Embed Size (px)
Citation preview

Research and Implementation of predictive Modeling Based on Logistic Regression
Modeling. By
Sharath Kumar Aitha.Instructor: Dr. Dongchul Kim.
OUTLINE: Introduction. Logistic Regression. Formula Conditional Density Function. Maximum log like hood Pseudo code Classification Output Application Conclusion

INTRODUCTION:
To analyze the historical data of online shop customer behaviors by logistic predictive modeling and predicts whether the customers purchase a tablet pc online shop.
Analyzes data by datamining and establishes predictive modeling based on logistic regression.

This is the most commonly used technology used for developing predictive modeling.
Its function is to look for a variety of equations which reflects the customer behavior patterns according to the observations of X and Y.
There are two types of regressions they are: 1.Ordinary least square Regression(OLS) 2.Logistic Regression.
Regression Predictive Analysis:

If the variable Y is continuous we usually use OLS For example if variable Y is the sales volume of tablet PCs and the
distribution of these observations is more beautiful, we can use OLS. But the requirements of OLS of Y are very harsh and difficulty, so we use logistic regression.
Ordinary Least Square Regression:

LOGISTIC REGRESSION: Logistic regression is a statistical method for analyzing a
dataset in which there are one or more independent variables that determine an outcome.
This is a unsupervised function where we need to provide the input values.

Formula: If we have feature data ti and label data y∈ℜ i {0,1},i = 1,2,··· ,n. corresponding to two ∈
classes. we can use logistic regression to solve this by doing regression between y and t on logistic function
H(t)=1/1+e-(at-b)
T is the input.
E is the exponential
A is the coefficient to adjust the slope.
B is the parameter.

Conditional Density Function: Def: Suppose X and Y are continuous random variables with joint probability
density function f(x,y) and marginal probability density functions fX(x) and fY(y), respectively. Then, the conditional probability density function of Y given X = x is
defined as: provided fX(x) > 0. Formula: conditional density function p(y/t): P(y/t)=h(t)y(1-h(t))(1-y)
Which can also be written as
P(y/t)=(1/1+e-(at-b))y(1/1+e(at-b))(1-y)
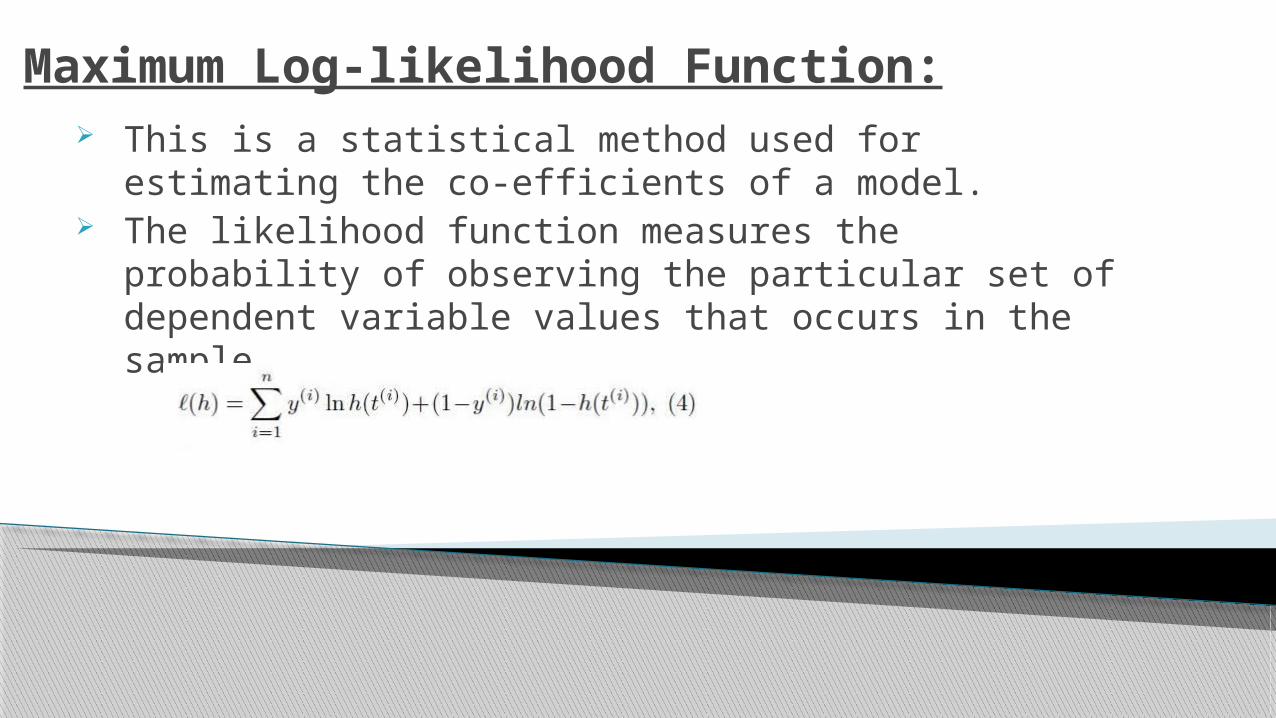
Maximum Log-likelihood Function: This is a statistical method used for estimating the co-
efficients of a model. The likelihood function measures the probability of
observing the particular set of dependent variable values that occurs in the sample.

Pseudo code:Algorithm 1 One dimension logistic regressionInput: t; yOutput: a; b1: Initialize a and b2: repeat3: a = a + τ ∂ℓ/∂a4: b = b + τ ∂ℓ/∂b5: until convergence of a and b

Differentiation of a&b:
∂ℓ/∂a
∂ℓ/∂b

Classification: For a testing data given feature t or x, by Eq.(1), we get h, it is the
probability of y=1. so the discriminant function is:

Output:

Application:Design and implementation:

Frequency Analysis:

Example:Modeling variable

Example:k-s Verification:

Conclusion:
Logistic Regression modeling can be used in predicting the possibility of a customer to buy a commodity.
This is also helpful for the online shop owner to make the decision.

THANK YOU