Embed Size (px)
Citation preview
Quality of Breads from Hard Red Winter Wheat and Hard White Winter Wheat
by SIVASEKARI BALASUBRAMANIAN
(Under the Direction of Robert L. Shewfelt)
ABSTRACT
Bread is a staple in many countries. Knowledge of consumer preference of breads would help in
making available products that have been tailored to consumer’s specifications. Sensory
preference of refined breads by consumers has been a barrier for the whole-wheat bread
consumption, in spite of the several health benefits that have been associated with whole-grain
products. This study aims at encouraging consumers to include more whole-grains in their diet
with minimum compromise in flavor. Whole-wheat breads and refined breads were made using
Hard Red Winter (HRW) wheat and Hard White Winter (HWW) wheat. Bread quality was
evaluated by consumer testing and instrumental analysis. Mathematical model was used to
predict acceptability as a function of sensory descriptors. Instrumental analysis of physical
quality characteristics showed a significant difference between the four bread types with regard
to color and texture. Higher preference of whole-wheat breads made using white wheat than
refined breads from traditional red wheat suggests that consumers can have the combined
advantage of nutrition from whole-wheat and minimum compromise in flavor.
INDEX WORDS: Consumer Acceptability, Whole-wheat Breads, Refined Breads, Hard Red
Winter Wheat, Hard White Winter Wheat.
QUALITY OF BREADS FROM HARD RED WINTER WHEAT AND HARD WHITE
WINTER WHEAT
By
SIVASEKARI BALASUBRAMANIAN
Foreign Bachelor’s Degree
A Thesis Submitted to the Graduate Faculty of The University of Georgia in Partial Fulfillment
of the Requirements for the Degree
MASTER OF SCIENCE
ATHENS, GEORGIA
2007

© 2007
Sivasekari Balasubramanian
All Rights Reserved
QUALITY OF BREADS FROM HARD RED WINTER WHEAT AND HARD WHITE
WINTER WHEAT
by
SIVASEKARI BALASUBRAMANIAN
Major Professor: Robert L. Shewfelt
Committee: William L. Kerr Jerry W. Johnson
Electronic Version Approved: Maureen Grasso Dean of the Graduate School The University of Georgia December 2007

DEDICATION
To my family and friends, whom I love very much.
iv
ACKNOWLEDGEMENTS
I am very grateful to Dr Robert L. Shewfelt, my mentor and one of the best teachers I have
ever had. He has been a great source of inspiration throughout my education here and his
enthusiasm and knack of helping students develop their individual thought style never fails. His
vast knowledge and extreme patience helped me at every step of my research and his guidance
has been very helpful in deciding the next step in my career. Besides all this Dr S is a wonderful
person and he simply is the best! I am very lucky to have been his student and I consider my
experience in this department as one of the best so far. I would also like to express my gratitude
to my committee members Dr William L. Kerr and Dr Jerry W. Johnson who have been
extremely helpful in completing my research.
I would like to specially thank my friends in the department: Anne Morrison, Maruj, Meera,
Brian, Darleen, Enyam and all my panelists. Thank you so much for your time and help. I know
I could not have completed the research without you guys. Anne and Maruj; thank you so much
for being there for me every time I needed your help (in spite of your busy schedules). You guys
are just wonderful and I enjoyed my stay in the lab with you both. Brian; thank you for all the
help with the instruments. I would like to thank Danny, Jinhee, Mark Corey, George and all the
others in the department who have lent their helping hand.
My family and friends are my biggest strength. I owe this degree to them. Their support
and encouragement and most importantly their faith in me helped me pull through this
successfully. I have no words to express my love and gratitude to them.
v

Finally, I would like to offer my thanks to God who has showered me with all his
blessings and love which I see in the form of my family, friends and mentor. Thank you
God. Anbe Sivam.
vi
TABLE OF CONTENTS
Page
ACKNOWLEDGEMENTS.............................................................................................................v
LIST OF TABLES......................................................................................................................... ix
LIST OF FIGURES .........................................................................................................................x
CHAPTER
1 INTRODUCTION AND LITERATURE REVIEW ....................................................1
BRIEF HISTORY OF BREAD .....................................................................1
BREAD TYPES.............................................................................................3
WHEAT ........................................................................................................4
BREADMAKING........................................................................................12
BREAD FLAVOR.......................................................................................13
BREAD AND NUTRITION........................................................................16
CONSUMER PREFERENCE OF REFINED BREAD...............................18
BREAD TEXTURE.....................................................................................19
WATER ACTIVITY ...................................................................................20
MOISTURE CONTENT .............................................................................20
COLOR.......................................................................................................21
REFERENCES ...........................................................................................22
vii
2 CONSUMER BASED EVALUATION OF BREADS MADE FROM HARD RED AND HARD WHITE WINTER WHEAT..........................................................................29
ABSTRACT......................................................................................................30
INTRODUCTION ...........................................................................................31
MATERIALS AND METHODS.....................................................................33
RESULTS AND DISCUSSION......................................................................37
CONCLUSIONS..............................................................................................39
REFERENCES ...............................................................................................40
3 PHYSICAL PROEPRTIES OF BREADS MADE FROM HARD RED WINTER AND HARD WHITE WINTER WHEAT...........................................................................47
ABSTRACT.................................................................................................48
INTRODUCTION ........................................................................................49
MATERIALS AND METHODS..................................................................51
RESULTS AND DISCUSSION...................................................................52
CONCLUSION.............................................................................................53
REFERENCES .............................................................................................54
4 CONCLUSIONS..................................................................................................................58
viii
LIST OF TABLES
Page
Table 2.1: SENSORY DESCRIPTORS, THEIR DEFINITION AND STANDARD
REFERENCES ON A SCALE OF 15cm ......................................................................................42
Table 2.2: AVERAGE INTENSITIES WITH STANDARD ERROR FOR THE VARIOUS
DESCRIPTORS FOR THE DIFFERENT BREADS....................................................................43
Table 2.3: PEARSON CORRELATION COEFFICIENTS OF SENSORY DESCRIPTORS
WITH CONSUMER ACCEPTABILITY......................................................................................44
Table 3.1: MEAN AND STANDARD ERROR VALUES OF MOISTURE CONTENT, WATER
ACTIVITY, TEXTURE AND COLOR FOR EACH OF THE FOUR BREAD TYPES .............57
ix
LIST OF FIGURES
Page
Figure 1.1: PROBABLE EVOLUTIONARY PATH OF HEXAPLOID WHEAT.........................6
Figure 1.2: PROTEINS IN WHEAT ...............................................................................................8
Figure 1.3: BREAD MAKING PROCESS....................................................................................12
Figure 2.1: AVERAGE INTENSITIES OF THE SENSORY DESCRIPTORS PERCIEVED BY
THE PANEL FOR THE FOUR BREAD TYPES.......................................................45
Figure 2.2: % ACCEPTABILITY AND UNACCEPTABILITY OF THE FOUR BREAD
TYPES .........................................................................................................................46
x
CHAPTER 1
INTRODUCTION AND LITERATURE REVIEW:
Bread is a staple in several parts of the globe and also one of the oldest prepared
foods. Among all cereals and cereal foods, bread provides best for our nutritional needs
(Pomeranz and Shellenberger, 1971). In 53% of the countries bread provides more than half
the caloric intake and it is a rich source of carbohydrates, fiber, protein and vitamins
(Pomeranz and Shellenberger, 1971).
A BRIEF HISTORY OF BREAD:
It is not known when or where bread originated. However, the known history of bread is
longer than the history of any other food. Many ancient civilizations, Egyptians,
Babylonians, Hebrews, Ancient Greece, all mastered the art of bread-making several
centuries ago (Pomeranz and Shellenberger, 1971) . Excavations in Babylon shows that
breads were consumed in 4000 B.C (Pomeranz and Shellenberger, 1971, Wahren. M., (no
date)). Breads and grains played a major role in Egyptian life style. It contributed
significantly to the country’s economy and prosperity.
The bread culture in Egypt was due to the several developments that took place
during the Neolithic era (young Stone Age). These breads were flat breads (fairly palatable).
At the end of this era, fermentation was discovered accidentally and this discovery took place
almost at the same time in several places. Fermentation led to the development of leavened
breads that had a better, lighter and improved flavor as a result of baking (Pomeranz and
Shellenberger, 1971).
1
2
The technique of bread-making migrated to the Mediterranean world (Greece) during the
8th century B.C. The Greeks employed two types of fermentation. They used a process called
“spontaneous fermentation” where bakers relied on air-borne microorganisms to leaven the
dough. They also used to make breads with grape juice as ferment, and these breads were flat
breads (Pomeranz and Shellenberger, 1971).
Rye (Secale cereale) replaced wheat (Triticum aestivum) during the Bronze Age.
White breads were a rare commodity and were mainly served to the upper classes (Pomeranz
and Shellenberger, 1971). Breads made in monasteries were the best and several different
varieties of breads were made here; e.g. unleavened, spelt bread, bread baked in ashes,
regular leavened bread, bread rolls, etc (Wahren. M., (no date)). In the middle Ages,
Northern Europe baked bread twice in a year. Winter-bread was made in autumn, with grain
ground on a water mill. The summer-bread was made in spring.
The latter part of 19th century saw a major change in bread culture (Pomeranz and
Shellenberger, 1971). With the increasing size of cities, commercial bakeries came into
existence. Viennese engineer Mautner, developed a method for bakery-yeast production,
which became a huge success. Bakers depended on spontaneous fermentation for many
years. Until Leeuwenhoek demonstrated the presence of yeast cells using microscopy, the
basic principle of fermentation remained a mystery (Pomeranz and Shellenberger, 1971).
Knowledge about aeration and stimulation of enzyme systems in yeasts during the end of the
19th century, helped increase yeast growth on a large scale industrial basis (Pomeranz and
Shellenberger, 1971).
In the early 20th century, sugar beet molasses replaced grain extracts as a substrate
for yeast. The latest development in bread production is the continuous process, and this was
developed primarily in USA. This process is much more efficient and time-saving than batch
process (Pomeranz and Shellenberger, 1971). Both batch and continuous processes involve
several basic stages of operation. Flour (protein source), salt, Baker’s yeast are the basic
ingredients and optional ingredients like sugar, shortening, gluten, etc are also usually added
(Pomeranz and Shellenberger, 1971). The ingredients are mixed together with water to make
the dough and the dough is shaped into loaves to bake the bread. Hence, since time
immemorial, cereals and cereal products have been a major source of nutrition for humans
and are continuing to do so until today. The bread making process has undergone dramatic
development over the ages, from traditional, home baking to commercial industrial
production on a large scale basis. Several varieties of breads are available in the market
today, allowing consumers to choose according to their preferences (flavor, nutrition, etc.).
BREAD TYPES:
This study deals with two types of breads that are commonly consumed in America; namely,
whole-wheat breads and white or enriched breads. Whole-wheat breads are a good source of
dietary fiber and are made from whole-wheat flour. When the wheat grain is milled into
flour, it contains the entire wheat grain including the bran (coarse outer layer containing
tannins, high fiber content), germ (inner layer) and endosperm (starchy middle layer) (Liu
2003). The FDA (Food and Drug Administration) specifies a criterion of at least 51% whole-
grain content by weight for a food product to be considered whole grain (Cleveland et al.,
2000, Food and Drug Administration, July 1999).
White or refined breads are generally preferred over whole-wheat breads due to their
more appealing flavor and appearance (Bakke and Vickers 2007). During the flour milling
process, the bran layer and a part of the endosperm of the wheat grain are stripped off and the
3
flour consists mainly of the starchy germ layer (Liu, 2002). These breads are lower in dietary
fiber than whole-wheat breads and are higher in sugar and carbohydrates. They appear white
due to bleaching of the flour during the milling process and also because the tannins present
in the bran which are responsible for reddish color of whole-wheat breads have been
removed (Pomeranz and Shellenberger, 1971).
WHEAT:
Flour is the basic and most important ingredient of bread, without which bread cannot be
made. Breads can be made with flours from various cereal sources, but the most widely
accepted and commonly consumed bread (white and whole-wheat pan breads) in the West is
that which is made from wheat (Pomeranz and Shellenberger, 1971).
Wheat is one of the most important crops grown widely around the world. Its
growth is most favorable in the temperate zones. It has always been a major source of
carbohydrates, and proteins. This combination is a unique property of wheat that gives it its
bread-making qualities (Belderok. et al., 2000).
Anatomy: The wheat kernel is a one-seeded fruit, and has a fruit coat that is attached to the
seed, which is called as caryopsis (Pomeranz and Shellenberger, 1971). The kernel comprises
of 3 distinct parts, namely, the germ (innermost) layer, mealy endosperm (middle) layer and
the outermost layer called bran. In general, 2-3% of the grain is the germ layer, 13-17% is the
bran and 80-85% is the starchy inner endosperm (Belderok. et al., 2000). The endosperm
mainly is made up of carbohydrates (82%) which contains mainly starch, proteins (13%) and
about 1.5% fats (Belderok et al., 2000). Flour for white bread is milled mainly from the
endosperm (Fance 1960). The outer layer of the endosperm is called the aleurone layer and it
has a different structure than the inner endosperm. It is a single layer of cubic shaped cells.
4
The aleurone layer is known to be rich in proteins and enzymes and they contain a
substantial amount of the total dietary fiber in the grain (Shewry and Jones 2005). The bran
or outer covering is usually removed during milling and it consists of fused pericarp
(surrounding the endosperm), the seed coat and the aleurone layer (Belderok 2000).
Genetics: Wheat belongs to the genus Triticum. The present-day bread wheat is a hexaploid
wheat species called Triticum aestivum and they are a result of evolution (crossing and
selection) from the original wild type cultivar which was a diploid species (Belderok 2000).
Triticum aestivum is known to be the most suitable species for bread-making. The hexaploid
wheat species has 42 (6 x 7) chromosomes. The genome of T. monococcum, a diploid (2 x 7
= 14 chromosomes) ancestor of modern-day wheat is called the A-genome. This wheat
consists of two sets of 7 chromosomes. It has been suggested that these 14 chromosomes
might have crossed with some unknown diploid wild grass to yield a tetraploid species (28
chromosomes) (Belderok 2000). The genome of the wild parent is the B-genome. The
tetraploid genome is called the AB-genome and the plants are genetically described as
AABB. T. aestivum is said to be a result of a cross between the 28 chromosomes of the
tetraploid species and the 14 chromosomes of a weed Aegilops squarrosa (also known as
Triticum tauschii) that grows on the borders of wheat fields. The chromosome of the weed is
called D-genome and hence, the genome of T. aestivum is called the ABD-genome and the
plants of this species are genetically characterized as AABBDD (Nelson. et al., October
1995, Belderok, 2000).
5
DIPLOID SPECIES DIPLOID SPECIES (2 x 7 = 14 chromosomes) X (2 x 7 = 14 chromosomes)
T.monococcum unknown wild grass
INFERTILE HYBRID (14 chromosomes) FERTILE TETRAPLOID (28 chromosomes) X Aegilops squarrosa
INFERTILE HYBRID
FERTILE HEXAPLOID
(42 chromosomes)
Triticum aestivum
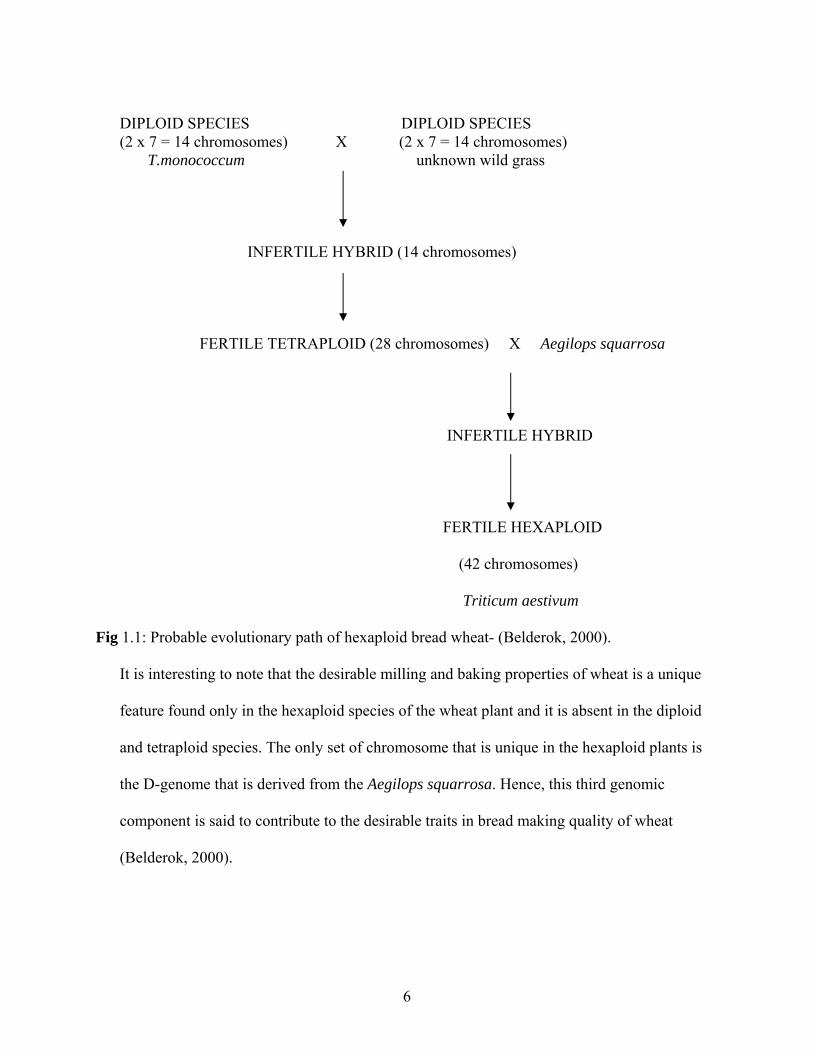
Fig 1.1: Probable evolutionary path of hexaploid bread wheat- (Belderok, 2000).
It is interesting to note that the desirable milling and baking properties of wheat is a unique
feature found only in the hexaploid species of the wheat plant and it is absent in the diploid
and tetraploid species. The only set of chromosome that is unique in the hexaploid plants is
the D-genome that is derived from the Aegilops squarrosa. Hence, this third genomic
component is said to contribute to the desirable traits in bread making quality of wheat
(Belderok, 2000).
6
Grain Hardness: Wheat grain hardness is an important parameter that is considered while
determining milling and baking properties (Belderok, 2000, Shewry and Jones, 2005,
Pomeranz and Williams, 1990) of wheat. Two distinct categories of wheat varieties are based
on grain hardness; namely, “hard” grains and “soft” grains. The kernels of hard grains
generally have a dark, shiny, vitreous appearance, whereas, soft grain kernels have a more
opaque and floury look (Fance, 1960). During the milling process, starch damage is higher in
hard wheat and this damage is favorable as it contributes to the soft texture and mouth-feel of
the crumb of breads. Hard grains are more suited for yeast-leavened bread-making due to
their tolerance to fermentation (Pomeranz and Shellenberger, 1971, Belderok, 2000). Starch
damage is also known to retard staling of bread (Belderok, 2000). Soft wheat on the other
hand, does not undergo extensive starch damage and this property makes it suitable for
making products like cakes, biscuits, wafers, etc. Hard wheat grains have higher protein
content than soft wheat grains and hard kernels have more resistance to grinding than soft
kernels (Belderok, 2000). Hard-kernels forms tenacious, elastic gluten, with good gas-
retaining properties and this is attributed to the high protein content (Pomeranz and
Shellenberger, 1971). Soft-grains on the other hand have low-elasticity gluten and poor gas-
retaining properties. A single gene or more than one gene is attributed to the inheritance of
grain hardness (Belderok, 2000). The American bakery and quality practices recommend use
of high-protein flours for bread-making process and this property is found more in hard-
wheat than soft-wheat (Pomeranz and Shellenberger, 1971).
Wheat grain-proteins and starches: The wheat grain mainly consists of gluten proteins and
wheat starch (Belderok, 2000). The proteins can be classified broadly as gluten proteins and
non-gluten proteins (Pomeranz and Shellenberger, 1971). The gluten proteins contribute to
7
the dough-formation. The albumins and globulins are low-molecular weight proteins and
most of them are physiologically active proteins (enzymes) (Belderok, 2000). These proteins
are found in seed-coat, aleurone layer and germ. They contribute to about 25% of the grain
proteins. The remaining 75% of proteins are storage proteins, that is, Gliadins and glutenins
which are located mainly in the starchy endosperm (Belderok, 2000) and are also called
storage proteins. These proteins are said to be technologically active, as they contribute to
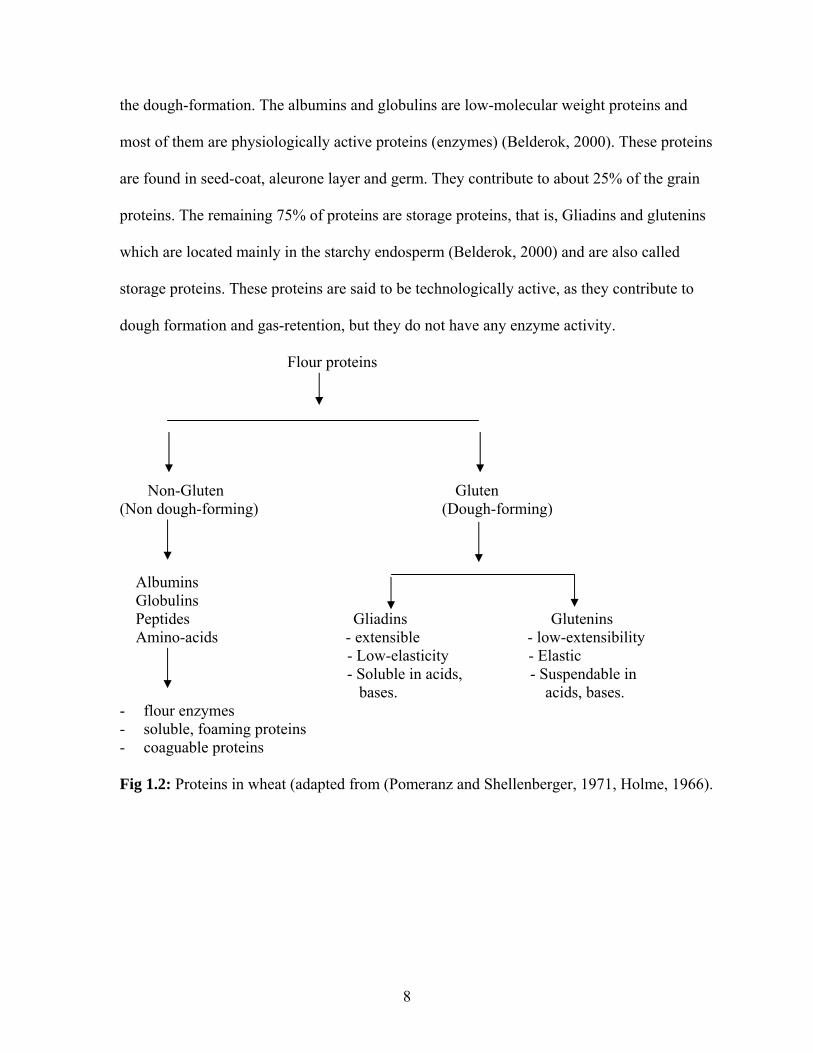
dough formation and gas-retention, but they do not have any enzyme activity.
Flour proteins
Non-Gluten Gluten (Non dough-forming) (Dough-forming) Albumins Globulins Peptides Gliadins Glutenins Amino-acids - extensible - low-extensibility - Low-elasticity - Elastic - Soluble in acids, - Suspendable in bases. acids, bases. - flour enzymes - soluble, foaming proteins - coaguable proteins
Fig 1.2: Proteins in wheat (adapted from (Pomeranz and Shellenberger, 1971, Holme, 1966).
8
Wheat starch contributes to about 75% of the grain. It is found in the seeds, mainly in the
endosperm in the form of granules. There are two types of starch in wheat grains. One is a
large, lenticular type (about 25-40 µm) and the other type is small and spherical (about 10-15
µm). Chemically, two types of starch are identified in wheat grains: amylose (predominantly
linear) and amylopectin (highly branched) (Belderok, 2000). During the milling process, part
of the starch is mechanically crushed and that starch is called damaged starch. Damaged
starch absorbs water and swells when viewed under a microscope and also they do not show
double fraction in polarized light as they have lost their crystalline structure (Belderok,
2000). Damaged starch contributes favorably to bread-making quality of wheat as it has two
vital properties: it absorbs water faster and in higher amounts than undamaged starch and
also it is easily digestible by enzymes to yield breakdown products like maltose and dextrins
(Belderok, 2000). Hard-kernels tend to sustain more starch damage than soft-wheat kernels.
According to the Approved Methods of the American Association of Cereal Chemists,
AACC, St Paul, Minnesota (1990), the optimal starch damage for bread-making is 7% and
should not exceed 9%. Excessive starch damage can cause the dough and bread to become
sticky and difficult to slice (Belderok, 2000).
Starch-degrading enzymes present in the grains help breakdown large starch molecules
and hence reduce the viscosity of a starch suspension. The two main enzymes found in wheat
grains are α-amylase and β-amylase (Belderok, 2000). α-amylase breaks glucosidic bonds on
a more random basis, while β-amylase cleaves starch at the ends of the polymer. These
enzymes together, convert about 85% of starch to sugar. Enzymes have a more rapid
degradation action on damaged starch than native starch (Belderok, 2000). Bread made from
sprouted wheat is considered to be of inferior quality and this is due to high α-amylase
9
activity. Pre-harvest sprouting generally occurs in rainy conditions and it is not a desirable
trait for wheat quality (Belderok, 2000, Bassoi. et al., abr. 2006). Breads baked with sprouted
wheat will have a smaller volume and compact interior (Groos. et al., 2002, Mansour, 1993).
Therefore, varieties with high sprout resistance must be chosen for bread-making. A good
indicator of degree of sprouting is to test for α-amylase activity in the grains and flour
(Hagberg-Perten test) (Groos. et al., 2002, Belderok, 2000).
Wheat Classes: Classification and sorting of wheat based on kernel color is an important as
the color plays a role in milling, baking and taste properties (Pasikatan and Dowell., 2003).
Wheat grains can either have a dark, red-brown appearance (red-seeded wheat) or a light,
yellowish color (white-seeded wheat) (Belderok, 2000). In this study, breads made from two
types of wheat: Hard Red Winter (HRW) wheat and Hard White Winter (HWW) wheat will
be compared. HRW is the major wheat type grown in U.S.A. HWW is more susceptible to
pre-harvest sprouting than HRW, which lowers the quality of wheat (Belderok, 2000, Bassoi.
et al., abr. 2006) and hence is not widely cultivated in America. Flour from the HRW variety
is the primary ingredient in most commercial breads (Chang. et al., 1995). HWW is a
relatively new classification in United States and is still in the developmental stages by many
Agricultural Experiment Stations (AES) and has not yet been widely used in the commercial
aspect (Chang. et al., 1995). Bran color is an important discriminator between red and white
wheat (Wu. et al., 1999). The plants of HRW and HWW are similar in most aspects but
differ mainly in the color of the bran (seed coat) (Paulsen., March 1998). The kernel color is
a trait that can be genetically inherited (Wu. et al., 1999, Cooper and Sorrells., 1984). The
gene expression however, is not independent of environmental factors (Wu. et al., 1999). The
original red wheat had three major genes for the red color, but the modern varieties have one
10

or two genes only (Paulsen., March 1998). The red color of bran is controlled by three loci
with partial dominance (Wu. et al., 1999). This was first postulated by Nelsson-Ehle in 1909
in his classical work on genetics of kernel color (Wu. et al., 1999, Bassoi. et al., abr. 2006).
Red alleles (R) of a dominant gene are responsible for red testa pigmentation of the bran
(Bassoi. et al., abr. 2006, Flintham, 2000). These genes reside on homologous loci on
chromosome 3A, 3B and 3D of the hexaploid wheat (Bassoi. et al., abr. 2006, Gale et al.,
1995, Flintham et al., 1999, Flintham et al., 1996, Groos. et al., 2002). The red color is
expressed as a result of pleiotropic effect of the genes and the color is visible via the seed
coat (bran). The gene expression for red color is more complex due to the presence of
additional minor genes. As many as six genes may influence kernel color (Wu. et al., 1999,
Bassoi. et al., abr. 2006, Freed et al., 1976). Phenolic compounds like proanthocyanidins
(PA’) and tannins present in the wheat grain have been associated with contribution to seed
coat color (Miyamoto and Everson, 1958, Mccallum and Walker., 1990). PA’s are colorless
oligomers and are converted to colored anthocyanidins by strong acids (Mccallum and
Walker, 1990). It has been suggested that PA’s in bran of winter wheat may also serve as
protective agents against microbial degradation apart from contributing to bran color
(Mccallum. and Walker., 1990, Harborne, 1985). Presence of high levels of phenolic acids in
bran could possibly contribute to the bitter taste characteristics to whole-wheat breads as
phenolic compounds have been associated with bitter tastes in other foods (Bakke. and
Vickers., 2007, Mondy and Gosselin, 1988, Robichaud and Noble, 1990, Busch et al., 2006).
White wheat has no major genes for bran color. It is determined by the presence of
three recessive genes and when all three genes are present, the grain appears mostly white
(Paulsen., March 1998). During the milling process, white kernel color has a higher
11
efficiency of extraction than red kernel color, since a higher flour extraction can be done
without sacrificing too much of the color (Wu. et al., 1999). White-wheat does not contain
the chemical pigments (phenolic components) that contribute to the red color in red wheat
and this might contribute to a milder flavor of white wheat (Paulsen., March 1998).
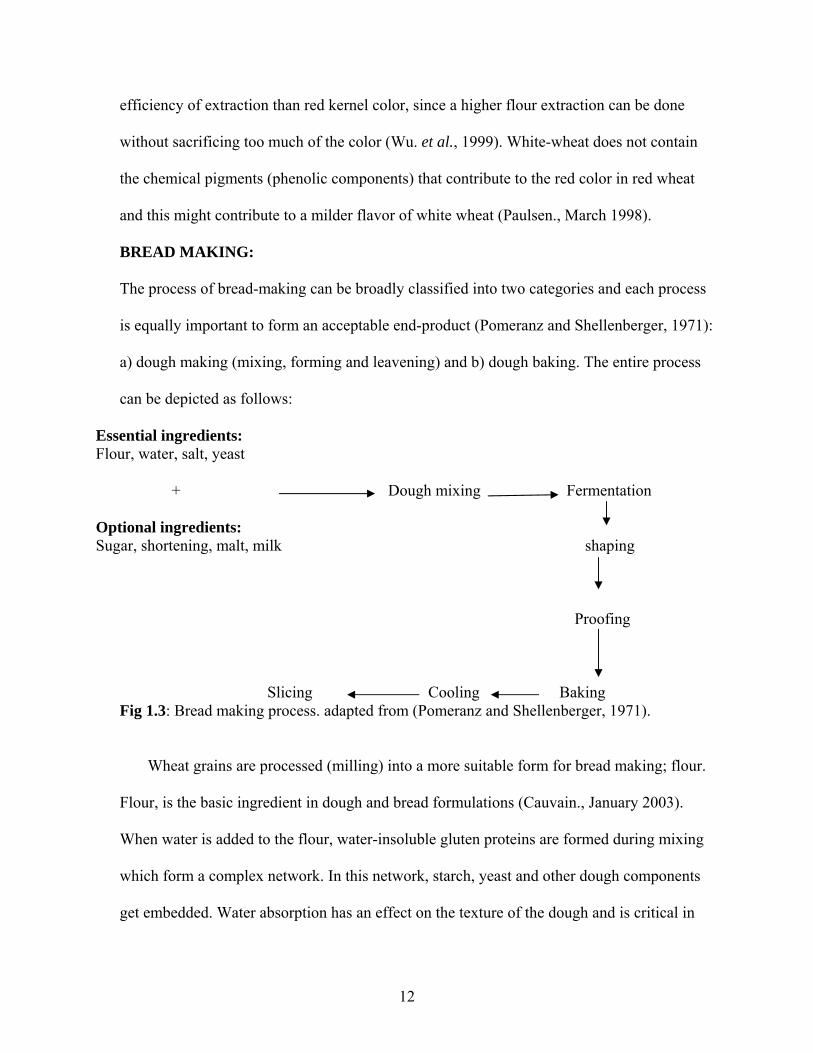
BREAD MAKING:
The process of bread-making can be broadly classified into two categories and each process
is equally important to form an acceptable end-product (Pomeranz and Shellenberger, 1971):
a) dough making (mixing, forming and leavening) and b) dough baking. The entire process
can be depicted as follows:
Essential ingredients: Flour, water, salt, yeast
+ Dough mixing Fermentation
Optional ingredients: Sugar, shortening, malt, milk shaping
Proofing
Slicing Cooling Baking Fig 1.3: Bread making process. adapted from (Pomeranz and Shellenberger, 1971).
Wheat grains are processed (milling) into a more suitable form for bread making; flour.
Flour, is the basic ingredient in dough and bread formulations (Cauvain., January 2003).
When water is added to the flour, water-insoluble gluten proteins are formed during mixing
which form a complex network. In this network, starch, yeast and other dough components
get embedded. Water absorption has an effect on the texture of the dough and is critical in
12

providing rheological properties to the dough that makes it suitable for further processing
(Lallemand Baking Update., 1997.). The yeast added to the mixture is responsible for the
fermentation process and generates carbon-dioxide as an end-product which is required for
expansion of the dough mass (aeration). Gluten forms a skeleton of wheat dough, and this
traps gas (CO2) produced during fermentation which has an effect on crumb texture
(Lallemand Baking Update., 1997., Pomeranz and Shellenberger, 1971). The dough is then
allowed to expand and the process is termed as “proofing”. The continued development of
gluten structure helps improve the dough’s rheological properties and its ability to expand
when fermentation increases gas pressure (Cauvain., January 2003). The dough is then
kneaded down and shaped into loaves and again proofed. During this period, further
fermentation and expansion of dough structures occur. They are then placed in ovens and
baked at appropriate temperatures and time depending on the bread type. The breads are then
removed from the oven, cooled and then sliced and packed for consumption (Cauvain.,
January 2003).
BREAD FLAVOR
Bread flavor plays a key role in influencing consumer perception of bread quality. The quality
of bread is normally defined on the basis of its volume, color, texture and flavor (Quilez. et
al., 2006). Flavor is said to be one of the most appreciated sensory characteristic in bread
(Caul, 1972, Martinez-Anaya, 1996). The term flavor comprises of the total sensation
experienced by the consumer: aroma, taste perceptions and tactile sensations (masticability) in
the mouth (Martinez-Anaya, 1996, Caul, 1972, El-Dash, 1967). Bread flavor is very appealing
to consumers (Martinez-Anaya, 1996, Coffman, 1965) and has been qualitatively described as
being discrete and subtle (Martinez-Anaya., 1996, Drapron and Molard , 1979). Bread flavor
13

remains a challenge due to its very complex flavor profile (Martinez-Anaya, 1996, Katina. et al.,
2006). The flavor of bread is composed of a large number of components with very distinctive
olfactory characteristics (Drapron and Molard, 1979, Martinez-Anaya, 1996, Quilez. et al.,
2006). Bread flavor cannot be attributed to the presence of any one single compound (Coffman,
1965, Drapron and Molard, 1979, Martinez-Anaya, 1996). The flavor components in bread arise
from interaction of many factors: ingredients, fermentation, degradation and thermal reactions
(Martinez-Anaya, 1996, Quilez. et al., 2006, Chang. et al., 1995, Jackel, 1969). Ingredients in the
breadmaking process undergo several changes in order to produce the final full flavor. Studies
have shown that fermentation plays a vital role in enhancing flavor of bread (Jackel, 1969,
Martinez-Anaya, 1996). Baker and Coffman have said that two processes in breadmaking are
essential for the flavor formation in bread: Fermentation and baking (Martinez-Anaya, 1996,
Coffman, 1965, Baker et al., 1953). Distinctive volatile components that contribute to bread
flavor originate as a result of fermentation of sugars by yeast (Martinez-Anaya, 1996, Robinson
et al., 1958, Calvel, 1981). Degradation reactions (mechanical and enzymic) help eliminate the
starchy residual taste of wheat flour (Martinez-Anaya, 1996, Jackel, 1969). Crust flavor and
color are a result of thermal reactions like caramelization and non-enzymatic browning that
occurs during the baking process (Jackel, 1969, Drapron and Molard, 1979, Martinez-Anaya.,
1996). Volatile compounds are produced from precursors that were already present in the
ingredients or are formed as a result of enzymatic and mechanical degradations (Drapron and
Molard, 1979, El-Dash, 1967 ).
Yeasts added during the breadmaking process plays a key role in fermentation process.
Sugar added to the flour and those that are formed from the amylolytic degradation of starch are
substrates for yeast fermentation (Martinez-Anaya, 1996, Pomeranz and Finney, 1975). Bread
14
yeasts (Saccharomyces cerevisiae) generally have saturated kinetics for hexoses and maltose and
all specimens possess α–glucosidase and β–fructosidase (invertase) (Martinez-Anaya, 1996,
Antuna and Martinez-Anaya, 1993). Bread fermentation occurs under anaerobic conditions
(limited oxygen) during which carbon dioxide and ethanol molecules (95% of alcoholic
fermentation by-product) are produced as end products (Martinez-Anaya, 1996, Pomper, 1969),
which subsequently contribute to flavor development apart from aiding in leavening of bread.
Lactic acid bacteria used in the breadmaking process are responsible for lactic fermentation. The
main end-product of lactic fermentation (85% in homofermentative species) is lactic acid which
helps lower the pH during fermentation (Martinez-Anaya, 1996, Spicher et al., 1987).
Enzymes present in the ingredients (flour and those produced as a result of yeast
metabolic activity) and those that are intentionally added in the formulation are very important in
development of flavor in the bread. Enzyme activity is usually initiated during the hydration of
flour in the mixing stage of breadmaking process and proceeds steadily until high temperatures
during baking degrade protein structure. Three distinct enzymic systems are related to
enhancement of bread flavor: amylases (α and β), proteases and lipoxygenases. The enzymes
generally contribute to flavor development by producing precursors (flavor- producing peptides)
either directly or indirectly (Martinez-Anaya, 1996). Amylases hydrolyze α-1,4-glycosidic bonds
of starch, amylose and amylopectin. α –amylase is a dextrinizing enzyme that acts on gelatinized
starch (random action), while β-amylase has a saccharifying action on damaged or gelatinized
starch (acts at non-reducing ends of chains of β-maltose). Lipoxygenase activity is low in wheat
flour and is located in the germ and bran. This enzyme oxidizes unsaturated fatty acids like
linoleic, linolenic acids that have cis,cis-1,4-pentadiene groups in the presence of molecular
15
oxygen. One of the many results of lipoxygenase activity is production of carbonyl compounds
that have an on bread flavor (Martinez-Anaya, 1996).
During bread baking, the rate of enzymatic reactions increases in the first few
minutes. Two main thermal, non-enzymatic reactions occur during this stage: Maillard browning
and caramelization reactions. The decrease in pH during fermentation enhances browning
reactions favorably. The distinct contribution of each of the non-enzymatic reaction to crust
aroma is unclear but, it has been accepted that these reactions contribute pre-dominantly to crust
aroma (Martinez-Anaya, 1996, Drapron and Molard, 1979). Higher temperatures transform
sugars and polysaccharide like starch (to a lesser extent) into colored degradation products and
volatiles, carbonyls and furfurals. The total amino acids and reducing sugars and the proportions
present on dough surface during baking act as limiting factors in crust aroma quality (Martinez-
Anaya, 1996).
Apart from the above mentioned factors that influence bread flavor formation, mixing
operations also have an influence on bread flavor. Excessive mixing can cause an increase in
hexanal production, which alters the balance of flavor compounds and can lead to an
uncharacteristic flavor of lower consumer acceptance (Martinez-Anaya, 1996, Drapron and
Molard D, 1979).
BREAD AND NUTRITION:
Whole wheat breads have a higher nutritional value than refined breads. Dietary guidelines
recommend the consumption of whole grains as a preventative measure to reduce risk of some
common chronic diseases (Slavin. et al., 1999). Whole-grain foods are a rich source of fiber
whereas white breads have low fiber content due to processing of the wheat grain during milling.
High-fiber diets have been associated with several possible health benefits like reducing risk of
16
diabetes, coronary heart disease, improved insulin sensitivity, obesity, etc (Merchant. et al.,
2006, Liu., 2003, Liu, 2002). Studies have shown that it is possible to achieve a favorable
glycemic control by consuming foods with whole-grains, which is not possible with refined grain
foods (Liu, 2002). It has also been suggested that consumption of high amounts of refined-
carbohydrate foods like white breads can reduce levels of HDL (High Density Lipoprotein)
which is a protective lipoprotein for Coronary Heart Diseases (CHD) (Liu, 2002). Refined breads
tend to cause a rapid increase in blood glucose levels and insulin than whole-wheat breads.
Whole-wheat breads have high contents of viscous fiber, these foods are digested
and absorbed more slowly and hence provide a prolonged feeling of satiety. This increase in
satiety has been attributed to the intact grains in the flour, whereas refined wheat breads have
processed grains that are stripped off the bran layer. Refining causes an easier and more rapid
access of digestive enzymes to the starch in the endosperm which makes the refined products to
be more easily digested and absorbed (Liu, 2002, Brand et al., 1985, Heaton et al., 1988, Jenkins
et al., 1988). Whole-wheat breads are low in fat and high in protein, vitamins, minerals and
dietary fiber (Slavin. et al., 1999). Other beneficial components that have possible health benefits
that are present in whole-wheat breads are phenolic compounds like tannins (high concentrations
in the bran), lignans, phytoestrogens, tocotrienols, enzyme inhibitors, antioxidants, etc. These
compounds are not found in refined breads because the bran layer of the wheat kernel has been
removed during processing and what are present in the flour mainly are high levels of starch
from the endosperm (Slavin. et al., 1999). Consumption of refined breads has an unfavorable
effect on risk of type-2 diabetes (Liu., 2003). American dietary guidelines like USDA and FDA
recommend 3 servings (1 ounce equivalent for a 2000 Kcal diet) of whole-grain foods. Studies
show that Americans consume only 0.3 servings of whole-grain foods while they consume on an
17
average 2 servings of refined food products (Bakke and Vickers, 2007, USDHHS / USDA,
2005). Hence it is important to increase whole-grain consumption. Whole-wheat breads have a
significant nutritional advantage than white breads and it is a recommended diet choice to
maintain healthy life-style.
CONSUMER PREFERENCE OF REFINED BREAD:
It has been generally concluded that consumers prefer refined wheat breads over whole-wheat
breads (Bakke and Vickers, 2007, Mialon et al., 2002). Consumer preference for refined breads
is a commonly cited reason for low-consumption of whole-wheat breads despite
recommendation of whole-wheat consumption as a healthier diet choice by the American dietary
guidelines (USDHHS /USDA, 2005, Bakke and Vickers, 2007). Sensory preferences (taste and
flavor) of refined breads act as a barrier for whole-wheat bread consumption (Bakke and
Vickers, 2007). Whole-wheat breads are known to be considerably more bitter than refined
wheat breads (Bakke and Vickers, 2007, Chang et al., 1995, Chang and Chamber, 1992). Studies
say that the presence of wheat germ could also contribute to bitterness in whole-wheat breads
due to enzymatic and non-enzymatic lipid oxidation (Bakke and Vickers, 2007, Lehtinen and
Laakso, 2004). The visual appeal of refined wheat breads is also higher than whole-wheat
breads. It has been shown that consumers rank flavor as the most important factor for choosing
and purchasing food product (Kihlberg et al., 2005, Torjusen et al., 2001, Magnusson et al.,
2001). Lower sensory appeal of whole-wheat breads (appearance and flavor) acts a limiting
factor for consumers to choose the healthier whole-wheat breads and it has been suggested that
modifying ingredients or processing methods could improve the liking of whole-wheat breads to
levels of refined wheat breads (Bakke and Vickers, 2007).
The main objective of this study is to determine whether whole-wheat breads made from
18
white wheat (which has a similar appearance as refined wheat breads) are more acceptable to
consumers in terms of flavor and quality than refined breads made from typical red wheat. If so,
these breads will have the combined advantages of both nutrition and flavor. This combination
will encourage consumers to make healthier choices and include more whole-grains in their diet
along with minimum compromise on flavor. This study will aid in making available, whole-
wheat breads with more acceptable flavor than the characteristic whole-wheat breads and higher
nutrition than the typical refined wheat breads.
BREAD TEXTURE:
Texture of bread is an important physical quality characteristic that contributes to consumer
acceptability (Pomeranz and Shellenberger, 1971, Gambaro. et al., 2002). It contributes to about
20% to the judgment of bread quality (Scanlon and Zghal, 2001, Pyler, 1988). Bourne et al
(1982) explains bread texture as the crumb uniformity and distribution of the cell sizes(Scanlon.
and Zghal., 2001). The overall texture is a result of the three-dimensional structure formed from
its individual components (Crowley. et al., 2002). Texture is sensed by feeling of touch (tactile)
and is related to the deformation of the food under force and can be measured as a function of
force, time and distance (Crowley et al., 2002, Bourne, 1982). Traditionally bread crumb texture
was scored based on human vision. However, this method of scoring is not reliable, is known to
be inconsistent and is liable to vary over a period of time even if evaluated by the same expert
(Scanlon and Zghal, 2001, Wang and Coles, 1994). Due to these limitations that could lead to
inconsistent results, modern day bread making has shifted to Digital Image Analysis (DIA) for
evaluation of bread crumb texture. This technique is more sophisticated, quick, reliable and
consistent unlike the traditional method (Scanlon and Zghal, 2001; Chan and Batchelor, 1993).
Image texture analysis gives a measure of characteristics such as coarseness, smoothness, etc
19
which can be used for scoring purposes (Scanlon and Zghal, 2001, Gonzalez and Wintz, 1983).
The first application of video image analysis of white bread texture was done in 1992 (Scanlon
and Zghal, 2001, Bertrand et al., 1992). Flavor is influenced by bread texture (Pomeranz and
Shellenberger, 1971). A dense and compact crumb would have a stronger taste sensation than a
crumb that has a fine, silky crumb. Differences in bread texture over time are attributed to the
changes that occur in the starch, protein, lipids and water (Gambaro. et al., 2002, Brady and
Mayer, 1985, D’Appolonia and Morad, 1981). In this study a texture analyzer (TA.XT2i) was
used to compare the texture of the four bread types as a measure of firmness.
WATER ACTIVITY (AW):
Water activity (aw) is a term used to describe the amount of available water for physical,
chemical or microbial activity in the food. Water activity helps determine shelf life of a food
(Fellows, 2000). Pure water has a water activity aw value of unity, whereas absence of any
available water is indicated by zero. Bread has a water activity of about 0.96 and it indicates that
bread is a perishable food, has higher quantities of available water and the packaging must be
designed so as to prevent loss of moisture. In general, at a higher aw the mobility of reactants is
more and complex chemical changes like browning reaches a maximum (Fellows, 2000). Water
activity also has an influence on textural changes such as crunchiness and crispiness. A change in
water activity (aw) in bread occurs with time and this change is an important quality parameter in
determining the shelf life of the bread. Water activity decreases with crumb ageing (Chinachoti
and Vodovotz, 2000).
MOISTURE CONTENT:
Water content of a food is a very important parameter that helps control the foods stability and
rate of deterioration. It is also one of the determining factors for shelf-life of the bread. Moisture
20
content of foods has been defined on a wet-weight basis as: m = (mass of water / mass of
sample) * 100 (Fellows, 2000). The percentage of moisture in bread is usually about 40%
(Fellows, 2000, Crowley et al., 2002). There are certain sites in the food matrix where a portion
of the total water in the food gets strongly bound e.g. hydroxyl groups of polysaccharides,
carbonyl and amino groups of protein, etc. The moisture content value at that point when all sites
are bound by adsorbed water is called the Brunauer-Emmett-Teller (BET) monolayer value
(Fellows, 2000, Fennema, 1996). It is at this value of moisture at which the food product is the
most stable. The water content of the bread becomes lower at the surface during the baking
process and increases at the center of the loaf. The moisture moves away from the surface due to
evaporation at high temperature and condensation occurs near the center of the loaf where
temperature is lower. Water content plays a role in crust formation and aroma of the bread as it
has an effect on reactions like Maillard browning (Thorvaldsson and Skjoldebrand, 1998,
Skjolderbrand, 1986). Moisture content also has an influence on starch gelatinization which
affects final quality of the bread (Thorvaldsson and Skjoldebrand, 1998, Kokini et al., 1992).
COLOR:
The visual appeal of bread is an important attribute that has been known to drive consumer
acceptability (Scanlon and Zghal, 2001, Seneca, 1956). Color contributes to this property of
bread. Characteristic golden brown color of bread results from complex reactions like Maillard
reactions and other non-enzymatic browning reactions (caramelization reactions) (Fellows,
2000). Conversion of sugars and dextrins (from starch) to furfural and hydroxymethyl furfural,
carbonization of sugars, fats and proteins also contribute to color formation. The above
mentioned reactions occur during the baking process. Other factors like the type of wheat used to
make the bread also has an effect on bread color. The pigments in the wheat, amount of bran
21

present in the flour have an effect on bread color. Xanthophylls, flavones and carotenes are
wheat flour pigments that contribute to crumb color (Al-Hooti et al., 2000, Lepage and Sims,
1968, Kulp et al., 1980, Anderson and Perkin, 1931). In general, majority of consumers prefer
white crumb color in bread.
The main objective of the second part of this study was to measure and
compare the different physical quality characteristics of breads made from Hard Red Winter
(HRW) wheat and Hard White Winter (HWW) wheat. Whole-wheat breads and refined
breads made from the two wheat types were compared by instrumental analysis for four
physical quality characteristics: texture, water activity (aw), color and moisture content.
REFERENCES:
[USDHHS/USDA] U.S. DEPT. OF HEALTH AND HUMAN SERVICES. and U.S. DEPT. OF
AGRICULTURE. 2005. Dietary Guidelines for Americans 35-7. (accessed, 2007). AL-HOOTI S.N., SIDHU J.S. and AL-SAQER J.M. 2000. Utility of CIE Tristimulus system in
measuring the objective crumb color of high-fiber toast bread formulations. Journal of Food Quality 23, 103-116.
ANDERSON J.A. and PERKIN A.G. 1931. The yellow coloring matter of Khapli wheats. J.
Chem. Soc 140, 2624-2625. ANTUNA B. and MARTINEZ-ANAYA M.A 1993. Sugar uptake and involved enzymatic
activities by yeasts and lactic acid bacteria: their relationship with breadmaking quality. Int. J. Food Microbiol 18, 181-200.
ANWAR T. MERCHANT., WARANUCH PITIPHAT., MARY FRANZ. and KAUMUDI J.
JOSHIPURA. 2006. Whole-grain and fiber intakes and periodontitis risk in men. Am J Clin Nutr 83, 1395-1400.
BAKER J. C., PARKER H.K. and FORTMANN K.L. 1953. Flavor of Bread. Cereal Chem. 30,
22-30. BAKKE A and VICKERS A 2007. Consumer Liking of Refined and Whole-wheat breads.
Journal of Food Science 72, 7, S473-S480.
22
BASSOI M. C., FLINTHAM J, and RIEDE C.R. abr. 2006. Analysis of pre-harvest sprouting in
three Brazilian wheat populations. Pesq. agropec. bras., Brasilia 41, 4, p.583-590. BELDEROK B., J.M.A.D.A.D. 2000. Bread-making Quality of Wheat: A Century of Breeding
in Europe. Kluwer Academic Publishers The Netherlands. BERTRAND D., LE GUERNEVE C., MARION D., DEVAUX M.F. and ROBERT P. 1992.
Description of the textural appearance of bread crumb by video image analysis. Cereal Chemistry 69, 257-261.
BOURNE M.C. 1982. Texture, viscosity and food. In In: Food texture and viscosity. Concept
and measurement, pp.1-23, Academic press, New York. BRADY, P.L. and MAYER, S.M. 1985. Correlation of sensory and instrumental measures of
bread texture. Cereal Chem. 62(1), 70-72. BRAND J., NICHOLSON P., THORBURN A. and TRUSWELL A. 1985. Food processing and
the glycemic index. Am J Clin Nutr 42, 1182-1196. BUSCH J L H C., HRNCIRIK K., BULUKIN E., BOUCON C. and MASCINI M. 2006.
Biosensormeasurements of polarphenolics for the assessment of the bitterness and pungency of virgin olive oil. J. Agric.Food Chem 54, 4371-4377.
CALVEL R. 1981. Fermentation et panification au levain naturel. Ind. Cereales 5, 31-36. CAUL M. 1972. La Flaveur des aliments et le consommateur. Bull. Anc. Eleves Ec. Meun.
ENSMIC 251, 242-246. CAUVAIN S.P. January 2003. Bread Making: Improving Quality. Woodhead Publishing Limited, Cambridge London. CHAN J. P. and BATCHELOR B.G. 1993. Machine vision for food industry, In A.C.Pinder and
G. Godfrey (Eds.). Blackie Academic and Professional, pp. 58-101, Glasgow. CHANG C. and CHAMBER E I. 1992. Flavor characterization of breads made from hard red
winter wheat and hard white winter wheat. Cereal Chem. 69, 556-559. CHANG C., SEITZ L.M. and CHAMBERS IV E. 1995. Volatile Flavor Components of Breads
Made from Hard Red Winter Wheat and Hard White Winter Wheat. Cereal Chem. 72(3), 237-242.
CHINACHOTI P. and VODOVOTZ Y. 2000. Bread Staling. CRC Press.
23

CLEVELAND L E, M., RD, MOSHFEGH A J, MS, RD, ALBERSTON A M, MS, RD AND GOLDMAN J D, MA 2000. Dietary Intake of Whole Grains. Journal of American College of Nutrition 19, 331S-338S.
COFFMAN J. R. 1965. Bread flavor. Symp. Foods: Chem. Physiol. Flavors, 185-202. COOPER D.C. and M.E. SORRELLS. 1984. Selection for white kernel color in the progeny of
red/white wheat crosses. Euphytica 33, 227-232. CROWLEY P., SCHOBER T.J., CLARKE C .I. and ARENDT E.K.2002. The Effect of Storage
time on textural and crumb grain characteristics of sourdough wheat bread. Eur. Food Res Technol 214, 489-496.
D’APPOLONIA B.L. and MORAD M.M. 1981. Bread staling. Cereal Chem. 58(3), 186-190. DRAPRON R. and RICHARD-MOLARD D. 1979. Influence de divers procedes technologiques
sur la formation de l’arome du pain. Repercussions sur sa qualite. In Le pain; Bure, Jr. Ed.; Actes du colloque du CNERA.Paris, France.
EL-DASH A. A. 1967 The precursors of bread flavor: effect of bread flavor. Cereal Sci. Today
6, 12, p-282. FANCE W.J. 1960. The Student’s Technology of Breadmaking and Flour Confectionery.
Published by Routledge and Kegan Paul Ltd., London. FELLOWS P. Published 2000. Food Processing and Technology principles and practices.
Woodhead publishing limited, 2nd edition. FLINTHAM J.E. 2000. Different genetic components control coat-imposed and embryo-imposed
dormancy in wheat. Seed Science Research 10, 43-50. FLINTHAM J.E., ADLAM R.E. and GALE M.D. 1996. Dormancy gene maps in homeologous
cereal genomes. In International Symposium on Pre-harvest Sprouting in Cereals, 7., 1995, Abashiri-shi .,Japan. Proceedings (Edited by K. Noda. & D.J. Mares., eds.)pp. p.143-149, Japan.Osaka: Center for Academic Societies.
FLINTHAM J.E., ADLAM R.E. and GALE M.D. 1999. Seed coat and embryo dormancy in
wheat In International Symposium on Pre-harvest Sprouting in Cereals 8, Detmold: Proceedings Association of Cereal Research; Federal Centre for Cereal; Potato and Lipid Research (Edited by D. Weipert., ed. pp. p.67-76, Detmold.
FOOD AND DRUG ADMINISTRATION. July 1999. Whole Grain Foods FDAMA Health
Claim Docket #99P-2209. (accessed, 2007). FREED R.D., E.H. EVERSON., K. RINGLUND. and M. GULLORD. 1976. Seed-coat in wheat
and the relationship to seed dormancy at maturity. Cereal Res. Commun 4, 147-148.
24
GALE M.D., ATKINSON M.D., CHINOY C.N., HARCOURT R.L., JIA J., LI Q.Y. and DEVOS K.M. 1995. Genetic maps of hexaploid wheat. In International Wheat Genetics Symposium, 8., 1995, Beijing. Proceedings (X.S.X. Edited by Z.S. Li, ed. pp. p.79-87, Beijing: China Agricultural Scientech Press.
GAMBARO A, P.VARELA. and A. GIMENEZ. 2002. Textural Quality of White-Pan Bread by Sensory and Instrumental Measurements. Journal of Texture Studies 33, 401-413. GARY M. PAULSEN,1998. Hard White Winter Wheat for Kansas.Contribution o.98-298-S
from the Kansas Agricultural Experiment Station. GROOS. C, GAY G, PERRETANT. M. R, GERVAIS L., BERNARD. M, DEDRYVER. F and
CHARMET G. 2002. Study of the relationship between pre-harvest sproutingand grain color by quantitative trait loci analysis in a white x red grain bread-wheat cross. Theor Appl Genet 104, 39-47.
GONZALEZ R.C. and WINTZ P. 1983. Digital image processing, Reading, MA: Addison
Wesley, pp. 320-387 HARBORNE J.B. 1985. Phenolics and Plant Defense. Annu. Proc. Phytochem. Soc. Eur 25, 393-
408. HEATON K., MARCUS S., EMMETT P. and BOLTON C. 1988. Particle size of wheat, maize
and oat test meals: effects on plasma glucose and insulin responses and the rate of starch digestion in vitro. Am J Clin Nutr 47, 675-682.
HOLME J. 1966. A review of wheat flour, proteins and their functional properties. Baker’s Dig
5, 40, 38-42,78. JACKEL S. S. 1969. Fermentation flavors of white bread. Baker’s Dig. 43 (5), 24-28, 64. JENKINS DJ., WESSON V., WOLEVER TM., JENKINS AL., KALMUSKY J., GUIDICI S.,
CSIMA S., JOSSE RG. and WONG GS. 1988. Wholemeal versus wholegrain breads: proportion of whole or cracked grain and the glycaemic response. BMJ 297, 958-960.
KATINA. K, HEINO R L, AUTIO K and POUTANEN K 2006. Optimization of sourdough process for improved sensory profile and texture of wheat bread. LWT 39, 1189-1202. KIHLBERG I, LISBETH JOHANSSON.L , LANGSRUD O. and RISVIK E, 2005. Effects of
information on liking of bread. Food Quality and Preference 16, 25-35. KOKINI J.L., LAI L. S. and CHEDID L.L. 1992. Effect of starch structure on starch rheological
properties. Food technology 46(6), 124-139.
25
KULP K., RANUM P.M., WILLIAMS P.C. and YAMAZAKI W.T. 1980. Natural levels of nutrients in commercially milled wheat flour. I. Description of samples and proximate analysis. Cereal Chem. 57, 54-58.
LALLEMAND BAKING UPDATE. 1997. Bread Flavor Volume 2/Number 6. (accessed 2007). LEHTINEN P. and LAAKSO S. 2004. Role of lipid reactions in quality of oat products. Agr
Food Sci Finland 13, 88-99. LEPAGE M. and SIMS, R.P.A. 1968. Carotenoids of wheat flour: Their identification and
composition. Cereal Chem. 45, 600-604. LIU, S.M., SCD, FACN., 2002. Intake of Refined Carbohydrates and Whole Grain Foods in
Relation to Risk of Type-2 Diabetes Mellitus and Coronary Heart Disease, A review. American College of Nutrition 21, 4, 298-306.
LIU S. 2003. Whole-grain foods, dietary fiber, and type-2 diabetes: searching for a kernel of
truth. Am J Clin Nutr 77, 527-529. MARTINEZ-ANAYA M A, 1996. Enzymes and Bread Flavor. Journal of Agricultural and
Food Chemistry 44, 9, 2469-2480. MAGNUSSON M. K., ARVOLA A., KOIVISTO HURSTI U.K., ABERG L. and SJODEN P.
2001. Attitudes towards organic foods among Swedish consumers. British Food Journal 103(3), 209-226.
MANSOUR K. 1993. Sprout damage in wheat and its effect on wheat products. In Walker-
Simmons MK, Ried JL (eds) Pre-harvest sprouting in cereals, 1992 pp. pp 8-9. MCCALLUM J A and WALKER. J R L, 1990. Proanthocyanidins in Wheat Bran,. Cereal
Chem. 67(3), 282-285. MIALON VS., CLARK MR., LEPPARD PI. and COX DN. 2002. The effect of dietary fiber
information on consumer responses to breads and “English” muffins: a cross cultural study. Food Qual Prefer 13, 1-12.
MIYAMOTO T. and EVERSON E. 1958. Biochemical and physiological studies of wheat seed
pigmentation. Agron. J. 50, 733-734. MONDY N I. and GOSSELIN B. 1988. Effect of peeling in total phenols, total glycoalkaloids,
discoloration and flavor of cooked potatoes. J. Food Sci. 53, 756-759. NELSON J C, SORRELLS M E, VAN DEYNZE A E, LU Y H, ATKINSON M, BERNARD M,
LEROY P, FARIS J D and ANDERSON J A, October 1995. Molecular Mapping of Wheat: Major Genes and Rearrangements in Homeologous Groups 4, 5 and 7. Genetics Society of America 141, 721-731.
26
OWEN R. FENNEMA. 1996. Food Chemistry, 3rd edition. published in CRC press, New York, Basel.
PASIKATAN M C and DOWELL F C, 2003. Evaluation of a High-Speed Color Sorter for
Segregation of Red and White Wheat,. Applied Engineering in Agriculture Vol. 19 (1), 71-76.
POMERANZ Y and WILLIAMS P C 1990. Wheat hardness: its genetic, structural and
biochemical background, measurement and significance. In Advances in Cereal Science and Technology, Ed Y. Pomeranz. St Paul, MN: American Association of Cereal Chemists 10, pp. 471-544,.
POMERANZ, Y. and SHELLENBERGER, J.A. 1971. Bread science and technology. Avi Pub.
Co., Westport, Conn. POMERANZ Y. and FINNEY K. F. 1975. Sugars in Breadmaking. Baker’s Dig. 49 (1), 20-27. POMPER S. 1969. Biochemistry of yeast fermentation. Baker’s Dig. 21 (4), 32-38. PYLER E.J. 1988. Baking Science and Technology, volume II., pp. 850-910. QUILEZ J, RUIZ J A and ROMERO M P 2006. Relationships Between Sensory Flavor
Evaluation and Volatile and Nonvolatile Compounds in Commercial Wheat Bread Type Baguette. Journal of Food Science 71, 6, S423-S427.
ROBICHAUD J L. and NOBLE A C. 1990. Astringency and bitterness of selected phenolics in
wine. J Sci Food Agric 53, 343-353. ROBINSON R. J., LORD T. H., JOHNSON J.A. and MILLER B.S. 1958. The aerobic
microbiological population of preferences and the use of selected bacteria for flavor production. Cereal Chem. 35, 295-305.
SCANLON M.G. and ZGHAL M.C. 2001. Bread properties and crumb structure. Food Research
International 34, 841-864. SENECA L.A (55). 1956. Epistolae morales, 119 and 123, In Mc Cance and Widdowson, pp.7-
8. SHEWRY, P.R. and JONES, H.D. 2005. Transgenic wheat: where do we stand after the first 12
years? A review. Ann Appl Biol 147, 1-14. SKJOLDERBRAND C. 1986. Heat and Mass Transfer in Baking of Bread, SIK Service Series
no.752.
27
SLAVIN J L, MARTINI M C, JACOBS JR. D R and MARQUART L. 1999. Plausible mechanisms for the protectiveness of whole-grains. Am J Clin Nutr 70(suppl), 459S-463S.
SPICHER G., STEPHAN H. and SAUERTEIG H. 1987. Biologie. Biochemie, Technologie,
3Auf. B. B. V. Wirstchaft Informationen GmbH: Hamburg, Germany, . THORVALDSSON K. and SKJOLDEBRAND C 1998. Water Diffusion in Bread During
Baking. LWT., 31, 7, 658-663.. TORJUSEN H., LIEBLEIN G., WANDEL M. and FRANCIS C.A. 2001. Food system
orientation and quality perception among consumers and producers of organic food in Hedmark County, Norway. Food Quality and Preference 12(3), 207-216.
WAHREN. M. (no date). Bread through the Ages., Publishers to the Swiss Assoc. of Master
Bakers and Confectioners, Berne. WANG J. and COLES G.D. 1994. Objective measurement of bread crumb texture. In SPIE
Proceedings, Optics in Agriculture, Forestry, and Biological Processing, 2345, 85-94. WU J, CARVER B F and GOAD C L. 1999. Kernel Color Variability of Hard White and Hard
Red Winter Wheat. Crop Sci 39, 634-638.
28
CHAPTER 2
CONSUMER-BASED EVALUATION OF BREADS MADE FROM HARD RED AND HARD
WHITE WINTER WHEAT
Balasubramanian, S. and Shewfelt, R.L. To be submitted to Journal of Food Quality
29
ABSTRACT:
Whole-wheat breads are considered a healthy option to include whole-grains in diet and to
increase fiber intake, but sensory preferences of refined breads are a barrier for consumption
of whole-wheat breads. Whole-wheat breads and white breads were made from two wheat
types, namely, Hard Red Winter (HRW) wheat and Hard White Winter (HWW) wheat. The
results from descriptive analysis and consumer tests showed that breads made from white
wheat had a higher rate of acceptability than those made from red wheat. Acceptability was
predicted as a function of three sensory descriptors: color, grain aroma and beany flavor.
30
INTRODUCTION:
The USDA dietary guidelines recommend including whole grain products in the diet to maintain
good health and nutrition (Cleveland, 2000, USDHHS / USDA, 2005). Consumption of whole
grains has been associated with a number of health benefits, mainly attributed to the high fiber
content of such foods (Slavin, 2003). High fiber diets have been associated with reduced risk of
chronic diseases like obesity, coronary heart diseases, type 2 diabetes, etc (Cleveland, 2000,
Shewry and Jones, 2005). USDA and FDA recommend 3 servings (1 ounce equivalent for a
2000 Kcal diet) of whole-grain foods daily. Studies have shown that Americans consume only
0.3 servings of whole-grain foods while they consume on an average 2 servings of refined food
products (Bakke and Vickers, 2007, USDHHS /USDA, 2005). Consumption whole-wheat breads
are a healthy way to include whole-grains in the diet and increase fiber intake. However,
consumers generally choose white breads (low in fiber and high in sugar content) over whole-
wheat breads due to its more appealing appearance and flavor (Bakke and Vickers, 2007),
thereby compromising nutritive value. Consumer acceptability is the ultimate determinant of a
product’s success in the market and lack of appeal to consumers may result in the product not
being consumed. Hence it is important to take into consideration, the consumer’s preference and
specifications while designing a food product. In the present study whole-wheat breads and
refined breads were made using two wheat classes namely; Hard Red Winter (HRW) wheat and
Hard White Winter (HWW). The flour from red wheat is the primary ingredient in majority of
the commercial breads in America (Chang. et al., 1995). White wheat is not so widely used and
is a relatively new classification of wheat in the United States. It is still in the developmental
31
32
stages in many Agricultural Experiment Stations (AES) and is yet to be used in a commercial
scale (Chang. et al., 1995).
The major discriminator between the white and red wheat is their bran (seed coat) color
(Wu. et al., 1999). The bran color is mainly a genetically inherited characteristic (Wu. et al.,
1999, Cooper and Sorrells, 1984). The original red wheat had three major genes for red color, but
the modern varieties have one or two genes only (Paulsen, 1998). Red alleles R of a dominant
gene are attributed to the red testa pigmentation of the bran (Bassoi. et al., 2006, Flintham,
2000). The red color is expressed as a pleiotropic effect of the genes and is visible via the bran.
White wheat on the other hand has no dominant gene for seed coat color. It has three recessive
genes, which when present make the wheat grain appear almost white (Paulsen, 1998).
Furthermore, presence of phenolic compounds like proanthocyanidins has also been shown to
contribute to color of the bran in red wheat (Mccallum and Walker, 1990, Harborne, 1985). The
phenolic compounds are present in high levels in the seed coat and could possibly contribute to
bitter taste and astringency in whole-wheat breads made using this wheat type (Bakke and
Vickers, 2007). White wheat does not contain phenolic compounds that contribute to red color in
red wheat and this might contribute to milder flavor and appearance of whole-wheat breads made
using this wheat class (Paulsen,1998). Bread flavor has a major influence on consumer
perception of bread quality (Quilez et al., 2006). In general, flavor preference of refined breads is
a barrier to the consumption of whole-wheat breads which though healthier, lacks in sensory
appeal to the consumers (Bakke and Vickers, 2007).
In an attempt to combine the advantages of both flavor and nutrition, the objective of this study
is to determine if whole-wheat breads made from white wheat are more acceptable to consumers
than breads made using the traditional red wheat. Whole-wheat breads made using white wheat

has an appearance similar to that of refined breads made with red wheat that consumers prefer,
with the nutritional advantages of whole-wheat.
MATERIALS AND METHODS:
Four types of breads were used in this study. Whole-wheat breads and white or refined breads
were made from both Hard Red Winter (HRW) wheat and Hard White Winter (HWW) wheat.
The bread samples were then evaluated by an experienced sensory panel for select sensory
descriptors. Consumer evaluation was also done for the bread samples as a measure of
willingness to purchase, followed by a survey questionnaire.
Breadmaking process:
The breads used for this study were baked in a conventional oven in the laboratory kitchen in
University of Georgia at Athens (UGA). The HRW flour (King Arthur’s) for whole-wheat bread
and white bread was purchased at the local Kroger store. The HWW flour for whole-wheat bread
and white bread was provided by ConAgra. The breads were baked in the UGA oven for four out
of the six sensory tests. The breads for the first two sensory tests were commercially available
breads purchased at the local Kroger.
Whole-wheat bread:
The formulation and preparation method for whole-wheat bread was adapted from the
“preparedpantry” website (Http://Www.Preparedpantry.Com/Whole-Wheatbreadrecipe.Htm.)
with slight modifications to the original formulation. The following proportions of ingredients
were used to prepare two loaves of bread: 6 cups whole wheat flour, 2 tablespoon wheat gluten, a
sachet of active dry yeast, 2.5 cups of water, 1.5 tablespoon salt, 1/3 cup brown sugar for red
wheat and 1/3 cup refined sugar for white wheat and 4 tablespoons of melted and slightly cooled
butter.
33
Dough preparation: The yeast contents were emptied into the mixer and ¼ cup warm water
(about 32 oC) was added and allowed to stand for 5 min for the yeast to be activated. The flour,
salt, sugar and water were then added to the mixer and were mixed with the dough hook for two
minutes. Then the wheat gluten and butter were added and mixed for about 4 minutes (this
allows the gluten to form). Once the dough was formed, it was placed in a large greased bowl
and covered with a plastic wrap and was placed in refrigeration temperature (4 oC) overnight. On
the day of baking, the dough was removed to room temperature (3-4 hours). At this time, the
dough rose to nearly twice its size. The dough was then kneaded (by hand) for about a minute
and then shaped into two loaves and placed in greased bread pans and covered with a plastic
wrap and was left at warm temperature (about 34-36 oC) for an hour and a half or until it doubled
in size
Baking: The oven was pre-heated to about 176oC. The loaves were placed in the oven and baked
for 35-40 min. The pans were then removed from the oven and allowed to cool completely to
room temperature before slicing.
White bread:
The formulation and preparation method for white bread was adapted from the southern food-
U.S. cuisine” website (Http://Wwsouthernfood.About.Com/Od/Yeastbreads/R/Blbb205.Htm)for
basic white bread with slight modifications to the original formulation. The following
proportions of ingredients were used to prepare two loaves of bread: 6 cups refined flour, a
sachet active dry yeast, 2.5 cups warm water (32 oC), 1 tablespoon salt, 2.5 tablespoon sugar and
1.5 cup melted butter.
Dough preparation: The yeast contents were emptied into a mixer and mixed with ¼ cup of
warm water (32 o C) and allowed to stand for 5 minutes to activate the yeast (appearance of gas
34

bubbles confirms that the yeast is active). The flour, salt, sugar, butter and water were then added
and mixed with the dough hook until a soft, elastic dough was formed (about 4 minutes). The
dough was then placed in a large greased bowl and allowed to rise for two hours (or until the
dough rises to twice its size) in a warm place (34-36 oC). The dough was then kneaded by hand
for about 1 minute and cut into two and shaped into loaves. The loaves were then placed in
greased bread pans and covered with a plastic wrap. The loaves were then allowed to rise to
about twice its size (about an hour and a half).
Baking: The oven was pre-heated to about 204oC. The loaves were placed in the oven and baked
for 30 minutes. The pans were then removed from the oven and allowed to cool completely to
room temperature before slicing.
Sensory Descriptive Analysis (SDA):
An experienced panel consisting of ten members evaluated the bread samples for selected
sensory descriptors: color, grain aroma, denseness, bitterness, astringency and beany flavor. The
descriptors were chosen based on previous studies on bread flavor (R.L. Shogren. et al., 2003).
The panel evaluation of breads was done once a week for six weeks. Commercial samples were
used in order to calibrate panelists for the chosen sensory attributes. For each test, the bread
samples were freshly baked the evening prior to the test. Standards with known intensities for
each of the sensory descriptor were provided to familiarize with the descriptors. Bread samples
were baked in the UGA Food Science and Technology laboratory kitchen. Whole-wheat breads
and white breads made from Hard Red Winter wheat and Hard White Winter wheat served as
samples in these tests. The six descriptors the panelists had to evaluate in the breads and the
standards used for each descriptor are indicated in the Table 2.1.
35
Sample serving and coding: The bread crust was removed and one slice of bread was cut into
four pieces and placed in zippered bags immediately and sealed. The bags were coded with
random three-digit codes and served to the panelists at normal room temperature. The test was
conducted in a panel room in the Food Science and Technology department at UGA. Panelists
were provided with standards at beginning of each test to refresh their memory of the standard
references and their intensities. The intensity of each descriptor as perceived by the panelist was
recorded in a ballot in each session. All intensities were evaluated on a standard scale of 15cm
(R.L. Shogren. et al., 2003). The panelists cleansed their palates between each sample with water
or unsalted crackers. The panelists were given food reward (candy) at the end of each test-
session.
Consumer Testing:
Consumer testing of the bread samples was conducted on two separate days, at two different
locations within the University of Georgia-Athens campus. For each test, the bread samples were
freshly prepared in the UGA laboratory kitchen. The bread crust was removed and each slice was
cut into 4 pieces and placed in zippered bags and sealed immediately. The bags were coded with
random three-digit codes and served with water to cleanse palate between samples. Consumers
were asked to taste the samples and mark their preference based on a 5-point willingness to
purchase scale. The consumers also answered a questionnaire that accompanied their survey
ballots which helped obtain additional information in the various aspects consumers consider
when they purchase breads.
36
Statistical Analysis:
Correlation testing was conducted by linking attribute scores from the sensory descriptive
analysis and consumer acceptability by multivariate correlation analysis. Predictive model was
further obtained using multiple regression using the JMP (5.1) from SAS (Statistical Analysis
Software) institute.
RESULTS AND DISCUSSION:
Sensory Descriptive Analysis: The results from the SDA (Figure 2.1) show that the major
difference between the breads was found in grain aroma and color. Differences between the
breads with respect to astringency, bitterness, denseness and beany flavor were also detected.
The bread with the maximum intensity of brown color was observed in the whole wheat bread
made from HRW wheat followed by the whole wheat bread made from HWW wheat. The
refined breads made from HRW and HWW had the least intensity for color and were closer to
value for white. A significant difference was detected in intensity of grain flavor between the
whole wheat breads and white breads made from both wheat types. However, the intensities of
grain flavor were similar for both the whole-wheat breads. A similar response was noted in grain
flavor and observed for the two refined breads.
The intensity of beany flavor was similar for all four bread types. The denseness was
maximum for the HRW whole wheat bread followed by HWW whole wheat. The denseness was
least in the refined breads and there was no significant difference in the denseness of the two
refined breads. Whole-wheat breads made from HRW wheat was evaluated to be the most bitter
among the four bread types, while the HWW refined breads was the least bitter. Whole-wheat
breads made from HWW wheat had an average bitterness of 1.9 while refined breads made from
HRW had an average intensity of 1.1. Whole-wheat breads made from HRW wheat had the
37
highest value for astringency, and refined bread made from HWW wheat had the lowest
astringency. Whole-wheat bread made from HWW wheat had an average astringency of 2.0
while refined bread made from HRW wheat averaged a 1.3.
From these results, it can be seen that whole-wheat breads made from HRW wheat has the
highest intensities for all the sensory descriptors that were evaluated. One of the main objectives
of this study was to determine if the whole-wheat breads made from HWW wheat was milder in
bitterness, color (visual appearance) and astringency unlike the characteristic whole-wheat
breads made from HRW wheat which make them unacceptable. A significant difference between
the two whole-wheat breads was found with respect to color. Also, with regard to the other
sensory descriptors, the whole-wheat breads made using HWW were lower and milder in
intensities than those made using HRW wheat. From the SDA results, it can be seen that of all
the four bread types evaluated in this study, the whole-wheat breads had the highest intensities of
the sensory descriptors while the refined breads had the lowest. And among the whole-wheat
breads which are of main concern in this study, those made from HWW was milder in all the
sensory descriptors and this may contribute favorably to acceptability of these bread with regard
to flavor.
Consumer Evaluation: Results from the consumer evaluation show that the breads made using
Hard White Winter wheat had a higher preference than those made using Hard Red Winter
wheat. Refined breads made from HWW wheat had a 64% acceptability rating whereas the
whole-wheat breads made from HWW wheat had an acceptability rate of 62%. Whole-wheat
breads and refined breads made using HRW wheat had acceptability ratings of 59% and 60%
respectively. It is also evident from the tests that consumers preferred whole-wheat breads made
using HWW wheat more than refined breads made from HRW wheat. In general refined breads
38
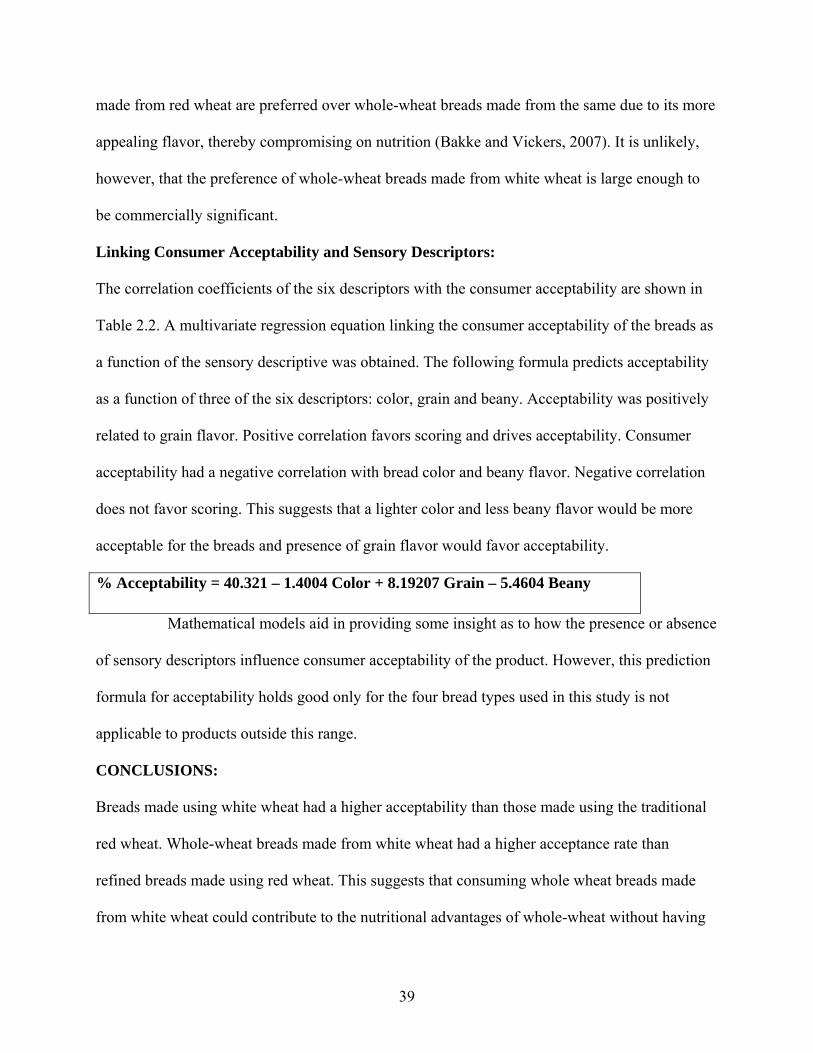
made from red wheat are preferred over whole-wheat breads made from the same due to its more
appealing flavor, thereby compromising on nutrition (Bakke and Vickers, 2007). It is unlikely,
however, that the preference of whole-wheat breads made from white wheat is large enough to
be commercially significant.
Linking Consumer Acceptability and Sensory Descriptors:
The correlation coefficients of the six descriptors with the consumer acceptability are shown in
Table 2.2. A multivariate regression equation linking the consumer acceptability of the breads as
a function of the sensory descriptive was obtained. The following formula predicts acceptability
as a function of three of the six descriptors: color, grain and beany. Acceptability was positively
related to grain flavor. Positive correlation favors scoring and drives acceptability. Consumer
acceptability had a negative correlation with bread color and beany flavor. Negative correlation
does not favor scoring. This suggests that a lighter color and less beany flavor would be more
acceptable for the breads and presence of grain flavor would favor acceptability.
% Acceptability = 40.321 – 1.4004 Color + 8.19207 Grain – 5.4604 Beany
Mathematical models aid in providing some insight as to how the presence or absence
of sensory descriptors influence consumer acceptability of the product. However, this prediction
formula for acceptability holds good only for the four bread types used in this study is not
applicable to products outside this range.
CONCLUSIONS:
Breads made using white wheat had a higher acceptability than those made using the traditional
red wheat. Whole-wheat breads made from white wheat had a higher acceptance rate than
refined breads made using red wheat. This suggests that consuming whole wheat breads made
from white wheat could contribute to the nutritional advantages of whole-wheat without having
39
to compromise on flavor which is the most important attribute that drives consumer
acceptability. However, refined breads made using white wheat had the highest rate of
preference among all the four bread types, which indicates that consumers still prefer refined
products. Mathematical model was used to predict acceptability as a function of three sensory
descriptors: color, grain and beany. Grain flavor had a positive correlation with acceptability
while color and beany was negatively related to acceptability.
REFERENCES:
USDHHS/USDA] U.S. DEPT. OF HEALTH AND HUMAN SERVICES. and U.S. DEPT. OF AGRICULTURE. 2005. Dietary Guidelines for Americans 35-7. (accessed, 2007).
BAKKE A. and VICKERS Z. 2007. Consumer Liking of Refined and Whole-wheat breads. Journal of Food Science 72, 7, S473-S480.
BASSOI M.C., FLINTHAM J. and RIEDE C.R. abr. 2006. Analysis of pre-harvest sprouting in three Brazilian wheat populations. Pesq. agropec. bras., Brasilia 41, 4, p.583-590.
CHANG C., SEITZ L.M. and CHAMBERS IV E. 1995. Volatile Flavor Components of Breads Made from Hard Red Winter Wheat and Hard White Winter Wheat. Cereal Chem. 72(3), 237-242.
CLEVELAND L.E, M S, RD, MOSHFEGH, A.J., MS, RD, ALBERSTON A.M. MS, RD AND GOLDMAN J.D., MA 2000. Dietary Intake of Whole Grains. Journal of American College of Nutrition 19, 331S-338S.
COOPER D.C. and SORRELLS M.E. 1984. Selection for white kernel color in the progeny of red/white wheat crosses. Euphytica 33, 227-232.
FLINTHAM J.E. 2000. Different genetic components control coat-imposed and embryo-imposed dormancy in wheat. Seed Science Research 10, p.43-50.
HAGLUND A., JOHANSSON L. and DAHLSTEDT L. 1998. Sensory Evaluation of Wholemeal Bread from Ecologically and Conventionally Grown Wheat. Journal of Cereal Science 27, 199-207.
HARBORNE J.B. 1985. Phenolics and Plant Defense. Annu. Proc. Phytochem. Soc. Eur 25, 393-408.
MCCALLUM J.A. and WALKER J.R.L. 1990. Proanthocyanidins in Wheat Bran,. Cereal Chem. 67(3), 282-285
40
PAULSEN.G.M, 1998. Hard White Winter Wheat for Kansas. Contribution o.98-298-S from the Kansas Agricultural Experiment Station.
QUILEZ. J, RUIZ J.A. and ROMERO M.P. 2006. Relationships Between Sensory Flavor Evaluation and Volatile and Nonvolatile Compounds in Commercial Wheat Bread Type Baguette. Journal of Food Science 71, 6, S423-S427
SHEWRY, P.R. and JONES, H.D. 2005. Transgenic wheat: where do we stand after the first 12 years? A review. Ann Appl Biol 147, 1-14.
SHOGREN R.L., MOHAMMED A.A, and CARRIERE C.J. 2003. Sensory Analysis of Whole-Wheat/Soy Flour Breads. Journal of Food Science 68, 6, 2141-2145.
SLAVIN, J. 2003. Why whole grains are protective: biological mechanisms. Proceedings of the Nutrition Society 62, 129-134.
TANDON K.S., BALDWIN E.A., SCOTT J.W. and SHEWFELT R.L. 2003. Linking Sensory Descriptors to Volatile and Non-volatile Components of Fresh Tomato Flavor. Journal of Food Science 68, 7, 2366-2371.
WU J., CARVER B.F. and GOAD C.L. 1999. Kernel Color Variability of Hard White and Hard Red Winter Wheat. Crop Sci 39, 634-638.
41
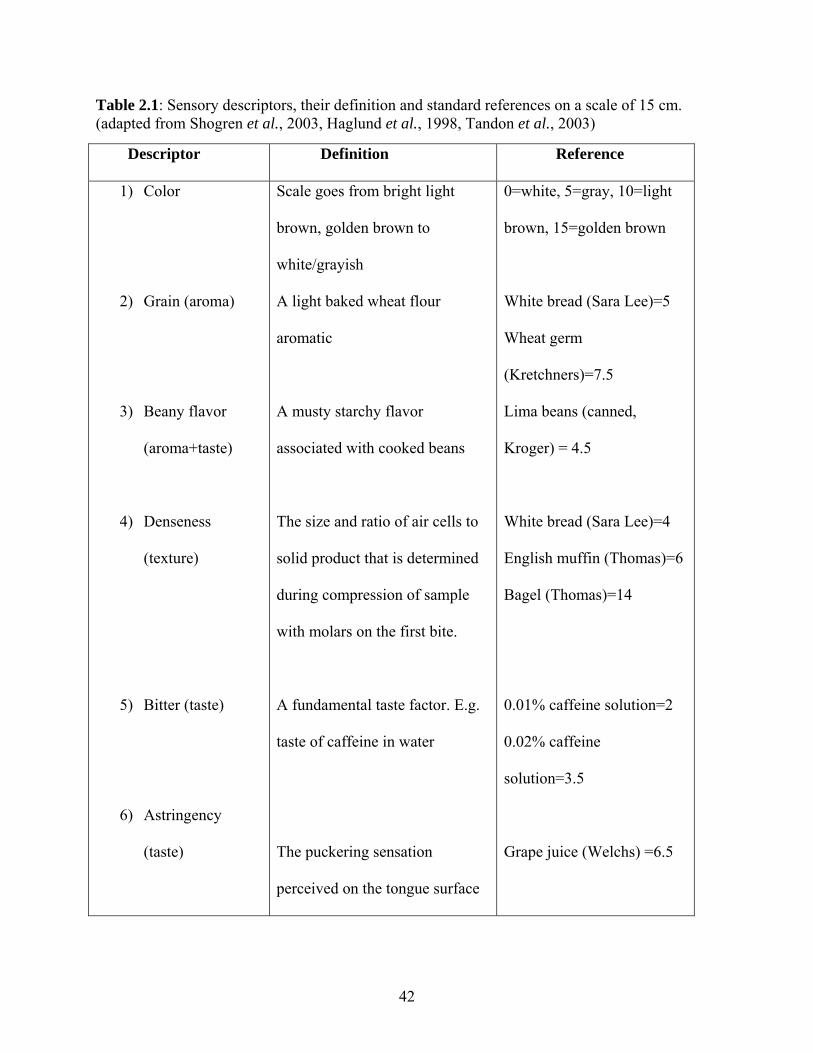
Table 2.1: Sensory descriptors, their definition and standard references on a scale of 15 cm. (adapted from Shogren et al., 2003, Haglund et al., 1998, Tandon et al., 2003)
Descriptor Definition Reference
1) Color
2) Grain (aroma)
3) Beany flavor
(aroma+taste)
4) Denseness
(texture)
5) Bitter (taste)
6) Astringency
(taste)
Scale goes from bright light
brown, golden brown to
white/grayish
A light baked wheat flour
aromatic
A musty starchy flavor
associated with cooked beans
The size and ratio of air cells to
solid product that is determined
during compression of sample
with molars on the first bite.
A fundamental taste factor. E.g.
taste of caffeine in water
The puckering sensation
perceived on the tongue surface
0=white, 5=gray, 10=light
brown, 15=golden brown
White bread (Sara Lee)=5
Wheat germ
(Kretchners)=7.5
Lima beans (canned,
Kroger) = 4.5
White bread (Sara Lee)=4
English muffin (Thomas)=6
Bagel (Thomas)=14
0.01% caffeine solution=2
0.02% caffeine
solution=3.5
Grape juice (Welchs) =6.5
42

Table 2.2: Average intensities with Standard Error for the various sensory descriptors for the different breads.
Sample Color Bitterness Grain Beany Astringency Denseness HWW Refined Bread HRW Refined Bread HWW Whole-wheat HRW Whole-wheat
0.91 ± 0.39 1.37 ± 0.39 9.53 ± 0.33 12.21 ± 0.58
0.87 ± 0.22 1.15 ± 0.27 1.91 ± 0.23 2.30 ± 0.13
4.83 ± 0.19 4.58 ± 0.07 6.72 ± 0.14 6.60 ± 0.21
2.48 ± 0.22 2.80 ± 0.26 3.45 ± 0.17 3.13 ± 0.19
1.13 ± 0.31 1.31 ± 0.17 2.09 ± 0.26 2.26 ± 0.12
4.43 ± 0.62 4.59 ± 0.16 6.49 ± 0.32 7.12 ± 0.49
43
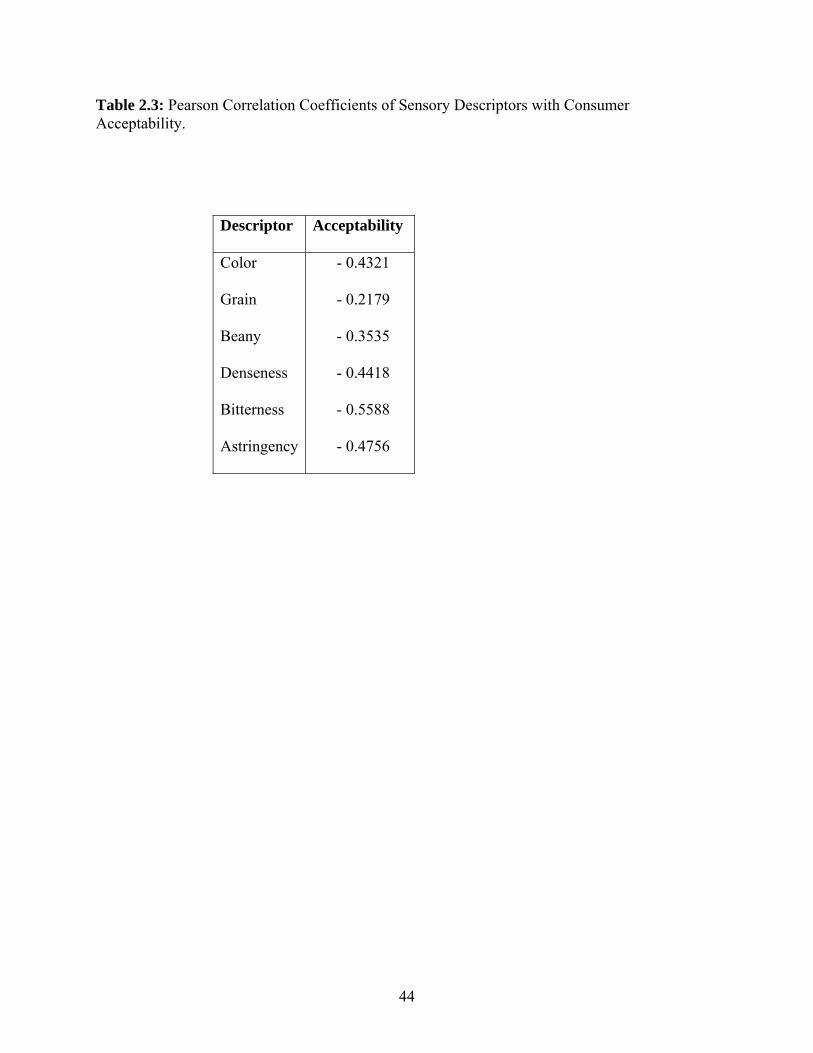
Table 2.3: Pearson Correlation Coefficients of Sensory Descriptors with Consumer Acceptability.
Descriptor Acceptability
Color
Grain
Beany
Denseness
Bitterness
Astringency
- 0.4321
- 0.2179
- 0.3535
- 0.4418
- 0.5588
- 0.4756
44
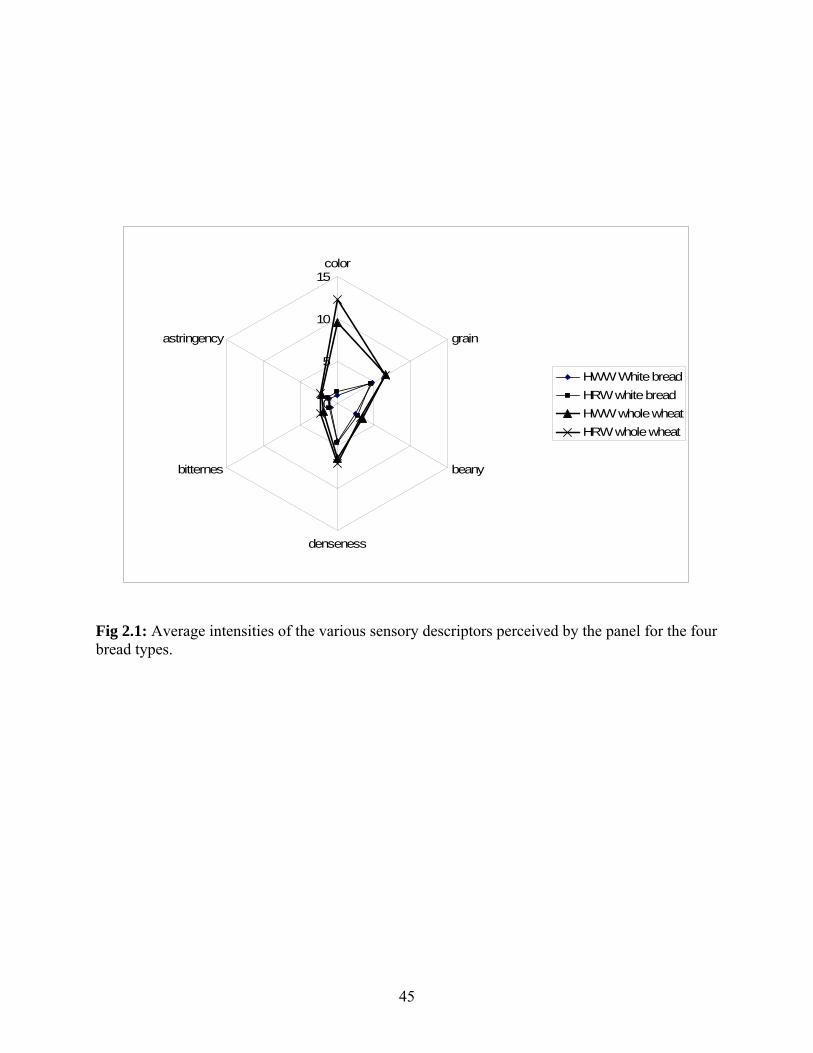
0
5
10
15color
grain
beany
denseness
bitternes
astringency
HWW White breadHRW white breadHWW whole wheatHRW whole wheat
Fig 2.1: Average intensities of the various sensory descriptors perceived by the panel for the four bread types.
45
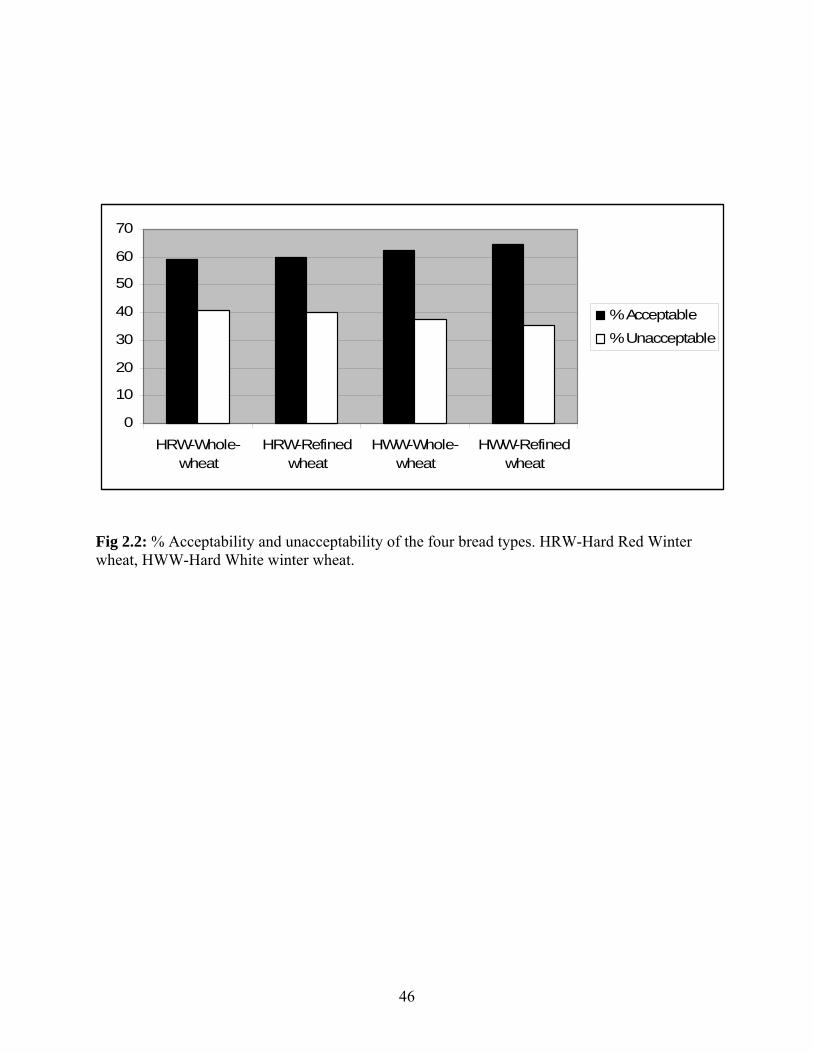
0
10
20
30
40
50
60
70
HRW-Whole-wheat
HRW-Refinedwheat
HWW-Whole-wheat
HWW-Refinedwheat
% Acceptable
% Unacceptable
Fig 2.2: % Acceptability and unacceptability of the four bread types. HRW-Hard Red Winter wheat, HWW-Hard White winter wheat.
46
CHAPTER 3
PHYSICAL PROPERTIES OF BREADS MADE FROM HARD RED AND HARD WHITE
WINTER WHEAT.
Balasubramanian, S., Shewfelt R.L. To be submitted to Journal of Food Quality.
47
48
ABSTRACT:
Visual appearance and texture of bread are quality attributes that have been known to
have an influence on consumer acceptability. Moisture content and water activity are
hidden quality characteristics that contribute to shelf stability. Textural properties (crumb
firmness), moisture (% moisture), water activity and color (L*, C*, H*, a* and b*) were
compared for whole-wheat and refined breads made from Hard Red Winter (HRW)
wheat and Hard White Winter (HWW) wheat. The results showed that there was a
significant difference in Lightness (L*), Chroma (C*), Hue angle (H*) and firmness of
the crumb between whole-wheat breads and refined breads. The type of wheat used also
has an influence on crumb firmness and color (lightness and hue angle). Whole-wheat
breads from white wheat had significantly Higher L* and H* value and lower firmness
than whole-wheat breads from red wheat.
KEY WORDS: Whole-wheat breads, refined breads, Texture, Moisture, Color, Water
Activity, Hard Red Winter wheat, Hard White Winter wheat.
INTRODUCTION:
In addition to flavor, texture and color are also important factors in influencing consumer
perception of bread quality (Chang et al., 1995, Scanlon and Zghal, 2001). Though
quality of bread is difficult to define, textural quality and visual appearance are indicators
of bread freshness to consumers and help determine acceptability (Gambaro et al., 2002,
Scanlon and Zghal, 2001, Seneca, 1956, Snyder, 1930). Macroscopic, microscopic and
molecular components of the food form a three-dimensional network which influences
the product’s textural properties (crumb firmness, crumb chewiness, denseness, crust
firmness, etc.) (Crowley et al., 2002). Although texture has been defined as a sensory
characteristic, human evaluation of texture is time consuming, expensive and is likely to
offer poor reproducibility (Bourne, 1982, Crowley et al., 2002, Szczesniak, 1987).
Instrumental analysis of texture is rapid, and the results are more consistent and have a
higher precision and reproducibility (Crowley et al., 2002). One of the important texture
parameter in bread is firmness, which has been defined as the “amount of force required
to bite through the bread sample” (Carson and Sun, 2000). Bread crumb texture has been
studied using instruments like the texture analyzer (Carson and Sun, 2000, Bourne, 1998,
Szczesniak, 1998). Kokini (1985) states that the “accuracy of an objective method in
measuring a quality parameter of a food is determined by its correlation to sensory
evaluation of that attribute” (Gambaro et al., 2002, Kokini, 1985). Additional studies
have shown that firmness is a textural attribute that has relatively higher correlation
between sensory and instrumental analysis (Gambaro et al., 2002, Szczesniak, 1998,
Meullenet et al., 1998, Carson and Sun 2000).
49
Moisture content of bread is critical for determining shelf-life, freshness and
staling quality (Xie et al., 2003).Amount of water in the bread has an effect on complex
reactions like Maillard browning, crust formation and development of aroma
(Thorvaldsson and Skjoldebrand, 1998, Skjolderbrand, 1986). Bread usually has a
moisture content of about 40% (Baik and Chinachoti 2000). At high temperatures of
baking, water at the surface of the loaf evaporates and moves toward the center where
condensation occurs due to lower temperature. This moisture redistribution influences
crust formation (Thorvaldsson and Skjoldebrand, 1998). Bread has high water activity:
0.95-0.96 (Fellows, 2000) and hence is categorized as a highly perishable food. Water
activity indicates the amount of available water for microbial activity and helps determine
shelf-stability of the bread (Fellows, 2000, Fennema, 1996).
Color of bread is the visual quality attribute that has an influence on
consumer’s perception of freshness and quality (Scanlon and Zghal, 2001). Bread’s
characteristic color is a result of wheat pigments in the flour, non-enzymatic browning
reactions like Maillard browning and caramelization reactions and other changes that
occur in the starches (carbonization of sugars), fats and proteins (Al-Hooti et al., 2000,
Fellows, 2000) in the bread. Bread crumb fineness influences color based on the
reflection of incident light (Al-Hooti et al., 2000, Kruger and Reed, 1988). Pigments like
xanthophylls and flavones in the wheat flour have been identified as contributors to bread
color (Al-Hooti et al., 2000).
The objective of this study is to measure and compare the texture, moisture
content, water activity and color of whole-wheat breads and refined breads made from
50
two wheat classes: Hard Red Winter (HRW) wheat and Hard White Winter (HWW)
wheat.
MATERIALS AND METHODS:
Sample preparation: The four bread samples: whole-wheat breads and refined breads
from red and white wheat were prepared as mentioned in Balasubramanian S. and
Shewfelt R. (2007).
Texture measurement:
Firmness of the crumb was measured using a Texture Analyzer (TA.XT2i Stable
Microsystems) with slight modifications to the Approved Method (AACC) (AACC,
2000). The compression disc used was an aluminum disc with 35-mm flat end (probe
P/35). Sample slice of 10 mm thickness was used. The selected settings were pretest, test
and post-test speed of 1.0, 1.7 and 10.0 mm/sec respectively and a 60% deformation (6
mm compression into sample). Each sample was measured at three different parts of the
crumb for firmness. The maximum peak force [N] was recorded as the firmness value.
The values reported for each bread type is an average of the different measurements. The
samples were discarded after measurement.
Moisture Analysis:
Crumb moisture was measured using a Moisture Analyzer (Mettler Toledo). 1.5 g of the
sample was used for each measurement at 70oC in the rapid-drying mode. Percentage
moisture was recorded for the four bread types at the end of the drying cycle. The water
activity was determined using an AquaLab Series 3 Water activity meter.
51
Instrumental Analysis of Color:
The color of each sample was measured using a Minolta CR-300 series Chroma Meter.
The data processor model was DP-301. L*a*b* readings were converted to chroma (C*)
and hue angle (H*).
Statistical Analysis: An analysis of variance was performed to compare the data
obtained for the different breads. Significance was accepted at p= 0.05 level. The means
with the standard error for each physical characteristic tested for all the four bread types
is reported in Table 3.1.
RESULTS AND DISCUSSION:
From the texture measurements, it was observed that whole-wheat breads were much
firmer than refined breads (Table 3.1.). Moisture content was similar for all the bread
types with the exception of HRW had significantly lower moisture. Water activity (aw)
for all the bread samples was in the range of 0.94-0.96. As expected, refined breads were
significantly lighter (L*) than whole-wheat breads. Whole wheat bread from HWW was
lighter than from HRW, but no significant difference was noted in lightness of the refined
breads. Color differences in whole and refined breads were also observed with chroma
(C*) and hue angle (H*).A higher C* corresponds to a more saturated, intense coloration.
As H* decreases from 90˚ to 75˚, the color becomes more reddish brown.
Texture and visual appearance are physical quality characteristics perceived
by the consumer and have been known to drive acceptability of breads (Scanlon and
Zghal, 2001). Increased firmness has been related to staling and contributes unfavorably
to consumer acceptability (Bice and Geddes, 1949, Xie et al., 2003). It is known that a
white crumb color has a higher preference rate by consumers (Al-Hooti et al., 2000). The
52

lighter crumb color of whole-wheat breads (higher L value) made using white wheat
rather than whole-wheat breads from red wheat suggests that these breads may be more
acceptable in terms of visual appeal. The results for crumb texture and color are
consistent with the sensory results for these four bread types (Balasubramanian and
Shewfelt, 2007). Instrumental texture analysis showed that whole-wheat breads made
from white wheat were less firm than whole-wheat breads made from red wheat. The
bread texture was evaluated as a measure of denseness in the sensory studies which also
showed that whole-wheat breads from white wheat have lower denseness compared to its
red wheat counterpart (Balasubramanian and Shewfelt, 2007). These textural attributes
(lower firmness and denseness) of whole-wheat bread from white wheat contribute
favorably to acceptability which is proven in the consumer study. The results for color
from instrumental analysis showed that the crumb color is lighter in the whole-wheat
breads made with white wheat. This is evident from the higher L* value of these breads
and larger hue angle (Table 3.1). This supports the results from the sensory studies which
showed that whole-wheat breads from white wheat has a lighter crumb color and has a
higher preference than those from red wheat. Moisture content and water activity are
hidden quality characteristics that contribute to the freshness of bread and helps in
determining the shelf-life of the bread (Baik and Chinachoti, 2000).
SUMMARY AND CONCLUSION:
Instrumental analysis of texture, moisture content, water activity and color was performed
and the results were compared for whole-wheat breads and refined breads made using red
wheat and white wheat. Moisture and water activity of the whole-wheat breads from
53
white wheat are similar to that of the refined breads. Analysis of texture as a measure of
firmness showed that crumb of whole-wheat breads from white wheat are less firm than
its counterpart from red wheat. Less firmness of bread crumb has been attributed to
enhance acceptability. Higher L* and larger H* show that whole-wheat bread from white
wheat have significantly lighter color and less red than those from red wheat thereby
enhancing visual appeal. These attributes (texture and color) of whole-wheat breads from
white wheat will contribute favorably to its acceptability over the traditional whole-wheat
breads. However, the sample size used in this analysis is too small to be commercially
significant.
REFERENCES:
AACC AMERICAN ASSN. OF CEREAL CHEMISTS. 2000. Cereal laboratory methods. Bread firmness by universal testing machine. Method 74-09.
AL-HOOTI S.N., SIDHU J.S. and AL-SAQER J.M. 2000. Utility of CIE Tristimulus
system in measuring the objective crumb color of high-fiber toast bread formulations. Journal of Food Quality 23, 103-116.
BAIK M.Y. and CHINACHOTI P. 2000. Moisture Redistribution and Phase Transition During Bread Staling. Cereal Chem. 77(4), 484-488.
BALASUBRAMANIAN S. and SHEWFELT R. L. 2007. Consumer Based Evaluation of Breads made from Hard Red and Hard White Winter Wheat. to be submitted to Journal of Food Quality.
BICE C.W. and GEDDES W.F. 1949. Studies on bread staling. IV. Evaluation of methods for the measurement of changes which occur during bread staling. Cereal Chem. 26, 440.
BOURNE M.C. 1982. Texture, viscosity and food. In In: Food texture and viscosity. Concept and measurement, pp.1-23, Academic press, New York.
BOURNE M.C. 1998. Texture Profile Analysis. Food Technol. 32, 62-66, 72.
CARSON L. and SUN X.S. 2000.Creep Recovery of Bread and Correlation to Sensory Measurements of Textural Attributes. Cereal Chem. 78(1), 101-104.
54
CHANG C., SEITZ L.M. and CHAMBERS IV E. 1995. Volatile Flavor Components of Breads Made from Hard Red Winter Wheat and Hard White Winter Wheat. Cereal Chem. 72(3), 237-242.
CROWLEY P.., SCHOBER T.J., CLARKE C.I. and ARENDT E.K. 2002. The Effect of Storage time on textural and crumb grain characteristics of sourdough wheat bread. Eur. Food Res Technol 214, 489-496.
FELLOWS P. Published 2000. Food Processing and Technology principles and practices. Woodhead publishing limited, 2nd edition.
FENNEMA O.R. 1996. Food Chemistry, 3rd edition. published in CRC press, New York, Basel.
GAMBARO A., VARELA P., and GIMENEZ A., 2002. Textural Quality of White-Pan Bread by Sensory and Instrumental Measurements. Journal of Texture Studies 33, 401-413.
KOKINI J.L. 1985. Fluid and semi-solid food texture and texture-tastes interactions. Food Technol. 39 (11), 86-94.
KOKINI J.L., LAI L. S. and CHEDID L.L. 1992. Effect of starch structure on starch rheological properties. Food technology 46(6), 124-139.
KRUGER J.E. and REED G. 1988. Enzymes and Color, In Wheat Chemistry and technology, (Y. Pomeranz, ed.) pp. 441-50, American Association of Cereal Chemists, St.Paul, Mn.
MEULLENET J.F., LYON B.G., CARPENTER J.A. and LYON C.E. 1998. Relationship
between sensory and instrumental texture profile attributes,. Journal of Sensory Study 13, 77-93.
SCANLON M.G. and ZGHAL M.C. 2001. Bread properties and crumb structure. Food Research International 34, 841-864.
SENECA L.A (55). 1956. Epistolae morales, 119 and 123, In Mc Cance and Widdowson, pp.7-8.
SKJOLDERBRAND C. 1986. Heat and Mass Transfer in Baking of Bread, SIK Service Series no.752.
SNYDER H. 1930. Bread, pp.228-237. New York Macmillan.
SZCZESNIAK A.S. 1987. Journal of Texture studies 18, 1-15.
SZCZESNIAK A.S. 1998. Sensory Texture profiling- Historical and Scientific perspective. Food Technol. 52, 54-57.
55

THORVALDSSON K. and SKJOLDEBRAND C. 1998. Water Diffusion in Bread During Baking. LWT., vol. 31, no.7 and 8, 658-663.
XIE F., DOWEL F.E., and SUN X.S. 2003. Comparison of Near-Infrared Reflectance
Spectroscopy and Texture Analyzer for Measuring Wheat Bread Changes in Storage.
Cereal Chem. Vol.80, no.1
56
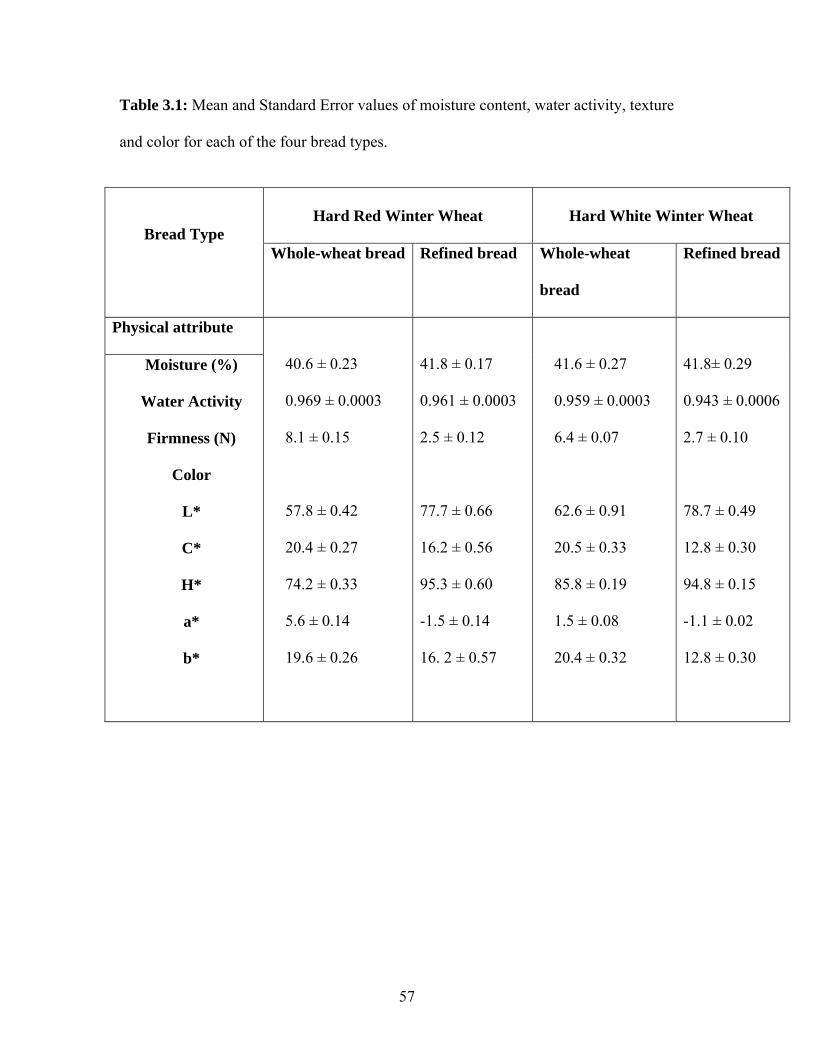
Table 3.1: Mean and Standard Error values of moisture content, water activity, texture
and color for each of the four bread types.
Hard Red Winter Wheat
Hard White Winter Wheat
Bread Type
Whole-wheat bread Refined bread Whole-wheat
bread
Refined bread
Physical attribute
Moisture (%)
Water Activity
Firmness (N)
Color
L*
C*
H*
a*
b*
40.6 ± 0.23
0.969 ± 0.0003
8.1 ± 0.15
57.8 ± 0.42
20.4 ± 0.27
74.2 ± 0.33
5.6 ± 0.14
19.6 ± 0.26
41.8 ± 0.17
0.961 ± 0.0003
2.5 ± 0.12
77.7 ± 0.66
16.2 ± 0.56
95.3 ± 0.60
-1.5 ± 0.14
16. 2 ± 0.57
41.6 ± 0.27
0.959 ± 0.0003
6.4 ± 0.07
62.6 ± 0.91
20.5 ± 0.33
85.8 ± 0.19
1.5 ± 0.08
20.4 ± 0.32
41.8± 0.29
0.943 ± 0.0006
2.7 ± 0.10
78.7 ± 0.49
12.8 ± 0.30
94.8 ± 0.15
-1.1 ± 0.02
12.8 ± 0.30
57
58
CHAPTER 4
SUMMARY AND CONCLUSION:
Consumers have certain specifications with regard to flavor and quality (that
make the product acceptable) and that must be taken into consideration while designing a
food product. Qualitative research gives a better understanding of consumer perception of
a product (Van Trijp and Schifferstein, 1995). Whole-grain products have been associated
with several health benefits like reduced risk of coronary heart disease, obesity, diabetes,
etc.(Merchant et al., 2006, Liu, 2003). This has been attributed to the presence of high
levels of dietary fiber in such foods. Whole-wheat breads are a good choice in increasing
dietary fiber. Flavor preference is the key factor that drives consumer acceptability
(Bakke and Vickers, 2007). Sensory preference of refined breads acts as a barrier for
whole-wheat bread consumption. In this study, whole-wheat breads and refined breads
made from two wheat types were evaluated: Hard Red Winter (HRW) and Hard White
Winter (HWW) wheat for quality as perceived by the consumer.
In chapter 2, the four bread types were evaluated by descriptive analysis and
consumer studies. Panelists scored the four bread types for six sensory attributes (color,
denseness, astringency, bitterness, grain and beany). Consumer studies showed that
breads made using white wheat had a higher preference rate than breads made using
traditional red wheat. Whole-wheat breads made from white wheat had a higher
acceptance rate than refined breads made using red wheat. Acceptability was expressed as
a function of sensory descriptors. Prediction model showed that grain flavor had a
positive correlation with acceptability while presence of beany flavor and color did not
contribute favorably to acceptability. This suggests that consuming whole wheat breads
made from white wheat has the nutritional advantages of whole-wheat without having to
compromise on flavor which is the most important attribute that drives acceptability.
However, higher preference rate of refined breads points out that consumers still prefer
refined products. Since the whole wheat made using white wheat is more preferred than
refined breads of red wheat, consumers can be encouraged to include more whole-wheat
in their diet. It is not clear, however, that these differences will be commercially
significant.
The main objective of chapter 3 was to measure and compare four physical
quality characteristics: texture, color, moisture content and water activity for the four
different bread types by instrumental methods. Consumers in general preferred less
firmness (a characteristic of refined breads) in breads. Textural analysis showed that
whole-wheat breads made from white wheat were less firm than whole-wheat breads
made from red wheat suggesting that they may have a higher acceptability rate.
Consumers also preferred a lighter crumb color (Al-Hooti et al., 2000). The color for the
whole-wheat breads from white-wheat was lighter than that of red wheat. This may
contribute favorably to visual appearance for consumers. Texture and visual appearance
is known to drive consumer acceptability of breads. However, moisture content and water
activity are hidden quality characteristics that contribute to the freshness of bread and
helps in determining the shelf-life of the bread. The results from the instrumental analysis
were consistent with the sensory results in terms of color and texture for the four bread
59
types studied. It can hence be concluded that whole-wheat breads made from white wheat
would have a better acceptability based on texture and color than those made from the
typical red wheat.
This study provides an insight into consumer’s perception of quality and
preference of different bread types. The results also showed that the type of wheat used
has an influence on sensory characteristics and texture of the breads. This information
will be useful in tailoring the product right from the wheat breeding stage to the final
production of bread as per consumer preferences. However, commercial significance of
this study is still unclear and further research is necessary to determine the chemical
components in the whole-wheat bread from white wheat that contributes to flavor
perception. And also linking consumer acceptability with instrumental analysis will help
provide a better understanding of acceptability and consumer perception of quality.
REFERENCES:
AL-HOOTI S.N., SIDHU J.S. and AL-SAQER J.M. 2000. Utility of CIE Tristimulus system in measuring the objective crumb color of high-fiber toast bread formulations. Journal of Food Quality 23, 103-116.
BAKKE A. and VICKERS Z. 2007. Consumer Liking of Refined and Whole-wheat breads. Journal of Food Science Vol.72, Nr. 7, S473-S480.
LIU S. 2003. Whole-grain foods, dietary fiber, and type-2 diabetes: searching for a kernel of truth. Am J Clin Nutr 77, 527-529.
MERCHANT. A.T., PITIPHAT W., FRANZ M. and JOSHIPURA. K.J., 2006. Whole-grain and fiber intakes and periodontitis risk in men. Am J Clin Nutr 83, 1395-1400.
VAN TRIJP H.C. and SCHIFFERSTEIN H.N.J. 1995. Sensory analysis in marketing practice: Comparison and integration. J. Sens. Studies 10, 127-147.
60