Embed Size (px)
Citation preview
2008
Division of Nuclear SafetyBureau of Environmental Safety
Report on Environmental Monitoring for Nuclear Generating Stations
State of IllinoisIllinois Emergency Management Agency
- i -
Executive Summary The Illinois Emergency Management Agency, Division of Nuclear Safety is charged with protecting the citizens of Illinois from the harmful effects of radioactive materials. To that end, the Division of Nuclear Safety monitors the environment around Illinois’s seven nuclear power stations for the presence of radionuclides. Samples of water, sediment, fish, milk and vegetables are collected from 132 locations analyzed for man-made and natural radionuclides. In addition, the Agency maintains a network 415 environmental dosimeters to measure and document the ambient gamma radiation levels within a ten-mile radius of each station. In 2008, 593 samples were collected and analyzed. The only radionuclide detected that can be attributed to nuclear power station operations was tritium, which was detected in several water samples. Tritium is a normal part of the effluent stream of nuclear power stations and the concentrations detected met all regulatory standards. Of the drinking water supplies sampled, tritium was detected in only one, Wilmington, but at a concentration of 1% of the US Environmental Protection Agency’s limit for drinking water. Historically, tritium has been detected at this location at concentrations of up to 20% of the limit. In 2008, special attention was paid to the ground water in the immediate vicinity of the Braidwood nuclear power station as Exelon continued its efforts to remediate the tritium plume found there. Analysis of samples collected from the area of the plume suggests that mitigation efforts have generally been successful. No tritium has been detected in any of the private wells sampled. Environmental dosimetry measurements at all stations were consistent with established background readings.
- ii -
TABLE OF CONTENTS
Page Executive Summary ........................................................................................................ i List of Figures ................................................................................................................ iii List of Tables ................................................................................................................. vi IEMA Environmental Monitoring Program .............................................................. 1 Samples and Analyses ........................................................................................1 Limits of Detection ............................................................................................3 Braidwood Nuclear Power Station ................................................................................5 Water Samples ...................................................................................................6 Milk Samples ...................................................................................................10 Sediment Samples ............................................................................................10 Fish Samples ....................................................................................................10 Vegetable Samples ...........................................................................................10 Ambient Gamma ..............................................................................................11 Dresden Nuclear Power Station ...................................................................................17 Water Samples .................................................................................................17 Milk Samples ...................................................................................................22 Sediment Samples ............................................................................................22 Fish Samples ....................................................................................................22 Vegetable Samples ...........................................................................................22 Ambient Gamma ..............................................................................................23 Byron Nuclear Power Station ......................................................................................26 Water Samples .................................................................................................26 Milk Samples ...................................................................................................27 Sediment Samples ............................................................................................28 Fish Samples ....................................................................................................28 Vegetable Samples ...........................................................................................28 Ambient Gamma ..............................................................................................28 Clinton Nuclear Power Station ....................................................................................32 Water Samples .................................................................................................32 Sediment Samples ............................................................................................33 Ambient Gamma ..............................................................................................33
- iii -
LaSalle Nuclear Power Station ....................................................................................36 Water Samples .................................................................................................36 Milk Samples ...................................................................................................40 Sediment Samples ............................................................................................40 Fish Samples ....................................................................................................40 Vegetable Samples ...........................................................................................40 Ambient Gamma ..............................................................................................41 Quad Cities Nuclear Power Station.............................................................................44 Water Samples .................................................................................................44 Milk Samples ...................................................................................................45 Sediment Samples ............................................................................................45 Fish Samples ....................................................................................................45 Vegetable Samples ...........................................................................................46 Ambient Gamma ..............................................................................................46 Zion Nuclear Power Station .........................................................................................49 Water Samples .................................................................................................49 Sediment Samples ............................................................................................50 Ambient Gamma ..............................................................................................50 Kankakee and Illinois River Tritium Monitoring .....................................................53
- iv -
List of Figures
Figure 1: Tritium in Wilmington Public Drinking Water ................................................7 Figure 2: Tritium Downstream of Braidwood Effluent ...................................................7 Figure 3: Tritium at Residential Well BD-36 ..................................................................8 Figure 4: Braidwood Tritium Plume Monitoring ............................................................9 Figure 5: Braidwood Monitoring Locations Overview .................................................14 Figure 6: Braidwood Monitoring Locations, Plume Detail ...........................................15 Figure 7: Braidwood Environmental Dosimeter Locations ...........................................16 Figure 8: Tritium in Dresden Cooling Channel .............................................................19 Figure 9: Tritium at Goose Lake in Kankakee River .....................................................19 Figure 10: Tritium in Residential Well ..........................................................................20 Figure 11: Tritium Downstream of Dresden ..................................................................21 Figure 12: Tritium Upstream of Dresden at Wilmington ..............................................21 Figure 13: Dresden Monitoring Locations .....................................................................24 Figure 14: Dresden Environmental Dosimeter Locations .............................................25 Figure 15: Tritium Downstream of Byron Station .........................................................27 Figure 16: Byron Monitoring Locations ........................................................................30 Figure 17: Byron Environmental Dosimeter Locations .................................................31 Figure 18: Clinton Monitoring Locations ......................................................................34 Figure 19: Clinton Environmental Dosimeter Locations ...............................................35 Figure 20: Tritium Upstream of LaSalle ........................................................................38 Figure 21: Tritium Downstream of LaSalle ...................................................................38 Figure 22: Correlation of Tritium Upstream and Downstream of LaSalle ....................39
- v -
List of Figures (cont.) Figure 23: Tritium Downstream of Dresden (Upstream of LaSalle) .............................39 Figure 24: LaSalle Monitoring Locations ......................................................................42 Figure 25: LaSalle Environmental Dosimeter Locations ..............................................43 Figure 26: Quad Cities Monitoring Locations ...............................................................47 Figure 27: Quad Cites Environmental Dosimeter Locations .........................................48 Figure 28: Zion Monitoring Locations ..........................................................................51 Figure 29: Zion Environmental Dosimeter Locations ...................................................52 Figure 30: Monitoring Locations on the Illinois and Kankakee Rivers ........................55 Figure 31: Tritium in Illinois River Upstream of LaSalle NPS .....................................56 Figure 32: Tritium in Illinois River Downstream of LaSalle NPS ................................56 Figure 33: Tritium Kankakee River Downstream of Braidwood NPS ..........................57 Figure 34: Tritium in Illinois River Downstream of Dresden NPS ...............................57 Figure 35: Tritium in Kankakee River Upstream of Braidwood NPS ...........................58 Figure 36: Tritium in Kankakee River Downstream of Braidwood NPS ......................58
- vi -
List of Tables
Table 1: Minimum Detectable Concentrations of Selected Radionuclides .....................4 Table 2: Braidwood Monitoring Locations ....................................................................12 Table 3: Braidwood Tritium Plume Monitoring Locations ...........................................13 Table 4: Dresden Monitoring Locations ........................................................................23 Table 5: Byron Monitoring Locations ...........................................................................29 Table 6: Clinton Monitoring Locations .........................................................................33 Table 7: LaSalle Monitoring Locations .........................................................................41 Table 8: Quad Cities Monitoring Locations ..................................................................46 Table 9: Zion Monitoring Locations ..............................................................................50
- 1 -
IEMA Environmental Monitoring Program Illinois is home to seven commercial nuclear power stations – more than any other state in the U.S. Although direct regulatory authority over all U.S. nuclear power stations rests with the US Nuclear Regulatory Commission (USNRC), the Illinois Emergency Management Agency (IEMA) has been charged with protecting the citizens of Illinois from unnecessary exposure to ionizing radiation in the environment. To this end, the IEMA Division of Nuclear Safety (DNS) maintains a monitoring program in order to confirm measurements made by the utilities, to evaluate any impact the stations may have on the environment and the public, and to establish a baseline in the event of a release of radioactive material. Samples are collected on a quarterly basis through a contract with Midwest Laboratory and are analyzed by the IEMA radiochemistry laboratory. These samples are identical splits of samples collected for Exelon’s Radiological Environmental Monitoring Program (REMP). Ambient gamma radiation is monitored using optically stimulated luminescence dosimeters. A network of 413 dosimeters is arrayed around the stations; the dosimeters are exchanged an analyzed quarterly. Samples and Analyses Samples collected for the IEMA monitoring program reflect the critical pathways that radionuclides could be transported to and ingested by the general population: water, sediments, and fish from lakes and rivers downstream; ground water from nearby wells; milk from local dairies; vegetables from nearby farms. At six stations, split samples are collected on a quarterly basis through a contract with Midwest Laboratory. At the seventh station, Clinton, IEMA staff members collect all samples. All samples are analyzed by the IEMA radiochemistry laboratory.
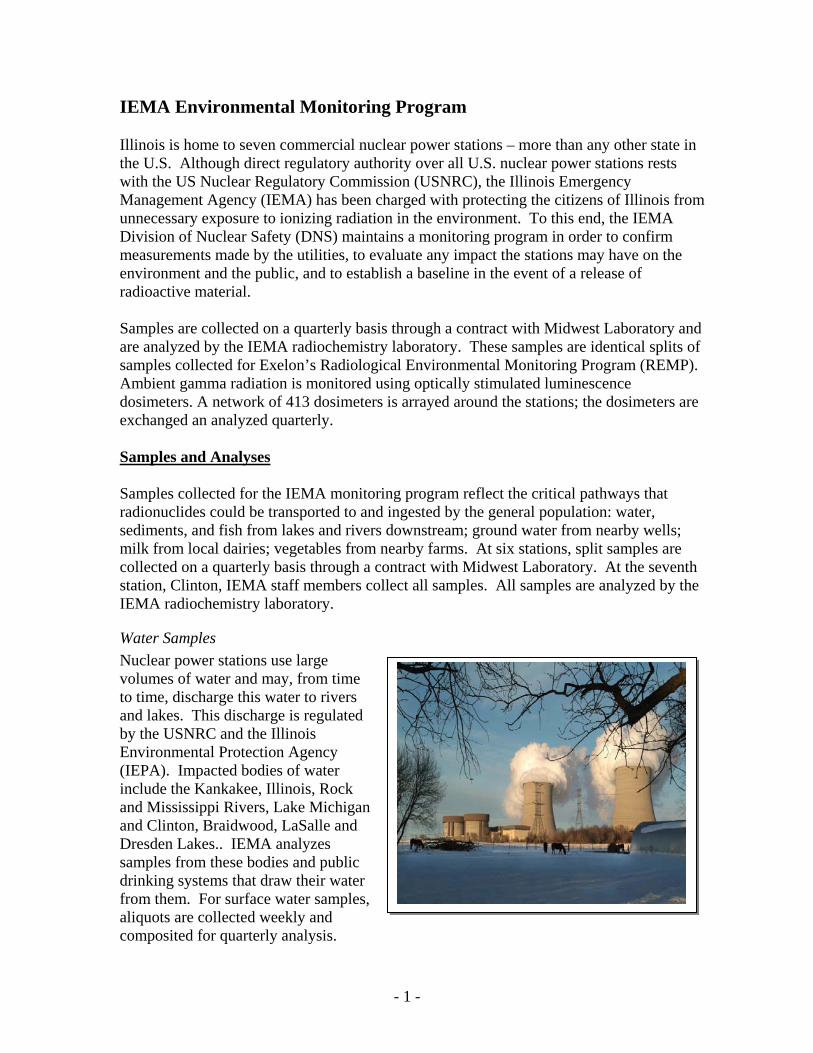
Water Samples Nuclear power stations use large volumes of water and may, from time to time, discharge this water to rivers and lakes. This discharge is regulated by the USNRC and the Illinois Environmental Protection Agency (IEPA). Impacted bodies of water include the Kankakee, Illinois, Rock and Mississippi Rivers, Lake Michigan and Clinton, Braidwood, LaSalle and Dresden Lakes.. IEMA analyzes samples from these bodies and public drinking systems that draw their water from them. For surface water samples, aliquots are collected weekly and composited for quarterly analysis.
- 2 -
Station operations can also impact ground water so IEMA also analyzes samples collected from wells in and around the stations. Ground water samples are collected and analyzed quarterly. For all water samples, typically 3-4 liters are collected per quarter. Water samples are monitored for several radionuclides associated with nuclear power station operations, including, but not limited to H-3 (tritium), Co-60, Cs-137, Fe-59, Zr-95, gross alpha and gross beta radiation.
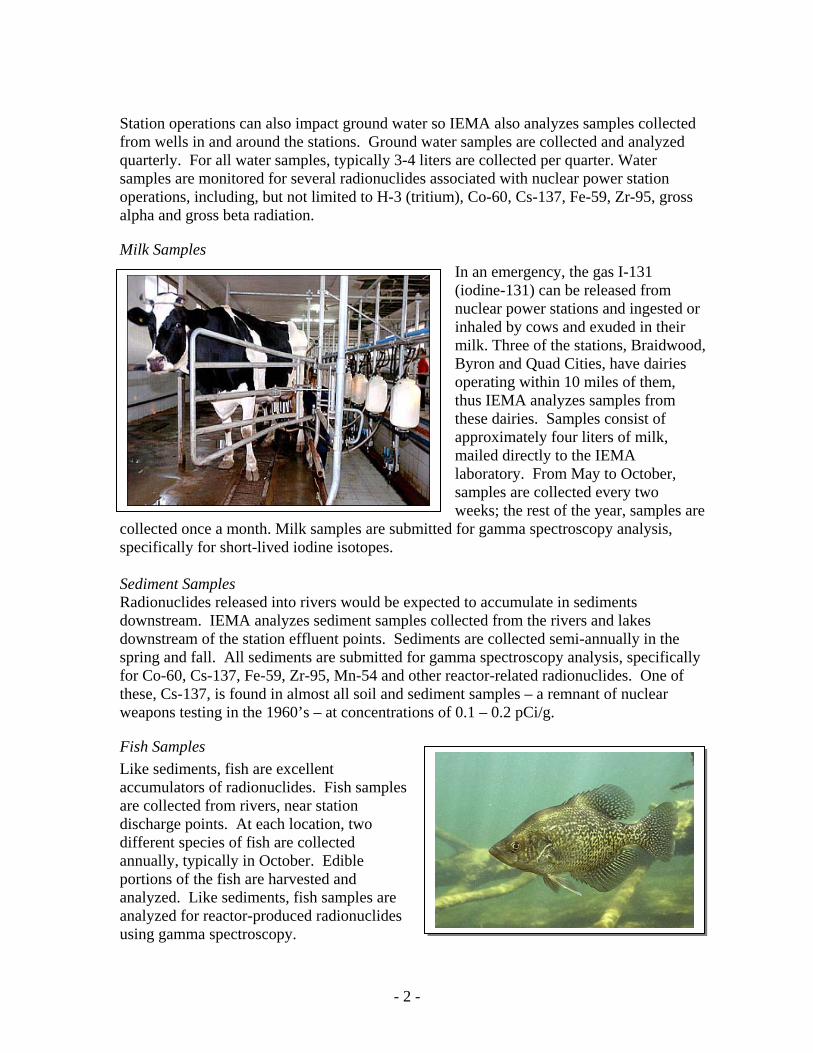
Milk Samples In an emergency, the gas I-131 (iodine-131) can be released from nuclear power stations and ingested or inhaled by cows and exuded in their milk. Three of the stations, Braidwood, Byron and Quad Cities, have dairies operating within 10 miles of them, thus IEMA analyzes samples from these dairies. Samples consist of approximately four liters of milk, mailed directly to the IEMA laboratory. From May to October, samples are collected every two weeks; the rest of the year, samples are
collected once a month. Milk samples are submitted for gamma spectroscopy analysis, specifically for short-lived iodine isotopes. Sediment Samples Radionuclides released into rivers would be expected to accumulate in sediments downstream. IEMA analyzes sediment samples collected from the rivers and lakes downstream of the station effluent points. Sediments are collected semi-annually in the spring and fall. All sediments are submitted for gamma spectroscopy analysis, specifically for Co-60, Cs-137, Fe-59, Zr-95, Mn-54 and other reactor-related radionuclides. One of these, Cs-137, is found in almost all soil and sediment samples – a remnant of nuclear weapons testing in the 1960’s – at concentrations of 0.1 – 0.2 pCi/g.
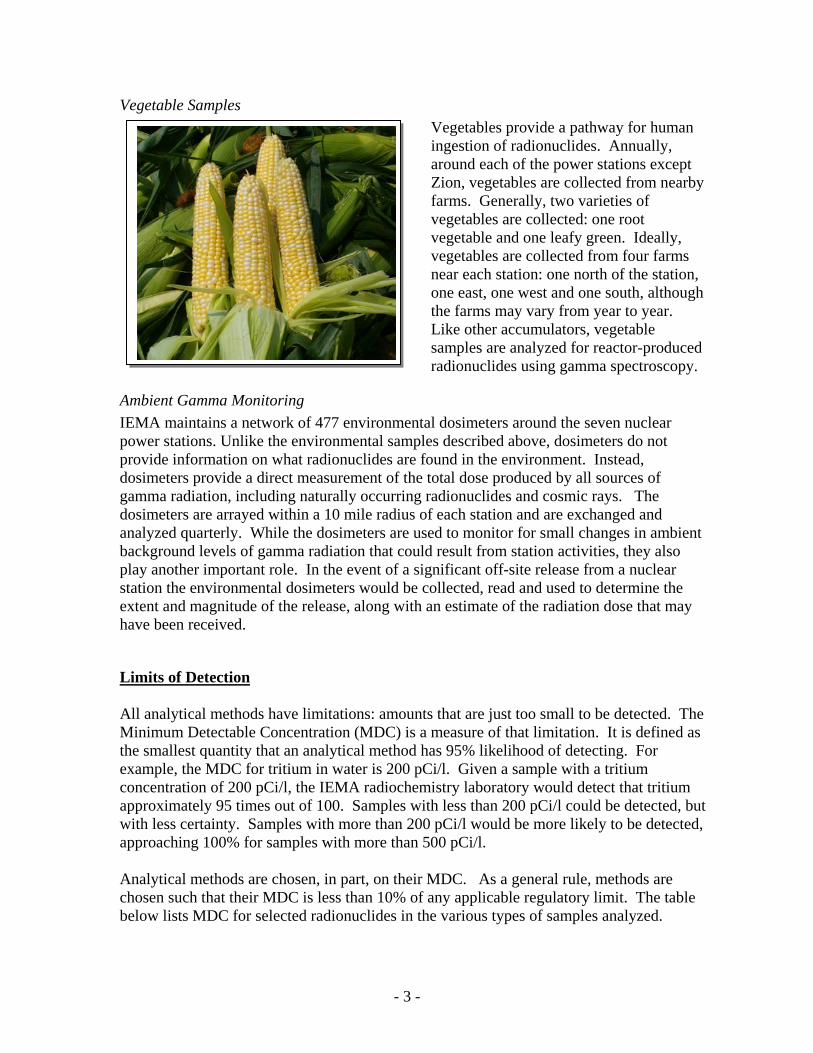
Fish Samples Like sediments, fish are excellent accumulators of radionuclides. Fish samples are collected from rivers, near station discharge points. At each location, two different species of fish are collected annually, typically in October. Edible portions of the fish are harvested and analyzed. Like sediments, fish samples are analyzed for reactor-produced radionuclides using gamma spectroscopy.
- 3 -
Vegetable Samples Vegetables provide a pathway for human ingestion of radionuclides. Annually, around each of the power stations except Zion, vegetables are collected from nearby farms. Generally, two varieties of vegetables are collected: one root vegetable and one leafy green. Ideally, vegetables are collected from four farms near each station: one north of the station, one east, one west and one south, although the farms may vary from year to year. Like other accumulators, vegetable samples are analyzed for reactor-produced radionuclides using gamma spectroscopy.
Ambient Gamma Monitoring IEMA maintains a network of 477 environmental dosimeters around the seven nuclear power stations. Unlike the environmental samples described above, dosimeters do not provide information on what radionuclides are found in the environment. Instead, dosimeters provide a direct measurement of the total dose produced by all sources of gamma radiation, including naturally occurring radionuclides and cosmic rays. The dosimeters are arrayed within a 10 mile radius of each station and are exchanged and analyzed quarterly. While the dosimeters are used to monitor for small changes in ambient background levels of gamma radiation that could result from station activities, they also play another important role. In the event of a significant off-site release from a nuclear station the environmental dosimeters would be collected, read and used to determine the extent and magnitude of the release, along with an estimate of the radiation dose that may have been received.
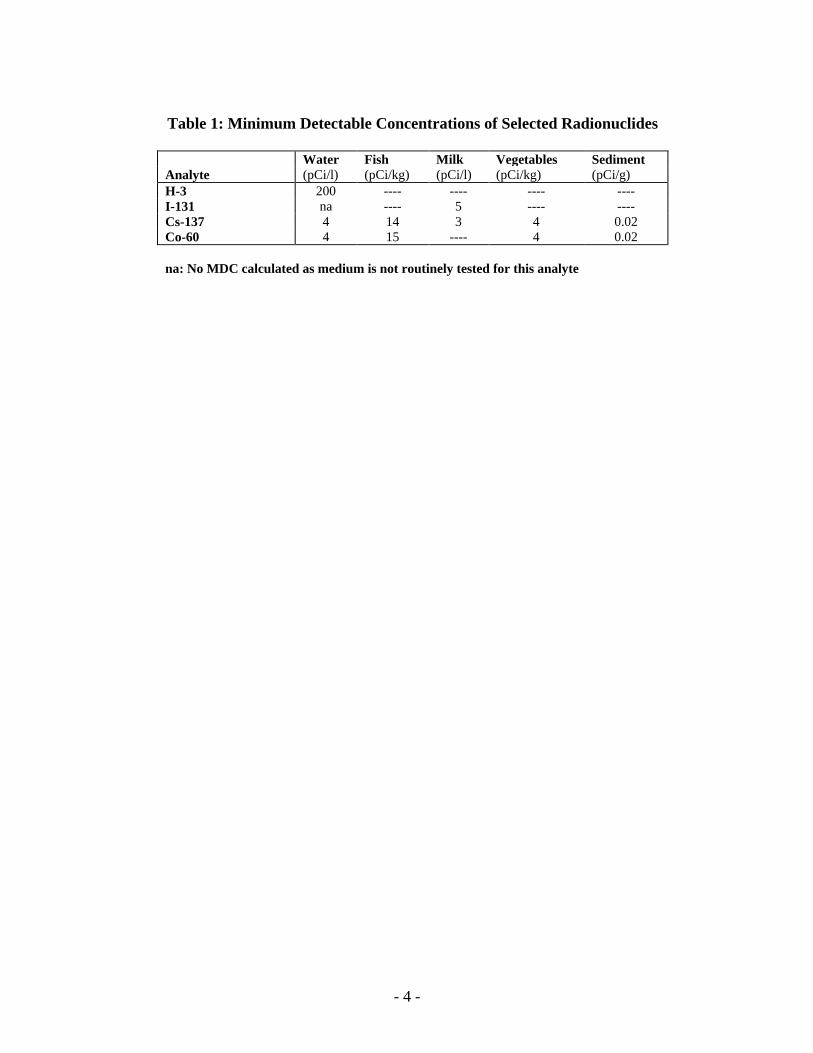
Limits of Detection All analytical methods have limitations: amounts that are just too small to be detected. The Minimum Detectable Concentration (MDC) is a measure of that limitation. It is defined as the smallest quantity that an analytical method has 95% likelihood of detecting. For example, the MDC for tritium in water is 200 pCi/l. Given a sample with a tritium concentration of 200 pCi/l, the IEMA radiochemistry laboratory would detect that tritium approximately 95 times out of 100. Samples with less than 200 pCi/l could be detected, but with less certainty. Samples with more than 200 pCi/l would be more likely to be detected, approaching 100% for samples with more than 500 pCi/l. Analytical methods are chosen, in part, on their MDC. As a general rule, methods are chosen such that their MDC is less than 10% of any applicable regulatory limit. The table below lists MDC for selected radionuclides in the various types of samples analyzed.
- 4 -
Table 1: Minimum Detectable Concentrations of Selected Radionuclides
Water Fish Milk Vegetables Sediment Analyte (pCi/l) (pCi/kg) (pCi/l) (pCi/kg) (pCi/g) H-3 200 ---- ---- ---- ---- I-131 na ---- 5 ---- ---- Cs-137 4 14 3 4 0.02 Co-60 4 15 ---- 4 0.02 na: No MDC calculated as medium is not routinely tested for this analyte
- 5 -
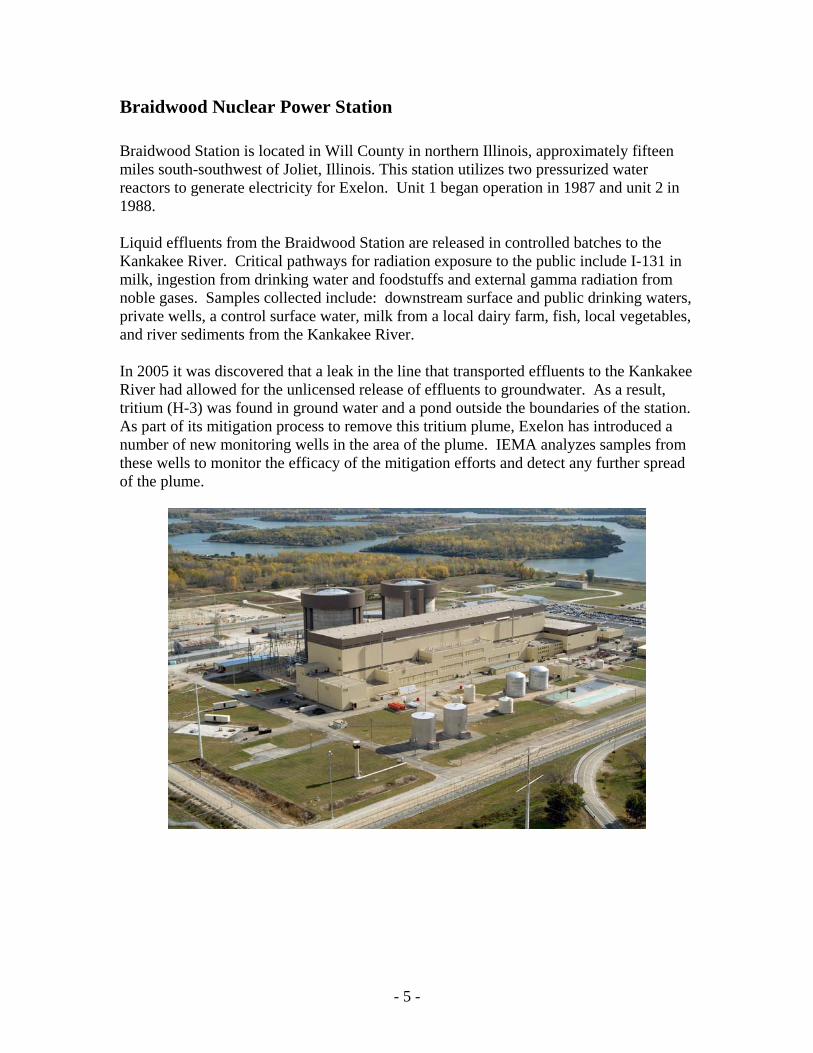
Braidwood Nuclear Power Station Braidwood Station is located in Will County in northern Illinois, approximately fifteen miles south-southwest of Joliet, Illinois. This station utilizes two pressurized water reactors to generate electricity for Exelon. Unit 1 began operation in 1987 and unit 2 in 1988. Liquid effluents from the Braidwood Station are released in controlled batches to the Kankakee River. Critical pathways for radiation exposure to the public include I-131 in milk, ingestion from drinking water and foodstuffs and external gamma radiation from noble gases. Samples collected include: downstream surface and public drinking waters, private wells, a control surface water, milk from a local dairy farm, fish, local vegetables, and river sediments from the Kankakee River. In 2005 it was discovered that a leak in the line that transported effluents to the Kankakee River had allowed for the unlicensed release of effluents to groundwater. As a result, tritium (H-3) was found in ground water and a pond outside the boundaries of the station. As part of its mitigation process to remove this tritium plume, Exelon has introduced a number of new monitoring wells in the area of the plume. IEMA analyzes samples from these wells to monitor the efficacy of the mitigation efforts and detect any further spread of the plume.
- 6 -
Water Samples
Water samples are collected from two locations in the Kankakee River, four surface water locations on-site, nine private drinking water wells, one public well and public drinking water supply that draws its water from the Kankakee River approximately six miles downstream of the effluent point. Ground water samples are collected once each quarter. Surface water samples are collected weekly and composited for quarterly analysis, with one exception. The public drinking water sample collected at the Wilmington Water Treatment station is collected by a device which draws an aliquot every 15 minutes. These aliquots are composited and collected for both weekly and quarterly analyses. For all samples, typically, 3-4 liters are collected per samples. All quarterly water samples are submitted for gross alpha, gross beta, tritium and gamma spectroscopy analyses. The weekly water samples from Wilmington are analyzed for tritium only. In 2007 IEMA began monitoring an additional thirty-four water sources in the area of the tritium plume. These include nine residential wells, a nearby pond and several monitoring wells in and around the plume. Samples from these locations are only monitored for tritium.
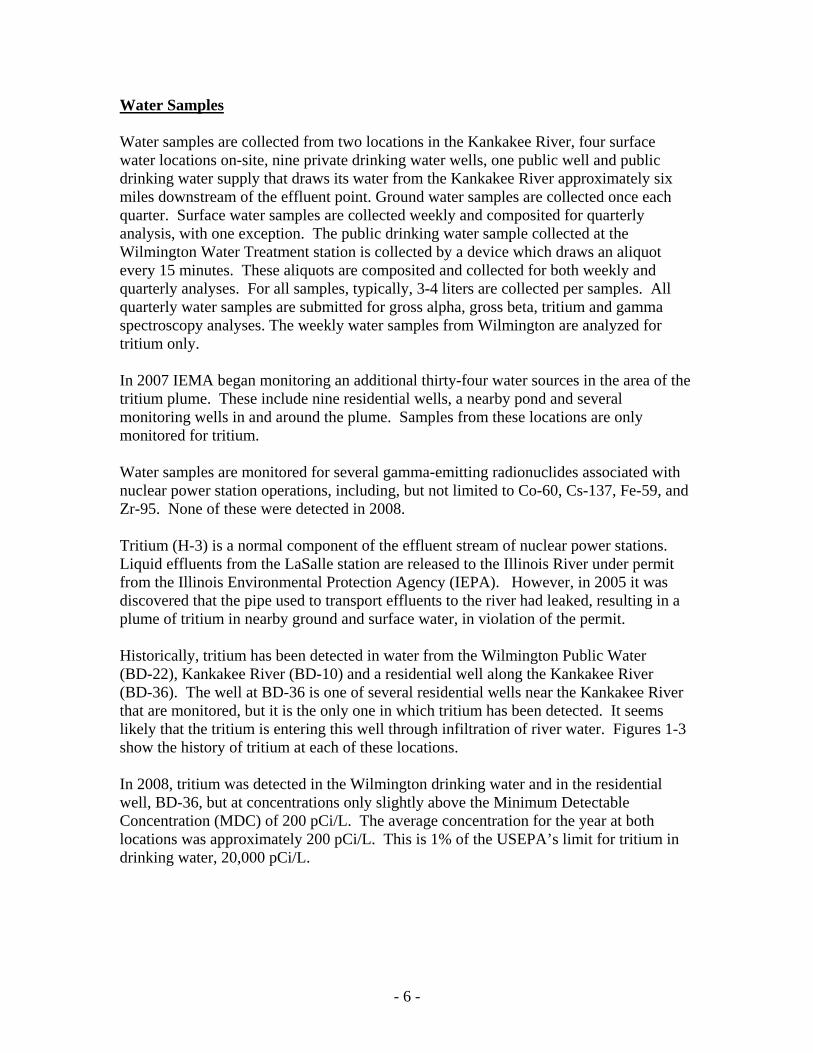
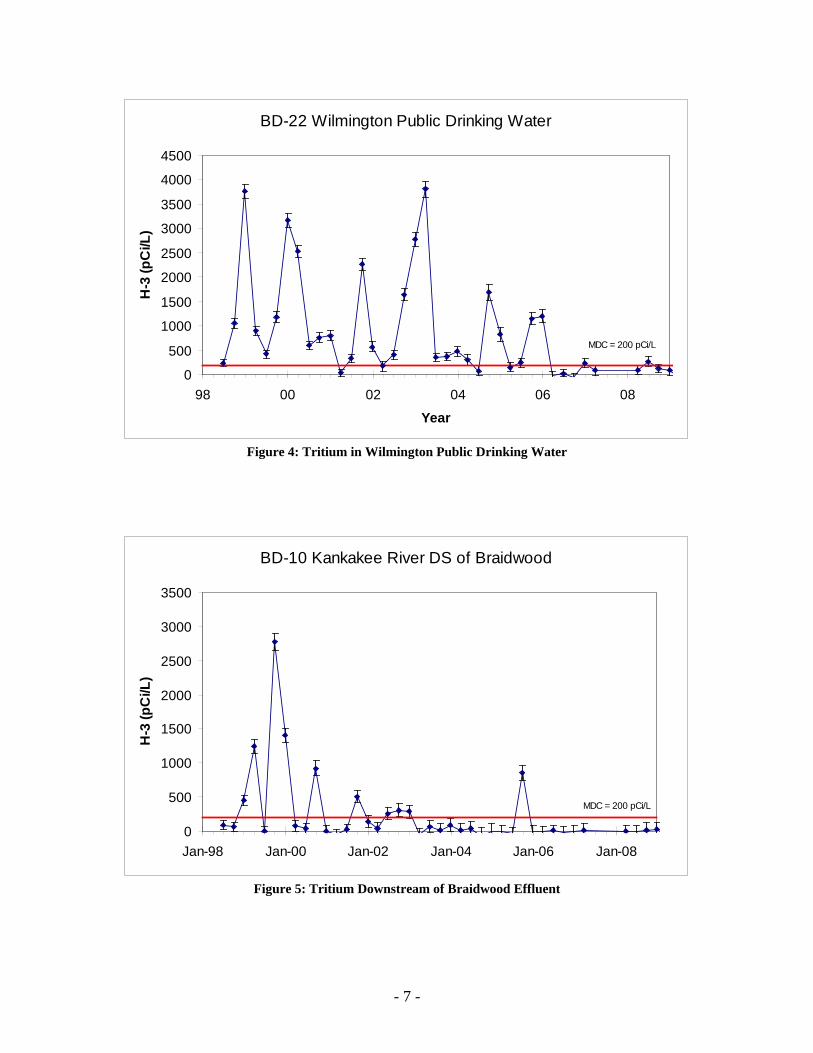
Water samples are monitored for several gamma-emitting radionuclides associated with nuclear power station operations, including, but not limited to Co-60, Cs-137, Fe-59, and Zr-95. None of these were detected in 2008. Tritium (H-3) is a normal component of the effluent stream of nuclear power stations. Liquid effluents from the LaSalle station are released to the Illinois River under permit from the Illinois Environmental Protection Agency (IEPA). However, in 2005 it was discovered that the pipe used to transport effluents to the river had leaked, resulting in a plume of tritium in nearby ground and surface water, in violation of the permit. Historically, tritium has been detected in water from the Wilmington Public Water (BD-22), Kankakee River (BD-10) and a residential well along the Kankakee River (BD-36). The well at BD-36 is one of several residential wells near the Kankakee River that are monitored, but it is the only one in which tritium has been detected. It seems likely that the tritium is entering this well through infiltration of river water. Figures 1-3 show the history of tritium at each of these locations. In 2008, tritium was detected in the Wilmington drinking water and in the residential well, BD-36, but at concentrations only slightly above the Minimum Detectable Concentration (MDC) of 200 pCi/L. The average concentration for the year at both locations was approximately 200 pCi/L. This is 1% of the USEPA’s limit for tritium in drinking water, 20,000 pCi/L.
- 7 -
BD-22 Wilmington Public Drinking Water
0
500
1000
1500
2000
2500
3000
3500
4000
4500
98 00 02 04 06 08
Year
H-3
(pC
i/L)
MDC = 200 pCi/L
Figure 4: Tritium in Wilmington Public Drinking Water
BD-10 Kankakee River DS of Braidwood
0
500
1000
1500
2000
2500
3000
3500
Jan-98 Jan-00 Jan-02 Jan-04 Jan-06 Jan-08
H-3
(pC
i/L)
MDC = 200 pCi/L
Figure 5: Tritium Downstream of Braidwood Effluent
- 8 -
BD-36 Residential Well
0
200
400
600
800
1000
1200
98 99 00 01 02 03 04 05 06 07 08
H-3
(pC
i/L)
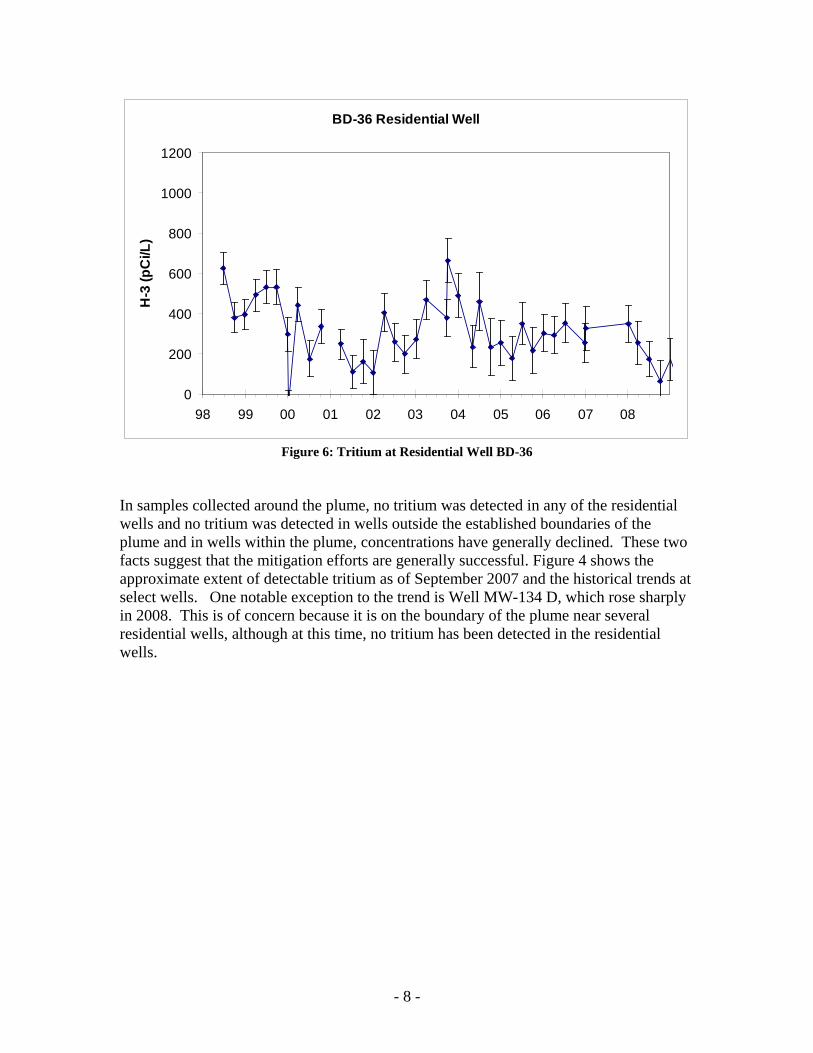
Figure 6: Tritium at Residential Well BD-36
In samples collected around the plume, no tritium was detected in any of the residential wells and no tritium was detected in wells outside the established boundaries of the plume and in wells within the plume, concentrations have generally declined. These two facts suggest that the mitigation efforts are generally successful. Figure 4 shows the approximate extent of detectable tritium as of September 2007 and the historical trends at select wells. One notable exception to the trend is Well MW-134 D, which rose sharply in 2008. This is of concern because it is on the boundary of the plume near several residential wells, although at this time, no tritium has been detected in the residential wells.
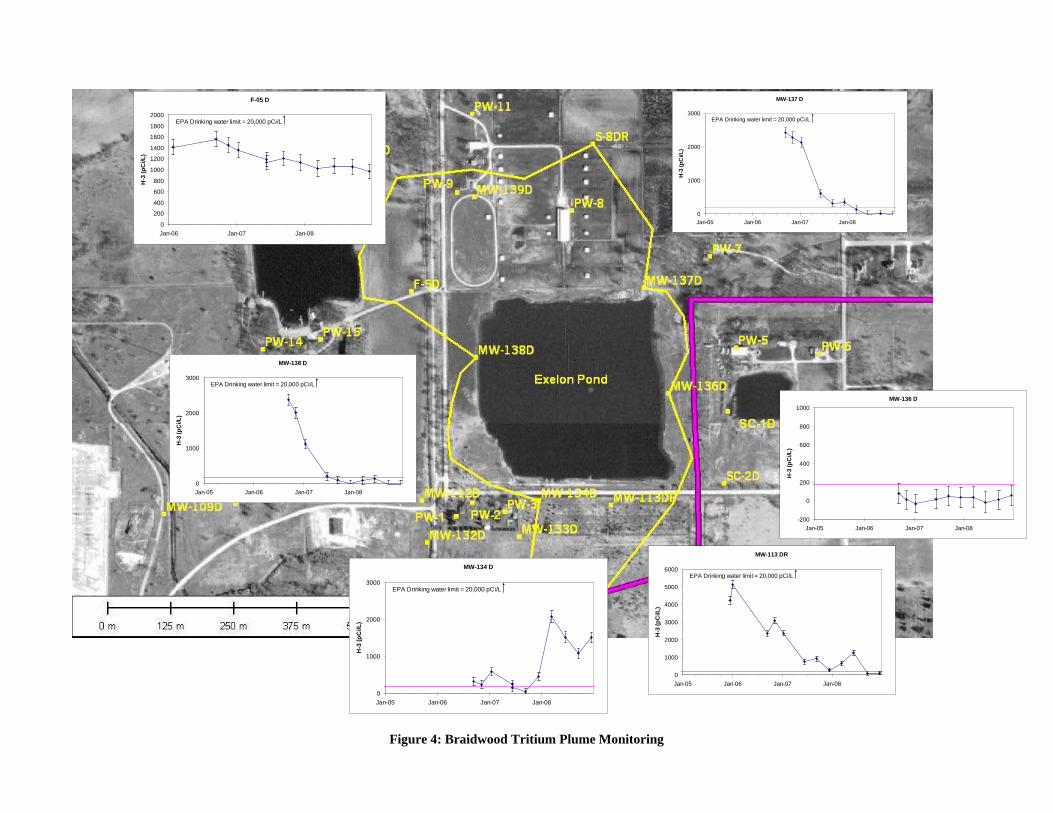
Figure 4: Braidwood Tritium Plume Monitoring
MW-138 D
0
1000
2000
3000
Jan-05 Jan-06 Jan-07 Jan-08
H-3
(pC
i/L)
EPA Drinking water limit = 20,000 pCi/L
MW-137 D
0
1000
2000
3000
Jan-05 Jan-06 Jan-07 Jan-08
H-3
(pC
i/L)
EPA Drinking water limit = 20,000 pCi/L
MW-134 D
0
1000
2000
3000
Jan-05 Jan-06 Jan-07 Jan-08
H-3
(pC
i/L)
EPA Drinking water limit = 20,000 pCi/L
MW-113 DR
0
1000
2000
3000
4000
5000
6000
Jan-05 Jan-06 Jan-07 Jan-08
H-3
(pC
i/L)
EPA Drinking water limit = 20,000 pCi/L
F-05 D
0
200
400
600
800
1000
1200
1400
1600
1800
2000
Jan-06 Jan-07 Jan-08
H-3
(pC
i/L)
EPA Drinking water limit = 20,000 pCi/L
MW-136 D
-200
0
200
400
600
800
1000
Jan-05 Jan-06 Jan-07 Jan-08
H-3
(pC
i/L)
- 10 -
Milk Samples
Milk samples are collected from two nearby dairies. Each month, approximately four liters of milk are collected and are mailed directly to the IEMA laboratory. Milk samples are mailed directly to the IEMA laboratory and analyzed within five days of sampling by gamma spectroscopy, specifically for short-lived iodine isotopes.
No radionuclides associated with nuclear power station operations were detected in milk samples. Only naturally occurring K-40 was detected, within the range typical of established background (1200 to 1500 pCi/L).
Sediment Samples Sediment samples are collected from the rivers downstream of the station effluent points. Sediments are collected annually in October. All sediments are submitted for gamma spectroscopy analysis. Sediment samples are monitored for several radionuclides associated with nuclear power station operations: Co-58, Co-60, Cs-134, Cs-137, and Mn-54. Cs-137, a remnant of atmospheric nuclear weapons testing, is present in most sediment and soil at concentrations of 0.1 – 0.2 pCi/g. In 2008, Cs-137 was detected in sediment from BD-57 at concentrations too small to quantify (< 0.1 pCi/g). No radionuclides associated with nuclear power station operations were detected in samples collected near Braidwood. Other radionuclides detected were naturally occurring. Fish samples Like sediments, fish are collected from rivers, near the station discharge point. At each location, two different species of fish are collected annually, typically in October. Edible portions of the fish are harvested by technicians at Midwest Incorporated Laboratory and prepared for analysis. Splits of the samples are provided to the IEMA laboratory. Fish samples are analyzed for reactor-produced radionuclides using gamma spectroscopy.
No radionuclides associated with nuclear power station operations were detected in fish samples. Only naturally occurring K-40 was detected, at concentrations typical of background (3 – 5 pCi/g). Vegetable samples Like fish, two varieties of vegetables are collected annually, generally one root vegetable and one leafy green. Ideally, vegetables are collected from four farms: one in each quadrant (north, east, south, and west) from the station, although the availability of farms may vary from year to year. In 2008, only one farm was available, in quadrant 4, west of
- 11 -
the station. Vegetable samples are analyzed for reactor-produced radionuclides using gamma spectroscopy.
No radionuclides associated with nuclear power station operations were detected in vegetable samples. Only naturally occurring K-40 was detected. Concentrations vary too widely between varieties for meaningful comparisons. Ambient Gamma
IEMA maintains a network of 145 environmental dosimeters in a ten-mile radius around the Braidwood and Dresden stations. Because of the proximity of the two stations, the network includes dosimeters that fall within the ten-mile monitoring radius of both stations. Unlike the environmental samples described above, dosimeters do not provide information on what radionuclides are found in the environment. Instead, dosimeters provide a direct measurement of the total dose produced by all sources of gamma radiation, including naturally occurring radionuclides and cosmic rays. Dosimeters are exchanged and analyzed quarterly.
In 2008, measurements at all 145 locations were consistent with established background measurements.
- 12 -
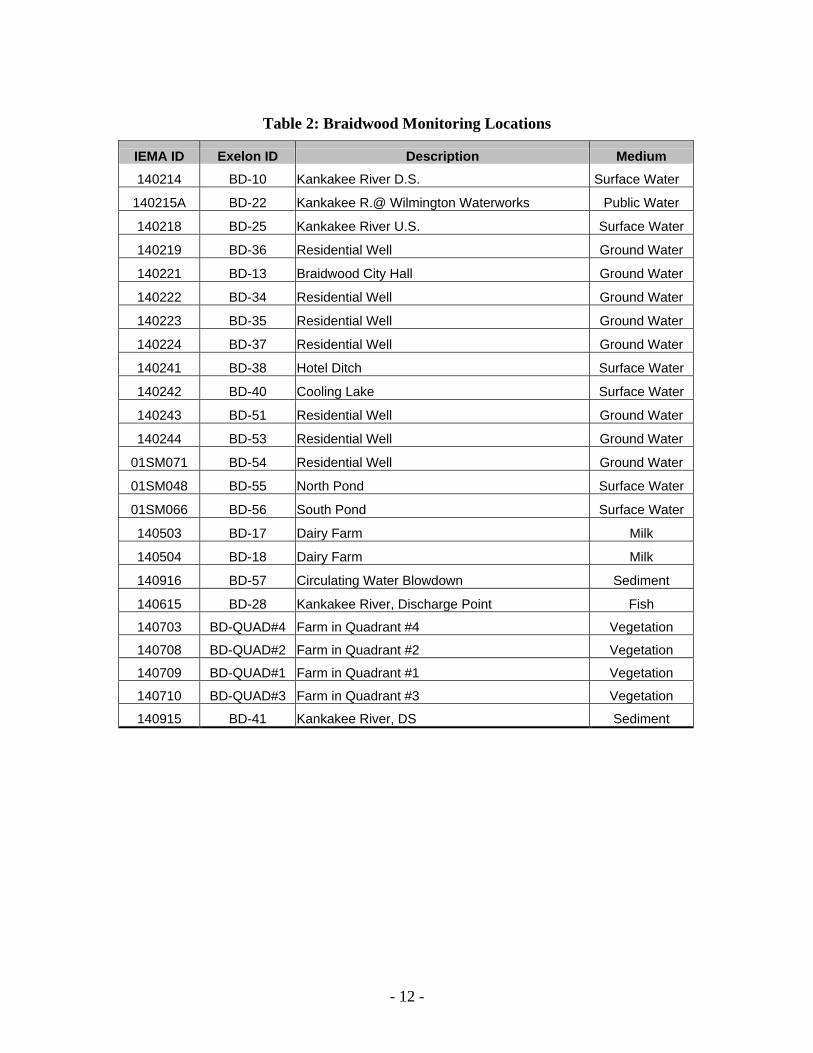
Table 2: Braidwood Monitoring Locations
IEMA ID Exelon ID Description Medium 140214 BD-10 Kankakee River D.S. Surface Water
140215A BD-22 Kankakee R.@ Wilmington Waterworks Public Water
140218 BD-25 Kankakee River U.S. Surface Water
140219 BD-36 Residential Well Ground Water
140221 BD-13 Braidwood City Hall Ground Water
140222 BD-34 Residential Well Ground Water
140223 BD-35 Residential Well Ground Water
140224 BD-37 Residential Well Ground Water
140241 BD-38 Hotel Ditch Surface Water
140242 BD-40 Cooling Lake Surface Water
140243 BD-51 Residential Well Ground Water
140244 BD-53 Residential Well Ground Water
01SM071 BD-54 Residential Well Ground Water
01SM048 BD-55 North Pond Surface Water
01SM066 BD-56 South Pond Surface Water
140503 BD-17 Dairy Farm Milk
140504 BD-18 Dairy Farm Milk
140916 BD-57 Circulating Water Blowdown Sediment
140615 BD-28 Kankakee River, Discharge Point Fish
140703 BD-QUAD#4 Farm in Quadrant #4 Vegetation
140708 BD-QUAD#2 Farm in Quadrant #2 Vegetation
140709 BD-QUAD#1 Farm in Quadrant #1 Vegetation
140710 BD-QUAD#3 Farm in Quadrant #3 Vegetation
140915 BD-41 Kankakee River, DS Sediment
- 13 -
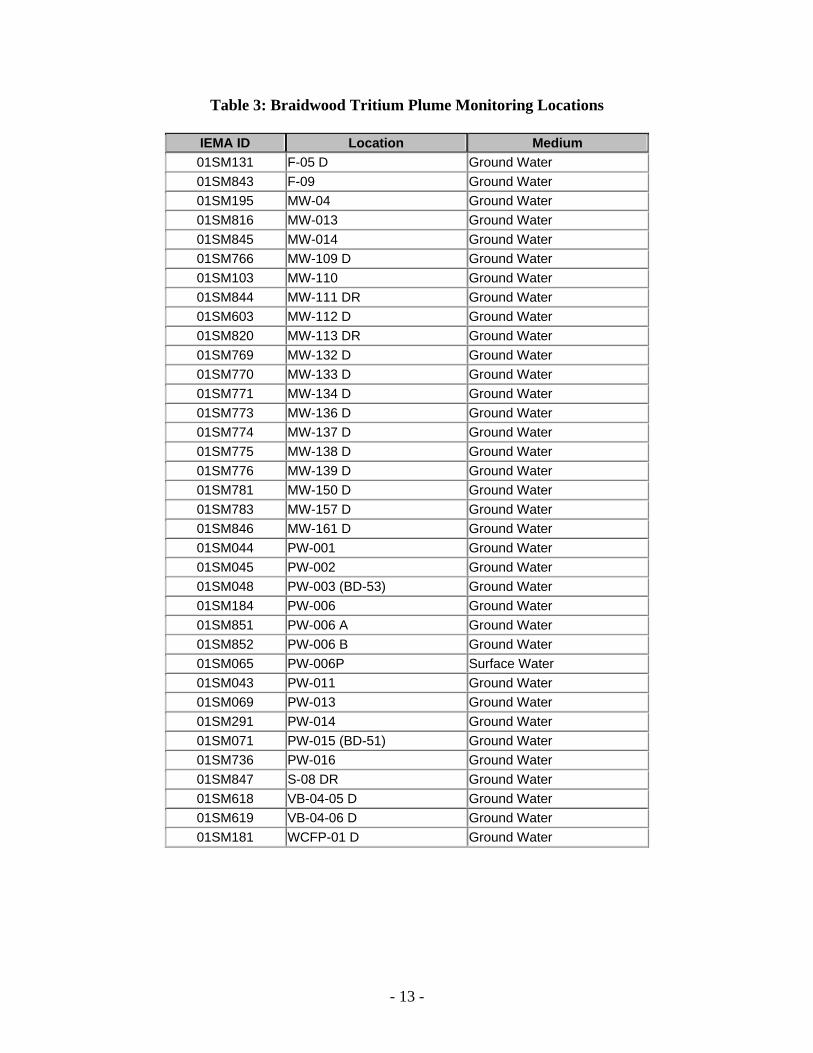
Table 3: Braidwood Tritium Plume Monitoring Locations
IEMA ID Location Medium 01SM131 F-05 D Ground Water 01SM843 F-09 Ground Water 01SM195 MW-04 Ground Water 01SM816 MW-013 Ground Water 01SM845 MW-014 Ground Water 01SM766 MW-109 D Ground Water 01SM103 MW-110 Ground Water 01SM844 MW-111 DR Ground Water 01SM603 MW-112 D Ground Water 01SM820 MW-113 DR Ground Water 01SM769 MW-132 D Ground Water 01SM770 MW-133 D Ground Water 01SM771 MW-134 D Ground Water 01SM773 MW-136 D Ground Water 01SM774 MW-137 D Ground Water 01SM775 MW-138 D Ground Water 01SM776 MW-139 D Ground Water 01SM781 MW-150 D Ground Water 01SM783 MW-157 D Ground Water 01SM846 MW-161 D Ground Water 01SM044 PW-001 Ground Water 01SM045 PW-002 Ground Water 01SM048 PW-003 (BD-53) Ground Water 01SM184 PW-006 Ground Water 01SM851 PW-006 A Ground Water 01SM852 PW-006 B Ground Water 01SM065 PW-006P Surface Water 01SM043 PW-011 Ground Water 01SM069 PW-013 Ground Water 01SM291 PW-014 Ground Water 01SM071 PW-015 (BD-51) Ground Water 01SM736 PW-016 Ground Water 01SM847 S-08 DR Ground Water 01SM618 VB-04-05 D Ground Water 01SM619 VB-04-06 D Ground Water 01SM181 WCFP-01 D Ground Water
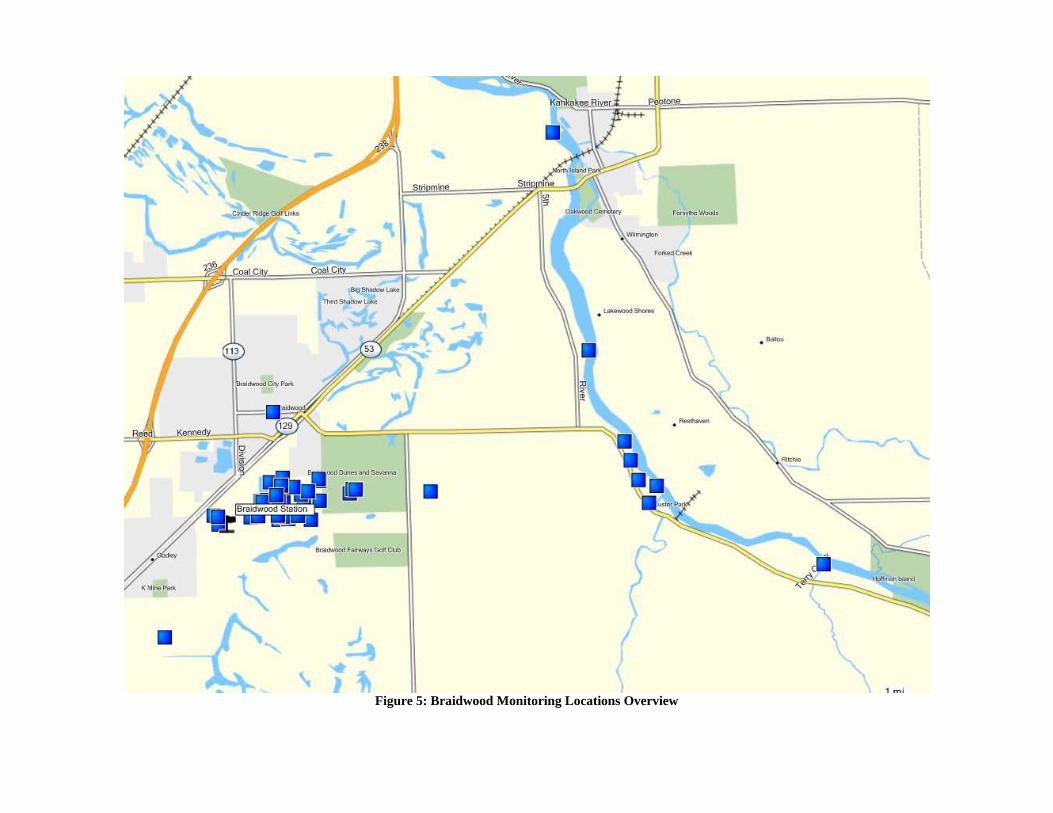
Figure 5: Braidwood Monitoring Locations Overview
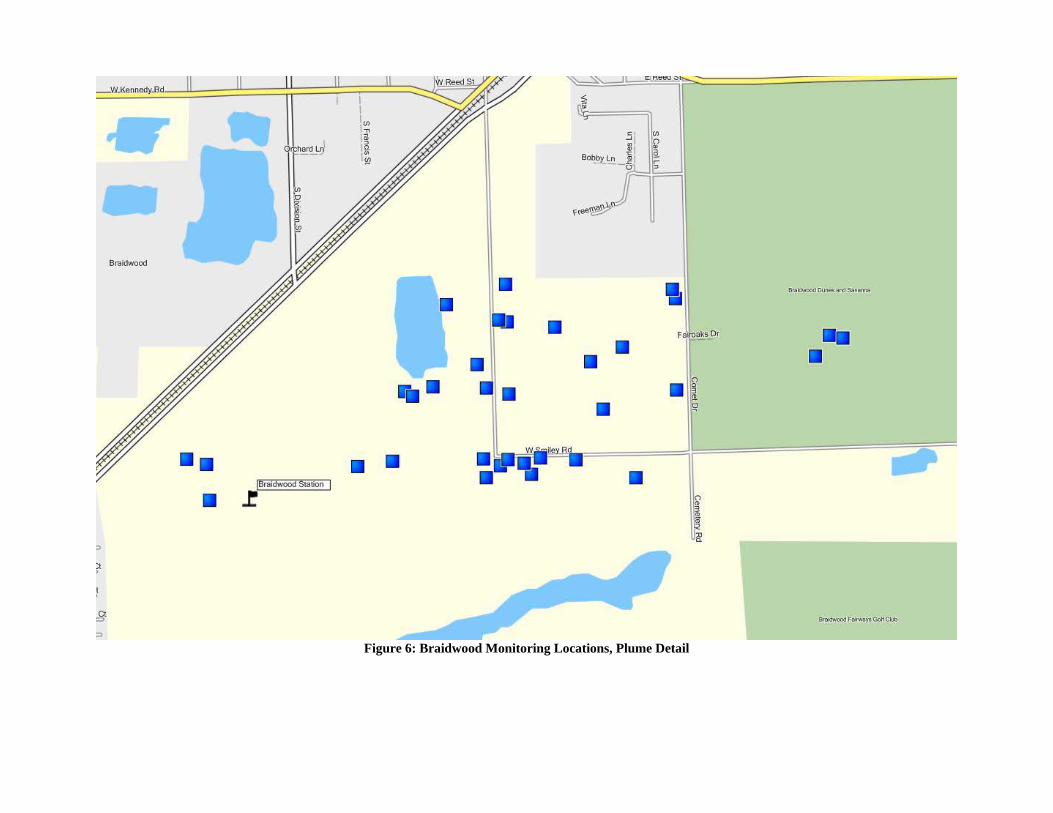
Figure 6: Braidwood Monitoring Locations, Plume Detail
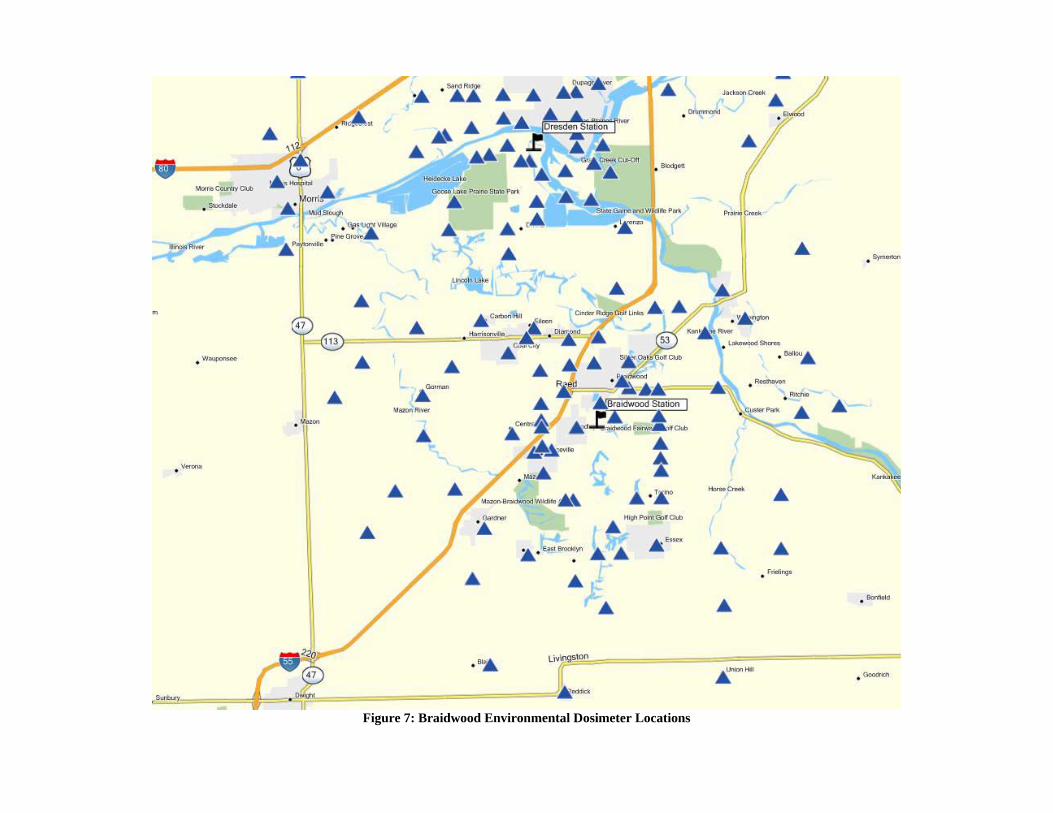
Figure 7: Braidwood Environmental Dosimeter Locations
- 17 -
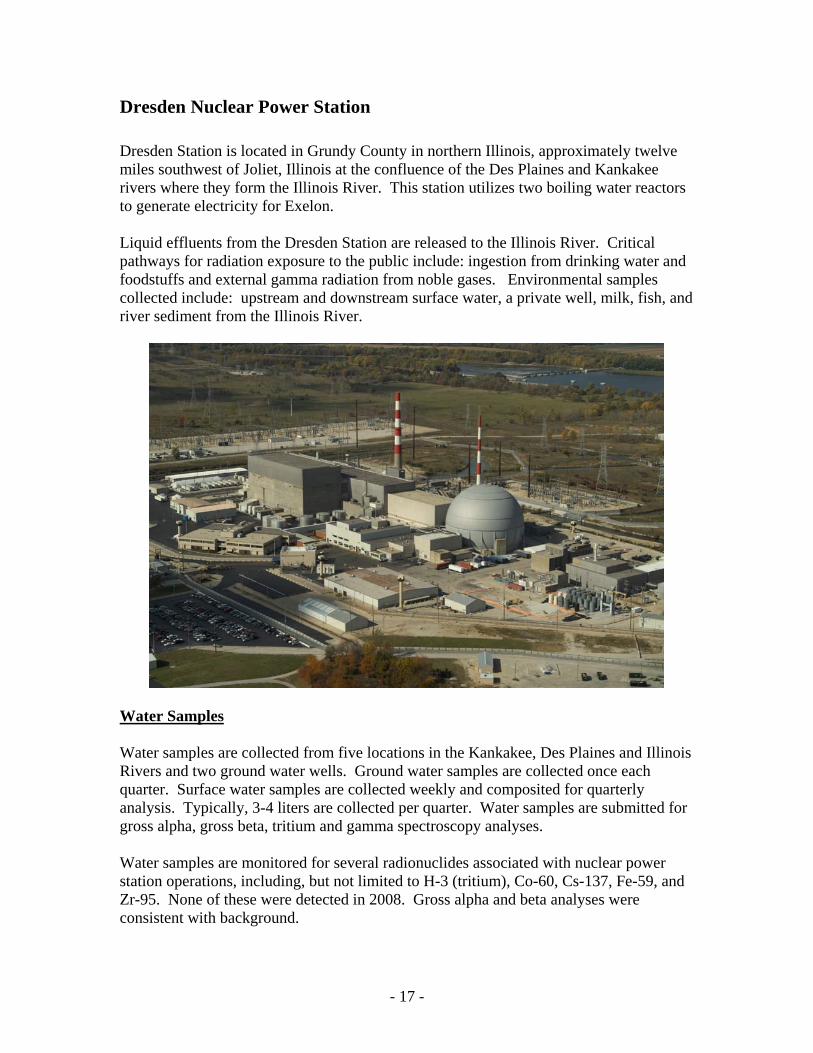
Dresden Nuclear Power Station Dresden Station is located in Grundy County in northern Illinois, approximately twelve miles southwest of Joliet, Illinois at the confluence of the Des Plaines and Kankakee rivers where they form the Illinois River. This station utilizes two boiling water reactors to generate electricity for Exelon. Liquid effluents from the Dresden Station are released to the Illinois River. Critical pathways for radiation exposure to the public include: ingestion from drinking water and foodstuffs and external gamma radiation from noble gases. Environmental samples collected include: upstream and downstream surface water, a private well, milk, fish, and river sediment from the Illinois River.
Water Samples
Water samples are collected from five locations in the Kankakee, Des Plaines and Illinois Rivers and two ground water wells. Ground water samples are collected once each quarter. Surface water samples are collected weekly and composited for quarterly analysis. Typically, 3-4 liters are collected per quarter. Water samples are submitted for gross alpha, gross beta, tritium and gamma spectroscopy analyses. Water samples are monitored for several radionuclides associated with nuclear power station operations, including, but not limited to H-3 (tritium), Co-60, Cs-137, Fe-59, and Zr-95. None of these were detected in 2008. Gross alpha and beta analyses were consistent with background.
- 18 -
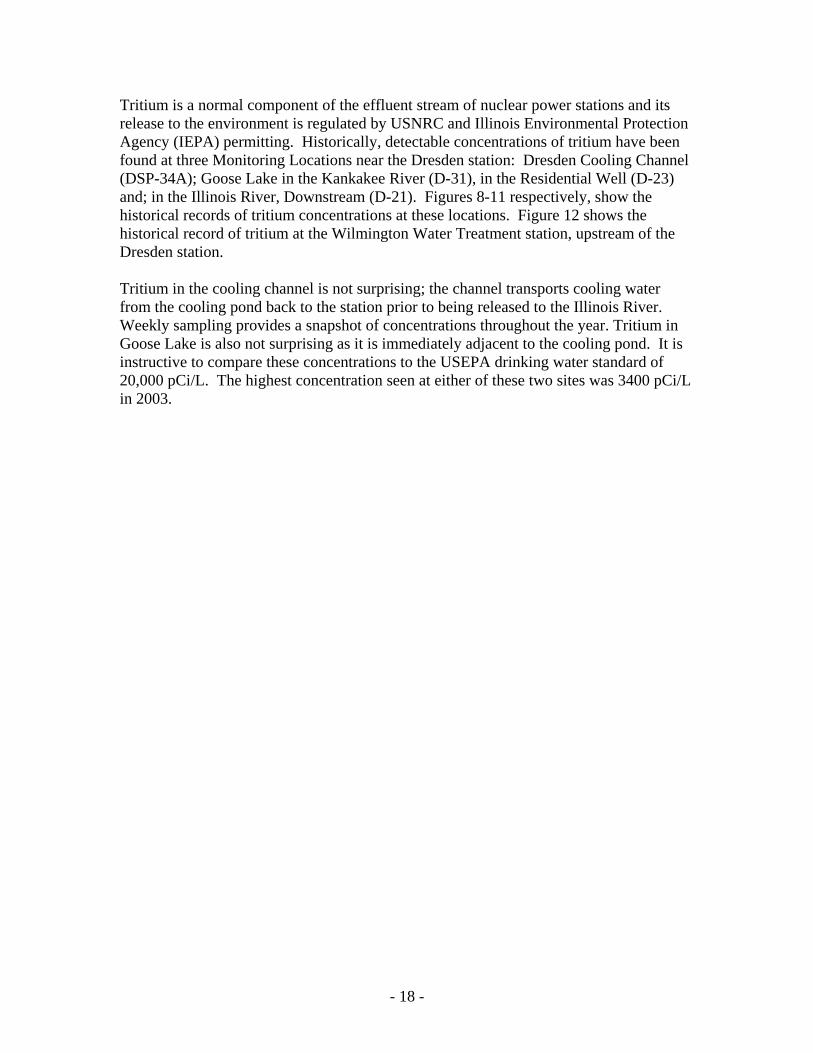
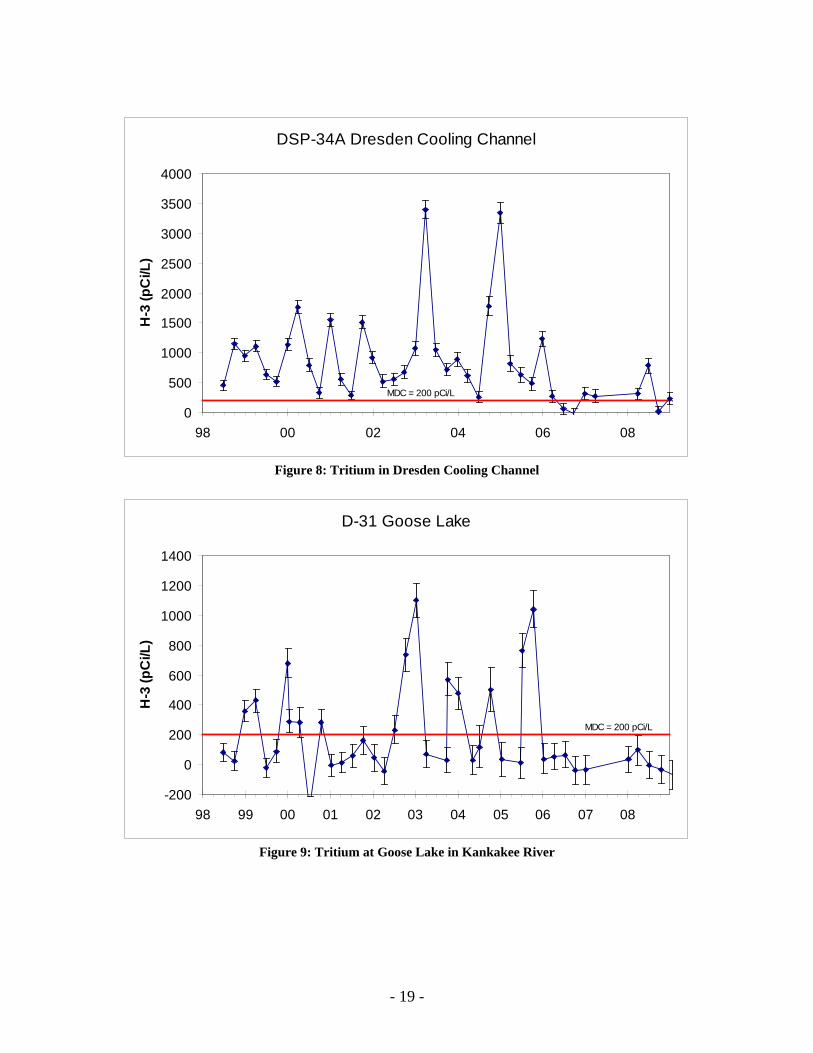
Tritium is a normal component of the effluent stream of nuclear power stations and its release to the environment is regulated by USNRC and Illinois Environmental Protection Agency (IEPA) permitting. Historically, detectable concentrations of tritium have been found at three Monitoring Locations near the Dresden station: Dresden Cooling Channel (DSP-34A); Goose Lake in the Kankakee River (D-31), in the Residential Well (D-23) and; in the Illinois River, Downstream (D-21). Figures 8-11 respectively, show the historical records of tritium concentrations at these locations. Figure 12 shows the historical record of tritium at the Wilmington Water Treatment station, upstream of the Dresden station. Tritium in the cooling channel is not surprising; the channel transports cooling water from the cooling pond back to the station prior to being released to the Illinois River. Weekly sampling provides a snapshot of concentrations throughout the year. Tritium in Goose Lake is also not surprising as it is immediately adjacent to the cooling pond. It is instructive to compare these concentrations to the USEPA drinking water standard of 20,000 pCi/L. The highest concentration seen at either of these two sites was 3400 pCi/L in 2003.
- 19 -
DSP-34A Dresden Cooling Channel
0
500
1000
1500
2000
2500
3000
3500
4000
98 00 02 04 06 08
H-3
(pC
i/L)
MDC = 200 pCi/L
Figure 8: Tritium in Dresden Cooling Channel
D-31 Goose Lake
-200
0
200
400
600
800
1000
1200
1400
98 99 00 01 02 03 04 05 06 07 08
H-3
(pC
i/L)
MDC = 200 pCi/L
Figure 9: Tritium at Goose Lake in Kankakee River
- 20 -
D-23 Residential Well
0
100
200
300
400
500
600
700
800
900
1000
98 99 00 01 02 03 04 05 06 07 08
H-3
(pC
i/L)
MDC = 200 pCi/L
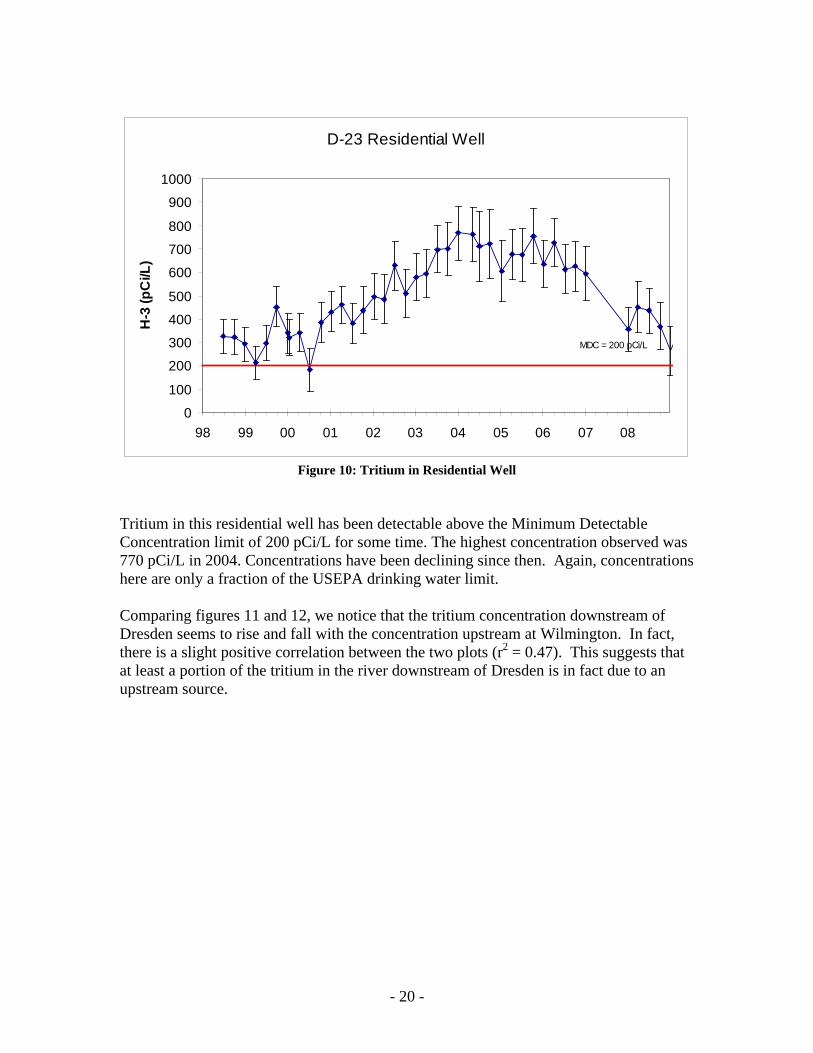
Figure 10: Tritium in Residential Well
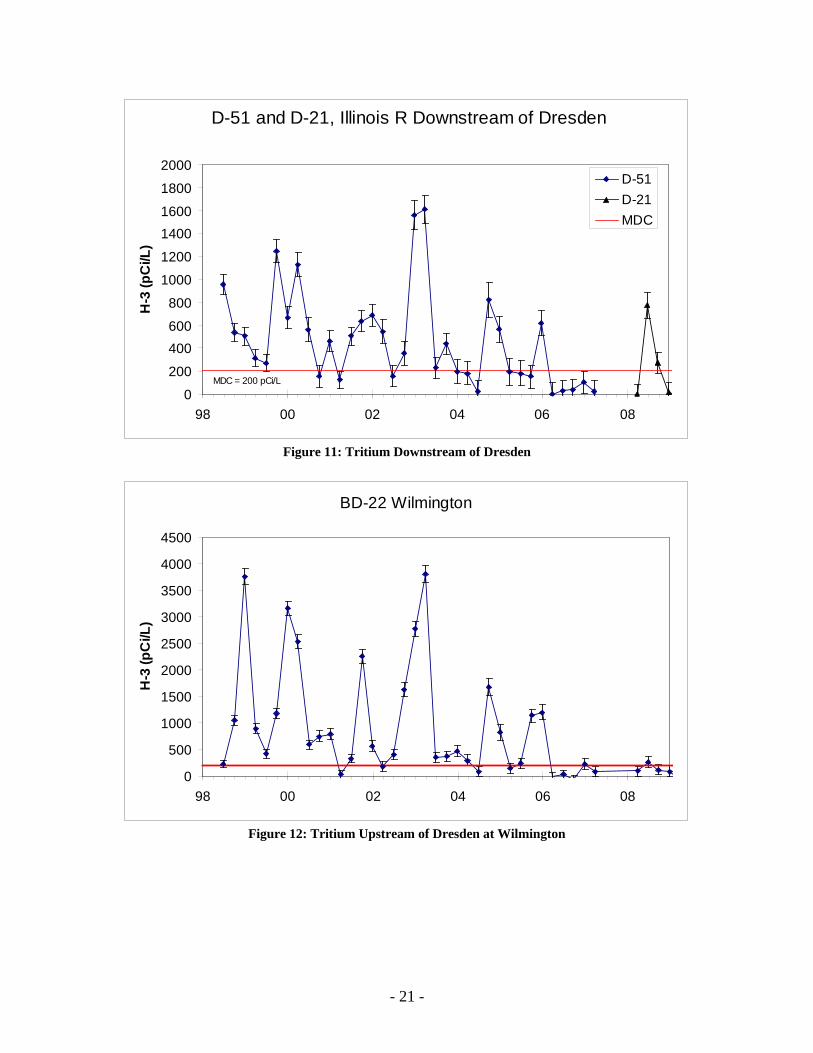
Tritium in this residential well has been detectable above the Minimum Detectable Concentration limit of 200 pCi/L for some time. The highest concentration observed was 770 pCi/L in 2004. Concentrations have been declining since then. Again, concentrations here are only a fraction of the USEPA drinking water limit. Comparing figures 11 and 12, we notice that the tritium concentration downstream of Dresden seems to rise and fall with the concentration upstream at Wilmington. In fact, there is a slight positive correlation between the two plots (r2 = 0.47). This suggests that at least a portion of the tritium in the river downstream of Dresden is in fact due to an upstream source.
- 21 -
D-51 and D-21, Illinois R Downstream of Dresden
0
200
400600
800
1000
1200
14001600
1800
2000
98 00 02 04 06 08
H-3
(pC
i/L)
D-51D-21MDC
MDC = 200 pCi/L
Figure 11: Tritium Downstream of Dresden
BD-22 Wilmington
0
500
1000
1500
2000
2500
3000
3500
4000
4500
98 00 02 04 06 08
H-3
(pC
i/L)
Figure 12: Tritium Upstream of Dresden at Wilmington
- 22 -
Milk Samples
No dairy falls inside the ten-mile EPZ. In the event that milk samples were collected, the sample collected at BD-18 would provide a control sample. Sediment Samples Sediment samples are collected from the Illinois River downstream of the station effluent point. Sediments are collected semi-annually in May and October. All sediments are submitted for gamma spectroscopy analysis. Sediment samples are monitored for several radionuclides associated with nuclear power station operations: Co-58, Co-60, Cs-134, Cs-137, and Mn-54. Cs-137, a remnant of atmospheric nuclear weapons testing, is present in most sediment and soil at concentrations of 0.1 – 0.2 pCi/g. In 2008, Cs-137 was detected in sediment from D-27, Illinois River at Dresden Lock & Dam, at 0.1 pCi/g. As stated above, this is typical of background. No radionuclides attributable to nuclear power station operations were detected in samples collected near Dresden. Other radionuclides detected were naturally occurring. Fish samples Like sediments, fish are collected from the Illinois River, near the station discharge point. Two different species of fish are collected annually. Edible portions of the fish are harvested by technicians at Midwest Incorporated Laboratory and prepared for analysis. Splits of the samples are provided to the IEMA laboratory. Fish samples are analyzed for reactor-produced radionuclides using gamma spectroscopy.
No radionuclides associated with nuclear power station operations were detected in fish samples. Only naturally occurring K-40 was detected, at concentrations typical of background (3 – 5 pCi/g). Vegetable samples Two varieties of vegetables are collected annually, generally one root vegetable and one leafy green. Ideally, vegetables are collected from four farms: one in each quadrant (north, east, south, and west) from the station, although the availability of farms may vary from year to year. In 2008, samples were collected from two quadrants, south and west of the station. Vegetable samples are analyzed for reactor-produced radionuclides using gamma spectroscopy.
No radionuclides associated with nuclear power station operations were detected in vegetable samples. Only naturally occurring K-40 was detected. Concentrations vary too widely between varieties for meaningful comparisons.
- 23 -
Ambient Gamma
IEMA maintains a network of 145 environmental dosimeters in a ten-mile radius around the Braidwood and Dresden stations. Because of the proximity of the two stations, the network includes dosimeters that fall within the ten-mile monitoring radius of both stations. Unlike the environmental samples described above, dosimeters do not provide information on what radionuclides are found in the environment. Instead, dosimeters provide a direct measurement of the total dose produced by all sources of gamma radiation, including naturally occurring radionuclides and cosmic rays. Dosimeters are exchanged and analyzed quarterly.
In 2008, measurements at all 145 locations were consistent with established background measurements.
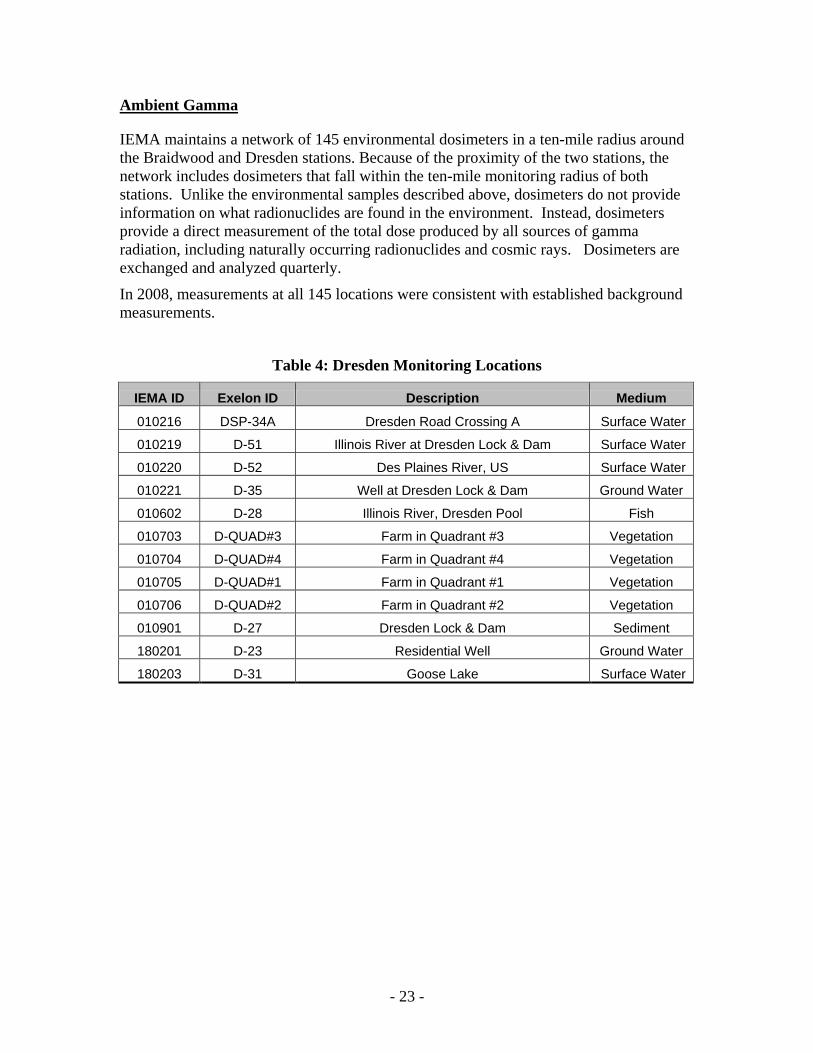
Table 4: Dresden Monitoring Locations
IEMA ID Exelon ID Description Medium
010216 DSP-34A Dresden Road Crossing A Surface Water
010219 D-51 Illinois River at Dresden Lock & Dam Surface Water
010220 D-52 Des Plaines River, US Surface Water
010221 D-35 Well at Dresden Lock & Dam Ground Water
010602 D-28 Illinois River, Dresden Pool Fish
010703 D-QUAD#3 Farm in Quadrant #3 Vegetation
010704 D-QUAD#4 Farm in Quadrant #4 Vegetation
010705 D-QUAD#1 Farm in Quadrant #1 Vegetation
010706 D-QUAD#2 Farm in Quadrant #2 Vegetation
010901 D-27 Dresden Lock & Dam Sediment
180201 D-23 Residential Well Ground Water
180203 D-31 Goose Lake Surface Water
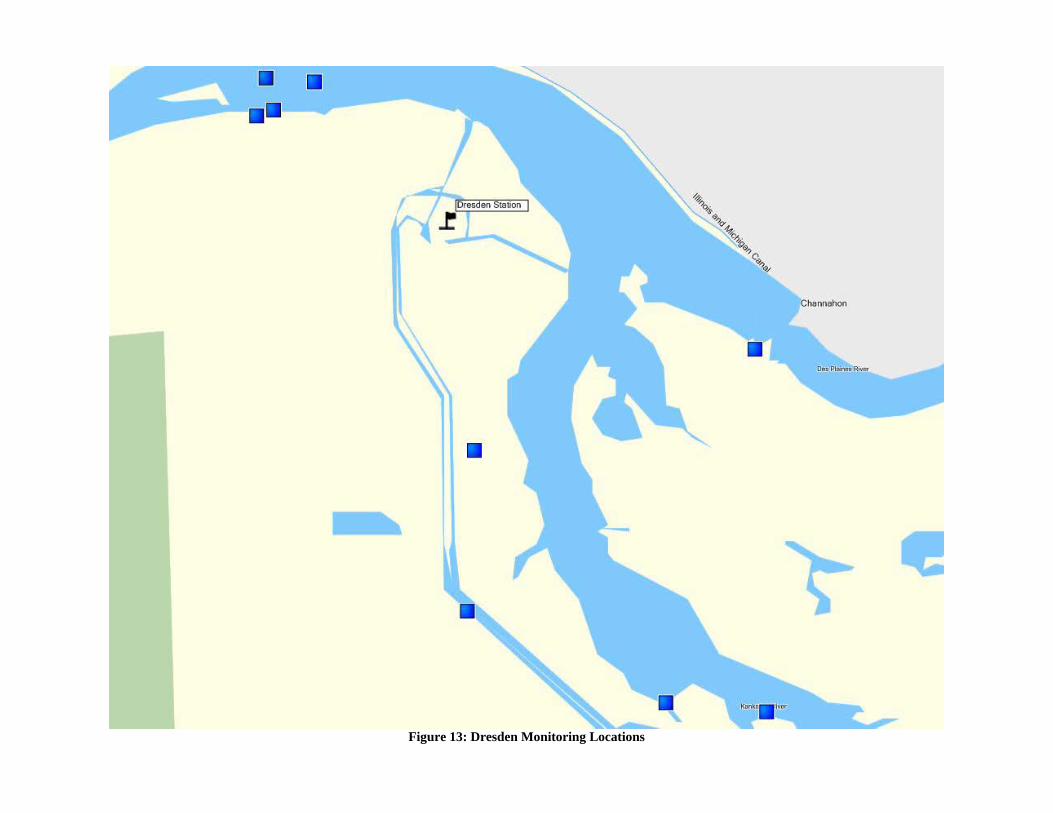
Figure 13: Dresden Monitoring Locations
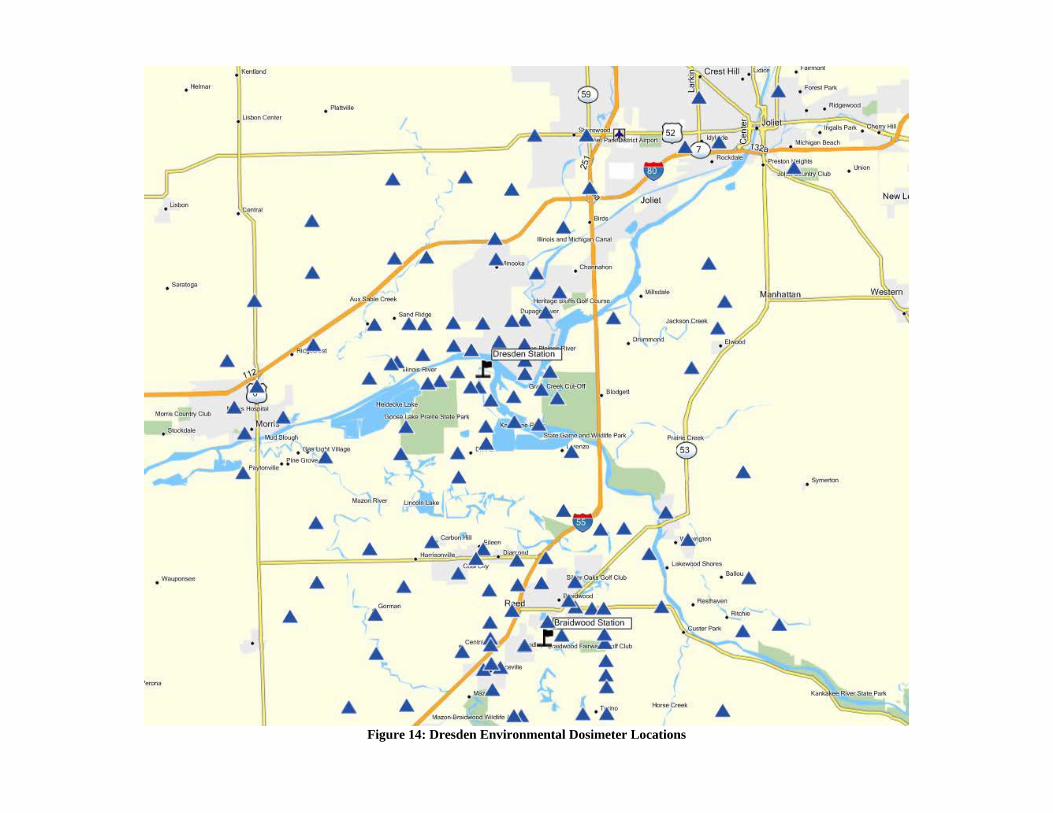
Figure 14: Dresden Environmental Dosimeter Locations
- 26 -
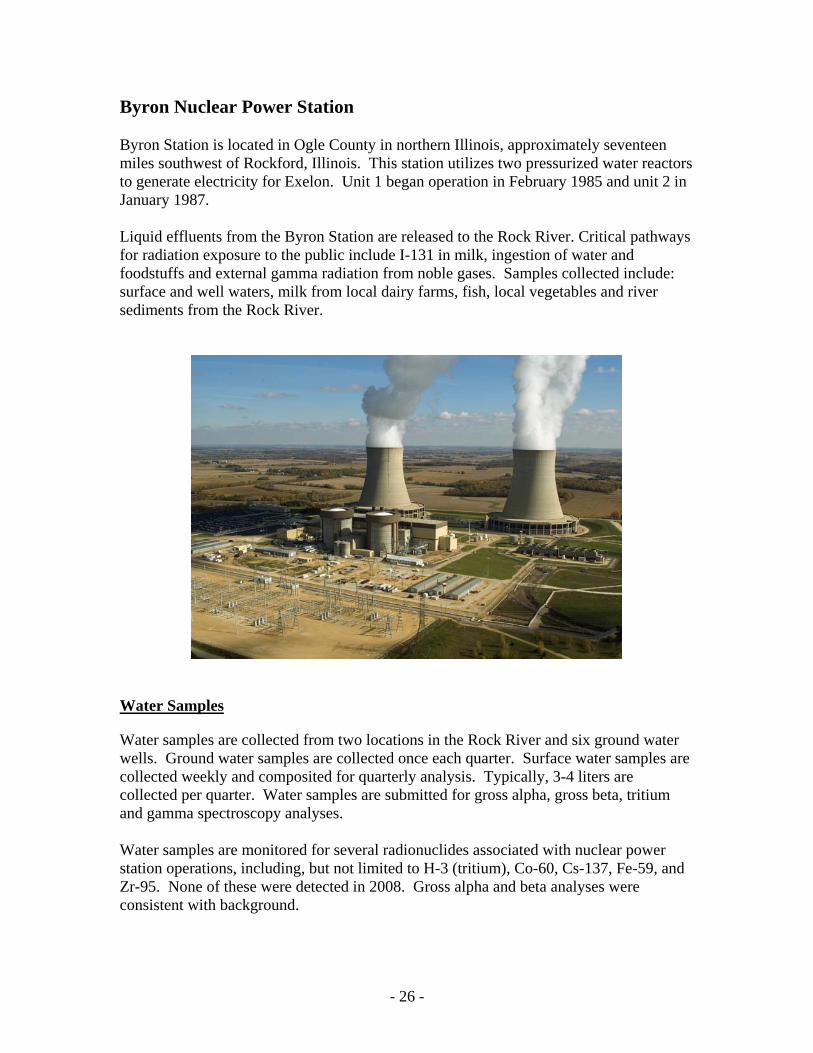
Byron Nuclear Power Station Byron Station is located in Ogle County in northern Illinois, approximately seventeen miles southwest of Rockford, Illinois. This station utilizes two pressurized water reactors to generate electricity for Exelon. Unit 1 began operation in February 1985 and unit 2 in January 1987. Liquid effluents from the Byron Station are released to the Rock River. Critical pathways for radiation exposure to the public include I-131 in milk, ingestion of water and foodstuffs and external gamma radiation from noble gases. Samples collected include: surface and well waters, milk from local dairy farms, fish, local vegetables and river sediments from the Rock River.
Water Samples
Water samples are collected from two locations in the Rock River and six ground water wells. Ground water samples are collected once each quarter. Surface water samples are collected weekly and composited for quarterly analysis. Typically, 3-4 liters are collected per quarter. Water samples are submitted for gross alpha, gross beta, tritium and gamma spectroscopy analyses.
Water samples are monitored for several radionuclides associated with nuclear power station operations, including, but not limited to H-3 (tritium), Co-60, Cs-137, Fe-59, and Zr-95. None of these were detected in 2008. Gross alpha and beta analyses were consistent with background.
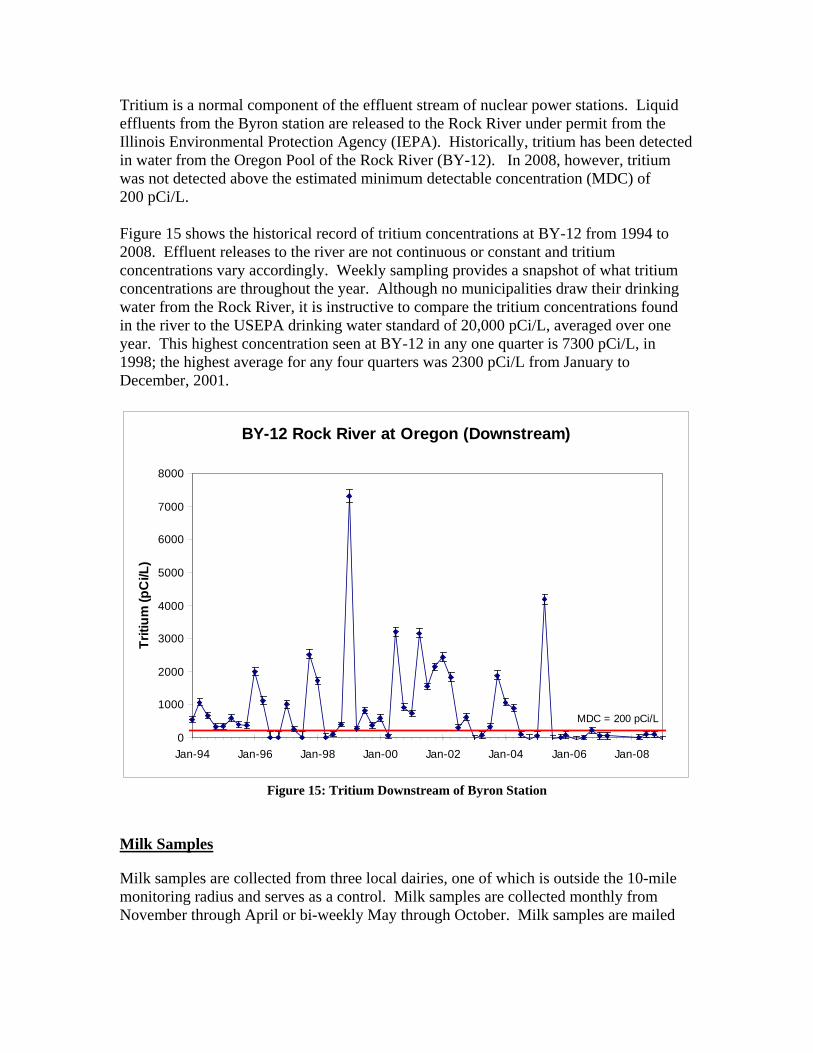
Tritium is a normal component of the effluent stream of nuclear power stations. Liquid effluents from the Byron station are released to the Rock River under permit from the Illinois Environmental Protection Agency (IEPA). Historically, tritium has been detected in water from the Oregon Pool of the Rock River (BY-12). In 2008, however, tritium was not detected above the estimated minimum detectable concentration (MDC) of 200 pCi/L. Figure 15 shows the historical record of tritium concentrations at BY-12 from 1994 to 2008. Effluent releases to the river are not continuous or constant and tritium concentrations vary accordingly. Weekly sampling provides a snapshot of what tritium concentrations are throughout the year. Although no municipalities draw their drinking water from the Rock River, it is instructive to compare the tritium concentrations found in the river to the USEPA drinking water standard of 20,000 pCi/L, averaged over one year. This highest concentration seen at BY-12 in any one quarter is 7300 pCi/L, in 1998; the highest average for any four quarters was 2300 pCi/L from January to December, 2001.
BY-12 Rock River at Oregon (Downstream)
0
1000
2000
3000
4000
5000
6000
7000
8000
Jan-94 Jan-96 Jan-98 Jan-00 Jan-02 Jan-04 Jan-06 Jan-08
Triti
um (p
Ci/L
)
MDC = 200 pCi/L
Figure 15: Tritium Downstream of Byron Station
Milk Samples
Milk samples are collected from three local dairies, one of which is outside the 10-mile monitoring radius and serves as a control. Milk samples are collected monthly from November through April or bi-weekly May through October. Milk samples are mailed
directly to the IEMA laboratory and analyzed within five days of sampling by gamma spectroscopy, specifically for short-lived iodine isotopes.
No radionuclides associated with nuclear power station operations were detected in milk samples. Only naturally occurring K-40 was detected, within the range typical of established background (1200 to 1500 pCi/L).
Sediment Samples
Sediment samples are collected from the Rock River at a point downstream of the station effluent stream. Sediment samples are monitored for several radionuclides associated with nuclear power station operations: Co-58, Co-60, Cs-134, Cs-137, and Mn-54. Cs-137, a remnant of atmospheric nuclear weapons testing, is present in most sediment and soil at concentrations of 0.1 – 0.2 pCi/g. In 2008, Cs-137 was detected in sediment from BY-34, Oregon Pool of the Rock River, at concentrations too small to quantify (< 0.1 pCi/g). No radionuclides associated with nuclear power station operations were detected in samples collected near Byron. Other radionuclides detected were naturally occurring. Fish samples
Fish are collected from the Rock River at a point near the station discharge point. Two different species of fish are collected each spring and fall. Edible portions of the fish are harvested by technicians at Midwest Incorporated Laboratory and prepared for analysis. Splits of the samples are provided to the IEMA laboratory. Fish samples are analyzed for reactor-produced radionuclides using gamma spectroscopy.
No radionuclides associated with nuclear power station operations were detected in fish samples. Only naturally occurring K-40 was detected, at concentrations typical of background (3 – 5 pCi/g). Vegetable samples
Two varieties of vegetables are collected annually, generally one root vegetable and one leafy green. Ideally, vegetables are collected from four farms: one in each quadrant (north, east, south, and west) from the station, although the availability of farms may vary from year to year. In 2008, samples were collected from all four quadrants. Vegetable samples are analyzed for reactor-produced radionuclides using gamma spectroscopy.
No radionuclides associated with nuclear power station operations were detected in vegetable samples. Only naturally occurring K-40 was detected. Ambient Gamma
IEMA maintains a network of 74 environmental dosimeters in a ten-mile radius around the Byron station. Unlike the environmental samples described above, dosimeters do not provide information on what radionuclides are found in the environment. Instead,
dosimeters provide a direct measurement of the total dose produced by all sources of gamma radiation, including naturally occurring radionuclides and cosmic rays. Dosimeters are exchanged and analyzed quarterly.
In 2008, measurements at all 74 locations were consistent with established background measurements.
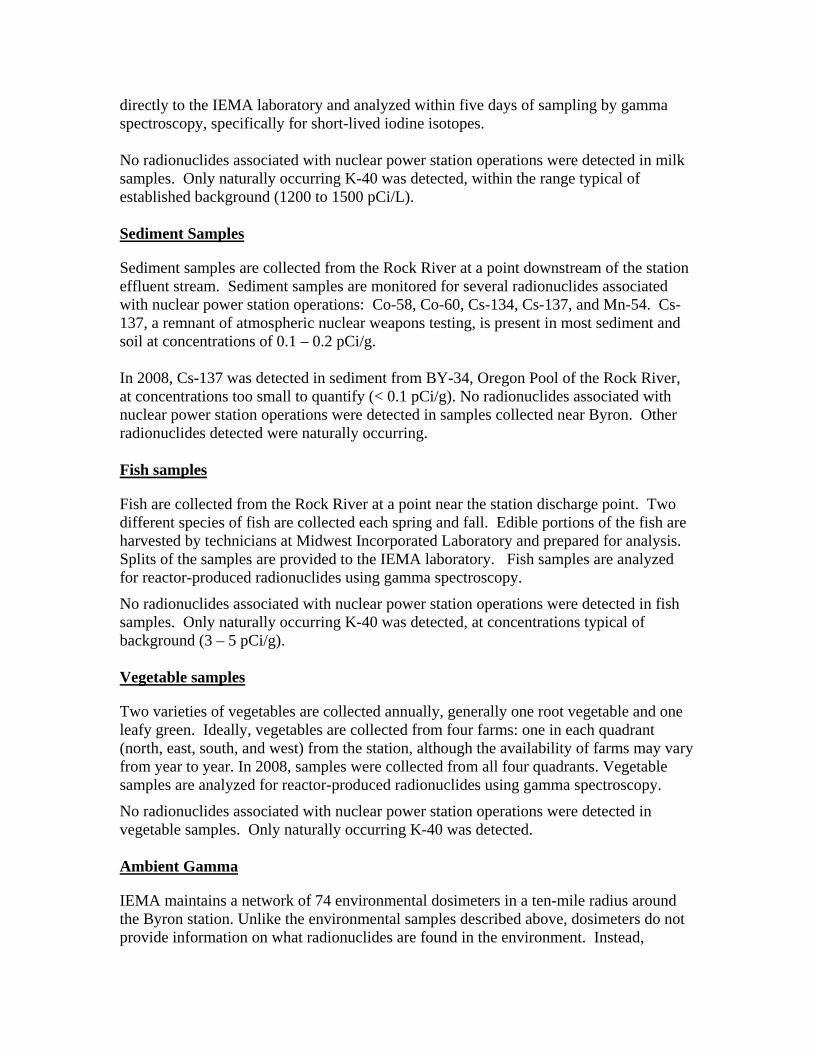
Table 5: Byron Monitoring Locations
IEMA ID Exelon ID Description Medium 130204 BY-12 Rock River, Downstream Surface Water
130220 BY-29 Rock River, Upstream Surface Water
130221 BY-18 Residential Well Ground Water
130223 BY-32 Residential Well Ground Water
130224 BY-14-1 Residential Well Ground Water
130225 BY-35 Residential Well Ground Water
130226 BY-36 Residential Well Ground Water
130227 BY-37 Residential Well Ground Water
130501 BY-20 Dairy Farm Milk
130507 BY-30 Dairy Farm Milk
130510 BY-26-1 Dairy Farm (Control) Milk
130603 BY-31 Rock River @ Discharge Fish
130701 BY-QUAD#1 Farm in Quadrant #1 (North) Vegetation
130702 BY-QUAD#2 Farm in Quadrant #2 (East) Vegetation
130703 BY-QUAD#3 Farm in Quadrant #3 (South) Vegetation
130704 BY-QUAD#4 Farm in Quadrant #4 (West) Vegetation
130911 BY-34 Rock River, Downstream Sediment
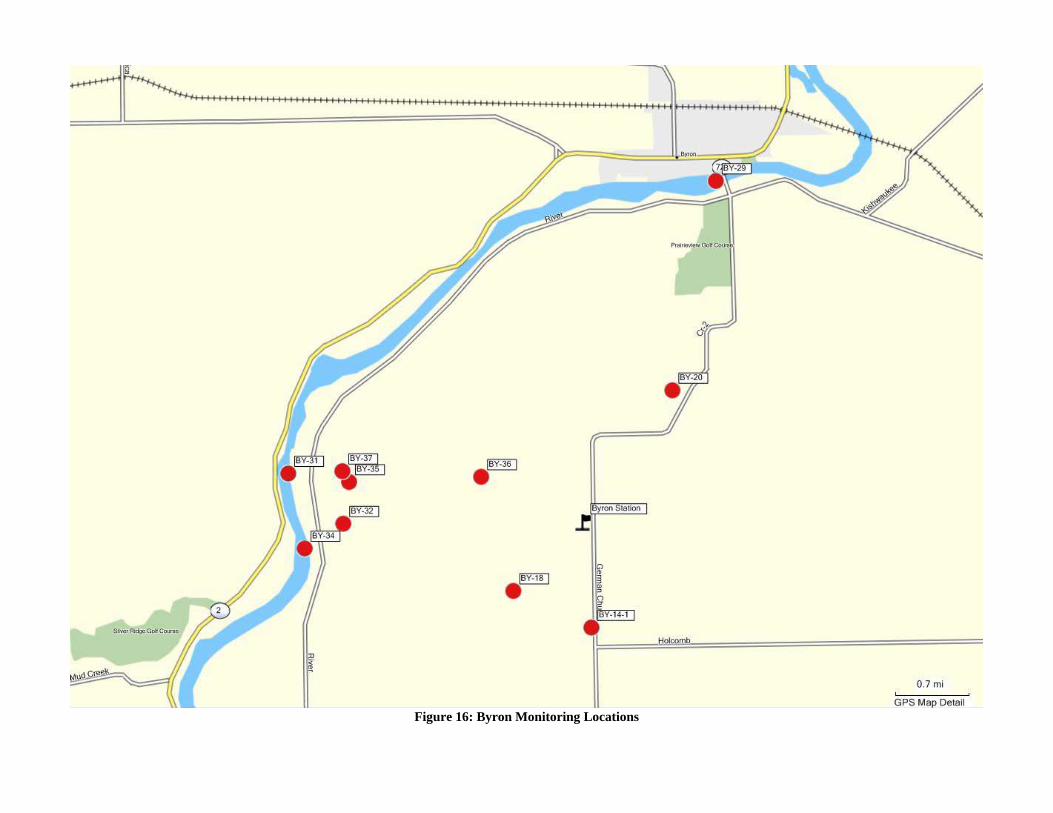
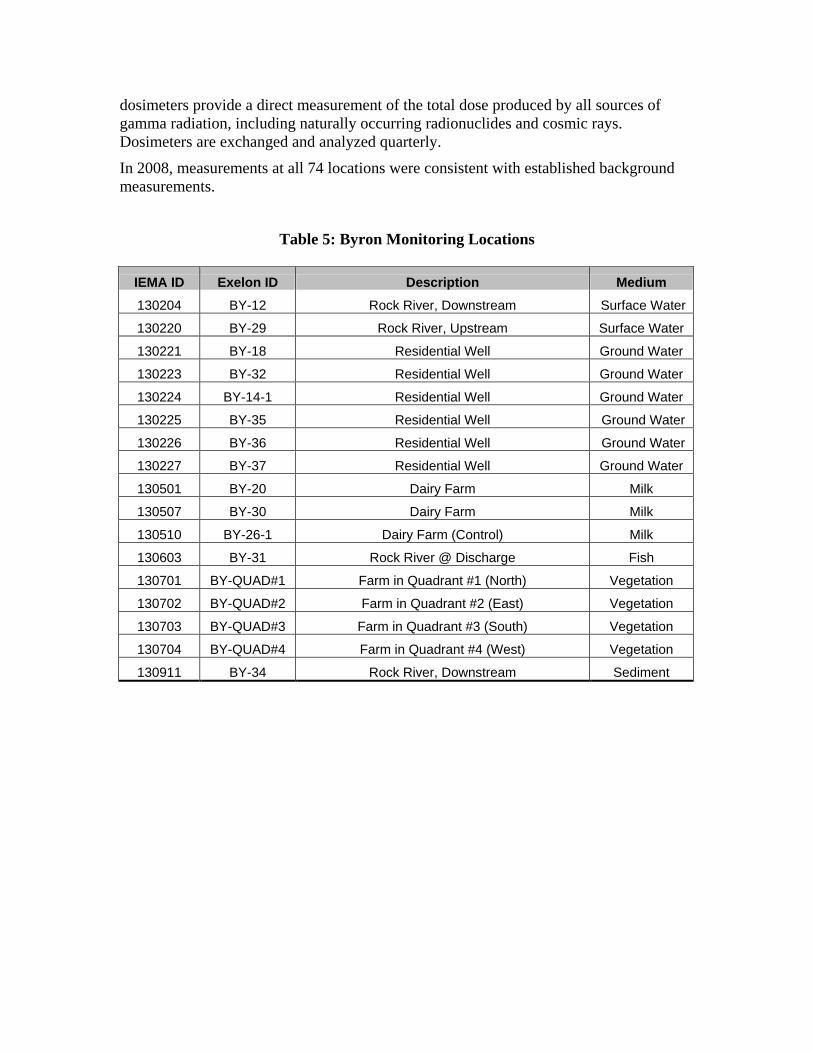
Figure 16: Byron Monitoring Locations
Figure 17: Byron Environmental Dosimeter Locations
- 32 -
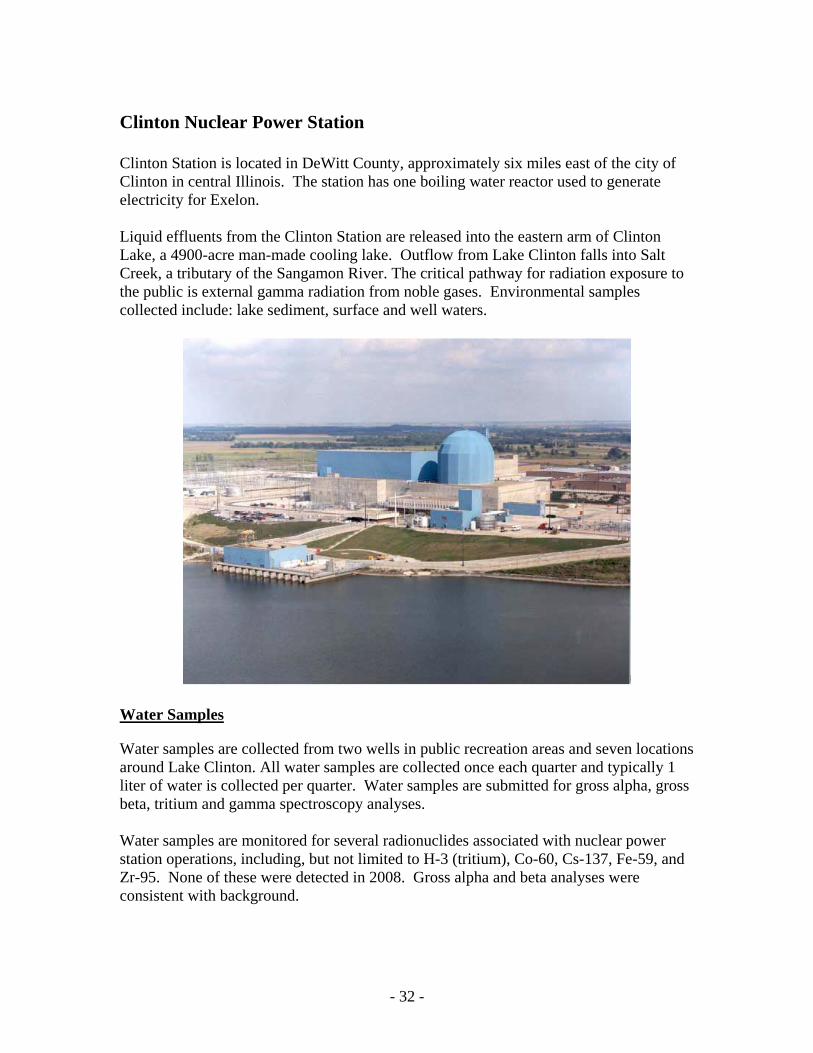
Clinton Nuclear Power Station Clinton Station is located in DeWitt County, approximately six miles east of the city of Clinton in central Illinois. The station has one boiling water reactor used to generate electricity for Exelon. Liquid effluents from the Clinton Station are released into the eastern arm of Clinton Lake, a 4900-acre man-made cooling lake. Outflow from Lake Clinton falls into Salt Creek, a tributary of the Sangamon River. The critical pathway for radiation exposure to the public is external gamma radiation from noble gases. Environmental samples collected include: lake sediment, surface and well waters.
Water Samples
Water samples are collected from two wells in public recreation areas and seven locations around Lake Clinton. All water samples are collected once each quarter and typically 1 liter of water is collected per quarter. Water samples are submitted for gross alpha, gross beta, tritium and gamma spectroscopy analyses.
Water samples are monitored for several radionuclides associated with nuclear power station operations, including, but not limited to H-3 (tritium), Co-60, Cs-137, Fe-59, and Zr-95. None of these were detected in 2008. Gross alpha and beta analyses were consistent with background.
- 33 -
Sediment Samples
Sediment samples are collected from six locations in Clinton Lake. Sediment samples are monitored for several radionuclides associated with nuclear power station operations: Co-58, Co-60, Cs-134, Cs-137, and Mn-54. None of these were detected in 2008. Ambient Gamma
IEMA maintains a network of 50 environmental dosimeters in a ten-mile radius around the Byron station. Unlike the environmental samples described above, dosimeters do not provide information on what radionuclides are found in the environment. Instead, dosimeters provide a direct measurement of the total dose produced by all sources of gamma radiation, including naturally occurring radionuclides and cosmic rays. Dosimeters are exchanged and analyzed quarterly.
In 2008, measurements at all 50 locations were consistent with established background measurements.
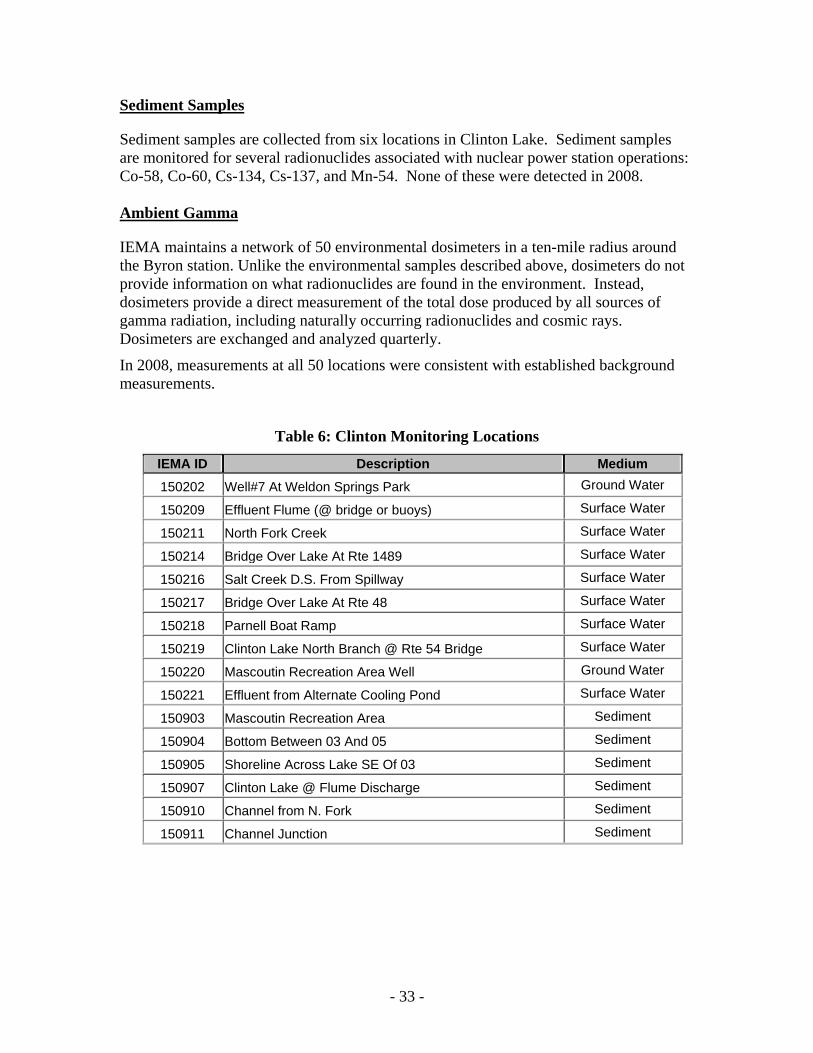
Table 6: Clinton Monitoring Locations
IEMA ID Description Medium 150202 Well#7 At Weldon Springs Park Ground Water 150209 Effluent Flume (@ bridge or buoys) Surface Water
150211 North Fork Creek Surface Water 150214 Bridge Over Lake At Rte 1489 Surface Water 150216 Salt Creek D.S. From Spillway Surface Water 150217 Bridge Over Lake At Rte 48 Surface Water 150218 Parnell Boat Ramp Surface Water 150219 Clinton Lake North Branch @ Rte 54 Bridge Surface Water 150220 Mascoutin Recreation Area Well Ground Water 150221 Effluent from Alternate Cooling Pond Surface Water 150903 Mascoutin Recreation Area Sediment 150904 Bottom Between 03 And 05 Sediment 150905 Shoreline Across Lake SE Of 03 Sediment 150907 Clinton Lake @ Flume Discharge Sediment 150910 Channel from N. Fork Sediment
150911 Channel Junction Sediment
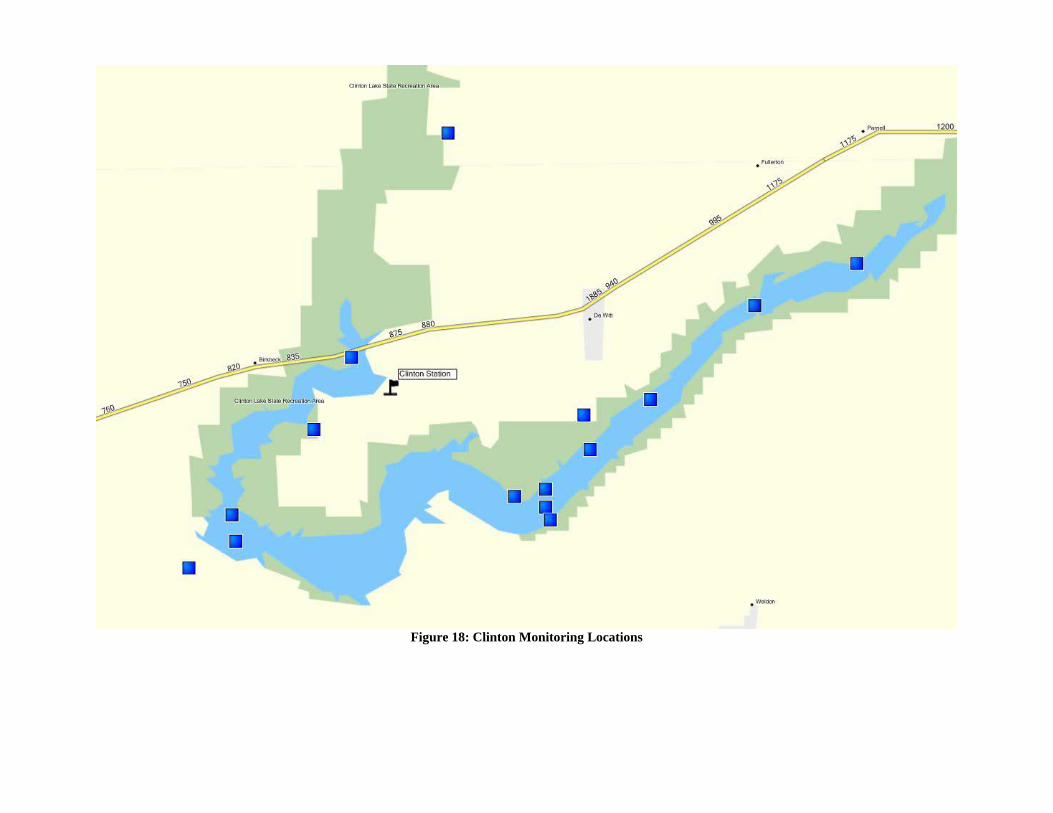
Figure 18: Clinton Monitoring Locations
Figure 19: Clinton Environmental Dosimeter Locations
- 36 -
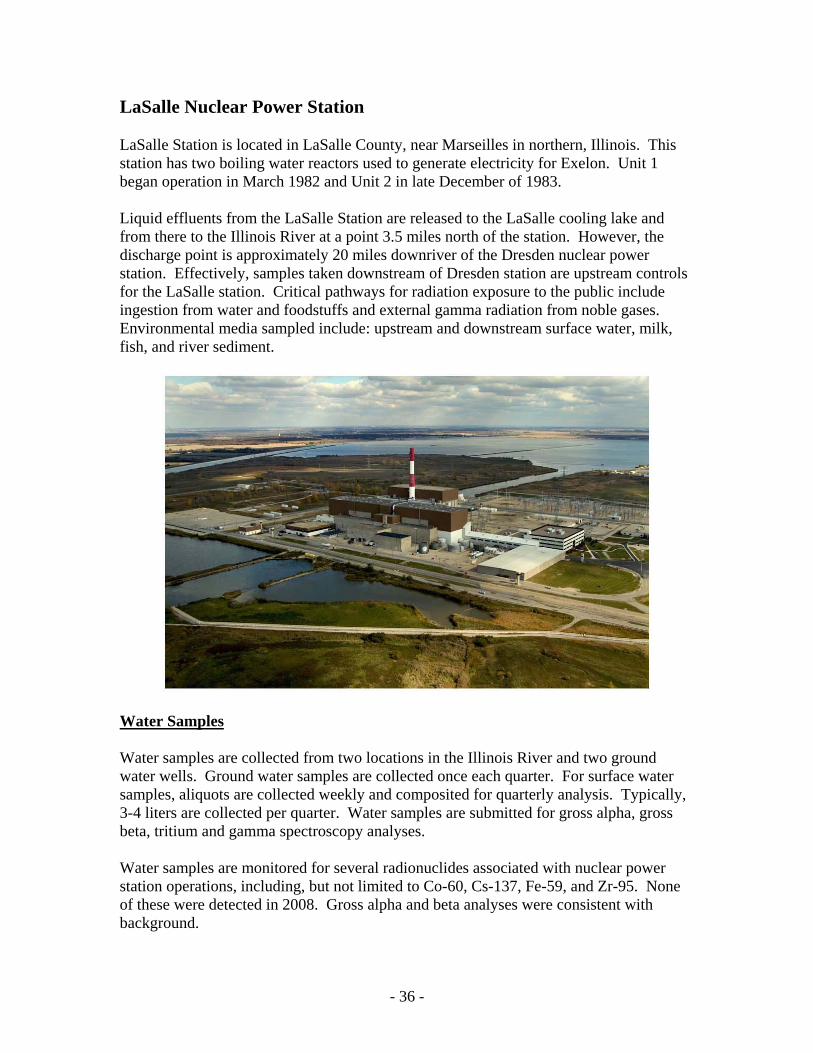
LaSalle Nuclear Power Station LaSalle Station is located in LaSalle County, near Marseilles in northern, Illinois. This station has two boiling water reactors used to generate electricity for Exelon. Unit 1 began operation in March 1982 and Unit 2 in late December of 1983. Liquid effluents from the LaSalle Station are released to the LaSalle cooling lake and from there to the Illinois River at a point 3.5 miles north of the station. However, the discharge point is approximately 20 miles downriver of the Dresden nuclear power station. Effectively, samples taken downstream of Dresden station are upstream controls for the LaSalle station. Critical pathways for radiation exposure to the public include ingestion from water and foodstuffs and external gamma radiation from noble gases. Environmental media sampled include: upstream and downstream surface water, milk, fish, and river sediment.
Water Samples
Water samples are collected from two locations in the Illinois River and two ground water wells. Ground water samples are collected once each quarter. For surface water samples, aliquots are collected weekly and composited for quarterly analysis. Typically, 3-4 liters are collected per quarter. Water samples are submitted for gross alpha, gross beta, tritium and gamma spectroscopy analyses.
Water samples are monitored for several radionuclides associated with nuclear power station operations, including, but not limited to Co-60, Cs-137, Fe-59, and Zr-95. None of these were detected in 2008. Gross alpha and beta analyses were consistent with background.
- 37 -
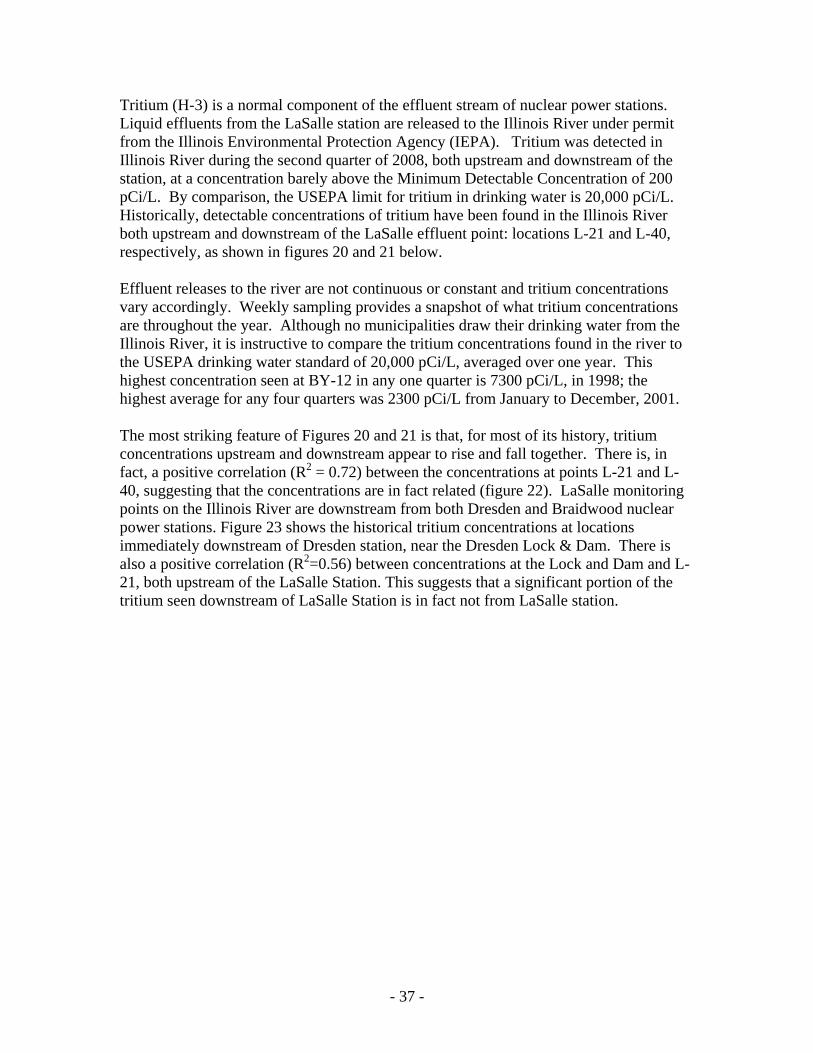
Tritium (H-3) is a normal component of the effluent stream of nuclear power stations. Liquid effluents from the LaSalle station are released to the Illinois River under permit from the Illinois Environmental Protection Agency (IEPA). Tritium was detected in Illinois River during the second quarter of 2008, both upstream and downstream of the station, at a concentration barely above the Minimum Detectable Concentration of 200 pCi/L. By comparison, the USEPA limit for tritium in drinking water is 20,000 pCi/L. Historically, detectable concentrations of tritium have been found in the Illinois River both upstream and downstream of the LaSalle effluent point: locations L-21 and L-40, respectively, as shown in figures 20 and 21 below. Effluent releases to the river are not continuous or constant and tritium concentrations vary accordingly. Weekly sampling provides a snapshot of what tritium concentrations are throughout the year. Although no municipalities draw their drinking water from the Illinois River, it is instructive to compare the tritium concentrations found in the river to the USEPA drinking water standard of 20,000 pCi/L, averaged over one year. This highest concentration seen at BY-12 in any one quarter is 7300 pCi/L, in 1998; the highest average for any four quarters was 2300 pCi/L from January to December, 2001.
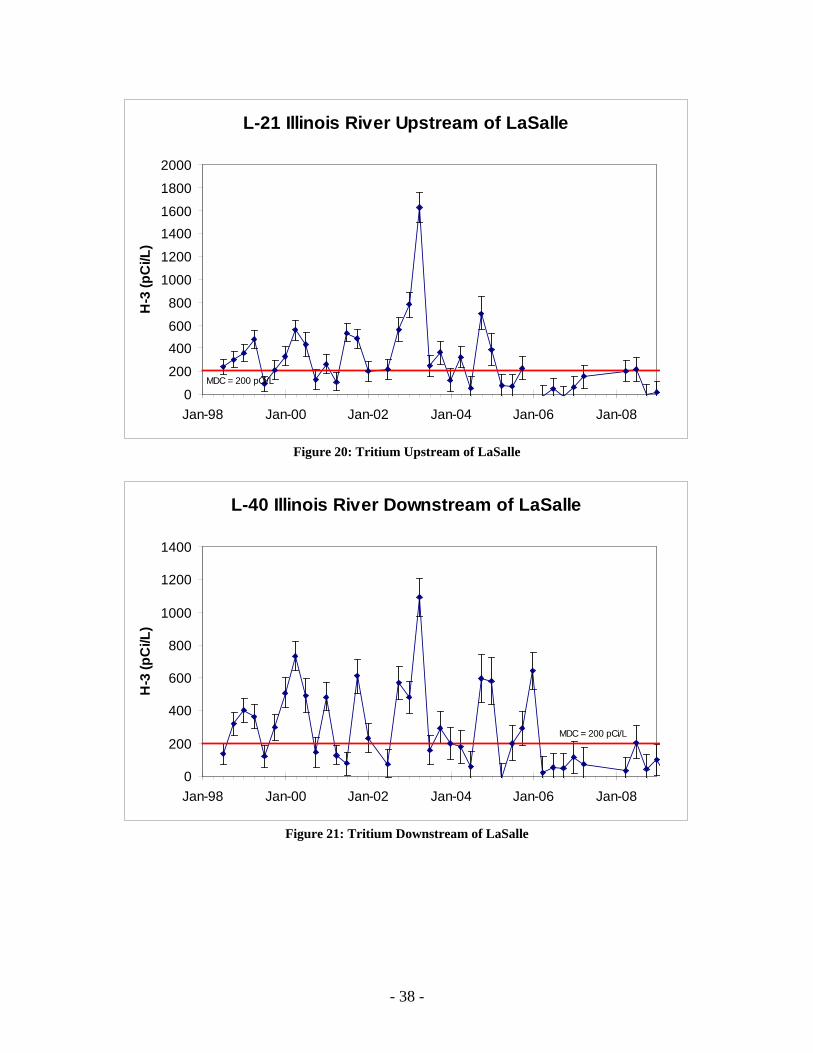
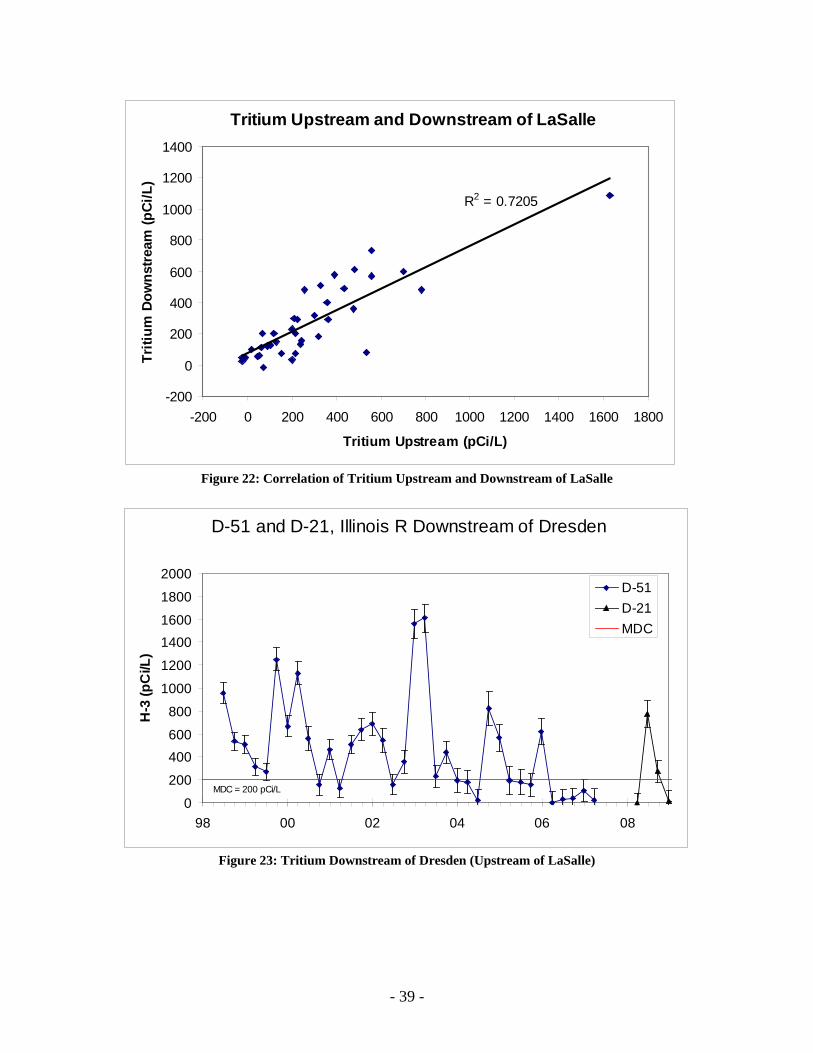
The most striking feature of Figures 20 and 21 is that, for most of its history, tritium concentrations upstream and downstream appear to rise and fall together. There is, in fact, a positive correlation (R2 = 0.72) between the concentrations at points L-21 and L-40, suggesting that the concentrations are in fact related (figure 22). LaSalle monitoring points on the Illinois River are downstream from both Dresden and Braidwood nuclear power stations. Figure 23 shows the historical tritium concentrations at locations immediately downstream of Dresden station, near the Dresden Lock & Dam. There is also a positive correlation (R2=0.56) between concentrations at the Lock and Dam and L-21, both upstream of the LaSalle Station. This suggests that a significant portion of the tritium seen downstream of LaSalle Station is in fact not from LaSalle station.
- 38 -
L-21 Illinois River Upstream of LaSalle
0
200
400600
800
1000
1200
14001600
1800
2000
Jan-98 Jan-00 Jan-02 Jan-04 Jan-06 Jan-08
H-3
(pC
i/L)
MDC = 200 pCi/L
Figure 20: Tritium Upstream of LaSalle
L-40 Illinois River Downstream of LaSalle
0
200
400
600
800
1000
1200
1400
Jan-98 Jan-00 Jan-02 Jan-04 Jan-06 Jan-08
H-3
(pC
i/L)
MDC = 200 pCi/L
Figure 21: Tritium Downstream of LaSalle
- 39 -
Tritium Upstream and Downstream of LaSalle
R2 = 0.7205
-200
0
200
400
600
800
1000
1200
1400
-200 0 200 400 600 800 1000 1200 1400 1600 1800
Tritium Upstream (pCi/L)
Triti
um D
owns
tream
(pCi
/L)
Figure 22: Correlation of Tritium Upstream and Downstream of LaSalle
D-51 and D-21, Illinois R Downstream of Dresden
0
200
400600
800
1000
1200
14001600
1800
2000
98 00 02 04 06 08
H-3
(pC
i/L)
D-51D-21MDC
MDC = 200 pCi/L
Figure 23: Tritium Downstream of Dresden (Upstream of LaSalle)
- 40 -
Milk Samples
No dairy falls inside the ten-mile EPZ. In the event that milk samples were collected, the sample collected at BD-18 would provide a control sample. Sediment Samples Sediment samples are collected from the rivers downstream of the station effluent points. Sediments are collected semi-annually in spring and fall. All sediments are submitted for gamma spectroscopy analysis. Sediment samples are monitored for several radionuclides associated with nuclear power station operations: Co-58, Co-60, Cs-134, Cs-137, and Mn-54. Cs-137, a remnant of atmospheric nuclear weapons testing, is present in most sediment and soil at concentrations of 0.1 – 0.2 pCi/g. In 2008, Cs-137 was detected in sediment from L-41, Illinois River, downstream, at concentrations too small to quantify (< 0.1 pCi/g). No other radionuclides associated with nuclear power station operations were detected in samples collected near LaSalle. Other radionuclides detected were naturally occurring. Fish samples Fish are collected from the Illinois River at a point near the station discharge point. Two different species of fish are collected each spring and fall. Edible portions of the fish are harvested by technicians at Midwest Incorporated Laboratory and prepared for analysis. Splits of the samples are provided to the IEMA laboratory. Fish samples are analyzed for reactor-produced radionuclides using gamma spectroscopy.
No radionuclides associated with nuclear power station operations were detected in fish samples. Only naturally occurring K-40 was detected, at concentrations typical of background (3 – 5 pCi/g). Vegetable samples Two varieties of vegetables are collected annually, generally one root vegetable and one leafy green. Ideally, vegetables are collected from four farms: one in each quadrant (north, east, south, and west) from the station, although the availability of farms may vary from year to year. In 2008, samples were collected from all four quadrants. Vegetable samples are analyzed for reactor-produced radionuclides using gamma spectroscopy.
No radionuclides associated with nuclear power station operations were detected in vegetable samples. Only naturally occurring K-40 was detected.
- 41 -
Ambient Gamma
IEMA maintains a network of 54 environmental dosimeters in a ten-mile radius around the LaSalle station. Unlike the environmental samples described above, dosimeters do not provide information on what radionuclides are found in the environment. Instead, dosimeters provide a direct measurement of the total dose produced by all sources of gamma radiation, including naturally occurring radionuclides and cosmic rays. Dosimeters are exchanged and analyzed quarterly.
In 2008, measurements at all 54 locations were consistent with established background measurements.
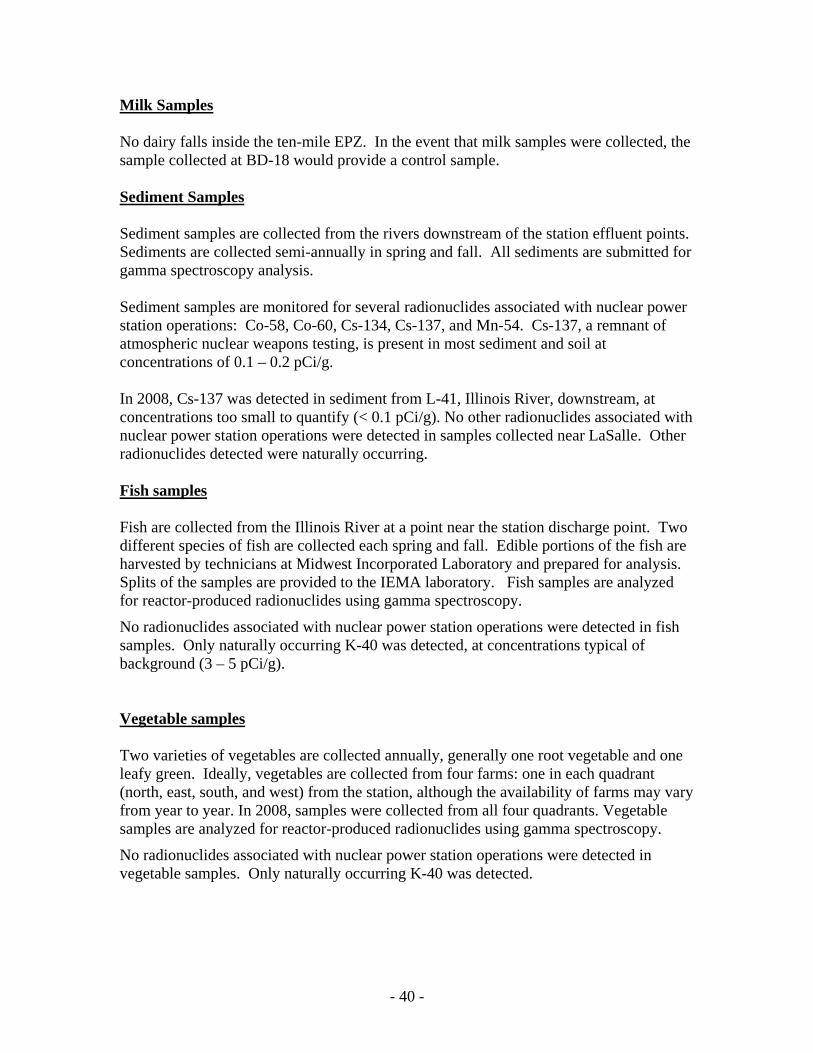
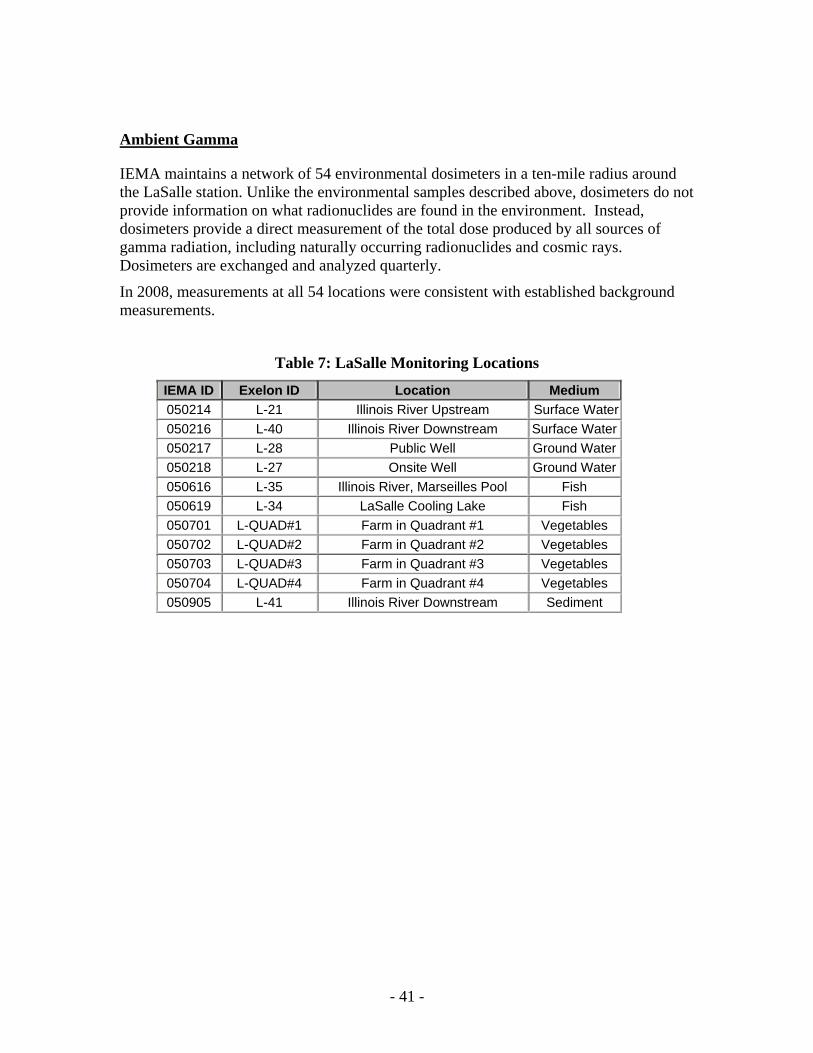
Table 7: LaSalle Monitoring Locations
IEMA ID Exelon ID Location Medium 050214 L-21 Illinois River Upstream Surface Water 050216 L-40 Illinois River Downstream Surface Water 050217 L-28 Public Well Ground Water 050218 L-27 Onsite Well Ground Water 050616 L-35 Illinois River, Marseilles Pool Fish 050619 L-34 LaSalle Cooling Lake Fish 050701 L-QUAD#1 Farm in Quadrant #1 Vegetables 050702 L-QUAD#2 Farm in Quadrant #2 Vegetables 050703 L-QUAD#3 Farm in Quadrant #3 Vegetables 050704 L-QUAD#4 Farm in Quadrant #4 Vegetables 050905 L-41 Illinois River Downstream Sediment
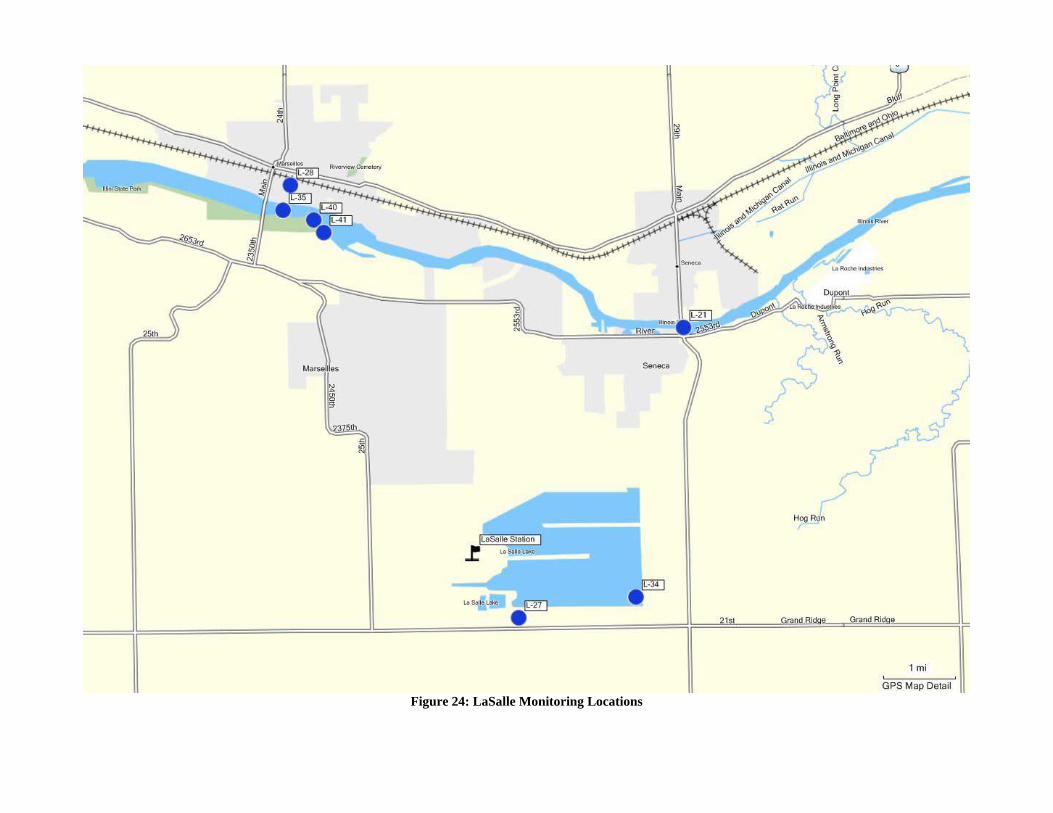
Figure 24: LaSalle Monitoring Locations
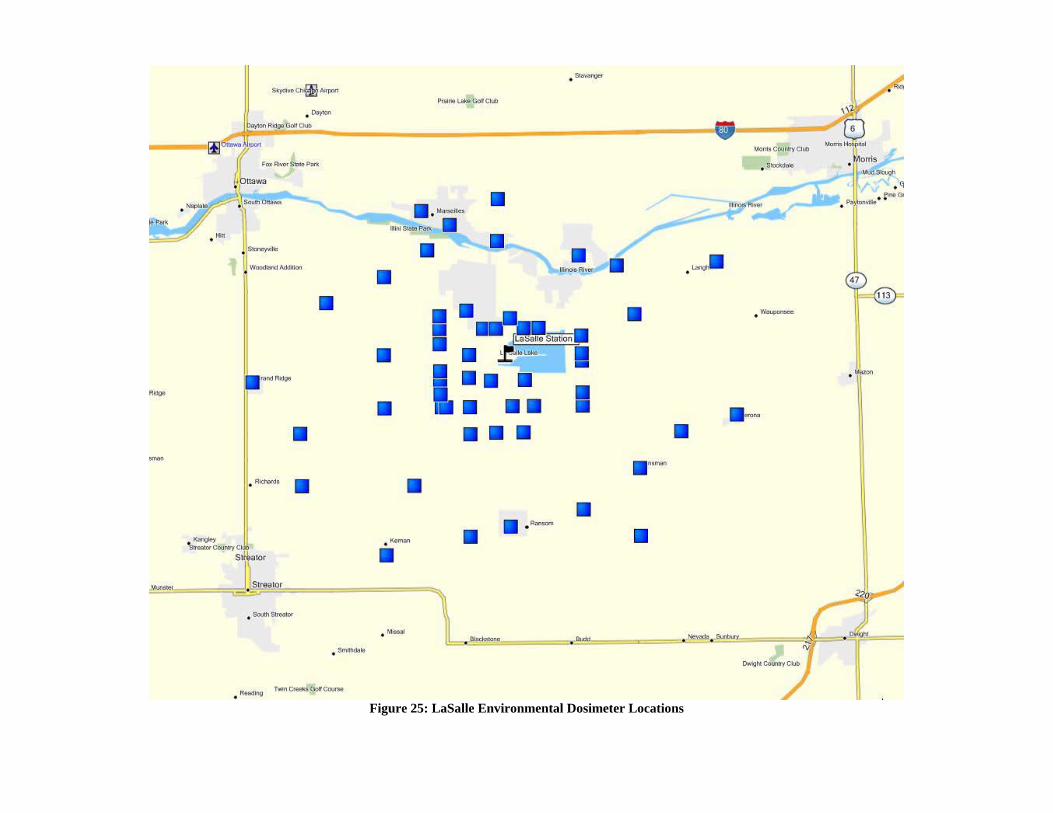
Figure 25: LaSalle Environmental Dosimeter Locations
- 44 -
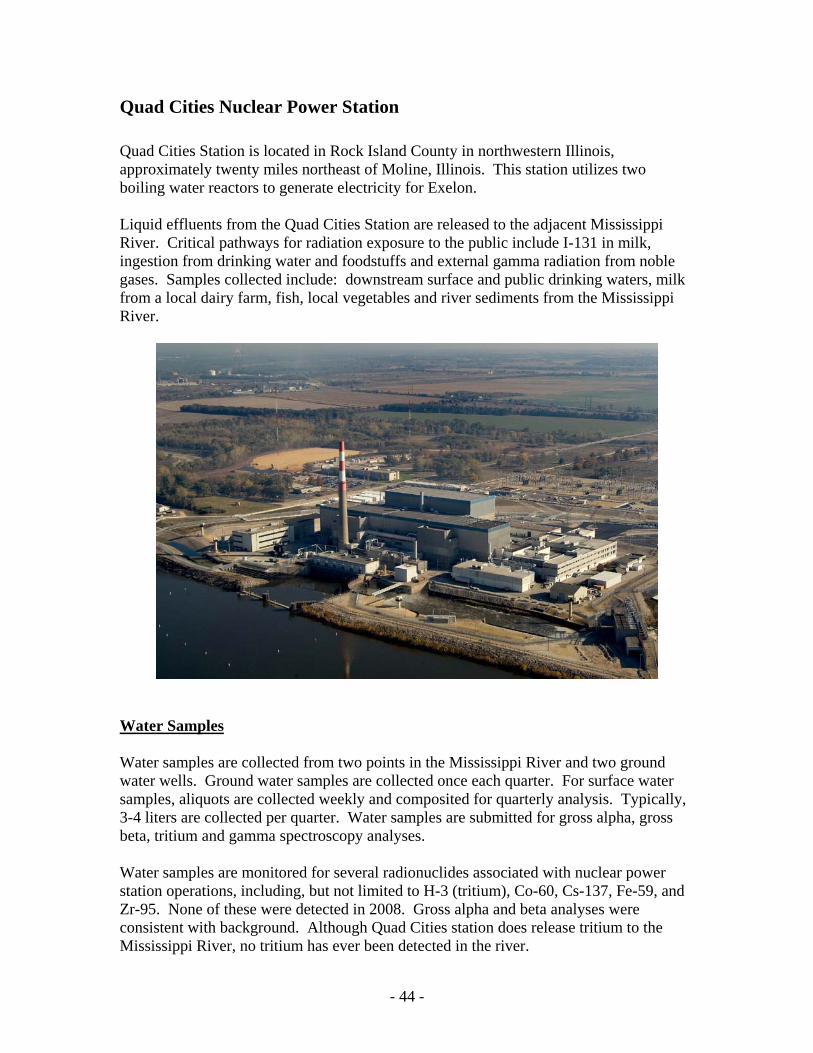
Quad Cities Nuclear Power Station Quad Cities Station is located in Rock Island County in northwestern Illinois, approximately twenty miles northeast of Moline, Illinois. This station utilizes two boiling water reactors to generate electricity for Exelon. Liquid effluents from the Quad Cities Station are released to the adjacent Mississippi River. Critical pathways for radiation exposure to the public include I-131 in milk, ingestion from drinking water and foodstuffs and external gamma radiation from noble gases. Samples collected include: downstream surface and public drinking waters, milk from a local dairy farm, fish, local vegetables and river sediments from the Mississippi River.
Water Samples Water samples are collected from two points in the Mississippi River and two ground water wells. Ground water samples are collected once each quarter. For surface water samples, aliquots are collected weekly and composited for quarterly analysis. Typically, 3-4 liters are collected per quarter. Water samples are submitted for gross alpha, gross beta, tritium and gamma spectroscopy analyses.
Water samples are monitored for several radionuclides associated with nuclear power station operations, including, but not limited to H-3 (tritium), Co-60, Cs-137, Fe-59, and Zr-95. None of these were detected in 2008. Gross alpha and beta analyses were consistent with background. Although Quad Cities station does release tritium to the Mississippi River, no tritium has ever been detected in the river.
- 45 -
Milk Samples
Milk samples are collected from a local dairy. Milk samples are collected monthly from November through April or bi-weekly May through October. Milk samples are mailed directly to the IEMA laboratory and analyzed within five days of sampling by gamma spectroscopy, specifically for short-lived iodine isotopes. No radionuclides associated with nuclear power station operations were detected in milk samples. Only naturally occurring K-40 was detected, within the range typical of established background (1200 to 1500 pCi/L). Sediment Samples Sediment samples are collected from the Mississippi River at a point downstream of the station effluent stream. Sediments are collected semi-annually in spring and fall. All sediments are submitted for gamma spectroscopy analysis. Sediment samples are monitored for several radionuclides associated with nuclear power station operations: Co-58, Co-60, Cs-134, Cs-137, and Mn-54. Cs-137, a remnant of atmospheric nuclear weapons testing, is present in most sediment and soil at concentrations of 0.1 – 0.2 pCi/g. In 2008, Cs-137 was detected in sediment from Q-39, Mississippi River at Cordova, at concentrations to small to quantify (< 0.1 pCi/g). This is typical of background. No radionuclides associated with nuclear power station operations were detected in samples. Other radionuclides detected were naturally occurring. Fish samples Fish are collected from the Mississippi River at a point near the station discharge point. Two different species of fish are collected each spring and fall. Edible portions of the fish are harvested by technicians at Midwest Incorporated Laboratory and prepared for analysis. Splits of the samples are provided to the IEMA laboratory. Fish samples are analyzed for reactor-produced radionuclides using gamma spectroscopy. No radionuclides associated with nuclear power station operations were detected in fish samples. Only naturally occurring K-40 was detected, at concentrations typical of background (3 – 5 pCi/g).
- 46 -
Vegetable samples Two varieties of vegetables are collected annually, generally one root vegetable and one leafy green. Ideally, vegetables are collected from four farms: one in each quadrant (north, east, south, and west) from the station, although the availability of farms may vary from year to year. In 2008, samples were collected from all four quadrants. Vegetable samples are analyzed for reactor-produced radionuclides using gamma spectroscopy.
No radionuclides associated with nuclear power station operations were detected in vegetable samples. Only naturally occurring K-40 was detected. Concentrations vary too widely between varieties for meaningful comparisons.
Ambient Gamma IEMA maintains a network of 66 environmental dosimeters in a ten-mile radius around the Quad Cities station. Unlike the environmental samples described above, dosimeters do not provide information on what radionuclides are found in the environment. Instead, dosimeters provide a direct measurement of the total dose produced by all sources of gamma radiation, including naturally occurring radionuclides and cosmic rays. Dosimeters are exchanged and analyzed quarterly.
In 2008, measurements at all 66 locations were consistent with established background measurements.
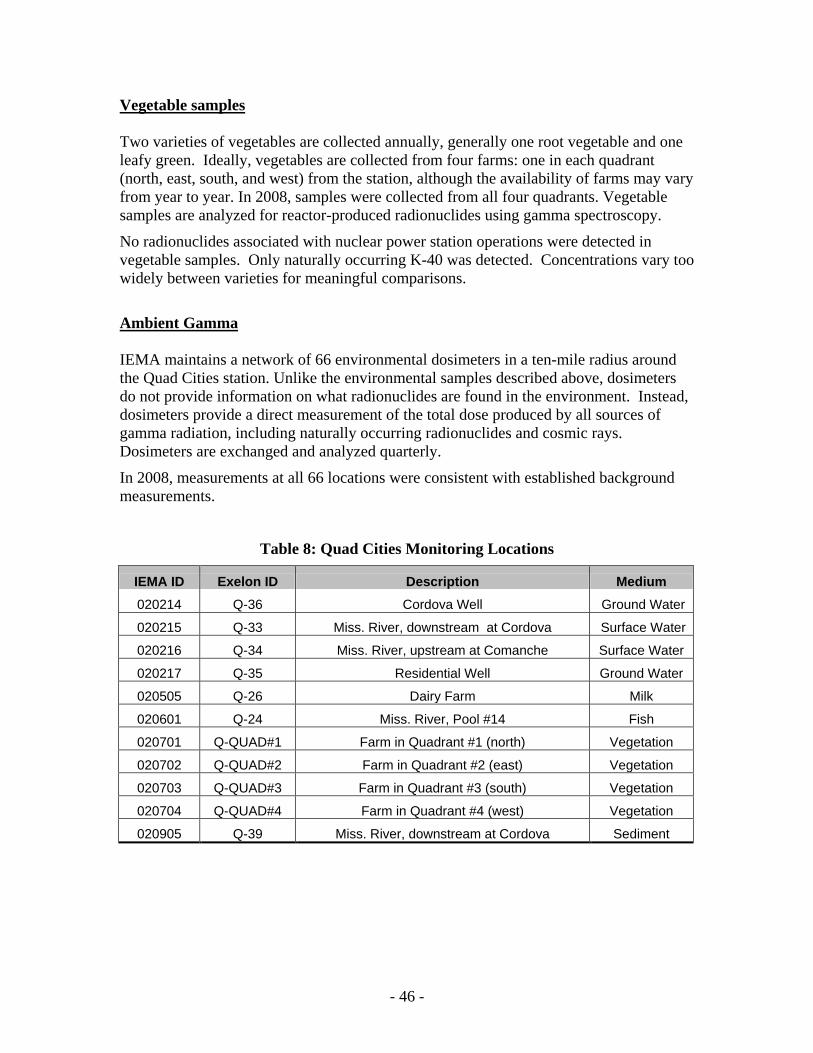
Table 8: Quad Cities Monitoring Locations
IEMA ID Exelon ID Description Medium 020214 Q-36 Cordova Well Ground Water
020215 Q-33 Miss. River, downstream at Cordova Surface Water
020216 Q-34 Miss. River, upstream at Comanche Surface Water
020217 Q-35 Residential Well Ground Water
020505 Q-26 Dairy Farm Milk
020601 Q-24 Miss. River, Pool #14 Fish
020701 Q-QUAD#1 Farm in Quadrant #1 (north) Vegetation
020702 Q-QUAD#2 Farm in Quadrant #2 (east) Vegetation
020703 Q-QUAD#3 Farm in Quadrant #3 (south) Vegetation
020704 Q-QUAD#4 Farm in Quadrant #4 (west) Vegetation
020905 Q-39 Miss. River, downstream at Cordova Sediment
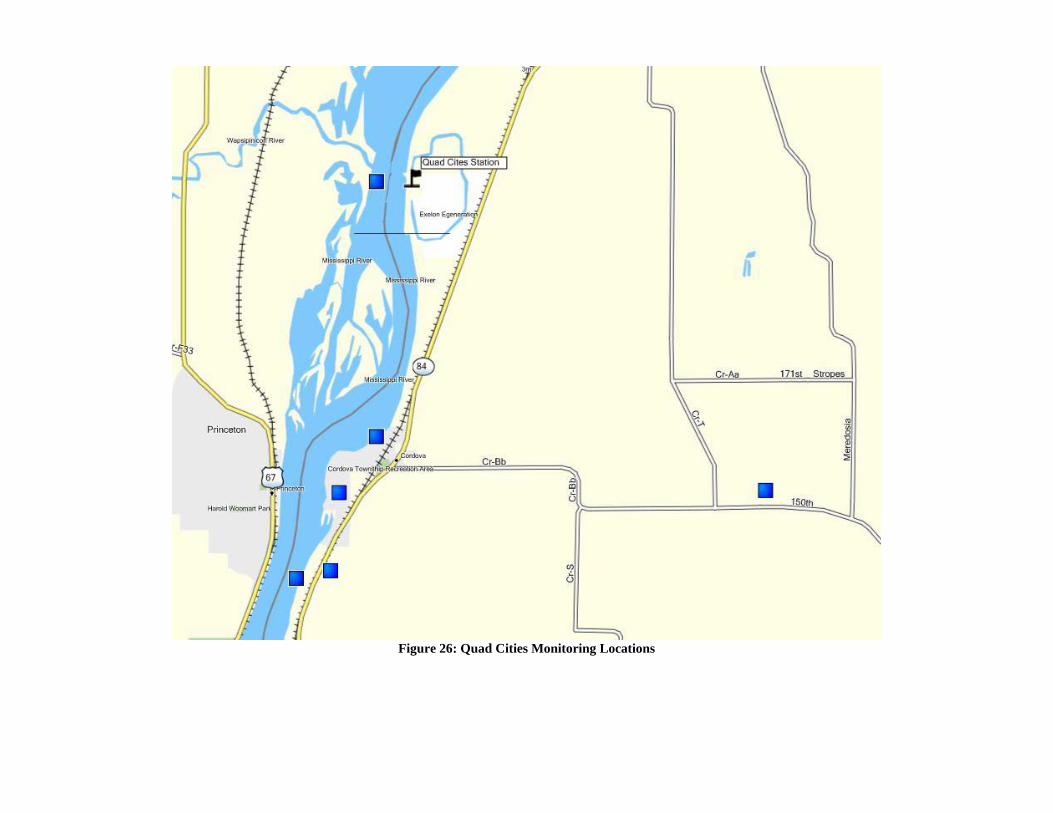
Figure 26: Quad Cities Monitoring Locations
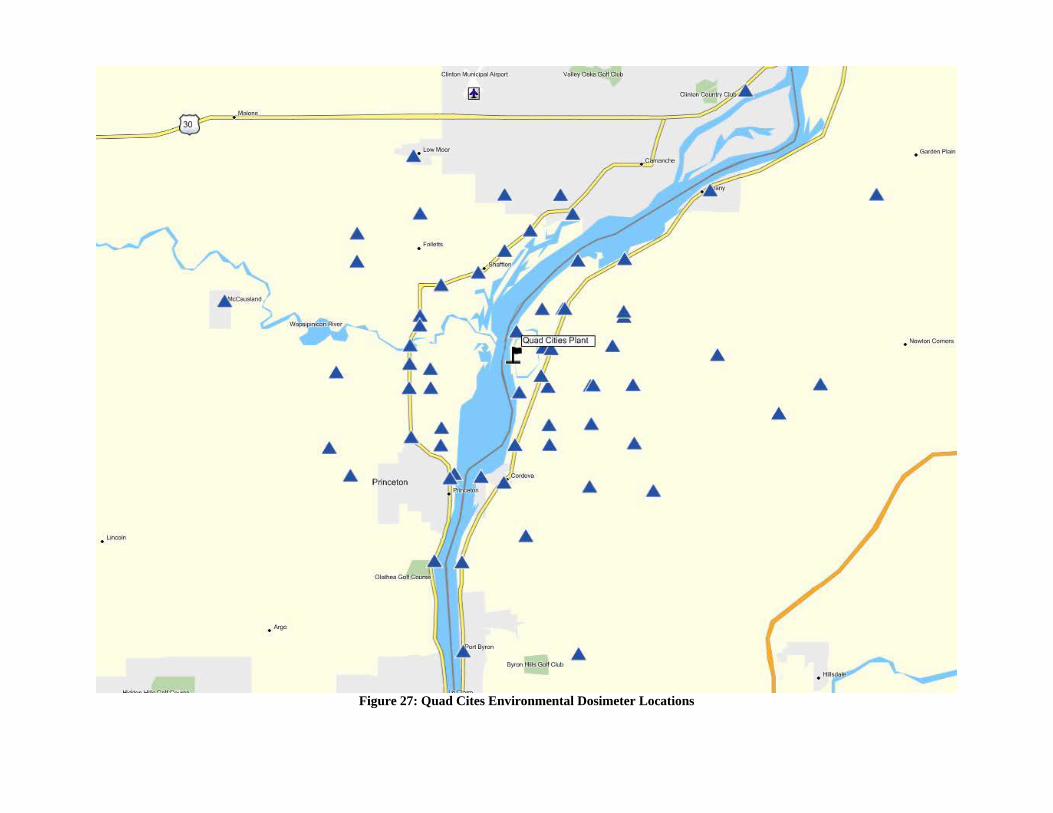
Figure 27: Quad Cites Environmental Dosimeter Locations
- 49 -
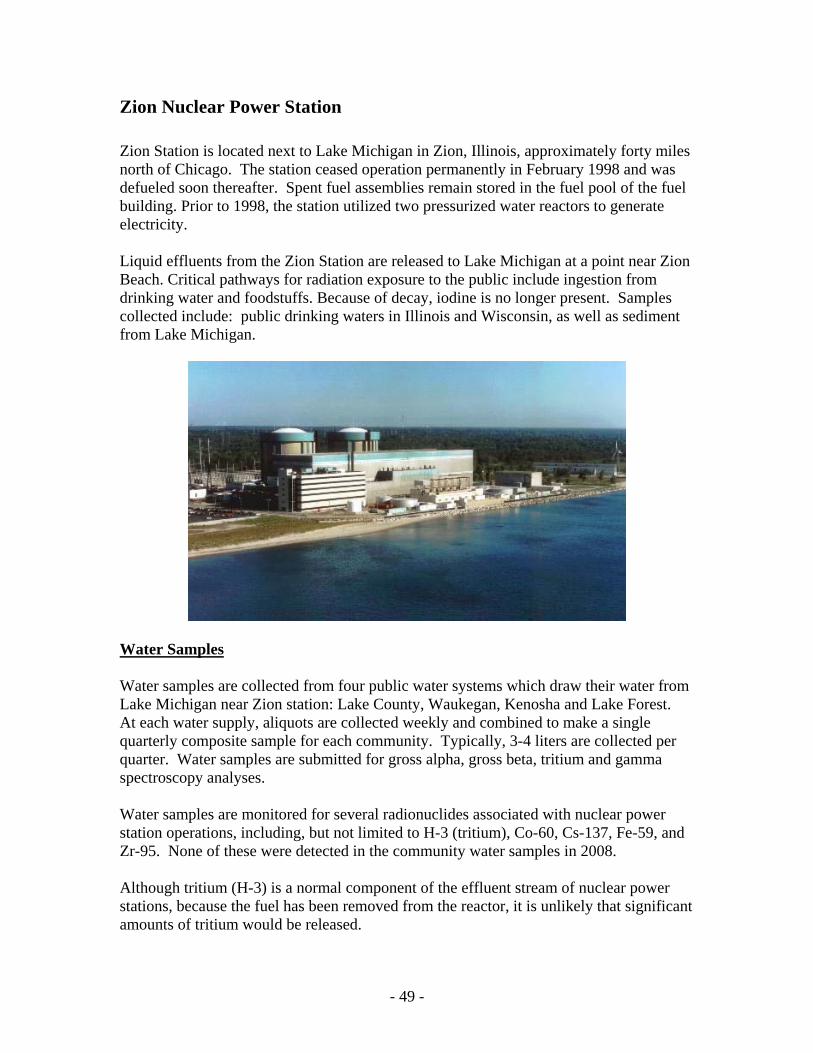
Zion Nuclear Power Station Zion Station is located next to Lake Michigan in Zion, Illinois, approximately forty miles north of Chicago. The station ceased operation permanently in February 1998 and was defueled soon thereafter. Spent fuel assemblies remain stored in the fuel pool of the fuel building. Prior to 1998, the station utilized two pressurized water reactors to generate electricity. Liquid effluents from the Zion Station are released to Lake Michigan at a point near Zion Beach. Critical pathways for radiation exposure to the public include ingestion from drinking water and foodstuffs. Because of decay, iodine is no longer present. Samples collected include: public drinking waters in Illinois and Wisconsin, as well as sediment from Lake Michigan.
Water Samples
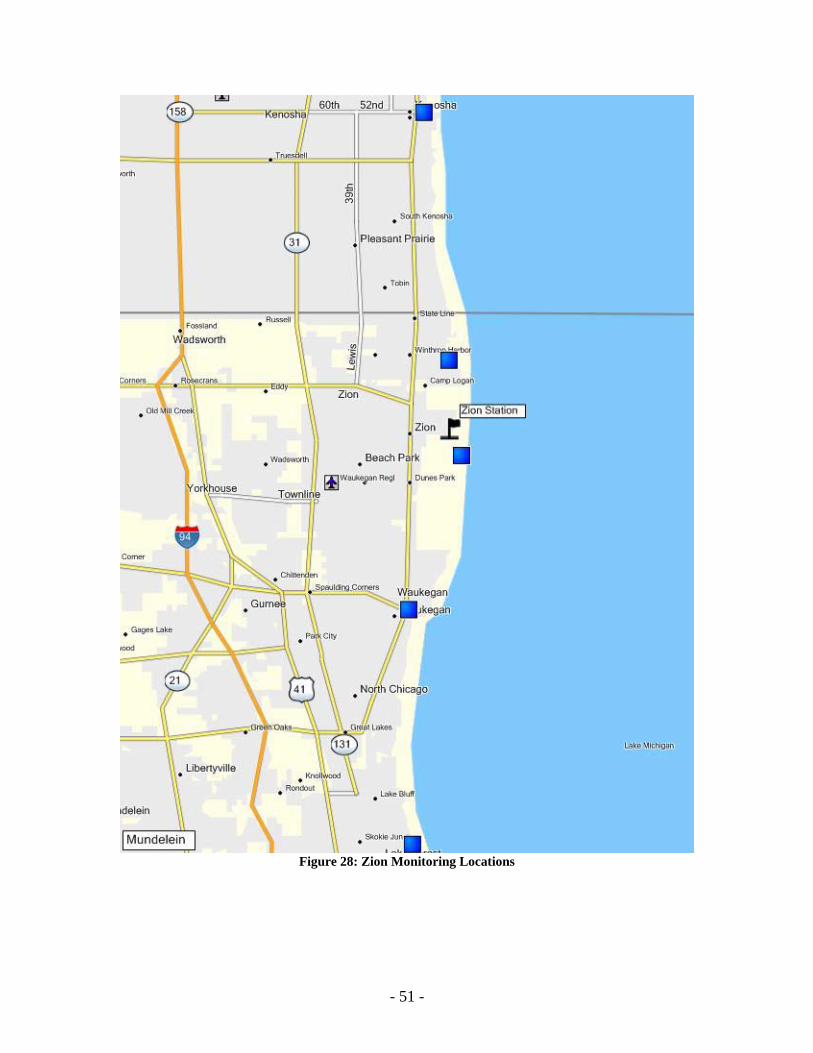
Water samples are collected from four public water systems which draw their water from Lake Michigan near Zion station: Lake County, Waukegan, Kenosha and Lake Forest. At each water supply, aliquots are collected weekly and combined to make a single quarterly composite sample for each community. Typically, 3-4 liters are collected per quarter. Water samples are submitted for gross alpha, gross beta, tritium and gamma spectroscopy analyses.
Water samples are monitored for several radionuclides associated with nuclear power station operations, including, but not limited to H-3 (tritium), Co-60, Cs-137, Fe-59, and Zr-95. None of these were detected in the community water samples in 2008. Although tritium (H-3) is a normal component of the effluent stream of nuclear power stations, because the fuel has been removed from the reactor, it is unlikely that significant amounts of tritium would be released.
- 50 -
Sediment Samples Sediment samples are collected from Lake Michigan near Illinois Beach State Park. Sediments are collected semi-annually in May and October. All sediments are submitted for gamma spectroscopy analysis. Sediment samples are monitored for several radionuclides associated with nuclear power station operations: Co-58, Co-60, Cs-134, Cs-137, and Mn-54. Cs-137, a remnant of atmospheric nuclear weapons testing, is present in most sediment and soil at concentrations of 0.1 – 0.2 pCi/g. In 2008, no radionuclides associated with nuclear power station operations were detected in samples collected near Zion Station. Other radionuclides detected were naturally occurring. Ambient Gamma IEMA maintains a network of 24 environmental dosimeters in a ten-mile radius around the Zion station. Unlike the environmental samples described above, dosimeters do not provide information on what radionuclides are found in the environment. Instead, dosimeters provide a direct measurement of the total dose produced by all sources of gamma radiation, including naturally occurring radionuclides and cosmic rays. Dosimeters are exchanged and analyzed quarterly.
In 2008, measurements at all 24 locations were consistent with established background measurements.
Table 9: Zion Monitoring Locations
IEMA ID Exelon ID Description Medium 030205 Z-15 Lake County PWS Public Water
030206 Z-16 Waukegan PWS Public Water
030208 Z-14 Kenosha PWS Public Water
030210 Z-18 Lake Forest PWS Public Water
030902 Z-25 Lake Michigan @ State Park Sediment
- 51 -
Figure 28: Zion Monitoring Locations
- 52 -
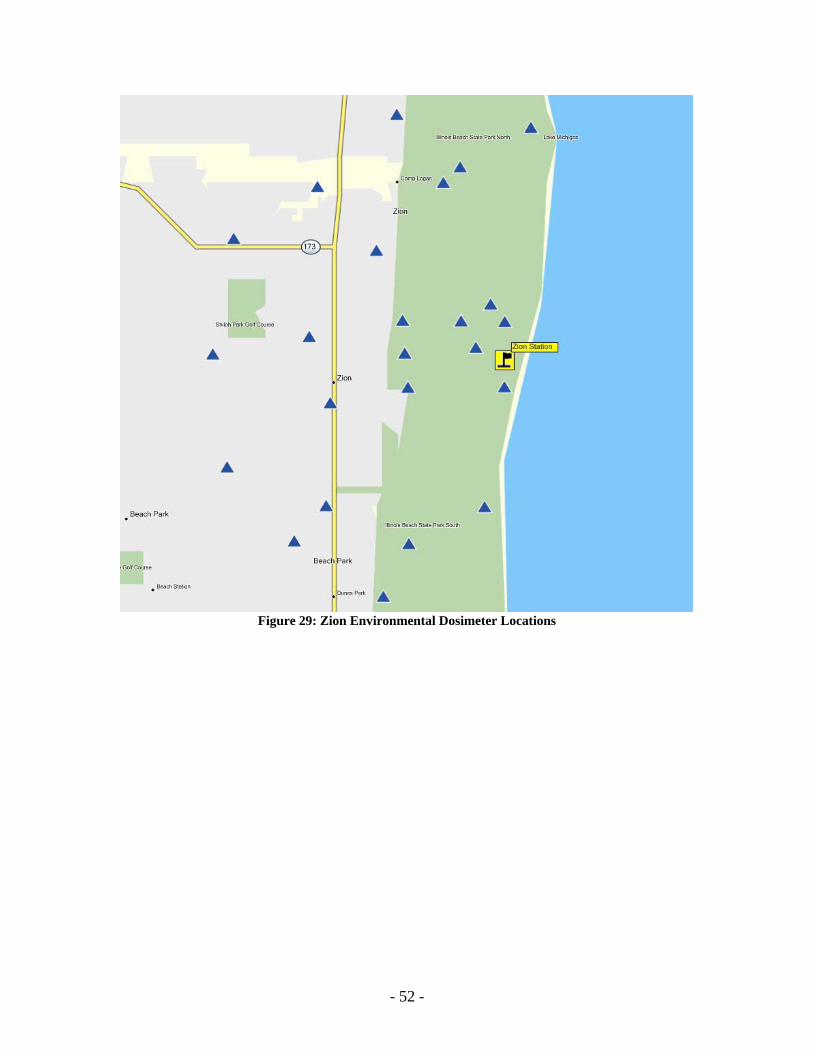
Figure 29: Zion Environmental Dosimeter Locations
- 53 -
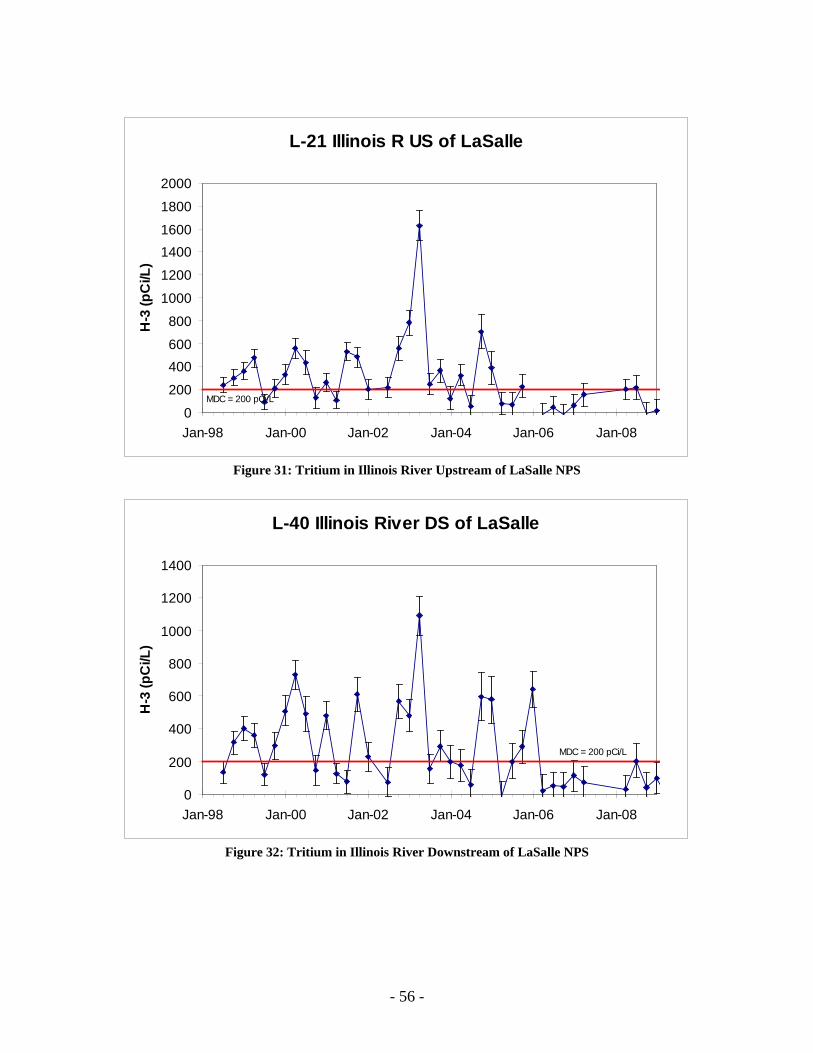
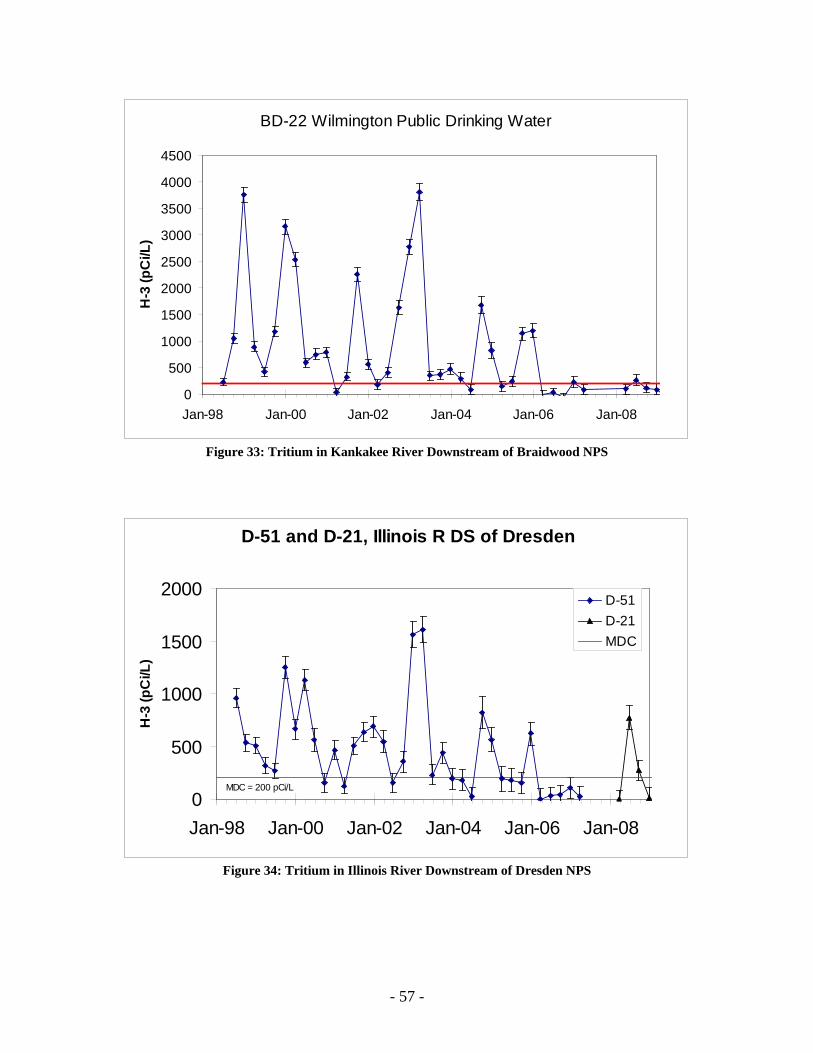
Kankakee and Illinois River Tritium Monitoring Three of the seven nuclear power stations in Illinois release effluents to either the Illinois River or its tributary, the Kankakee. Thus, the effluents of one station can impact the monitoring programs of those down stream. This is a brief review of the tritium monitoring results from these rivers over the last ten years to give an idea of just where tritium in the rivers is coming from. All of the samples discussed here are part of Exelon’s Radiological Environmental Monitoring Program (REMP). As such, they are collected by Midwest Labs and provided to IEMA for analysis. The samples are made up of aliquots collected weekly and composited for quarterly analysis. In this way, one sample can reasonably reflect the average concentration in the river during the entire quarter. If we follow the flow of the rivers, the stations from upstream to downstream are: Braidwood (releases to the Kankakee), Dresden (releases to the Illinois at the confluence of the Des Plaines and Kankakee) and LaSalle (releases to the Illinois). Figure 30, below, shows an overview of the rivers and monitoring points discussed in this summary. Note: there is a monitoring point on the Des Plaines River, upstream of Dresden station which is not discussed here for brevity. No tritium has been detected there in the ten years we have monitored that point. Below are plots showing the tritium concentrations downstream and upstream of each of the stations: LaSalle, Dresden and Braidwood, respectively. Comparing each pair, we can get an idea of how much tritium is contributed by each station. Starting with the furthest downstream, LaSalle, we can see that the tritium concentrations at both locations seem to be correlated closely. If we overlay one plot on the other, we see that they rise and fall together. Plotting these concentrations against each other, we see that they are strongly correlated, with r2=0.72. (see figure 22, above) We conclude that LaSalle’s contribution of tritium to the river is overwhelmed by an upstream source. LaSalle may be adding tritium to the river, but it is much smaller than what is already found there. Upstream, at Dresden, there is insufficient data from the new upstream monitoring point D-57 for a meaningful comparison. However, the point BD-22, Wilmington Public Water Supply, is the next point upstream. Wilmington is the only municipality to draw drinking water from the Kankakee or Illinois Rivers. Water is drawn from a point approximately six miles downstream from the point Braidwood station discharges into the river. This sample is a quarterly composite of aliquots collected daily from the distribution reservoir. Comparing tritium concentrations downstream of Dresden (location D-51 and its recent replacement D-21), to those at BD-22, we can see an apparent correlation. In this case, the correlation isn’t as strong (r2=0.47) but it is positive. It is difficult to estimate how much dilution might occur between the two points because they are so far apart, so it is impossible to estimate Dresden’s tritium contribution to the river, but it is clear that much of the tritium in the Illinois River is in fact coming from upstream in the Kankakee.
- 54 -
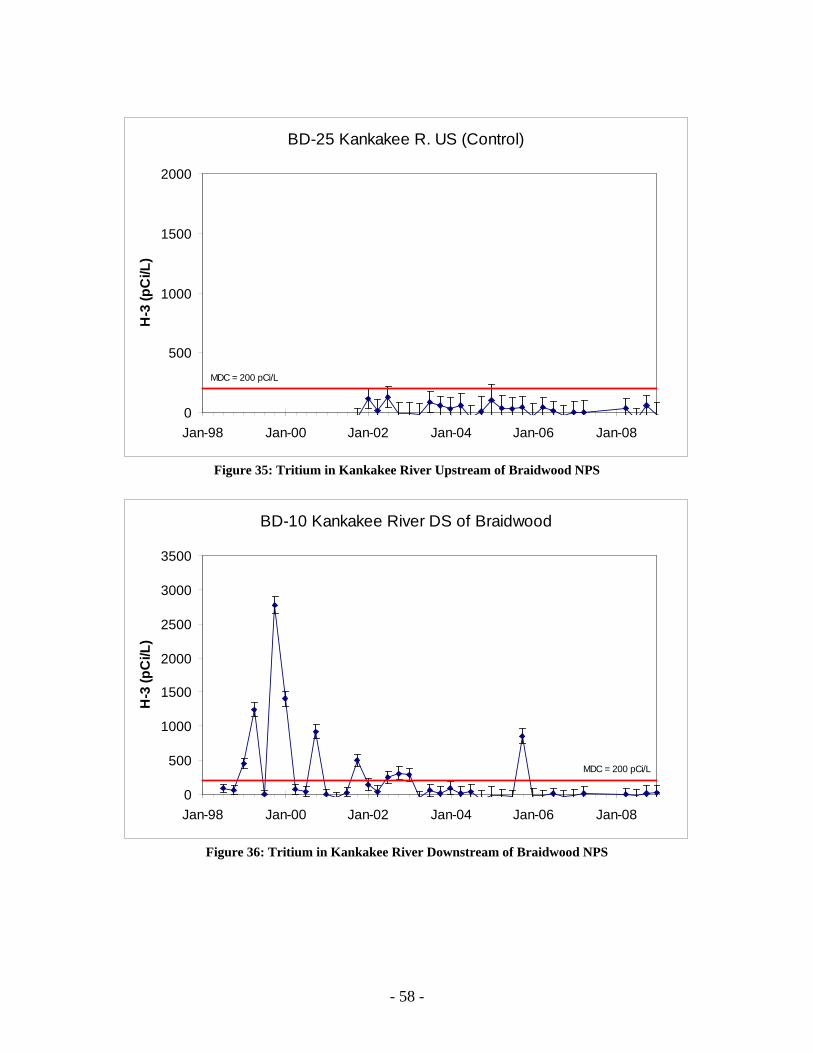
Comparing the designated upstream and downstream sample locations at Braidwood (BD-25 and BD-10) respectively, we see that, as expected, upstream, we have never detected tritium and downstream we see it only occasionally. However, we know from the BD-22 that considerably more tritium is released than is being detected at BD-10. It appears that sampling at BD-10 is frequently missing many tritium releases. This is likely a side-effect of the concern for tritium in the Wilmington drinking water. Since 2003, Braidwood station has timed its releases so that the “slug” would pass by the Wilmington water treatment station at night, when the station is not drawing water from the river. Braidwood operators use the rivers current height as a gauge for water velocity and calculate appropriate start and stop times and, for the most part, have been successful. Collection of the aliquots from BD-10 is done during the working day, probably at approximately the same time each week. It is likely that sampling and releases happen at fairly consistent times of day which allow the “slugs” to pass by the sampling point without being sampled. This is enhanced by the fact that the sampling point is relatively close to the release point, which would allow for minimal mixing. The introduction of sampling location D-57, upstream of Dresden station may provide a possible solution – being further downstream from Braidwood allows for more mixing and may provide more time in which the “slug” will be available for sampling. From these results, it is clear that the tritium IEMA is seeing downstream of both the LaSalle and Dresden stations is, in large part, coming from Braidwood. Although they are undoubtedly contributing tritium to the river, it is difficult to quantify their contributions, either because they are swamped by the tritium already there or because, as at BD-10, the sampling is missing an unmixed slug and detecting only the well-mixed slug coming from further upstream. This underscores the difficulty in properly sampling moving surface water for non-continuous releases; the best method would be to perform sampling that is truly random in time or collect more frequent aliquots.
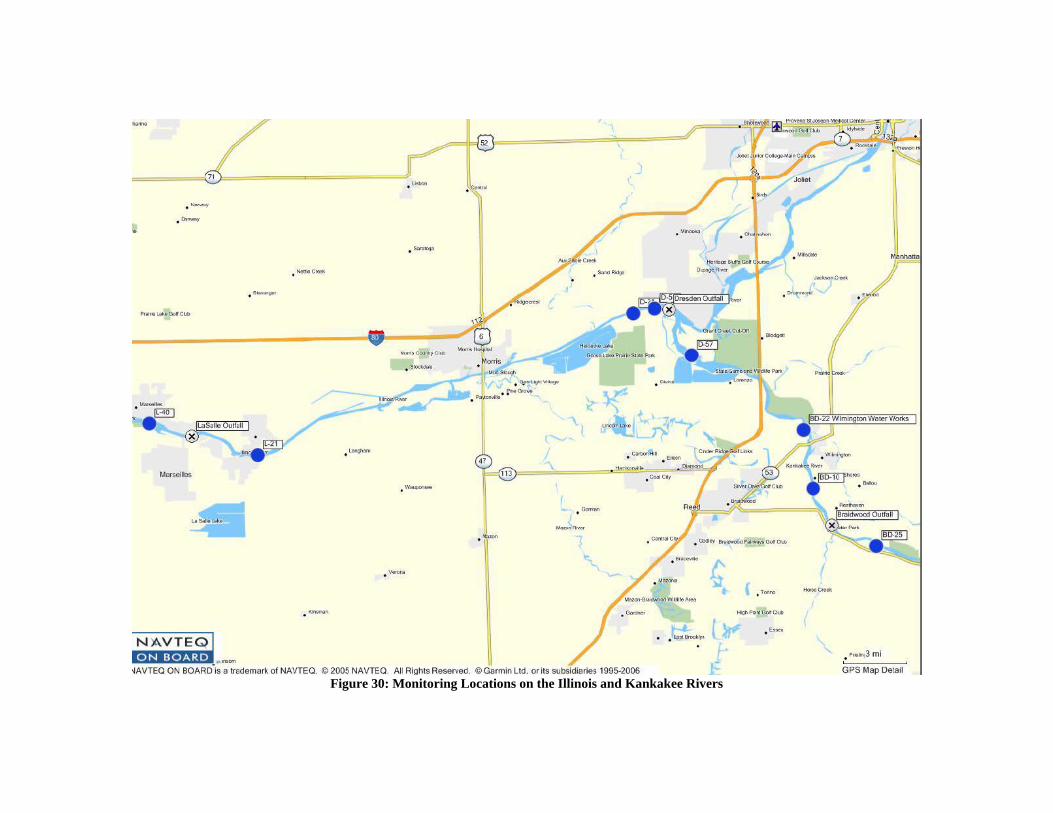
Figure 30: Monitoring Locations on the Illinois and Kankakee Rivers
- 56 -
L-21 Illinois R US of LaSalle
0
200
400600
800
1000
1200
14001600
1800
2000
Jan-98 Jan-00 Jan-02 Jan-04 Jan-06 Jan-08
H-3
(pC
i/L)
MDC = 200 pCi/L
Figure 31: Tritium in Illinois River Upstream of LaSalle NPS
L-40 Illinois River DS of LaSalle
0
200
400
600
800
1000
1200
1400
Jan-98 Jan-00 Jan-02 Jan-04 Jan-06 Jan-08
H-3
(pC
i/L)
MDC = 200 pCi/L
Figure 32: Tritium in Illinois River Downstream of LaSalle NPS
- 57 -
BD-22 Wilmington Public Drinking Water
0
500
1000
1500
2000
2500
3000
3500
4000
4500
Jan-98 Jan-00 Jan-02 Jan-04 Jan-06 Jan-08
H-3
(pC
i/L)
Figure 33: Tritium in Kankakee River Downstream of Braidwood NPS
D-51 and D-21, Illinois R DS of Dresden
0
500
1000
1500
2000
Jan-98 Jan-00 Jan-02 Jan-04 Jan-06 Jan-08
H-3
(pC
i/L)
D-51D-21MDC
MDC = 200 pCi/L
Figure 34: Tritium in Illinois River Downstream of Dresden NPS
- 58 -
BD-25 Kankakee R. US (Control)
0
500
1000
1500
2000
Jan-98 Jan-00 Jan-02 Jan-04 Jan-06 Jan-08
H-3
(pC
i/L)
MDC = 200 pCi/L
Figure 35: Tritium in Kankakee River Upstream of Braidwood NPS
BD-10 Kankakee River DS of Braidwood
0
500
1000
1500
2000
2500
3000
3500
Jan-98 Jan-00 Jan-02 Jan-04 Jan-06 Jan-08
H-3
(pC
i/L)
MDC = 200 pCi/L
Figure 36: Tritium in Kankakee River Downstream of Braidwood NPS