Embed Size (px)
Citation preview
© CAIRN HOMES PLC 2016. WWW.CAIRNHOMES.COM1
Cairn Homes plcEquity Presentation
January 2017
CAIRNHOMES.COM
Designed for Living.
Built for Life.Designed for Living.
Built for Life.
WWW.CAIRNHOMES.COM
Cairn Homes plcPreliminary Results Presentation
Year ended 31 December 2016 09 March 2017

© CAIRN HOMES PLC 2016. WWW.CAIRNHOMES.COM2
Disclaimer
This presentation document (hereinafter “this document”) has been prepared by Cairn Homes Plc (“Cairn Homes” or the“Company”).
This document has been prepared in good faith, but the information contained in it has not been subject to a verification exercise.No representation or warranty, express or implied, is given by or on behalf of the Company, its group companies or any of theirrespective shareholders, directors, officers, advisers, agents of other persons as to the accuracy, fairness or sufficiency of theinformation, projections, forecasts or opinions contained in the presentation. In particular, the market data in this document hasbeen sourced from third parties. Save in the context of fraud, no liability is accepted for any errors, omissions or inaccuracies in anyof the information or opinions in this document.
Certain information contained herein constitutes “forward-looking statements”, which can be identified by the use of terms such as“may”, “will”, “should”, “expect”, “anticipate”, “project”, “intend”, “continue”, “target” or “believe” (or the negatives thereof) or othervariations thereon or comparable terminology. Due to various risks and uncertainties, actual events of results of actual performanceof the Company may differ materially from those reflected or contemplated in such forward-looking statements. No representationor warranty is made as to the achievement or reasonableness of and no reliance should be placed on such forward-lookingstatements. There is no guarantee that the Company will generate a particular rate of return, unit operating profit or operating profitmargin or that it will achieve its targeted number of homes (per annum or over a development period).

© CAIRN HOMES PLC 2016. WWW.CAIRNHOMES.COM3
Agenda
1. Key Highlights
2. Operations
3. Financials
4. FTBs & Affordability
5. Outlook
6. Appendix
© CAIRN HOMES PLC 2016. WWW.CAIRNHOMES.COM4
Key highlightsO
per
atin
gFi
nan
cial
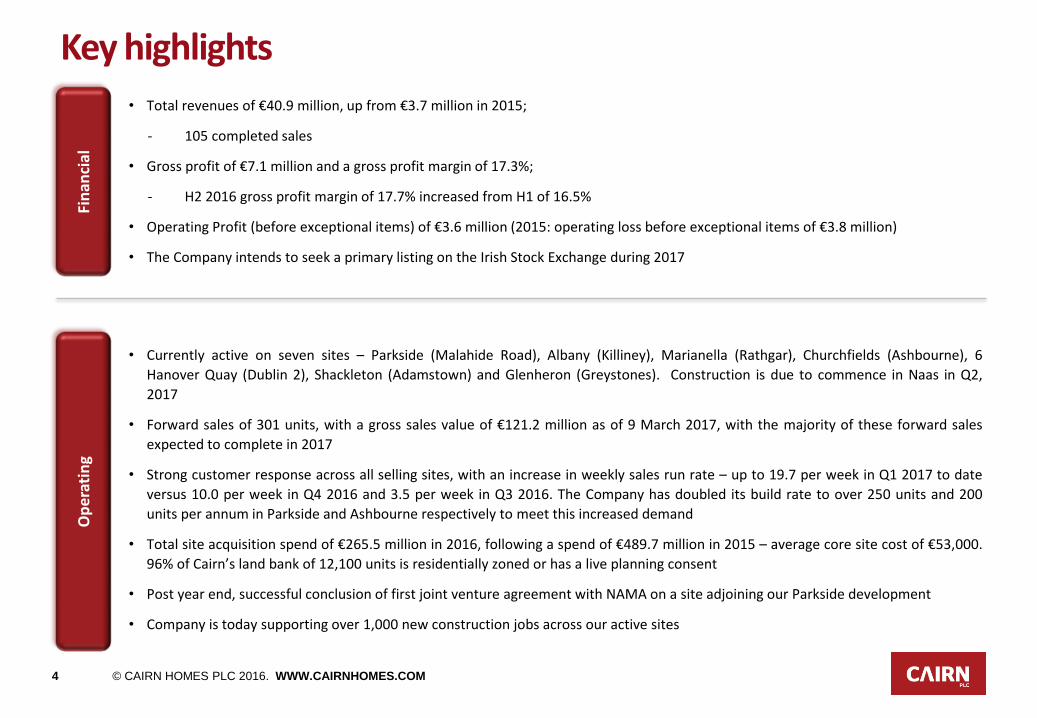
• Total revenues of €40.9 million, up from €3.7 million in 2015;
- 105 completed sales
• Gross profit of €7.1 million and a gross profit margin of 17.3%;
- H2 2016 gross profit margin of 17.7% increased from H1 of 16.5%
• Operating Profit (before exceptional items) of €3.6 million (2015: operating loss before exceptional items of €3.8 million)
• The Company intends to seek a primary listing on the Irish Stock Exchange during 2017
• Currently active on seven sites – Parkside (Malahide Road), Albany (Killiney), Marianella (Rathgar), Churchfields (Ashbourne), 6
Hanover Quay (Dublin 2), Shackleton (Adamstown) and Glenheron (Greystones). Construction is due to commence in Naas in Q2,
2017
• Forward sales of 301 units, with a gross sales value of €121.2 million as of 9 March 2017, with the majority of these forward sales
expected to complete in 2017
• Strong customer response across all selling sites, with an increase in weekly sales run rate – up to 19.7 per week in Q1 2017 to date
versus 10.0 per week in Q4 2016 and 3.5 per week in Q3 2016. The Company has doubled its build rate to over 250 units and 200
units per annum in Parkside and Ashbourne respectively to meet this increased demand
• Total site acquisition spend of €265.5 million in 2016, following a spend of €489.7 million in 2015 – average core site cost of €53,000.
96% of Cairn’s land bank of 12,100 units is residentially zoned or has a live planning consent
• Post year end, successful conclusion of first joint venture agreement with NAMA on a site adjoining our Parkside development
• Company is today supporting over 1,000 new construction jobs across our active sites

© CAIRN HOMES PLC 2016. WWW.CAIRNHOMES.COM5
Agenda
1. Key Highlights
2. Operations
3. Financials
4. FTBs & Affordability
5. Outlook
6. Appendix
© CAIRN HOMES PLC 2016. WWW.CAIRNHOMES.COM6
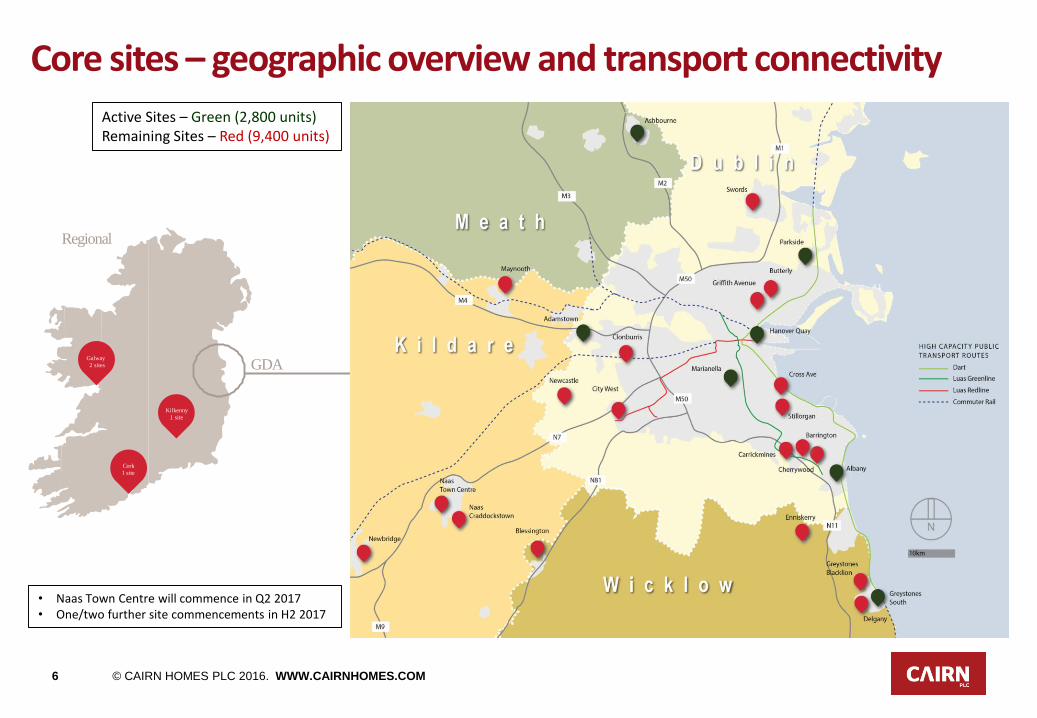
Regional
Galway
2 sites
Kilkenny
1 site
Cork
1 site
Core sites – geographic overview and transport connectivity
Ashbourne
354 homesSwords
Parkside
433 homes
Butterly
Griffith Ave
Maynooth
597 homes
Adamstown
1,195 homes
Clonburris
3,000
homes
Hanover Quay
122 homes
Newbridge
Marianella
234 homes
Stillorgan
Ard na
GlaiseBlackrock
Albany
20 homes
Greystones
833 homes
Cherrywood
315 homes
Barrington
Tower
Carrickmines
SaggartNewcastle
Blessington
Naas
700 homes
EnniskerryEnniskerry
Active Sites – Green (2,800 units)Remaining Sites – Red (9,400 units)
GDA
• Naas Town Centre will commence in Q2 2017• One/two further site commencements in H2 2017

© CAIRN HOMES PLC 2016. WWW.CAIRNHOMES.COM7
Land bank analysis
64%
26%
10%
The pathway to 1,200+ unit delivery by 2019Composition of 12,100 unit land bank
91% of land bank in Dublin and GDA
Dublin – 63%
Regional – 9%
GDA – 28%
0
200
400
600
800
1000
1200
1400
2016 2017 2018 2019
Range: 375 – 400 units
850 units
1,200+ units
105 units
25%
75%
20%
57%
10%13%
27%
35%
4%
34%
© CAIRN HOMES PLC 2016. WWW.CAIRNHOMES.COM8
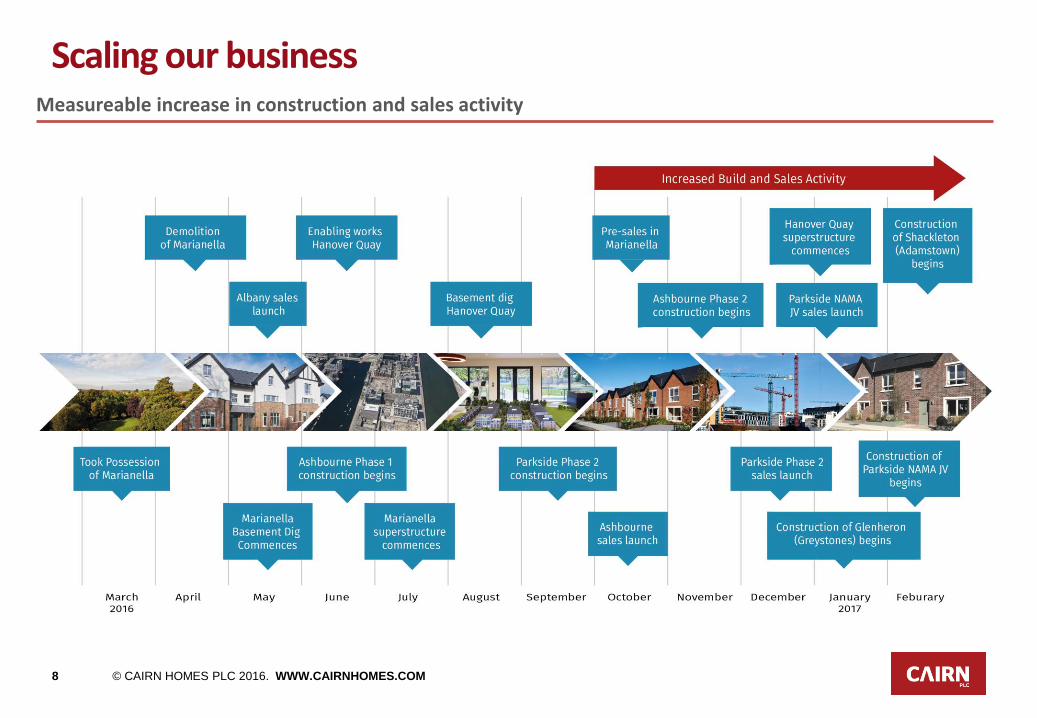
Scaling our businessMeasureable increase in construction and sales activity

© CAIRN HOMES PLC 2016. WWW.CAIRNHOMES.COM9
The Cairn team and supporting subcontractors
• Assembled a talented, high calibre and dedicated team to deliver on future growth plans
Scaling our business Supporting our subcontractor base
• 285 subcontractors and suppliers are employed across our 7 active sites
• Supporting 1,000 construction jobs across our active sites
• Continued sponsorship of apprenticeship programmes
• Advantages of the Cairn platform to our subcontractors:
- Security provided by longer duration and larger phase developments (average core site contains > 400 units) allowing them to scale their businesses;
- Efficient sequencing of trades managed by Cairns experienced site management teams;
- Regular and prompt payment of invoices;
- Visible growth prospects on foot of our long-term land bank and line of sight over development pipeline; and
- Bulk purchasing of materials leveraging off fixed supplier pricing agreed directly between Cairn and suppliers
© CAIRN HOMES PLC 2016. WWW.CAIRNHOMES.COM10
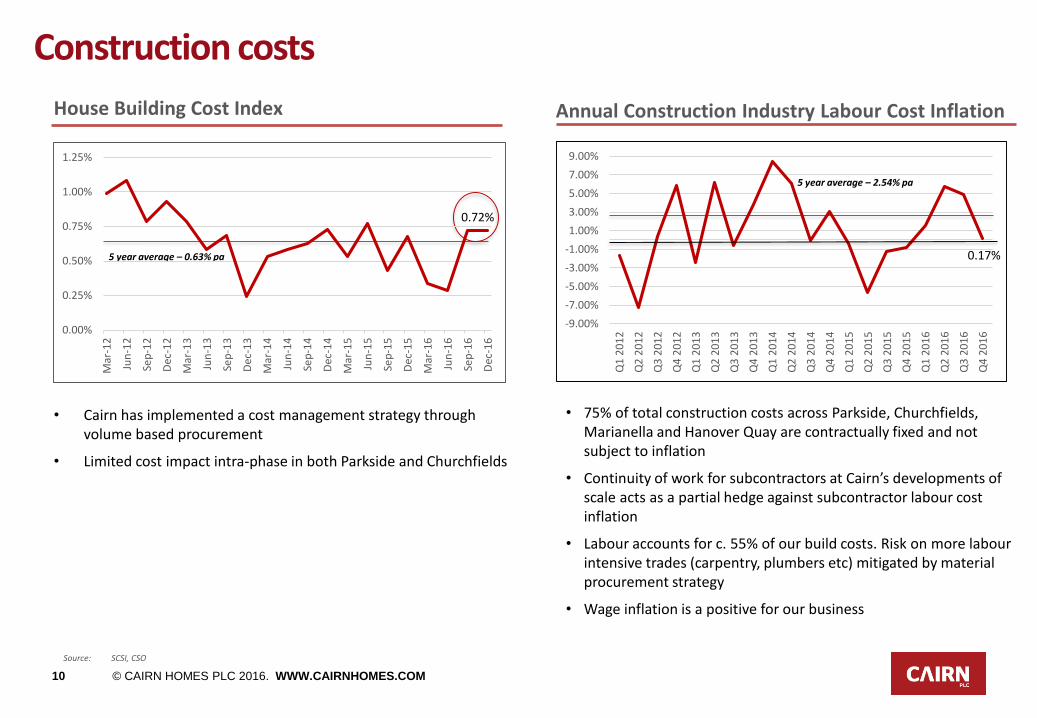
Construction costs
Source: SCSI, CSO
-9.00%
-7.00%
-5.00%
-3.00%
-1.00%
1.00%
3.00%
5.00%
7.00%
9.00%
Q1
20
12
Q2
20
12
Q3
20
12
Q4
20
12
Q1
20
13
Q2
20
13
Q3
20
13
Q4
20
13
Q1
20
14
Q2
20
14
Q3
20
14
Q4
20
14
Q1
20
15
Q2
20
15
Q3
20
15
Q4
20
15
Q1
20
16
Q2
20
16
Q3
20
16
Q4
20
16
House Building Cost Index Annual Construction Industry Labour Cost Inflation
5 year average – 2.54% pa
0.17%
• Cairn has implemented a cost management strategy through volume based procurement
• Limited cost impact intra-phase in both Parkside and Churchfields
• 75% of total construction costs across Parkside, Churchfields, Marianella and Hanover Quay are contractually fixed and not subject to inflation
• Continuity of work for subcontractors at Cairn’s developments of scale acts as a partial hedge against subcontractor labour cost inflation
• Labour accounts for c. 55% of our build costs. Risk on more labour intensive trades (carpentry, plumbers etc) mitigated by material procurement strategy
• Wage inflation is a positive for our business
0.72%
5 year average – 0.63% pa
0.00%
0.25%
0.50%
0.75%
1.00%
1.25%
Mar
-12
Jun
-12
Sep
-12
Dec
-12
Mar
-13
Jun
-13
Sep
-13
Dec
-13
Mar
-14
Jun
-14
Sep
-14
Dec
-14
Mar
-15
Jun
-15
Sep
-15
Dec
-15
Mar
-16
Jun
-16
Sep
-16
Dec
-16

© CAIRN HOMES PLC 2016. WWW.CAIRNHOMES.COM11
20
17
Sales performance
64%
10%
Strong monthly sales trajectory evident
Weekly Sales Cumulative Sales
• The graph reflects cumulative sales from:
- Parkside (launched September 2015);
- Albany (launched May 2016);
- Churchfields (launched October 2016);
- Marianella (pre-sale launch October 2016 – 69 unit sales with a gross sales value of €39.7m)
• 223 unit sales in FY 2016 and 177 unit sales in the year to date
• Average weekly sales run rate of 3.5 units in Q3 2016, 10.0 in Q4 2016 and 19.7 YTD 2017
• Two further selling sites, Glenheron (Greystones) and Shackleton (Adamstown), will be added in Autumn 2017 bringing our total number of selling sites to six
Impact of Marianella launch
-
50
100
150
200
250
300
350
400
-
10
20
30
40
50
60
70
80
90
Monthly Sales Cumulative Sales

© CAIRN HOMES PLC 2016. WWW.CAIRNHOMES.COM12
Construction life cycle of a Cairn home• Efficient operating model delivers new homes in under 20 working weeks on average from laying foundations to customer snag:
Note – excludes timerequired to completesite works andprelims which varyfrom site to sitedepending on thelevel of infrastructureand services required
• New homes are delivered through an efficient sub-contracting housing delivery model – core sites teams (average of 5-7 direct staff)manage a team of sub-contractors who operate under design and fit packages
= 19 weeks
= 17 weeks
Foundations Complete
Brick & Block Complete
Roof Complete and Home sealed
1st Fix Internals Complete
2nd Fix, Internal FFE and Decoration
Total Construction Timeline ahead of Customer Snag and Handover

© CAIRN HOMES PLC 2016. WWW.CAIRNHOMES.COM13
The Cairn brand
• Further strengthening of brand positioning through:
- The high quality of our overall product – the core pillar of our brand proposition;
- Creation of sustainable, vibrant communities, centred around smart design and high quality landscaped environments;
- Innovative approach to managing the customer journey through a dedicated team;
- Looking beyond traditional marketing methods such as on-site ‘Information houses’ – designed to educate buyers on the energy efficiency andbuild quality of our new homes; and
- Harnessing customer feedback to influence design
At the heart of our business

© CAIRN HOMES PLC 2016. WWW.CAIRNHOMES.COM14
20
17
64%
Marianella, Rathgar – 234 units Hanover Quay, Dublin 2 – 122 units
March 2017 – construction on schedule in preparation for formal sales launch in April off Block A show units
On taking possession in late February 2016
March 2017 – basement concrete pour underway
Active sites
March 2016
© CAIRN HOMES PLC 2016. WWW.CAIRNHOMES.COM15
20
17
64%
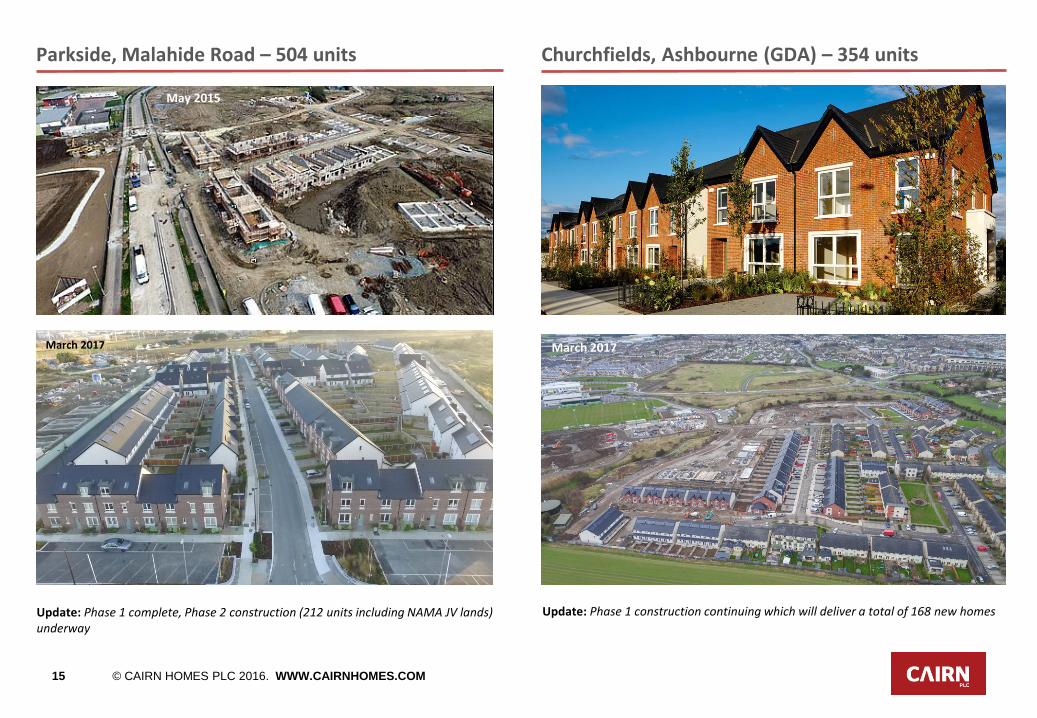
Parkside, Malahide Road – 504 units Churchfields, Ashbourne (GDA) – 354 units
Update: Phase 1 construction continuing which will deliver a total of 168 new homes
May 2015
Update: Phase 1 complete, Phase 2 construction (212 units including NAMA JV lands) underway
March 2017 March 2017
© CAIRN HOMES PLC 2016. WWW.CAIRNHOMES.COM16
20
17
64%
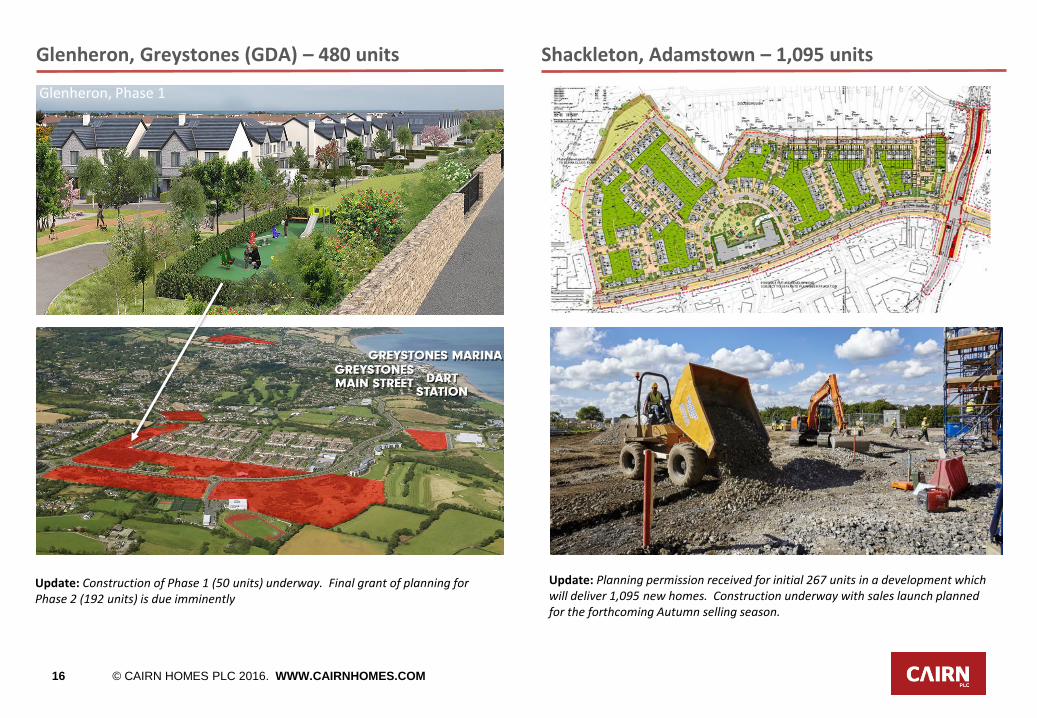
Glenheron, Greystones (GDA) – 480 units Shackleton, Adamstown – 1,095 units
Update: Construction of Phase 1 (50 units) underway. Final grant of planning for Phase 2 (192 units) is due imminently
Glenheron, Phase 1
Update: Planning permission received for initial 267 units in a development which will deliver 1,095 new homes. Construction underway with sales launch planned for the forthcoming Autumn selling season.
© CAIRN HOMES PLC 2016. WWW.CAIRNHOMES.COM17
20
17
64%
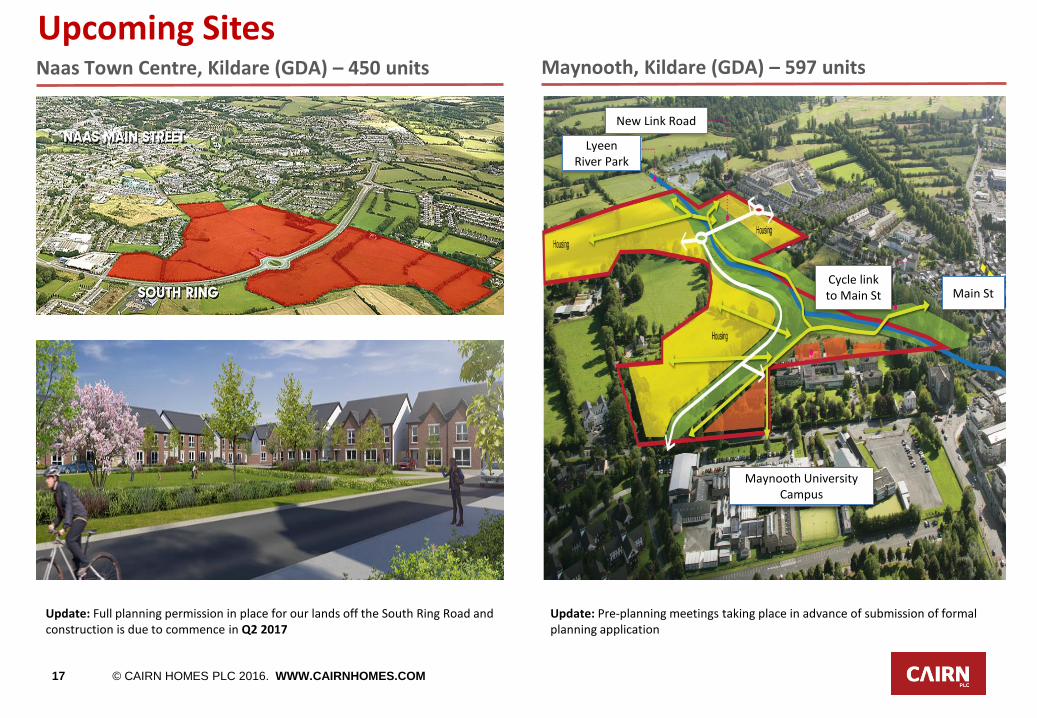
Naas Town Centre, Kildare (GDA) – 450 units Maynooth, Kildare (GDA) – 597 units
Dublin City Centre
Adamstown Train Station
Update: Pre-planning meetings taking place in advance of submission of formal planning application
Upcoming Sites
Update: Full planning permission in place for our lands off the South Ring Road and construction is due to commence in Q2 2017
Maynooth University Campus
New Link Road
Lyeen River Park
Main StCycle link to Main St

© CAIRN HOMES PLC 2016. WWW.CAIRNHOMES.COM18
20
17
64%
Cherrywood, Dublin (SDZ) – 315 units Clonburris, Dublin – 3,000 units
Dublin City Centre
Adamstown Train Station
Update: 692 Ac (280 Ha) SDZ presently under review by SDCC focussing on lower density levels and associated levels of infrastructure. Final adoption of revised SDZ anticipated in Q3 2017
Update: Infrastructure works underway (spine road and public park) in advance of submission of planning application for our 315 units within the overall SDZ
Future Sites

© CAIRN HOMES PLC 2016. WWW.CAIRNHOMES.COM19
Agenda
1. Key Highlights
2. Operations
3. Financials
4. FTBs & Affordability
5. Outlook
6. Appendix

© CAIRN HOMES PLC 2016. WWW.CAIRNHOMES.COM20
Revenue of €40.9m predominantly from the sale of 105
houses (€31.0m), €4.5m from the sale of completed
Project Clear asset sales and €4.2m from site sales
Gross operating profit margin of 17.3%, with an operating
profit of €7.1m
- H2 17.7%, H1 16.5%
Other income of €4.4m mainly comprised of loan related
income and a gain relating to expected payments to third
parties (relating to Project Clear) that are no longer
payable
Admin expenses of €7.8m
Operating profit of €2.3m compares to operating loss of
€34.0m in 2015
Exceptional administrative costs of €1.4m, which
represent transaction costs relating to the Argentum
acquisition
Finance costs mainly represent the interest on the Group’s
€200m senior debt facilities
Financial results: Income Statement
CommentaryIncome statement for 12 months ended 31 December 2016
Before Except Before Except
(all numbers in €'000) Except Items Total Except Items Total
Revenue 40,906 - 40,906 3,717 - 3,717
Cost of Sales (33,844) - (33,844) (3,015) - (3,015)
Gross Profit 7,062 - 7,062 702 - 702
% margin 17.3% 17.3% 18.9% 18.9%
Other Income 4,425 - 4,425 - - -
Admin expenses (7,841) (1,356) (9,197) (4,492) (1,086) (5,578)
Founder Share FV Charge - - - - (29,100) (29,100)
Operating profit/(loss) 3,646 (1,356) 2,290 (3,790) (30,186) (33,976)
Net finance costs (5,105) - (5,105) (1,686) (1,858) (3,544)
Profit/(Loss) before tax (1,459) (1,356) (2,815) (5,476) (32,044) (37,520)
Income tax credit 752 312
Loss for the period (2,063) (37,208)
Basic loss per share (€0.003) (€0.159)
Fully diluted loss per share (€0.003) (€0.159)
For year ended 31-Dec-16 For period ended 31-Dec-15
© CAIRN HOMES PLC 2016. WWW.CAIRNHOMES.COM21
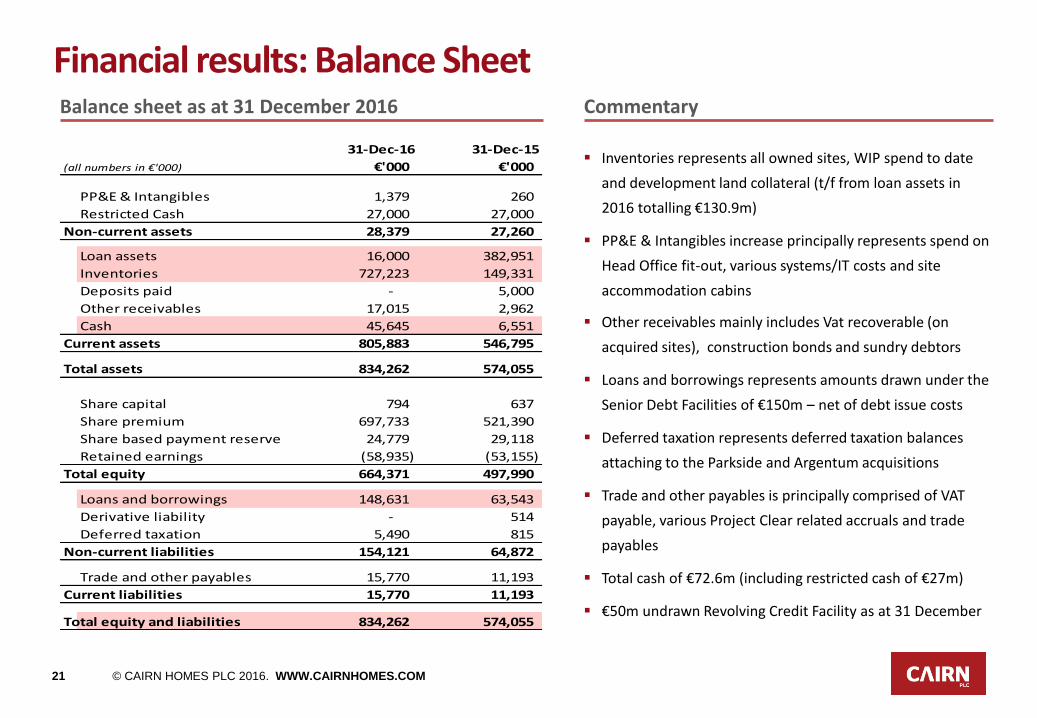
Inventories represents all owned sites, WIP spend to date
and development land collateral (t/f from loan assets in
2016 totalling €130.9m)
PP&E & Intangibles increase principally represents spend on
Head Office fit-out, various systems/IT costs and site
accommodation cabins
Other receivables mainly includes Vat recoverable (on
acquired sites), construction bonds and sundry debtors
Loans and borrowings represents amounts drawn under the
Senior Debt Facilities of €150m – net of debt issue costs
Deferred taxation represents deferred taxation balances
attaching to the Parkside and Argentum acquisitions
Trade and other payables is principally comprised of VAT
payable, various Project Clear related accruals and trade
payables
Total cash of €72.6m (including restricted cash of €27m)
€50m undrawn Revolving Credit Facility as at 31 December
Financial results: Balance SheetBalance sheet as at 31 December 2016 Commentary
31-Dec-16 31-Dec-15
(all numbers in €'000) €'000 €'000
PP&E & Intangibles 1,379 260
Restricted Cash 27,000 27,000
Non-current assets 28,379 27,260
Loan assets 16,000 382,951
Inventories 727,223 149,331
Deposits paid - 5,000
Other receivables 17,015 2,962
Cash 45,645 6,551
Current assets 805,883 546,795
Total assets 834,262 574,055
Share capital 794 637
Share premium 697,733 521,390
Share based payment reserve 24,779 29,118
Retained earnings (58,935) (53,155)
Total equity 664,371 497,990
Loans and borrowings 148,631 63,543
Derivative liability - 514
Deferred taxation 5,490 815
Non-current liabilities 154,121 64,872
Trade and other payables 15,770 11,193
Current liabilities 15,770 11,193
Total equity and liabilities 834,262 574,055
© CAIRN HOMES PLC 2016. WWW.CAIRNHOMES.COM22
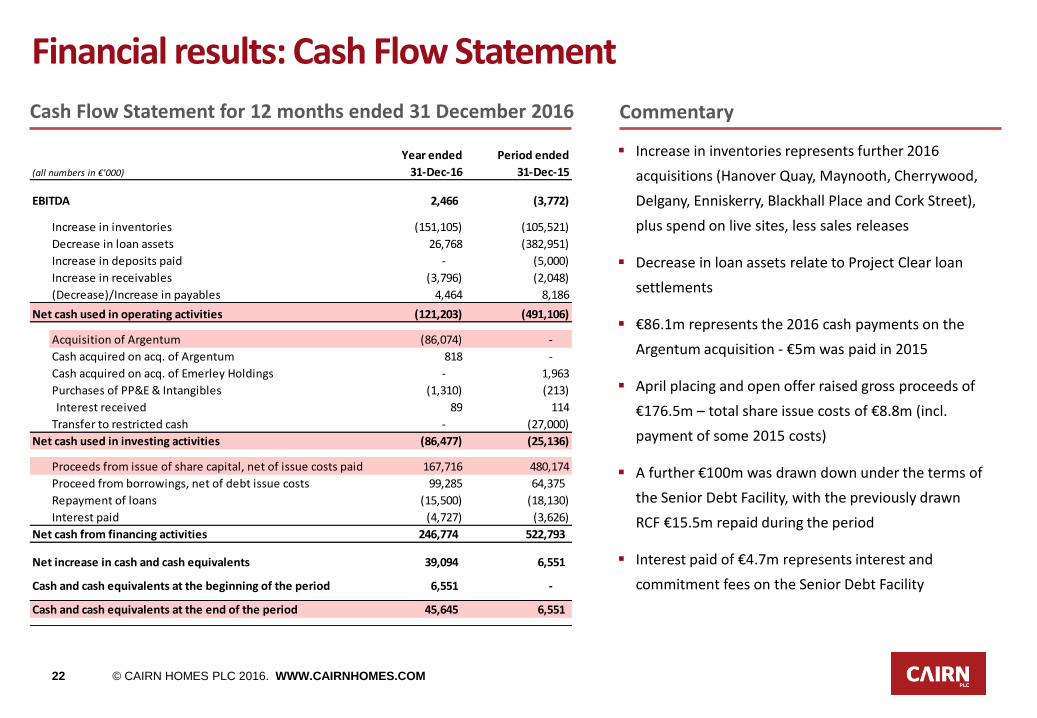
Increase in inventories represents further 2016
acquisitions (Hanover Quay, Maynooth, Cherrywood,
Delgany, Enniskerry, Blackhall Place and Cork Street),
plus spend on live sites, less sales releases
Decrease in loan assets relate to Project Clear loan
settlements
€86.1m represents the 2016 cash payments on the
Argentum acquisition - €5m was paid in 2015
April placing and open offer raised gross proceeds of
€176.5m – total share issue costs of €8.8m (incl.
payment of some 2015 costs)
A further €100m was drawn down under the terms of
the Senior Debt Facility, with the previously drawn
RCF €15.5m repaid during the period
Interest paid of €4.7m represents interest and
commitment fees on the Senior Debt Facility
Financial results: Cash Flow Statement
CommentaryCash Flow Statement for 12 months ended 31 December 2016
Year ended Period ended
(all numbers in €'000) 31-Dec-16 31-Dec-15
EBITDA 2,466 (3,772)
Increase in inventories (151,105) (105,521)
Decrease in loan assets 26,768 (382,951)
Increase in deposits paid - (5,000)
Increase in receivables (3,796) (2,048)
(Decrease)/Increase in payables 4,464 8,186
Net cash used in operating activities (121,203) (491,106)
Acquisition of Argentum (86,074) -
Cash acquired on acq. of Argentum 818 -
Cash acquired on acq. of Emerley Holdings - 1,963
Purchases of PP&E & Intangibles (1,310) (213)
Interest received 89 114
Transfer to restricted cash - (27,000)
Net cash used in investing activities (86,477) (25,136)
Proceeds from issue of share capital, net of issue costs paid 167,716 480,174
Proceed from borrowings, net of debt issue costs 99,285 64,375
Repayment of loans (15,500) (18,130)
Interest paid (4,727) (3,626)
Net cash from financing activities 246,774 522,793
Net increase in cash and cash equivalents 39,094 6,551
Cash and cash equivalents at the beginning of the period 6,551 -
Cash and cash equivalents at the end of the period 45,645 6,551
© CAIRN HOMES PLC 2016. WWW.CAIRNHOMES.COM23
Agenda
1. Key Highlights
2. Operations
3. Financials
4. FTBs & Affordability
5. Outlook
6. Appendix

© CAIRN HOMES PLC 2016. WWW.CAIRNHOMES.COM24
Supply side measures delivering mortgage-backed FTBs • The loosening of the CBI mortgage rules (now 90% LTV unlimited) and the launch of the Help to Buy income tax rebate scheme (capped
at €20,000) have materially reduced FTB deposit requirements:
Source: CBI, Revenue.ie, BPFI, Department of Housing, Planning, Community and Local Government
€0
€10,000
€20,000
€30,000
€40,000
€50,000
€60,000
€70,000
€80,000
€250,000 Home
€300,000 Home
€350,000 Home
€400,000 Home
€450,000 Home
€500,000 Home
Old Deposit (pre-July 2016) Current Deposit (CBI + HTB) (2017)
55%61%
64%
62%
66%
63%
• The CBI and Help to Buy measures have converted prospective FTBs into more immediate mortgage-backed FTBs (mortgage approvals by value + 53% YoY to January 2017 driven by FTBs + 77%)
• Dublin requires 10,000 new residential units per annum against just 4,234 completions in 2016:
• The number of newly constructed homes in multi-unit developments in 2016 is estimated at below 2,500 (as per Property Price Register registrations)
Significantly reduced timeframe for FTBs home ownership is driving supply
3 year completions = 1 year demand
2014 2015 2016 Total Demand Shortfall
New Home Completions 3,268 2,891 4,234 10,393 10,000 (5,766)
2016

© CAIRN HOMES PLC 2016. WWW.CAIRNHOMES.COM25
Source: Daft.ie 2016 Q4 Rental Report Mortgages.ie Mortgage Calculator – Mortgage Cost €4.95 cost per €’000
Home ownership is more affordable than rentingUnder-supply driving rental growth
Under-supply of housing has resulted in significant growth in rental prices with over 51% growth nationally since 2012
Rents in Dublin are now 14% above 2008 peak, up 15% YoY to December 2016 and up almost 65% from their lowest point in 2010
Fewer than 4,000 units for rent in Ireland at the start of February 2017 (and 1,600 units in Dublin equating to < 2 weeks supply) – down from
24,000 in 2009
At the starter home end of the Dublin market, the cost of renting an average 3 bed house in Dublin is now 35% more expensive than
servicing a mortgage on the same unit while it is 37% more expensive to rent a 2 bed apartment (assuming 90% first time buyer LTV, 3.60%
variable interest rate on a fully amortising 30 year term):
Rent + 37%Rent + 35%
€1,091
€1,496
€1,293
€1,740
Note – assumes €270,000 purchase price for a 2 bed apartment and €320,000 purchase price for a 3 bed home

© CAIRN HOMES PLC 2016. WWW.CAIRNHOMES.COM26
Source: CSO, BPFI, CBI
Other affordability drivers• Unemployment down to 6.6% in February 2016
Yo
Y e
arn
ings
gro
wth
(%
)
2013 2014 2015 2016f 2017f 2018F
• Upward trend in earnings growth
4.12%
3.40%
Peak – 15.2%
4.0%
6.0%
8.0%
10.0%
12.0%
14.0%
16.0%
1700
1800
1900
2000
2100
2200
Employment Unemployment Rate
3.80%
3.27%
(‘000)
€m # Loans
• Mortgage drawdowns strengthening • Mortgage rates reducing
+213,000
© CAIRN HOMES PLC 2016. WWW.CAIRNHOMES.COM27
Agenda
1. Key Highlights
2. Operations
3. Financials
4. FTBs & Affordability
5. Outlook
6. Appendix

© CAIRN HOMES PLC 2016. WWW.CAIRNHOMES.COM28
Outlook
Cash flow positive in Q4 2017
Overall economic, regulatory and political environment continues to improve in Ireland
Active on seven sites with three more site commencements before the year-end
Pent up demand for good quality homes in attractive locations
Strong sales momentum - forward bookings continues to strengthen and underpins confidence in targets
Mortgage market conditions continuing to improve
Scalable business model – ability to immediately respond to market demand
Further strong progress in 2017

© CAIRN HOMES PLC 2016. WWW.CAIRNHOMES.COM29
Agenda
1. Key Highlights
2. Operations
3. Financials
4. FTBs & Affordability
5. Outlook
6. Appendix
© CAIRN HOMES PLC 2016. WWW.CAIRNHOMES.COM30
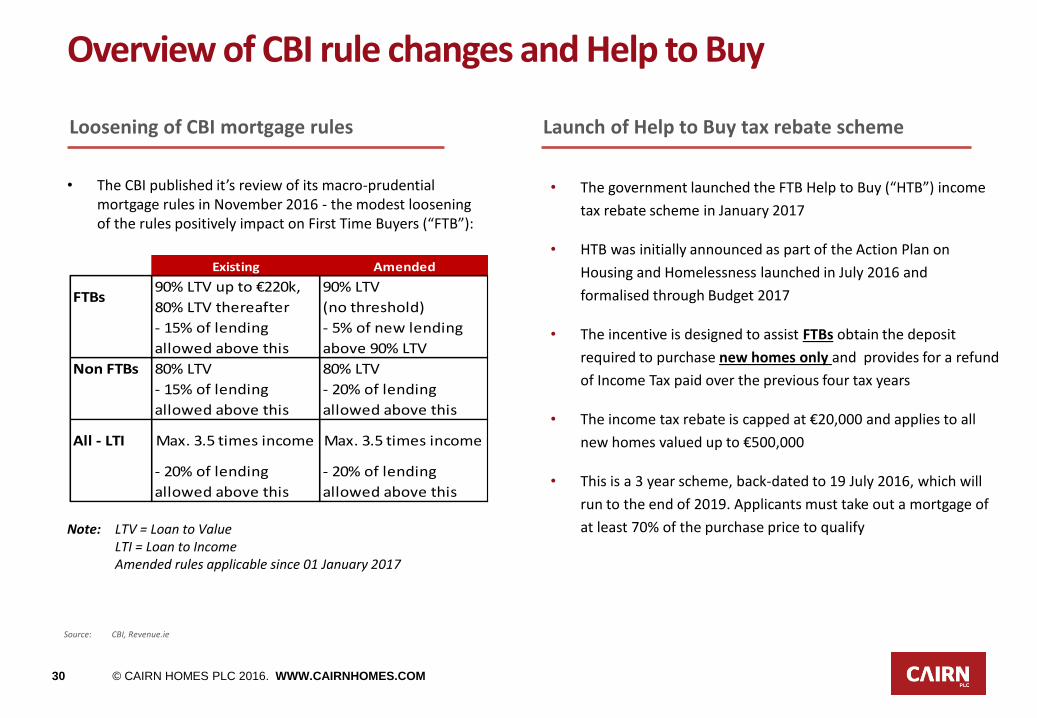
Overview of CBI rule changes and Help to Buy
• The CBI published it’s review of its macro-prudential mortgage rules in November 2016 - the modest loosening of the rules positively impact on First Time Buyers (“FTB”):
Note: LTV = Loan to ValueLTI = Loan to IncomeAmended rules applicable since 01 January 2017
Existing Amended
FTBs90% LTV up to €220k,
80% LTV thereafter
90% LTV
(no threshold)
- 15% of lending
allowed above this
- 5% of new lending
above 90% LTV
Non FTBs 80% LTV 80% LTV
- 15% of lending
allowed above this
- 20% of lending
allowed above this
All - LTI Max. 3.5 times income Max. 3.5 times income
- 20% of lending
allowed above this
- 20% of lending
allowed above this
• The government launched the FTB Help to Buy (“HTB”) income
tax rebate scheme in January 2017
• HTB was initially announced as part of the Action Plan on
Housing and Homelessness launched in July 2016 and
formalised through Budget 2017
• The incentive is designed to assist FTBs obtain the deposit
required to purchase new homes only and provides for a refund
of Income Tax paid over the previous four tax years
• The income tax rebate is capped at €20,000 and applies to all
new homes valued up to €500,000
• This is a 3 year scheme, back-dated to 19 July 2016, which will
run to the end of 2019. Applicants must take out a mortgage of
at least 70% of the purchase price to qualify
Launch of Help to Buy tax rebate schemeLoosening of CBI mortgage rules
Source: CBI, Revenue.ie
© CAIRN HOMES PLC 2016. WWW.CAIRNHOMES.COM31
Source: CSO Census 2016 (Preliminary) and Regional Population Projections 2016-2031, Markit Manufacturing PMI December 2016, CBRE
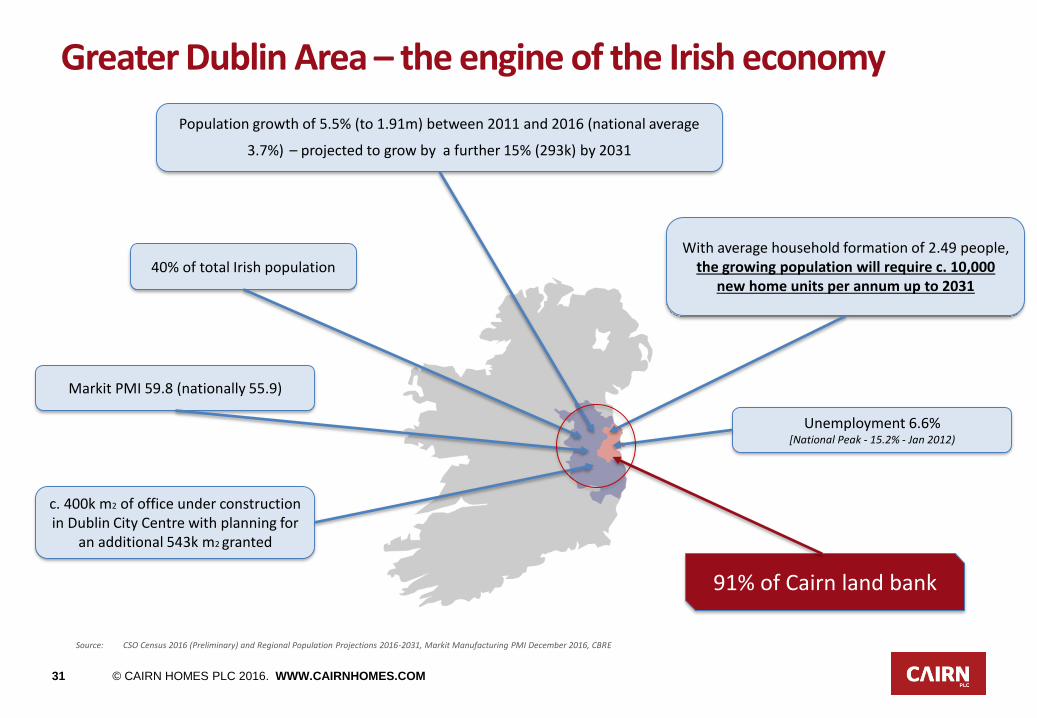
Greater Dublin Area – the engine of the Irish economy
Population growth of 5.5% (to 1.91m) between 2011 and 2016 (national average
3.7%) – projected to grow by a further 15% (293k) by 2031
40% of total Irish populationWith average household formation of 2.49 people,
the growing population will require c. 10,000 new home units per annum up to 2031
Unemployment 6.6%[National Peak - 15.2% - Jan 2012)
c. 400k m2 of office under construction in Dublin City Centre with planning for
an additional 543k m2 granted
Markit PMI 59.8 (nationally 55.9)
91% of Cairn land bank

© CAIRN HOMES PLC 2016. WWW.CAIRNHOMES.COM32
Supply Shortfall
Dublin residential price recovery v’s rental price recovery
Av. House Price € Av. Rental Price €
Source: CSO, Daft.ieNote: Average rental price for Dublin is calculated as the average price quoted for each of the six listed Dublin districts in the Daft.ie quarterly rental report Q1 2006 – Q4 2016 inclusive.
32% below 2007 peak
6% above 2007 peak

© CAIRN HOMES PLC 2016. WWW.CAIRNHOMES.COM33
0
10,000
20,000
30,000
40,000
50,000
60,000
70,000
80,000
'70 '75 '80 '85 '90 '95 '00 '05 '10
Co
mp
leti
on
s
Cork Galway Meath Kildare Other
0
4,000
8,000
12,000
16,000
20,000
'70 '75 '80 '85 '90 '95 '00 '05 '10 '15
Co
mp
leti
on
s
Source: Department of Housing, Planning, Community and Local Government.Note: Total house completions based on the number of new dwellings connected by ESB Networks to the electricity supply. Dublin includes Laoghaire-Rathdown, Fingal and South Dublin County Councils and Dublin City Council. Cork and
Galway include County and City councils. Data up to and including Q4 2016
(1) Medium term housing demand 2016-2021 (estimated), Goodbody (Irish Property, September 2014).
11,000
8,000
Medium term housing demand(1)
Medium term housing demand(1)17,000
14,000
Rest of Ireland Dublin
Demand continues to significantly exceed supply
2016 completions 10,698 are + 923 (9.4%) on 2015 levels 2016 completions 4,234 are +1,343 on 2015 levels
Completions are significantly below medium term demand in Dublin and the Rest of Ireland. While the Dublin market recovery more pronounced, 2016 output was still significantly behind medium term housing demand levels

© CAIRN HOMES PLC 2016. WWW.CAIRNHOMES.COM34
A sustainable house-building economy…..
Housing Completions v Economy
As outlined in the tables below, the Irish housebuilding sector built and sold an average of 23,871 units per annum in the pre-Celtic Tiger 20 year period to 1995. To put this into context, the Irish economy is now over 3 times larger and employment has increased by
60% since 1995, yet 2016 housing completions of 14,932 units are only 63% of the 1975-1995 average annual output.
Source: Goodbody, CSO, Department of Housing, Planning , Community and Local Government
1975-1995 Estimate
House Completions 1975 1985 1995 Average Current
ROI 19,103 17,164 21,752 17,222 10,698
Dublin 7,789 6,784 8,823 6,649 4,234
Total 26,892 23,948 30,575 23,871 14,932
Economy 1975 1985 1995 Now
Employment ('000) 1,084 1,097 1,282 2,048
GNP (Real - €bn) 43.9 52.9 77.1 252.0
Interest Rates 11.3% 13.0% 7.0% 3.6%