Embed Size (px)
Citation preview
CALCULATION METHODS OF X-RAY SPECTRA:A COMPARATIVE STUDY
B. Chyba, M. Mantler, H. Ebel, R. SvageraTechnische Universit��������Vienna, Austria
ABSTRACT
The accurate characterization of the spectral distribution of x-rays emitted from X-ray tubes iscrucial in many analytical investigations. This includes the primary production of radiationwithin the tube target as well as absorption by the tube window and eventually applied filters.This paper discusses two calculation methods for tube spectra: an analytical program based onalgorithms by H. Ebel and the MCNP software package based on Monte-Carlo code. Thecalculated data were also compared to measured spectra generated on a SEM with Au and Cutargets at voltages from 10kV to 30kV.
INTRODUCTION
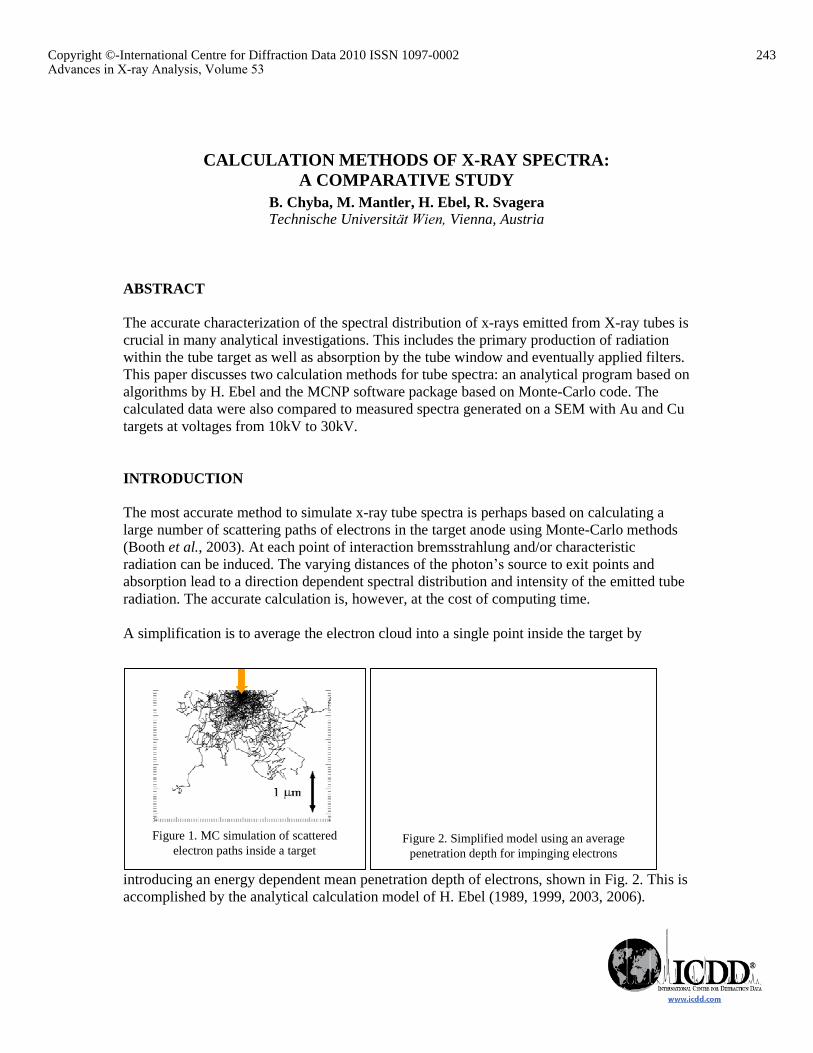
The most accurate method to simulate x-ray tube spectra is perhaps based on calculating alarge number of scattering paths of electrons in the target anode using Monte-Carlo methods(Booth et al., 2003). At each point of interaction bremsstrahlung and/or characteristicradiation can be induced. The varying distances of the photon���source to exit points andabsorption lead to a direction dependent spectral distribution and intensity of the emitted tuberadiation. The accurate calculation is, however, at the cost of computing time.
A simplification is to average the electron cloud into a single point inside the target by
introducing an energy dependent mean penetration depth of electrons, shown in Fig. 2. This isaccomplished by the analytical calculation model of H. Ebel (1989, 1999, 2003, 2006).
Figure 1. MC simulation of scatteredelectron paths inside a target
Figure 2. Simplified model using an averagepenetration depth for impinging electrons
243Copyright ©-International Centre for Diffraction Data 2010 ISSN 1097-0002Advances in X-ray Analysis, Volume 53
This document was presented at the Denver X-ray Conference (DXC) on Applications of X-ray Analysis. Sponsored by the International Centre for Diffraction Data (ICDD). This document is provided by ICDD in cooperation with the authors and presenters of the DXC for the express purpose of educating the scientific community. All copyrights for the document are retained by ICDD. Usage is restricted for the purposes of education and scientific research. DXC Website – www.dxcicdd.com
ICDD Website - www.icdd.com
Advances in X-ray Analysis, Volume 53
Calculation times are orders of magnitudes shorter than using MC-methods (about 1scompared to 4h), but the model is currently limited to energies up to 50keV; reliableexperimental data for higher energies are extremely rare. Apparently the MC-method is theonly alternative to provide spectra at higher energies up to several hundreds of keV. Such tubevoltages are common in industrial computed tomography and spectral data are required tosupport simulations employed for optimizations and improvement of experimental parameters(Chyba et al., 2008).
A topical example is computed tomography (CT) where the demand for increased imageresolution causes twofold problems: In clinical diagnostics the absorbed dose of the radiationfrom a CT device by the patient may already come to a critical level according torecommended dose limits, which makes the need for dose calculations obvious. On the otherhand, accurate non-destructive material testing in industry based on CT with cone beamgeometry requires detailed mathematical modelling of all interactions of the primary beamwith the analyzed object including scattering and excitation of secondary radiation; such datacan be used for proper interpretation of the measured image as well as for finding optimizedconditions for a measurement.
This paper investigates the applicability and possible limitations of MC-methods. We usedMCNP as well as H.Ebel's analytical model to compute spectra and compared data from bothsources with available experimental data within the matching energy ranges which arehowever limited to 30keV and below. Simulations include also high energy spectra for up to450kV tube voltage.
INSTRUMENTATION
The experimental X-ray spectra shown in this work are from two different target materials(Au, Cu); they are part of the collection used for the development of Ebel's model and havebeen measured on a scanning electron microscope at the Vienna University of Technologywith a Si(Li) detector and electron energies from 10 to 30kV. (Detector model: Edax NewXL-30 135-10 UTW+; detecting unit: PV 9760/69ME; port: back left upper; active area:10mm2; amplifier model: 194)
The same energy dependent detector efficiency that was used by Ebel was applied to the MCdata for comparison of the spectra. It is based on a simple 3 layer absorption model (window,inactive absorbing layer, active crystal).
The software used for the analytical calculations of tube spectra has been developed at theInstitute of Solid State Physics, Vienna University of Technology. It implements the Ebelformula (2006) and uses cross-section and fluorescence data from Cullen et al. (1997).
RESULTS
244Copyright ©-International Centre for Diffraction Data 2010 ISSN 1097-0002Advances in X-ray Analysis, Volume 53
Measured and simulated spectra obtained at 10kV and 30kV for target materials Au and Cuare shown in Fig. 3. While the good agreement between the analytical model and experimenthas already been demonstrated elsewhere (Ebel, 1989, 1999, 2003, 2006) the current interestfocuses on the Monte-Carlo spectra. At higher energies their match with the others isexcellent as well. The differences at low energies are due to the energy cut off at 1keV(affecting all Cu L-lines) and several M-lines (of Au) missing in the database of MCNP.
While the Ebel model is specified to work for energies below 50keV, it was also tried to applythe algorithm to higher energies and compare the result with MCNP. Fig. 4 shows the 100kVspectrum of a W-target as well as the region around the K- and L-absorption edges andemission lines in high magnification. Again good agreement is achieved between bothcomputational methods except for the characteristic lines. MCNP seems to replace the manyindividual L-lines by a few lines summing up their intensities, and omit most or all M-lines.Both programs cut off energies below 1keV.
Figure 3: Comparison of measured and computed x-ray spectra for Au and Cu targets at voltagesof 10 and 30kV; electron beam is perpendicular to target surface, photon takeoff angle is 30�.
245Copyright ©-International Centre for Diffraction Data 2010 ISSN 1097-0002Advances in X-ray Analysis, Volume 53
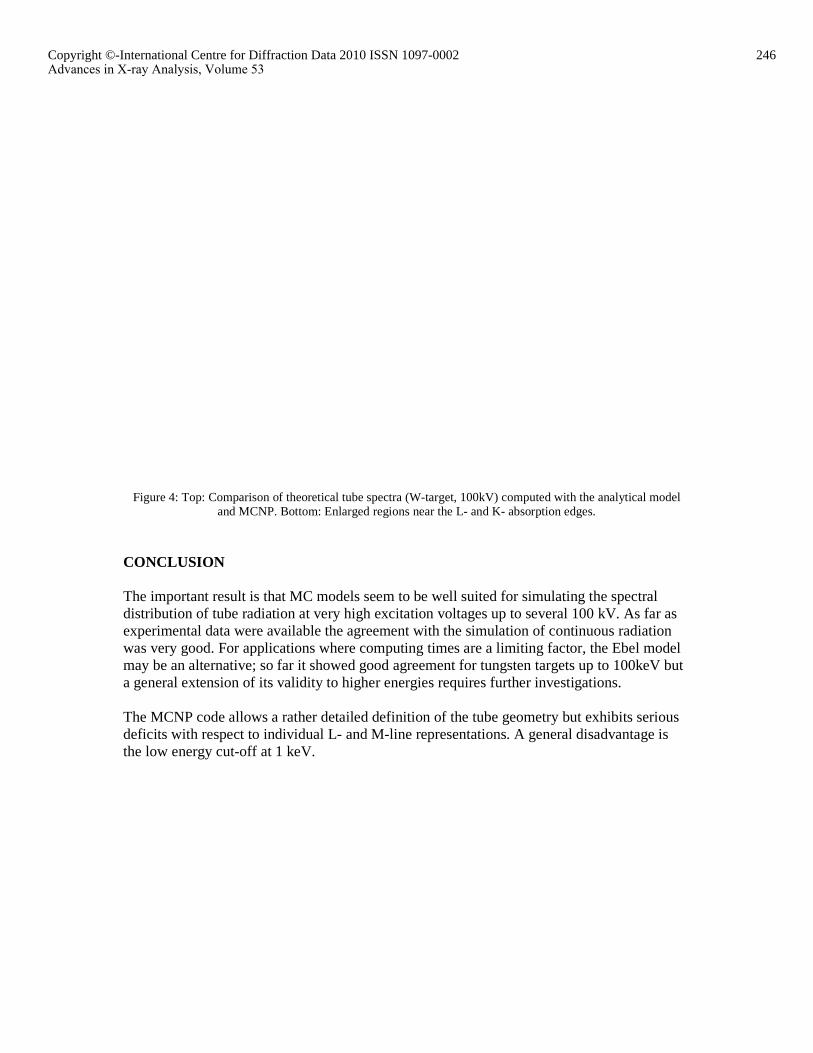
Figure 4: Top: Comparison of theoretical tube spectra (W-target, 100kV) computed with the analytical modeland MCNP. Bottom: Enlarged regions near the L- and K- absorption edges.
CONCLUSION
The important result is that MC models seem to be well suited for simulating the spectraldistribution of tube radiation at very high excitation voltages up to several 100 kV. As far asexperimental data were available the agreement with the simulation of continuous radiationwas very good. For applications where computing times are a limiting factor, the Ebel modelmay be an alternative; so far it showed good agreement for tungsten targets up to 100keV buta general extension of its validity to higher energies requires further investigations.
The MCNP code allows a rather detailed definition of the tube geometry but exhibits seriousdeficits with respect to individual L- and M-line representations. A general disadvantage isthe low energy cut-off at 1 keV.
246Copyright ©-International Centre for Diffraction Data 2010 ISSN 1097-0002Advances in X-ray Analysis, Volume 53
REFERENCES
Booth, T. E., Brown, F. B., Bull, J. S., Forster, R. A., Goorley, J. T., Hughes,H. G., Mosteller, R. D., Prael, R. E., Sood, A., Sweezy, J. E., Zukaitis,A., Marsha Boggs, M., and Roger Martz, R. (2003). MCNP - A generalMonte Carlo N-particle transport code, Report LAUR 03-1987, Los AlamosNational Laboratory, Los Alamos, NM.
Chyba, B., Mantler, M., Reiter, M. (2008). �Monte-Carlo Simulation of Projections inComputed Tomography�, Powder Diffraction 23 (2), 150-153
Cullen, D. E., Hubbel, J. H. , Kissel, L. D. (1997): EPDL97: The Evaluated Photon DataLibrary, '97 Version, Report UCRL-50400, Vol. 6, Rev. 5, Lawrence Livermore NationalLaboratory, Livermore, CA
Ebel, H., Ebel, M.F., Wernisch, J., Poehn, Ch., Wiederschwinger, H. (1989). �������� ��of continuous and characteristic tube spectra for fundamental parameter analysis�, X-RaySpectrom. 18, 89-100
Ebel, H. (1999). �X-ray tube spectra�� X-Ray Spectrom. 27, 255-266
Ebel, H. (2003). X-Ray Spectrom. 32, 46-51
Ebel, H. (2006). �Fundamental Parameter Programs: Algorithms for the Description of K, Land M Spectra of X-ray Tubes�, Adv. X-Ray Anal. 49, 267-273
ACKNOWLEDGEMENTThis work was supported by the ������� ��� ������� ���������������������� ���������project 812136-SCK/KUG.
Correspondence:
Michael MantlerVienna University of TechnologyWiedner Hauptstrasse 8-10/138A 1040 Vienna, Austria
Phone (43-1) 58801-13761Fax: (43-1) 58801-13799Email: [email protected]
247Copyright ©-International Centre for Diffraction Data 2010 ISSN 1097-0002Advances in X-ray Analysis, Volume 53