Embed Size (px)
Citation preview
Prepared for: California Energy Commission
Prepared by: National Renewable Energy Laboratory
A l t e r n a t i v e a n d R e n e w a b l e F u e l a n d V e h i c l e T e c h n o l o g y P r o g r a m
F I N A L P R O J E C T R E P O R T
CALIFORNIA STATEWIDE PLUG-IN ELECTRIC VEHICLE INFRASTRUCTURE ASSESSMENT
May 2014
CEC-600-2014-003
Prepared by: Primary Author(s):
Marc Melaina, Ph.D. Michael Helwig, Ph.D.
National Renewable Energy Laboratory 15013 Denver West Parkway Golden, CO 80401 Agreement Number: 600-11-002 Prepared for: California Energy Commission Leslie Baroody Task Manager Jim McKinney Agreement Manager Program Manager John P. Butler II Office Manager Emerging Fuels and Technologies Office Randy Roesser Deputy Director Fuels and Transportation Division Robert P. Oglesby Executive Director
DISCLAIMER
This report was prepared as the result of work sponsored by the California Energy Commission. It does not necessarily represent the views of the Energy Commission, its employees or the State of California. The Energy Commission, the State of California, its employees, contractors and subcontractors make no warrant, express or implied, and assume no legal liability for the information in this report; nor does any party represent that the uses of this information will not infringe upon privately owned rights. This report has not been approved or disapproved by the California Energy Commission nor has the California Energy Commission passed upon the accuracy or adequacy of the information in this report.
i
FUNDING STATEMENT
The National Renewable Energy Laboratory 15013 Denver West Parkway, Golden, CO, 80401, is a national laboratory of the U.S. Department of Energy (DOE) managed by the Alliance for Sustainable Energy, LLC, under Contract Number DE-AC36-08GO28308. This report was prepared as an account of work sponsored by the California Energy Commission and pursuant to a management and operating (M&O) contract with the U.S. DOE. Neither the Alliance for Sustainable Energy, LLC, the U.S. DOE, the Energy Commission, nor any of their employees, contractors, or subcontractors makes any warranty, express or implied, or assume any legal liability or responsibility for the accuracy, completeness, or usefulness of any information, apparatus, product, or process disclosed or represents that use of this report would not infringe upon privately owned rights. Reference herein to any specific commercial product, process, or service by trade name, trademark, manufacturer, or otherwise does not necessarily constitute or imply its endorsement, recommendation, or favoring by Alliance for Sustainable Energy, LLC, the DOE, or the Energy Commission. The views and opinions of authors expressed herein do not necessarily state or reflect those of Alliance for Sustainable Energy, LLC, the DOE, or the Energy Commission, or any of their employees, or the United States Government, or any agency thereof, or the State of California. This report has not been approved or disapproved by Alliance for Sustainable Energy, LLC, the DOE, or the Energy Commission, nor has Alliance for Sustainable Energy, LLC, the DOE or the Energy Commission passed upon the accuracy or adequacy of the information in this report.
ii
ACKNOWLEDGEMENTS
The authors are very grateful for the opportunity to support the California Energy Commission’s efforts in developing the California Statewide Plug-In Electric Vehicle Infrastructure Assessment. In particular, they’d like to acknowledge Jim McKinney as leader for the Energy Commission’s work for the Alternative Renewable Fuel and Vehicle Technology Program and Leslie Baroody as task manager for the Energy Commission. Leslie’s contributions as document reviewer, reference source provider, workshop planner, and editor were invaluable.
Statewide PEV Infrastructure Plan Stakeholder Workshop
Feedback from the Statewide Plug-In Electric Vehicle (PEV) Infrastructure Plan Stakeholder Workshop was most useful in developing this document. The National Renewable Energy Laboratory would like to thank workshop presenters Leslie Baroody (Energy Commission), Wade Crowfoot and Randall Winston (Governor’s Office), Christine Kehoe (Plug-In Electric Vehicle Collaborative), and Audrey Lee (California Public Utilities Commission); the Infrastructure Models Panel consisting of J.R. DeShazo (University of California, Los Angeles), Tim Brown (University of California, Irvine), Tom Turrentine (University of California, Davis) and Marcus Alexander (Electric Power Research Institute); and breakout session facilitators and technical advisors not already mentioned, including David Almeida (California Center for Sustainable Energy), David Nichols (Energy Commission), Joshua Cunningham (California Air Resources Board), Marcia Smith (Energy Commission), Jennifer Allen (Energy Commission), and Jean Baronas (Energy Commission). Lindsee Tanimoto (Energy Commission) also played a key role in planning and organizing the workshop, as well as Jared Cacho (Energy Commission) and others from the Emerging Fuels and Technologies Office. Workshop attendees and stakeholders provided many comments and suggestions during breakout sessions that were useful in developing this assessment.
Statewide PEV Infrastructure Assessment Reviewers
This document underwent many revisions and improvements prior to publication, thanks to subject matter expert inputs, including those from Tim Brown (University of California, Irvine), Michael Nicholas and Gil Tal (University of California, Davis), Jim Zoellick (Humboldt State University), J.R. DeShazo (University of California, Los Angeles), and Mark Alexander (Electric Power Research Institute).
Authors of Sources Cited
There are more than 60 sources cited as references in this document – many of them providing outstanding examples of PEV infrastructure planning methods, tools, and suggestions for electric vehicle supply equipment siting and PEV policies and strategies. The authors acknowledge that these references laid the groundwork for this assessment, and it is likely that future revisions and updates will continue to rely on the outstanding research of authors like those cited in this document.

iii
PREFACE
Assembly Bill 118 (Núñez, Chapter 750, Statutes of 2007) created the Alternative and Renewable Fuel and Vehicle Technology Program (ARFVT Program). The statute, subsequently amended by Assembly Bill 109 (Núñez, Chapter 313, Statutes of 2008), authorizes the California Energy Commission to develop and deploy alternative and renewable fuels and advanced transportation technologies to help attain the state’s climate change policies. Recently signed Assembly Bill 8 (Perea, Chapter 401, Statutes of 2013) extends the expiration date of the ARFVT Program to January 1, 2024. The Energy Commission has an annual program budget of about $100 million and provides financial support for projects that:
• Develop and improve alternative and renewable low-carbon fuels. • Enhance alternative and renewable fuels for existing and developing engine
technologies. • Produce alternative and renewable low-carbon fuels in California. • Decrease, on a full-fuel-cycle basis, the overall impact and carbon footprint of
alternative and renewable fuels and increase sustainability. • Expand fuel infrastructure, fueling stations, and equipment. • Improve light-, medium-, and heavy-duty vehicle technologies. • Retrofit medium- and heavy-duty on-road and nonroad vehicle fleets. • Expand infrastructure connected with existing fleets, public transit, and
transportation corridors. • Establish workforce training programs, conduct public education and promotion,
and create technology centers.
The Energy Commission has contracted with the National Renewable Energy Laboratory through Agreement 600-11-002, issued on September 13, 2012, to assist with analysis and implementation of specific ARFVT topics, including electric vehicle supply equipment infrastructure planning.
iv
ABSTRACT
The California Statewide Plug-In Electric Vehicle Infrastructure Assessment conveys to interested parties the Energy Commission’s conclusions, recommendations, and intentions with respect to plug-in electric vehicle (PEV) infrastructure development. There are several relatively low-risk and high-priority electric vehicle supply equipment (EVSE) deployment options that will encourage PEV sales and increase electric miles (e-miles) driven by PEVs. These include homes where PEVs exist; workplaces and multiunit dwellings where management has indicated support for PEVs and surveys indicate a high likelihood of use of charging infrastructure; garaged fleets with significant numbers of PEVs; and airports and locations near public transportation, provided certain conditions are met. Corridor charging, destination charging, and workplace or multiunit dwelling locations without management support and/or conclusive surveys are also being pursued and will prove valuable for future PEV market growth. Corridor and remote destination charging options can help increase driver range confidence and electric miles driven, though their relative importance is difficult to assess compared to other EVSE deployment options. Priorities may be shifted or refined over time as the market evolves and new data become available.
This Assessment introduces two scenarios that provide a basis for projecting future statewide charging infrastructure deployment needed to support 1 million PEVs by 2020. At this stage of market development, it is too early to prescribe detailed plans for infrastructure deployment, however, it is possible to outline a range of infrastructure expansion scenarios based on various market conditions.
There is a strong need for both additional data and more sophisticated analytical tools to prioritize charging locations that will prove essential to an integrated statewide infrastructure. The Energy Commission intends to update this assessment as PEV deployment accelerates in the coming years. As PEV adoption continues, and consumer behavior and technology trends are better understood, the assessment framework will evolve into an actionable plan to guide Energy Commission statewide support, regional planning, and other stakeholder actions.
Keywords: California Energy Commission, plug-in electric vehicle (PEV), electric vehicle supply equipment (EVSE), charging infrastructure, charging priorities, PEV infrastructure assessment, California PEV
Please use the following citation for this report:
Melaina, Marc, Michael Helwig. (National Renewable Energy Laboratory). 2014. California Statewide Plug-In Electric Vehicle Infrastructure Assessment. California Energy Commission. Publication Number: CEC-600-2014-003.
v
TABLE OF CONTENTS FUNDING STATEMENT ......................................................................................................................... i
ACKNOWLEDGEMENTS ..................................................................................................................... ii
PREFACE .................................................................................................................................................. iii
ABSTRACT .............................................................................................................................................. iv
TABLE OF CONTENTS ........................................................................................................................... v
LIST OF FIGURES ................................................................................................................................ viii
LIST OF TABLES ...................................................................................................................................... x
EXECUTIVE SUMMARY ........................................................................................................................ 1
CHAPTER 1: Introduction ...................................................................................................................... 7
CHAPTER 2: Background ....................................................................................................................... 9
Purpose of This Document ................................................................................................................... 9
PEV Growth Potential ......................................................................................................................... 10
CHAPTER 3: Infrastructure Expansion Scenarios ........................................................................... 15
Summary of Goals and Milestones .................................................................................................... 15
EVSE Infrastructure Expansion Scenarios ........................................................................................ 22
Home Charging Assumptions ....................................................................................................... 27
Public Charging Assumptions ....................................................................................................... 30
Workplace Charging Assumptions ............................................................................................... 33
Tracking Market Trends to Improve Future Planning ................................................................... 34
CHAPTER 4: The Energy Commission’s Conclusions, Recommendations, and Intentions ... 40
EVSE Siting and Infrastructure .......................................................................................................... 41
First Step ............................................................................................................................................ 41
Anticipated EVSE Use ..................................................................................................................... 41
Charging Locations .......................................................................................................................... 43
Fast Charging .................................................................................................................................... 45
PEV Signs .......................................................................................................................................... 46
EVSE Standards ................................................................................................................................ 47

vi
Technical Challenges and Opportunities ..................................................................................... 47
Charging at Airports and Near Public Transportation ............................................................... 48
Wireless Charging ............................................................................................................................ 49
Charging Etiquette ........................................................................................................................... 50
Medium- and Heavy-Duty ZEVs................................................................................................... 51
Summary ........................................................................................................................................... 52
Policy ...................................................................................................................................................... 55
Fiscal Support ................................................................................................................................... 56
Data ........................................................................................................................................................ 56
Interaction and Facilitation ................................................................................................................. 58
CHAPTER 5: Selected Sources Used in Developing the Statewide PEV Infrastructure Assessment ................................................................................................................................................ 60
Regional Plans ...................................................................................................................................... 60
Bay Area and Monterey Bay Area Plan ........................................................................................ 60
Ventura, Santa Barbara, and San Luis Obispo Counties Plan ................................................... 61
Southern California Plan ................................................................................................................. 61
Sacramento Regional Assessment ................................................................................................. 62
San Diego Regional Plan ................................................................................................................. 62
San Joaquin Valley Plan .................................................................................................................. 63
ZEV Research and Data Needs Workshops (and Seven Associated Papers) .............................. 63
Statewide PEV Infrastructure Plan Stakeholder Workshop .......................................................... 64
U.S. Department of Energy ................................................................................................................. 66
Selected Publications ........................................................................................................................... 68
Current and Future Initiatives ........................................................................................................... 68
Regional Coordination Meetings ................................................................................................... 69
ZEV Community Readiness Guidebook ....................................................................................... 69
GLOSSARY .............................................................................................................................................. 70
APPENDIX A: Excerpts From Statewide PEV Infrastructure Plan Stakeholder Workshop .... 73
vii
APPENDIX B: Technical Excursion – Demand Charge Management and Mitigation ............. 83
APPENDIX C: Technical Excursion – Electrified Roadways ......................................................... 85
APPENDIX D: Selected Energy Commission-Supported Research Efforts ............................... 87
Previous and Ongoing Research Efforts ........................................................................................... 87
Upcoming Research Efforts ................................................................................................................ 89
APPENDIX E: Interoperability of Electric Vehicle Supply Equipment ..................................... 90
Stakeholder Panel I Questions ........................................................................................................... 91
Stakeholder Panel II Questions .......................................................................................................... 91
APPENDIX F: EVSE Expansion Scenario Calculations and Data ................................................. 92
Projecting PEV Electricity Demand ................................................................................................... 92
Calculating the Number of EVSE Stations in Each Scenario ......................................................... 95
Peak Charging Demand and Capacity Assumptions ................................................................... 100
Early Adopter Metric ......................................................................................................................... 106
Comparisons with EV Project Data ................................................................................................. 110

viii
LIST OF FIGURES
Figure 1: Fast Charge Stations in California ........................................................................................... 6
Figure 2: PEV/HEV Sales Comparison .................................................................................................. 11
Figure 3: PEV Driver Survey Results .................................................................................................... 12
Figure 4: Comparing Electricity and Gasoline Costs .......................................................................... 13
Figure 5: Energy Commission Awards ................................................................................................. 14
Figure 6: Potential Mix of BEVs, PHEVs, and FCEVs for Meeting the 2025 ZEV Goal ................. 18
Figure 7: Excerpt From Figure 8 Indicating EVSE Scenario Metrics by Region .............................. 20
Figure 8: Number and Location of PEVs and Workplace and Public EVSE Stations by Region .. 21
Figure 9: Market Outcomes Resolving Consumer Demand and EVSE Supplier Benefits ............ 25
Figure 10: Distribution by Scenario of EVSE Electricity by EVSE Type (a) and PEV Type (b) ..... 28
Figure 11: Percentage of Population and Percentage of Early Adopters for All Planning Regions ...................................................................................................................................................... 36
Figure 12: Existing DC Fast Chargers by Source and Planning Region ........................................... 37
Figure 13: Fast Charging and Vehicle Range ....................................................................................... 39
Figure 14: ZEV and PEV Rebates by County and ZIP Code .............................................................. 42
Figure 15: Caltrans-Approved PEV Charging Sign ............................................................................ 47
Figure 16: New LAX PEV Policy ............................................................................................................ 49
Figure 17: PEV Charging Protocol Placard ........................................................................................... 50
Figure 18: PEV Infrastructure Considerations ..................................................................................... 53
Figure 19: Additional PEV Infrastructure Considerations ................................................................. 54
Figure 20: Charging Priorities ................................................................................................................ 54
Figure 21: NREL Mobile Alternative Fueling Station Locator .......................................................... 57
Figure 22: PlugShare EV Charging Station Map ................................................................................. 57
Figure 23: Plug-In Electric Vehicle Resource Center Home Page .................................................... 59
Figure 24: Multiunit Residential Density Example ............................................................................. 62
Figure 25: Excerpt From the San Diego Regional Plan .......................................................................... 63
Figure 26: Photo From Statewide PEV Infrastructure Plan Stakeholder Workshop ...................... 65
ix
Figure 27: President Obama at the Announcement of the EV Everywhere Grand Challenge ..... 66
Figure 28: Excerpt From U.S. DOE’s Alternative Fueling Station Locator ...................................... 67
Figure B-1: Various Demand Charges in California ........................................................................... 83
Figure C-1: Volvo and Alstom Roadway Electrification System ...................................................... 86
Figure E-1: Source for Interoperability Workshop Documents ......................................................... 90
Figure F-1: Potential Mix of New ZEV Sales Meeting the 1.5 Million ZEV Goal by 2025 ............. 94
Figure F-2: Potential Mix of BEVs, PHEVs, and FCEVs for Meeting the 2025 Goal ....................... 94
Figure F-3: Example of Variability in Peak Hourly Demand and Influence of Average kWh per Charging Event on Total Installed EVSE Capacity ............................................................................. 97
Figure F-4: Demand and Capacities for Home Charging ................................................................. 101
Figure F-5: Demand and Capacities for Work Charging .................................................................. 102
Figure F-6: Demand and Capacities for Level 1 and Level 2 Public Charging ............................. 103
Figure F-7: Demand and Capacities for Fast Charge Stations ......................................................... 104
Figure F-8: Average Hourly Demand by Charging Location and Scenario .................................. 105
Figure F-9: Early Adopter Metric (EAM) Results Compared to Percentage of Regional Population ............................................................................................................................................... 109
Figure F-10: Average Miles Driven per Day for Scenario Assumptions and EV Project Data ... 110
Figure F-11: Average Number of Charges per EVSE Charge Point per Day ................................ 111
x
LIST OF TABLES
Table 1: Distribution of Charge Points in 2020 by Scenario and Planning Region (fast charge [FC] values are shown for both charge points and stations) ............................................................... 3
Table 2: 2024 Anticipated Distribution of ZEVs by Region Required To Meet 1 Million ZEVs ..... 4
Table 3: PEV Milestones From the 2013 ZEV Action Plan ..................................................................... 8
Table 4: Distribution of EVSE Charge Points in 2020 by Scenario and Planning Region .............. 16
Table 5: Anticipated Distribution of ZEVs by Region Required To Meet 1 Million ZEVs ............ 19
Table 6: Average PEV Fleet Attributes for 1 Million PEVs in 2024 ................................................... 23
Table 7: Key Assumptions for the Distribution of EVSE Units in Each Expansion Scenario ........ 31
Table 8: EVSE Station Charge Points, Average Charge Events per Day per Charge Point, and Nominal Capacities by EVSE Type and Location ............................................................................... 32
Table F-1: Metrics Used to Determine Number of EVSE Stations as a Function of the Percentage of Daily E-Miles Provided....................................................................................................................... 99
Table F-2: Percentage of PEVs Without Home Charging ................................................................... 99
Table F-3: Early Adopter Metric Components ................................................................................... 108
1
EXECUTIVE SUMMARY
In March 2012, Governor Brown issued Executive Order B-16-2012, directing specific government agencies to establish benchmarks resulting in 1.5 million zero-emission vehicles (ZEVs) on California roadways by 2025. In response to the executive order, the Governor’s Office published the 2013 ZEV Action Plan in February 2013. The 2013 ZEV Action Plan itemizes specific strategies and directives for achieving the executive order goals and identifies lead and supporting state agencies charged with implementing those strategies. The California Energy Commission was identified as lead agency for a variety of initiatives, including development of a statewide plan for PEV infrastructure. For purposes of the executive order and the 2013 ZEV Action Plan, ZEVs include PEVs (plug-in electric vehicles, including pure battery electric vehicles and plug-in hybrid electric vehicles) and FCEVs (fuel cell electric vehicles).
This Assessment introduces two scenarios that provide a basis for projecting future statewide charging infrastructure deployment needed to support 1 million PEVs by 2020. At this stage, it is too early to prescribe detailed plans for infrastructure deployment, however, it is possible to outline a range of infrastructure expansion scenarios based on various market conditions. As new Electric Vehicle Supply Equipment (EVSE) projects continue to be funded and installed, additional empirical and statistical data will be collected to better calibrate planning and market projection models. This need for additional data and experience has been a recurring theme expressed by PEV stakeholders with respect to EVSE planning. The Energy Commission intends to update this assessment as PEV deployment accelerates in the coming years. As PEV adoption continues, and uncertainties about future market and technology trends are reduced, the assessment framework will evolve into an actionable plan to guide Energy Commission statewide support, regional planning, and other stakeholder actions.
This document serves multiple purposes, including articulating the Energy Commission’s conclusions and recommendations regarding PEV infrastructure planning, providing guidance to local communities and regions, contributing to state-level policy, and conveying the Energy Commission’s intentions in supporting public infrastructure plans. This document also conveys (1) stakeholder feedback collected from the PEV Infrastructure Plan Stakeholder Workshop, (2) recommended revisions based upon reviews of earlier draft versions of this document, and (3) discussions with key stakeholders. Other relevant goals and/or action items contained in the 2013 ZEV Action Plan with the Energy Commission identified as the lead are also addressed. A companion document to this report – a ZEV Community Readiness Guidebook – is available online at the Governor’s Office of Planning and Research website.
There are two major goals and milestones associated with this assessment. The first is supporting the 1.5 million ZEV goal, which is targeted at 2025. A second goal, which supports the first, is that California’s ZEV infrastructure will be able to support up to 1 million vehicles by 2020. Other goals and milestones (including infrastructure and related actions) are not addressed after 2020 in the 2013 ZEV Action Plan due to the changing nature of the ZEV market and are not addressed in this report for the same reason. As ZEV market conditions unfold, this assessment and associated Energy Commission support strategies will be updated.

2
Future trends in ZEV markets are highly uncertain, and likely development patterns for corresponding electric vehicle supply equipment (EVSE) infrastructure are even more uncertain. Acknowledging these uncertainties, a scenario approach is adopted to portray a range of hypothetical EVSE infrastructure development trends sufficient to meet the 2020 infrastructure goal. These scenarios are not predictions. Instead, they are intended to serve as a starting point for more in-depth discussions of key issues and market trends. As more market data are collected over time, it is expected that analytic methods will improve to better inform infrastructure plans and decisions.
Charging stations are often referred to as EVSE and are categorized as Level 1 chargers, Level 2 chargers, and fast chargers. Level 1 chargers are generally the least expensive charging option and are the slowest. On the other extreme are fast chargers, which can charge a PEV relatively quickly but are the most expensive. Level 2 and fast charge stations may have more than one charge point, allowing the station to connect to more than one vehicle at a time. To simplify discussion, these three EVSE types are assumed to be installed in one of three locations: at home, at the workplace, and at public locations. The general approach of the scenario method is to estimate total electricity demanded by a fleet of 1 million ZEVs and then to estimate the number and location of EVSE stations and charge points required to provide this electricity. These estimates are made for 11 regions and for two distinct scenarios.
Table 1 breaks out the number of EVSE charge points by region for the two scenarios: a Home Dominant scenario and a High Public Access scenario. The Home Dominant scenario assumes that most PEV charging will occur at home and that workplace charging and public charging support a modest fraction of total electric miles driven, or e-miles. The High Public Access scenario assumes that many future PEV drivers place a high premium on public charging and that stakeholders installing public EVSE units receive significant benefits from installing public EVSE, including revenue from electricity sales and other benefits. The result is that workplace and public charging support a significant fraction of total e-miles. While there are differences in the numbers and types of chargers under both scenarios, home charging is emphasized under both approaches. The High Public Access scenario has 92 percent of the number of home charging units as the Home Dominant scenario, for example. While there is a goal of supporting 1 million ZEVs by 2020, it’s more likely that the time frame for actually achieving 1 million ZEVs is in the 2023—2024 time frame. A reasonable number of ZEVs in each region required to meet this 2024 estimate is provided in Table 2.
Assuming there exists a reasonable estimate of the number and location (by region) of ZEVs required to meet the 2025 1.5 million ZEV goal, and there also exists a reasonable estimate of the number, type, and location of EVSE required by 2020, the Energy Commission intends to monitor infrastructure development and ZEV growth over the next several years. If infrastructure numbers appear to be tracking well but ZEV vehicle growth is lagging, the Energy Commission may consider providing incentives for ZEV acquisitions, including PEVs. Conversely, if ZEV vehicle growth is consistent with estimates but EVSE infrastructure is lagging, the Energy Commission may focus investments more on EVSE.

3
A variety of inputs and sources were used in developing this assessment, including inputs from National Renewable Energy Laboratory staff; the Statewide PEV Infrastructure Plan Stakeholder Workshop; inputs from industry, academic, and other expert stakeholders; the PEV regional plans; and multiple publications, documents, and websites cited throughout this report. Opportunities were provided for interested parties to comment on the proposed outline of this document and on the document itself. Feedback was used to strengthen the document, modify scenario trends, and clarify certain points that were unclear. Moving forward, the Energy Commission welcomes recommendations for improving this assessment and the supporting methodologies, and recognizes that more information in the following areas would help to improve strategies and recommendations in the future:
• Trends in EVSE product and network development and infrastructure growth, and in usage of and demand for Level 1 and Level 2 charging in workplace and public settings
• Trends in usage of and demand for direct current fast charging in all settings
• Customer payment methods used, prices, and associated customer response
Table 1 : Distribution of Charge Points in 2020 by Scenario and Planning Region (fast charge [FC] values are shown for both charge points and stations)
Region & Scenario Home Work Public L1 L2 Total L1 L2 Total L1 L2 FC FC Stns
Home Dominant
Southern California 235,000 168,000 403,000 9,200 37,700 47,000 750 9,300 247 124
Bay Area 126,000 90,000 216,000 5,000 20,200 25,200 400 5,000 133 66
San Joaquin Valley 21,000 15,000 36,000 800 3,400 4,200 70 800 22 11
San Diego 46,000 33,000 79,000 1,800 7,400 9,200 150 1,800 49 24
Capital Area 26,000 19,000 45,000 1,000 4,200 5,200 80 1,000 27 14
Coachella Valley 22,000 16,000 38,000 900 3,600 4,500 70 900 23 12
Central Coast (S.) 15,000 11,000 26,000 600 2,400 3,000 50 600 16 8
Monterey Bay 7,600 5,500 13,100 300 1,200 1,500 20 300 12 6
Central Coast 7,800 5,600 13,300 300 1,200 1,600 20 310 12 6
Upstate 1,800 1,300 3,100 70 290 360 6 70 4 2
North Coast 1,100 800 1,900 40 180 220 4 40 5 2 Total 511,000 365,000 876,000 20,100 82,000 102,000 1,620 20,100 551 275
High Public Access
Southern California 239,000 133,000 372,000 10,600 67,000 77,000 970 21,500 702 351
Bay Area 128,000 72,000 200,000 5,700 36,000 41,000 520 11,500 377 189
San Joaquin Valley 22,000 12,000 34,000 1,000 6,000 7,000 90 1,900 63 32
San Diego 47,000 26,000 73,000 2,100 13,000 15,000 190 4,200 138 69
Capital Area 26,000 15,000 41,000 1,200 7,000 9,000 110 2,400 78 39
Coachella Valley 23,000 13,000 35,000 1,000 6,000 7,000 90 2,000 67 33
Central Coast (S.) 15,000 9,000 24,000 700 4,000 5,000 60 1,400 45 23
Monterey Bay 7,700 4,300 12,100 300 2,000 3,000 30 700 34 17
Central Coast 7,900 4,400 12,300 300 2,200 2,500 30 710 35 17
Upstate 1,800 1,000 2,900 80 510 590 7 160 11 5
North Coast 1,100 600 1,800 50 310 360 5 100 13 7 Total 517,000 289,000 806,200 22,900 144,000 167,000 2,100 46,500 1,550 775
Note: L1: Level 1 charger; L2: Level 2 charger; FC: fast charger Source: NREL analysis.
4
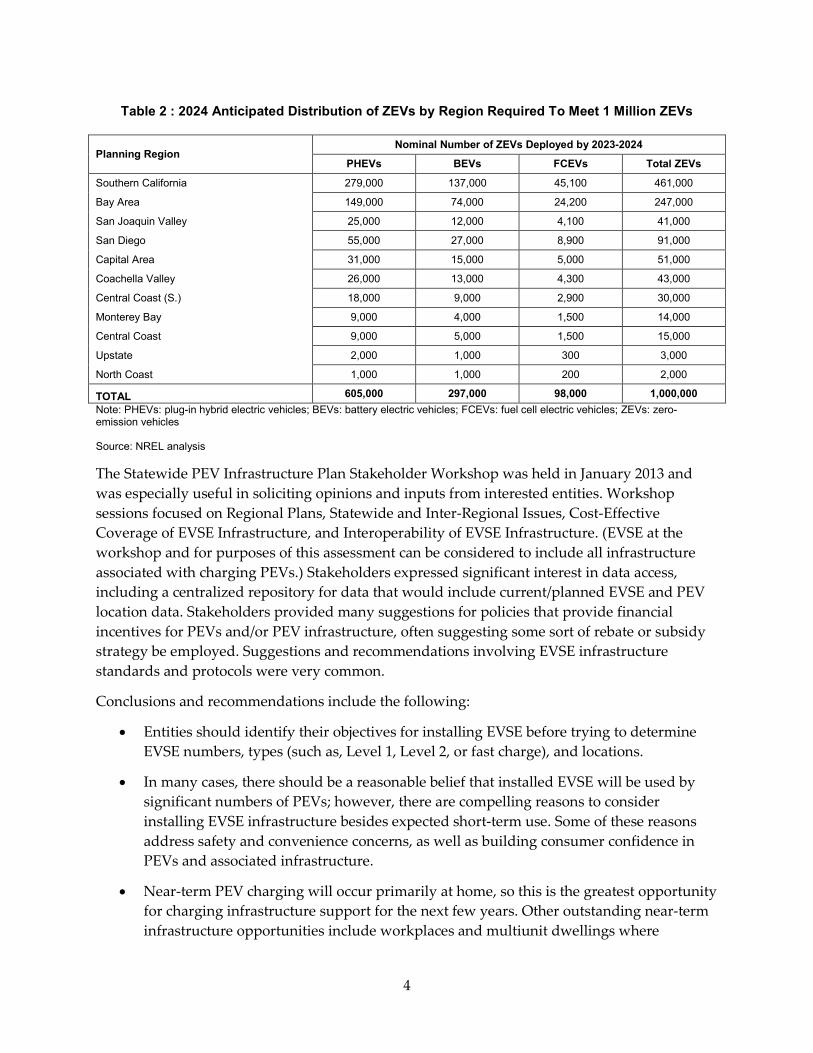
Table 2 : 2024 Anticipated Distribution of ZEVs by Region Required To Meet 1 Million ZEVs
Planning Region Nominal Number of ZEVs Deployed by 2023-2024
PHEVs BEVs FCEVs Total ZEVs
Southern California 279,000 137,000 45,100 461,000
Bay Area 149,000 74,000 24,200 247,000
San Joaquin Valley 25,000 12,000 4,100 41,000
San Diego 55,000 27,000 8,900 91,000
Capital Area 31,000 15,000 5,000 51,000
Coachella Valley 26,000 13,000 4,300 43,000
Central Coast (S.) 18,000 9,000 2,900 30,000
Monterey Bay 9,000 4,000 1,500 14,000
Central Coast 9,000 5,000 1,500 15,000
Upstate 2,000 1,000 300 3,000
North Coast 1,000 1,000 200 2,000
TOTAL 605,000 297,000 98,000 1,000,000 Note: PHEVs: plug-in hybrid electric vehicles; BEVs: battery electric vehicles; FCEVs: fuel cell electric vehicles; ZEVs: zero-emission vehicles Source: NREL analysis
The Statewide PEV Infrastructure Plan Stakeholder Workshop was held in January 2013 and was especially useful in soliciting opinions and inputs from interested entities. Workshop sessions focused on Regional Plans, Statewide and Inter-Regional Issues, Cost-Effective Coverage of EVSE Infrastructure, and Interoperability of EVSE Infrastructure. (EVSE at the workshop and for purposes of this assessment can be considered to include all infrastructure associated with charging PEVs.) Stakeholders expressed significant interest in data access, including a centralized repository for data that would include current/planned EVSE and PEV location data. Stakeholders provided many suggestions for policies that provide financial incentives for PEVs and/or PEV infrastructure, often suggesting some sort of rebate or subsidy strategy be employed. Suggestions and recommendations involving EVSE infrastructure standards and protocols were very common.
Conclusions and recommendations include the following:
• Entities should identify their objectives for installing EVSE before trying to determine EVSE numbers, types (such as, Level 1, Level 2, or fast charge), and locations.
• In many cases, there should be a reasonable belief that installed EVSE will be used by significant numbers of PEVs; however, there are compelling reasons to consider installing EVSE infrastructure besides expected short-term use. Some of these reasons address safety and convenience concerns, as well as building consumer confidence in PEVs and associated infrastructure.
• Near-term PEV charging will occur primarily at home, so this is the greatest opportunity for charging infrastructure support for the next few years. Other outstanding near-term infrastructure opportunities include workplaces and multiunit dwellings where
5
management has indicated support for infrastructure and surveys indicate likely PEV adoption; garaged fleet locations that have or will have significant numbers of PEVs; and crowded airport and commuter parking locations, provided certain conditions are met.
• Locations along some corridors linking multiple urban areas, specific destinations, and those locations mentioned above that lack management support and/or whose surveys are inconclusive should require additional analyses before committing to PEV infrastructure installation.
• A need exists for (1) better PEV infrastructure data (current and planned locations, operating hours, numbers and types of chargers, and so forth), including access to real-time data via mobile applications or onboard vehicle systems, for example; (2) highly refined models capable of evaluating potential locations for public charging stations based on a variety of factors and objectives; and (3) expanded outreach and enhanced collaboration among stakeholders, including auto dealers, electric utilities, city planners, and regional PEV readiness coordinators, as examples. The Energy Commission intends (and, in some cases, has commenced) to support these types of efforts.
• Updates to this assessment will incorporate findings from new data and lessons learned into recommendations for future Energy Commission support strategies.
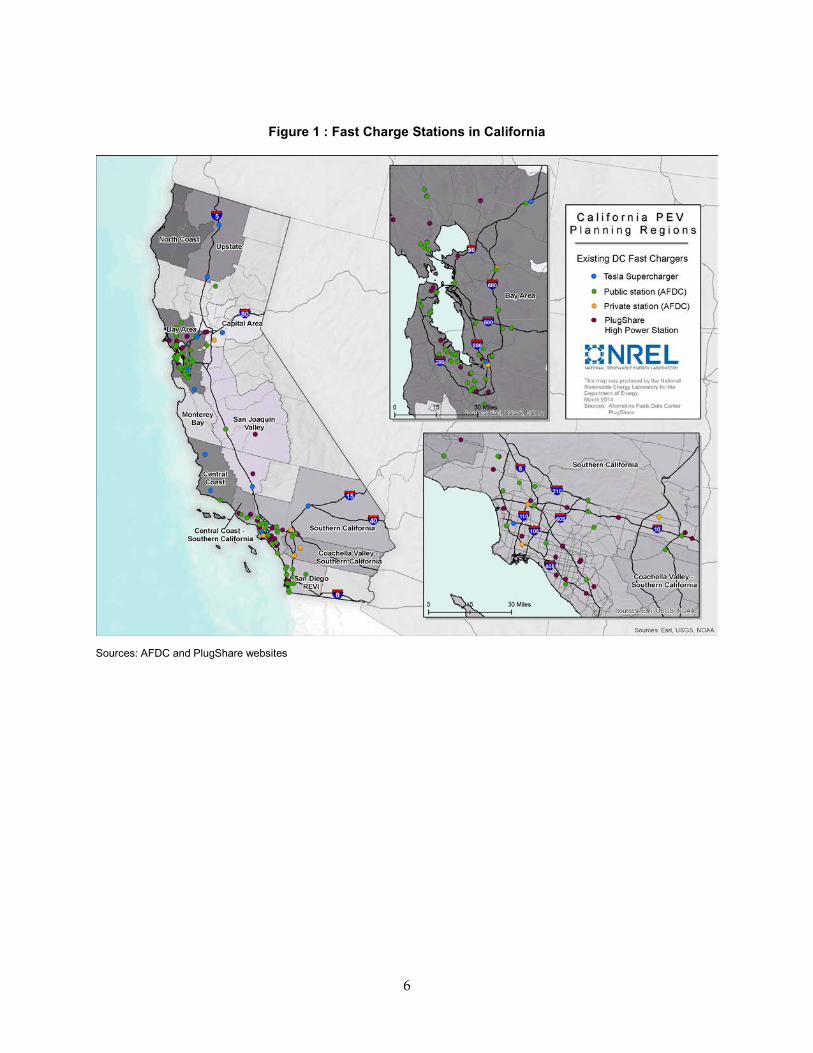
The installation of significant numbers of fast charge stations will support PEV growth throughout California. Figure 1 illustrates current fast charge stations as of early March 2014 based on information from the Alternative Fuels Data Center and PlugShare websites. Most fast charge stations in Figure 1 are found on both the Alternative Fuels Data Center and PlugShare websites – these stations are symbolized by the green and yellow circles (for public and private stations respectively). Stations symbolized with maroon-colored circles and identified in the Figure 1 legend as “PlugShare High Power Station” are unique to the PlugShare website. The Tesla stations (blue circles) are broken out separately because of proprietary charging capabilities and requirements for Tesla vehicles. Information on locations and numbers of current fast charging stations is changing rapidly, and it is acknowledged that this map may be incomplete; however, the intent is to provide a broad geographical overview of fast charge station locations. Additional data on planned stations are available from other sources, such as the regional plans, and will also be updated over time as plans and market conditions change.
6
Figure 1 : Fast Charge Stations in California
Sources: AFDC and PlugShare websites
7
CHAPTER 1: Introduction In March 2012, Governor Brown issued Executive Order B-16-2012, directing specific government agencies to establish benchmarks resulting in 1.5 million zero-emission vehicles (ZEVs) on California roadways by 2025.1 The Executive Order specified intermediate goals and benchmarks for 2015 and 2020 and identified a target of an 80 percent reduction in transportation sector greenhouse gas (GHG) emissions by 2050 (relative to 1990 levels).
In response to the executive order, the Governor’s Office published the 2013 ZEV Action Plan in February 2013.2 The 2013 ZEV Action Plan itemizes specific strategies for achieving the executive order goals and identifies lead and supporting state agencies charged with implementing those strategies. One of those strategies for plug-in electric vehicles (PEVs) is to:
“Develop a statewide PEV infrastructure plan that will consider infrastructure needs of interregional corridors, encourage cohesiveness among regional plans, and provide guidance on high priority locations for infrastructure such as airports and near public transportation. The plan will also consider standards for privately developed infrastructure being constructed throughout the state.”
The California Energy Commission is the lead agency for developing the Statewide Plan, supported by the Governor’s Office and the California Air Resources Board (ARB). The 2013 ZEV Action Plan defined ZEVs to include PEVs and FCEVs. PEVs include both pure battery electric vehicles (BEVs) and plug-in hybrid electric vehicles (PHEVs) and are the focus for this document.
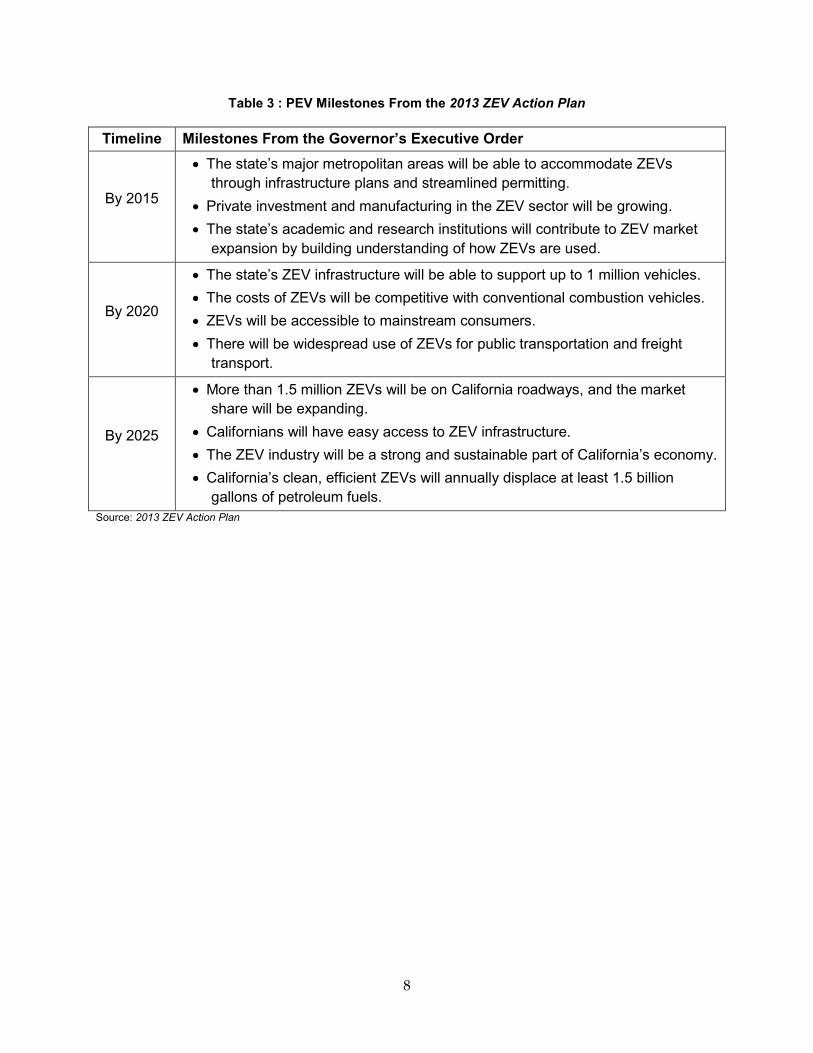
Table 3 is an excerpt from the 2013 ZEV Action Plan, highlighting some of the milestones of Executive Order B-16-2012. Milestones are broken into three time frames of five-year increments. Some milestones (including infrastructure and related actions) are not addressed in the 2013 Action Plan after 2020 due to the uncertainty of the ZEV market. This Statewide PEV Infrastructure Assessment will be updated as PEV market conditions evolve.
1 E.O. B-16-2012. http://gov.ca.gov/news.php?id=17472. Accessed March 12, 2013. 2 Governor’s Interagency Working Group on Zero-emission Vehicles. (February 2013). 2013 ZEV Action Plan. http://opr.ca.gov/docs/Governor’s_Office_ZEV_Action_Plan_(02-13).pdf. Accessed March 1, 2013.
8
Table 3 : PEV Milestones From the 2013 ZEV Action Plan
Timeline Milestones From the Governor’s Executive Order
By 2015
• The state’s major metropolitan areas will be able to accommodate ZEVs through infrastructure plans and streamlined permitting.
• Private investment and manufacturing in the ZEV sector will be growing. • The state’s academic and research institutions will contribute to ZEV market
expansion by building understanding of how ZEVs are used.
By 2020
• The state’s ZEV infrastructure will be able to support up to 1 million vehicles. • The costs of ZEVs will be competitive with conventional combustion vehicles. • ZEVs will be accessible to mainstream consumers. • There will be widespread use of ZEVs for public transportation and freight
transport.
By 2025
• More than 1.5 million ZEVs will be on California roadways, and the market share will be expanding.
• Californians will have easy access to ZEV infrastructure. • The ZEV industry will be a strong and sustainable part of California’s economy. • California’s clean, efficient ZEVs will annually displace at least 1.5 billion
gallons of petroleum fuels. Source: 2013 ZEV Action Plan
9
CHAPTER 2: Background Purpose of This Document This document serves several purposes. The primary purpose is to articulate the Energy Commission’s conclusions and recommendations regarding PEV infrastructure planning, provide guidance to local communities and regions, contribute to state-level policy, and convey the Energy Commission’s intentions in supporting public infrastructure plans. A second purpose is to convey (1) stakeholder feedback collected from the PEV Infrastructure Plan Stakeholder Workshop, (2) reviews of earlier drafts of this document, and (3) discussions with key stakeholders.
A third purpose is to satisfy the 2013 ZEV Action Plan requirement that the Energy Commission (1) consider infrastructure needs of interregional corridors, (2) encourage cohesiveness among regional plans, and (3) provide guidance on high-priority locations for infrastructure, such as airports and near public transportation. This assessment addresses each of these issues. Other relevant goals and/or action items contained in the 2013 ZEV Action Plan with the Energy Commission identified as the lead are also addressed in this report. See the 2013 ZEV Action Plan for more detailed action items assigned to the Energy Commission and other involved parties.3 A final and overarching purpose of this report is to inform and guide different audiences and personnel from a variety of agencies and organizations. As such, the document is intentionally limited to about 60 pages (plus appendices) in the hope that it will be read in its entirety by interested parties.
This assessment is a flexible and evolving document that reflects the Energy Commission’s engagement in the early phases of a long-term infrastructure planning process. Over time, PEV markets will continue to expand, more definitive technology trends will emerge, and stakeholder input will continue to be received. While information on current technology and market trends may be sufficient to support infrastructure planning at the local and regional levels, infrastructure expansion trends at the corridor, statewide, and interstate levels are much more uncertain due to a lack of data reflecting both a broad consumer base and long-term technology trends. Funding from the Energy Commission for corridor and remote destination EVSE projects continues, and is justified based upon the hypothesis that they will improve range confidence, increase e-miles, and promote PEV sales.
This assessment therefore employs a scenario approach to projecting future EVSE requirements. As additional data are collected, and the uncertainties about future market and technology trends are reduced, more predictive planning tools will be incorporated and the assessment framework will evolve into an actionable and adaptive statewide plan.
3 Governor’s Interagency Working Group on Zero-emission Vehicles. (February 2013). 2013 ZEV Action Plan. http://opr.ca.gov/docs/Governor’s_Office_ZEV_Action_Plan_(02-13).pdf. Accessed March 1, 2013.
10
There are several longer-term PEV infrastructure planning goals that are not yet fully realized or characterized and that continue to be a high priority for the Energy Commission. Some of these goals follow.
• Support market growth of PEVs. A major challenge is determining how best to support this market growth and could include, for example, evaluating tradeoffs between funding public charging stations and workplace charging stations. Workplace charging stations may initially be used more frequently, but some public charging stations would instill PEV driver confidence and help spur PEV adoption.
• Identify best use of public funds. This is an ongoing goal and will be understood better as more data on real-world PEV deployment results are collected and analyzed.
• Improve analysis aimed at supporting electric vehicle supply equipment (EVSE) location-siting decision making. A better-informed decision-making process to determine the best locations to install different types of EVSE enables an efficient use of capital, strengthens PEV market growth, results in more miles traveled using electricity as a fuel (e-miles), and increases positive public perception of PEVs.
• Improve analytical planning capability. This goal complements the decision-making goal above but also includes accurate cost-benefit analyses associated with deployment of PEVs and EVSE.
As such, the Energy Commission seeks stakeholder feedback in the following areas:
• Trends in EVSE product and network development and infrastructure growth
• Trends in usage of and demand for Level 1 and Level 2 charging in workplace and public settings
• Trends in usage of and demand for direct current (DC) fast charging in all settings
• Customer payment methods used, prices, and associated customer response
PEV Growth Potential The number of PEVs in California is growing rapidly. One source estimates cumulative PEV sales in California from 2011 to 2013 at nearly 51,000 vehicles, or slightly more than one-third of all national PEV sales.4 Nearly 70 percent of global investment in PEV-related sectors in the first half of 2011 was in California, and almost three-quarters of the U.S. investment of almost $500 million in similar sectors was in California.5
4 California Plug-in Electric Vehicle Collaborative. http://www.pevcollaborative.org/. Accessed October 28, 2013. 5 NEXT 10. (December 2011). Powering Innovation: California is Leading the Shift to Electric Vehicles from R&D to Early Adoption. http://next10.org/powering-innovation-california-leading-shift-electric-vehicles-rd-early-adoption. Accessed March 1, 2013.

11
Moderate estimates project more than 700,000 PEVs in Southern California alone by 2022,6 suggesting that more than 1 million PEVs could be on the road statewide within 10 years. The Energy Commission acknowledges uncertainties in PEV projections and will update this document based on various factors, including changes in expected California PEV deployment. Additional experience and enhanced analytic planning capabilities may also provide new insights into more cost-effective means of deploying EVSE to support PEV market growth. The Energy Commission intends to continue updating PEV (and ZEV) projections based in part on ARB interviews with automakers about their deployment plans. Figure 2 : PEV/HEV Sales Comparison
Source: U.S. DOE7
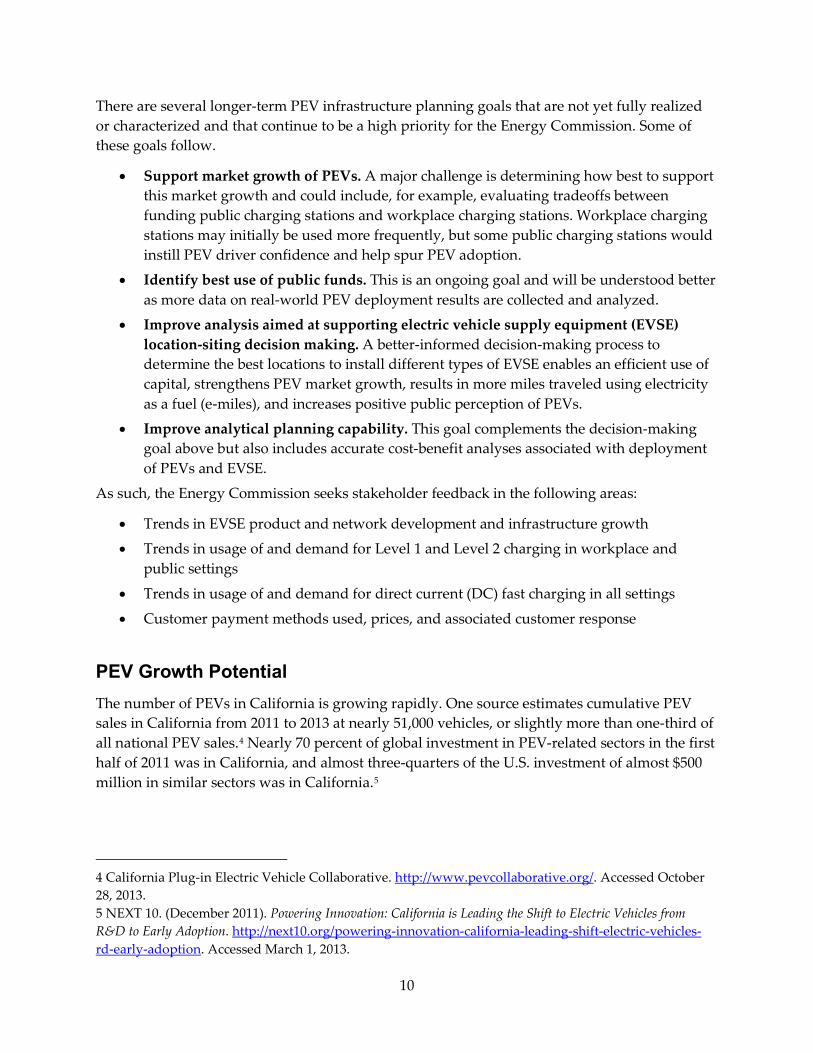
Why the interest in PEVs? Recent PEV driver survey results published by the California Center for Sustainable Energy provide some insights, indicating that environmental benefits (among other factors) contribute to the motivation to purchase a PEV.8 Figure 3 is an excerpt from the survey.
6 Luskin Center. (2013). Southern California Plug-in Electric Vehicle Atlas. http://innovation.luskin.ucla.edu/sites/default/files/PEV_Atlas_Final.pdf. Accessed March 11, 2014. 7 U.S. DOE. (January 31, 2013). EV Everywhere Grand Challenge Blueprint. https://www1.eere.energy.gov/vehiclesandfuels/electric_vehicles/pdfs/eveverywhere_blueprint.pdf. Accessed March 11, 2013. 8 California Center for Sustainable Energy. (May 2013). California Plug-in Electric Vehicle Driver Survey Results May 2013. http://energycenter.org/sites/default/files/docs/nav/transportation/cvrp/survey-results/California_Plug-in_Electric_Vehicle_Driver_Survey_Results-May_2013.pdf. Accessed March 11, 2014.
PEV sales in the first two years (2010—2012) compare very favorably with hybrid electric vehicle (HEV) sales during their first two years (1999—2001). Figure 2 illustrates that PEV sales are roughly double those of HEVs in their respective introductory phases. (The horizontal axis represents each of the 24 months, and the dots represent monthly sales as opposed to cumulative sales.) This same Department of Energy report notes U.S. PEV sales tripled in 2012 (more than 50,000 cars sold), and a PEV (the Chevrolet Volt) beat all other vehicle models in Consumer Reports’ owner satisfaction survey for a second time.
12
Figure 3 : PEV Driver Survey Results
Source: California Center for Sustainable Energy
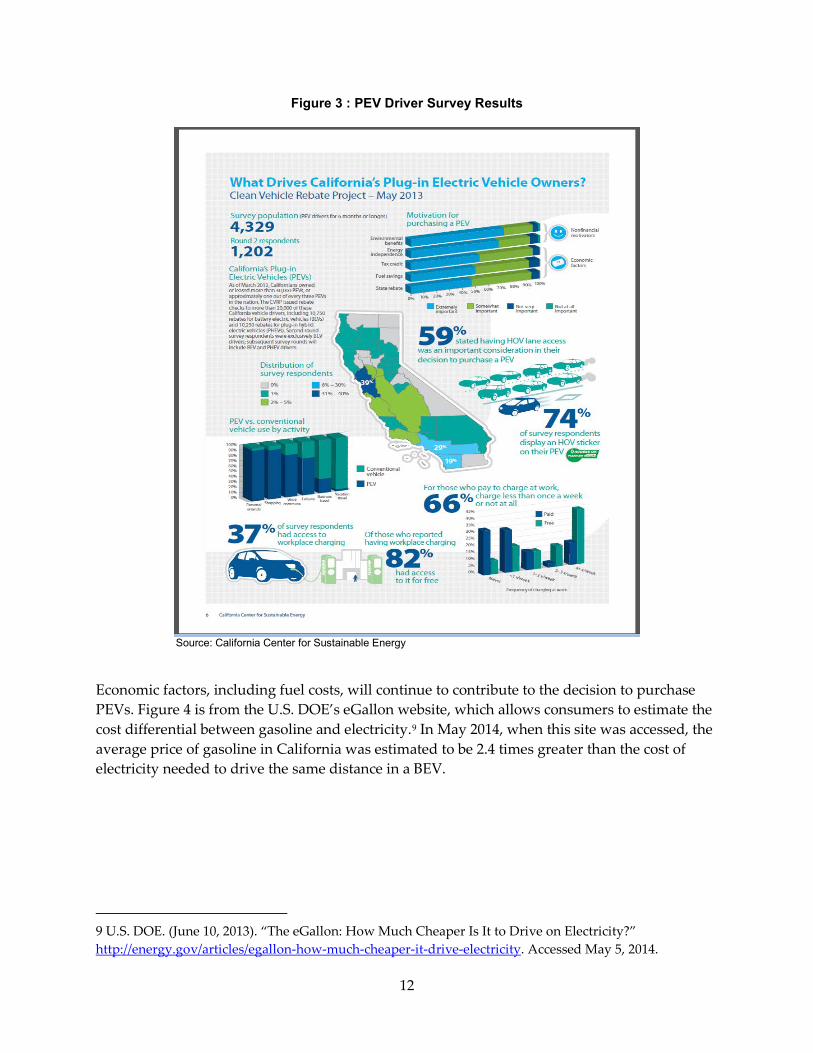
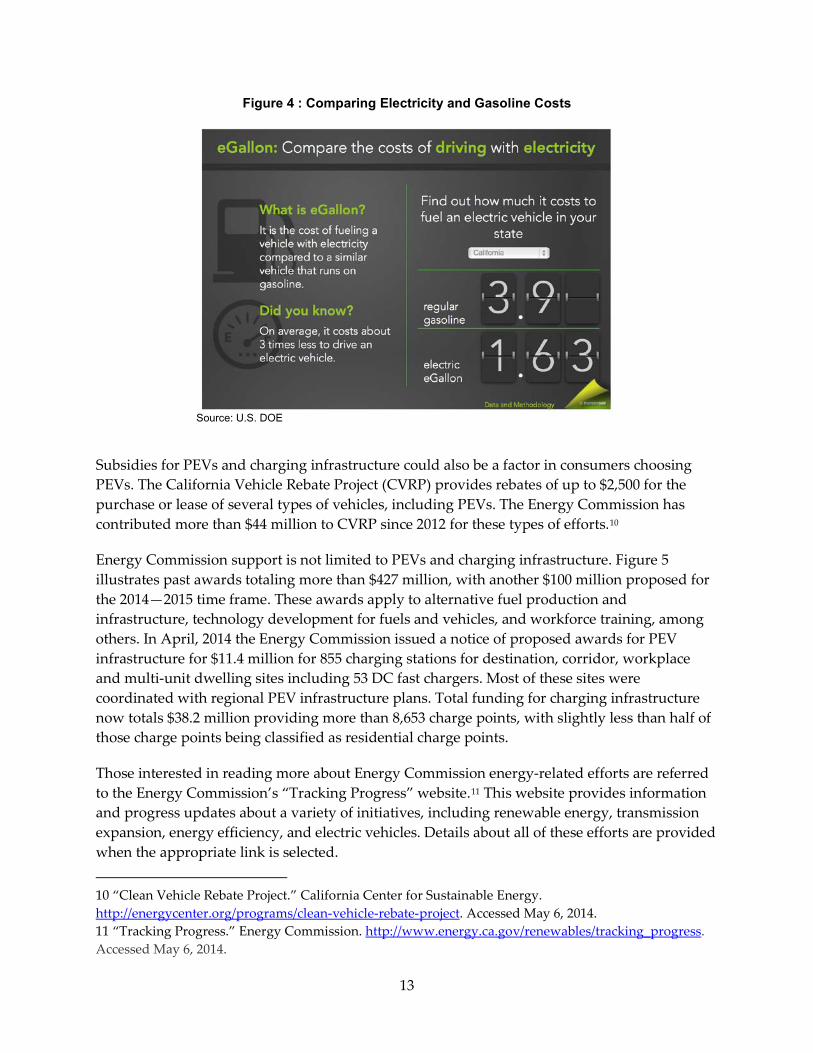
Economic factors, including fuel costs, will continue to contribute to the decision to purchase PEVs. Figure 4 is from the U.S. DOE’s eGallon website, which allows consumers to estimate the cost differential between gasoline and electricity.9 In May 2014, when this site was accessed, the average price of gasoline in California was estimated to be 2.4 times greater than the cost of electricity needed to drive the same distance in a BEV.
9 U.S. DOE. (June 10, 2013). “The eGallon: How Much Cheaper Is It to Drive on Electricity?” http://energy.gov/articles/egallon-how-much-cheaper-it-drive-electricity. Accessed May 5, 2014.
13
Figure 4 : Comparing Electricity and Gasoline Costs
Source: U.S. DOE
Subsidies for PEVs and charging infrastructure could also be a factor in consumers choosing PEVs. The California Vehicle Rebate Project (CVRP) provides rebates of up to $2,500 for the purchase or lease of several types of vehicles, including PEVs. The Energy Commission has contributed more than $44 million to CVRP since 2012 for these types of efforts.10
Energy Commission support is not limited to PEVs and charging infrastructure. Figure 5 illustrates past awards totaling more than $427 million, with another $100 million proposed for the 2014—2015 time frame. These awards apply to alternative fuel production and infrastructure, technology development for fuels and vehicles, and workforce training, among others. In April, 2014 the Energy Commission issued a notice of proposed awards for PEV infrastructure for $11.4 million for 855 charging stations for destination, corridor, workplace and multi-unit dwelling sites including 53 DC fast chargers. Most of these sites were coordinated with regional PEV infrastructure plans. Total funding for charging infrastructure now totals $38.2 million providing more than 8,653 charge points, with slightly less than half of those charge points being classified as residential charge points.
Those interested in reading more about Energy Commission energy-related efforts are referred to the Energy Commission’s “Tracking Progress” website.11 This website provides information and progress updates about a variety of initiatives, including renewable energy, transmission expansion, energy efficiency, and electric vehicles. Details about all of these efforts are provided when the appropriate link is selected. 10 “Clean Vehicle Rebate Project.” California Center for Sustainable Energy. http://energycenter.org/programs/clean-vehicle-rebate-project. Accessed May 6, 2014. 11 “Tracking Progress.” Energy Commission. http://www.energy.ca.gov/renewables/tracking_progress. Accessed May 6, 2014.

14
Figure 5 : Energy Commission Awards
Source: Energy Commission
The March 2012 settlement between the California Public Utility Commission and NRG will benefit California’s PEV drivers. Under this settlement, NRG will spend nearly $90 million over four years to construct a minimum of 200 fast-charging stations and 10,000 “make readies,” laying the groundwork so that 10,000 EVSE units can be installed in at least 1,000 locations statewide. These charge points will be located in investor-owned utility service areas. Additional NRG funding of about $10 million will support technology demonstrations and additional PEV charging infrastructure.
15
CHAPTER 3: Infrastructure Expansion Scenarios Summary of Goals and Milestones This assessment addresses two major goals and milestones. The first is the 1.5 million ZEV goal, which is targeted at 2025. A second goal, which supports the first, is for California’s ZEV infrastructure to support up to 1 million vehicles by 2020. Other goals and milestones (including infrastructure and related actions) are not addressed after 2020 in the 2013 ZEV Action Plan due to the uncertainty of the ZEV market, nor are they addressed here for the same reason. As ZEV market conditions become clearer, this assessment and associated Energy Commission support strategies will be updated. This chapter examines potential EVSE infrastructure expansion trends required to meet these 2020 and 2025 goals. Given the many uncertainties around key factors that will be influencing PEV markets out to 2025, infrastructure trends are discussed with reference to scenarios of hypothetic futures rather than predictions of future market outcomes. The scenario framework characterizes pertinent technology factors and market indicators and provides a simple quantitative basis to inform the Energy Commission’s ongoing efforts to support PEV market growth.
This chapter examines two scenarios with distinct assumptions about consumer demands and supplier benefits associated with EVSE infrastructure required to support PEVs in 2020.12 The total electricity used by vehicles is the same in both scenarios, but the number and types of EVSE units required vary significantly. The assumptions and analyses relied upon to develop these scenarios are described later in this chapter and detailed more completely in Appendix F. A summary of the number and type of EVSE stations required in each scenario by 2020 is provided in Table 4. The different categories of EVSE stations are itemized as Level 1 chargers (L1), Level 2 chargers (L2), and fast chargers (FC). Level 1 chargers are generally the least expensive charging option and also the slowest. On the other extreme are fast chargers, which can charge a PEV relatively quickly but are the most expensive.
The EVSE stations required in each scenario are described as being installed at home, at the workplace, or at public locations. L1 and L2 EVSE units are installed at all three locations, while all FC stations are assumed to be installed at public locations. These location categories are a simplified representation of what inevitably will prove to be a very diverse and multifaceted infrastructure rollout. It is acknowledged that sometimes there is a gray area in distinguishing charging types by functionality – a public garage may cater to commuters during the week but to shoppers on weekends, for example. A public garage would be considered public charging in an example like this, with the understanding that some types of public charging could be classified as workplace or destination charging.
12 The term supplier is used here as a general term including any stakeholders directly involved in the development of EVSE infrastructure, including equipment vendors, installers, employers at workplace EVSE locations, public agencies, or host establishments.
16
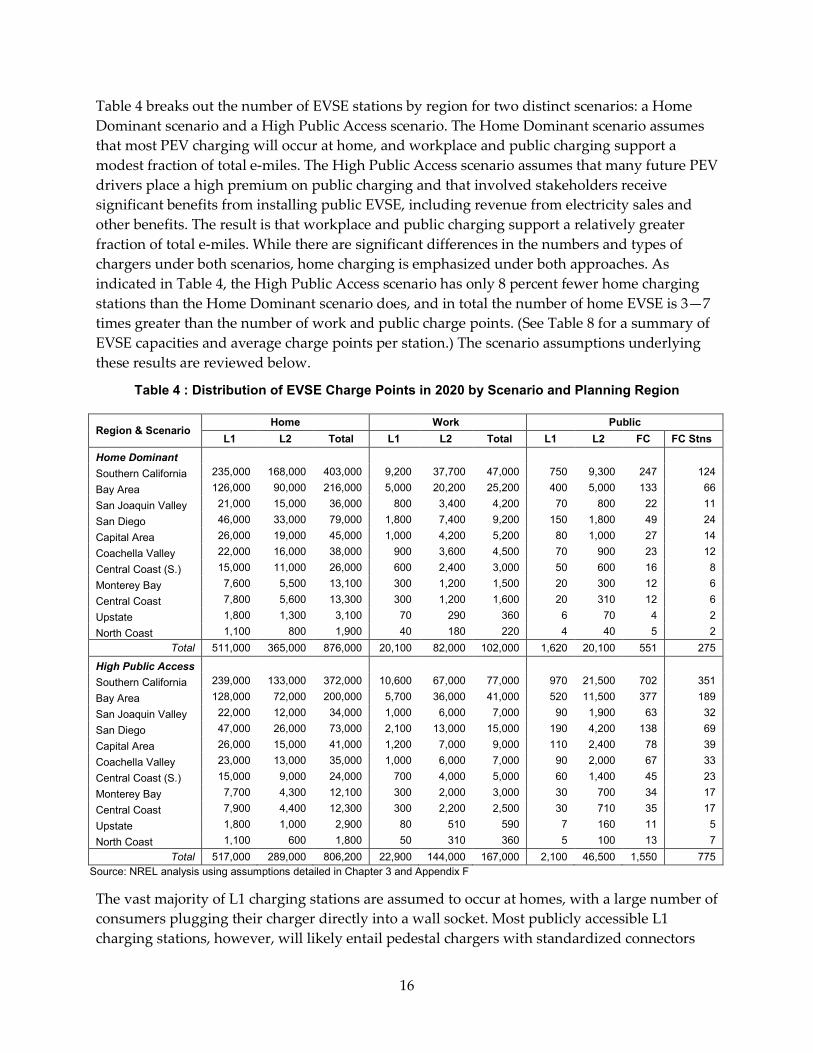
Table 4 breaks out the number of EVSE stations by region for two distinct scenarios: a Home Dominant scenario and a High Public Access scenario. The Home Dominant scenario assumes that most PEV charging will occur at home, and workplace and public charging support a modest fraction of total e-miles. The High Public Access scenario assumes that many future PEV drivers place a high premium on public charging and that involved stakeholders receive significant benefits from installing public EVSE, including revenue from electricity sales and other benefits. The result is that workplace and public charging support a relatively greater fraction of total e-miles. While there are significant differences in the numbers and types of chargers under both scenarios, home charging is emphasized under both approaches. As indicated in Table 4, the High Public Access scenario has only 8 percent fewer home charging stations than the Home Dominant scenario does, and in total the number of home EVSE is 3—7 times greater than the number of work and public charge points. (See Table 8 for a summary of EVSE capacities and average charge points per station.) The scenario assumptions underlying these results are reviewed below.
Table 4 : Distribution of EVSE Charge Points in 2020 by Scenario and Planning Region
Region & Scenario Home Work Public L1 L2 Total L1 L2 Total L1 L2 FC FC Stns
Home Dominant
Southern California 235,000 168,000 403,000 9,200 37,700 47,000 750 9,300 247 124
Bay Area 126,000 90,000 216,000 5,000 20,200 25,200 400 5,000 133 66
San Joaquin Valley 21,000 15,000 36,000 800 3,400 4,200 70 800 22 11
San Diego 46,000 33,000 79,000 1,800 7,400 9,200 150 1,800 49 24
Capital Area 26,000 19,000 45,000 1,000 4,200 5,200 80 1,000 27 14
Coachella Valley 22,000 16,000 38,000 900 3,600 4,500 70 900 23 12
Central Coast (S.) 15,000 11,000 26,000 600 2,400 3,000 50 600 16 8
Monterey Bay 7,600 5,500 13,100 300 1,200 1,500 20 300 12 6
Central Coast 7,800 5,600 13,300 300 1,200 1,600 20 310 12 6
Upstate 1,800 1,300 3,100 70 290 360 6 70 4 2
North Coast 1,100 800 1,900 40 180 220 4 40 5 2 Total 511,000 365,000 876,000 20,100 82,000 102,000 1,620 20,100 551 275
High Public Access Southern California 239,000 133,000 372,000 10,600 67,000 77,000 970 21,500 702 351 Bay Area 128,000 72,000 200,000 5,700 36,000 41,000 520 11,500 377 189 San Joaquin Valley 22,000 12,000 34,000 1,000 6,000 7,000 90 1,900 63 32 San Diego 47,000 26,000 73,000 2,100 13,000 15,000 190 4,200 138 69 Capital Area 26,000 15,000 41,000 1,200 7,000 9,000 110 2,400 78 39 Coachella Valley 23,000 13,000 35,000 1,000 6,000 7,000 90 2,000 67 33 Central Coast (S.) 15,000 9,000 24,000 700 4,000 5,000 60 1,400 45 23 Monterey Bay 7,700 4,300 12,100 300 2,000 3,000 30 700 34 17 Central Coast 7,900 4,400 12,300 300 2,200 2,500 30 710 35 17 Upstate 1,800 1,000 2,900 80 510 590 7 160 11 5 North Coast 1,100 600 1,800 50 310 360 5 100 13 7
Total 517,000 289,000 806,200 22,900 144,000 167,000 2,100 46,500 1,550 775 Source: NREL analysis using assumptions detailed in Chapter 3 and Appendix F
The vast majority of L1 charging stations are assumed to occur at homes, with a large number of consumers plugging their charger directly into a wall socket. Most publicly accessible L1 charging stations, however, will likely entail pedestal chargers with standardized connectors
17
(removing the need for – and the risk of theft of – a personal charging cord). Public L1 charging stations may be appealing for applications such as airport parking, hotels, or commuter parking, where the quicker charge time of an L2 charger is not necessarily required.
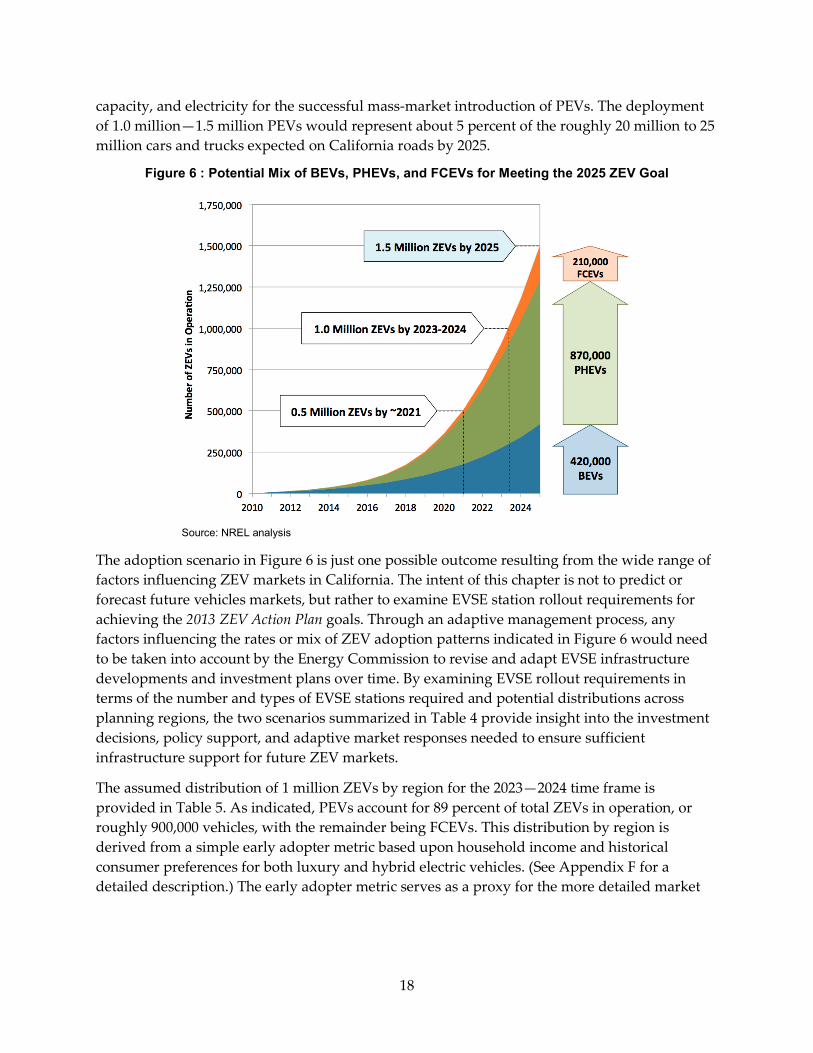
Figure 6 indicates the ZEV growth scenario underlying the electricity demand requirements for both the Home Dominant and the High Public Access EVSE infrastructure scenarios. The figure shows the total number of ZEVs in operation as market shares increase over time. Recall that under the 2013 ZEV Action Plan, the 1.5 million ZEV goal is defined as including FCEVs, BEVs, and PHEVs. As indicated in Figure 6, PHEVs are the majority of the ZEVs deployed, accounting for 870,000 of the 1.5 million ZEVs deployed by 2025. The scenarios assume about 420,000 BEVs are deployed by 2025. FCEV market shares begin to increase more rapidly after around 2020—2023, and FCEVs account for 210,000 of the ZEVs in operation by 2025.13 (Note: ARB conducts regular surveys and interviews with FCEV automakers about FCEV deployment plans, and updated results are anticipated to be released shortly after publication of this report. The numbers in Figure 6 can adjusted as projections improve, actual deployment numbers become available, and as auto manufacturers share their future vehicle deployment plans.) The vehicle sales per year associated with this scenario approximate the likely ZEV compliance scenario from the 2011 Initial Statement of Reasons (ISOR) report from the ARB (see Appendix F) but with a somewhat stronger ramp-up rate to achieve the 1.5 million ZEV goal by 2025.
While the goal is to establish EVSE infrastructure sufficient to support 1 million ZEVs by 2020, the time frame for actually achieving 1 million ZEVs would be around 2023 or 2024, just before the ramp-up to 1.5 million ZEVs by 2025. This steep growth of ZEVs projected to be in operation to meet the 2025 goal is apparent in Figure 6. Following the 2011 ISOR report, it is assumed that all PHEVs have 20-mile batteries, and BEVs have 100-mile, all-electric range. Significant EVSE infrastructure would be required by 2020 in preparation for the strong ramp-up in vehicles around 2023—2025. Furthermore, with sustained market growth in ZEVs through 2025, additional infrastructure would need to be installed at a rapid rate.
The EVSE scenarios discussed in this section examine early infrastructure deployment trends necessary to meet the demand of 1.0 million vehicles by 2020, even though the total number of vehicles on the road by 2020 would be less than 0.5 million given the PEV adoption rates in Figure 6. This early infrastructure development is important to increase the early adopter acceptance and effective utility of PEVs by increasing the availability of home, public, and workplace charging options. Though additional research will be needed to better understand the relationship between workplace or public charging and PEV adoption rates, it is anticipated that a dampening of EVSE deployment would also dampen PEV sales. The metrics underlying the scenarios presented here, and those used in other market adoption models, must be updated as these relationships are better understood. To some degree, the scenarios presented here are relevant regardless of the timing and acceleration of PEV adoption: They provide a framework for discussing milestones and goals associated with supplying sufficient EVSE coverage,
13 The requirements for hydrogen station infrastructure rollout to support early FCEV markets are not addressed in this report. For a discussion of early stations needed for market growth, see the roadmap developed by the California Fuel Cell Partnership, available at http://cafcp.org/carsandbuses/caroadmap.
18
capacity, and electricity for the successful mass-market introduction of PEVs. The deployment of 1.0 million—1.5 million PEVs would represent about 5 percent of the roughly 20 million to 25 million cars and trucks expected on California roads by 2025.
Figure 6 : Potential Mix of BEVs, PHEVs, and FCEVs for Meeting the 2025 ZEV Goal
Source: NREL analysis
The adoption scenario in Figure 6 is just one possible outcome resulting from the wide range of factors influencing ZEV markets in California. The intent of this chapter is not to predict or forecast future vehicles markets, but rather to examine EVSE station rollout requirements for achieving the 2013 ZEV Action Plan goals. Through an adaptive management process, any factors influencing the rates or mix of ZEV adoption patterns indicated in Figure 6 would need to be taken into account by the Energy Commission to revise and adapt EVSE infrastructure developments and investment plans over time. By examining EVSE rollout requirements in terms of the number and types of EVSE stations required and potential distributions across planning regions, the two scenarios summarized in Table 4 provide insight into the investment decisions, policy support, and adaptive market responses needed to ensure sufficient infrastructure support for future ZEV markets.
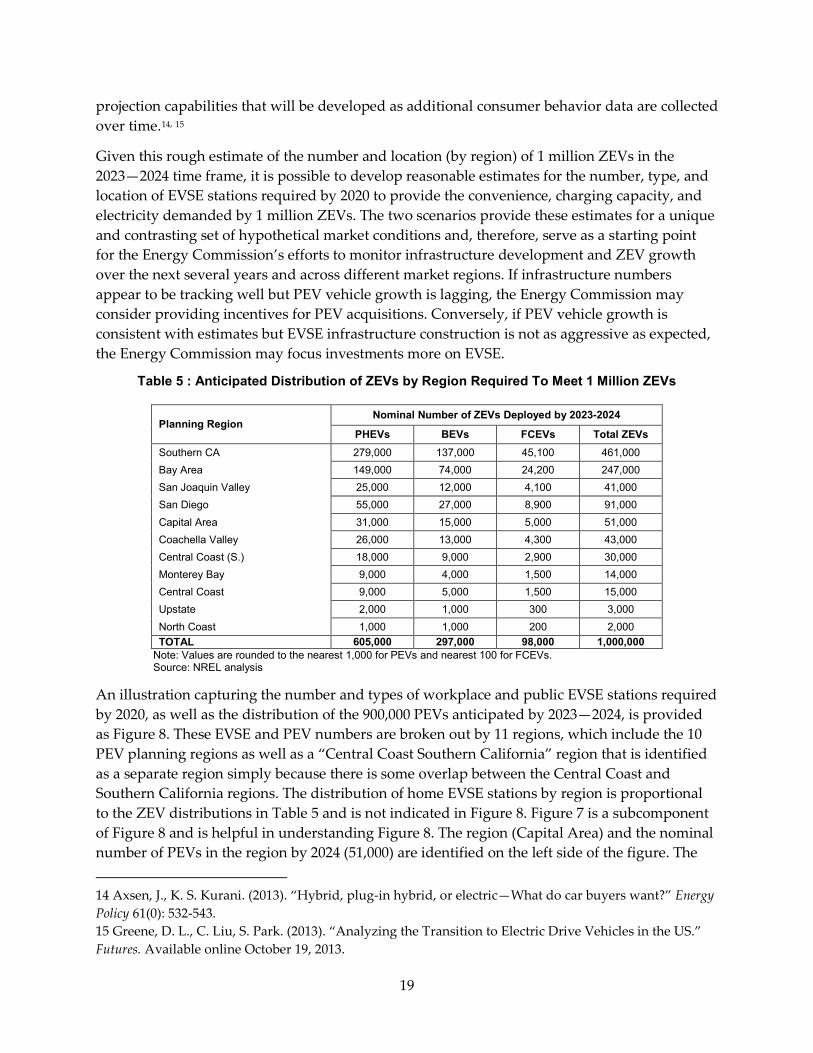
The assumed distribution of 1 million ZEVs by region for the 2023—2024 time frame is provided in Table 5. As indicated, PEVs account for 89 percent of total ZEVs in operation, or roughly 900,000 vehicles, with the remainder being FCEVs. This distribution by region is derived from a simple early adopter metric based upon household income and historical consumer preferences for both luxury and hybrid electric vehicles. (See Appendix F for a detailed description.) The early adopter metric serves as a proxy for the more detailed market
19
projection capabilities that will be developed as additional consumer behavior data are collected over time.14, 15
Given this rough estimate of the number and location (by region) of 1 million ZEVs in the 2023—2024 time frame, it is possible to develop reasonable estimates for the number, type, and location of EVSE stations required by 2020 to provide the convenience, charging capacity, and electricity demanded by 1 million ZEVs. The two scenarios provide these estimates for a unique and contrasting set of hypothetical market conditions and, therefore, serve as a starting point for the Energy Commission’s efforts to monitor infrastructure development and ZEV growth over the next several years and across different market regions. If infrastructure numbers appear to be tracking well but PEV vehicle growth is lagging, the Energy Commission may consider providing incentives for PEV acquisitions. Conversely, if PEV vehicle growth is consistent with estimates but EVSE infrastructure construction is not as aggressive as expected, the Energy Commission may focus investments more on EVSE.
Table 5 : Anticipated Distribution of ZEVs by Region Required To Meet 1 Million ZEVs
Planning Region Nominal Number of ZEVs Deployed by 2023-2024
PHEVs BEVs FCEVs Total ZEVs Southern CA 279,000 137,000 45,100 461,000 Bay Area 149,000 74,000 24,200 247,000 San Joaquin Valley 25,000 12,000 4,100 41,000 San Diego 55,000 27,000 8,900 91,000 Capital Area 31,000 15,000 5,000 51,000 Coachella Valley 26,000 13,000 4,300 43,000 Central Coast (S.) 18,000 9,000 2,900 30,000 Monterey Bay 9,000 4,000 1,500 14,000 Central Coast 9,000 5,000 1,500 15,000 Upstate 2,000 1,000 300 3,000 North Coast 1,000 1,000 200 2,000 TOTAL 605,000 297,000 98,000 1,000,000
Note: Values are rounded to the nearest 1,000 for PEVs and nearest 100 for FCEVs. Source: NREL analysis
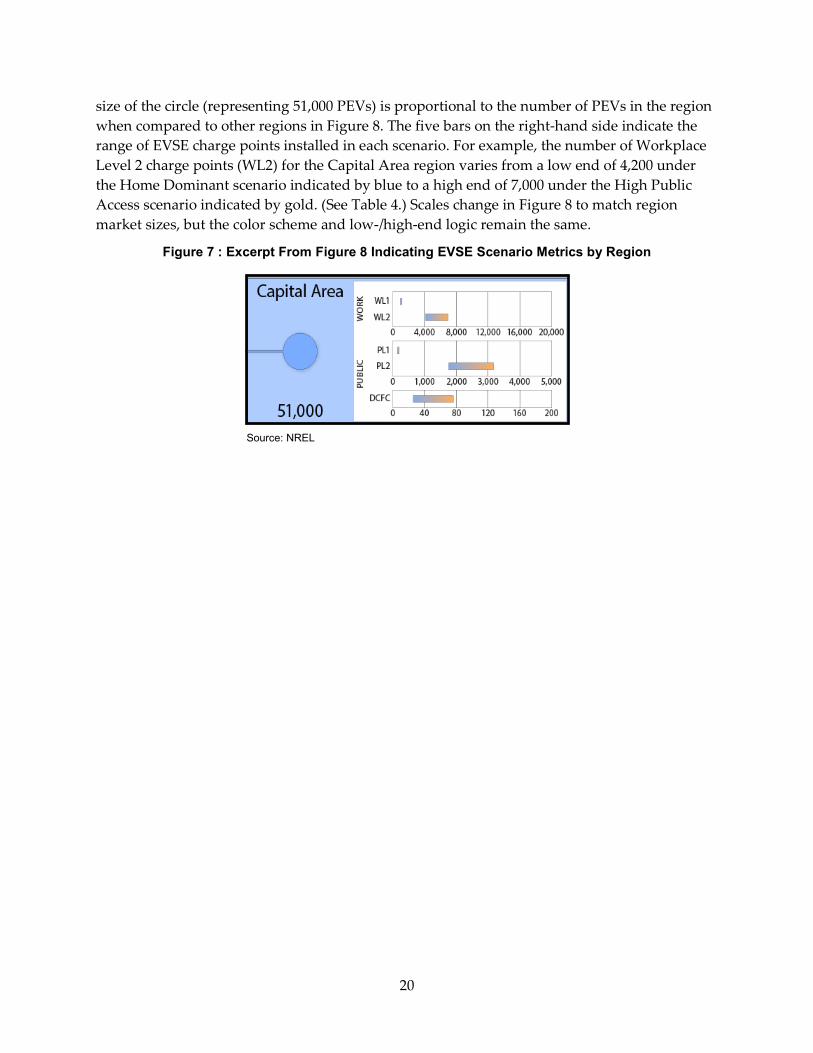
An illustration capturing the number and types of workplace and public EVSE stations required by 2020, as well as the distribution of the 900,000 PEVs anticipated by 2023—2024, is provided as Figure 8. These EVSE and PEV numbers are broken out by 11 regions, which include the 10 PEV planning regions as well as a “Central Coast Southern California” region that is identified as a separate region simply because there is some overlap between the Central Coast and Southern California regions. The distribution of home EVSE stations by region is proportional to the ZEV distributions in Table 5 and is not indicated in Figure 8. Figure 7 is a subcomponent of Figure 8 and is helpful in understanding Figure 8. The region (Capital Area) and the nominal number of PEVs in the region by 2024 (51,000) are identified on the left side of the figure. The 14 Axsen, J., K. S. Kurani. (2013). “Hybrid, plug-in hybrid, or electric—What do car buyers want?” Energy Policy 61(0): 532-543. 15 Greene, D. L., C. Liu, S. Park. (2013). “Analyzing the Transition to Electric Drive Vehicles in the US.” Futures. Available online October 19, 2013.
20
size of the circle (representing 51,000 PEVs) is proportional to the number of PEVs in the region when compared to other regions in Figure 8. The five bars on the right-hand side indicate the range of EVSE charge points installed in each scenario. For example, the number of Workplace Level 2 charge points (WL2) for the Capital Area region varies from a low end of 4,200 under the Home Dominant scenario indicated by blue to a high end of 7,000 under the High Public Access scenario indicated by gold. (See Table 4.) Scales change in Figure 8 to match region market sizes, but the color scheme and low-/high-end logic remain the same.
Figure 7 : Excerpt From Figure 8 Indicating EVSE Scenario Metrics by Region
Source: NREL

21
Figure 8 : Number and Location of PEVs and Workplace and Public EVSE Stations by Region
Source: NREL analysis
22
EVSE Infrastructure Expansion Scenarios As more PEVs are deployed in California, it is vital that consumers are able to charge their vehicles to increase fuel savings and achieve the environmental benefits that come from displacing gasoline miles with e-miles. Rapid PEV market uptake will require accelerated EVSE deployment rates to achieve adequate home, workplace, and public charging capability. This section outlines two scenarios for EVSE infrastructure expansion by 2020 and discusses the different market trends and consumer preferences that the Energy Commission must take into account to best support PEV market growth. The scenarios represent two extremes in providing sufficient EVSE infrastructure for 1 million PEVs by 2020:
• Home Dominant: This scenario assumes that most PEV charging occurs at home. Workplace and public charging support a modest fraction of total e-miles.
• High Public Access: This scenario assumes that many future PEV drivers place a high
premium on public charging and that stakeholders installing workplace and public EVSE stations receive significant benefits from installing EVSE stations, including revenue from kilowatt hour (kWh) sales and other benefits. The result is that workplace and public charging support a significant fraction of total e-miles.
These two scenarios place bounds on the trajectory of EVSE deployment trends necessary to support California’s PEV fleet as it grows to meet the Governor’s goal of 1.5 million ZEVs by 2025. The first section below describes the rationale and quantitative basis for EVSE stations estimated in these two scenarios. These EVSE infrastructure expansion scenarios are not a prediction of future market outcomes, but they do provide a means of understanding a number of key market factors as regions begin to adopt different deployment strategies and planning tools. The second section in this chapter discusses the types of data collection and market trends the Energy Commission must take into account to best support EVSE infrastructure as PEV markets continue to grow.
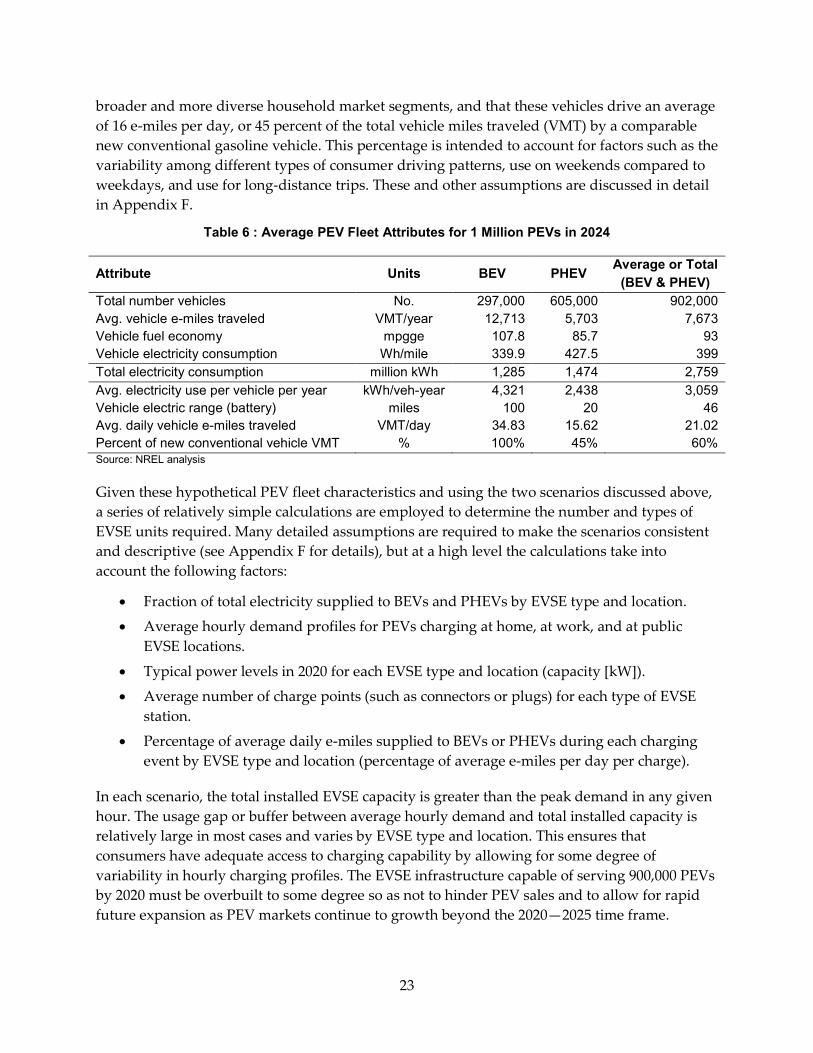
The scenarios are developed to articulate possible EVSE infrastructure expansion trends in response to distinct market forces. Both scenarios establish infrastructure capable of supporting roughly 900,000 PEVs by 2020. As indicated in Table 6, PEVs deployed by 2024 consist of 297,000 BEVs and 605,000 PHEVs, requiring about 2.8 billion kWh and consuming about 3,000 kWh per year per vehicle on average. Because BEVs are assumed to be driven more e-miles than PHEVs, the total electricity demand for both PEV types is similar (1,285 million kWh for BEVs and 1,474 million kWh for PHEVs). The watt-hours per mile value for PHEVs is relatively higher than that for BEVs partly due to the assumption that PHEVs are sold into both the car and light truck market segments, while BEVs are sold only into smaller car markets. The table also indicates average e-miles traveled per year and per day, fleet-average vehicle fuel economy in miles per gallon gasoline equivalent (mpgge), fuel consumption in watt-hours per mile (Wh/mile), electricity use per vehicle per year, and average vehicle battery range. It is assumed that BEVs with 100-mile range are sold into households with driving patterns amenable to limited-range vehicles, and that on average a BEV displaces the same total annual miles driven by a conventional gasoline vehicle. It is assumed that PHEVs with 20-mile batteries are sold into
23
broader and more diverse household market segments, and that these vehicles drive an average of 16 e-miles per day, or 45 percent of the total vehicle miles traveled (VMT) by a comparable new conventional gasoline vehicle. This percentage is intended to account for factors such as the variability among different types of consumer driving patterns, use on weekends compared to weekdays, and use for long-distance trips. These and other assumptions are discussed in detail in Appendix F.
Table 6 : Average PEV Fleet Attributes for 1 Million PEVs in 2024
Attribute Units BEV PHEV Average or Total (BEV & PHEV)
Total number vehicles No. 297,000 605,000 902,000 Avg. vehicle e-miles traveled VMT/year 12,713 5,703 7,673 Vehicle fuel economy mpgge 107.8 85.7 93 Vehicle electricity consumption Wh/mile 339.9 427.5 399 Total electricity consumption million kWh 1,285 1,474 2,759 Avg. electricity use per vehicle per year kWh/veh-year 4,321 2,438 3,059 Vehicle electric range (battery) miles 100 20 46 Avg. daily vehicle e-miles traveled VMT/day 34.83 15.62 21.02 Percent of new conventional vehicle VMT % 100% 45% 60% Source: NREL analysis
Given these hypothetical PEV fleet characteristics and using the two scenarios discussed above, a series of relatively simple calculations are employed to determine the number and types of EVSE units required. Many detailed assumptions are required to make the scenarios consistent and descriptive (see Appendix F for details), but at a high level the calculations take into account the following factors:
• Fraction of total electricity supplied to BEVs and PHEVs by EVSE type and location.
• Average hourly demand profiles for PEVs charging at home, at work, and at public EVSE locations.
• Typical power levels in 2020 for each EVSE type and location (capacity [kW]).
• Average number of charge points (such as connectors or plugs) for each type of EVSE station.
• Percentage of average daily e-miles supplied to BEVs or PHEVs during each charging event by EVSE type and location (percentage of average e-miles per day per charge).
In each scenario, the total installed EVSE capacity is greater than the peak demand in any given hour. The usage gap or buffer between average hourly demand and total installed capacity is relatively large in most cases and varies by EVSE type and location. This ensures that consumers have adequate access to charging capability by allowing for some degree of variability in hourly charging profiles. The EVSE infrastructure capable of serving 900,000 PEVs by 2020 must be overbuilt to some degree so as not to hinder PEV sales and to allow for rapid future expansion as PEV markets continue to growth beyond the 2020—2025 time frame.
24
A broad range of technology developments, market factors, and consumer preferences will influence which types of EVSE stations actually supply electricity to PEVs in the 2020—2025 time frame. Given how quickly the market must advance to achieve 1.5 million PEVs by 2025, only some of these factors will have been revealed through clear trends within the 2015—2019 time frame, which is when significant growth in EVSE infrastructure must occur to meet the 2020 goal. These trends can be separated into consumer demand and EVSE supply trends. They include, but are not limited to:
• Consumer demand trends
o Consumer demand for different types of PEV technologies.
o PEV types supplied by automobile manufacturers.
o Household driving behavior in response to use of limited-range BEVs.
o Overall consumer demand for workplace and public charging.
• EVSE supply trends
o The cost and end-user convenience of EVSE equipment.
o Reductions in EVSE installation costs and streamlined permitting.
o Success with information technologies employed to increase the use of EVSE.
o Prices established for electricity supplied from any particular EVSE type or location.
o Revenue accrued by EVSE suppliers from kWh sales.
o Additional benefits to EVSE suppliers aside from kWh sales.
o Total benefits to EVSE suppliers from increased workplace and public access.
The two EVSE infrastructure expansion scenarios are based upon extreme outcomes for the last bulleted consumer demand and EVSE supply trends listed above: (1) Overall consumer demand for workplace and public charging and (2) Total benefits to EVSE suppliers from increased workplace and public access. Though the other trends listed above will influence EVSE infrastructure expansion, these two high-level trends are considered key to determining relative types of EVSE required by 2020. These two trends are also key factors (or indicators) for informing Energy Commission options for supporting EVSE markets and are therefore chosen as defining characteristics in developing the scenarios.
The combination of high and low outcomes for these two key trends is shown in Figure 9. The vertical axis indicates high and low demand for public charging by early PEV adopters in the 2020—2025 time frame. The horizontal axis indicates high and low outcomes for the total benefits received by EVSE suppliers, including revenue from kWh sales as well as other benefits, such as increased non-kWh sales at a given retail store or improved corporate image. The four quadrants represent possible market outcomes or scenarios as the dynamics between consumer demand and supplier benefits are resolved over time. Two of these outcomes, Home Dominant (quadrant C) and High Public Access (B), are the basis for the two EVSE expansion scenarios. The other two market outcomes, Unfulfilled Demand (A) and Excess Supply (D), portray unique EVSE expansion trends, but the total EVSE expansion required in these two
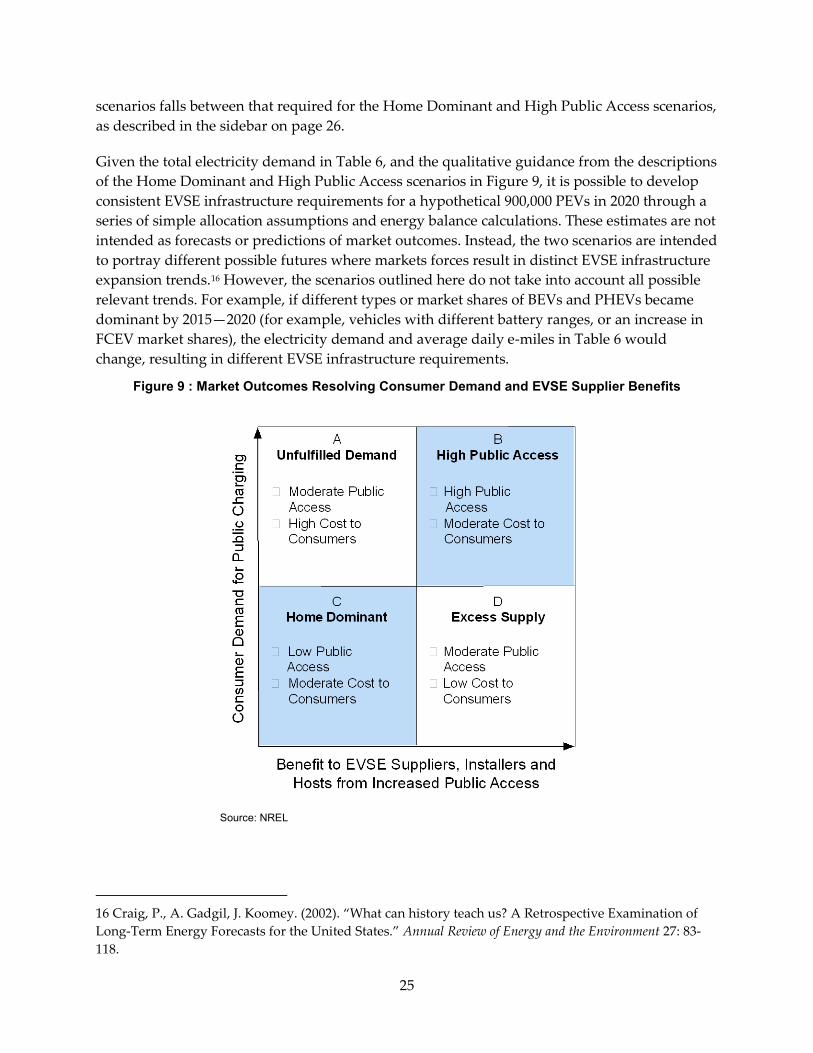
25
scenarios falls between that required for the Home Dominant and High Public Access scenarios, as described in the sidebar on page 26.
Given the total electricity demand in Table 6, and the qualitative guidance from the descriptions of the Home Dominant and High Public Access scenarios in Figure 9, it is possible to develop consistent EVSE infrastructure requirements for a hypothetical 900,000 PEVs in 2020 through a series of simple allocation assumptions and energy balance calculations. These estimates are not intended as forecasts or predictions of market outcomes. Instead, the two scenarios are intended to portray different possible futures where markets forces result in distinct EVSE infrastructure expansion trends.16 However, the scenarios outlined here do not take into account all possible relevant trends. For example, if different types or market shares of BEVs and PHEVs became dominant by 2015—2020 (for example, vehicles with different battery ranges, or an increase in FCEV market shares), the electricity demand and average daily e-miles in Table 6 would change, resulting in different EVSE infrastructure requirements.
Figure 9 : Market Outcomes Resolving Consumer Demand and EVSE Supplier Benefits
Source: NREL
16 Craig, P., A. Gadgil, J. Koomey. (2002). “What can history teach us? A Retrospective Examination of Long-Term Energy Forecasts for the United States.” Annual Review of Energy and the Environment 27: 83-118.
26
It is anticipated that technology and market trends leading to any one of these four outcomes will be revealed with increasing clarity within the 2015—2019 time frame, and that in response the Energy Commission will be able to prioritize the use of public funds accordingly to best support the evolving PEV market. The subsequent section in this chapter discusses how the Energy Commission might monitor and respond to these trends. The remainder of this section reviews the quantitative estimates of EVSE infrastructure expansion for the Home Dominant and High Public Access scenarios.
Resolving Public EVSE Demand and Supply Outcomes
Figure 9 indicates four possible scenarios due to two key market forces influencing the availability of public EVSE in the 2020—2025 time frame, including both workplace and commercial EVSE stations. The least amount of public EVSE would be realized in the Home Dominant scenario (quadrant C), where consumer demand is low and the total benefit to suppliers and installers is low. If the benefit to suppliers and installers remains low, but consumer demand for public EVSE increases, the Unfulfilled Demand scenario emerges (A). In this scenario access is somewhat greater than in C, as suppliers and installers respond to increased demand but only to a limited degree. In addition, suppliers and installers are able to charge consumers more per kWh supplied to PEVs. In contrast, if consumer demand remains low but the total benefits to suppliers and installers from increased public access is high, due to non-kWh benefits such as increased retail sales at a given location or a greener corporate image, the Excess Supply scenario emerges (D). The availability of public EVSE increases and the cost per kWh charged to PEV drivers will be relatively low as suppliers and installers receive revenue from other sources. The High Public Access scenario emerges with both high consumer demand and significant total benefits to suppliers and installers. The availability of public EVSE is greater than in the other three scenarios and the cost to consumers is less than in quadrant A and greater than in quadrant D. The Home Dominant and High Public Access scenarios therefore represent low and high estimates of the availability of public EVSE due to the market influence of consumer demand and total supplier, installer, and host benefits.
27
Home Charging Assumptions A key quantitative assumption in developing the two scenarios is the total fraction of electricity provided by home charging. The authors assume that the majority of charging in both scenarios is home charging, but that greater access to public and work charging in the High Public Access scenario allows more drivers to be comfortable with Level 1 or even no home charging. In addition, greater access to public and workplace charging results in fewer overall kWh being provided by Level 1 or Level 2 home chargers in the High Public Access scenario. Table 7 summarizes various quantitative assumptions for each scenario, including the percentage of BEVs and PHEVs without home charging.
For PEVs that do have home charging, about 70 to 85 percent of all electricity used is provided through home charging, depending on the scenario, PEV type (100-mile BEV or 20-mile PHEV), and EVSE type (Level 1 or Level 2). Workplace and public charging provide the remaining electricity required, as well as 100 percent of the electricity for PEVs without home chargers. In sum, home charging provides 85 percent of the electricity in the Home Dominant scenario and 70 percent of the electricity in the High Public Access scenario. This result is compared to the percentage of electricity provided by workplace or public charging in Figure 10a. The distribution of electricity supplied to BEVs and PHEVs within each pair of EVSE location (home, work, public) and type (L1, L2, FC) is indicated in Figure 10b. The percentage of electricity provided by public charging is based upon a series of bottom-up calculations. The percentage of electricity provided by workplace charging is then determined as the difference between total electricity required and the sum of electricity provided by home and public charging. Assumptions used to develop the total amount of public charging are reviewed below.

28
Figure 10 : Distribution by Scenario of EVSE Electricity by EVSE Type (a) and PEV Type (b)
(a)
Source: NREL
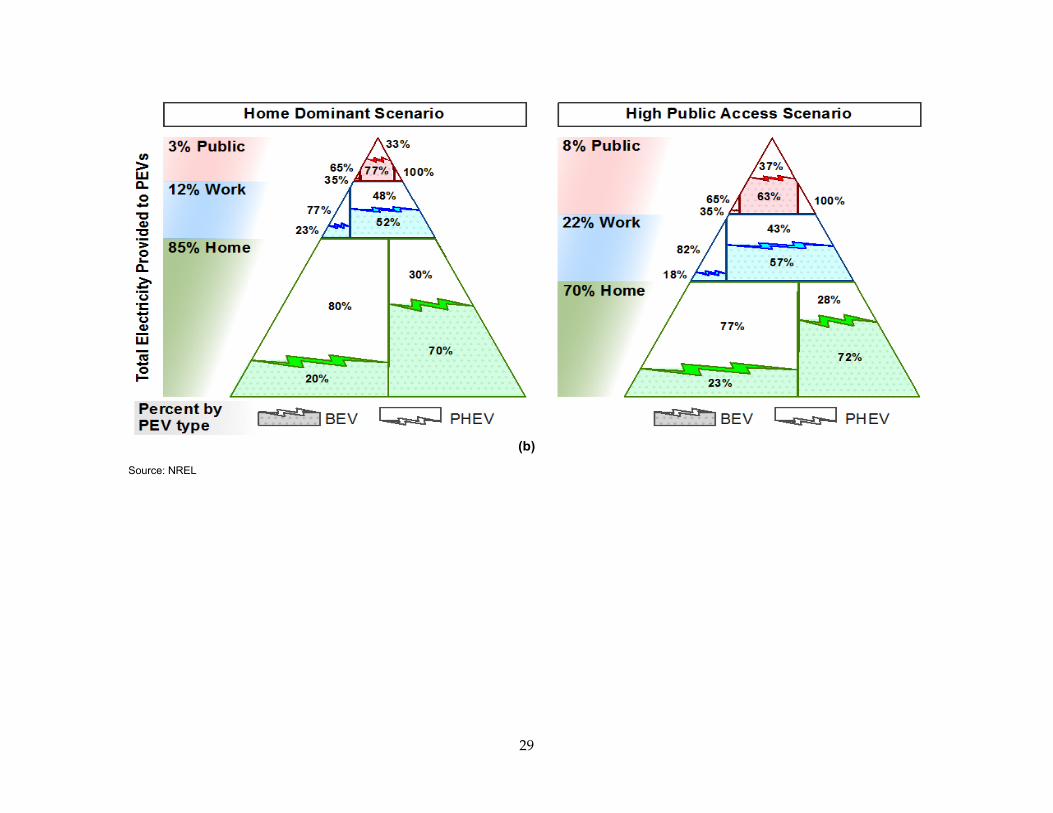
29
(b)
Source: NREL
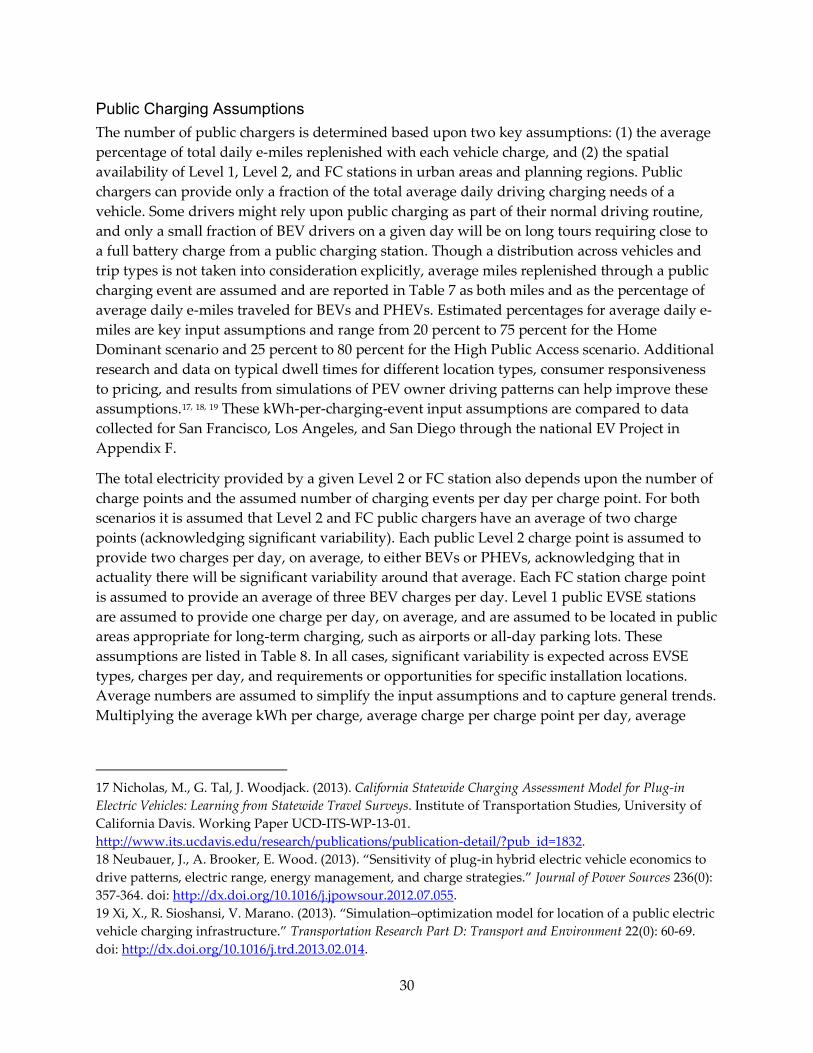
30
Public Charging Assumptions The number of public chargers is determined based upon two key assumptions: (1) the average percentage of total daily e-miles replenished with each vehicle charge, and (2) the spatial availability of Level 1, Level 2, and FC stations in urban areas and planning regions. Public chargers can provide only a fraction of the total average daily driving charging needs of a vehicle. Some drivers might rely upon public charging as part of their normal driving routine, and only a small fraction of BEV drivers on a given day will be on long tours requiring close to a full battery charge from a public charging station. Though a distribution across vehicles and trip types is not taken into consideration explicitly, average miles replenished through a public charging event are assumed and are reported in Table 7 as both miles and as the percentage of average daily e-miles traveled for BEVs and PHEVs. Estimated percentages for average daily e-miles are key input assumptions and range from 20 percent to 75 percent for the Home Dominant scenario and 25 percent to 80 percent for the High Public Access scenario. Additional research and data on typical dwell times for different location types, consumer responsiveness to pricing, and results from simulations of PEV owner driving patterns can help improve these assumptions.17, 18, 19 These kWh-per-charging-event input assumptions are compared to data collected for San Francisco, Los Angeles, and San Diego through the national EV Project in Appendix F.
The total electricity provided by a given Level 2 or FC station also depends upon the number of charge points and the assumed number of charging events per day per charge point. For both scenarios it is assumed that Level 2 and FC public chargers have an average of two charge points (acknowledging significant variability). Each public Level 2 charge point is assumed to provide two charges per day, on average, to either BEVs or PHEVs, acknowledging that in actuality there will be significant variability around that average. Each FC station charge point is assumed to provide an average of three BEV charges per day. Level 1 public EVSE stations are assumed to provide one charge per day, on average, and are assumed to be located in public areas appropriate for long-term charging, such as airports or all-day parking lots. These assumptions are listed in Table 8. In all cases, significant variability is expected across EVSE types, charges per day, and requirements or opportunities for specific installation locations. Average numbers are assumed to simplify the input assumptions and to capture general trends. Multiplying the average kWh per charge, average charge per charge point per day, average
17 Nicholas, M., G. Tal, J. Woodjack. (2013). California Statewide Charging Assessment Model for Plug-in Electric Vehicles: Learning from Statewide Travel Surveys. Institute of Transportation Studies, University of California Davis. Working Paper UCD-ITS-WP-13-01. http://www.its.ucdavis.edu/research/publications/publication-detail/?pub_id=1832. 18 Neubauer, J., A. Brooker, E. Wood. (2013). “Sensitivity of plug-in hybrid electric vehicle economics to drive patterns, electric range, energy management, and charge strategies.” Journal of Power Sources 236(0): 357-364. doi: http://dx.doi.org/10.1016/j.jpowsour.2012.07.055. 19 Xi, X., R. Sioshansi, V. Marano. (2013). “Simulation–optimization model for location of a public electric vehicle charging infrastructure.” Transportation Research Part D: Transport and Environment 22(0): 60-69. doi: http://dx.doi.org/10.1016/j.trd.2013.02.014.
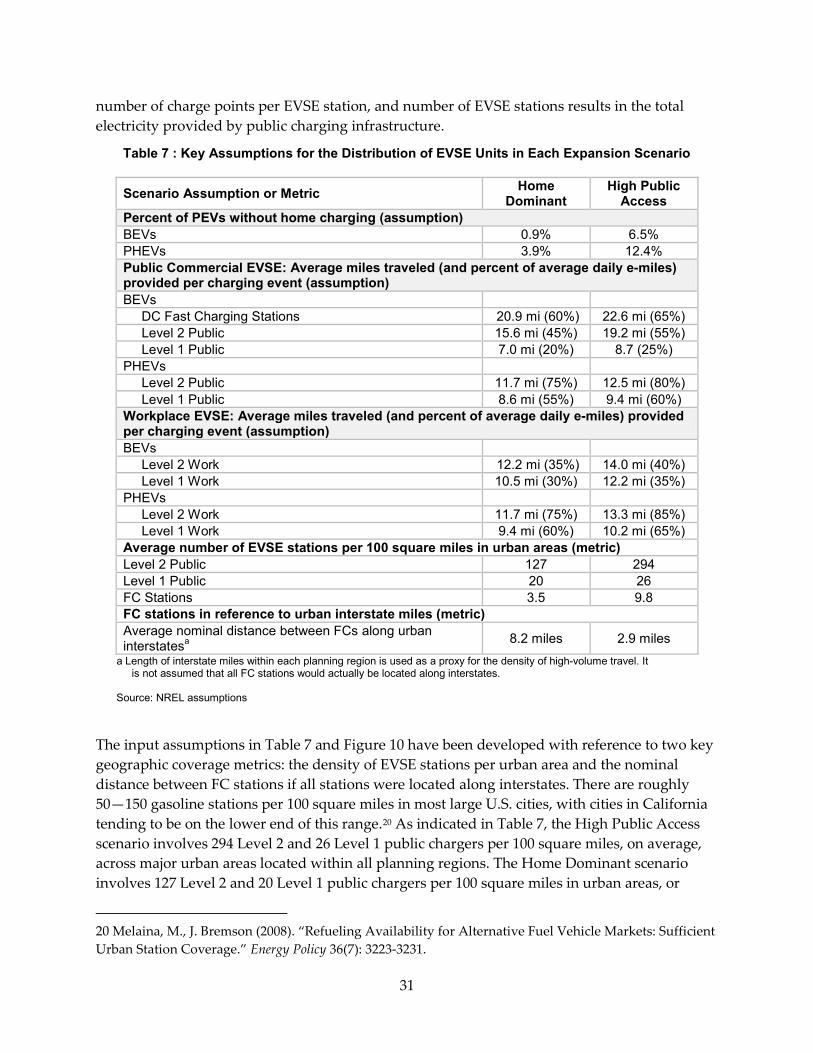
31
number of charge points per EVSE station, and number of EVSE stations results in the total electricity provided by public charging infrastructure.
Table 7 : Key Assumptions for the Distribution of EVSE Units in Each Expansion Scenario
Scenario Assumption or Metric Home Dominant
High Public Access
Percent of PEVs without home charging (assumption) BEVs 0.9% 6.5% PHEVs 3.9% 12.4% Public Commercial EVSE: Average miles traveled (and percent of average daily e-miles) provided per charging event (assumption) BEVs DC Fast Charging Stations 20.9 mi (60%) 22.6 mi (65%) Level 2 Public 15.6 mi (45%) 19.2 mi (55%) Level 1 Public 7.0 mi (20%) 8.7 (25%) PHEVs Level 2 Public 11.7 mi (75%) 12.5 mi (80%) Level 1 Public 8.6 mi (55%) 9.4 mi (60%) Workplace EVSE: Average miles traveled (and percent of average daily e-miles) provided per charging event (assumption) BEVs Level 2 Work 12.2 mi (35%) 14.0 mi (40%) Level 1 Work 10.5 mi (30%) 12.2 mi (35%) PHEVs Level 2 Work 11.7 mi (75%) 13.3 mi (85%) Level 1 Work 9.4 mi (60%) 10.2 mi (65%) Average number of EVSE stations per 100 square miles in urban areas (metric) Level 2 Public 127 294 Level 1 Public 20 26 FC Stations 3.5 9.8 FC stations in reference to urban interstate miles (metric) Average nominal distance between FCs along urban interstatesa 8.2 miles 2.9 miles
a Length of interstate miles within each planning region is used as a proxy for the density of high-volume travel. It is not assumed that all FC stations would actually be located along interstates.
Source: NREL assumptions
The input assumptions in Table 7 and Figure 10 have been developed with reference to two key geographic coverage metrics: the density of EVSE stations per urban area and the nominal distance between FC stations if all stations were located along interstates. There are roughly 50—150 gasoline stations per 100 square miles in most large U.S. cities, with cities in California tending to be on the lower end of this range.20 As indicated in Table 7, the High Public Access scenario involves 294 Level 2 and 26 Level 1 public chargers per 100 square miles, on average, across major urban areas located within all planning regions. The Home Dominant scenario involves 127 Level 2 and 20 Level 1 public chargers per 100 square miles in urban areas, or
20 Melaina, M., J. Bremson (2008). “Refueling Availability for Alternative Fuel Vehicle Markets: Sufficient Urban Station Coverage.” Energy Policy 36(7): 3223-3231.
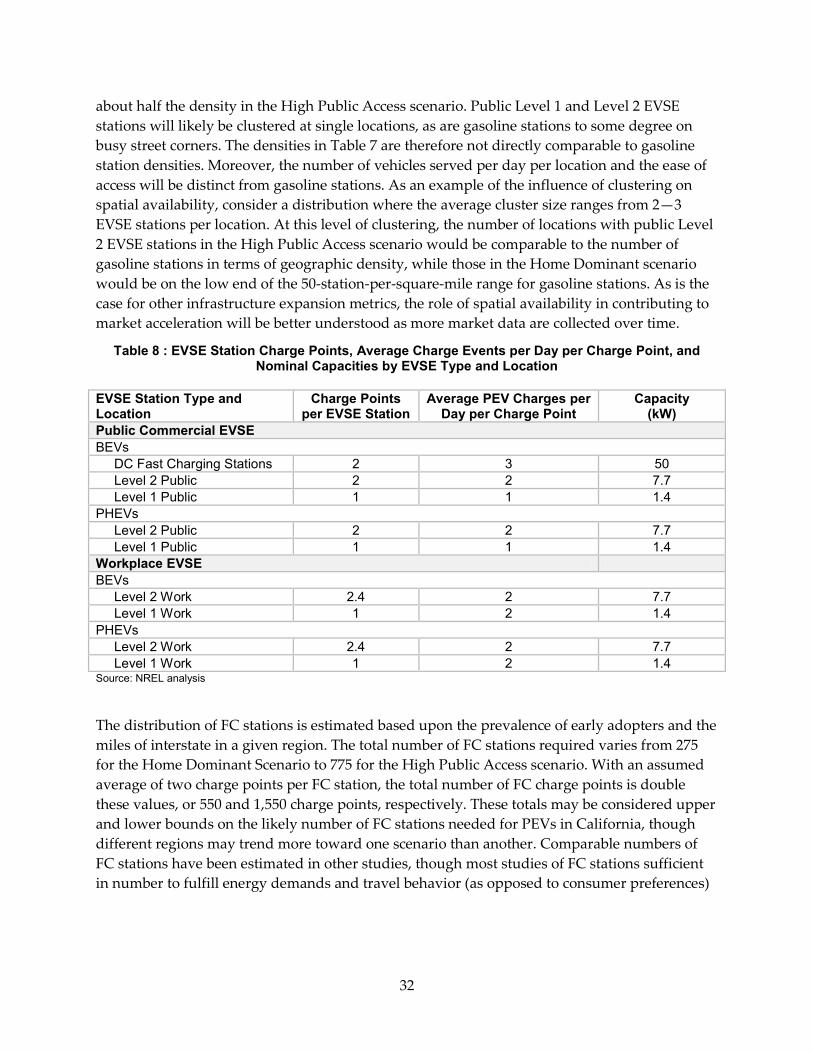
32
about half the density in the High Public Access scenario. Public Level 1 and Level 2 EVSE stations will likely be clustered at single locations, as are gasoline stations to some degree on busy street corners. The densities in Table 7 are therefore not directly comparable to gasoline station densities. Moreover, the number of vehicles served per day per location and the ease of access will be distinct from gasoline stations. As an example of the influence of clustering on spatial availability, consider a distribution where the average cluster size ranges from 2—3 EVSE stations per location. At this level of clustering, the number of locations with public Level 2 EVSE stations in the High Public Access scenario would be comparable to the number of gasoline stations in terms of geographic density, while those in the Home Dominant scenario would be on the low end of the 50-station-per-square-mile range for gasoline stations. As is the case for other infrastructure expansion metrics, the role of spatial availability in contributing to market acceleration will be better understood as more market data are collected over time.
Table 8 : EVSE Station Charge Points, Average Charge Events per Day per Charge Point, and Nominal Capacities by EVSE Type and Location
EVSE Station Type and Location
Charge Points per EVSE Station
Average PEV Charges per Day per Charge Point
Capacity (kW)
Public Commercial EVSE BEVs DC Fast Charging Stations 2 3 50 Level 2 Public 2 2 7.7 Level 1 Public 1 1 1.4 PHEVs Level 2 Public 2 2 7.7 Level 1 Public 1 1 1.4 Workplace EVSE BEVs Level 2 Work 2.4 2 7.7 Level 1 Work 1 2 1.4 PHEVs Level 2 Work 2.4 2 7.7 Level 1 Work 1 2 1.4 Source: NREL analysis
The distribution of FC stations is estimated based upon the prevalence of early adopters and the miles of interstate in a given region. The total number of FC stations required varies from 275 for the Home Dominant Scenario to 775 for the High Public Access scenario. With an assumed average of two charge points per FC station, the total number of FC charge points is double these values, or 550 and 1,550 charge points, respectively. These totals may be considered upper and lower bounds on the likely number of FC stations needed for PEVs in California, though different regions may trend more toward one scenario than another. Comparable numbers of FC stations have been estimated in other studies, though most studies of FC stations sufficient in number to fulfill energy demands and travel behavior (as opposed to consumer preferences)
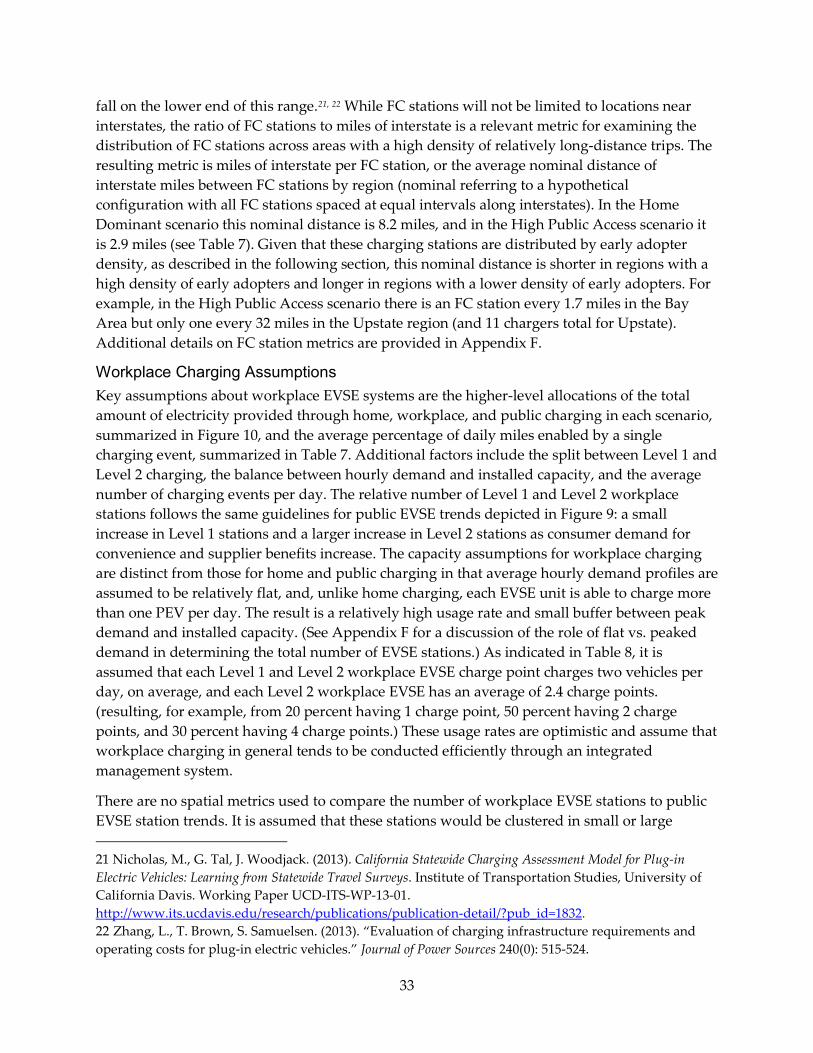
33
fall on the lower end of this range.21, 22 While FC stations will not be limited to locations near interstates, the ratio of FC stations to miles of interstate is a relevant metric for examining the distribution of FC stations across areas with a high density of relatively long-distance trips. The resulting metric is miles of interstate per FC station, or the average nominal distance of interstate miles between FC stations by region (nominal referring to a hypothetical configuration with all FC stations spaced at equal intervals along interstates). In the Home Dominant scenario this nominal distance is 8.2 miles, and in the High Public Access scenario it is 2.9 miles (see Table 7). Given that these charging stations are distributed by early adopter density, as described in the following section, this nominal distance is shorter in regions with a high density of early adopters and longer in regions with a lower density of early adopters. For example, in the High Public Access scenario there is an FC station every 1.7 miles in the Bay Area but only one every 32 miles in the Upstate region (and 11 chargers total for Upstate). Additional details on FC station metrics are provided in Appendix F.
Workplace Charging Assumptions Key assumptions about workplace EVSE systems are the higher-level allocations of the total amount of electricity provided through home, workplace, and public charging in each scenario, summarized in Figure 10, and the average percentage of daily miles enabled by a single charging event, summarized in Table 7. Additional factors include the split between Level 1 and Level 2 charging, the balance between hourly demand and installed capacity, and the average number of charging events per day. The relative number of Level 1 and Level 2 workplace stations follows the same guidelines for public EVSE trends depicted in Figure 9: a small increase in Level 1 stations and a larger increase in Level 2 stations as consumer demand for convenience and supplier benefits increase. The capacity assumptions for workplace charging are distinct from those for home and public charging in that average hourly demand profiles are assumed to be relatively flat, and, unlike home charging, each EVSE unit is able to charge more than one PEV per day. The result is a relatively high usage rate and small buffer between peak demand and installed capacity. (See Appendix F for a discussion of the role of flat vs. peaked demand in determining the total number of EVSE stations.) As indicated in Table 8, it is assumed that each Level 1 and Level 2 workplace EVSE charge point charges two vehicles per day, on average, and each Level 2 workplace EVSE has an average of 2.4 charge points. (resulting, for example, from 20 percent having 1 charge point, 50 percent having 2 charge points, and 30 percent having 4 charge points.) These usage rates are optimistic and assume that workplace charging in general tends to be conducted efficiently through an integrated management system.
There are no spatial metrics used to compare the number of workplace EVSE stations to public EVSE station trends. It is assumed that these stations would be clustered in small or large 21 Nicholas, M., G. Tal, J. Woodjack. (2013). California Statewide Charging Assessment Model for Plug-in Electric Vehicles: Learning from Statewide Travel Surveys. Institute of Transportation Studies, University of California Davis. Working Paper UCD-ITS-WP-13-01. http://www.its.ucdavis.edu/research/publications/publication-detail/?pub_id=1832. 22 Zhang, L., T. Brown, S. Samuelsen. (2013). “Evaluation of charging infrastructure requirements and operating costs for plug-in electric vehicles.” Journal of Power Sources 240(0): 515-524.
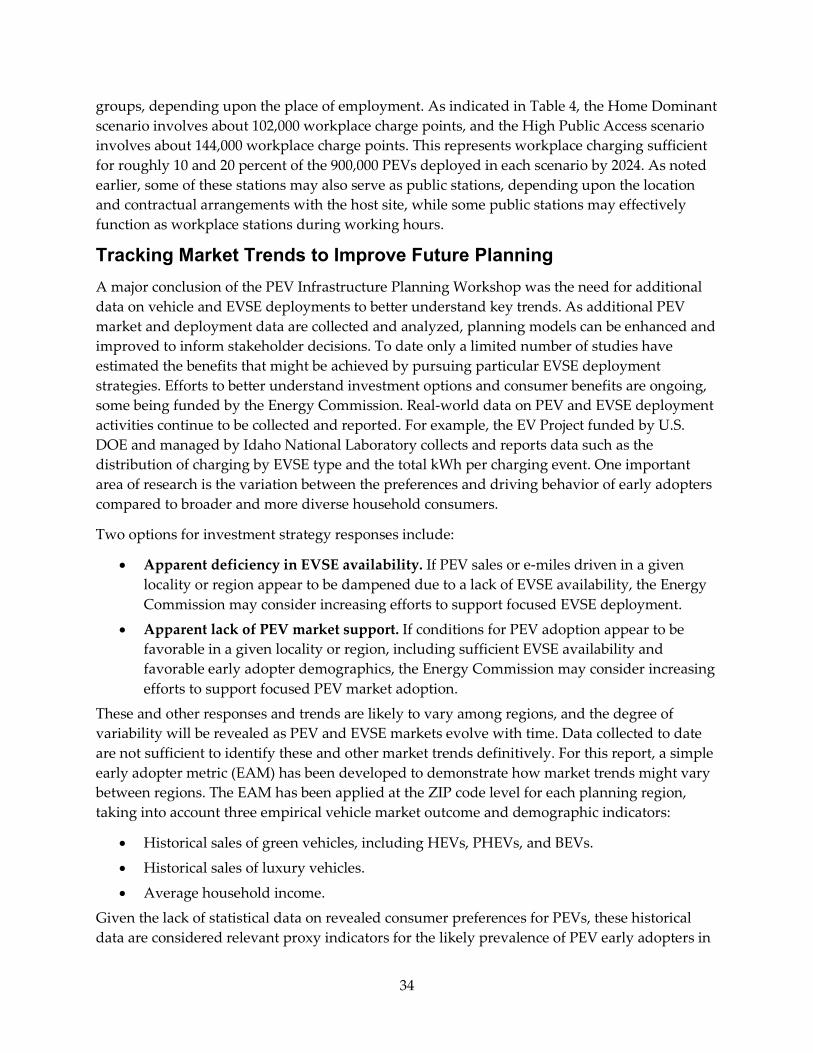
34
groups, depending upon the place of employment. As indicated in Table 4, the Home Dominant scenario involves about 102,000 workplace charge points, and the High Public Access scenario involves about 144,000 workplace charge points. This represents workplace charging sufficient for roughly 10 and 20 percent of the 900,000 PEVs deployed in each scenario by 2024. As noted earlier, some of these stations may also serve as public stations, depending upon the location and contractual arrangements with the host site, while some public stations may effectively function as workplace stations during working hours.
Tracking Market Trends to Improve Future Planning A major conclusion of the PEV Infrastructure Planning Workshop was the need for additional data on vehicle and EVSE deployments to better understand key trends. As additional PEV market and deployment data are collected and analyzed, planning models can be enhanced and improved to inform stakeholder decisions. To date only a limited number of studies have estimated the benefits that might be achieved by pursuing particular EVSE deployment strategies. Efforts to better understand investment options and consumer benefits are ongoing, some being funded by the Energy Commission. Real-world data on PEV and EVSE deployment activities continue to be collected and reported. For example, the EV Project funded by U.S. DOE and managed by Idaho National Laboratory collects and reports data such as the distribution of charging by EVSE type and the total kWh per charging event. One important area of research is the variation between the preferences and driving behavior of early adopters compared to broader and more diverse household consumers.
Two options for investment strategy responses include:
• Apparent deficiency in EVSE availability. If PEV sales or e-miles driven in a given locality or region appear to be dampened due to a lack of EVSE availability, the Energy Commission may consider increasing efforts to support focused EVSE deployment.
• Apparent lack of PEV market support. If conditions for PEV adoption appear to be favorable in a given locality or region, including sufficient EVSE availability and favorable early adopter demographics, the Energy Commission may consider increasing efforts to support focused PEV market adoption.
These and other responses and trends are likely to vary among regions, and the degree of variability will be revealed as PEV and EVSE markets evolve with time. Data collected to date are not sufficient to identify these and other market trends definitively. For this report, a simple early adopter metric (EAM) has been developed to demonstrate how market trends might vary between regions. The EAM has been applied at the ZIP code level for each planning region, taking into account three empirical vehicle market outcome and demographic indicators:
• Historical sales of green vehicles, including HEVs, PHEVs, and BEVs.
• Historical sales of luxury vehicles.
• Average household income.
Given the lack of statistical data on revealed consumer preferences for PEVs, these historical data are considered relevant proxy indicators for the likely prevalence of PEV early adopters in
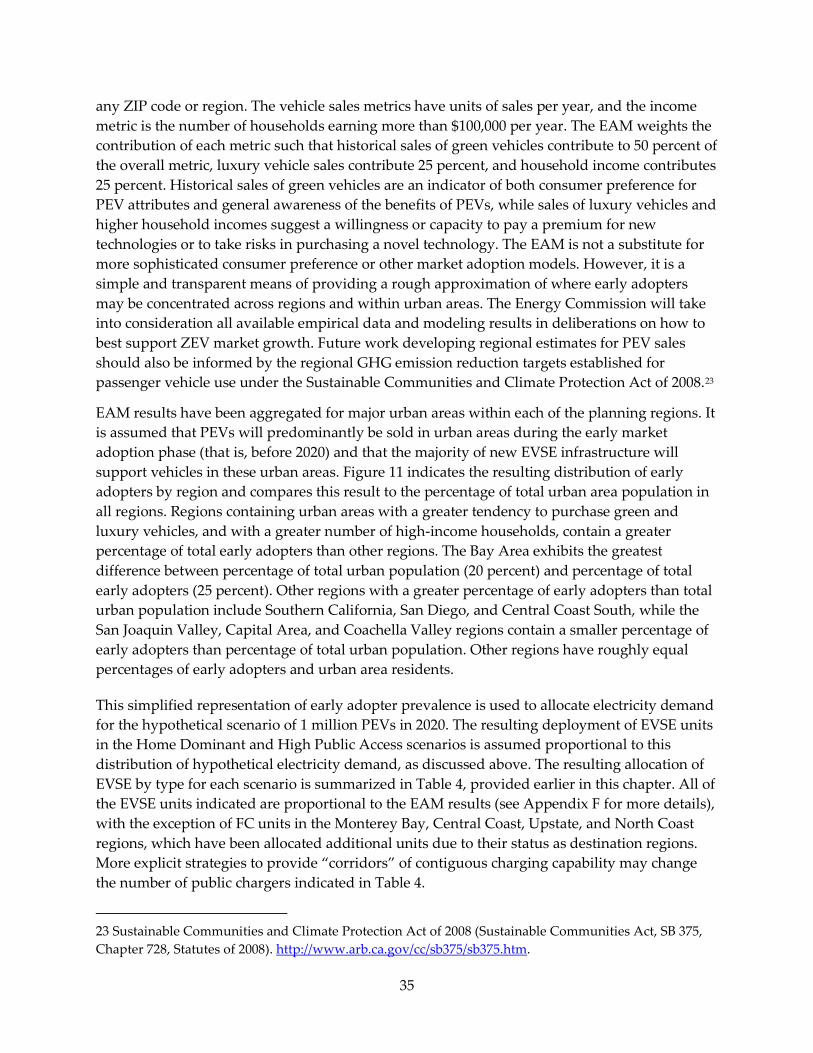
35
any ZIP code or region. The vehicle sales metrics have units of sales per year, and the income metric is the number of households earning more than $100,000 per year. The EAM weights the contribution of each metric such that historical sales of green vehicles contribute to 50 percent of the overall metric, luxury vehicle sales contribute 25 percent, and household income contributes 25 percent. Historical sales of green vehicles are an indicator of both consumer preference for PEV attributes and general awareness of the benefits of PEVs, while sales of luxury vehicles and higher household incomes suggest a willingness or capacity to pay a premium for new technologies or to take risks in purchasing a novel technology. The EAM is not a substitute for more sophisticated consumer preference or other market adoption models. However, it is a simple and transparent means of providing a rough approximation of where early adopters may be concentrated across regions and within urban areas. The Energy Commission will take into consideration all available empirical data and modeling results in deliberations on how to best support ZEV market growth. Future work developing regional estimates for PEV sales should also be informed by the regional GHG emission reduction targets established for passenger vehicle use under the Sustainable Communities and Climate Protection Act of 2008.23
EAM results have been aggregated for major urban areas within each of the planning regions. It is assumed that PEVs will predominantly be sold in urban areas during the early market adoption phase (that is, before 2020) and that the majority of new EVSE infrastructure will support vehicles in these urban areas. Figure 11 indicates the resulting distribution of early adopters by region and compares this result to the percentage of total urban area population in all regions. Regions containing urban areas with a greater tendency to purchase green and luxury vehicles, and with a greater number of high-income households, contain a greater percentage of total early adopters than other regions. The Bay Area exhibits the greatest difference between percentage of total urban population (20 percent) and percentage of total early adopters (25 percent). Other regions with a greater percentage of early adopters than total urban population include Southern California, San Diego, and Central Coast South, while the San Joaquin Valley, Capital Area, and Coachella Valley regions contain a smaller percentage of early adopters than percentage of total urban population. Other regions have roughly equal percentages of early adopters and urban area residents.
This simplified representation of early adopter prevalence is used to allocate electricity demand for the hypothetical scenario of 1 million PEVs in 2020. The resulting deployment of EVSE units in the Home Dominant and High Public Access scenarios is assumed proportional to this distribution of hypothetical electricity demand, as discussed above. The resulting allocation of EVSE by type for each scenario is summarized in Table 4, provided earlier in this chapter. All of the EVSE units indicated are proportional to the EAM results (see Appendix F for more details), with the exception of FC units in the Monterey Bay, Central Coast, Upstate, and North Coast regions, which have been allocated additional units due to their status as destination regions. More explicit strategies to provide “corridors” of contiguous charging capability may change the number of public chargers indicated in Table 4.
23 Sustainable Communities and Climate Protection Act of 2008 (Sustainable Communities Act, SB 375, Chapter 728, Statutes of 2008). http://www.arb.ca.gov/cc/sb375/sb375.htm.
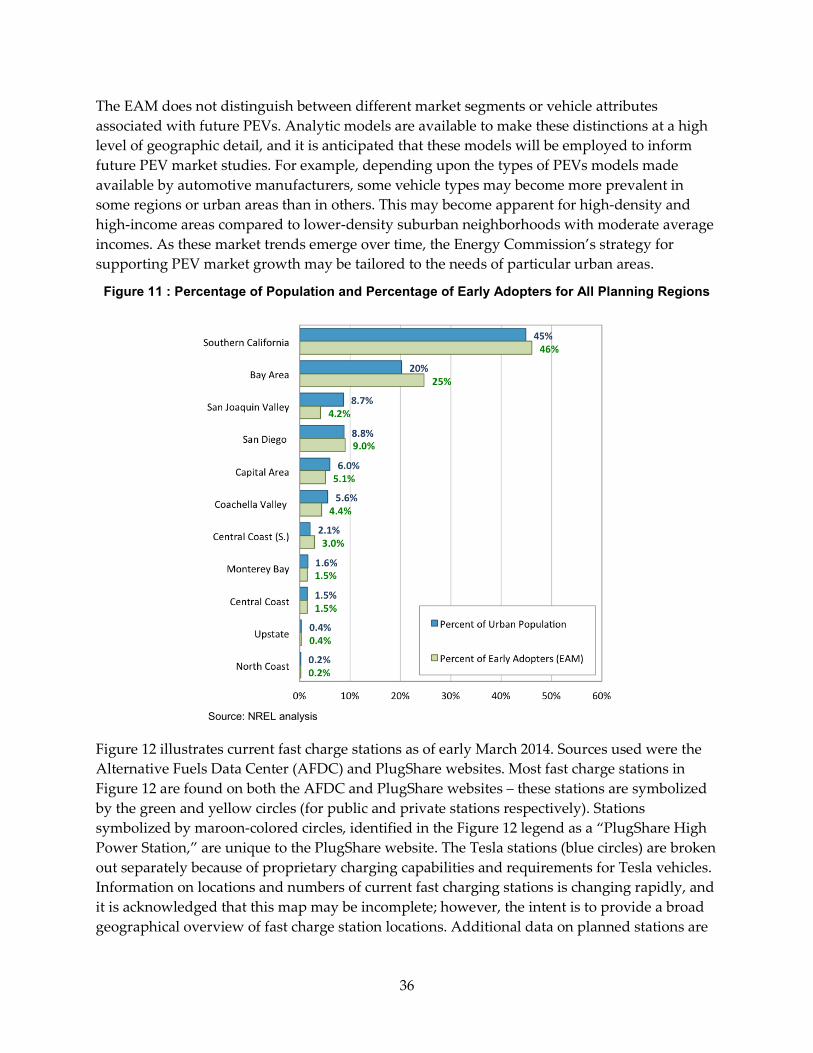
36
The EAM does not distinguish between different market segments or vehicle attributes associated with future PEVs. Analytic models are available to make these distinctions at a high level of geographic detail, and it is anticipated that these models will be employed to inform future PEV market studies. For example, depending upon the types of PEVs models made available by automotive manufacturers, some vehicle types may become more prevalent in some regions or urban areas than in others. This may become apparent for high-density and high-income areas compared to lower-density suburban neighborhoods with moderate average incomes. As these market trends emerge over time, the Energy Commission’s strategy for supporting PEV market growth may be tailored to the needs of particular urban areas.
Figure 11 : Percentage of Population and Percentage of Early Adopters for All Planning Regions
Source: NREL analysis
Figure 12 illustrates current fast charge stations as of early March 2014. Sources used were the Alternative Fuels Data Center (AFDC) and PlugShare websites. Most fast charge stations in Figure 12 are found on both the AFDC and PlugShare websites – these stations are symbolized by the green and yellow circles (for public and private stations respectively). Stations symbolized by maroon-colored circles, identified in the Figure 12 legend as a “PlugShare High Power Station,” are unique to the PlugShare website. The Tesla stations (blue circles) are broken out separately because of proprietary charging capabilities and requirements for Tesla vehicles. Information on locations and numbers of current fast charging stations is changing rapidly, and it is acknowledged that this map may be incomplete; however, the intent is to provide a broad geographical overview of fast charge station locations. Additional data on planned stations are

37
available from other sources, such as the regional plans, and will also be updated over time as plans and market conditions change.
The EVSE infrastructure expansion scenarios discussed above include many simplifying assumptions. Other more detailed studies have provided insight into the degree to which increased availability of public Level 2 and FC stations influences e-miles and PEV utility in general.24 These simulations are examples of the types of planning models that will improve over time as additional data are collected on PEV and EVSE market trends.
Figure 12 : Existing DC Fast Chargers by Source and Planning Region
Sources: AFDC and PlugShare websites
24 See the following: Neubauer, J., E. Wood. (2014). “The Impact of Range Anxiety and Home, Workplace, and Public Charging Infrastructure on Simulated Battery Electric Vehicle Lifetime Utility.” Journal of Power Sources 257(0): 12-20; Zhang, L., T. Brown, G.S. Samuelsen. “The optimization of DC fast charging deployment in California.” Journal of Power Sources 2013, submitted.

38
One limitation of the present analysis is the assumption that all FC stations have 50 kW capacity, and each is allocated an average kWh-per-year usage rate. In reality, there will be significant diversity among types of FC stations, especially with respect to geographic coverage and anticipated usage rates. This diversity is suggested in results from a University of California (UC) Davis study of future FC station demand based upon a simulation using California Department of Transportation (Caltrans) 2001 California Statewide Travel Survey data.25 The resulting demand at FC locations is indicated geographically in Figure 13, with both the number of stations and charging intensity concentrated in the Bay Area and Los Angeles basin and between adjacent metropolitan regions, such as the Bay Area to Sacramento or Los Angeles to San Diego. A significant number of stations with relatively low demand are located near smaller urban areas and along major interstates and highways. Also affecting the spatial distribution of demand and the total demand in kWh is the battery size of vehicles using the network. As indicated by the distribution of gold (100 mile BEVs) and blue (300 mile BEVs) circles, if battery size and all-electric range grow, FC station demand will tend to shift away from metro areas to more remote interstate locations. The inset graph in Figure 13 indicates the reduction in charging at FC stations within metro areas as battery size increases.
25 Nicholas, M., G. Tal, J. Woodjack. (2013). California Statewide Charging Assessment Model for Plug-in Electric Vehicles: Learning from Statewide Travel Surveys. Institute of Transportation Studies, University of California Davis. Working Paper UCD-ITS-WP-13-01. http://www.its.ucdavis.edu/research/publications/publication-detail/?pub_id=1832.
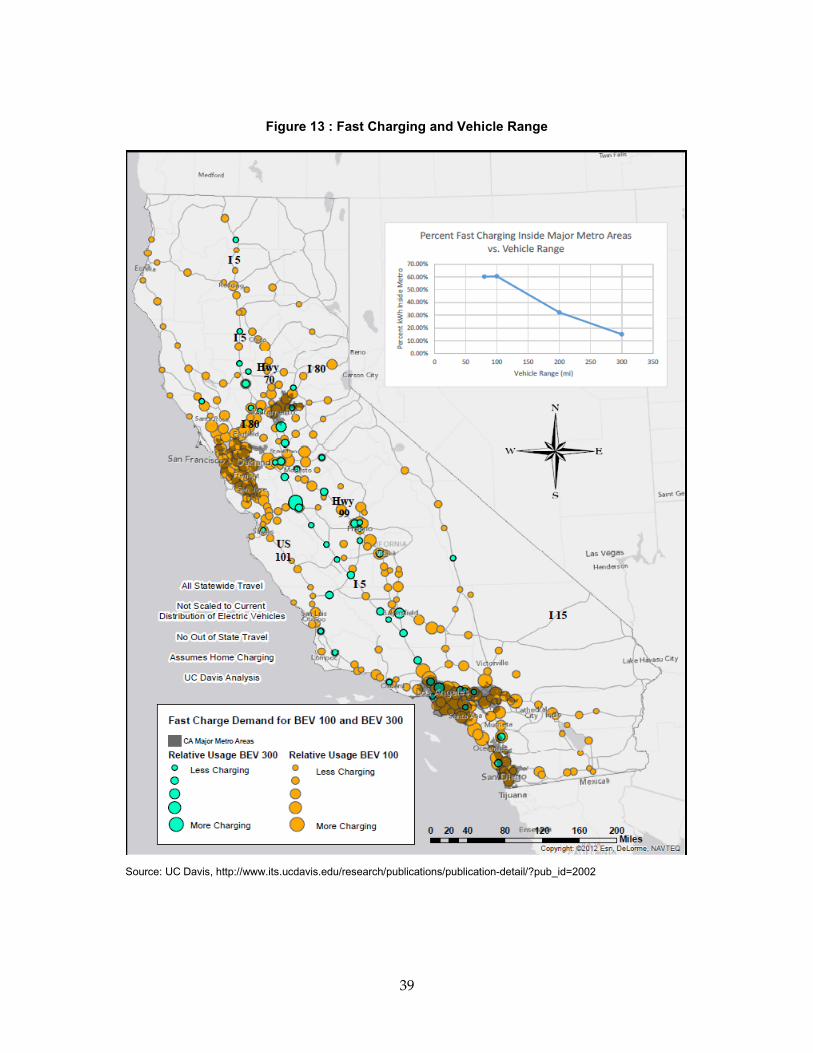
39
Figure 13 : Fast Charging and Vehicle Range
Source: UC Davis, http://www.its.ucdavis.edu/research/publications/publication-detail/?pub_id=2002
40
CHAPTER 4: The Energy Commission’s Conclusions, Recommendations, and Intentions
This chapter summarizes Energy Commission conclusions, recommendations, and intentions for a variety of PEV- and EVSE-related efforts and issues. It begins with a brief list of recently developed and future resources and then proceeds to address PEV-related topics, including those most frequently identified at the Statewide PEV Infrastructure Plan Stakeholder Workshop, those that often arise at stakeholder meetings and/or in various publications, and many of those assigned to the Energy Commission as lead agency in the 2013 ZEV Action Plan. Conclusions are based on previous studies and publications, stakeholder feedback and input, and subject matter expert input. Because this assessment is an evolving document, some of these conclusions and intended courses of action will be updated over time.
The Energy Commission intends to continue its support for PEV/EVSE development stakeholders. Several initiatives are recently completed or under development, including:
• Statewide PEV Infrastructure Assessment. This document fulfills the requirement.
• Governor’s Office ZEV Community Readiness Guidebook. Available now at the Office of Planning and Research website, http://opr.ca.gov/docs/ZEV_Guidebook.pdf.
• 10 regional PEV plans. In progress with completion in 2014, supported by the Energy Commission.
• Regular stakeholder meetings. Regularly scheduled meetings began in February 2013.
• Dissemination and availability of data. Ongoing effort; addressed by “Data” and “Interaction and Facilitation” sections below.
• Model analyses. Addressed by “EVSE Siting and Infrastructure” section below.
The Energy Commission’s PEV-related conclusions, recommendations, and intentions are categorized into four sections:
• EVSE Siting and Infrastructure
• Policy
• Data
• Interaction and Facilitation
There is overlap among these categories. For example, some policy actions could involve infrastructure. However, a specific issue will be identified only once in the category deemed most appropriate.
41
EVSE Siting and Infrastructure
The Energy Commission believes there are multiple reasons for supporting EVSE development, including:
• Expanding PEV market growth.
• Increasing the number of miles traveled using electricity as a fuel (e-miles).
• Social and environmental benefits.
• Financial and economic benefits.
First Step The Energy Commission will support a broad range of programs and projects aimed at increasing the deployment of PEVs in California, but it believes that, before determining what type of EVSE should be installed in which locations, a more fundamental question of why EVSE is desired in the first place should be addressed. The text box to the right provides some possible answers. Knowing what one’s goals are can influence the location and type of EVSE infrastructure to install. The Energy Commission also understands that most charging – in the near term – will occur at home.
Entities should identify their goals for installing EVSE before trying to determine EVSE locations. Some locations for EVSE installation become obvious after this initial step is completed. For example, if the intent is to attract PEV drivers to a certain destination, then EVSE should be installed at that destination. If the intent is to provide safe, convenient charging, then well-lit, monitored stations at shopping centers may be an option.
Anticipated EVSE Use In most cases, publicly funded EVSE infrastructure should be developed with the understanding and belief that EVSE will be used regularly. This belief should be based on existing agreements with fleet operators, sound technical analyses, examples of similar successful applications, and factors within control of the installer. However, there are many reasons for installing EVSE, and high use rates are not an absolute requirement in some cases. For example, EVSE installation considerations can also include building consumer confidence and providing safe charging opportunities for drivers. The Energy Commission acknowledges efforts aimed at identifying potential future charging locations, including (among others) ongoing efforts at UCLA, UC Irvine, UC Davis, and Humboldt State University, and it believes there is need for a more comprehensive predictive model that can project PEV growth and travel patterns to help make sound, analytically based recommendations on locations for publicly available charging.
Why install EVSE? The answer may seem obvious, but benefits could include attracting customers to retail locations and increasing sales due to increased customer shopping time, providing convenient and safe charging, displaying a “green” image, providing employees with a perk, attracting drivers to a certain destination, or some combination of the above.
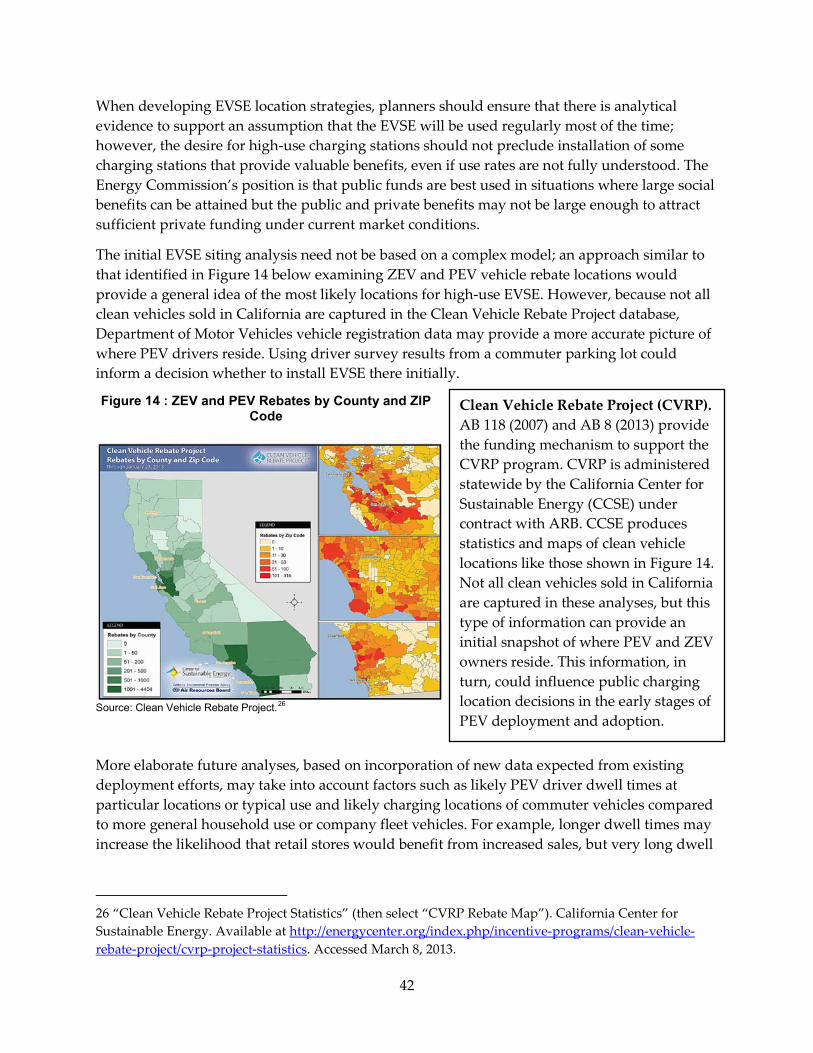
42
When developing EVSE location strategies, planners should ensure that there is analytical evidence to support an assumption that the EVSE will be used regularly most of the time; however, the desire for high-use charging stations should not preclude installation of some charging stations that provide valuable benefits, even if use rates are not fully understood. The Energy Commission’s position is that public funds are best used in situations where large social benefits can be attained but the public and private benefits may not be large enough to attract sufficient private funding under current market conditions.
The initial EVSE siting analysis need not be based on a complex model; an approach similar to that identified in Figure 14 below examining ZEV and PEV vehicle rebate locations would provide a general idea of the most likely locations for high-use EVSE. However, because not all clean vehicles sold in California are captured in the Clean Vehicle Rebate Project database, Department of Motor Vehicles vehicle registration data may provide a more accurate picture of where PEV drivers reside. Using driver survey results from a commuter parking lot could inform a decision whether to install EVSE there initially.
Figure 14 : ZEV and PEV Rebates by County and ZIP Code
Source: Clean Vehicle Rebate Project.26
More elaborate future analyses, based on incorporation of new data expected from existing deployment efforts, may take into account factors such as likely PEV driver dwell times at particular locations or typical use and likely charging locations of commuter vehicles compared to more general household use or company fleet vehicles. For example, longer dwell times may increase the likelihood that retail stores would benefit from increased sales, but very long dwell
26 “Clean Vehicle Rebate Project Statistics” (then select “CVRP Rebate Map”). California Center for Sustainable Energy. Available at http://energycenter.org/index.php/incentive-programs/clean-vehicle-rebate-project/cvrp-project-statistics. Accessed March 8, 2013.
Clean Vehicle Rebate Project (CVRP). AB 118 (2007) and AB 8 (2013) provide the funding mechanism to support the CVRP program. CVRP is administered statewide by the California Center for Sustainable Energy (CCSE) under contract with ARB. CCSE produces statistics and maps of clean vehicle locations like those shown in Figure 14. Not all clean vehicles sold in California are captured in these analyses, but this type of information can provide an initial snapshot of where PEV and ZEV owners reside. This information, in turn, could influence public charging location decisions in the early stages of PEV deployment and adoption.
43
times may result in underuse of installed EVSE. A better understanding of this tradeoff can improve the efficient use of public funds.
The Energy Commission intends to support efforts aimed at developing and refining analytical tools that will identify the best locations for initial PEV infrastructure. In the meantime, there are likely some “can’t miss” locations for EVSE, for example, homes where the residents own a PEV and multiunit dwellings (MUDs) and/or workplaces whose occupants have indicated that the presence of EVSE might, or will, influence their decision to own a PEV. Areas near public transportation or at airports are addressed later in this document.
Charging Locations Multiple studies completed to date suggest that, at least for the foreseeable future, the vast majority (perhaps 70 percent to 90 percent) of PEV charging will occur at home.27,28,29,30 Residential charging is a broad category that encompasses different types of charging infrastructure options and different types of homes. Charging options include Level 1 or Level 2, and there are tradeoffs associated with each. Level 1 charging infrastructure costs are often negligible, while Level 2 chargers can cost hundreds or thousands of dollars, depending on the required level of electrical upgrade. Level 1 charging can provide about 3 to 5 miles of driving range per hour charged; Level 2 charging provides on the order of three to four times as much range per hour charged compared to Level 1 charging.
Homes can also be classified as single-family homes or as MUDs. MUDs are very appealing in terms of providing charging access to multiple PEV drivers. Unfortunately, there is no standard approach that will work for all MUDs. Some of these housing units may eventually house a relatively large percentage of PEV drivers; other may have few to none. Surveys of these housing unit occupants and landlords should influence the decision to install PEV infrastructure at MUDs and/or workplaces. MUD electrical systems would need to be evaluated to determine if they are capable of handling PEV charging. If the number of PEVs exceeded the number of charging outlets, a charging sharing system could be developed and implemented.
Workplace charging will be a high priority behind home charging for the near term. Workplace charging essentially doubles commuting range, and the availability of workplace charging – especially free charging – is a convenience used frequently by PEV owners today. Figure 3
27 ECOtality. (2013). The EV Project Q4 2012 Report. http://www.theevproject.com/downloads/documents/Q4%202012%20EVP%20Report.pdf. Accessed March 17, 2013. 28 “Developing a Charging Network for PEVs in California.” (2011). PowerPoint presentation developed by University of California, Davis. http://www.energy.ca.gov/2011_energypolicy/documents/2011-05-11_workshop/presentations/UC_Davis.pdf. Accessed March 9, 2013. 29 SCAQMD California Plug-In Electric Vehicle (PEV) Readiness Project Final Report. (updated January 3, 2013). http://www.evcollaborative.org/sites/all/themes/pev/files/docs/ca_pev_readiness_report_final.pdf. Accessed March 7, 2013. 30 Luskin Center. (December 2012). Southern California Plug-in Electric Vehicle Readiness Plan. http://164.67.121.27/files/Downloads/luskincenter/ev/PEV_Readiness_Plan_Ch05.pdf. Accessed April 2, 2013.
44
illustrates that more than one-third of California PEV drivers had access to workplace charging and that, even if PEV drivers had to pay for charging, many of them were willing to do so. An employer may choose to require payment for charging when demand for PEV parking exceeds supply and to help separate those who are shifting demand from home to work simply to take advantage of free charging. Allocation of resources will be important as competition for charging parking spots increases, and BEVs may be given charging priority over PHEVs, depending on an employer’s perspective.
The California Plug-in Electric Vehicle Collaborative website (http://www.evcollaborative.org/resources) contains several documents that provide guidelines for property owners, managers, and residents of MUDs who wish to install charging infrastructure. Similar guidelines and recommendations related to workplace charging are available on this website.
Corridor charging will complement home, workplace, and other public charging sites; provide drivers with the ability to travel farther distances; and likely increase prospective PEV consumer confidence. Some studies indicate that installation of between 200 and 300 fast chargers throughout California could provide adequate charging coverage for most PEV drivers for the near term,31,32 and the installation of 200 or more fast charge station locations under the NRG settlement, as well as investments by the Energy Commission, air quality management districts, publicly owned utilities, and Tesla may be sufficient for the immediate future. While residential and workplace charging efforts may receive high priority, the Energy Commission does not necessarily intend to support home and workplace charging at the expense of fast charging. In many cases, PEV owners can afford the expense of acquiring home charging EVSE or can take advantage of incentives. It is possible that Energy Commission investments may best be used for “higher risk” fast charging opportunities – those with less certain economic cost-effectiveness, for example. The Energy Commission’s emphasis on fast charge stations may shift as it receives data indicating market growth or consumer demand, such as performance and use rates of Energy Commission-funded stations and NRG stations.
Corridor charging is one of the most challenging topics associated with this assessment. Uncertainties in annual PEV market sales, PEV travel patterns, and the siting of fast charge stations under the NRG settlement all contribute to an evolving fast charge strategy in interregional corridors. Furthermore, while the need for convenient, safe corridor charging is understood, so is the need for a fast charging network that is ultimately economically sustainable. This assessment provides a framework for a more integrated statewide planning process that will incorporate future data on market and technology trends.
31 Nicholas, M., G. Tal, J. Woodjack. (2013). California Statewide Charging Assessment Model for Plug-in Electric Vehicles: Learning from Statewide Travel Surveys. Institute of Transportation Studies, University of California Davis. Working Paper UCD-ITS-WP-13-01. http://www.its.ucdavis.edu/research/publications/publication-detail/?pub_id=1832. 32 Zhang, L., T. Brown, S. Samuelsen. (2013). “Evaluation of charging infrastructure requirements and operating costs for plug-in electric vehicles.” Journal of Power Sources 240(0): 515-524.
45
Fast Charging The Energy Commission’s approach to fast charging installation will consist of two phases, as described below.
• Near term. Based in part on workshop feedback and NRG settlement progress, the Energy Commission will promulgate a fast charger installation strategy that will include analytical and guidance components. The Energy Commission understands the need for an analytically based fast charging siting strategy, and it will explore model development or enhancement opportunities that could help identify ideal fast charging locations. Models used by several universities in California could be expanded, for example, for this purpose. The Energy Commission recently supported a Governor’s Office of Business and Economic Development-led (GO-Biz) effort aimed at streamlining permitting processes for ZEV fueling stations, including EVSE and hydrogen fueling infrastructure. The Energy Commission will continue to hold regularly scheduled meetings with regional representatives to understand siting processes and concerns of the various regions. Regions like the Monterey Bay Area that are not scheduled to have fast charging stations installed under the current NRG settlement plan may be an area of higher focus for the Energy Commission. Detailed model results are not required to identify this region as one that may be underserved for fast charging installations in the near term.
The Energy Commission intends to support privately developed infrastructure to the greatest extent practicable. A multiagency workshop focusing on interoperability was held in August 2013. This workshop focused on EVSE infrastructure standards to provide the private sector with an opportunity to influence, comment on, and understand infrastructure standard issues. The primary purpose of the workshop was to address the 2013 ZEV Action Plan’s directive of encouraging industry efforts to develop interoperability standards for charging stations so that PEV drivers can locate, reserve, and be billed for charging regardless of memberships or subscriptions to a network of chargers. A summary of the Interoperability Workshop is provided in Appendix E.
• Longer term. Longer-term fast charging direction will be influenced by results obtained during near-term efforts. Models developed earlier will be tested, validated, and improved. Numbers and locations of required additional fast charging stations will be determined using information from previous efforts. The business cases for interregional fast charging will be better understood.
A major challenge associated with fast charging infrastructure is cost. Fast charge station costs can depend on a variety of factors, including location and relative size of the station compared to other fast charging stations. The draft Bay Area Plug-In Electric Vehicle Readiness Plan fast charge EVSE cost estimates range from $73,000 to $141,000, for example.33 This same analysis attempts to quantify the breakeven pricing mechanism – that is, “the price per charging event
33 Bay Area Air Quality Management District. (September 2013). Bay Area Plug-In Electric Vehicle Readiness Plan: Background and Analysis. http://www.bayareapevready.org/assets/Background-Analysis-PEV-Readiness-Plan-Draft-Final-v2.pdf.
46
that an EVSE provider would have to charge in order to break even on the initial investment by a given year of operation.” Under the assumptions used in this analysis, making a business case for fast charge stations is challenging. In general, a station owner would have to charge significantly more than what a PEV driver would pay for home charging if he or she were to recoup the investment within five years; charging rates that were competitive to home charging might result in a 10-year payback of initial investment – not very appealing to a for-profit business. At this time, some type of financial incentive is likely required to make a business case for FC EVSE investment.
PEV infrastructure planners can use surveys for determining likely use of charging stations at workplaces and destinations like shopping malls and supermarkets. Publicly available charging infrastructure may face the challenge of some vehicles being “plugged in” for several hours when the PEV is fully charged; this challenge is addressed later in this section. The Energy Commission intends to support directly a broad approach to PEV infrastructure, including home, workplace, destination, fleet, and fast charging stations – with an emphasis on home and workplace charging support, as well as key corridors for fast chargers due to the likelihood of influencing early PEV market development.
One example of a long-term strategic fast charging plan is the concept of the West Coast Electric Highway. The intent of this effort is to develop a network of fast charge stations at regular intervals along Interstate 5 through the states of Washington, Oregon, and California. The genesis of this goal was a memorandum of understanding signed in 2008 by representatives from the Department of Transportation for all three states. A major goal was to increase the use of alternative fuel vehicles and alternative fuel, including electricity, along Interstate 5. One can learn about Washington and Oregon EV charging networks by accessing the West Coast Electric Highway website at http://www.westcoastgreenhighway.com/electrichighways.htm. A fully-developed West Coast Electric Highway would establish the West Coast multistate region as a leader in commitment to alternative fuel vehicles and fuels, alleviate range anxiety for long trips up and down the coast, and almost certainly lead to an increase in the adoption of EVs.
PEV Signs The need for PEV charging signs was a recurring theme from stakeholders at the Statewide PEV Infrastructure Plan Stakeholder Workshop. Caltrans recently issued a new policy directive deleting some existing PEV signs and approving others, such as that in Figure 15.34
The 2013 ZEV Action Plan identifies Caltrans as the lead agency charged with installing signs “along highway corridors and local roads to provide directions to PEV charging and hydrogen stations.” The Energy Commission will support Caltrans in this effort, and it notes that Caltrans signs will be focused on a geographic area generally within 3 miles of major roadways, including interstates. The Energy Commission may support efforts to provide additional signage coverage between 3 and 5 miles from major roadways.
34 California DOT Policy Directive 13-01. (Issued March 14, 2013). http://www.dot.ca.gov/hq/traffops/signtech/signdel/policy/13-01.pdf. Accessed March 19, 2013.

47
Figure 15 : Caltrans-Approved PEV Charging Sign
Source: California DOT
EVSE Standards Many stakeholders request Energy Commission support in establishing national standards for EVSE. This was a common recommendation at the Statewide PEV Infrastructure Plan Stakeholder Workshop. While much of the discussion at the workshop focused on actual hardware standards, there were a significant number of comments about communication protocols and the desire to ensure PEV drivers could charge their vehicles at any station regardless of whether they were members of some “charging plan” consortium.
The Energy Commission concurs with multiple recommendations to support national standards for EVSE, and it intends to support these efforts to the greatest extent practicable. It is likely that Energy Commission support will include discussions of various fast charge standards developed by organizations that are addressing these issues at the national level.
Technical Challenges and Opportunities Opportunities exist to demonstrate PEV-specific technical solutions and capabilities, possibly including communication protocols mentioned above as well as supporting demand response programs, smart-charging strategies, and vehicle-to-grid demonstrations. Appendices B and C provide brief examples of technical excursions, addressing challenges and opportunities associated with demand charge management and mitigation and with electrified roadways. The Energy Commission will explore opportunities to support potential solutions to technical challenges associated with PEVs and EVSE. Solicitations and/or grants may be available for these types of efforts in the future. One example of this type of effort was a vehicle-grid integration workshop held in early October 2013 in Sacramento that included Energy Commission, California Independent System Operator (California ISO), California Public Utilities Commission (CPUC), and stakeholder representatives. In December 2013, California ISO, the Energy Commission, and the CPUC released the California Vehicle-Grid Integration (VGI) Roadmap, which outlines specific challenges to VGI and details necessary actions for determining VGI value, developing enabling policy, and supporting enabling technology
48
development.35 The Energy Commission will provide supporting roles for analyzing vehicle-to-grid and smart-charging capabilities for medium-duty and heavy-duty PEV fleets and for fostering charging infrastructure standards enabling PEVs to access multiple charger types as directed in the 2013 ZEV Action Plan.
One such effort was an Energy Commission award to UC San Diego earlier this year.36 UC San Diego will soon have more than 50 charging outlets (with most available for public charging). This latest award will be for the installation, testing, and assessment of multiple Level 2 and fast charging systems. Examples of Energy Commission-supported past, ongoing, and future research efforts are provided in Appendix D.
Charging at Airports and Near Public Transportation The installation of EVSE at airports and near public transportation presents unique challenges and opportunities. These two location types were specifically identified in the 2013 ZEV Action Plan as “high priority locations,” and the Energy Commission agrees – with caveats. In general, locations near public transportation are optimal for EVSE. An ideal decision process would include surveying drivers about their interest and likely support of EVSE infrastructure. Incentives could include reserving more desirable parking spots for PEVs, providing free or subsidized charging, and/or reducing monthly parking fees. Drivers should understand the expiration dates (if any) of these subsidies to avoid situations like that described below for airport parking.
Figure 16 reflects the new PEV parking policy at LAX, which continues to provide free charging – but no longer free parking – for PEVs.37 The old policy of free parking for PEVs was highly successful in attracting large numbers of PEVs to LAX, but it highlighted the need for a charging rotation system. Some PEV drivers parked at LAX for weeks at a time and were not being charged for most of this time. One option to address this issue would be a “valet” parking system allowing charged vehicles to be moved – freeing up spots for vehicles requiring charging. This approach could be used for workplace charging as well if there are a limited number of chargers.
35 California ISO. (February 2014). California Vehicle-Grid Integration (VGI) Roadmap. http://www.caiso.com/Documents/Vehicle-GridIntegrationRoadmap.pdf. 36 Energy Commission. (January 9, 2013). “Energy Commission Awards More Than $1.8 Million for UC San Diego Microgrid Projects.” http://www.energy.ca.gov/releases/2013_releases/2013-01-09_UCSD_nr.html. Accessed June 9, 2013. 37 Los Angeles World Airports. (2013). “Electric Vehicle Parking Changes.” http://www.lawa.org/uploadedFiles/LAX/Parking/Electric%20Vehicle%20Parking4bFinal1-2-13.pdf. Accessed March 26, 2013.
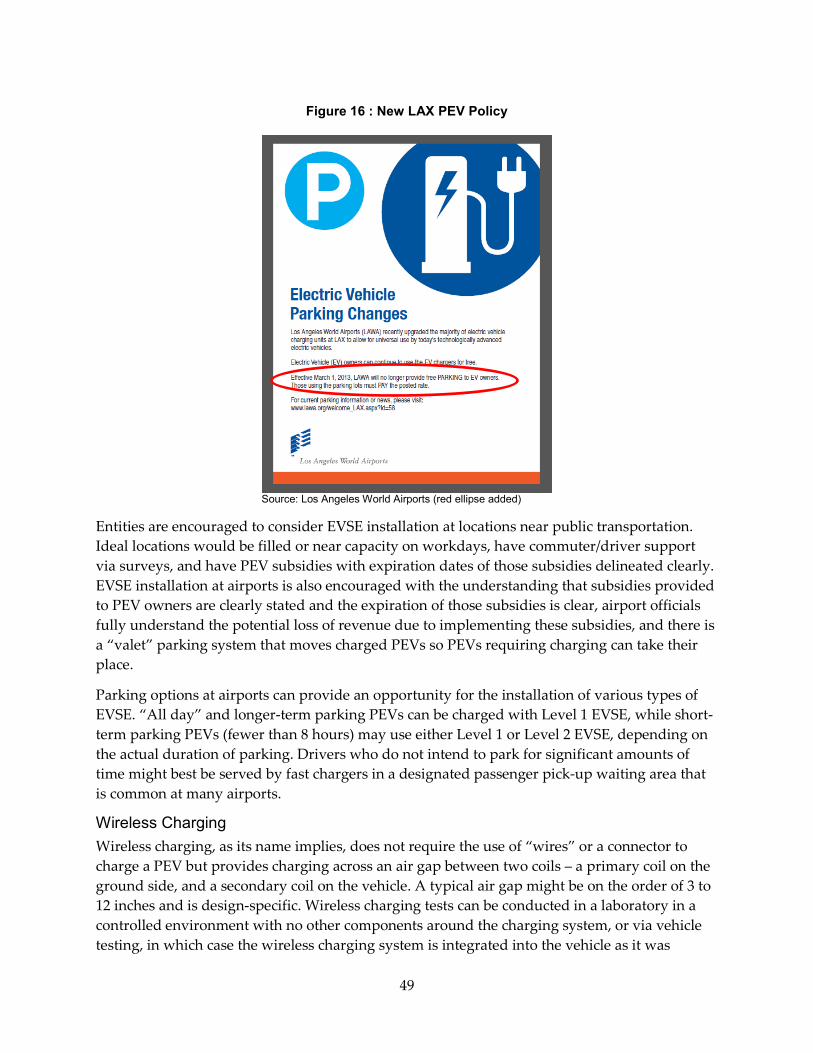
49
Figure 16 : New LAX PEV Policy
Source: Los Angeles World Airports (red ellipse added)
Entities are encouraged to consider EVSE installation at locations near public transportation. Ideal locations would be filled or near capacity on workdays, have commuter/driver support via surveys, and have PEV subsidies with expiration dates of those subsidies delineated clearly. EVSE installation at airports is also encouraged with the understanding that subsidies provided to PEV owners are clearly stated and the expiration of those subsidies is clear, airport officials fully understand the potential loss of revenue due to implementing these subsidies, and there is a “valet” parking system that moves charged PEVs so PEVs requiring charging can take their place.
Parking options at airports can provide an opportunity for the installation of various types of EVSE. “All day” and longer-term parking PEVs can be charged with Level 1 EVSE, while short-term parking PEVs (fewer than 8 hours) may use either Level 1 or Level 2 EVSE, depending on the actual duration of parking. Drivers who do not intend to park for significant amounts of time might best be served by fast chargers in a designated passenger pick-up waiting area that is common at many airports.
Wireless Charging Wireless charging, as its name implies, does not require the use of “wires” or a connector to charge a PEV but provides charging across an air gap between two coils – a primary coil on the ground side, and a secondary coil on the vehicle. A typical air gap might be on the order of 3 to 12 inches and is design-specific. Wireless charging tests can be conducted in a laboratory in a controlled environment with no other components around the charging system, or via vehicle testing, in which case the wireless charging system is integrated into the vehicle as it was
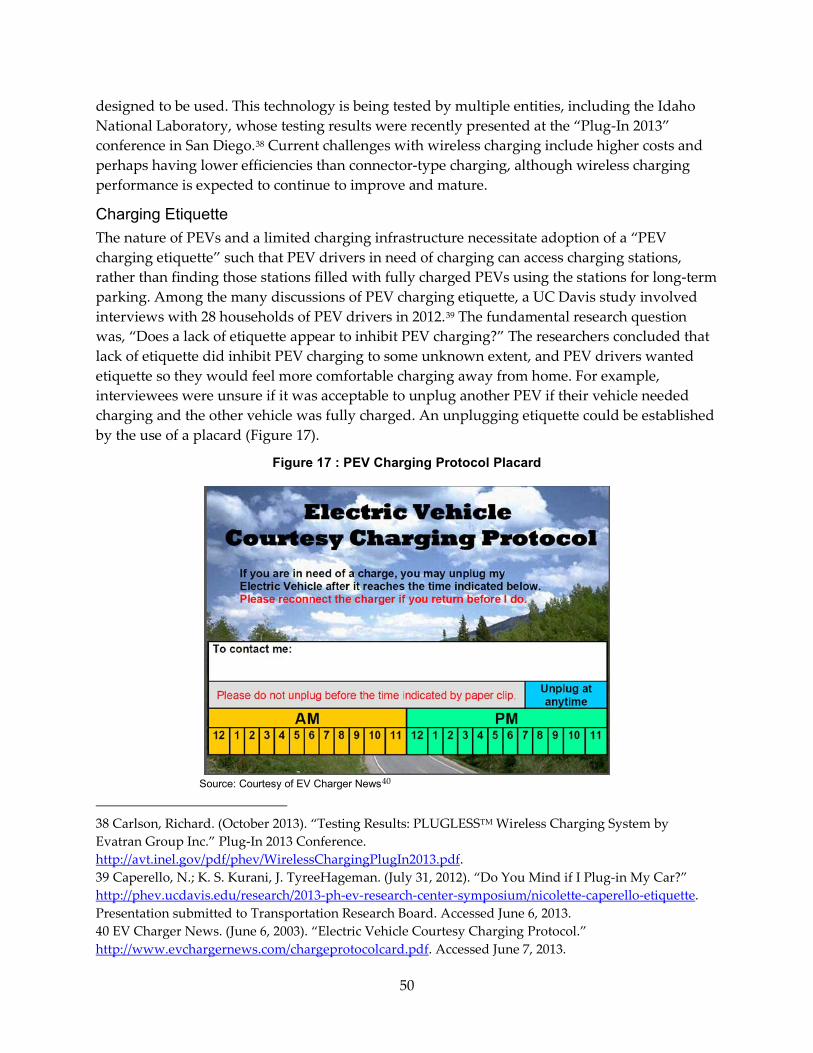
50
designed to be used. This technology is being tested by multiple entities, including the Idaho National Laboratory, whose testing results were recently presented at the “Plug-In 2013” conference in San Diego.38 Current challenges with wireless charging include higher costs and perhaps having lower efficiencies than connector-type charging, although wireless charging performance is expected to continue to improve and mature.
Charging Etiquette The nature of PEVs and a limited charging infrastructure necessitate adoption of a “PEV charging etiquette” such that PEV drivers in need of charging can access charging stations, rather than finding those stations filled with fully charged PEVs using the stations for long-term parking. Among the many discussions of PEV charging etiquette, a UC Davis study involved interviews with 28 households of PEV drivers in 2012.39 The fundamental research question was, “Does a lack of etiquette appear to inhibit PEV charging?” The researchers concluded that lack of etiquette did inhibit PEV charging to some unknown extent, and PEV drivers wanted etiquette so they would feel more comfortable charging away from home. For example, interviewees were unsure if it was acceptable to unplug another PEV if their vehicle needed charging and the other vehicle was fully charged. An unplugging etiquette could be established by the use of a placard (Figure 17).
Figure 17 : PEV Charging Protocol Placard
Source: Courtesy of EV Charger News40
38 Carlson, Richard. (October 2013). “Testing Results: PLUGLESSTM Wireless Charging System by Evatran Group Inc.” Plug-In 2013 Conference. http://avt.inel.gov/pdf/phev/WirelessChargingPlugIn2013.pdf. 39 Caperello, N.; K. S. Kurani, J. TyreeHageman. (July 31, 2012). “Do You Mind if I Plug-in My Car?” http://phev.ucdavis.edu/research/2013-ph-ev-research-center-symposium/nicolette-caperello-etiquette. Presentation submitted to Transportation Research Board. Accessed June 6, 2013. 40 EV Charger News. (June 6, 2003). “Electric Vehicle Courtesy Charging Protocol.” http://www.evchargernews.com/chargeprotocolcard.pdf. Accessed June 7, 2013.

51
Some PEV drivers reported creating rules for workplace charging among fellow employees, and some suggested that a charging reservation system be implemented. During this study charging was free. If drivers had to pay for charging, stricter rules and regulations governing PEV charging might result.
An article from the Edmunds website attempts to answer some of the difficult questions regarding PEV charging etiquette, including:41
• Does a "pure" BEV have precedence at a public charger over a PHEV?
• Is it ever OK to unplug someone else's car?
• What's the proper way to unplug another driver's vehicle?
• How long can a PEV occupy a charging spot?
A Ford website provides a “cheat sheet” for EV etiquette,42 and there are plenty of other etiquette websites and articles addressing this issue as well. The Energy Commission does not intend to dictate PEV charging etiquette to California consumers, but in general it does concur with many of the etiquette guidelines suggested on various websites. The Energy Commission will address PEV etiquette issues at regularly scheduled meetings with regional representatives and, with these and other stakeholders’ comments, may promulgate additional guidance and recommendations for PEV charging etiquette.
Medium- and Heavy-Duty ZEVs PEV infrastructure planning is not limited to light-duty vehicles. The 2013 ZEV Action Plan requires the Energy Commission to consider heavy-duty ZEVs when planning infrastructure for light-duty vehicles and, along with ARB, to continue to support funding for buses and other heavy-duty vehicles.
The Energy Commission does not foresee significant numbers of medium-duty and heavy-duty ZEVs transiting the interstates of California for hundreds of miles each day in the near term. However, heavy-duty ZEVs are well-suited to applications such as urban delivery, airport shuttles, and cargo haulers, for which daily mileage might not exceed 60 to 80 miles. An additional consideration is that the most common alternating current (AC) Level 2 EVSE (208V, 30A) often will not suffice; higher-powered AC Level 2 EVSE (208V, 80A) is more appropriate for larger PEVs. Even at the top of the power range defined for AC Level 2, charging could take several hours for a large PEV with a moderately low battery charge state.
The same PEV range challenges facing commuter PEV drivers occur with medium- and heavy-duty PEVs, but the Energy Commission believes there is a difference. While some PEV
41 O’Dell, J. (October 23, 2012). “Electric Charging Station Etiquette for Plug-In Cars.” http://www.edmunds.com/fuel-economy/electric-charging-station-etiquette-for-plug-in-cars.html. Accessed June 7, 2013. 42 Singh, D. (January 4, 2013). “EV Etiquette: A whole new ballgame.” http://blog.ford.ca/2013/01/04/ev-etiquette-a-whole-new-ballgame/. Accessed February 11, 2014.
52
passenger vehicle drivers might like to drive their PEVs for extended ranges, it is likely that owners of larger, commercial vehicles would recognize the inherent limitations of PEVs and would not endorse long-range trips that would require several hours of charging during company time. Even fast chargers would require charging time that a business might not have. The most likely near-term scenarios for medium- and heavy-duty PEV use are in local areas, with the PEVs charged at night at their home base. The Energy Commission will support PEV charging infrastructure development for medium- and heavy-duty applications, such as those described above, to the greatest extent practicable.
Summary The locations of many of the few hundred fast chargers to be funded by NRG and other entities have not yet been determined. The Energy Commission will support analytical efforts aimed at determining optimal fast charging locations that can support light-duty vehicles in locations with heavy concentrations of medium- and heavy-duty vehicle traffic. Buses and heavy-duty vehicle purchases will continue to compete for Energy Commission support consistent with funding availability.
One of the most daunting tasks associated with PEV infrastructure planning is determining where to install EVSE. If the number, locations, and destinations of PEVs in California over the next 10 years were known with acceptable precision, the task would be easier, but they are not. This document (especially this section) assesses EVSE deployment trends and siting issues through a scenario framework, and provides references to other documents that address these and other issues in greater detail. As more data become available, the decision-making process supporting the siting process will improve, especially with regard to the best use of public funds.
This assessment does not duplicate the more detailed analyses of EVSE siting considerations reported in other publications. Instead, a two-page informal summary of considerations and recommendations is provided as guidance for organizations or persons responsible for PEV infrastructure planning. This informal summary is provided as Figure 18 and Figure 19 on the following pages and is intended to be referred to in conjunction with – not in lieu of – the various references identified in this document.
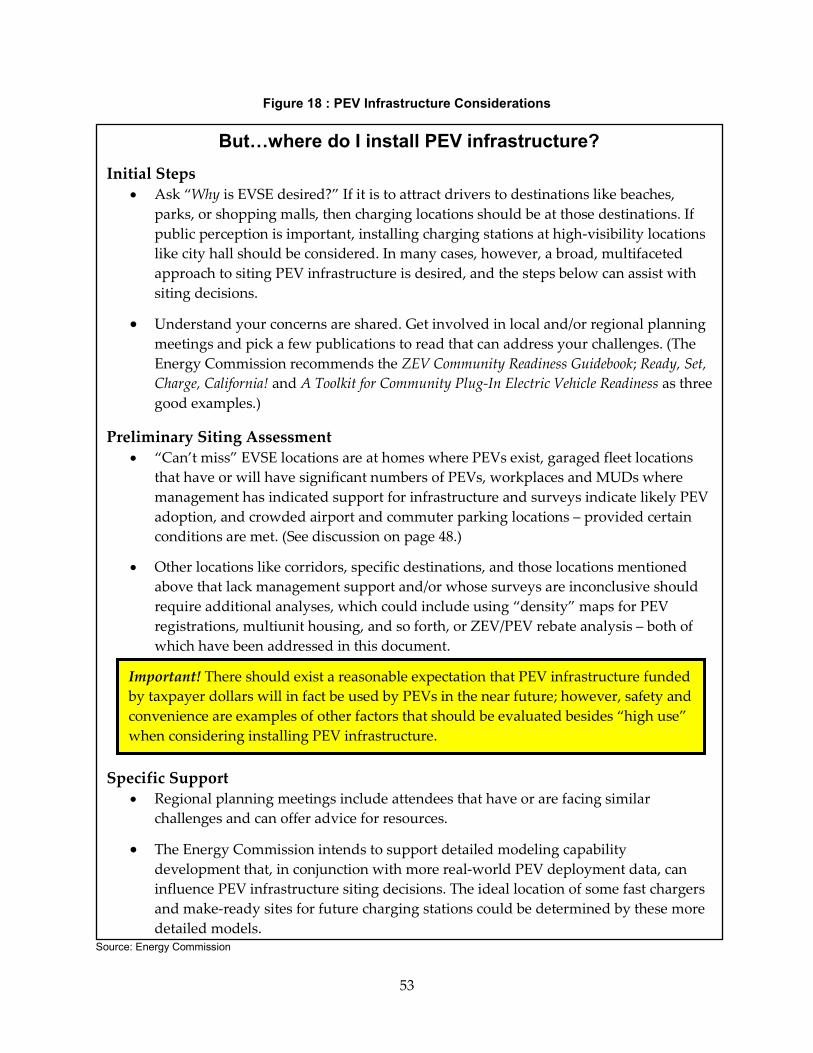
53
Figure 18 : PEV Infrastructure Considerations
Source: Energy Commission
But…where do I install PEV infrastructure? Initial Steps
• Ask “Why is EVSE desired?” If it is to attract drivers to destinations like beaches, parks, or shopping malls, then charging locations should be at those destinations. If public perception is important, installing charging stations at high-visibility locations like city hall should be considered. In many cases, however, a broad, multifaceted approach to siting PEV infrastructure is desired, and the steps below can assist with siting decisions.
• Understand your concerns are shared. Get involved in local and/or regional planning meetings and pick a few publications to read that can address your challenges. (The Energy Commission recommends the ZEV Community Readiness Guidebook; Ready, Set, Charge, California! and A Toolkit for Community Plug-In Electric Vehicle Readiness as three good examples.)
Preliminary Siting Assessment • “Can’t miss” EVSE locations are at homes where PEVs exist, garaged fleet locations
that have or will have significant numbers of PEVs, workplaces and MUDs where management has indicated support for infrastructure and surveys indicate likely PEV adoption, and crowded airport and commuter parking locations – provided certain conditions are met. (See discussion on page 48.)
• Other locations like corridors, specific destinations, and those locations mentioned above that lack management support and/or whose surveys are inconclusive should require additional analyses, which could include using “density” maps for PEV registrations, multiunit housing, and so forth, or ZEV/PEV rebate analysis – both of which have been addressed in this document.
• Specific Support
• Regional planning meetings include attendees that have or are facing similar challenges and can offer advice for resources.
• The Energy Commission intends to support detailed modeling capability development that, in conjunction with more real-world PEV deployment data, can influence PEV infrastructure siting decisions. The ideal location of some fast chargers and make-ready sites for future charging stations could be determined by these more detailed models.
Important! There should exist a reasonable expectation that PEV infrastructure funded by taxpayer dollars will in fact be used by PEVs in the near future; however, safety and convenience are examples of other factors that should be evaluated besides “high use” when considering installing PEV infrastructure.

54
Figure 19 : Additional PEV Infrastructure Considerations
A number of key issues must be considered when determining the location of EVSE installations. Considerations for general types of locations are summarized below. In general, the Energy Commission will prioritize home charging and then workplace/retail charging, followed by public charging, as illustrated in the Electric Power Research Institute pyramid in Figure 20. The Energy Commission will pursue this broad approach to ensure PEV market growth, and it recommends that California’s 10 regions adopt a similar approach. Source: EPRI
EVSE Location EVSE Considerations 1 2 3 4 5 6 7 8 9 10 11 California regions (10 total) X X X X X X Residential X X Workplace X X X X X X X X MUD X X X X X X X X Destination X X X X X X X X X Corridor X X X X X X X Near public transportation/airports X X X X X X X X X X
EVSE Considerations 1. Permitting and/or building code considerations. Permitting is an issue with all EVSE –
perhaps more so with MUDs and workplace charging, but also with single-family homes and fast charging.
2. What is the objective of EVSE installation? 3. Level of management support. 4. Surveys. Driver surveys indicating likelihood of using EVSE. 5. Appearances/usage. This can be a double-edged sword. EVSE at a beach or downtown may
appear “green,” but underuse of publicly funded charging infrastructure could be criticized as a waste of taxpayer dollars.
6. Parking or charging fees. 7. Ensuring equal access to charging. Includes compliance with the Americans with
Disabilities Act (ADA). 8. Reserved parking spaces required. 9. Valet parking system. To reposition vehicles once they are charged so others requiring
charging can take their place. 10. Expiration of subsidies. Must be spelled out clearly. 11. Future efforts. Need to understand the future potential for PEVs and demand for EVSE.
Source: Energy Commission
Figure 20: Charging Priorities
55
Policy
The Energy Commission will use its authority to support ZEV growth. The 2013 ZEV Action Plan assigned the Energy Commission as lead or supporting agency for many policy-related goals. Some of those goals are summarized below.
• Ensure future state-funded PEV charging stations are accessible to the public.
• Promoting coordination among existing Energy Commission-funded regional planning groups, regional coordinating councils, Clean Cities Coalitions, and other local organizations advancing ZEVs.
• Promoting cost-effective charging infrastructure at appropriate longer-term public parking locations, such as airports and transit centers.
• Expanding incentives, programs, and technical assistance to California companies that install PEV chargers in their workplaces.
• Supporting funding for ZEV planning by local governments and regional planning bodies.
• Supporting new market opportunities for battery reuse and recycling.
• Ensuring funding support for ZEV research that contributes most to ZEV innovation, manufacturing, and deployment.
The Energy Commission intends to fulfill its policy-related responsibilities through several different strategies and has already conducted a number of related outreach events. One successful approach was the convening of the Statewide PEV Infrastructure Plan Stakeholder Workshop in January 2013. The Energy Commission, along with other entities like the Governor’s Office, has had great success with workshops and notes the value of having multiple stakeholders and subject matter experts meeting together. It is likely similar events will be held in the future. One result from the January workshop included the establishment of regular meetings with regional PEV planning coordinators, which are ongoing.
The Energy Commission will also provide policy support in areas not mentioned in this section, including supporting EVSE national standards and encouraging the reporting of all public EVSE installations in California to the AFDC database. Stakeholders can expect additional policy support via publications, when applicable, as well as direct financial support, when possible. For example, Energy Commission financial support has exceeded $25 million for more than 7,200 charge points in metropolitan areas of the state.
What is the Energy Commission’s role? When it comes to PEV infrastructure, many attendees at the Statewide PEV Infrastructure Plan Stakeholder Workshop felt that the Energy Commission should endorse rebates or other subsidies to encourage charging station installation – especially home charging. This type of suggestion received the most “votes” of any at the workshop.
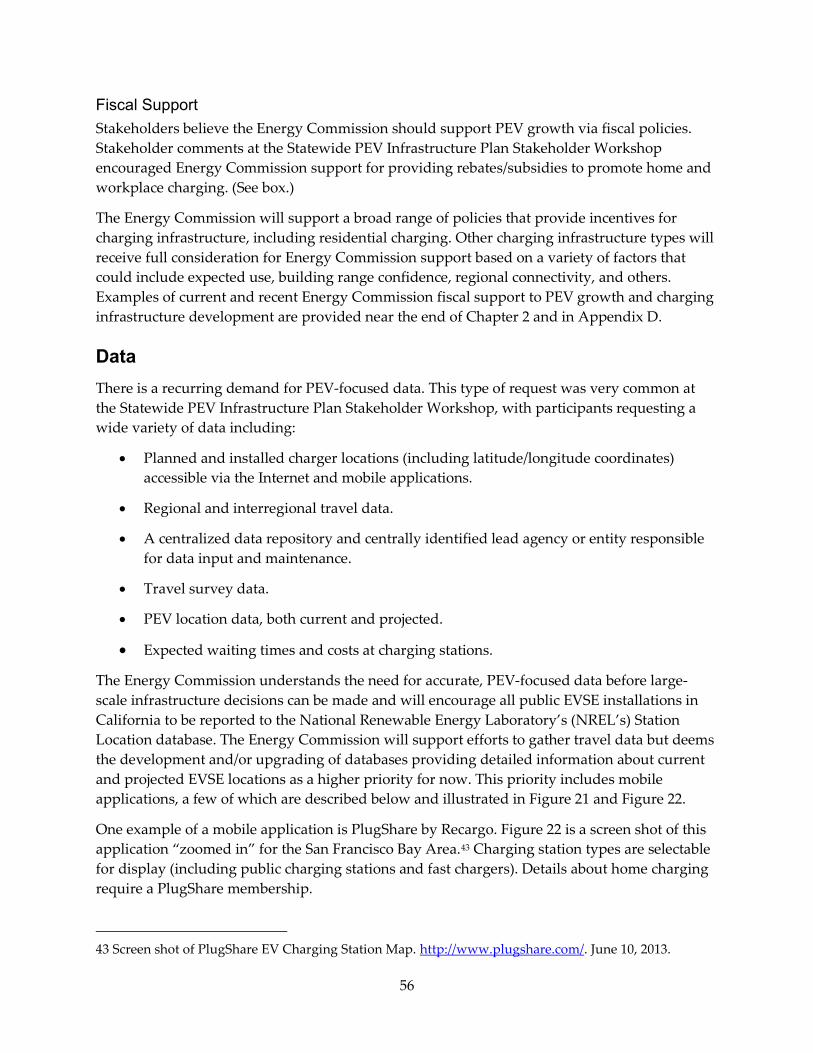
56
Fiscal Support Stakeholders believe the Energy Commission should support PEV growth via fiscal policies. Stakeholder comments at the Statewide PEV Infrastructure Plan Stakeholder Workshop encouraged Energy Commission support for providing rebates/subsidies to promote home and workplace charging. (See box.)
The Energy Commission will support a broad range of policies that provide incentives for charging infrastructure, including residential charging. Other charging infrastructure types will receive full consideration for Energy Commission support based on a variety of factors that could include expected use, building range confidence, regional connectivity, and others. Examples of current and recent Energy Commission fiscal support to PEV growth and charging infrastructure development are provided near the end of Chapter 2 and in Appendix D. Data There is a recurring demand for PEV-focused data. This type of request was very common at the Statewide PEV Infrastructure Plan Stakeholder Workshop, with participants requesting a wide variety of data including:
• Planned and installed charger locations (including latitude/longitude coordinates) accessible via the Internet and mobile applications.
• Regional and interregional travel data.
• A centralized data repository and centrally identified lead agency or entity responsible for data input and maintenance.
• Travel survey data.
• PEV location data, both current and projected.
• Expected waiting times and costs at charging stations.
The Energy Commission understands the need for accurate, PEV-focused data before large-scale infrastructure decisions can be made and will encourage all public EVSE installations in California to be reported to the National Renewable Energy Laboratory’s (NREL’s) Station Location database. The Energy Commission will support efforts to gather travel data but deems the development and/or upgrading of databases providing detailed information about current and projected EVSE locations as a higher priority for now. This priority includes mobile applications, a few of which are described below and illustrated in Figure 21 and Figure 22.
One example of a mobile application is PlugShare by Recargo. Figure 22 is a screen shot of this application “zoomed in” for the San Francisco Bay Area.43 Charging station types are selectable for display (including public charging stations and fast chargers). Details about home charging require a PlugShare membership.
43 Screen shot of PlugShare EV Charging Station Map. http://www.plugshare.com/. June 10, 2013.
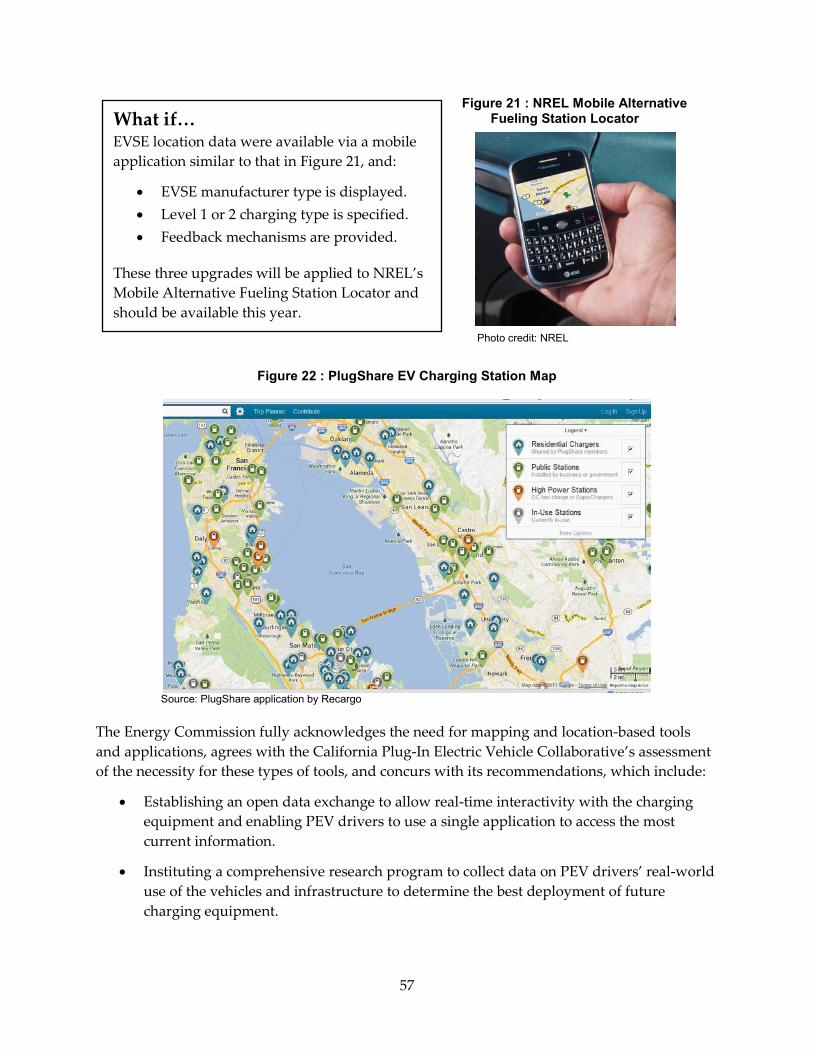
57
Figure 21 : NREL Mobile Alternative Fueling Station Locator
Photo credit: NREL
Figure 22 : PlugShare EV Charging Station Map
Source: PlugShare application by Recargo
The Energy Commission fully acknowledges the need for mapping and location-based tools and applications, agrees with the California Plug-In Electric Vehicle Collaborative’s assessment of the necessity for these types of tools, and concurs with its recommendations, which include:
• Establishing an open data exchange to allow real-time interactivity with the charging equipment and enabling PEV drivers to use a single application to access the most current information.
• Instituting a comprehensive research program to collect data on PEV drivers’ real-world use of the vehicles and infrastructure to determine the best deployment of future charging equipment.
What if… EVSE location data were available via a mobile application similar to that in Figure 21, and:
• EVSE manufacturer type is displayed. • Level 1 or 2 charging type is specified. • Feedback mechanisms are provided.
These three upgrades will be applied to NREL’s Mobile Alternative Fueling Station Locator and should be available this year.
58
• Assisting planners with developing consensus-built infrastructure deployment strategies via the PEV Collaborative and PEV Regional Coordination Councils (and the Energy Commission) and collaborating with the National Renewable Energy Laboratory/Alternative Fuels Data Center (NREL/AFDC) to ensure that it further develops its mapping and navigation tools.
• Ensuring that specific charging station information (for example, location, access type, payment methods, charger details) is available through both the NREL/AFDC database and mapping tool and via location-based subscription plans that PEV drivers may use.44
The Energy Commission will support these types of data-driven development efforts and is very interested in more powerful, upgraded mobile applications that could be used by California PEV drivers. Critiques of current applications (like those identified by the California Plug-In Electric Vehicle Collaborative) have been addressed in some cases (see call-out box on page 57) and would require addressing in other cases.
The Energy Commission concurs with the need for a centralized data repository with oversight to ensure quality and open access, where possible, for use by multiple research and planning entities. Data would include current and planned charger locations and PEV location data and would be accessible via the Internet and mobile applications. The Energy Commission will explore various approaches to this challenge, ensuring that privacy issues (such as those associated with PEV garaged locations) are addressed. Interaction and Facilitation Energy Commission interaction and facilitation with entities is required. The 2013 ZEV Action Plan directs the Energy Commission to monitor and provide support as the 10 regional plans are developed. The Energy Commission is to ease coordination among various organizations, including regional planning groups and coordinating councils, Clean Cities Coalitions, and other local organizations supporting ZEVs. The Energy Commission is to support education at auto dealerships regarding ZEVs and to consider inviting auto manufacturers to join a to-be-created joint working group of research institutions focused on ZEV research.
The Energy Commission is supporting the development of 10 regional PEV and EVSE deployment plans via direct funding, by documents such as this one, and by establishing periodic meetings focused on regional concerns and challenges. Portions of these meetings will address coordination opportunities with local organizations. The Energy Commission will expand education efforts at automotive dealerships. Single-source resources like ARB’s Plug-In Electric Vehicle Resource Center exist – which are beneficial to potential PEV customers,
44 California Plug-In Electric Vehicle Collaborative. (May 2012). Maps & Apps: Today’s Mapping and Location-Based Services for Plug-In Electric Vehicle Charging Infrastructure. Accessed March 26, 2013. http://www.evcollaborative.org/sites/all/themes/pev/files/PEV_Maps_Apps_120827.pdf.
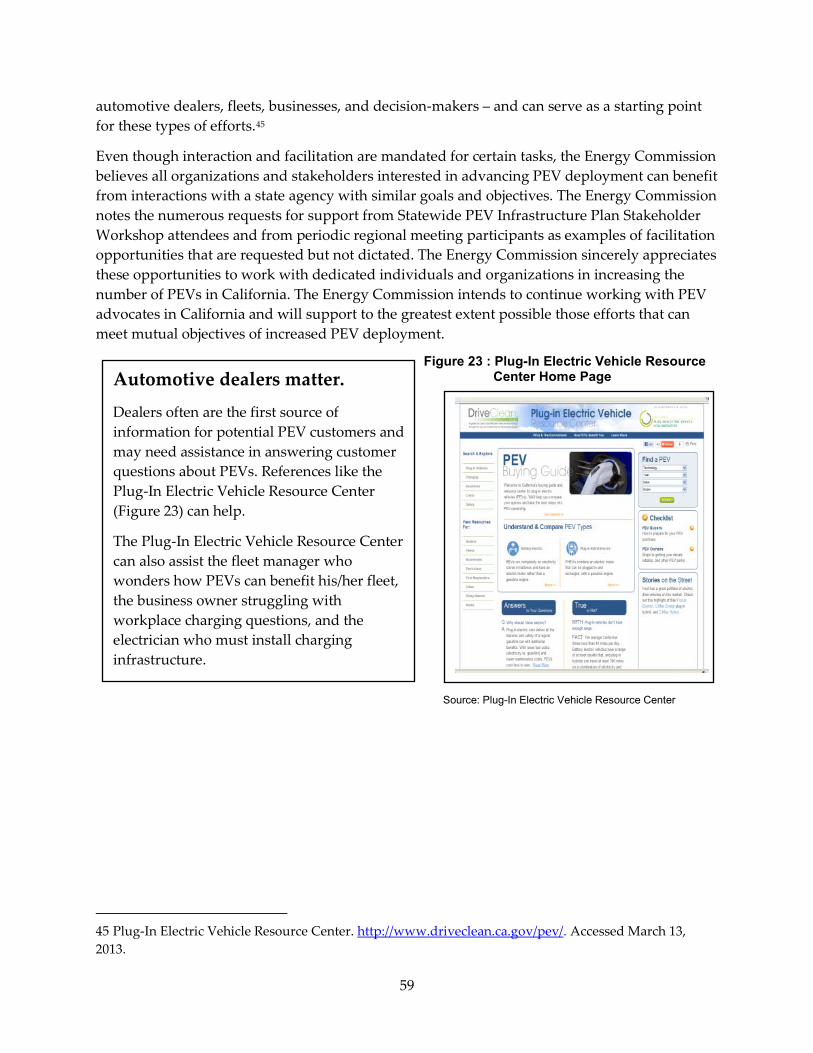
59
automotive dealers, fleets, businesses, and decision-makers – and can serve as a starting point for these types of efforts.45
Even though interaction and facilitation are mandated for certain tasks, the Energy Commission believes all organizations and stakeholders interested in advancing PEV deployment can benefit from interactions with a state agency with similar goals and objectives. The Energy Commission notes the numerous requests for support from Statewide PEV Infrastructure Plan Stakeholder Workshop attendees and from periodic regional meeting participants as examples of facilitation opportunities that are requested but not dictated. The Energy Commission sincerely appreciates these opportunities to work with dedicated individuals and organizations in increasing the number of PEVs in California. The Energy Commission intends to continue working with PEV advocates in California and will support to the greatest extent possible those efforts that can meet mutual objectives of increased PEV deployment.
Figure 23 : Plug-In Electric Vehicle Resource Center Home Page
Source: Plug-In Electric Vehicle Resource Center
45 Plug-In Electric Vehicle Resource Center. http://www.driveclean.ca.gov/pev/. Accessed March 13, 2013.
Automotive dealers matter.
Dealers often are the first source of information for potential PEV customers and may need assistance in answering customer questions about PEVs. References like the Plug-In Electric Vehicle Resource Center (Figure 23) can help.
The Plug-In Electric Vehicle Resource Center can also assist the fleet manager who wonders how PEVs can benefit his/her fleet, the business owner struggling with workplace charging questions, and the electrician who must install charging infrastructure.
60
CHAPTER 5: Selected Sources Used in Developing the Statewide PEV Infrastructure Assessment The Energy Commission relied heavily on external expertise in the development of this assessment. Stakeholders, regional representatives, subject matter experts, and representatives from industry, national laboratories, and academia all contributed. This chapter reviews a few of the documents, programs, studies, analyses, and workshops that were influential in informing this report, but it should not be interpreted as an exhaustive list of contributors.
Regional Plans The U.S. Department of Energy (U.S. DOE) initially provided support that was used to develop regional PEV plans for 6 of California’s 10 regions (often referred to as “Phase I” plans), and the Energy Commission is supporting more detailed plan development for all 10 regions. (These plans are sometimes informally referred to as “Phase II” plans.) A summary of the deliverables to DOE and the 6 initial plans themselves are publicly available. Phase I plans contain many unique and interesting aspects, but each plan had five core elements: (1) update zoning and parking policies, (2) update local building codes, (3) streamline permitting and inspection processes, (4) participate in training and education programs for local officials, and (5) marketing and outreach to local residents and businesses. Much of the groundwork for successful PEV infrastructure development was laid as a result of these studies. A brief summary of each of the six Phase I plans follows.
Bay Area and Monterey Bay Area Plan The Bay Area and Monterey Bay Area Plug-In Electric Vehicle Readiness Plan contains a well-thought-out section on prioritized recommendations for PEV readiness at the local level that focuses on building codes, permitting checklists, and parking space issues.46 This is important because the Bay Area and Monterey Bay Area Plan references a survey of more than 100 local government agencies from March to August 2012 that indicated:
• Only one in six local governments surveyed has actually adopted EVSE requirements for permitting.
• Five percent of the respondents have actually adopted zoning/parking ordinances related to EVSE.
• Only 1 in 10 local governments has proactively adopted building codes for EVSE.
The plan also notes that little guidance exists for municipalities on how to complete permitting for multifamily dwelling units and commercial properties.
46 Bay Area and Monterey Bay Area Plug-In Electric Vehicle Readiness Plan. (December 2012; updated January 2, 2013). http://www.evcollaborative.org/sites/all/themes/pev/files/docs/ba_pev_plan.pdf. Accessed March 7, 2013.
61
The Monterey Bay Area is very appealing for PEV development because it has the highest rate of Nissan LEAF adoption in the country and in the state on a per-household basis. The Bay Area and Monterey Bay Area Plug-In Electric Vehicle Readiness Plan indicates priority for home charging first, followed by workplace charging, and then public charging, and it includes maps indicating “Most Likely PEV Adopters” and subsequent workplace siting opportunities.
Ventura, Santa Barbara, and San Luis Obispo Counties Plan The Electric Vehicle Readiness Plan for Ventura, Santa Barbara, and San Luis Obispo Counties itemizes an initial PEV-related goals and metrics framework, including a short-term goal for the number of public charging stations by 2013.47 These draft target goals are 100 to 200 Level 1 charging points, 100 to 200 Level 2 charging points, and between 5 and 10 fast-charging points. There is a section on residential charger installation recommendations, as well as high-level siting recommendations and considerations prior to the next phase of this plan, which will address specific site recommendations.
Several appendices cite material from multiple sources (including the Tri-Chapter Uniform Committee of the International Code Council). One appendix is a good example of a sample permit for charging equipment installation, a second provides a checklist for building inspectors for residential EVSE installation, a third has charger installation guidance for commercial installations, and a fourth provides recommended standards for charging station development on streets, sidewalks, and other public places. Other appendices provide more guidance and compliance recommendations, address parking space challenges, discuss codes and signage, and address issues with MUDs – including some cost factors and basic financial analysis.
Southern California Plan The Southern California Plug-In Electric Vehicle Readiness Plan is an extensive document with entire chapters addressing the basics of PEVs and chargers, residential charging, MUD charging, workplace charging (including financial analyses), zoning, permitting, and parking issues.48 This plan estimates PEV growth in Southern California and provides a variety of examples of mapping analysis capabilities similar to that illustrated in Figure 24.
47 Electric Vehicle Readiness Plan for Ventura, Santa Barbara, and San Luis Obispo Counties. (September 21, 2013; updated January 2, 2013). V. 3.0. http://www.evcollaborative.org/sites/all/themes/pev/files/docs/cc_pev_plan.pdf. Accessed March 7, 2013. 48 Southern California Plug-In Electric Vehicle Readiness Plan. (December 2012; updated January 2, 2013). http://www.evcollaborative.org/sites/all/themes/pev/files/docs/SouthCoast_PEV_Readiness_Plan_Main.pdf. Accessed March 7, 2013.

62
Figure 24 : Multiunit Residential Density Example
Source: Southern California Plug-In Electric Vehicle Readiness Assessment
Sacramento Regional Assessment The Sacramento Regional Assessment incorporates survey results.49 The 22 largest cities and counties in the region were asked to fill out a survey about the PEV permitting process in their respective regions. Nineteen total responses were received, including a response to the following question: “What do you see as a barrier(s) to implementing a PEV/EVSE specific permitting process (check all that apply)?” Of 19 respondents, 7 answered “Lack of information,” 6 answered “Staff resources,” 6 answered “Lack of standards,” 3 answered “Cost,” and 7 answered “other” and listed a variety of challenges. In general, these responses are considered consistent with responses obtained during the Statewide PEV Infrastructure Plan Stakeholder Workshop described later in this document.
San Diego Regional Plan The San Diego Regional Plan acknowledges that its emphasis is on EVSE.50 The plan has a one-page executive summary that is worthy in itself as a stand-alone reference document. Much of the plan contains easy-to-read graphics, such as those illustrated in Figure 25. Numbers from these graphics are often easier to identify and remember than conventional text. Also appealing is the list of specific recommendations in the plan, such as the identification of a San Diego technical policy for installing EVSE.
49 Take Charge I: A First Step to PEV Readiness in the Sacramento Region. (Updated January 2, 2013). http://www.evcollaborative.org/sites/all/themes/pev/files/docs/sac_pev_plan.pdf. Accessed March 8, 2013. 50 San Diego Regional Plug-In Electric Vehicle (PEV) Readiness Plan. (Updated January 2, 2013). http://www.evcollaborative.org/sites/all/themes/pev/files/docs/SD_PEV_Readiness_Plan_Main.pdf. Accessed March 8, 2013.
Figure 24 is an example of a multiunit residential density map. Yellow, orange, and red indicate increasing residential density, which, in turn, may indicate higher numbers of parking spaces that could house PEV charging units. Similar maps exist for number of PEV registrations, publicly accessible charging stations, PEV daytime destinations, and employment density as part of the Southern California PEV Atlas that is included in this plan.
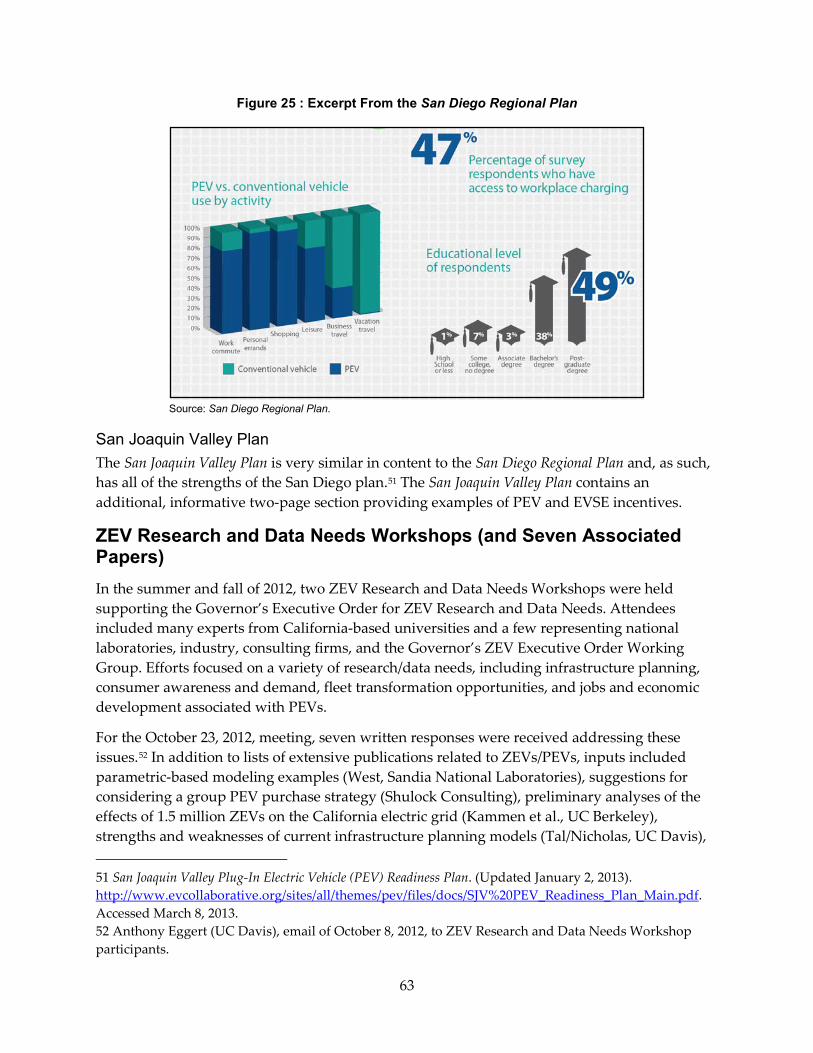
63
Figure 25 : Excerpt From the San Diego Regional Plan
Source: San Diego Regional Plan.
San Joaquin Valley Plan The San Joaquin Valley Plan is very similar in content to the San Diego Regional Plan and, as such, has all of the strengths of the San Diego plan.51 The San Joaquin Valley Plan contains an additional, informative two-page section providing examples of PEV and EVSE incentives.
ZEV Research and Data Needs Workshops (and Seven Associated Papers) In the summer and fall of 2012, two ZEV Research and Data Needs Workshops were held supporting the Governor’s Executive Order for ZEV Research and Data Needs. Attendees included many experts from California-based universities and a few representing national laboratories, industry, consulting firms, and the Governor’s ZEV Executive Order Working Group. Efforts focused on a variety of research/data needs, including infrastructure planning, consumer awareness and demand, fleet transformation opportunities, and jobs and economic development associated with PEVs.
For the October 23, 2012, meeting, seven written responses were received addressing these issues.52 In addition to lists of extensive publications related to ZEVs/PEVs, inputs included parametric-based modeling examples (West, Sandia National Laboratories), suggestions for considering a group PEV purchase strategy (Shulock Consulting), preliminary analyses of the effects of 1.5 million ZEVs on the California electric grid (Kammen et al., UC Berkeley), strengths and weaknesses of current infrastructure planning models (Tal/Nicholas, UC Davis), 51 San Joaquin Valley Plug-In Electric Vehicle (PEV) Readiness Plan. (Updated January 2, 2013). http://www.evcollaborative.org/sites/all/themes/pev/files/docs/SJV%20PEV_Readiness_Plan_Main.pdf. Accessed March 8, 2013. 52 Anthony Eggert (UC Davis), email of October 8, 2012, to ZEV Research and Data Needs Workshop participants.

64
and results of some infrastructure planning models and suggestions for further research (UC Irvine). These two workshops and associated papers provided useful insight into the current challenges and opportunities associated with ZEVs and PEVs.
Statewide PEV Infrastructure Plan Stakeholder Workshop
On January 30, 2013, the Energy Commission hosted the Statewide PEV Infrastructure Plan Stakeholder Workshop. Details of the event – including agenda, key questions, suggested readings, presentations, and workshop summary – are available online.53 This one-day event included more than 100 attendees from industry, government, local and regional stakeholders, national laboratories, academia, and research organizations. The goal of the workshop was “to collect stakeholder feedback on high-priority items to be included in the plan.” The workshop featured five speakers providing updates on specific topics, a panel on PEV infrastructure models, and ten breakout sessions – five in the morning and the same five in the afternoon – that provided an opportunity for participants to discuss and give feedback on multiple topics and key questions. Breakout sessions focused on four topics:
• Supporting regional plans
• Statewide and inter-regional issues
• Cost-effective coverage (of EVSE infrastructure)
• Interoperability (of EVSE infrastructure).
Workshop participants attended two breakout sessions, in the morning and afternoon, to discuss two of the four topics. Participants were assigned to particular breakout groups to ensure a diverse mix of stakeholder types and a more balanced discussion. Most participants had indicated their topics of interest to the workshop organizers before the actual workshop, and others were assigned based on affiliation and stakeholder type. The third topic, cost-effective coverage, was discussed in two parallel groups due to demand, resulting in a total of five breakout sessions. During each breakout session, participants were asked to provide challenges or solutions in response to 1—3 key questions. Facilitators asked clarifying questions, encouraged discussion, and collected discrete challenges or solutions on storyboards that were made visible during each breakout group (Figure 26). At the end of each breakout session, participants were given five dots to vote for their highest-priority challenges or solutions, with the explicit goal of highlighting priority issues within the Statewide Plan. Facilitators combined similar discrete issues prior to the voting process, whenever possible.
53 Statewide PEV Infrastructure Workshop. Energy Commission. http://www.energy.ca.gov/altfuels/notices/pev_infrastructure_workshop/. Accessed March 22, 2013.
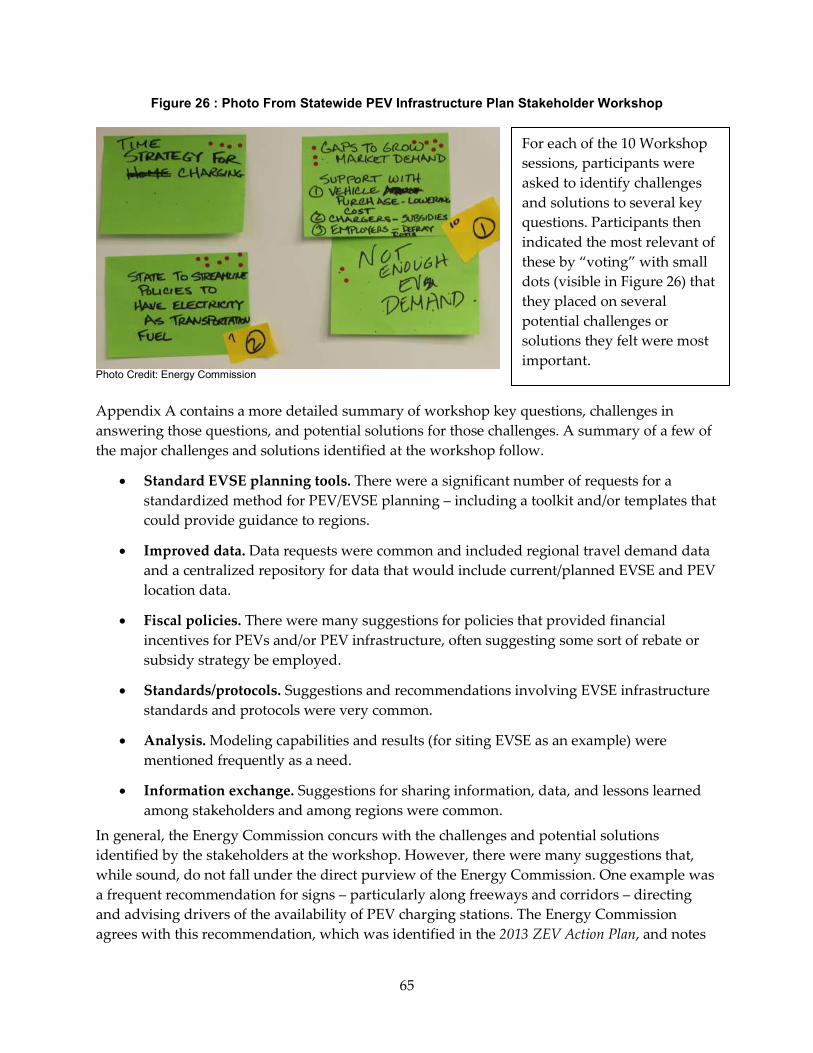
65
Figure 26 : Photo From Statewide PEV Infrastructure Plan Stakeholder Workshop
Photo Credit: Energy Commission
Appendix A contains a more detailed summary of workshop key questions, challenges in answering those questions, and potential solutions for those challenges. A summary of a few of the major challenges and solutions identified at the workshop follow.
• Standard EVSE planning tools. There were a significant number of requests for a standardized method for PEV/EVSE planning – including a toolkit and/or templates that could provide guidance to regions.
• Improved data. Data requests were common and included regional travel demand data and a centralized repository for data that would include current/planned EVSE and PEV location data.
• Fiscal policies. There were many suggestions for policies that provided financial incentives for PEVs and/or PEV infrastructure, often suggesting some sort of rebate or subsidy strategy be employed.
• Standards/protocols. Suggestions and recommendations involving EVSE infrastructure standards and protocols were very common.
• Analysis. Modeling capabilities and results (for siting EVSE as an example) were mentioned frequently as a need.
• Information exchange. Suggestions for sharing information, data, and lessons learned among stakeholders and among regions were common.
In general, the Energy Commission concurs with the challenges and potential solutions identified by the stakeholders at the workshop. However, there were many suggestions that, while sound, do not fall under the direct purview of the Energy Commission. One example was a frequent recommendation for signs – particularly along freeways and corridors – directing and advising drivers of the availability of PEV charging stations. The Energy Commission agrees with this recommendation, which was identified in the 2013 ZEV Action Plan, and notes
For each of the 10 Workshop sessions, participants were asked to identify challenges and solutions to several key questions. Participants then indicated the most relevant of these by “voting” with small dots (visible in Figure 26) that they placed on several potential challenges or solutions they felt were most important.
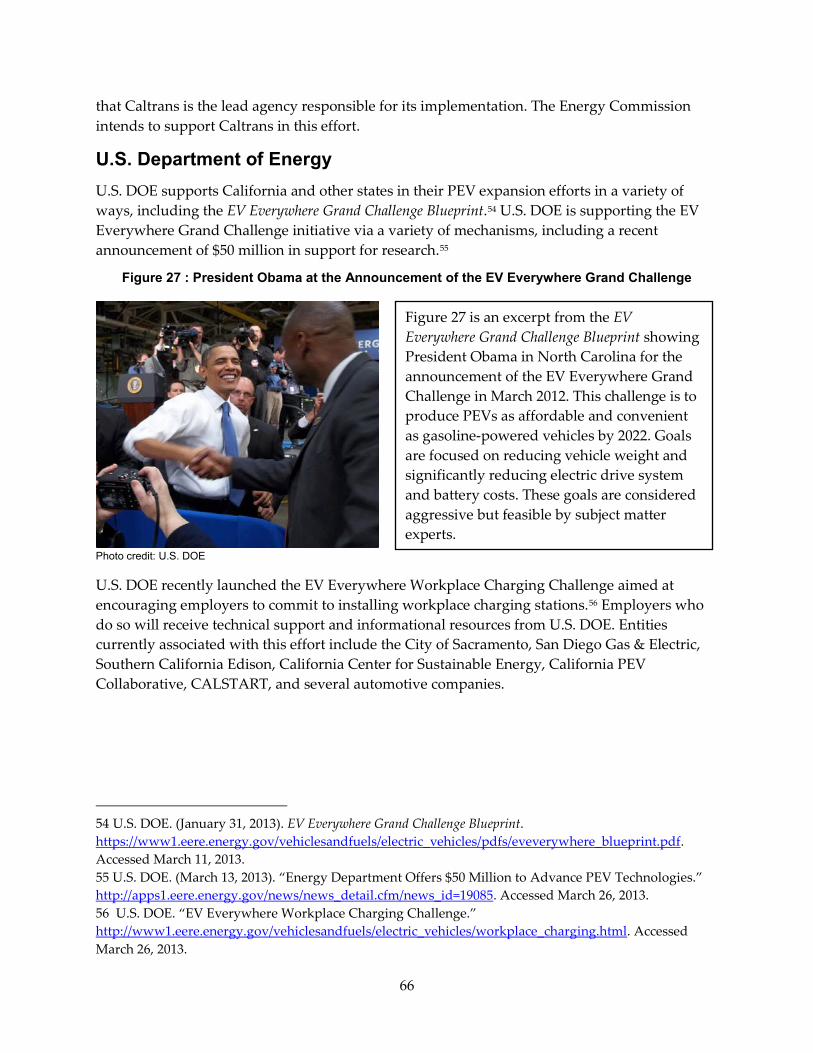
66
that Caltrans is the lead agency responsible for its implementation. The Energy Commission intends to support Caltrans in this effort.
U.S. Department of Energy U.S. DOE supports California and other states in their PEV expansion efforts in a variety of ways, including the EV Everywhere Grand Challenge Blueprint.54 U.S. DOE is supporting the EV Everywhere Grand Challenge initiative via a variety of mechanisms, including a recent announcement of $50 million in support for research.55
Figure 27 : President Obama at the Announcement of the EV Everywhere Grand Challenge
Photo credit: U.S. DOE
U.S. DOE recently launched the EV Everywhere Workplace Charging Challenge aimed at encouraging employers to commit to installing workplace charging stations.56 Employers who do so will receive technical support and informational resources from U.S. DOE. Entities currently associated with this effort include the City of Sacramento, San Diego Gas & Electric, Southern California Edison, California Center for Sustainable Energy, California PEV Collaborative, CALSTART, and several automotive companies.
54 U.S. DOE. (January 31, 2013). EV Everywhere Grand Challenge Blueprint. https://www1.eere.energy.gov/vehiclesandfuels/electric_vehicles/pdfs/eveverywhere_blueprint.pdf. Accessed March 11, 2013. 55 U.S. DOE. (March 13, 2013). “Energy Department Offers $50 Million to Advance PEV Technologies.” http://apps1.eere.energy.gov/news/news_detail.cfm/news_id=19085. Accessed March 26, 2013. 56 U.S. DOE. “EV Everywhere Workplace Charging Challenge.” http://www1.eere.energy.gov/vehiclesandfuels/electric_vehicles/workplace_charging.html. Accessed March 26, 2013.
Figure 27 is an excerpt from the EV Everywhere Grand Challenge Blueprint showing President Obama in North Carolina for the announcement of the EV Everywhere Grand Challenge in March 2012. This challenge is to produce PEVs as affordable and convenient as gasoline-powered vehicles by 2022. Goals are focused on reducing vehicle weight and significantly reducing electric drive system and battery costs. These goals are considered aggressive but feasible by subject matter experts.

67
U.S. DOE also supports a Plug-In Electric Vehicle Readiness Scorecard that enables communities to assess their readiness for PEVs and EVSE.57 Feedback and recommendations are provided to communities to strengthen their approach.
U.S. DOE also supports the Alternative Fueling Station Locator, which can be used to identify public electric charging stations in California.58 Figure 28 was accessed on October 28, 2013, and focuses on the San Francisco area; the locator identified more than 1,400 public charging stations throughout the state. The need for this tool (or something similar) was a common theme at the Statewide PEV Infrastructure Plan Stakeholder Workshop.
Figure 28 : Excerpt From U.S. DOE’s Alternative Fueling Station Locator
Source: U.S. DOE.
U.S. DOE partnered with ECOtality and provided support for The EV Project, which included funding for deployment of EVSE in major metropolitan areas in the United States. Qualified participants receive a home charger at no cost. The goal of the project “is to take the lessons learned from the deployment of the first thousands of EVs, and the charging infrastructure supporting them, to enable the streamlined deployment of the next generation of EVs to come.”59 The EV Project second quarter report for 2013 is available online and provides information useful for those interested in facilitating PEV deployment.60 Note: ECOtality filed for bankruptcy in the fall of 2013. Car Charging Group and its subsidiary Blink Acquisition LLC
57 U.S. DOE Alternative Fuels Data Center. “Plug-In Electric Vehicle Readiness Scorecard.” https://www.afdc.energy.gov/pev-readiness. Accessed March 26, 2013. 58 U.S. DOE Alternative Fuels Data Center. “Electric Vehicle Charging Stations.” http://www.afdc.energy.gov/fuels/electricity_stations.html. Accessed March 26, 2013. 59 “Overview.” The EV Project. http://www.theevproject.com/overview.php. Accessed March 17, 2013. 60 ECOtality. (August 2013). The EV Project: Q2 2013 Report. http://www.theevproject.com/cms-assets/documents/127233-901153.q2-2013-rpt.pdf. Accessed October 28, 2013.
68
purchased assets from ECOtality, including Level 2 and fast charging stations. Car Charging Group and Energy Commission representatives have met (and will continue to do so) in an effort to continue moving forward with planned installations of dozens of fast charge and Level 2 stations in California.
Finally, U.S. DOE provided direct funding support to help six California regions develop regional PEV infrastructure plans. These plans were addressed earlier in this document.
Selected Publications A few publications that the Energy Commission views as especially useful are highlighted here, including the ZEV Community Readiness Guidebook, which has been mentioned already. The California Plug-In Electric Vehicle Collaborative provides access to and supports development of many useful documents. The website http://www.evcollaborative.org/policy-makers provides access to the regional plans described earlier and to multiple informative documents as part of a PEV readiness toolkit. One such document, A Toolkit for Community Plug-In Electric Vehicle Readiness, focuses on the same five core actions as the regional plans and provides multiple references, resources, and specific recommendations for PEV implementation.61
Another useful publication is Ready, Set, Charge, California! that provides a list of primary recommendations for local governments as they prepare for PEV deployment and expands on those recommendations by providing more detail on permitting efficiencies, charging station installation strategies, MUD installation design considerations, checklists, and more.62 A similar paper authored by the executive director of the EV Communities Alliance and focusing more on regional policy perspectives is appropriate for California leaders in understanding potential benefits of PEVs.63
Current and Future Initiatives As mentioned earlier, this assessment is an evolving document and will be updated as required based on stakeholder feedback, sound analysis, PEV and EVSE growth trends, and other factors. Two recently implemented initiatives itemized below will support PEV infrastructure development and provide a mechanism for feedback that could be incorporated into a future, updated Statewide PEV Infrastructure Assessment.
61 California Plug-In Electric Vehicle Collaborative. (August 2012). A Toolkit for Community Plug-In Electric Vehicle Readiness. http://www.evcollaborative.org/sites/all/themes/pev/files/docs/toolkit_final_website.pdf. Accessed March 8, 2013. 62 Ready, Set, Charge, California! A Guide to EV-Ready Communities. (November 2011). http://www.baclimate.org/images/stories/actionareas/ev/guidelines/readysetcharge_evguidelines.pdf. Accessed March 8, 2013. 63 Schorske, R. (November 2011). Accelerating California's EV Transition: A Core Strategy to Enhance our Economy and Environment. Final draft (v2). http://www.baclimate.org/images/stories/actionareas/ev/guidelines/acceleratingcalifornias_evtransition.pdf. Accessed March 8, 2013.
69
The Energy Commission will continue to work with other entities to support EVSE development and PEV adoption. One such effort is the West Coast Green Highway initiative, which is called out specifically in the 2013 ZEV Action Plan. While the Governor’s Office leads this initiative, the Energy Commission intends to support this effort in part by coordinating with the Governor’s Office and with regional representatives as they develop their regional plans. Certainly a focus of this effort will be the Interstate 5 corridor and the short-term challenges associated with ensuring adequate charging availability along Interstate 5 the entire length of California. In the very near term, it may not be practical to expect to travel for long distances along interstates in PEVs – especially in less densely populated areas like Northern California. The capability to do so, though, is a goal that the Energy Commission supports and is a goal that will be addressed regularly with regional coordinators and the Governor’s Office.
Regional Coordination Meetings The first initiative is the establishment of regional PEV readiness coordination meetings. A kickoff meeting was held on February 27, 2013, via a phone conference, with regional representatives providing updates on PEV progress and challenges. Conference call participants indicated strong support for continued regularly scheduled meetings. Based on participant inputs, the agenda for the first three monthly meetings would address streamlining the permitting and inspection processes; promoting PEVs in MUDs, workplaces, fleets, and public agency-owned properties; and updating zoning and parking policies combined with updating building codes for EVSE. The meetings will also serve as an opportunity to remind regional representatives of upcoming Energy Commission funding announcements related to PEVs and EVSE.
ZEV Community Readiness Guidebook A second initiative is the development of a ZEV Community Readiness Guidebook that supports PEV deployment by providing recommendations for permit streamlining, model codes and standards, parking and zoning policies, signage, and fueling and charging locations. The guidebook development requirement was part of the 2013 ZEV Action Plan and was led by the Governor’s Office of Planning Research.
70
GLOSSARY Alternative Fuels Data Center (AFDC): website supported by the U.S. Department of Energy (Office of Energy Efficiency and Renewable Energy) that provides resources and information for a variety of alternative fuels; including benefits, incentives and station location information.
Alternative and Renewable Fuel and Vehicle Technology Program (ARFVTP): program created in 2007 within the California Energy Commission with goals that include developing and deploying alternative and renewable fuels and advanced transportation technologies to help attain California’s climate change policies.
Battery electric vehicle (BEV): a type of electric vehicle that uses chemical energy stored in rechargeable battery packs. Sometimes the terms “pure” BEV or “battery-only electric vehicle” are used in conjunction with or instead of the term “BEV,” often to emphasize that the vehicle’s propulsion is derived from batteries only, and that the vehicle does not have an internal combustion engine, fuel cell, or fuel tank.
California Center for Sustainable Energy (CCSE): a nonprofit organization assisting entities with planning and technical support for efficient buildings, renewable energy, and clean transportation via outreach programs, policy research, and education.
Clean Vehicle Rebate Project (CVRP): a program administered by CCSE that offers rebates for the purchase/lease of various ZEVs or plug-in hybrid light-duty vehicles. Certain rebate requirements apply.
Early adopter metric (EAM): a metric used in this report as a possible indication of the likelihood of ZEV early adoption. The EAM considers historical sales of “green” vehicles, historical sales of luxury vehicles, and average household income.
Electric vehicle supply equipment (EVSE): equipment associated with delivering electrical energy to the electric vehicle, including connectors, plugs and fittings, and other associated equipment, including conductors and housing.
Fast charger (FC): a general term used in this report to denote a charger that has a direct current power supply and can typically charge an electric vehicle much faster than a Level 1 or Level 2 charger.
Fuel cell electric vehicle (FCEV): a vehicle that uses a fuel cell to power its on-board electric motor - typically using hydrogen as a fuel.
Greenhouse gas (GHG): as it relates to this report, greenhouse gases are those emissions from the transportation sector targeted for an 80 percent reduction in 2050 relative to 1990 levels. This goal stems from Executive Order B-16-2012, signed by Governor Brown in March 2012.
Hybrid electric vehicle (HEV): a vehicle with both internal combustion engine and electric propulsion systems.
71
Internal combustion engine vehicle (ICEV): a vehicle with an internal combustion engine. For this report, an ICEV can be considered a typical gasoline-fueled vehicle.
Kilowatt (kW): a unit of power (1,000 watts) often used in defining the output power of electric motors and engines.
Kilowatt hour (kWh): a unit of energy frequently used by electric utilities when billing their customers. A kWh is sometimes a useful term for comparing fuel economy and fuel costs of a conventional vehicle with an electric vehicle. For example, if an electric vehicle requires 30 kWh of electricity to travel 100 miles, and the cost of electricity is $0.10 per kWh, then the electric fuel cost of a hundred mile trip would be $3.00.
Level 1 charger (L1): Level 1 charging is 120V charging that would occur if an electric vehicle were plugged into an ordinary outlet at a typical home, meaning that a Level 1 charger could be considered the outlet or the home itself, for example.
Level 2 charger (L2): a charger that typically supplies 240V, meaning that in general, a Level 2 charger can charge an electric vehicle faster than a Level 1 charger can, but not as fast as a fast charger can. Level 2 chargers can be installed in homes, and the 240V used for Level 2 chargers are similar to what a large home appliance might use.
Light-duty vehicles (LDVs): a passenger car or light truck vehicle weighing less than 8,501 pounds, including subcompact cars, compact cars, midsized cars, large cars, vans, pick-up trucks, and sport utility vehicles.
Light truck (LT): a subset of light-duty vehicles including larger vehicles, such as vans, pick-up trucks, and sport utility vehicles, and excluding smaller passenger vehicles.
Miles per gallon gasoline equivalent (mpgge): a measure of the average distance traveled per unit of energy consumed. One gallon of gasoline is defined as equivalent to 33.7 kilowatt hours of electricity.
Multiunit dwelling (MUD): a single building containing multiple housing units (for example, an apartment building), or a complex that contains several buildings of this type.
National Renewable Energy Laboratory (NREL): a national laboratory for the U.S. Department of Energy focusing on renewable energy and energy efficiency technologies and practices.
Plug-in electric vehicle (PEV); in general, a vehicle that has the capability to be charged from an external source of electricity (such as a residential outlet) with the electricity being stored in onboard rechargeable batteries. The term “PEV” is most often used in this report to denote both PHEVs and BEVs.
Plug-in hybrid electric vehicle (PHEV): a vehicle with an electric motor, an internal combustion engine, and a battery that can be charged using an external connector. PHEVs are bi-fuel vehicles that can be fueled with both gasoline and electricity.
U.S. Department of Energy (U.S. DOE): United States Department of Energy.

72
Vehicle miles traveled (VMT): the total number of miles travelled by a vehicle or vehicles within a given time span.
Zero-emission vehicle (ZEV): in general, a vehicle that emits no harmful tailpipe emissions. For this report (and as defined in the 2013 ZEV Action Plan), ZEVs include hydrogen fuel cell electric vehicles and PEVs (which include both BEVs and PHEVs).
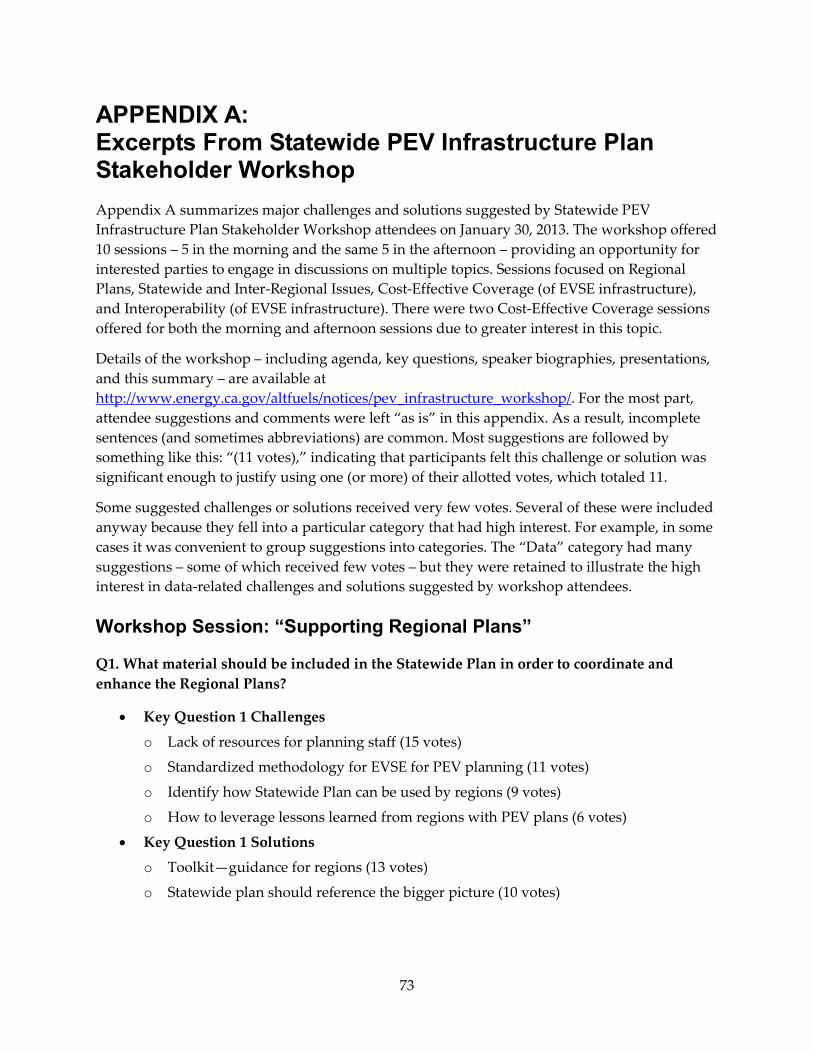
73
APPENDIX A: Excerpts From Statewide PEV Infrastructure Plan Stakeholder Workshop Appendix A summarizes major challenges and solutions suggested by Statewide PEV Infrastructure Plan Stakeholder Workshop attendees on January 30, 2013. The workshop offered 10 sessions – 5 in the morning and the same 5 in the afternoon – providing an opportunity for interested parties to engage in discussions on multiple topics. Sessions focused on Regional Plans, Statewide and Inter-Regional Issues, Cost-Effective Coverage (of EVSE infrastructure), and Interoperability (of EVSE infrastructure). There were two Cost-Effective Coverage sessions offered for both the morning and afternoon sessions due to greater interest in this topic.
Details of the workshop – including agenda, key questions, speaker biographies, presentations, and this summary – are available at http://www.energy.ca.gov/altfuels/notices/pev_infrastructure_workshop/. For the most part, attendee suggestions and comments were left “as is” in this appendix. As a result, incomplete sentences (and sometimes abbreviations) are common. Most suggestions are followed by something like this: “(11 votes),” indicating that participants felt this challenge or solution was significant enough to justify using one (or more) of their allotted votes, which totaled 11.
Some suggested challenges or solutions received very few votes. Several of these were included anyway because they fell into a particular category that had high interest. For example, in some cases it was convenient to group suggestions into categories. The “Data” category had many suggestions – some of which received few votes – but they were retained to illustrate the high interest in data-related challenges and solutions suggested by workshop attendees. Workshop Session: “Supporting Regional Plans”
Q1. What material should be included in the Statewide Plan in order to coordinate and enhance the Regional Plans?
• Key Question 1 Challenges
o Lack of resources for planning staff (15 votes)
o Standardized methodology for EVSE for PEV planning (11 votes)
o Identify how Statewide Plan can be used by regions (9 votes)
o How to leverage lessons learned from regions with PEV plans (6 votes)
• Key Question 1 Solutions
o Toolkit—guidance for regions (13 votes)
o Statewide plan should reference the bigger picture (10 votes)

74
o Statewide plan should start with synthesizing regional plans identifying what needs to be added – integrate best practices from regional plans and identify what should be used in each region (7 votes)
o Education—including customer education (e.g. costs for set-up of at home charging) (7 votes)
o Templates: generic plan, reporting, permitting, zoning/building codes (7 votes)
o Minimum statewide standards with local level flexibility (6 votes)
Q2. What information can be provided to Energy Commission/NREL from regional planning activities to improve the Statewide Plan?
• Key Question 2 Challenges
o Data: Regional travel demand data (7 votes); Centralized resource for data (6 votes); Existing survey data (4 votes)
• Key Question 2 Solutions
o Data access: Current/planned EVSE and PEV location data (15 votes)
Workshop Session: “Statewide & Inter-Regional Issues”
Q1. What are the critical issues requiring coordination between regions?
• Key Question 1 Challenges
o Planning staff cuts in cities/counties limit participation (5 votes)
o There is a need for vehicle data tracking tools and technology to support accurate assignment of funds for road maintenance (model TBD) in a non-fossil fuel environment – infrastructure knowing ‘where’ the miles are driven (5 votes)
o More data requests…
Institutional structures and incentives for state agencies to share and disseminate regional and inter-regional data (2 votes)
Inter-region transportation surveys – How much traffic travels between regions; Where do they stop and how often?
Identify popular destinations visited by consumers in multiple regions
Frequency of travel from one region to another by an EV (2 votes)
o Cost effectiveness, duty factor, economic model for host will be a challenge for DC fast charge aimed at connectivity (4 votes)
o No standardized permitting requirements between AHJs on commercial/residential installs (4 votes)
o Can we develop incentives to get cities to coordinate? (4 votes)
• Key Question 1 Solutions
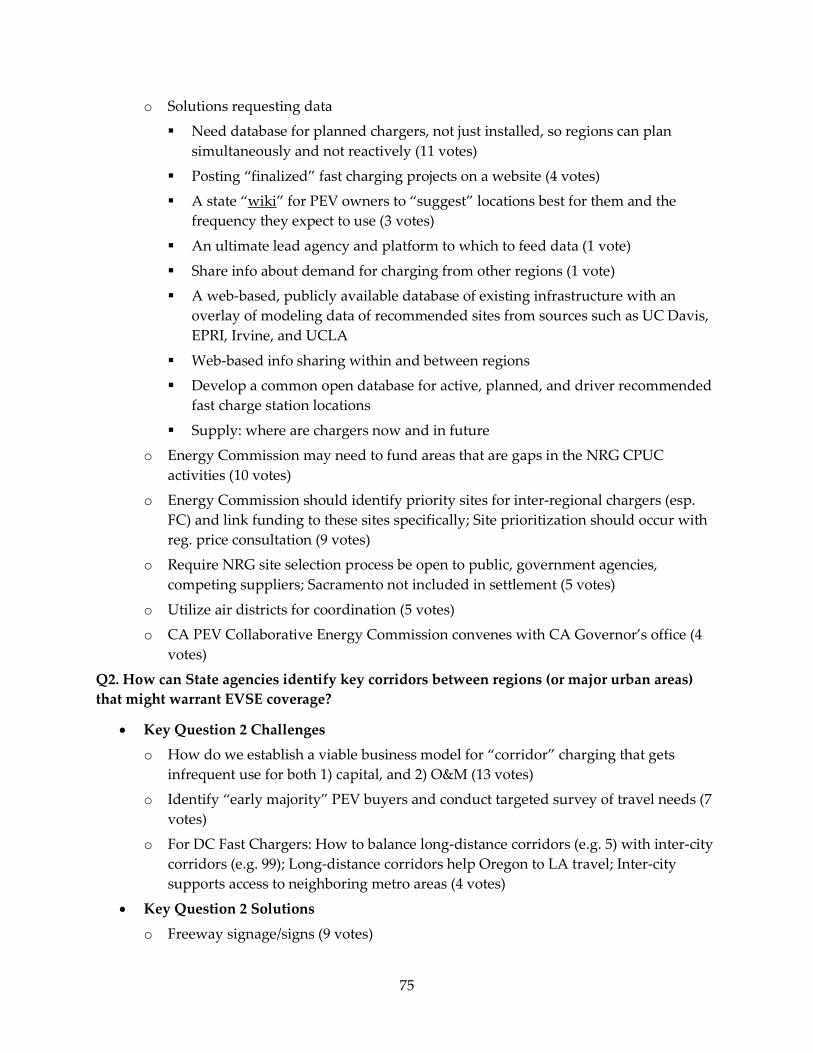
75
o Solutions requesting data
Need database for planned chargers, not just installed, so regions can plan simultaneously and not reactively (11 votes)
Posting “finalized” fast charging projects on a website (4 votes)
A state “wiki” for PEV owners to “suggest” locations best for them and the frequency they expect to use (3 votes)
An ultimate lead agency and platform to which to feed data (1 vote)
Share info about demand for charging from other regions (1 vote)
A web-based, publicly available database of existing infrastructure with an overlay of modeling data of recommended sites from sources such as UC Davis, EPRI, Irvine, and UCLA
Web-based info sharing within and between regions
Develop a common open database for active, planned, and driver recommended fast charge station locations
Supply: where are chargers now and in future
o Energy Commission may need to fund areas that are gaps in the NRG CPUC activities (10 votes)
o Energy Commission should identify priority sites for inter-regional chargers (esp. FC) and link funding to these sites specifically; Site prioritization should occur with reg. price consultation (9 votes)
o Require NRG site selection process be open to public, government agencies, competing suppliers; Sacramento not included in settlement (5 votes)
o Utilize air districts for coordination (5 votes)
o CA PEV Collaborative Energy Commission convenes with CA Governor’s office (4 votes)
Q2. How can State agencies identify key corridors between regions (or major urban areas) that might warrant EVSE coverage?
• Key Question 2 Challenges
o How do we establish a viable business model for “corridor” charging that gets infrequent use for both 1) capital, and 2) O&M (13 votes)
o Identify “early majority” PEV buyers and conduct targeted survey of travel needs (7 votes)
o For DC Fast Chargers: How to balance long-distance corridors (e.g. 5) with inter-city corridors (e.g. 99); Long-distance corridors help Oregon to LA travel; Inter-city supports access to neighboring metro areas (4 votes)
• Key Question 2 Solutions
o Freeway signage/signs (9 votes)
76
o Lots of suggestions similar to bullets below suggesting modeling study results and/or data are used. Examples include travel demand model data, BEV sales data, registration data etc. (8 votes)
o Choose corridors where there is higher density of shops, businesses, restaurants so that drivers have something to do while their car charges (example: HWY 99 vs. I5) (6 votes)
o Conduct intervention study of charger users while charging to understand usage needs (5 votes)
o Rely on regional PEVCCs for local knowledge of infrastructure needs (4 votes)
o Corridors chosen based on electric miles expected to be accessed if there are chargers – based on research models (4 votes)
o Access and use leisure travel data resources to support tourist destination economies (and passing through corridors, i.e. rural areas); existing data (4 votes)
Workshop Session: “Cost-Effective Coverage”
Q1. How can state agencies determine the best use of public funds to support an evolving EVSE network serving multiple vehicle markets? How would this support vary between EVSE applications: residential, MUD, commercial, workplace, and DC fast chargers?
• Key Question 1 Challenges
o Data
Ensure that public-funded EVSE are enabled to collect data and that data is made available for research and modeling work (4 votes)
Comprehensive mapping of expected infrastructure (2 votes)
o Education/training
Confusion about networks and $ to fuel; Need for education about EVSE networks (3 votes)
Education or demonstration to show public EVSE is not very important for PHEV
o Analysis
Time strategy for charging (4 votes)
o Policy
Gaps to grow market demand: support by lowering vehicle purchase cost, subsidies for chargers, employers defray costs (8 votes)
State to streamline policies to have electricity as a transportation fuel (7 votes)
More proportional funding to residential (5 votes)
Careful to prioritize Gaps over selling PEVs (4 votes)

77
Clear metrics/definition of “best” use of public funds (3 votes)
GAP = Multi-family charging in municipal utility territories – retrofits in these areas (3 votes)
MUD and others lack of dedicated parking – need charging in city centers (3 votes)
“Utilization” metric may be misguided – use other metrics (1 vote)
• Key Question 1 Solutions
o Data
Workplace/commercial known locations; solutions and funding to develop tools and manuals (2 votes)
o Education/training
MUD: education/outreach, tech assist, financial (3 votes)
o Analysis
• Target large employee worksites (200+), especially public agencies; minimize costs to charge; expand/enlarge successful existing sites – target public transit parking lots (workplace surrogate) (4 votes)
• Exploit economies of scale – install EVSE at workplace/MUD (3 votes)
• Coordinate EVSE with sustainable communities planning (SB 375) (3 votes)
• Use adaptive, phased planning approach to EVSE deployment, track and learn from usage, inform future deployment (2 votes)
• Ensure EVSE funded today can meet demands of tomorrow
• Identify major driving destinations that can only be reached if install fast chargers
• Put resources where the State can have a critical impact
• Location analysis should be a “local” decision (one ex. for FC – markets in cities)
• Work with existing EV owner/user groups to gain insight into actual use
• Use models, traffic demand data, etc. + expected market penetration to identify areas where EVSE is likely needed – high PEV traffic, long dwell times (ex. workplace)
o Policy
Residential rebate program: private sponsorship, direct to end users, end users decide (17 votes)
Residential: Tax rebate, sell EVSE, Provide public funds as incentives (all-in costs), assist in areas, financing/rebates available to low-income areas, alt. refuel tax credit (or rebate) modeled after feds, statewide process/best practices/protocol for permitting and install, training for building inspectors/permitting, point of purchase rebate, special rate charge and equip.
78
rebate, dealer incentives/rebates, net metering (on vehicles), let utilities sub meter to allow incentive pricing (15 votes)
Utilization/Drivers’ Needs: Ask the drivers – provide funding based on drivers’ needs; CP has 30,000 driver accounts, ask “where do you want your next charger?” (12 votes)
State focus should be on policy fixes/enabling policy (10 votes)
Workplace: support ($) to companies to install L1 or L2 charging, outreach, tariff, rebates, carbon credits/LEED (9 votes)
Demand charges are barrier for low use fast chargers, so public funds could support/offset demand charges until desired use reached (5 votes)
Public input on where they want charging (5 votes)
Destination charging: sponsored charging (i.e. adopt a charger), grants and matching funds (4 votes)
Funding to educate jurisdiction and expedite permit process for MUD deployment (4 votes)
MUD/residential: grants for jurisdictions to craft policy/plan (4 votes)
Provide competitive performance based rebates to spur private efforts, jobs and innovation (3 votes)
Direct investment to drivers to avoid stranded investment (3 votes)
Reduce interconnection timeframes by ensuring minimal utility and municipal delays (3 votes)
Deploying EMS to create new capacity “headroom” for MUDs to lower cost of EVSE upgrades (3 votes)
Commercial: fewer data collection requirements tied to public funds that drive up cost of infrastructure – more flexibility in implementation; mandates for some percentage of spaces devoted to EVs over time, similar to energy eff. stds (3 votes)
Building codes and standards for EVSE (3 votes)
Provide incentives to businesses for workplace charging – leverages public $ with private $ (3 votes)
Public safety network should be CA-level priority (3 votes)
Tiered rebate program (similar to federal 8411 program): let state funds fill private funding gaps in electrical infrastructure and EVSE equipment; various tiers for various applications (2 votes)
FC: government buildings, public parking, free (2 votes)
Take environmental benefit into consideration when funding network (2 votes)
Fast charging: EV electricity rate that mitigates impact at demand charges (1 vote)
79
Public funding should focus on (in order) public, MUD, residential (1 vote)
Multi-family: include in Title 24, local agencies to include in remodels; MUD, long-term parking, and residential (1 vote)
Need to develop communication protocols: TOU rate structures, universal access to EVSE, level 3 reservation system (1 vote)
Q2. How might measures of cost-effectiveness vary as applied across regions?
• Key Question 2 Challenges
o Data
o Education/training
Increase overall market – more cars, education (3 votes)
o Analysis
Base cost effectiveness ultimately is the economic viability of a location; This comes from not just up-front costs but use and community economic benefit in $, GHG, health, etc.; They can be designed for … evaluation (3 votes)
Some EVSE is needed for direct use; some is needed just for public confidence; one metric cannot accurately assess both (3 votes)
Identify reasons why PEVs are not purchased and use public funds to address barriers in all areas (1 vote)
Evaluate cost effectiveness based on PEV take rate in region
o Policy
State should fill in gaps to access for all Californians, but prioritize based on demand 2 eVMT (4 votes)
Potential disparity between regions; how do we divide money between regions (politics)
Avoid geographic targets, focus on markets/segments
• Key Question 2 Solutions
o Data
o Education/training
o Analysis
Focus funds on technology solutions that address the key barriers of entry (cost, convenience, time to charge) and place infrastructure based on data showing traffic patterns to support the investment (6 votes)
Define technical cost effectiveness measures – kw/$<= station capacity/$; kwh/$ <= operational cost effective (5 votes)
Based on long-term feasibility, will they become self-supporting? How long before investment is recouped? (2 votes)
80
o Policy
Regions themselves define top priorities (…, GHG, jobs, etc.); EVSE investments scored by priorities (8 votes)
Fund the process e.g. permit fees, ADA compliance (2 votes)
Invest based on population with set-aside for economically disadvantaged (1 vote) (with disagreement noted – need strong base first)
Workshop Session: “Interoperability”
Q1. Should measures be taken (at the state agency level) to ensure that any PEV driver can use any charging station, regardless of their network membership? If so, what measures could ensure such access and how should they be addressed in the Statewide Plan?
• Key Question 1 Challenges
o Retain possibility of no-network option (11 votes)
o Keep costs low (6 votes)
o Ubiquity (3 votes)
• Key Question 1 Solutions
o Solutions involving Standards/Protocol
National standards (13 votes)
Yes – government monitor industry standards development; Include publicly-available free stations (7 votes)
Open charge point protocol (6 votes)
CA should support standards and encourage BUT NOT MANDATE interoperability (5 votes)
Use existing cards (4 votes)
Open standards (2 votes)
NEMA industry voluntary open standards (2 votes)
Energy Commission funding for companies to develop standards (1 vote)
Public open internet settlement protocols should be encouraged (1 vote)
Define performance parameters instead of full standards (1 vote)
Government financial assistance to voluntarily comply with open national standards for interoperability (1 vote)
DMS Stds
o Policy
Adoption of price disclosure for inter-network should be encouraged, price regulation should not be imposed (5 votes)
81
For public subsidy eligibility, needs to be “free” or “option of paying cash” (1 vote)
CA could set parameters for differential pricing for in/out of network drivers (1 vote)
Q2. What guidance can be provided to ensure that drivers receive enhanced performance from California’s EVSE network?
• Key Question 2 Challenges
o State can dramatically improve performance capabilities if it were to mandate a low cost machine-to-machine cellular data plan – only for energy-related products and systems (10 votes)
o Station location and status data base needs to be neutrally managed, ensuring no self-interest of database operator (4 votes)
o Ensure opt-out is possible for mapping (of EVSE) (4 votes)
o Encourage cars to plug in by removing barriers; Educational opportunity for general public, seeing cars plugged in “in the wild” (2 votes)
• Key Question 2 Solutions
o Mapping—must be lat/long location, not just mailing address or utility service address; Safety - require directional signage to aid user in finding exact location of chargers (11 votes)
o AFDC Mapping system is evolving (10 votes)
o Government investments require 100% open access; private sector figures out how (8 votes)
o Locations on all maps with standardized data format & web feed, RSS (7 votes)
o Government’s role is to promote a level playing field across free, monetized, and all charging business models (6 votes)
o Set standard for kW chargers with minimum fee displayed (4 votes)
o AB-118 funds go to EVSE w/o interoperability issues (2 votes)
Q3. Are there other measures that should be taken in order to provide interoperability in a way that protects consumers?
• Key Question 3 Challenges
o The Energy Commission should ensure EVSE capabilities to respond to demand response programs and pro-actively coordinate with CAISO and V2G Roadmap and CPUC metering and telemetry group. (11 votes)
o Keep market choice in interoperability (2 votes)
• Key Question 3 Solutions
o Logo or voluntary markings to ID interoperable EVSE (7 votes)
o Sponsored charging as an option to attract consumers (5 votes)

82
• Other Comments with significant numbers.
o More comments on Standards echoing those above
o Suggestions for meetings/video conferences between stakeholders, industry, government.
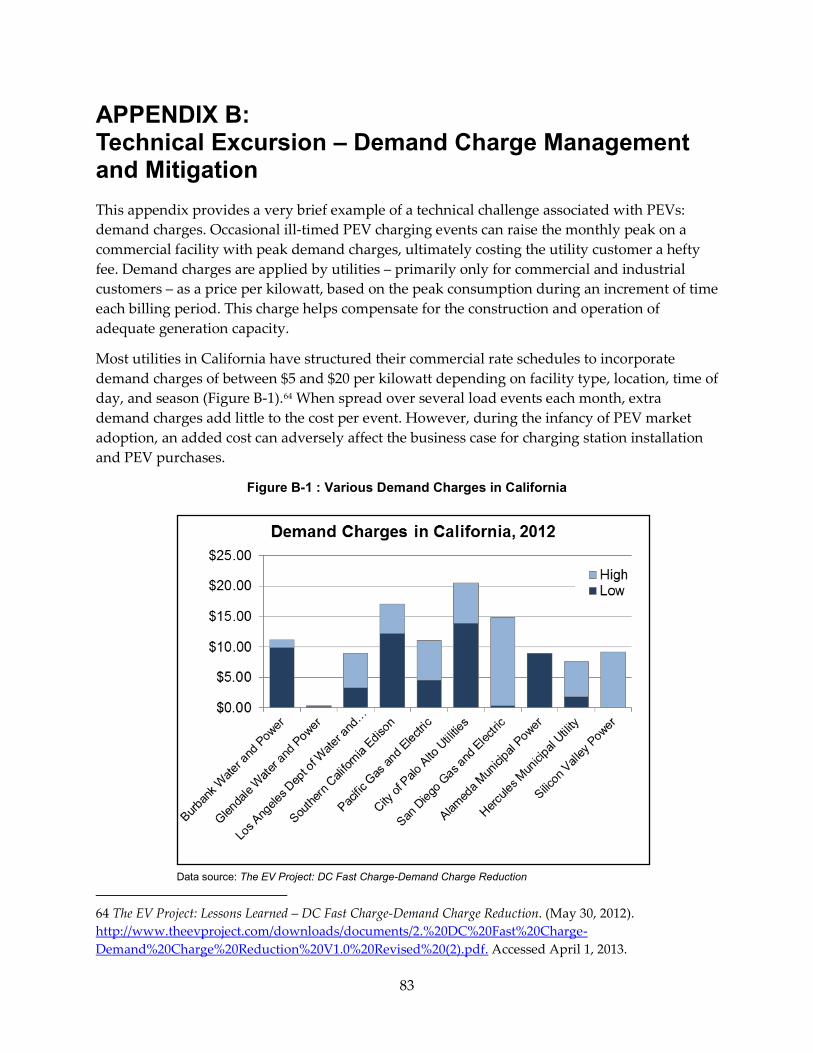
83
APPENDIX B: Technical Excursion – Demand Charge Management and Mitigation
This appendix provides a very brief example of a technical challenge associated with PEVs: demand charges. Occasional ill-timed PEV charging events can raise the monthly peak on a commercial facility with peak demand charges, ultimately costing the utility customer a hefty fee. Demand charges are applied by utilities – primarily only for commercial and industrial customers – as a price per kilowatt, based on the peak consumption during an increment of time each billing period. This charge helps compensate for the construction and operation of adequate generation capacity.
Most utilities in California have structured their commercial rate schedules to incorporate demand charges of between $5 and $20 per kilowatt depending on facility type, location, time of day, and season (Figure B-1).64 When spread over several load events each month, extra demand charges add little to the cost per event. However, during the infancy of PEV market adoption, an added cost can adversely affect the business case for charging station installation and PEV purchases.
Figure B-1 : Various Demand Charges in California
Data source: The EV Project: DC Fast Charge-Demand Charge Reduction
64 The EV Project: Lessons Learned – DC Fast Charge-Demand Charge Reduction. (May 30, 2012). http://www.theevproject.com/downloads/documents/2.%20DC%20Fast%20Charge-Demand%20Charge%20Reduction%20V1.0%20Revised%20(2).pdf. Accessed April 1, 2013.
84
This is of particular concern when planning for DC fast charging stations that may demand up to 50 kW during a single charging session (soon to be 90 kW with the introduction of Society of Automotive Engineers “combo” connector compatible vehicles). Even at the lower end of $5 per kW, an SAE-compliant DC fast charge can add $450 to the station operating expenses each month – offsetting revenue and creating a disincentive to install DC fast chargers.
While some utilities have proposed utility-operated switches to mitigate critical peak events at DC fast charge stations, the station operator will ultimately be responsible for demand charges. Fast charger suppliers anticipated this and began designing stations with internal battery “buffers.” For example, Kanematsu offers a 50 kW charger that requires only a 20 kW grid connection by supplementing the grid power with stationary energy storage.65 The addition of a solar array may further offset demand from the grid. Tesla’s “Supercharger Network” incorporates solar arrays, which generate revenue when not directly offsetting charge power, in addition to stationary batteries.66
The Energy Commission is supporting efforts to provide fast charging infrastructure in California that will use energy storage to reduce demand charges. Green Charge Networks will install, operate, collect data, and assess the performance of fast-charging electric vehicle infrastructure at 16 sites located at 7-Eleven convenience stores in Ventura, Los Angeles, Orange, Riverside, and San Diego Counties. This project will demonstrate the capability of energy storage to dampen the demand peaks and save on the upfront capital investment and ongoing system operating and maintenance costs. The energy storage system will minimize the demand charges of the store by being charged from the grid during off-peak hours when electricity costs are less and storing electricity for use later to charge a PEV (which may be during the day during a period of peak demand). The fast chargers will be available 24 hours per day, 7 days per week with unlimited public access.
65 EV Collective (Kanematsu USA). “Buffer Battery 50KW DC Fast Charger.” http://www.evcollective.com/charger/BB50KW.html. Accessed April 1, 2013. 66 Tesla Motors. (September 24, 2012). “Tesla Motors Launches Revolutionary Supercharger Enabling Convenient Long Distance Driving.” http://www.teslamotors.com/about/press/releases/tesla-motors-launches-revolutionary-supercharger-enabling-convenient-long-dista. Accessed April 1, 2013.
85
APPENDIX C: Technical Excursion – Electrified Roadways
Markets for PEVs are limited by several key barriers, including high upfront vehicle cost, limited range per charge, limited battery life, and slow charge rates. Electrified roadways, which power PEV while driving, are a potential long-term strategy for overcoming these barriers. Relatively little infrastructure would be needed to electrify a significant amount of PEV travel because most travel occurs on a small fraction of roadways. At 1 percent of the roadways, the interstate highway system captures roughly 20 percent of travel.67,68 Electrifying functional road Classes 1, 2, and 3 (generally high-volume, high-speed roadways) would equate to 7 percent of the roadway infrastructure while capturing more than 50 percent of travel. Electrified roadways would alleviate range limitations, reduce the need for public charging, reduce consumer charge times, and extend battery life by reducing cycling wear and displacing the need for fast charging (which also reduces battery life). In addition to making charging more convenient, a reliable and extensive electrified roadway network could also reduce the upfront cost of BEVs. Since almost 80 percent of the U.S. population lives in urban areas, and most people in urban areas are within 10 miles of an interstate highway, many BEV drivers could travel to a greater number of destinations with a smaller battery. Additional research is needed to better understand the potential tradeoffs between the upfront costs associated with electrified roadways and the benefits of alleviating range limitations, more convenient charging, longer battery life, and lower upfront PEV costs due to smaller battery sizes. Assuming high usage rates, results from a preliminary study suggest that capital costs associated with roadway electrification could be recovered with relatively low electricity rates charged to drivers.69
Several electrified roadway implementation technologies are being developed. Volvo has teamed with Alstom to provide vehicles with electric power while driving (Figure C-1).70 In this system, a segment of conductive strip is powered below the vehicle. Siemens is developing an overhead charging pantograph system for trucks.71 KAIST has developed a wireless inroad
67 Federal Highway Administration. (October 2005). “Federal – Aid Highway Length – 2004 Miles by System.” http://www.fhwa.dot.gov/policy/ohim/hs04/xls/hm15.xls. Accessed October 15, 2009. 68 Federal Highway Administration. “Annual Vehicle Distance Traveled in Miles and Related Data – 2004 1/By Highway Category and Vehicle Type.” http://www.fhwa.dot.gov/policy/ohim/hs04/xls/vm1.xls. Accessed October 25, 2009. 69 Brooker, A., H. Wu, M. Earleywine, J. Gonder. (February 2012). “Evaluation of the Costs, Benefits, and Feasibility of Electric Roadways Technologies and Travel Scenarios.” Proceedings of the Conference on Electric Roads and Vehicles (CERV). 70 AB Volvo. (May 23, 2013). “The road of tomorrow is electric.” http://news.volvogroup.com/2013/05/23/the-road-of-tomorrow-is-electric/ 71 Siemens. (Fall 2012). “Electric Trucks: Ready to Roll.” Pictures of the Future. http://www.siemens.com/innovation/apps/pof_microsite/_pof-fall-2012/_html_en/electric-trucks.html.
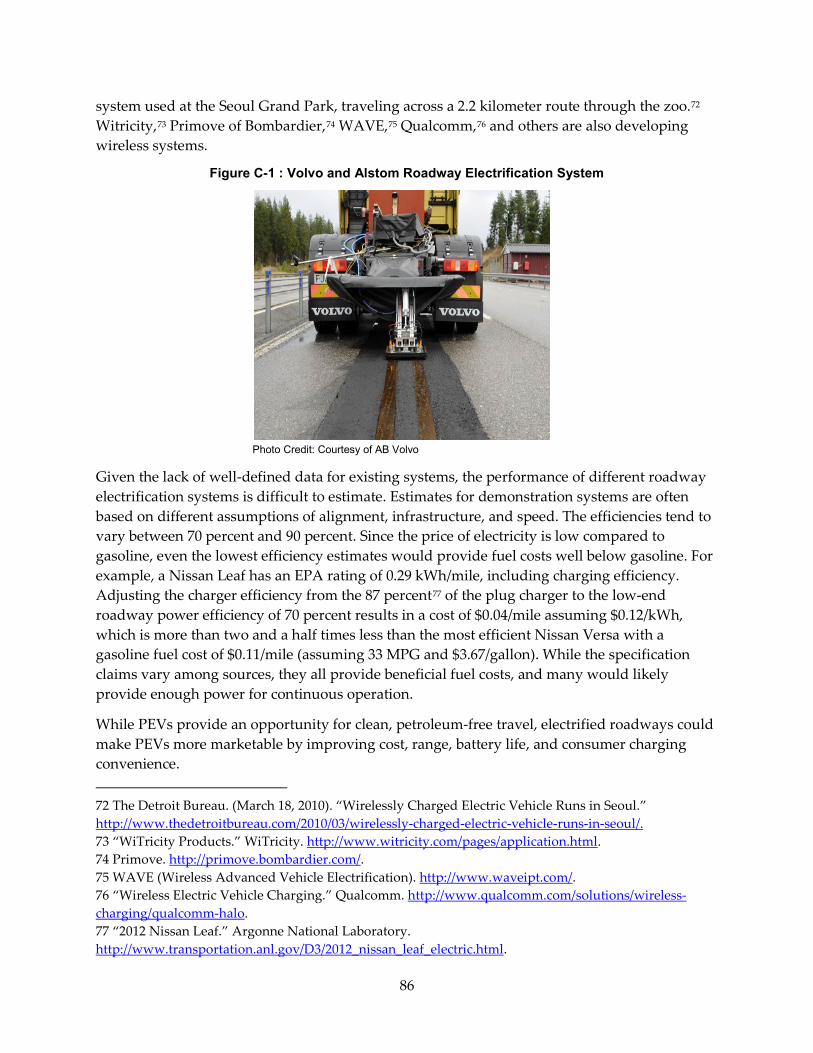
86
system used at the Seoul Grand Park, traveling across a 2.2 kilometer route through the zoo.72 Witricity,73 Primove of Bombardier,74 WAVE,75 Qualcomm,76 and others are also developing wireless systems.
Figure C-1 : Volvo and Alstom Roadway Electrification System
Photo Credit: Courtesy of AB Volvo
Given the lack of well-defined data for existing systems, the performance of different roadway electrification systems is difficult to estimate. Estimates for demonstration systems are often based on different assumptions of alignment, infrastructure, and speed. The efficiencies tend to vary between 70 percent and 90 percent. Since the price of electricity is low compared to gasoline, even the lowest efficiency estimates would provide fuel costs well below gasoline. For example, a Nissan Leaf has an EPA rating of 0.29 kWh/mile, including charging efficiency. Adjusting the charger efficiency from the 87 percent77 of the plug charger to the low-end roadway power efficiency of 70 percent results in a cost of $0.04/mile assuming $0.12/kWh, which is more than two and a half times less than the most efficient Nissan Versa with a gasoline fuel cost of $0.11/mile (assuming 33 MPG and $3.67/gallon). While the specification claims vary among sources, they all provide beneficial fuel costs, and many would likely provide enough power for continuous operation.
While PEVs provide an opportunity for clean, petroleum-free travel, electrified roadways could make PEVs more marketable by improving cost, range, battery life, and consumer charging convenience. 72 The Detroit Bureau. (March 18, 2010). “Wirelessly Charged Electric Vehicle Runs in Seoul.” http://www.thedetroitbureau.com/2010/03/wirelessly-charged-electric-vehicle-runs-in-seoul/. 73 “WiTricity Products.” WiTricity. http://www.witricity.com/pages/application.html. 74 Primove. http://primove.bombardier.com/. 75 WAVE (Wireless Advanced Vehicle Electrification). http://www.waveipt.com/. 76 “Wireless Electric Vehicle Charging.” Qualcomm. http://www.qualcomm.com/solutions/wireless-charging/qualcomm-halo. 77 “2012 Nissan Leaf.” Argonne National Laboratory. http://www.transportation.anl.gov/D3/2012_nissan_leaf_electric.html.
87
APPENDIX D: Selected Energy Commission-Supported Research Efforts
Appendix D contains examples of research efforts supported by the Energy Commission. Some of the examples are of previous work, while others reflect ongoing and planned efforts.
Previous and Ongoing Research Efforts • Battery Second Use
o The PHEV Center performed benchmark testing on electric vehicle battery packs and battery modules, simulating real-world stationary energy storage applications. It was determined that these batteries are capable of operating within acceptable temperature, voltage, roundtrip efficiency, and state-of-charge limits when tested under simulated stationary energy storage application power profiles.
o The PHEV Center looked at the potential reduction in plug-in hybrid battery lease payments from the value that may be added through post-vehicle (second life) grid and localized energy storage services. The analysis found positive but modest potential benefits from repurposing batteries into energy-storage devices sized in accordance with the degraded vehicle capacity.
o The PHEV Center recently subcontracted with Wireless Glue to perform modeling work that will compare the costs and benefits of home energy storage appliances (HESA) and battery-to-grid (B2G) to vehicle-to-grid (V2G) systems. This work was recently completed.
• Vehicle to Grid (V2G)
o The PHEV Center contracted with Colorado State University to develop a techno-economic model framework for V2G and B2G systems to assess the economic effect of marketplace requirements, dispatch signal characteristics, and energy storage limitations. The following conclusions were made:
The models, which took into account battery state of charge (SOC), show lower net revenue of both V2G and B2G compared to analyses that do not take SOC into account.
Grid operators must develop V2G-/B2G-specific signals to take into account distributed energy storage system metrics and specifically designed command signals. Power commands that enable distributed energy storage systems to maintain high reliability can maximize the stability and value of the electric grid.
The scale at which B2G will be viable depends on the utility and on the characteristics of their actuation signals.

88
o The Energy Commission is supporting a V2G demonstration at Los Angeles Air Force Base, the first demonstration of its kind in the nation. This demonstration project will equip several PEVs at the base with V2G equipment to explore the revenue-generating capability of these PEVs by having them participate as fully as possible in the California Independent System Operator's ancillary services markets. This effort is underway and expected to be completed in 2016.
o Expanding on the V2G effort at the Los Angeles Air Force Base, the Department of Defense has awarded contracts for similar demonstrations at an additional six bases. The Energy Commission is supporting efforts at the China Lake base. Research and testing are expected to begin in mid-2014.
• PHEV/BEV Consumer Behavior
o The PHEV Center conducts research to discover conditions under which consumers most value PHEVs and BEVs. Research initiatives include vehicle energy feedback systems that improve value, safety, and performance of vehicles for drivers and energy systems, as well as charging behavior. This work was recently completed.
• Battery Recycling
o Lawrence Berkeley National Laboratory was awarded $250,290 to develop strategies for sustainable and cost-effective recycling and disposal pathways for PEV battery packs. Laboratory researchers will develop consumer adoption scenarios to determine how quickly recycling infrastructure must be scaled up and develop centralized and decentralized recycling scenarios with identification of target areas for early development.
o Farasis Energy, Inc., was awarded $749,710 to develop and demonstrate the technical and cost feasibility of a battery recycling technology known as direct recycling, which was designed for large lithium-ion batteries, such as those found in electric vehicles. The direct recycling approach will recover high-value materials, including lithium and graphite with greater than a 95 percent yield. The materials will then be made suitable for use in the production of new electric vehicle battery packs. The project will include a small-scale demonstration of the integrated process and use the effort to develop a cost model for implementation of the technology throughout California.
o Electricore, Inc., was awarded $750,000 to complete an in-depth study of the potential impacts of the design and process changes required for PEV system standards, including manufacturing and design, vehicle competitiveness with other technologies, battery removal and manufacturing costs, and resulting economic outcomes. It will survey the PEV marketplace, propose design options for standardization of battery modules, identify barriers of having standard battery system design, and recommend potential paths to commercialization.
89
Upcoming Research Efforts Additional research and development opportunities will be pursued under the Electric Program Investment Charge or EPIC. The Energy Commission submitted a Proposed 2012-2014 Triennial Investment Plan to the California Public Utilities Commission (CPUC) on November 1, 2012, which proposes about $4 million in research, development, and demonstration activities for clean transportation and ZEV technologies. If adopted by the CPUC, the triennial plan identifies the following transportation-related strategic objectives:
• Smart and Efficient Charging Technologies and PEV Integration on Grid:
o Investigate smart charging technologies and other strategies, including time-of-use rates for shifting PEV charging to off-peak times while still meeting consumer needs.
o Develop and validate methods to better predict the charging behavior of PEV drivers and the impact of PEVs on the grid.
o Explore and pilot methods to better use smart chargers to integrate PEVs into the grid.
o Investigate and analyze the benefits and downside of wireless PEV charging technologies.
• Grid Communication Interfaces for V2G
o Develop grid communication interfaces for PEV charging to support vehicle-to-grid services.
• Second-Use EV Battery Storage Applications
o Advance development of second-use applications to reduce the upfront costs of both distributed storage and PEVs
• Advanced Recycling Technologies and Processes for PEV Batteries
o Further develop and evaluate advanced technologies and methods for the safe and efficient recycling of battery packs from PEVs.
o Develop the data and tools needed to inform development of a recycling infrastructure for PEV batteries in California.
• V2G and Second-Use Vehicle Battery Application Demonstrations
o Demonstrate V2G and battery second-use applications in various locations and fleet applications (commercial vehicle fleets, as well as light-duty fleets) within IOU territories. The demonstrations will include methods to evaluate and address concerns regarding the application of V2G on battery packs and vehicle-charging components.

90
APPENDIX E: Interoperability of Electric Vehicle Supply Equipment One of the action items in the Governor’s 2013 ZEV Action Plan is to “encourage industry efforts to develop interoperability standards for electric vehicle charging stations that enable PEV drivers to locate and reserve public charging stations and be billed regardless of drivers’ memberships or subscriptions to a network of electric vehicle chargers.” The Governor’s Office is the lead agency on this action item with the Energy Commission providing a supporting role.
On August 15, 2013, the Energy Commission hosted a workshop to solicit ideas on the best way for the state to support EVSE interoperability and what interoperability criteria should be considered when developing EVSE solicitations. The workshop notice, agenda, transcript, presentations, and comments are provided online and illustrated below in Figure E-1.78
Figure E-1 : Source for Interoperability Workshop Documents
Source: Energy Commission
Questions that were addressed during the two stakeholder panels are provided below.
78 Energy Commission. “Implementation of Energy Commission Activities within the Zero Emission Vehicle Action Plan.” http://www.energy.ca.gov/2013-ALT-01/documents/. Accessed September 11, 2013.
91
Stakeholder Panel I Questions 1. What should be the State’s role in supporting industry efforts to develop interoperability
standards? 2. What should the State prioritize in an EVSE solicitation to support the development of
network interoperability – driver access, cost reduction or other priorities? 3. What current business models exist in the EVSE market with regard to interoperability
and should the State provide financial or other support for these models? 4. What criteria should future State EVSE solicitations require with regard to EVSE
interoperability?
Stakeholder Panel II Questions 1. What are the advantages of ensuring that EVSE in California have hardware
interoperability? Are there any disadvantages, and, if so, what are they? 2. What are the overlapping issues and relationships between network and hardware
interoperability? Where do they intersect and what are the future implications of adopting network interoperability without hardware interoperability?
3. How can the Open Charge Point Protocol used in Europe serve as an example to California?
Since the transcripts, presentations and workshop comments are readily available, the Energy Commission does not intend to duplicate them here. The following are some of the more recurring themes or points that were raised at the workshop.
• Membership-based charging networks have some advantages over a pay-as-you-charge approach, including reservation ability and potentially fewer credit card transactions. Requiring a reservation for charging and potential roaming fees could be perceived as disadvantages to a member-based network.
• There were multiple comments and concerns echoing a similar theme – cautioning against “picking a winner” too early. Comments included the need for market consensus before the Energy Commission should take any prescriptive action. Participants noted that business models will evolve and that forcing a market solution too early could stifle technological innovations.
• The cost of charging should be readily apparent to a customer before charging.
• There was general agreement that drivers should be able to charge everywhere, understand charging price mechanisms, and be able to quickly and easily locate charging locations.
• For future EVSE solicitations, it was generally agreed that it would be prudent to require a basic open protocol (such as Open Charge Point Protocol) with the understanding and allowance that a proprietary-developed protocol could be included.
• It is clear that interoperability challenges would not be completely solved at the workshop, and that further discussion was warranted.

92
APPENDIX F: EVSE Expansion Scenario Calculations and Data Projecting PEV Electricity Demand
This analysis assumes that the number of ZEVs sold per year follows a similar distribution of ZEVs and PHEVs used in the minimum ZEV growth scenario developed as part of ARB’s evaluation of the ZEV mandate79, but with an overall greater number of vehicles introduced each year to achieve 1.5 million ZEVs in 2025. Annual sales used in this analysis are shown on Figure F-1, and the resulting mix of ZEVs on the road is shown in Figure F-2. These include BEVs, PHEVs, and a relatively small fraction of fuel cell electric vehicles (FCEVs). As indicated, total PEV sales reach 50,000 per year by 2019, 200,000 per year by 2023, and 350,000 per year by 2025. Passenger cars make up the majority of BEV and PHEV sales, in which FCEVs are split between passenger cars and light trucks (LT). The ZEV growth scenario used in part to develop these calculations is just one scenario representing a minimum number of ZEVs to achieve compliance with the ZEV regulation, not a prediction of or prescription for ZEV sales.
To comply with the ZEV regulation, automakers must generate increasing numbers of ZEV credits each year by making ZEVs available for sale or lease, and it is possible they will over comply. Over the next five years, automakers intend to cater to a diverse array of customer expectations by offering a variety of ZEVs, including FCEVs that meet today’s customer expectations in terms of traveling range, refueling times, and platforms offered. While this analysis assumes that the 2013 ZEV Action Plan milestones and goals will be met primarily with PEVs, the market will ultimately drive California’s ZEV mix in the years to come. The assumed PEV growth trends used in this analysis, which are simplified logistic functions based upon the base ZEV compliance scenario in ARB’s 2011 ISOR report (ARB, 201180), suggest exponential market growth beyond 2025, implying the EVSE infrastructure would also need to continue expanding well beyond the 2020-2025 time frame. For this analysis, the authors focus on the 2020 milestone year from the Governor’s ZEV Action Plan.
The total amount of electricity required to support the 1 million PEVs expected in 2024 is estimated using the ARB VISION81 model for 100-mile BEVs and 20-mile PHEVs, with the summary results indicated in Table G-1. The total fleet of vehicles is approximately 70 percent PHEVs and 30 percent BEVs, with the PHEVs traveling about 45 percent as many e-miles as BEVs. It is assumed that early niche market households operating these BEVs, representing 2 percent of the 14 million light-duty vehicles (LDVs) expected on the road in 2024, are able to use
79 Air Resources Board. (December 2011). “Staff Report: Initial Statement of Reasons Advanced Clean Cars 2012 Proposed Amendments to the Zero Emission Vehicle Program Regulations.” 80 Air Resources Board. (2011). “Staff Report: Initial Statement of Reasons Advanced Clean Cars 2012 Proposed Amendments to the Zero Emission Vehicle Program Regulations.” 81 Air Resources Board. (2012). “Vision for Clean Air: A Framework for Air Quality and Climate Planning.” http://www.arb.ca.gov/planning/vision/vision.htm.
93
a BEV with the same average utility (miles) as households using a primary gasoline internal combustion engine vehicle (ICEV). In other words, the BEVs deployed are not displacing gasoline ICEVs in typical or average households, but rather households that are able to use a limited range vehicle. The average daily VMT for a BEV is shown in Table 6 as being higher than the average gasoline ICEVs because in 2024 most of the BEVs on the road are assumed to be new purchases, which are driven more than older vehicles. The new PHEVs deployed by 2024 are assumed to have a 20-mile electric mile range, with 48 percent of all VMT being e-miles.82
Vehicle fuel economy (mpgge) or fuel consumption (Wh/mile) improves over time as new vehicles employ more efficient components and vehicle designs. The averages shown in Table 6 are for the on-road PEV fleet in 2024, with BEVs at 108 mpgge and PHEVs at 88 mpgge for e-miles. As a point of reference, these fuel economy values are relatively conservative compared to the technological potential for electric drive vehicles in the recent National Research Council study (NRC 2013).83 The vehicle stock model accounts for changes in vehicle attributes and driving patterns over time, so this average improves over time as more efficient vehicles are introduced and driven more VMT per year than older vehicles. The average values for VMT per year and on-road efficiency for both BEVs and PHEVs in Table 6 suggest a total electricity demand of roughly 3 billion kWh, or 3,000 kWh per vehicle per year. This total demand would increase rapidly with the exponential PEVs sales suggested in Figure F-1, reaching 4.0 billion kWh in 2025, and nearly 10 billion kWh by 2030.
82 This estimate of e-miles for 20-mile PHEVs is based upon the usage estimate in the VISION model. 83 The NRC study (2013) explores the potential for an 80 percent reduction in LDV GHG emissions by 2050 and estimates new BEV cars on EPA 2 cycle tests achieving a midrange technology potential of 190 mpgge equivalent and an optimistic technology potential of 219 mpgge (Table 2.12). NRC. (2013). Transitions to Alternative Vehicles and Fuels. Committee on Transitions to Alternative Vehicles and Fuels; Board on Energy and Environmental Systems; Division on Engineering and Physical Sciences; National Research Council. Washington, D.C.: The National Academies Press. http://www.nap.edu/catalog.php?record_id=18264.

94
Figure F-1 : Potential Mix of New ZEV Sales Meeting the 1.5 Million ZEV Goal by 2025
Source: NREL analysis
Figure F-2 : Potential Mix of BEVs, PHEVs, and FCEVs for Meeting the 2025 Goal
Source: NREL analysis
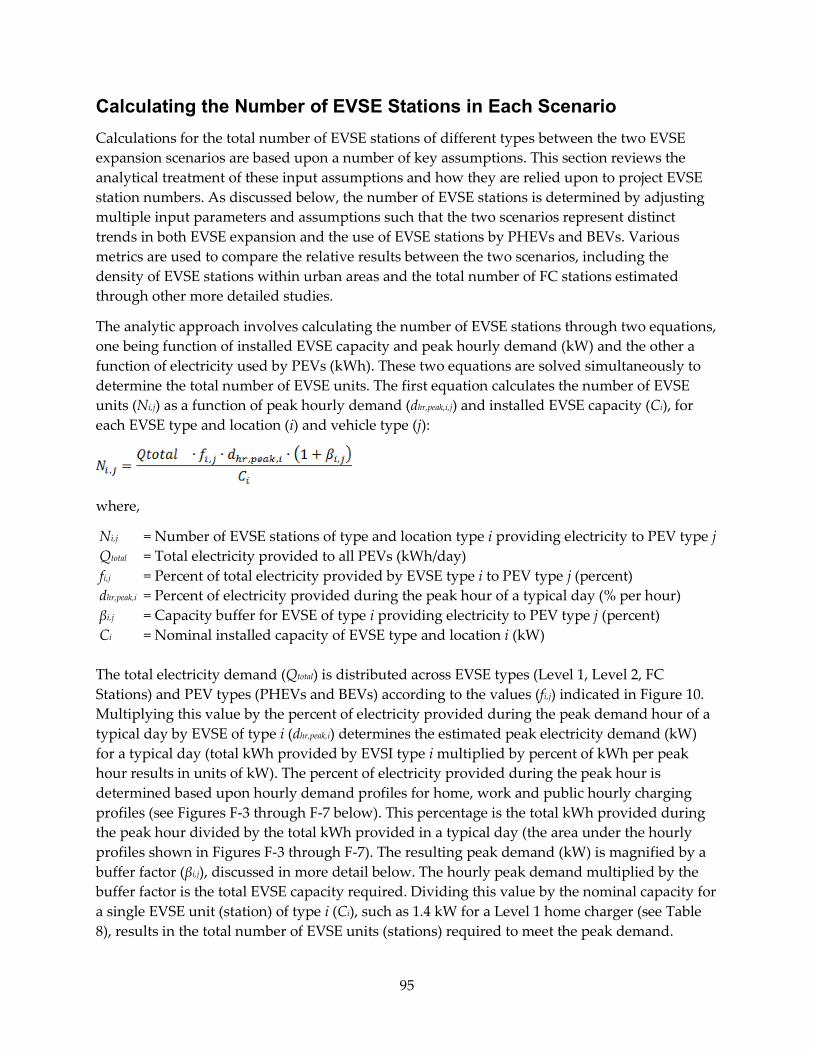
95
Calculating the Number of EVSE Stations in Each Scenario Calculations for the total number of EVSE stations of different types between the two EVSE expansion scenarios are based upon a number of key assumptions. This section reviews the analytical treatment of these input assumptions and how they are relied upon to project EVSE station numbers. As discussed below, the number of EVSE stations is determined by adjusting multiple input parameters and assumptions such that the two scenarios represent distinct trends in both EVSE expansion and the use of EVSE stations by PHEVs and BEVs. Various metrics are used to compare the relative results between the two scenarios, including the density of EVSE stations within urban areas and the total number of FC stations estimated through other more detailed studies.
The analytic approach involves calculating the number of EVSE stations through two equations, one being function of installed EVSE capacity and peak hourly demand (kW) and the other a function of electricity used by PEVs (kWh). These two equations are solved simultaneously to determine the total number of EVSE units. The first equation calculates the number of EVSE units (Ni,j) as a function of peak hourly demand (dhr,peak,i,j) and installed EVSE capacity (Ci), for each EVSE type and location (i) and vehicle type (j):
where,
Ni,j = Number of EVSE stations of type and location type i providing electricity to PEV type j Qtotal = Total electricity provided to all PEVs (kWh/day) fi,j = Percent of total electricity provided by EVSE type i to PEV type j (percent) dhr,peak,i = Percent of electricity provided during the peak hour of a typical day (% per hour) βi,j = Capacity buffer for EVSE of type i providing electricity to PEV type j (percent) Ci = Nominal installed capacity of EVSE type and location i (kW) The total electricity demand (Qtotal) is distributed across EVSE types (Level 1, Level 2, FC Stations) and PEV types (PHEVs and BEVs) according to the values (fi,j) indicated in Figure 10. Multiplying this value by the percent of electricity provided during the peak demand hour of a typical day by EVSE of type i (dhr,peak,i) determines the estimated peak electricity demand (kW) for a typical day (total kWh provided by EVSI type i multiplied by percent of kWh per peak hour results in units of kW). The percent of electricity provided during the peak hour is determined based upon hourly demand profiles for home, work and public hourly charging profiles (see Figures F-3 through F-7 below). This percentage is the total kWh provided during the peak hour divided by the total kWh provided in a typical day (the area under the hourly profiles shown in Figures F-3 through F-7). The resulting peak demand (kW) is magnified by a buffer factor (βi,j), discussed in more detail below. The hourly peak demand multiplied by the buffer factor is the total EVSE capacity required. Dividing this value by the nominal capacity for a single EVSE unit (station) of type i (Ci), such as 1.4 kW for a Level 1 home charger (see Table 8), results in the total number of EVSE units (stations) required to meet the peak demand.
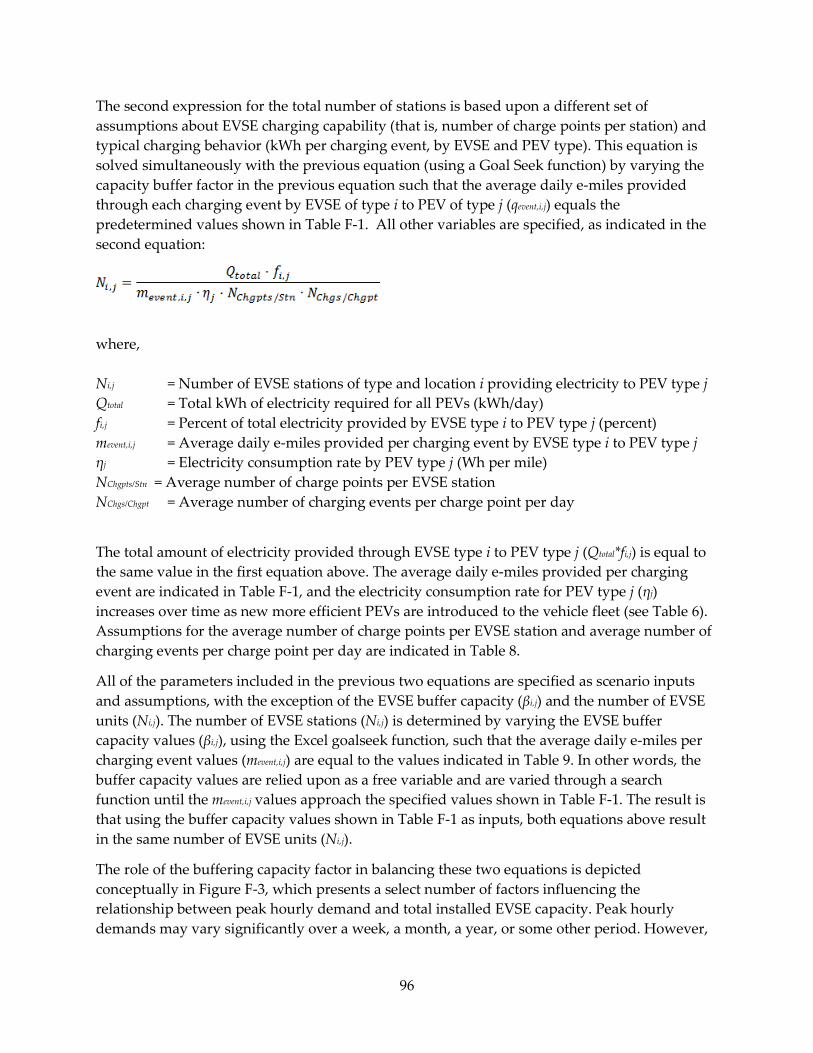
96
The second expression for the total number of stations is based upon a different set of assumptions about EVSE charging capability (that is, number of charge points per station) and typical charging behavior (kWh per charging event, by EVSE and PEV type). This equation is solved simultaneously with the previous equation (using a Goal Seek function) by varying the capacity buffer factor in the previous equation such that the average daily e-miles provided through each charging event by EVSE of type i to PEV of type j (qevent,i,j) equals the predetermined values shown in Table F-1. All other variables are specified, as indicated in the second equation:
where, Ni,j = Number of EVSE stations of type and location i providing electricity to PEV type j Qtotal = Total kWh of electricity required for all PEVs (kWh/day) fi,j = Percent of total electricity provided by EVSE type i to PEV type j (percent) mevent,i,j = Average daily e-miles provided per charging event by EVSE type i to PEV type j ηj = Electricity consumption rate by PEV type j (Wh per mile) NChgpts/Stn = Average number of charge points per EVSE station NChgs/Chgpt = Average number of charging events per charge point per day
The total amount of electricity provided through EVSE type i to PEV type j (Qtotal*fi,j) is equal to the same value in the first equation above. The average daily e-miles provided per charging event are indicated in Table F-1, and the electricity consumption rate for PEV type j (ηj) increases over time as new more efficient PEVs are introduced to the vehicle fleet (see Table 6). Assumptions for the average number of charge points per EVSE station and average number of charging events per charge point per day are indicated in Table 8.
All of the parameters included in the previous two equations are specified as scenario inputs and assumptions, with the exception of the EVSE buffer capacity (βi,j) and the number of EVSE units (Ni,j). The number of EVSE stations (Ni,j) is determined by varying the EVSE buffer capacity values (βi,j), using the Excel goalseek function, such that the average daily e-miles per charging event values (mevent,i,j) are equal to the values indicated in Table 9. In other words, the buffer capacity values are relied upon as a free variable and are varied through a search function until the mevent,i,j values approach the specified values shown in Table F-1. The result is that using the buffer capacity values shown in Table F-1 as inputs, both equations above result in the same number of EVSE units (Ni,j).
The role of the buffering capacity factor in balancing these two equations is depicted conceptually in Figure F-3, which presents a select number of factors influencing the relationship between peak hourly demand and total installed EVSE capacity. Peak hourly demands may vary significantly over a week, a month, a year, or some other period. However,

97
there are very little data available to estimate the likely range of variability in 2024 when 1 million PEVs have been deployed. Moreover, peak demands will likely be managed to some degree by the 2020-2025 time frame, though the effectiveness of different management approaches is also uncertain. Another equally important factor is the degree to which installed EVSE capacity must exceed peak demand periods as the number of PEVs grows exponentially through the 2020-2025 time frame. The authors assume that a successful rollout of EVSE infrastructure will provide sufficient capacity (and spatial coverage) to satisfy these variations in peak demand to enable uninhibited PEV market growth. Figure F-3 indicates how, within the analytic framework relied upon in this study, total installed capacity exceeds both the average peak demand and anticipated variability in peak demand. This analysis is primarily done by specifying the kWh provided through each charging event, as well as the number of events per EVSE charge point (Table F-1). An assumption of fewer kWhs per charging event would result in more installed EVSE capacity, and a greater number of kWhs per event would necessitate less installed capacity, as suggested by the arrows in Figure F-3.
Figure F-3 : Example of Variability in Peak Hourly Demand and Influence of Average kWh per Charging Event on Total Installed EVSE Capacity
Source: NREL analysis
A number of additional variables also influence both peak demand and installed capacity and, therefore, the buffer capacity factor. Rather than attempting to explicitly estimate buffer capacities for each EVSE and PEV type, the present analysis involves adjustments across multiple input parameters such that the two EVSE deployment scenarios represent distinct
98
scenarios that provide insights into relevant metrics and market trends.84 The result of these adjustments is that the relative buffer capacity values between the Home Dominant and High Public Access scenarios, as well as across the range of PEV and EVSE combinations, indicate a consistent representation of the likely influence of peak demand variability and consumer demand for convenience (expressed through market signals or other means) on total installed EVSE capacity. These proposed relative influences are theoretical and conceptual rather than predictive. Future work relying upon more detailed models of travel behavior, spatial infrastructure development, and market behavior will improve upon these types of input assumptions. Acknowledging these uncertainties and potential ranges of variability, the present analytic approach is an attempt to adjust the influence of multiple relevant input assumptions (charges per unit per day, daily profiles, e-miles traveled, and so forth) such that the relative buffer capacities across different EVSE and PEV types match a conceptual understanding of service availability needs, growth dynamics, and consumer demands for convenience.
The EVSE station number result is determined by adjusting each of the parameters discussed above such that the two EVSE expansion scenarios are distinct from one another and provide consistent trends according to assumed consumer demand for public and workplace charging, as well as total supplier benefits associated with increased public and workplace charging. (See Figure 9.) Additional metrics taken into consideration to adjust different input assumptions that influence the total number of EVSE stations are:
1. Percentage of BEVs and PHEVs with and without home charging (Level 1 or Level 2) (see Table 10).
2. Number of public fast charge stations as a function of stations per 100 miles of interstate, with reference to nominal driving times between stations.
3. Number of public Level 1 and Level 2 chargers as a function of EVSE units per square mile, with reference to typical urban area gasoline station densities.
4. Average usage rates (or capacity buffer factors) for workplace and public EVSE units.
The percentage of PEVs without home charging in each scenario is indicated in Table F-2. The greater fraction for the High Public Access scenario effectively pushes more of the total kWhs supplied to PEVs to come from workplace and public EVSE stations and, therefore, influences the balance of e-miles provided per charging event and the number of EVSE stations. The comparisons of FC stations by nominal interstate length and public stations by urban area density are discussed in the text accompanying Table 7. The resulting average usage rates or capacity buffer factors (βi,j) are shown graphically in Figures F-4, F-5, F-6, and F-7 and are discussed in more detail in the following section.
84 The importance of scenario analysis methods in providing insight (in contrast to forecasting models attempting to predict the future) has been discussed elsewhere. See Craig, P., A. Gadgil, J. Koomey. (2002). “What Can History Teach Us? A Retrospective Examination of Long-Term Energy Forecasts for the United States.” Annual Review of Energy and the Environment 27: 83-118.
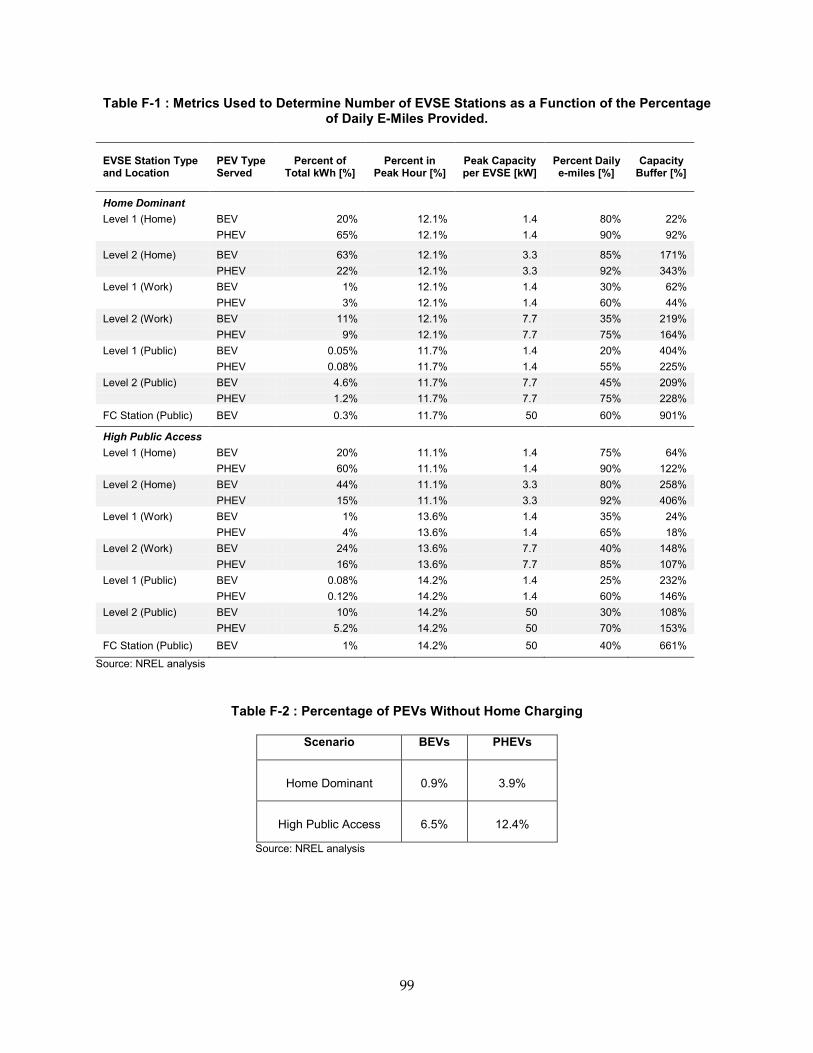
99
Table F-1 : Metrics Used to Determine Number of EVSE Stations as a Function of the Percentage of Daily E-Miles Provided.
EVSE Station Type and Location
PEV Type Served
Percent of Total kWh [%]
Percent in Peak Hour [%]
Peak Capacity per EVSE [kW]
Percent Daily e-miles [%]
Capacity Buffer [%]
Home Dominant Level 1 (Home) BEV 20% 12.1% 1.4 80% 22% PHEV 65% 12.1% 1.4 90% 92%
Level 2 (Home) BEV 63% 12.1% 3.3 85% 171% PHEV 22% 12.1% 3.3 92% 343% Level 1 (Work) BEV 1% 12.1% 1.4 30% 62% PHEV 3% 12.1% 1.4 60% 44% Level 2 (Work) BEV 11% 12.1% 7.7 35% 219% PHEV 9% 12.1% 7.7 75% 164% Level 1 (Public) BEV 0.05% 11.7% 1.4 20% 404% PHEV 0.08% 11.7% 1.4 55% 225% Level 2 (Public) BEV 4.6% 11.7% 7.7 45% 209% PHEV 1.2% 11.7% 7.7 75% 228% FC Station (Public) BEV 0.3% 11.7% 50 60% 901%
High Public Access Level 1 (Home) BEV 20% 11.1% 1.4 75% 64% PHEV 60% 11.1% 1.4 90% 122% Level 2 (Home) BEV 44% 11.1% 3.3 80% 258% PHEV 15% 11.1% 3.3 92% 406% Level 1 (Work) BEV 1% 13.6% 1.4 35% 24% PHEV 4% 13.6% 1.4 65% 18% Level 2 (Work) BEV 24% 13.6% 7.7 40% 148% PHEV 16% 13.6% 7.7 85% 107% Level 1 (Public) BEV 0.08% 14.2% 1.4 25% 232% PHEV 0.12% 14.2% 1.4 60% 146% Level 2 (Public) BEV 10% 14.2% 50 30% 108% PHEV 5.2% 14.2% 50 70% 153% FC Station (Public) BEV 1% 14.2% 50 40% 661%
Source: NREL analysis
Table F-2 : Percentage of PEVs Without Home Charging
Scenario BEVs PHEVs
Home Dominant 0.9% 3.9%
High Public Access 6.5% 12.4%
Source: NREL analysis
100
Peak Charging Demand and Capacity Assumptions A key consideration is the average hourly peak demand for PEVs charging at home, work or public EVSE locations. Demand profiles developed by Markel et al. are relied upon to represent typical hourly demand profiles.85 The three EVSE unit types (L1, L2 and FC) are assumed to have the same demand provide for each location. In the Home Dominant scenario, home Level 1 charging capacity is about 715 MW, home Level 2 is 1,200 MW, work Level 1 charging capacity is 28 MW, work Level 2 is about 260 MW, and public charging is about 2 MW for Level 1 EVSE, 78 MW for Level 2 EVSE, and 13 MW for FC Stations. In contrast, the High Public Access scenario has less home Level 2 charging capacity, and greater work and public charging capacities. The combined demand for all EVSE types is shown in Figure F-8, with the peak in home demand charging in the Home Dominant scenario being reduced in exchange for significant increases in work and public demand peaks in the High Public Access scenarios.
85 Markel, T., T. Mai, M. Kinter-Meyer. (2010). Transportation Electrification Load Development for a Renewable Future Analysis. 25th World Battery, Hybrid and Fuel Cell Electric Vehicle Symposium & Exhibition. Shenzhen, China, November 5-9, 2010. http://www.nrel.gov/docs/fy11osti/49181.pdf.

101
Figure F-4 : Demand and Capacities for Home Charging
Source: NREL analysis
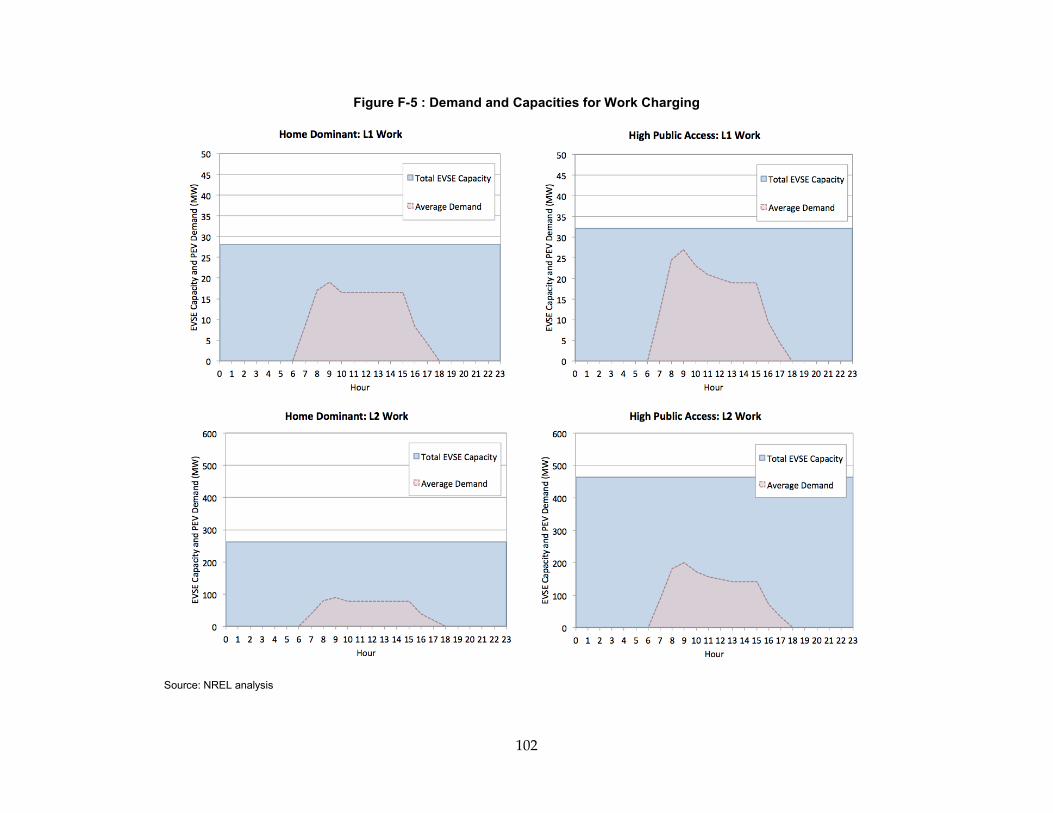
102
Figure F-5 : Demand and Capacities for Work Charging
Source: NREL analysis
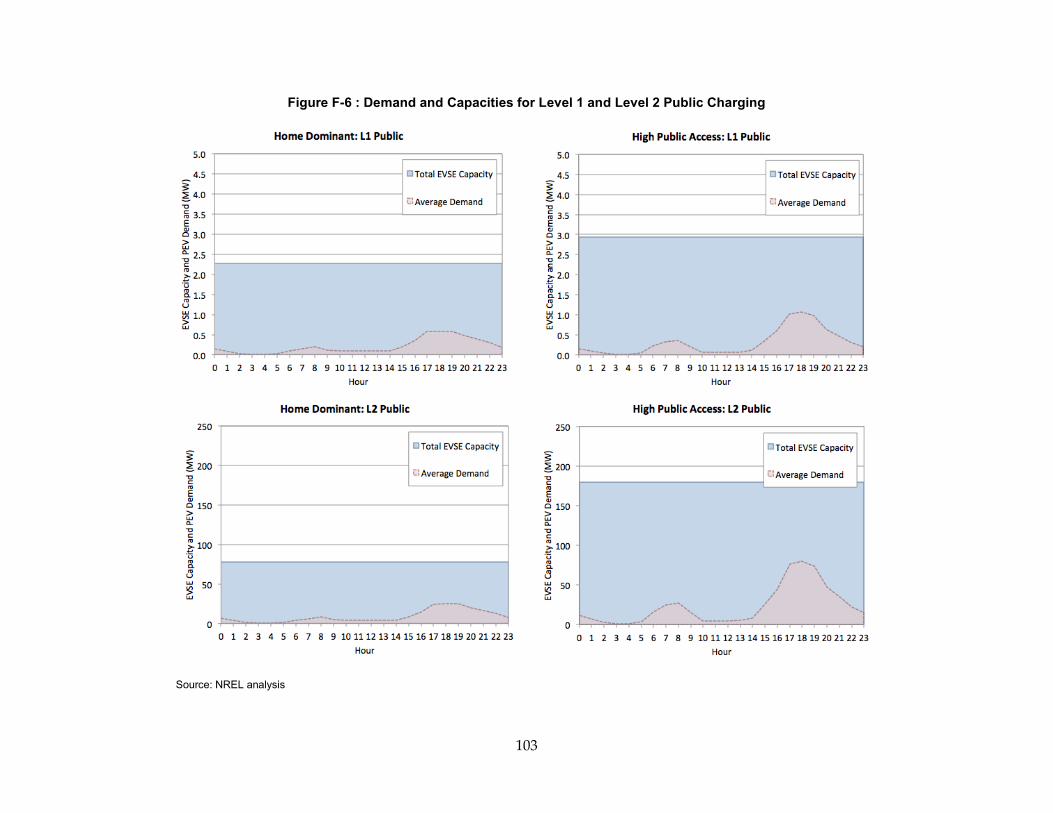
103
Figure F-6 : Demand and Capacities for Level 1 and Level 2 Public Charging
Source: NREL analysis
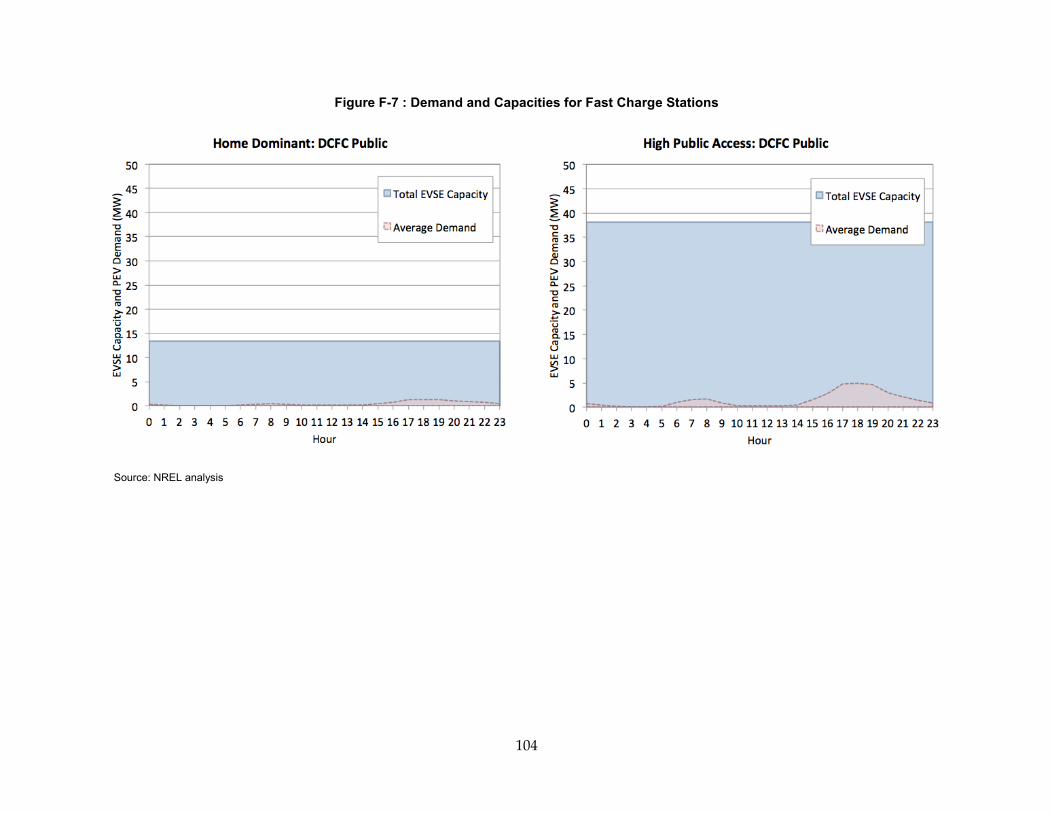
104
Figure F-7 : Demand and Capacities for Fast Charge Stations
Source: NREL analysis
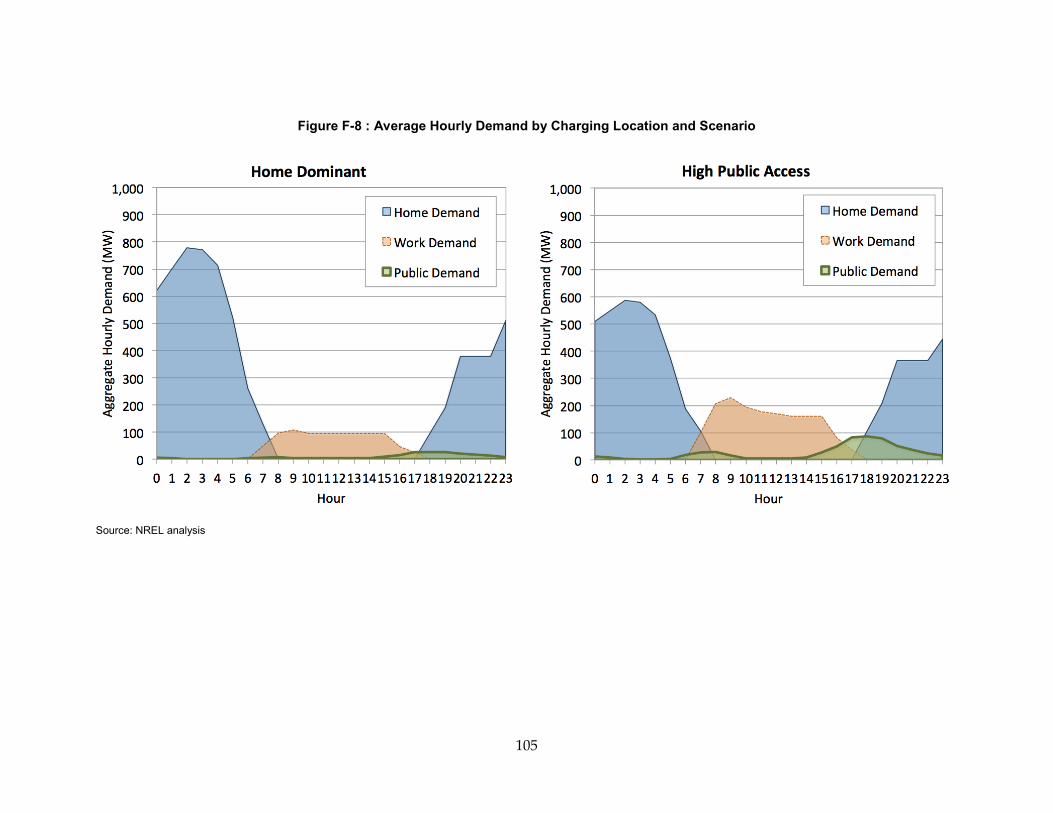
105
Figure F-8 : Average Hourly Demand by Charging Location and Scenario
Source: NREL analysis

106
Early Adopter Metric Given the lack of market experience with PEVs, a generic early adopter metric (EAM) is employed as a proxy for future PEV sales. The EAM weights potential sales regionally based upon simple demographics and sales of LDVs in 2011. The EAM equation is indicated below.
Where the total number of LDV sales as HEVs in a given region is QHEV, total luxury vehicle sales is QLuxury, and total households with annual income greater than $100k is HHIgt$100k. The following weighting factors have been selected:
These factors were selected such that HEV sales account for about 50 percent of the EAM, luxury vehicle sales 30 percent, and household income 20 percent. The rationale behind this subjective weighting system is that the consumers purchasing PEVs between now and 2020 will tend to favor greener LDVs such as HEVs; will tend to prefer higher-end vehicles such as luxury vehicles; and will have relatively high household incomes. This type of metric could be refined considerably to predict consumer behavior with respect a broader range of consumer and vehicle attributes, as has been done in a number of studies based upon both stated and revealed preference data.86,87,88 The goal of using a simple metric in this report is not to predict sales with respect to more detailed attributes or particular consumer study results, but rather to identify general and probable geographic trends for the introduction of advanced and more sustainable LDV technologies within early adopter markets. Future work developing regional estimates for PEV sales should be informed by the regional GHG emission reduction targets established for passenger vehicle use under the Sustainable Communities and Climate Protection Act of 2008.89
Table F-3 below compares various components of the EAM for data in 2011, including total population and percent of total population by planning region. The table also indicates the percentage of HEV and luxury vehicle sales by region, both of which correlate strongly with total LDV sales. These sales data are derived from Polk data for 2011 model year vehicle
86 Brownstone, D., D. S. Bunch, K. Train. (2000). “Joint mixed logit models of stated and revealed preferences for alternative-fuel vehicles.” Transportation Research Part B-Methodological 34(5): 315-338. 87 Greene, D. (2001). TAFV Alternative Fuels and Vehicles Choice Model Documentation. Oak Ridge National Laboratory. http://www.ornl.gov/~webworks/cppr/y2001/rpt/111293.pdf. 88 Brooker, A. (2013). “Analytical Modeling Linking FASTSim and ADOPT Software Tools.” U.S. DOE Vehicle Technologies Program Annual Merit Review Meeting, May 16, 2013, Washington, DC. http://www4.eere.energy.gov/vehiclesandfuels/resources/merit-review/sites/default/files/van004_brooker_2013_o.pdf. 89 Sustainable Communities and Climate Protection Act of 2008 (Sustainable Communities Act, SB 375, Chapter 728, Statutes of 2008). http://www.arb.ca.gov/cc/sb375/sb375.htm.

107
registrations by ZIP code and include roughly 58,000 HEVs and 157,000 luxury vehicles. The percentage of households with annual incomes greater than $100,000 is also indicated. Using the weighting factors indicated above, the EAM can be determined based upon these components and is shown as both a percentage of total early adopters in all regions and as the number of nominal PEVs deployed by 2020, assuming sufficient EVSE infrastructure is required to support 1 million PEVs in that year. As indicated, the Southern California and Bay Area regions account for about 60 percent of the total population and about 70 percent of early adopters.
These EAM results are indicated graphically in Figure F-9, with the percentage of total regional population on the horizontal axis and EAM results on the vertical axis. The use of EAM in the present analysis is considered an improvement over allocating PEVs and, specifically, electricity demand by future PEVs, on the simple basis of population. Figure F-9 indicates the degree to which allocation by the EAM deviates from a simple allocation by population. The figure also portrays the relative size of each region in terms of population and potential early adopters, with the inset in the lower left-hand corner of Figure F-9a containing the eight regions shown in Figure F-9b. These figures indicate the degree to which potential early adopters tend to be concentrated in larger and more affluent urban areas, such as the San Francisco Bay Area, Los Angeles, San Diego, and cities within the Central Coast (Southern). For all of the other regions, the fraction of total regional LDV sales as HEVs or luxury vehicles, as well as the fraction of total regional households with annual incomes greater than $100,000, is less than the percentage of population by region, as indicated numerically in Table F-3. The resulting distribution of a nominal 1 million ZEVs is shown in Table 2.
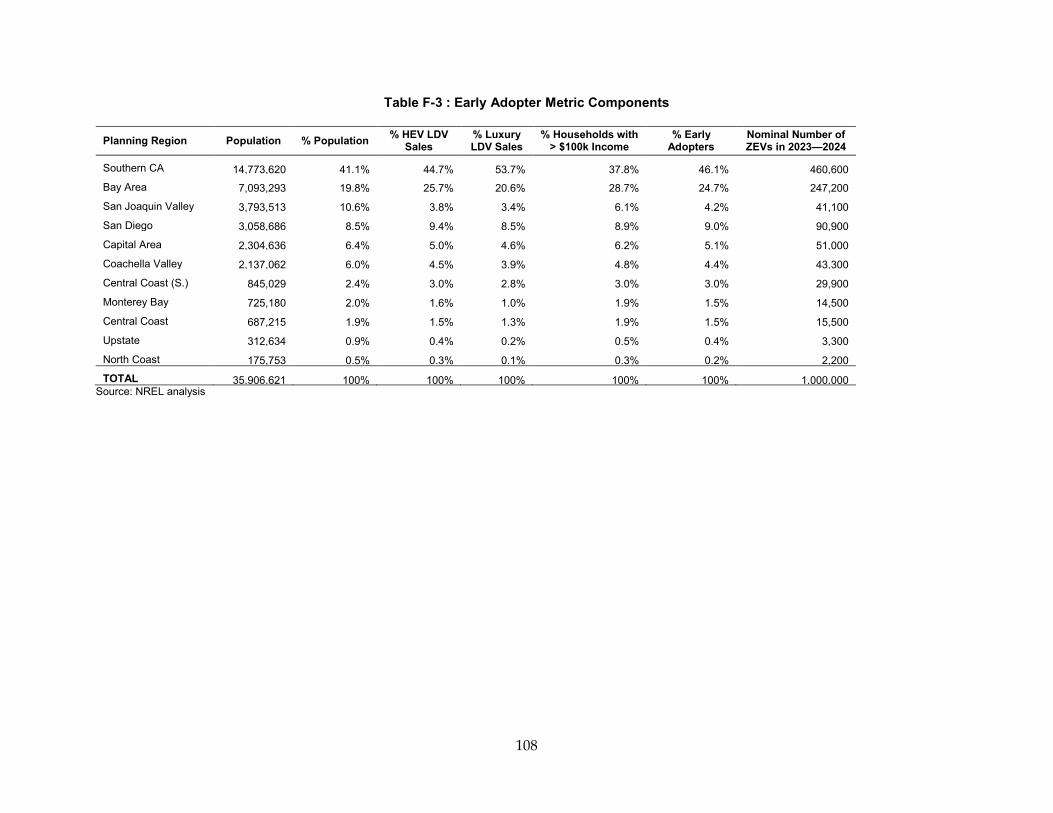
108
Table F-3 : Early Adopter Metric Components Planning Region Population % Population % HEV LDV
Sales % Luxury LDV Sales
% Households with > $100k Income
% Early Adopters
Nominal Number of ZEVs in 2023—2024
Southern CA 14,773,620 41.1% 44.7% 53.7% 37.8% 46.1% 460,600 Bay Area 7,093,293 19.8% 25.7% 20.6% 28.7% 24.7% 247,200
San Joaquin Valley 3,793,513 10.6% 3.8% 3.4% 6.1% 4.2% 41,100
San Diego 3,058,686 8.5% 9.4% 8.5% 8.9% 9.0% 90,900
Capital Area 2,304,636 6.4% 5.0% 4.6% 6.2% 5.1% 51,000
Coachella Valley 2,137,062 6.0% 4.5% 3.9% 4.8% 4.4% 43,300
Central Coast (S.) 845,029 2.4% 3.0% 2.8% 3.0% 3.0% 29,900
Monterey Bay 725,180 2.0% 1.6% 1.0% 1.9% 1.5% 14,500
Central Coast 687,215 1.9% 1.5% 1.3% 1.9% 1.5% 15,500
Upstate 312,634 0.9% 0.4% 0.2% 0.5% 0.4% 3,300
North Coast 175,753 0.5% 0.3% 0.1% 0.3% 0.2% 2,200
TOTAL 35,906,621 100% 100% 100% 100% 100% 1,000,000 Source: NREL analysis
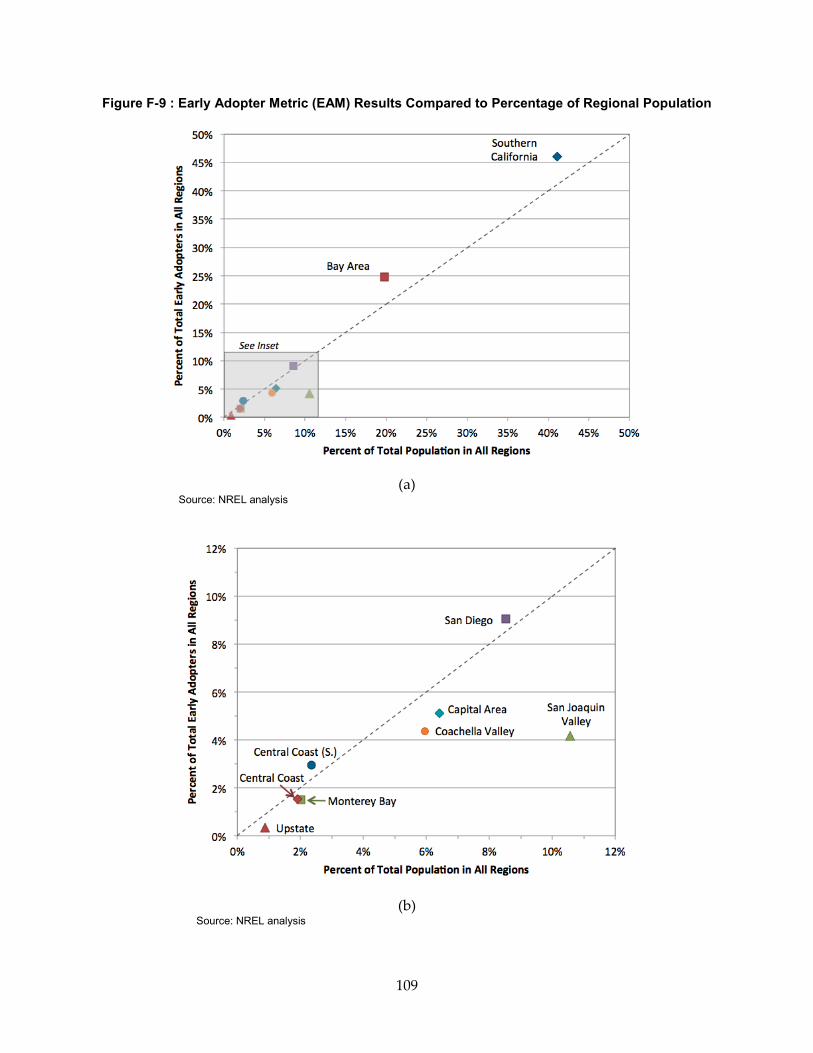
109
Figure F-9 : Early Adopter Metric (EAM) Results Compared to Percentage of Regional Population
(a) Source: NREL analysis
(b) Source: NREL analysis
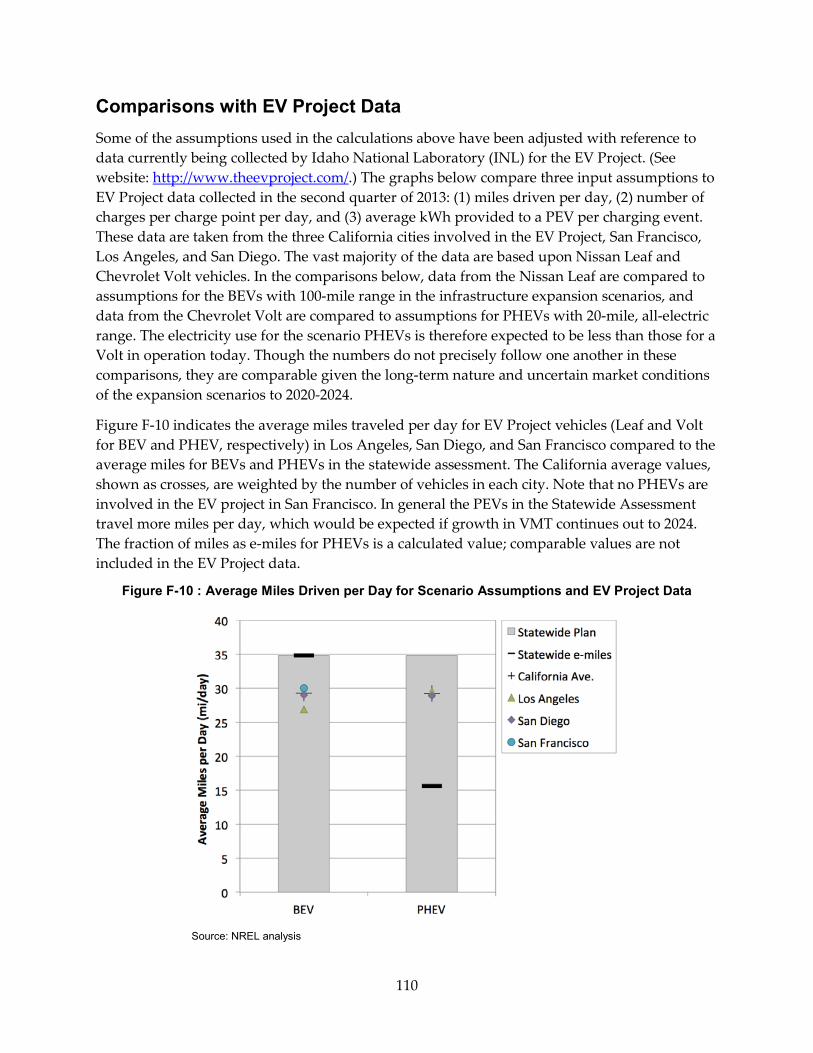
110
Comparisons with EV Project Data
Some of the assumptions used in the calculations above have been adjusted with reference to data currently being collected by Idaho National Laboratory (INL) for the EV Project. (See website: http://www.theevproject.com/.) The graphs below compare three input assumptions to EV Project data collected in the second quarter of 2013: (1) miles driven per day, (2) number of charges per charge point per day, and (3) average kWh provided to a PEV per charging event. These data are taken from the three California cities involved in the EV Project, San Francisco, Los Angeles, and San Diego. The vast majority of the data are based upon Nissan Leaf and Chevrolet Volt vehicles. In the comparisons below, data from the Nissan Leaf are compared to assumptions for the BEVs with 100-mile range in the infrastructure expansion scenarios, and data from the Chevrolet Volt are compared to assumptions for PHEVs with 20-mile, all-electric range. The electricity use for the scenario PHEVs is therefore expected to be less than those for a Volt in operation today. Though the numbers do not precisely follow one another in these comparisons, they are comparable given the long-term nature and uncertain market conditions of the expansion scenarios to 2020-2024.
Figure F-10 indicates the average miles traveled per day for EV Project vehicles (Leaf and Volt for BEV and PHEV, respectively) in Los Angeles, San Diego, and San Francisco compared to the average miles for BEVs and PHEVs in the statewide assessment. The California average values, shown as crosses, are weighted by the number of vehicles in each city. Note that no PHEVs are involved in the EV project in San Francisco. In general the PEVs in the Statewide Assessment travel more miles per day, which would be expected if growth in VMT continues out to 2024. The fraction of miles as e-miles for PHEVs is a calculated value; comparable values are not included in the EV Project data.
Figure F-10 : Average Miles Driven per Day for Scenario Assumptions and EV Project Data
Source: NREL analysis
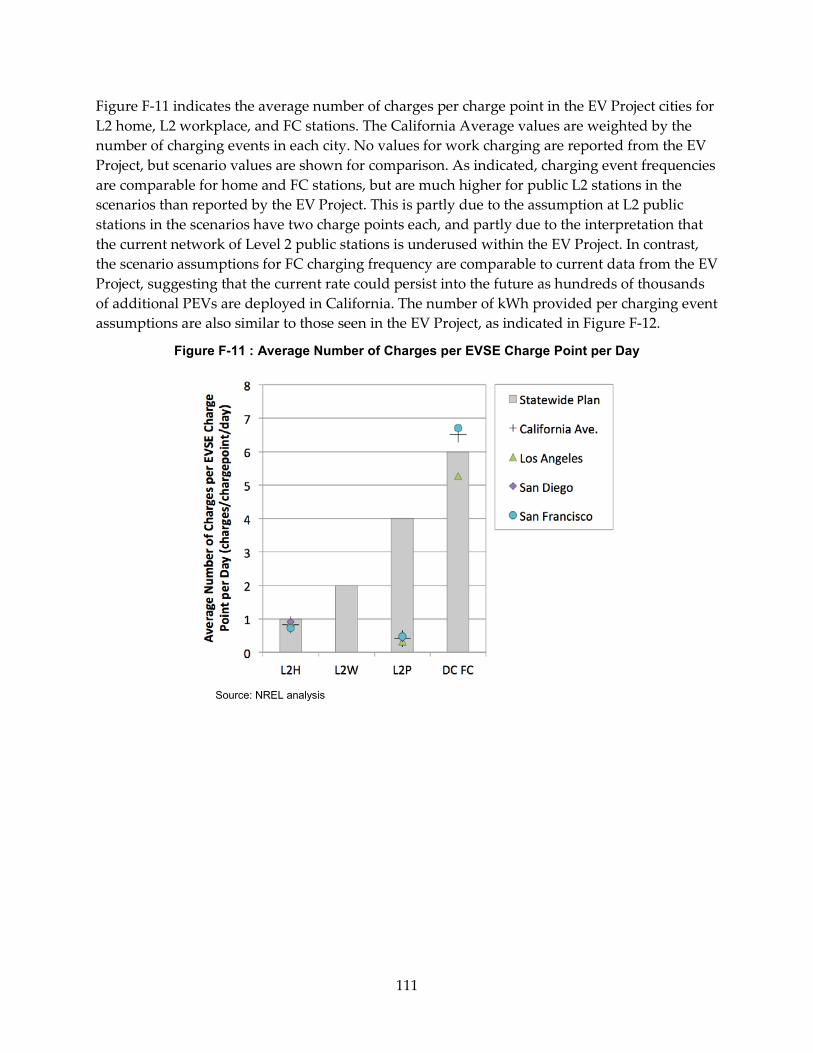
111
Figure F-11 indicates the average number of charges per charge point in the EV Project cities for L2 home, L2 workplace, and FC stations. The California Average values are weighted by the number of charging events in each city. No values for work charging are reported from the EV Project, but scenario values are shown for comparison. As indicated, charging event frequencies are comparable for home and FC stations, but are much higher for public L2 stations in the scenarios than reported by the EV Project. This is partly due to the assumption at L2 public stations in the scenarios have two charge points each, and partly due to the interpretation that the current network of Level 2 public stations is underused within the EV Project. In contrast, the scenario assumptions for FC charging frequency are comparable to current data from the EV Project, suggesting that the current rate could persist into the future as hundreds of thousands of additional PEVs are deployed in California. The number of kWh provided per charging event assumptions are also similar to those seen in the EV Project, as indicated in Figure F-12.
Figure F-11 : Average Number of Charges per EVSE Charge Point per Day
Source: NREL analysis
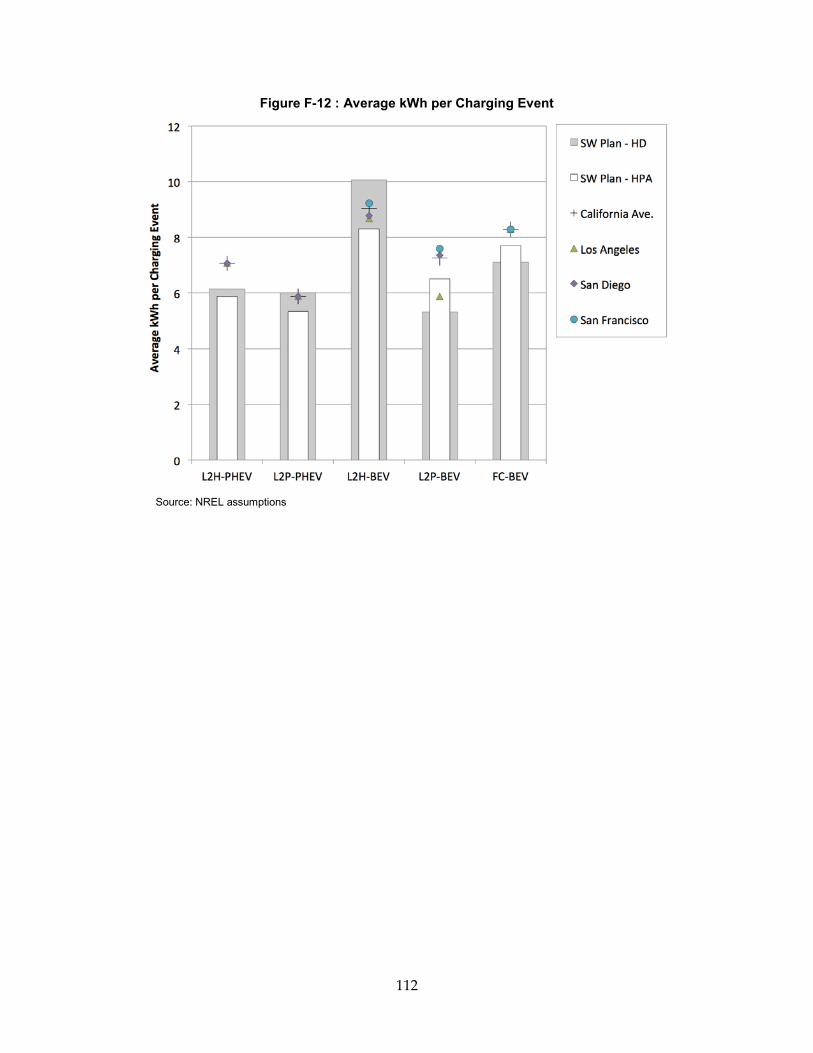
112
Figure F-12 : Average kWh per Charging Event
Source: NREL assumptions