Embed Size (px)
DESCRIPTION
(Cambridge Solid State Science Series )D. I. Bower, W. F. Maddams-The Vibrational Spectroscopy of Polymers (Cambridge Solid State Science Series)-Cambridge University Press(1989)
Citation preview


This book introduces the reader to the theory and practice of infraredand Raman spectroscopy as applied to the study of the physical andchemical characteristics of synthetic organic polymers. Its purpose is toprovide a firm foundation in the subject and a starting point for thestudy of more-advanced literature. To this end, the book concentrateson the fundamental principles, including many now classic studies inthe subject. No previous knowledge either of polymers or of vibrationalspectroscopy is assumed.
The book will be of value to anyone beginning research on thevibrational spectroscopy of polymers, from either a physics or achemistry background, and in particular to research students. Parts ofit will be suitable for use in undergraduate courses in physics, chemistryor materials science.

The vibrational spectroscopy of polymers
Cambridge Solid State Science Series
EDITORS
Professor E. A. DavisDepartment of Physics, University of Leicester
Professor I. M. Ward, FRSDepartment of Physics, University of Leeds
Titles in print in this series
B. W. CherryPolymer surfaces
D. HullAn introduction to composite materials
S. W. S. McKeeverThermoluminescence of solids
D. P. Woodruff and T. A. DelcharModern techniques of surface science
C. N. R. Rao and J. GopalakrishnanNew directions in solid state chemistry
P. L. RossiterThe electrical resistivity of metals and alloys
D. I. Bower and W. F. MaddamsThe vibrational spectroscopy of polymers
S. SureshFatigue of materials
J. ZarzyckiGlasses and the vitreous state
R. A. StreetHydrogenated amorphous silicon
T.-W. ChouMicrostructural design of fiber composites
A. M. Donald and A. H. WindleLiquid crystalline polymers
D.I. BOWERReader in Polymer SpectroscopyInterdisciplinary Research Centre in Polymer Science & TechnologyDepartment of Physics, University of Leeds
W.F. MADDAMSSenior Visiting FellowDepartment of Chemistry, University of Southampton
The vibrationalspectroscopy of polymers
CAMBRIDGEUNIVERSITY PRESS
CAMBRIDGE UNIVERSITY PRESSCambridge, New York, Melbourne, Madrid, Cape Town, Singapore, Sao Paulo
Cambridge University Press
The Edinburgh Building, Cambridge CB2 2RU, UK
Published in the United States of America by Cambridge University Press, New York
www.cambridge.orgInformation on this title: www.cambridge.org/9780521246330
© Cambridge University Press 1989
This publication is in copyright. Subject to statutory exceptionand to the provisions of relevant collective licensing agreements,no reproduction of any part may take place withoutthe written permission of Cambridge University Press.
First published 1989First paperback edition 1992
A catalogue record for this publication is available from the British Library
Library of Congress Cataloguing in Publication dataBower, D. I.The vibrational spectroscopy of polymers/D. I. Bower andW. F. Maddams.
p. cm. - (Cambridge solid state science series)Bibliography: p.Includes index.ISBN 0 521 24633 41. Polymers and polymerization-Analysis. 2. Vibrational spectra.I. Maddams, W.F. II. Title. III. Series.QD381.8.B69 1989547.8 '43-dcl9 88-2956
ISBN-13 978-0-521-24633-0 hardbackISBN-10 0-521-24633-4 hardback
ISBN-13 978-0-521-42195-9 paperbackISBN-10 0-521-42195-0 paperback
Transferred to digital printing 2006
Contents
Preface xiii
1 Introduction 11.1 Vibrational spectroscopy 1
1.1.1 Molecular vibrations 11.1.2 Infrared and Raman spectroscopy 1
1.2 Fundamentals of polymers 21.2.1 Addition polymers 31.2.2 Step growth polymers 41.2.3 Regular chains and defect structures 71.2.4 Polymer morphology and crystallization 12
1.3 The infrared and Raman spectra of polymers 141.4 The electromagnetic spectrum - symbols and units 171.5 Spectrometers and experimental methods in infrared
spectroscopy 181.5.1 Introduction 181.5.2 The dispersive infrared spectrometer 211.5.3 The Fourier transform spectrometer 241.5.4 Sources, detectors and polarizers 271.5.5 The preparation of samples for transmission
spectroscopy 281.5.6 Reflection spectroscopy 30
1.6 Spectrometers and experimental methods in Ramanspectroscopy 311.6.1 Introduction 311.6.2 Sources and optical systems 331.6.3 Monochromators and detectors 341.6.4 Sample preparation and mounting 36
1.7 Mathematical techniques for processing spectra 381.8 Further reading 41
2 Symmetry and normal modes of vibration 422.1 Interatomic forces and molecular vibrations 42
2.1.1 Interatomic forces 422.1.2 Normal modes of vibration 44
vii
viii Contents
2.2 Symmetry and small molecules 472.2.1 Point symmetry operations and symmetry
elements 472.2.2 Point groups 53
2.3 Group representations 572.3.1 Representation of groups by matrices 572.3.2 Reducible, irreducible and equivalent
representations 602.3.3 Symmetry species and character tables 632.3.4 Notation for symmetry species 65
2.4 The number of normal modes of each symmetry species 662.4.1 A reducible 3A/-dimensional representation of the
point group 672.4.2 Reduction of the 3iV-dimensional representation
by the use of normal coordinates 692.4.3 The number of normal modes of each
symmetry species 702.5 Symmetry coordinates and internal coordinates 742.6 Further reading 78
3 The vibrational modes of polymers 803.1 The vibrations of regular polymer chains 80
3.1.1 Introduction 803.1.2 Line group and factor group: polyethylene 813.1.3 Polyethylene and the vinyl polymers: descent in
symmetry 893.1.4 Helical molecules 93
3.2 The vibrations of polymer crystals 973.2.1 The nature of the factor group modes 983.2.2 Factor group modes for crystalline PVC and
polyethylene 1003.3 Further reading 106
4 Infrared and Raman spectra 1074.1 Semiclassical treatment of origins of spectra 107
4.1.1 Polarizability tensors and dipole moments 1074.1.2 Infrared absorption - mechanism and selection
rule 1094.1.3 The origin of Raman scattering 1114.1.4 Raman scattering and the rule of mutual
exclusion 1134.1.5 Selection rules for Raman activity: Raman tensors 117
Contents
4.2
4.3
Polarization effects4.2.1
4.2.2
Polarized infrared spectroscopy - dichroicratiosPolarized Raman spectroscopy - depolarizationratios
Vibrational assignments4.3.14.3.24.3.34.3.44.3.5Force4.4.14.4.2
IntroductionFactor group analysis - chain or local symmetryGroup vibrationsModel compoundsIsotope substitutionfields and vibrational calculationsThe vibrational problem in Cartesian coordinatesGeneralized coordinates - the Wilson G and F
120
120
122125125126131134134137138
4.4
matrices 1394.4.3 Mass-weighted Cartesian coordinates and
normal coordinates 1414.4.4 The solution in principle; potential energy
distributions 1434.4.5 Symmetry coordinates and internal symmetry
coordinates 1454.4.6 Force fields and force constants 1464.4.7 Application to polymers 150
4.5 Finite chains 1564.6 Overtone and combination frequencies; Fermi
resonance 1584.7 Further reading 161
5 The characterization of polymers 1625.1 Introduction 1625.2 The interpretation of polymer spectra: factor group
analysis 1635.2.1 Polyethylene 1635.2.2 Poly(vinyl chloride) 1735.2.3 Poly(vinylidene chloride) 1805.2.4 Polytetrafluoroethylene 1855.2.5 Polystyrene 1945.2.6 Polyethylene terephthalate) 200
5.3 The interpretation of polymer spectra: groupfrequencies 2035.3.1 Introduction 203
x Contents
5.3.2 Hydrocarbon polymers: polypropylene,polyisobutene 206
5.3.3 Polyesters: acetates, acrylates, methacrylates 2085.3.4 Other oxygen-containing polymers: phenolic
resins 2105.3.5 Nitrogen-containing polymers: amides,
polyurethanes 2125.4 Quantitative analysis 215
5.4.1 Introduction 2155.4.2 Copolymers of vinyl chloride or ethylene with
vinyl acetate 2175.4.3 Styrene/acrylonitrile copolymers and crosslinking
in polystyrene 2185.4.4 Polybutadienes and styrene/butadiene copolymers 218
5.5 Monomers and additives 2195.5.1 Caprolactam in Nylon 6; monomer and water in
5.6
5.7
66.1
6.2
6.3
6.46.5
poly(methyl methacrylate)5.5.2 Additives in polyethylene and polypropyleneThe characterization of oxidation and degradation5.6.1 Hydrocarbon polymers: polyethylene,
polypropylene5.6.2 Resonance Raman studies of degradation in PVCFurther reading
The microstructure of polymersThe distribution of copolymerized units in the polymerchain6.1.1 General principles6.1.2 The determination of overall copolymer
composition6.1.3 The characterization of sequence lengthsConfigurational and conformational isomerism6.2.1 Introduction6.2.2 Configurational isomerism: polypropylene6.2.3 Conformational isomerismChain branching6.3.1 Introduction6.3.2 Polyethylene6.3.3 Poly(vinyl chloride)Head-to-head placements in vinyl polymersEnd groups6.5.1 Polyethylene
220222223
223224226
227
227227
228231234234234238246246246250250251252
Contents xi
6.6
6.7
6.86.96.10
6.11
6.5.2 Vinyl polymers6.5.3 Other polymersHydrogen bonding6.6.1 Introduction6.6.2 Poly amides6.6.3 Polyurethanes6.6.4 BiopolymersChain order and crystallinity6.7.1 Introduction6.7.2 Polyethylene6.7.3 Polyoxymethylene6.7.4 Poly(vinyl chloride)6.7.5 Lattice modes in polyethylene and
polytetrafluoroethylene6.7.6 Differentiation between crystallinity and chain
orderChain folding in polyethyleneLongitudinal acoustic modesMolecular orientation6.10.1 Introduction6.10.2 Theoretical background6.10.3 Orientation in polyethylene and poly(ethylene
terephthalate)Further reading
References for chapters 5 and 6
A note on the use of the indexes
Index of spectra illustrated
Index of point groups
Index of group modes
Index of polymers
Main index
254255256256257258262264264265271274
276
278280286292292293
298301
303
307
308
309
309
311
313

Preface
The aim of this book is to present a coherent introductory account of thetheory of vibrational spectroscopy and of its application to the study ofsynthetic organic polymers. The level of presentation is intended to besuitable for the research student who has previously obtained a degreein either physics or chemistry and who is embarking on research in thisarea. Such a student would, we hope, read the book in its entirety andthen be equipped with sufficient background knowledge and under-standing to tackle the specialised literature of the subject with some con-fidence. We hope that in addition the book will fulfil a similar functionfor any research worker new to the subject and that parts of it may alsobe found useful by undergraduate students studying either vibrationalspectroscopy or polymer science. To make the book accessible to thosenew to the study of polymers we have given a brief introduction to thesubject in chapter 1. This chapter also contains a brief description ofexperimental methods in vibrational spectroscopy which is intended togive the reader the minimum amount of information required to followthe rest of the book and to feel that his feet are firmly on the ground.Although we regard the book primarily as one to be read rather thansimply referred to, we have provided detailed indexes, since the nature ofthe subject is such that the spectroscopist needs to master a largenumber of ideas and facts and easy reference to these is vital if thatmastery is to be quickly obtained.
Infrared spectroscopy has been used to characterise syntheticpolymers for the whole of the period over which the majority of themhave been known, and it is still the more popular of the two vibrationalspectroscopic techniques discussed in this book. Raman spectroscopywas very difficult to apply to any material before the advent of the laserin 1960, but since that time the ease of use of the laser as a source hasstimulated the development of better Raman spectrophotometers andRaman spectroscopy may now be undertaken quite as routinely asinfrared. Its lesser popularity springs largely from its greater expense,but we feel that there is also an element of suspicion in the minds of somethat despite the extra expense Raman spectroscopy does not offer anymore than infrared for many investigations, and that in any case it ismore difficult to understand. In fact, the two techniques arecomplementary in a variety of ways and there can be no excuse for
xiii
xiv Preface
neglecting either unless it be the one of expense. In this book the twomethods are treated completely on a par and while we admit thatRaman spectroscopy is slightly more difficult to understand thaninfrared we hope to dispel any fears on this ground.
One of the problems of all spectroscopic techniques is that theyinvolve large amounts of specialised notation and usually attract acorresponding amount of jargon. It is one of the aims of this book topresent both of these aspects of Raman and infrared spectroscopy,particularly as applied to polymers, in as simple a way as possible and togive many examples of their use. In order to leave room for a largeamount of illustrative material, the theoretical sections do not go intomore depth than is necessary for a beginner's understanding. For fullerdetails the reader is referred to the books listed in the Further Readingsections at the ends of chapters 2, 3 and 4. One piece of jargon that wehave tried to avoid entirely is the use of the word 'band' to describe thebroadened spectral lines that are observed in the infrared and Ramanspectra of polymers. To us that word implies a set of discrete lines veryclose together and is best avoided since that is not what is implied by itsuse in the literature of the vibrational spectroscopy of polymers. Wehave preferred to use words such as 'peak' or 'absorption' and we hopethat this idiosyncrasy on our part will not be found confusing.
We owe a great debt to many books, reviews and papers onvibrational spectroscopy in general and on the vibrational spectroscopyof polymers in particular. The books and reviews that we have foundmost useful are listed in the Further Reading sections at the ends of thechapters. We did feel, however, that in a textbook of this nature thepages should not be peppered with references to individual papers. Ouraim has been primarily to illustrate the basic principles of the subject bymeans of examples where the interpretation of the spectra is nowgenerally accepted as well established, at least in outline. Suchacceptance is usually the outcome of the work of a large number ofpeople. In those places where we have relied extensively on the work ofparticular authors their names will usually occur in the text, inacknowledgments for the use of tables or diagrams or in the list ofreferences for chapters 5 and 6 given at the end of the book. This list isnot meant to be comprehensive but to include references to classicpapers and to papers that will lead the reader to the literature of aparticular topic. We thank all authors whose work we have made use ofin preparing the book and especially those who have given us permissionto reproduce or adapt their material. We hope that all will forgive us forany inadvertent misinterpretation or oversimplification of their work.
We are very grateful to a number of people who have read drafts of
Preface xv
various parts of the book, which has benefitted enormously from theircomments. In particular, we should like to thank Professor N. Sheppardfor reading and commenting in great detail on drafts of chapters 1 to 4:without these comments a large number of errors and obscurities wouldnot have been avoided. Others who read various sections and madevaluable suggestions were Professors J. S. Dugdale and G. J. Morgan,Drs G. C. East, L. J. Fina, P. Gans, J. B. Gill, S. J. Spells, A. P. Unwinand J. M. Woodhouse. Professor A. C. T. North rewrote our originalversion of subsection 6.6.4 and the present version is substantially his.Our greatest debt is to Professor I. M. Ward, both for the originalsuggestion to write the book and for reading at least two completedrafts. The present structure of the book and the content of a number ofsections, particularly in chapters 5 and 6, were influenced greatly by hissuggestions. To all these people who contributed to making the bookbetter than it would otherwise have been we offer our thanks, whileaccepting that, in spite of their efforts, errors and obscurities will remain.We accept full responsibility for these and would be pleased to beinformed about them.
Our thanks are due to Dr S. Parker of BP Research Centre, Sunbury,for providing the original spectra for figures 5.1,5.3,5.9,5.14,5.15,5.17,5.18, 5.19 and to Dr P. Spiby for providing the spectrum for figure 4.5.We also thank Mrs M. Edmundson and Mrs G. Garbett for typing partsof the early drafts and the Cambridge University Press for their patienceduring the long preparation time of this book.
August 1988 D. I. BowerW. F. Maddams

Introduction
1.1 Vibrational spectroscopy1.1.1 Molecular vibrations
Molecules consist of atoms bound together by what are usuallycalled chemical bonds. The nature of these bonds will be discussed morefully in chapter 2 and it is only necessary to note here that the bonds andthe angles between them are not rigid. To a first approximation the forcerequired to make a small change in the length of a bond, or a smallchange in the angle between two bonds, is proportional to the changeproduced; similarly, the torque required to twist one part of a moleculethrough a small angle with respect to the rest about a bond isapproximately proportional to the angle of twist. The molecule thusconsists of a set of coupled harmonic oscillators and if it is disturbedfrom its equilibrium state it will vibrate in such a way that the motioncan be considered to be a superposition of a number of simple harmonicvibrations. In each of these so-called normal modes every atom in themolecule vibrates with the same frequency, and in the simplestmolecules all atoms pass through their respective positions of zerodisplacement simultaneously.
There are three principal methods by which the vibrations may bestudied: infrared and Raman spectroscopies and inelastic neutronscattering. The first two methods are available in very manylaboratories, since the equipment required is relatively small and cheap.Neutron scattering is less readily available, since the technique requiresa neutron source, which is usually a nuclear reactor, and relativelyspecialized and expensive equipment to analyse the energies of theneutrons scattered from the sample. In this book we shall not considerneutron scattering in any detail, although it will be mentionedoccasionally. The main purpose of the book will be to explain whatkinds of information infrared and Raman spectroscopies can provideabout polymers and how the information may be obtained. Much ofchapters 2 and 3 and parts of chapter 4 are, however, relevant to thestudy of the vibrations of molecules of any kind.
1.1.2 Infrared and Raman spectroscopyA vibrating molecule may interact in two distinctly different
ways with electromagnetic radiation of appropriate frequency. If the1
2 Introduction
radiation has the same frequency as one of the normal modes ofvibration, and this usually means that it will be in the infrared region ofthe electromagnetic spectrum, it may be possible for the molecule toabsorb the radiation. The energy absorbed will later be lost by themolecule either by re-radiation or, more usually, by transfer to othermolecules of the material in the form of heat energy. An infraredabsorption spectrum of a material is obtained simply by allowing infraredradiation to pass through the sample and determining what fraction isabsorbed at each frequency within some particular range. The frequencyat which any peak in the absorption spectrum appears is equal to thefrequency of one of the normal modes of vibration of the molecules of thesample.
The second way in which electromagnetic radiation may interact witha molecule is by being scattered, with or without a change of frequency.If light is allowed to fall on a sample which is homogeneous on a scalelarge compared with the wavelength of light both types of scattering willin general take place. The scattering without change of frequency may bethought of as scattering from the equilibrium states of the molecules andis called Rayleigh scattering. The scattering with change of frequency iscalled Raman scattering and the change in frequency is equal to thefrequency of one of the normal modes of vibration of the molecules. Thestrongest scattering is at frequencies lower than that of the incident lightand this is called the Stokes Raman scattering.
In general, some but not all of the modes of vibration of a particulartype of molecule can be observed by means of infrared spectroscopy andthese are said to be infrared-active modes. Similarly, some but not allmodes are Raman active. Which modes are active for which processdepends on the symmetry of the molecule. Chapters 2 and 3 are largelydevoted to a discussion of molecular symmetry and how it affects thenature of the normal modes of molecules, polymer chains and polymercrystals. Chapter 4 considers the selection rules which determinewhether each mode is infrared or Raman active and how observedspectral features can be assigned to normal modes.
1.2 Fundamentals of polymersIn this book the term polymer is used to mean a particular class
of macromolecules which consist, at least to a first approximation, of aset of regularly repeated chemical units of the same type, or possibly of avery limited number of different types (usually only two), joined end toend to form a chain molecule. If there is only one type of chemical unitthe corresponding polymer is a homopolymer and otherwise it is acopolymer. The synthetic polymers will form the main examples in this
1.2 Fundamentals of polymers 3
book although much of what is said applies equally to certain classes ofbiological macromolecules, or biopolymers. In this section we considerbriefly the main types of chemical structural repeat units present insynthetic polymers, together with the kinds of structural regularities andirregularities that may occur. Further details of the structures ofindividual polymers will be given in later sections of the book. It shouldbe noted that the term monomer or monomer unit is often used to meaneither the chemical repeat unit or the small molecule which polymerizesto give the polymer. These are not always the same in atomiccomposition, as will be clear from what follows, and the chemicalbonding must of course be different even when they are.
1.2.1 Addition polymersThe sequential addition of monomer units to a growing chain is
a process which is easy to visualize and is the mechanism for theproduction of an important class of polymers. For the most commonforms of this process to occur, the monomer must contain a double (ortriple) bond. The process of addition polymerization occurs in threestages. In the initiation step an activated species, such as a free radicalfrom an initiator added to the system, attacks and opens the doublebond of a molecule of the monomer, producing a new activated species.In the propagation step this activated species adds on a monomer unitwhich becomes the new site of activation and adds on another monomerunit in turn. Although this process may continue until thousands ofmonomer units have been added sequentially, it always terminates whenthe chain is still of finite length. The termination process normally occursby one of a variety of specific chain terminating reactions, which lead toa corresponding variety of end groups.The propagation process isnormally very much more probable than the termination process, sothat macromolecules containing thousands or tens of thousands ofrepeat units are formed.
The simplest type of addition reaction is the formation of polyethylenefrom ethylene monomer:
2—CH2 + C H 2 = C H 2 - -eCH2^ r T TCH2—CH2
Polyethylene is a special example of a generic class that includes many ofthe industrially important macromolecules, the vinyl and vinylidenepolymers. The chemical repeat unit of a vinylidene polymer is—CH2—CXY—, where X and Y represent single atoms or chemicalgroups. For a vinyl polymer Y is H and for polyethylene both X and Y
are H. If X is — CH3 , Cl, —CN, - < O or —O . CO . CH3 and Y is H,
4 Introduction
the well-known materials polypropylene, poly(vinyl chloride) (PVC),polyacrylonitrile, polystyrene or poly(vinyl acetate), respectively, areobtained. When Y is not H, X and Y may be the same type of atom orgroup, as with poly(vinylidene chloride) (X and Y are Cl), or they maydiffer, as in poly (methyl methacrylate)( X is — CH3, Y is —COOCH3)
and poly(a-methyl styrene) {X is — CH3, Y is —<^))- When the
substituents are small, polymerization of a tetra-substituted monomer ispossible, to produce a polymer such as polytetrafluoroethylene (PTFE),-f-CF2 — CF2-)^, but if large substituents are present on both carbonatoms of the double bond there is usually steric hindrance topolymerization.
Polydienes are a second important group within the class of additionpolymers. The monomers have two double bonds and one of theseis retained in the polymeric structure, to give one double bondper chemical repeat unit of the chain. This bond may be in thebackbone of the chain or in a side group. If it is always in a sidegroup the polymer is of the vinyl or vinlylidene type. The two mostimportant examples of polydienes are polybutadiene, containing1,4-linked units of type — CH2—CH=CH—CH2— or 1,2-linkedunits of type —CH2—CH(CH=CH2)—, and polyisoprene, containingcorresponding units of type —CH2—C(CH3)=CH—CH2— or—CH2—C(CH3)(CH=CH2)—. Polymers containing both types of unitare not uncommon, but special conditions may lead to polymersconsisting largely of one type. Acetylene, CH=CH, polymerizes by ananalogous reaction in which the triple bond is converted into a doublebond to give the chemical repeat unit -(-CH=CH-)-.
Ring-opening polymerizations, such as those in which cyclic etherspolymerize to give polyethers, may also be considered to be additionpolymerizations:
The simplest type of polyether, polyoxymethylene, is obtained by thesimilar polymerization of formaldehyde in the presence of water:
nCH 2 =O -+ -f-CH2—(H;
1.2.2 Step growth polymersStep growth polymers are obtained by the repeated process of
joining together smaller molecules, which are usually of two differentkinds at the beginning of the polymerization process. For theproduction of linear (unbranched) chains it is necessary and sufficient
1.2 Fundamentals of polymers 5
that the number of reactive groups on each of the initial 'building brick'molecules is two and that the molecule formed by the joining together oftwo of these molecules also retains two appropriate reactive groups.There is usually no specific initiation step so that any appropriate pair ofmolecules present anywhere in the reaction volume can join together.Many short chains are thus produced initially and the length of thechains increases both by the addition of monomer to either end of anychain and by the joining together of chains.
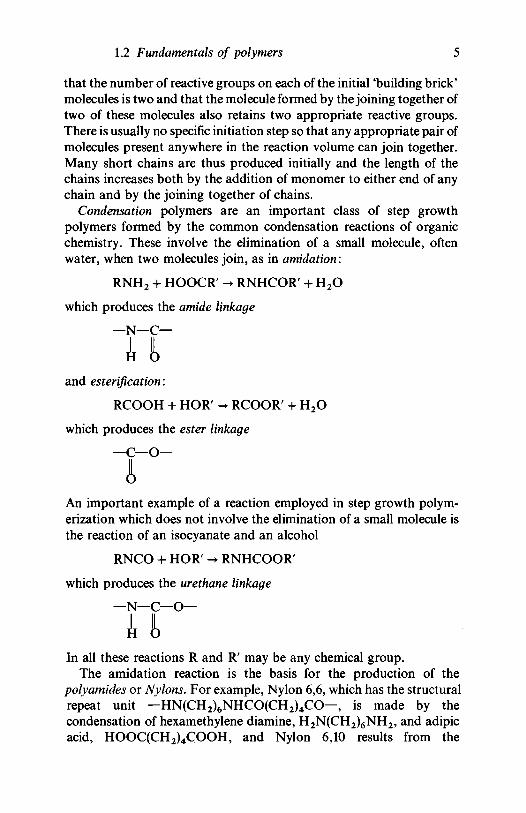
Condensation polymers are an important class of step growthpolymers formed by the common condensation reactions of organicchemistry. These involve the elimination of a small molecule, oftenwater, when two molecules join, as in amidation:
RNH2 + HOOCR' -• RNHCOR' + H2O
which produces the amide linkage
—N—C—
Hand esterification:
RCOOH + HOR' - RCOOR' + H2O
which produces the ester linkage
—C—O—
An important example of a reaction employed in step growth polym-erization which does not involve the elimination of a small molecule isthe reaction of an isocyanate and an alcohol
RNCO + HOR' -> RNHCOOR'
which produces the methane linkage
—N—C—O—
HIn all these reactions R and R' may be any chemical group.
The amidation reaction is the basis for the production of thepolyamides or Nylons. For example, Nylon 6,6, which has the structuralrepeat unit —HN(CH2)6NHCO(CH2)4CO—, is made by thecondensation of hexamethylene diamine, H2N(CH2)6NH2, and adipicacid, HOOC(CH2)4COOH, and Nylon 6,10 results from the
6 Introduction
comparable reaction between hexamethylene diamine and sebacic acid,HOOC(CH2)8COOH. In the labelling of these Nylons the first numberis the number of carbon atoms in the amine residue and the second thenumber of carbon atoms in the acid residue. Two Nylons of somewhatsimpler structure, Nylon 6 and Nylon 11, are obtained, respectively,from the ring-opening polymerization of the cyclic compound e-caprolactam:
nOt(CH2)5NH
and from the self-condensation of co-amino-undecanoic acid:
H H O O C ( C H 2 ) 1 0 N H 2 -+ -eOC(CH2)10NH-^ + nH2O
The most important polyester is poly(ethylene terephthalate),
-(-(CH2)2OOC—<(3^COO-fe, which is made by the condensa-
tion of ethylene glycol, HO(CH2)2OH, and terephthalic
acid, HOOC—{Q>—COOH, or dimethyl terephthalate,
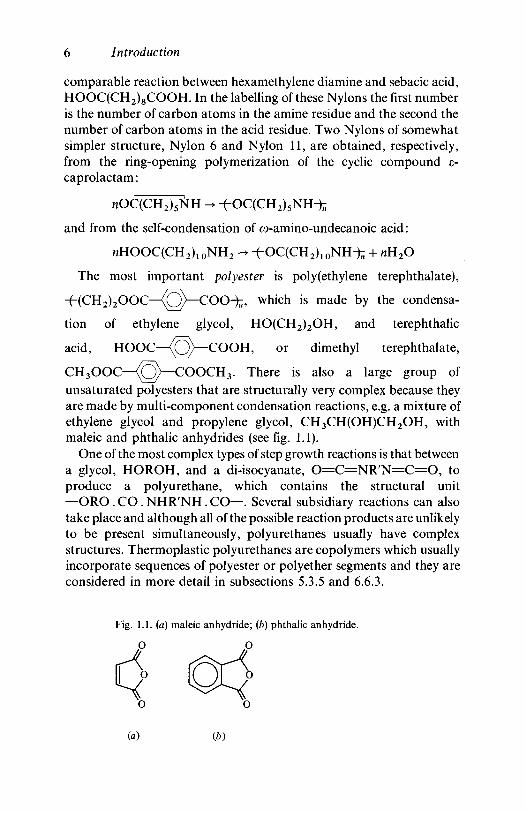
CH3OOC—{C>>—COOCH3. There is also a large group ofunsaturated polyesters that are structurally very complex because theyare made by multi-component condensation reactions, e.g. a mixture ofethylene glycol and propylene glycol, CH3CH(OH)CH2OH, withmaleic and phthalic anhydrides (see fig. 1.1).
One of the most complex types of step growth reactions is that betweena glycol, HOROH, and a di-isocyanate, O = C = N R ' N = C = O , toproduce a polyurethane, which contains the structural unit—ORO . CO . NHR'NH . CO—. Several subsidiary reactions can alsotake place and although all of the possible reaction products are unlikelyto be present simultaneously, polyurethanes usually have complexstructures. Thermoplastic polyurethanes are copolymers which usuallyincorporate sequences of polyester or polyether segments and they areconsidered in more detail in subsections 5.3.5 and 6.6.3.
Fig. 1.1. (a) maleic anhydride; {b) phthalic anhydride.
O O
1.2 Fundamentals of polymers
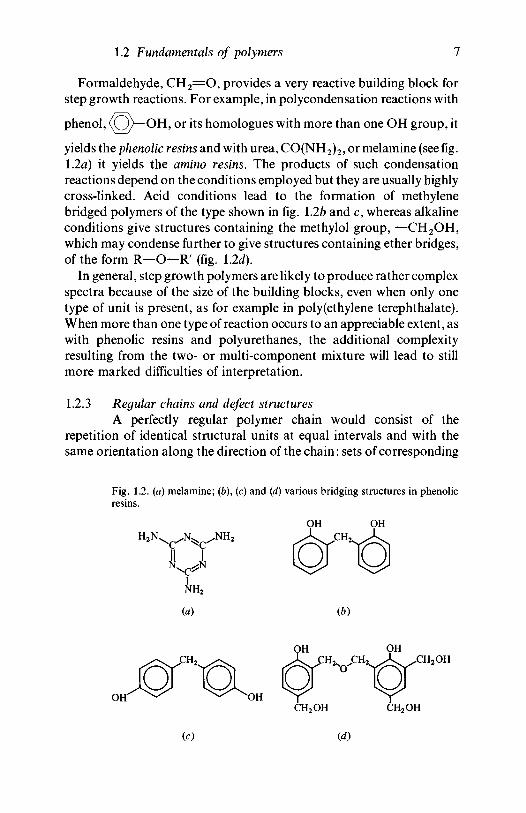
Formaldehyde, C H 2 = O , provides a very reactive building block forstep growth reactions. For example, in polycondensation reactions with
phenol, \O)—OH, or its homologues with more than one OH group, it
yields the phenolic resins and with urea, CO(NH2)2, or melamine (see fig.1.2a) it yields the amino resins. The products of such condensationreactions depend on the conditions employed but they are usually highlycross-linked. Acid conditions lead to the formation of methylenebridged polymers of the type shown in fig. 1.2b and c, whereas alkalineconditions give structures containing the methylol group, —CH2OH,which may condense further to give structures containing ether bridges,of the form R—O—R' (fig. 12d).
In general, step growth polymers are likely to produce rather complexspectra because of the size of the building blocks, even when only onetype of unit is present, as for example in poly(ethylene terephthalate).When more than one type of reaction occurs to an appreciable extent, aswith phenolic resins and polyurethanes, the additional complexityresulting from the two- or multi-component mixture will lead to stillmore marked difficulties of interpretation.
1.2.3 Regular chains and defect structuresA perfectly regular polymer chain would consist of the
repetition of identical structural units at equal intervals and with thesame orientation along the direction of the chain: sets of corresponding
Fig. 1.2. (a) melamine; (b), (c) and (d) various bridging structures in phenolicresins.
OH
NH2
(a) (b)
(c)
OH.CH2OH
8 Introduction
points in all structural units would lie on parallel straight lines. The termdefect structure will be used to denote a chain-terminating group, a chainbranch or a stereochemical imperfection in an otherwise regularlyrepeating polymer chain, i.e. a region in which either the internalbonding of a structural unit or its orientation with respect to theadjacent unit on one or both sides causes the chain to depart fromregularity. This definition excludes the alternative types of chemicalstructural units that are frequently formed during condensationreactions. Polymers containing the latter structures may be regarded ascopolymers. All real polymer chains contain defect structures, eventhose in the most perfect of polymer single crystals (see section 1.2.4).
Irregularities of addition, leading to defect structures, can occurduring addition polymerization for several reasons. In polymers of thevinyl or vinylidene class, sequence isomerism may occur. The twocarbon atoms of —CH2—CHX— or —CH2—CXY— bear differentsubstituents. The units usually add head-to-tail, to give the regularstructure -(-CH2—CHX-^ or -f-CH2—CXY^, but they may addhead-to-head or tail-to-tail, to give units of type-fCH2—CHX—CHX—CH2-f or -^CHX—CH2—CH2—CHX-^-,respectively, for a vinyl polymer. Most substituents are sufficientlybulky to cause some degree of steric hindrance in the head-to-headarrangement and this structure is usually of sufficiently higher energythat it is formed in very low concentration. The van der Waals radius ofthe fluorine atom is comparatively small and an appreciable degree ofhead-to-head addition occurs during the polymerization of vinylfluoride and vinylidene fluoride, with a corresponding amount of tail-to-tail addition, necessarily.
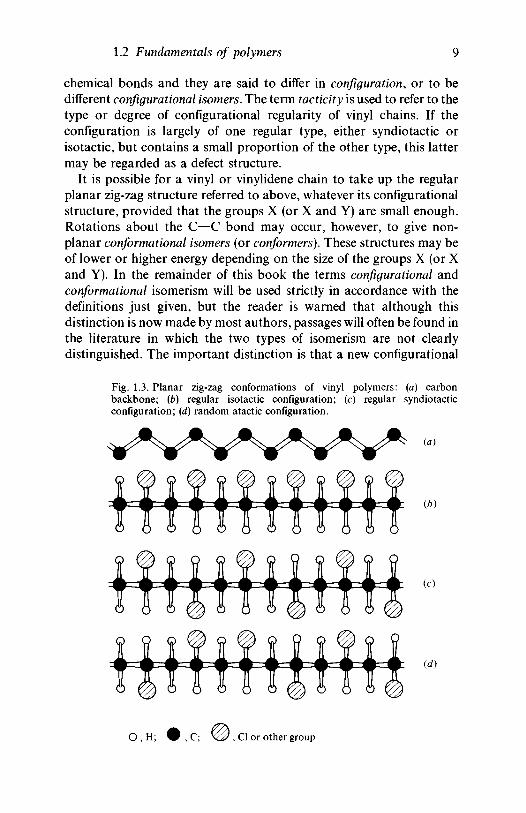
The most important type of structural irregularity in polymers of thevinyl or vinylidene type occurs because the four bonds to each carbonatom are arranged approximately tetrahedrally in space, and this meansthat for vinyl polymers of the type ~(-CH2—CHX-^ two regular types ofspatial disposition of the substituent X with respect to the polymerbackbone of carbon atoms are possible. The simplest types of structurethat may be envisaged are those in which the carbon atoms form aplanar zig-zag structure. If we look edge-on to the plane of this zig-zag,three distinct types of placing of the X atoms are possible (fig. 1.3). In theisotactic chain all the X atoms or groups are on the same side of the planeof the zig-zag, whereas in the syndiotactic chain they are alternately onopposite sides. These two structures are said to be stereoregular. In theatactic chain the X atoms or groups are randomly placed on the twosides of the plane. None of these three types of arrangement can beconverted into any of the others without breaking and reforming
1.2 Fundamentals of polymers 9
chemical bonds and they are said to differ in configuration, or to bedifferent configurational isomers. The term tacticity is used to refer to thetype or degree of configurational regularity of vinyl chains. If theconfiguration is largely of one regular type, either syndiotactic orisotactic, but contains a small proportion of the other type, this lattermay be regarded as a defect structure.
It is possible for a vinyl or vinylidene chain to take up the regularplanar zig-zag structure referred to above, whatever its configurationalstructure, provided that the groups X (or X and Y) are small enough.Rotations about the C—C bond may occur, however, to give non-planar conformational isomers (or conformers). These structures may beof lower or higher energy depending on the size of the groups X (or Xand Y). In the remainder of this book the terms configurational andconformational isomerism will be used strictly in accordance with thedefinitions just given, but the reader is warned that although thisdistinction is now made by most authors, passages will often be found inthe literature in which the two types of isomerism are not clearlydistinguished. The important distinction is that a new configurational
Fig. 1.3. Planar zig-zag conformations of vinyl polymers: (a) carbonbackbone; (b) regular isotactic configuration; (c) regular syndiotacticconfiguration; (d) random atactic configuration.
(a)
(b)
(c)
id)
O,H; ' , Cl or other group
10 Introduction
isomer can only be formed by breaking and reforming one or morebonds, whereas a change of conformational isomer can be achievedsimply by the rotation of parts of the molecule around single bonds.
In many vinyl polymers the X atom or group is rather large and theplanar conformation is a high energy one for the isotactic configuration,because of the small mutual separation of those atoms or groups in thatstructure, and a different conformational isomer may result. Isotacticsequences in PVC are a good example of this. The equilibriumproportions of such conformers present at a particular temperature aredetermined by the differences between their Gibbs free energies. Inisotactic vinyl polymers with bulky side groups a helical structure oftenoccurs. This may be imagined to be formed from the planar zig-zag byrotating the part of the molecule on one side of a backbone C—C bondthrough 120° around the bond with respect to the rest of the moleculeand repeating the operation for alternate C—C bonds, the rotationbeing always in the same direction.
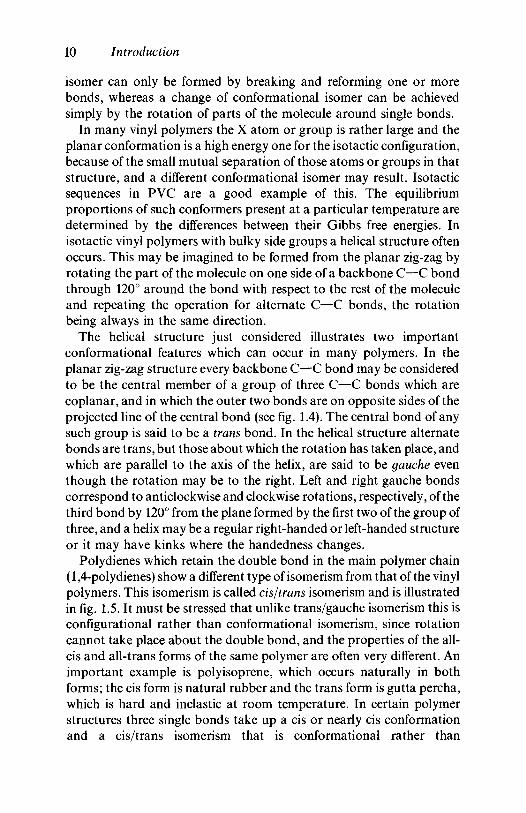
The helical structure just considered illustrates two importantconformational features which can occur in many polymers. In theplanar zig-zag structure every backbone C—C bond may be consideredto be the central member of a group of three C—C bonds which arecoplanar, and in which the outer two bonds are on opposite sides of theprojected line of the central bond (see fig. 1.4). The central bond of anysuch group is said to be a trans bond. In the helical structure alternatebonds are trans, but those about which the rotation has taken place, andwhich are parallel to the axis of the helix, are said to be gauche eventhough the rotation may be to the right. Left and right gauche bondscorrespond to anticlockwise and clockwise rotations, respectively, of thethird bond by 120° from the plane formed by the first two of the group ofthree, and a helix may be a regular right-handed or left-handed structureor it may have kinks where the handedness changes.
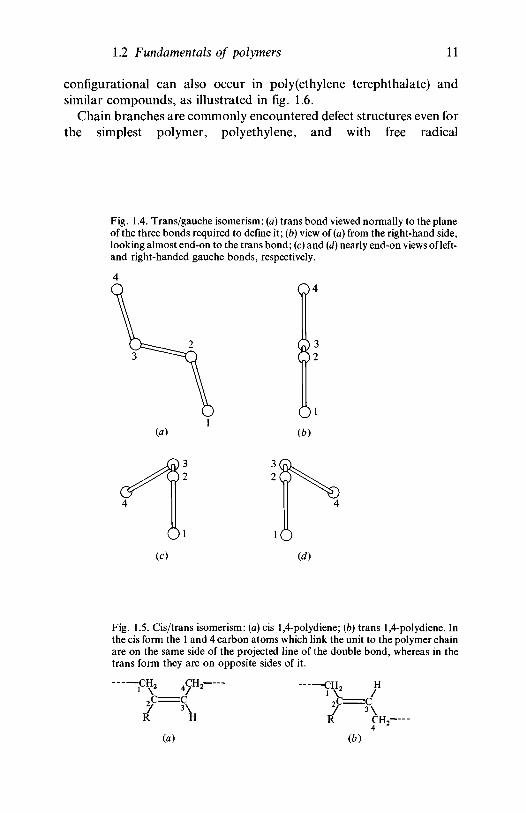
Polydienes which retain the double bond in the main polymer chain(1,4-polydienes) show a different type of isomerism from that of the vinylpolymers. This isomerism is called cis/trans isomerism and is illustratedin fig. 1.5. It must be stressed that unlike trans/gauche isomerism this isconfigurational rather than conformational isomerism, since rotationcannot take place about the double bond, and the properties of the all-cis and all-trans forms of the same polymer are often very different. Animportant example is polyisoprene, which occurs naturally in bothforms; the cis form is natural rubber and the trans form is gutta percha,which is hard and inelastic at room temperature. In certain polymerstructures three single bonds take up a cis or nearly cis conformationand a cis/trans isomerism that is conformational rather than
1.2 Fundamentals of polymers 11
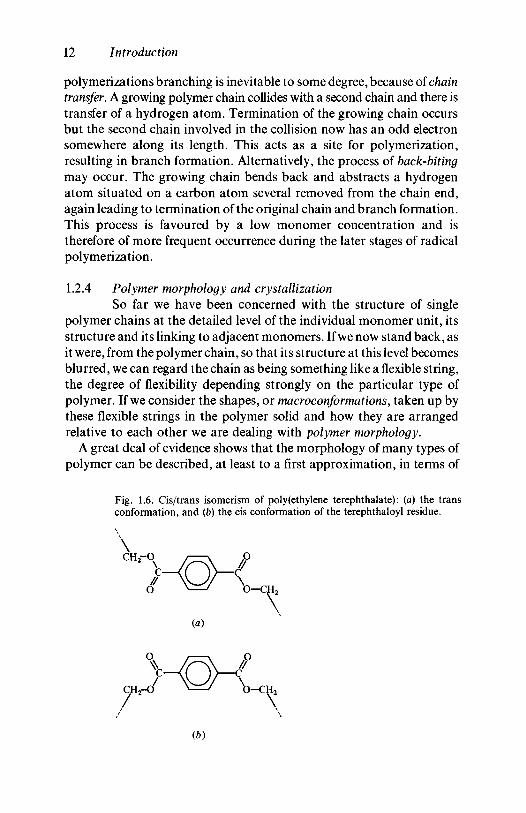
configurational can also occur in poly(ethylene terephthalate) andsimilar compounds, as illustrated in fig. 1.6.
Chain branches are commonly encountered defect structures even forthe simplest polymer, polyethylene, and with free radical
Fig. 1.4. Trans/gauche isomerism: {a) trans bond viewed normally to the planeof the three bonds required to define it; (b) view of (a) from the right-hand side,looking almost end-on to the trans bond; (c) and (d) nearly end-on views of left-and right-handed gauche bonds, respectively.
332
(b)
(c) (d)
Fig. 1.5. Cis/trans isomerism: (a) cis 1,4-polydiene; (b) trans 1,4-polydiene. Inthe cis form the 1 and 4 carbon atoms which link the unit to the polymer chainare on the same side of the projected line of the double bond, whereas in thetrans form they are on opposite sides of it.
CH2 H
7 3 \R CH2
(a) (b)
12 Introduction
polymerizations branching is inevitable to some degree, because of chaintransfer. A growing polymer chain collides with a second chain and there istransfer of a hydrogen atom. Termination of the growing chain occursbut the second chain involved in the collision now has an odd electronsomewhere along its length. This acts as a site for polymerization,resulting in branch formation. Alternatively, the process of back-bitingmay occur. The growing chain bends back and abstracts a hydrogenatom situated on a carbon atom several removed from the chain end,again leading to termination of the original chain and branch formation.This process is favoured by a low monomer concentration and istherefore of more frequent occurrence during the later stages of radicalpolymerization.
1.2.4 Polymer morphology and crystallizationSo far we have been concerned with the structure of single
polymer chains at the detailed level of the individual monomer unit, itsstructure and its linking to adjacent monomers. If we now stand back, asit were, from the polymer chain, so that its structure at this level becomesblurred, we can regard the chain as being something like a flexible string,the degree of flexibility depending strongly on the particular type ofpolymer. If we consider the shapes, or macroconformations, taken up bythese flexible strings in the polymer solid and how they are arrangedrelative to each other we are dealing with polymer morphology.
A great deal of evidence shows that the morphology of many types ofpolymer can be described, at least to a first approximation, in terms of
Fig. 1.6. Cis/trans isomerism of poly(ethylene terephthalate): (a) the transconformation, and (b) the cis conformation of the terephthaloyl residue.
O-CH 2
(a)
(b)
1.2 Fundamentals of polymers 13
two simple types of structure or modifications of them. These structuresare randomly coiled chains, which occur in the non-crystalline regions ofpolymers, and lamellar chain-folded crystallites or lamellae. In randomlycoiled chains the various possible microconformational states of thetypes considered in the last section occur at random with overallconcentrations determined by the Gibbs free energy differences betweenthem. The non-crystalline regions of a polymer are often called theamorphous regions, but in oriented polymers and in some non-crystalline regions of partially crystalline polymers the chains do nothave truly random coil form and the term should therefore be avoided orused with caution.
Polymer glasses, such as poly(methyl methacrylate) (PMMA,Perspex, Plexiglass), consist entirely of non-crystalline material which,in samples that have not been oriented, is present in the form ofinterpenetrating randomly coiled chains, and this is the reason for theirhigh degree of transparency. PMMA is non-crystalline because it is anatactic vinylidene polymer with large side groups which cause it to beconformationally highly irregular and so unable to crystallize.Polyethylene chains, on the other hand, are usually highly regular andcan therefore take up the low-energy planar zig-zag form and crystallizeunder suitable conditions. In material cooled slowly from the moltenstate the crystallites usually aggregate into complicated structures calledspherulites. The diameters of the spherulites are often comparable tothat of the wavelength of light, which they therefore scatter strongly, sothat the polymer has a milky appearance. Between the spherulites thereis non-crystalline material.
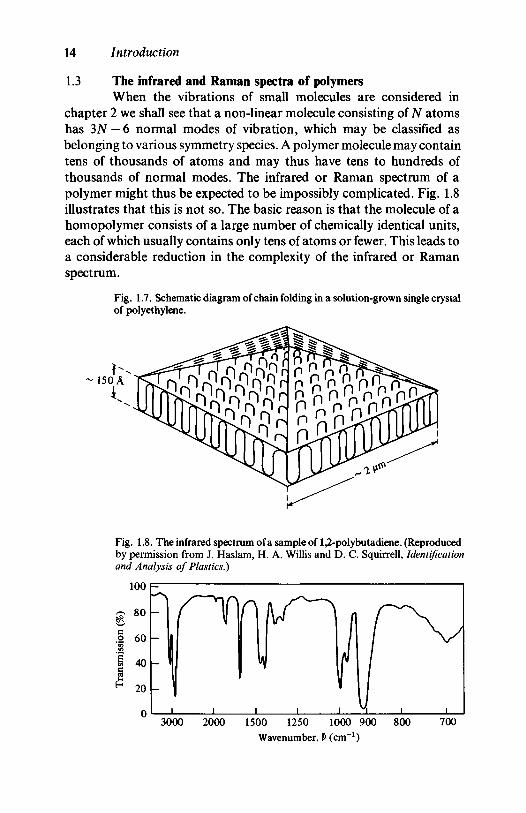
If polyethylene is allowed to crystallize from dilute solution small,almost flat, pyramid-shaped single crystals form which may be a fewmicrometres across and about 100-150 A thick. Electron diffractionshows that the chain axes in these lamellar crystals are normal to themean plane of the crystal and the only possible conclusion is that thechains fold back and forth within it, as shown schematically in fig. 1.7. Agreat deal of evidence shows that the crystallites in material producedfrom the melt are also lamellar in nature and of a similar general type tothose grown from solution, though less perfect, and that other polymersalso form chain-folded lamellar crystals from both solution and melt.Much effort has been devoted to elucidating the precise nature of thefolds and to determining whether the chain segments on either side of aparticular fold lie adjacent to each other within the crystallite; theevidence that vibrational spectroscopy can bring to bear on thesequestions and other aspects of polymer crystals and crystallinity isdiscussed in chapter 6.
14 Introduction
1.3 The infrared and Raman spectra of polymersWhen the vibrations of small molecules are considered in
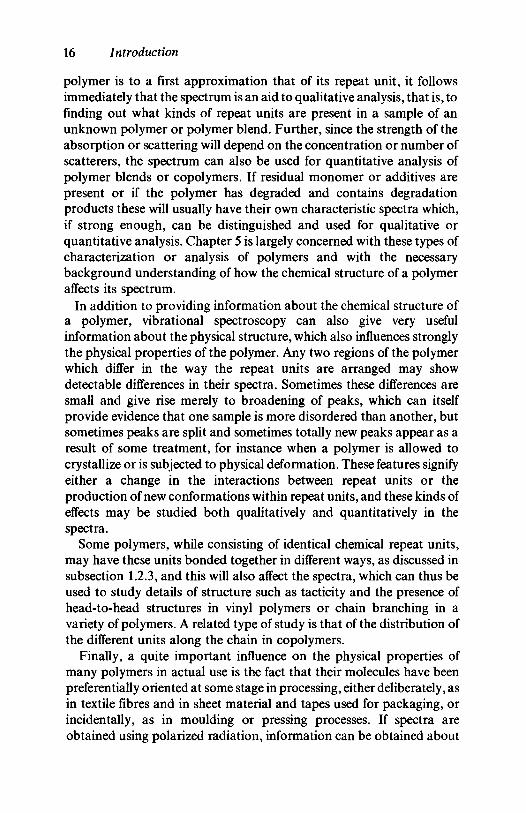
chapter 2 we shall see that a non-linear molecule consisting of N atomshas 3N — 6 normal modes of vibration, which may be classified asbelonging to various symmetry species. A polymer molecule may containtens of thousands of atoms and may thus have tens to hundreds ofthousands of normal modes. The infrared or Raman spectrum of apolymer might thus be expected to be impossibly complicated. Fig. 1.8illustrates that this is not so. The basic reason is that the molecule of ahomopolymer consists of a large number of chemically identical units,each of which usually contains only tens of atoms or fewer. This leads toa considerable reduction in the complexity of the infrared or Ramanspectrum.
Fig. 1.7. Schematic diagram of chain folding in a solution-grown single crystalof polyethylene.
Fig. 1.8. The infrared spectrum of a sample of 1,2-polybutadiene. (Reproducedby permission from J. Haslam, H. A. Willis and D. C. Squirrell, Identificationand Analysis of Plastics.)
3000 2000 1500 1250 1000 900
Wavenumber, v (cm"1)
800 700
1.3 Infrared and Raman spectra of polymers 15
One can understood this simply by realizing that the repeat unit of apolymer has typical dimensions of order 10 ~9 m, whereas thewavelength of the light involved in Raman scattering is of order5x 10" 7m and the wavelength of the infrared radiation that isabsorbed by the vibrating molecules is usually greater than 2 x 10~6 m.There are thus many repeat units within one wavelength and theinteraction of the polymer molecule with the radiation will thereforedepend on the sum of the interactions over many repeat units. If thepolymer chain is a perfectly regular one in a crystalline region of apolymer, only a small fraction of the possible number of normal modesof vibration are such that all the repeat units in the chain vibrate inphase. The other modes are essentially standing-wave modes in whichthe vibrations of all repeat units in the chain are similar but the phasesalternate along the chain. In these modes the interactions of theindividual repeat units with the radiation cancel out over the length ofthe chain and the modes are thus inactive in both Raman and infraredspectroscopy. The infrared- and Raman-active modes belong to thegroup of modes in which all repeat units vibrate in phase. A furtherreduction in the complexity of the spectra often occurs because, as willbe discussed in chapter 4, it is possible for even some of these modes to beinactive in either the Raman or infrared spectrum, or both.
For an irregular chain in a non-crystalline region of a polymer allnormal modes are potentially both Raman and infrared active becausethere is no molecular symmetry. The chemical repeat units are, however,no longer also physical repeat units, because of the geometricalirregularity, and the coupling forces between repeat units are also nolonger all the same. It is therefore often a useful approximation to regardeach chemical repeat unit as a separate molecule in its own localenvironment. This is particularly so when the vibration concernedinvolves mainly the motion of side-group atoms and little motion of theatoms of the chain backbone. We then expect to see broad infraredabsorption or Raman scattering peaks due to group vibrations, thebroadening arising because the groups of atoms of the same kind indifferent repeat units have slightly different frequencies of vibration as aconsequence of the different physical environments of the units to whichthey belong. The widths of the broad peaks are, however, usually smallcompared with the separations between peaks that are due to quitedifferent types of vibration of the repeat unit.
We see, therefore, that the Raman or infrared spectrum of a polymerwill usually contain a number of peaks which is of order 3n or less, wheren is the number of atoms in the repeat unit, rather than 3AT, where N isthe number of atoms in the whole molecule. Since the spectrum of a
16 Introduction
polymer is to a first approximation that of its repeat unit, it followsimmediately that the spectrum is an aid to qualitative analysis, that is, tofinding out what kinds of repeat units are present in a sample of anunknown polymer or polymer blend. Further, since the strength of theabsorption or scattering will depend on the concentration or number ofscatterers, the spectrum can also be used for quantitative analysis ofpolymer blends or copolymers. If residual monomer or additives arepresent or if the polymer has degraded and contains degradationproducts these will usually have their own characteristic spectra which,if strong enough, can be distinguished and used for qualitative orquantitative analysis. Chapter 5 is largely concerned with these types ofcharacterization or analysis of polymers and with the necessarybackground understanding of how the chemical structure of a polymeraffects its spectrum.
In addition to providing information about the chemical structure ofa polymer, vibrational spectroscopy can also give very usefulinformation about the physical structure, which also influences stronglythe physical properties of the polymer. Any two regions of the polymerwhich differ in the way the repeat units are arranged may showdetectable differences in their spectra. Sometimes these differences aresmall and give rise merely to broadening of peaks, which can itselfprovide evidence that one sample is more disordered than another, butsometimes peaks are split and sometimes totally new peaks appear as aresult of some treatment, for instance when a polymer is allowed tocrystallize or is subjected to physical deformation. These features signifyeither a change in the interactions between repeat units or theproduction of new conformations within repeat units, and these kinds ofeffects may be studied both qualitatively and quantitatively in thespectra.
Some polymers, while consisting of identical chemical repeat units,may have these units bonded together in different ways, as discussed insubsection 1.2.3, and this will also affect the spectra, which can thus beused to study details of structure such as tacticity and the presence ofhead-to-head structures in vinyl polymers or chain branching in avariety of polymers. A related type of study is that of the distribution ofthe different units along the chain in copolymers.
Finally, a quite important influence on the physical properties ofmany polymers in actual use is the fact that their molecules have beenpreferentially oriented at some stage in processing, either deliberately, asin textile fibres and in sheet material and tapes used for packaging, orincidentally, as in moulding or pressing processes. If spectra areobtained using polarized radiation, information can be obtained about
1.4 Electromagnetic spectrum-symbols and units 17
the degree of molecular orientation, which leads to a betterunderstanding of the properties of the materials.
The way in which vibrational spectroscopy can give usefulinformation about all these physical details of polymer microstructure isthe subject of chapter 6.
1.4 The electromagnetic spectrum - symbols and unitsIt has already been indicated that the regions of the electro-
magnetic spectrum with which we are involved when studying thevibrational spectra of polymers are the visible and infrared regions. Wenow wish to be rather more specific and to introduce some of the unitsusually used in discussing spectra. Any simple harmonic wave may bereferred to by its wavelength, its frequency or its wavenumber; thesymbols used for these quantities in this book are the standard ones,namely, X, v and v, respectively.
The frequencies of the normal vibrational modes of small moleculesgenerally lie in the region 6 x 10¹²-1.2x 10¹⁴Hz or 6-120 THz;overtone and combination vibrations can extend the range up to about250 THz. There are some very low frequency torsional vibrations ofsmall molecules or polymers and in crystals there are various lowfrequency modes which are either essentially lattice modes, in whichwhole chains move with respect to each other, or acoustic modes, inwhich crystals vibrate on a macroscopic scale. These extend the lowfrequency end of the range down to about 0.3 THz. As alreadyexplained, the actual frequencies of infrared absorption coincide withthe frequencies of the vibrational modes, so that the range of frequenciesinvolved in infrared spectroscopy is roughly 0.3-250 THz, although fewsingle instruments will cover the whole range.
Historically, spectroscopists have tended to specify the wavelengthrather than the frequency of the radiation, because this is the quantitymost easily determined directly in the visible and infrared regions, byusing diffraction gratings of known ruling spacing. Since the velocity oflight is 3 x 10 8ms~ 1 , the wavelength range involved in infraredspectroscopy is about 1-1000 jam. The region above about 50 fiva issometimes called the far infrared and the region below the near infrared.
Older infrared instruments are often calibrated to read directly inwavelength. More recently it has become almost universal to work inreciprocal wavelength units, or wavenumber units, which specify thenumber of waves per metre or, more usually, per cm. This is because intheoretical treatments frequencies are calculated, or in quantum-mechanical calculations energy levels, and the frequencies or differencesbetween energy levels are proportional to the wavenumbers of the
18 Introduction
corresponding radiation. In terms of wavenumbers the range of theinfrared spectrum, including overtones, is roughly 10-8000 cm"1 or103—8 x 10⁵ m ~ l . Most infrared spectroscopists and almost all polymerspectroscopists work in cm"1 . Absorption peaks in polymers usuallyhave a width between about 5 and 30 cm"1 and for many purposes it isthus sufficient to specify the position of an absorption peak to thenearest whole cm " 1 and to work with a spectral resolution of this order.
In the Raman spectrum the difference in frequency between theincident light and the Raman-scattered light is equal to the frequency ofthe vibration. It is therefore customary to specify only this difference infrequency, or more usually the corresponding wavenumber differencewhich is proportional to it, and these differences span exactly the sameranges as the infrared frequencies or wavenumbers. The wavelength orfrequency of the incident light used is not critical unless one is interestedin either observing or specifically avoiding the resonance Raman effect,which is dealt with briefly in chapter 5. It is very convenient to use avisible laser beam, and since the efficiency of the very weak Ramanscattering process is inversely proportional to the fourth power of thewavelength it is usual to use light in the green or blue regions of thespectrum except for compounds which absorb strongly in these regions,for which light in the yellow or red regions of the spectrum may be used.If light of wavelength 500 nm is used the Stokes Raman spectrum of thevibrational fundamentals extends up to about 600 nm.
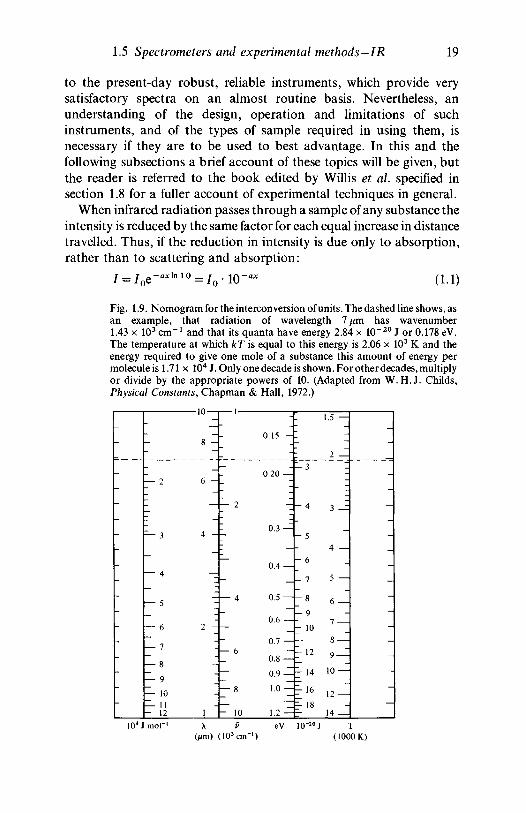
In the quantum-mechanical theory of the vibrations of molecules theclassical frequency of vibration, v, is replaced by an energy differenceAE = hv between vibrational energy levels and these energy differencesare sometimes quoted in electron volts (eV) by dividing hv by e, theelectronic charge. It is also often convenient to consider at whattemperature the thermal energy kT would be equal to the energydifference between two levels, or how many kilojoules per mole wouldgive each molecule (or repeat unit in a polymer) the correspondingenergy. Fig. 1.9 shows the relationships between these and other unitsreferred to in this section.
1.5 Spectrometers and experimental methods in infraredspectroscopy
1.5.1 IntroductionThe spectacular increase in the use of infrared spectroscopy,
both as a structural diagnostic tool and for analytical purposes, duringthe past 40 years owes much to instrumental developments. There hasbeen an evolution from delicate, temperamental spectrometers, whichgave satisfactory results only in the hands of skilled and patient operators,
1.5 Spectrometers and experimental methods-IR 19
to the present-day robust, reliable instruments, which provide verysatisfactory spectra on an almost routine basis. Nevertheless, anunderstanding of the design, operation and limitations of suchinstruments, and of the types of sample required in using them, isnecessary if they are to be used to best advantage. In this and thefollowing subsections a brief account of these topics will be given, butthe reader is referred to the book edited by Willis et ah specified insection 1.8 for a fuller account of experimental techniques in general.
When infrared radiation passes through a sample of any substance theintensity is reduced by the same factor for each equal increase in distancetravelled. Thus, if the reduction in intensity is due only to absorption,rather than to scattering and absorption:
= /ne -axIn 10 (1.1)
Fig. 1.9. Nomogram for the intercon version of units. The dashed line shows, asan example, that radiation of wavelength 7/«n has wavenumber1.43 x 103 cm"1 and that its quanta have energy 2.84 x 10~20 J or 0.178 eV.The temperature at which kT is equal to this energy is 2.06 x 10³ K and theenergy required to give one mole of a substance this amount of energy permolecule is 1.71 x 10⁴ J. Only one decade is shown. For other decades, multiplyor divide by the appropriate powers of 10. (Adapted from W.H.J . Childs,Physical Constants, Chapman & Hall, 1972.)
_
-
-
_
_
-
-
_
_
-
-
-
_
— 2
L— 3
— 4
— 5
— 6—— 7
— 8— 9
— 10— 11- 12
—-10—j
8 -
6 -
4 -
-
2
_
-
-
_
1
1
-
_
_
— 2
:
_
— 4
:
-— 6
—
— 8
- 10
-
0.15 -
0.20 —
0.3 —
—
0.4 —
0.5 —
0.6 —
0.7 —
0.8 —
0.9 —
1.0 —
1.2 —
[- 3
- 4
- 5-
- 6
- 7
-8
- 9
- 10—
- 12
r 14
z- 16
b 18
1.5 —
-
2 —
3 —
-
4 —
5 —
6 —
7 —
8 —
9 —
1 0 ^
12 —
14
_
-
-
I_--__---
104JGum)
eV 10"20J T(1000 K)
20 Introduction
where x is the distance travelled from a reference surface within thesubstance, / 0 is the intensity at the reference surface and a is called theabsorption coefficient. The quantity I/Io is the transmittance, T, of thethickness x and a quantity A given by
A = \og10(I0/I) (1.2)
is called the absorbance of the thickness x of the substance. The infraredabsorption spectrum of a substance is ideally a plot of the transmittanceor the absorbance of a suitable thickness against the wavelength orwavenumber of the infrared radiation. In practice the losses of intensityby reflection at the surfaces of a sample can often be neglected and then,from equations (1.1) and (1.2),
A = ax = \og10(I0/I) (1.3)
with x equal to the thickness of the sample, 70 equal to the intensity ofthe radiation incident on the sample surface and / equal to the intensityof the radiation emerging from the other side of the sample. For most ofthis book reflection losses will not be specifically considered but itshould be noted that they must be taken into account for certain kinds ofquantitative investigation.
If the sample is very thick the transmittance will approach zero andthe absorbance will tend to infinity for all wavelengths, and even forthinner samples there may be wavelength regions where A>3, thepractical limit for most spectrometers. In order to avoid too high anabsorbance for a solid polymer it is usually necessary to work withsamples of thickness between about 30 and 300 fim. Methods ofproducing such thin film samples, and other forms of sample whichprovide similar absorbances, will be discussed in subsection 1.5.5. Forsome polymers it is very difficult to produce samples with suitably lowabsorbance and for some investigations, such as those on surfacecoatings, it is not even possible to obtain the appropriate material freefrom a substrate. For such samples the method of attenuated totalreflection (ATR) spectroscopy, described in subsection 1.5.6, may beuseful because in this method the radiation passes only through a limitedthickness, usually only a few /im, of the sample.
Until recently the conventional way to obtain an infrared spectrum ofa substance, whether by transmission or ATR, has been to use aspectrometer consisting of (i) a source of radiation with a continuousspectrum over a wide range of infrared wavelengths, (ii) a means ofdispersing the radiation into its constituent wavelengths, (iii) anarrangement for allowing the radiation to pass through the sample or bereflected from its surface, (iv) a means of measuring intensities using a
1.5 Spectrometers and experimental methods-IR 21
detector which responds over the whole range of wavelengths of interestand (v) a method of displaying, and possibly performing calculations on,the spectrum. A more recent type of instrument replaces (i) and (ii) by atunable diode laser which produces radiation of an extremely smallrange of frequencies, the centre of which may be varied in a systematicway to scan the spectrum. The principal use of such instruments is inhigh resolution infrared spectroscopy and they will not be furtherdiscussed here.
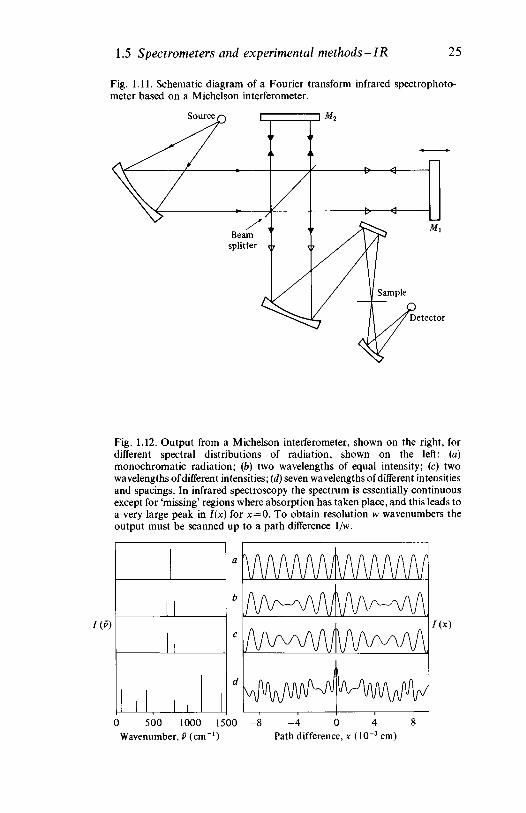
There are two distinct types of infrared spectrometer in common usefor studying polymers: dispersive instruments and Fourier transforminstruments. In the dispersive instruments the radiation is physicallysplit up into its constituent wavelengths by a monochromator eitherbefore, or more usually after, it passes through the sample and thedifferent wavelengths are processed in sequence. In the Fouriertransform instrument radiation of all wavelengths passes through thesample to the detector simultaneously. The detector measures the totaltransmitted intensity as a function of the displacement of one of themirrors in a double beam interferometer, usually of the Michelson type,and the separation of the different wavelengths is subsequently donemathematically using a dedicated computer. The principles of operationof each type of instrument are briefly explained in the next twosubsections and the sources and detectors used for both types aredescribed in subsection 1.5.4.
All modern spectrometers are capable of producing their output as anabsorbance or transmittance spectrum plotted on a chart recorder, butmany spectrometers are now equipped with computers which permitother forms of display and various kinds of mathematical processing ofthe data. Section 1.7 describes briefly some of the techniques employedin processing polymer spectra using either dedicated or non-dedicatedcomputers.
1.5.2 The dispersive infrared spectrometerA block diagram of a dispersive instrument is given in fig. 1.10a.
The radiation from the source is split into two equal beams which travelalong different optical paths: the sample and reference beams. The twobeams are subsequently directed alternately to the detector via themonochromator, which scans slowly through the spectral region ofinterest by rotating the dispersive element. The beam splitting orrecombination is usually achieved by a rotating mirror/chopper. Sinceeach beam falls on the detector for half the time, two AC signals 180° outof phase with each other are generated in the detector. If there isabsorption by the sample at a particular wavelength the intensity of the
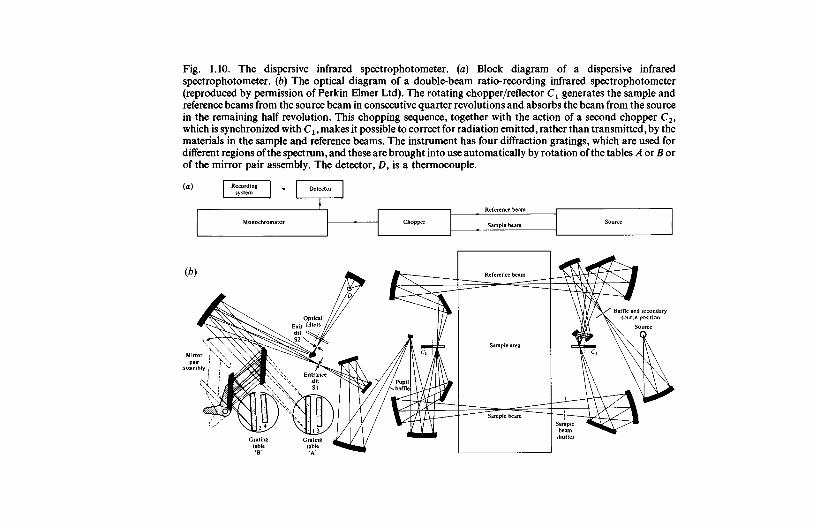
Fig. 1.10. The dispersive infrared spectrophotometer. (a) Block diagram of a dispersive infraredspectrophotometer. (b) The optical diagram of a double-beam ratio-recording infrared spectrophotometer(reproduced by permission of Perkin Elmer Ltd). The rotating chopper/reflector Cl generates the sample andreference beams from the source beam in consecutive quarter revolutions and absorbs the beam from the sourcein the remaining half revolution. This chopping sequence, together with the action of a second chopper C2,which is synchronized with Cx, makes it possible to correct for radiation emitted, rather than transmitted, by thematerials in the sample and reference beams. The instrument has four diffraction gratings, which are used fordifferent regions of the spectrum, and these are brought into use automatically by rotation of the tables A or B orof the mirror pair assembly. The detector, D, is a thermocouple.
(a) Recording „ D e t e c t o r1 system | | |
Monochromator Chopper Sample beam Source
1.5 Spectrometers and experimental methods-IR 23
radiation in the sample beam will be lower than that in the referencebeam and the corresponding electrical signal from the detector will beproportionately smaller. The transmittance and absorbance of thesample may be deduced from the magnitudes of the two signals, asexplained below. This double-beam optical system has two majoradvantages. It largely eliminates the effects of absorption byatmospheric water vapour and carbon dioxide, which occurs in bothbeams and can give strong absorptions capable of causing seriousinterference at several wavelengths in single-beam instruments. Also,because of the rapid alternation between the two beams it is possible toeliminate the effects of thermal drift, which gives only a DC signal.
Two methods are in common use for deriving the transmittance, andhence the absorbance, from the electrical signals. The first is theprinciple of optical null balance. The total AC electrical signal from thedetector, caused by the difference in energy between the two beams, isused to drive a mechanical 'comb' in or out of the reference beam untilthe two out of phase signals from the detector are equal in magnitudeand the total AC signal is therefore zero. The shape of comb is chosen sothat its transmittance is related linearly to its displacement and thus theposition of the comb at this balance point is a direct measure of theabsorption of the sample. Although widely used, this null-balancesystem has well-known disadvantages. When the sample absorption ishigh the signal from the detector tends to zero and the servo systemdriving the balancing comb becomes sluggish and unreliable. Even whenthe energy is not low the response time constant of the system isrelatively long and distortion occurs if sharp absorption peaks arescanned rapidly. Finally, it is not easy to design and manufacture acomb that gives a linear response over the whole operating range,particularly for low transmissions. These problems do not occur withthe method of ratio recording, in which a direct ratio of the electricalsignals from the reference and sample beams is obtained using electroniccircuitry. This requires high stability low noise circuits and the methodwas until recently found only in high performance instruments.Following the advent of solid state electronics it is now becoming thenorm for spectrometers in the medium price range. The advantages forquantitative work are such that there has been a renaissance in this areaof the application of infrared spectroscopy to polymers.
In early instruments the dispersive element of the monochromatorwas often a sodium chloride or potassium bromide prism. Suchmonochromators have the drawback that the dispersion falls off badlywith decreasing wavelength and is nowadays considered to beinadequate in the region where C—H, O—H and N—H stretching
24 Introduction
modes occur. In recent years the ready availability of competitivelypriced replica diffraction gratings has led to their almost universal use,providing monochromators for which the dispersion is much lesswavelength dependent. The resolution which can be achieved dependson the scanning speed and on the slit width required to provide sufficientenergy to give a satisfactory signal-to-noise ratio at any wavelength (seesubsection 1.5.4) and usually lies in the range 1-2 cm"1 , which isappreciably smaller than the widths of most infrared peaks for the liquidand solid phases. The optical diagram of a modern instrument is shownin fig. 1.10b.
1.5.3 The Fourier transform spectrometerThe Fourier transform infrared (FTIR) spectrometer, which is
usually based on the Michelson interferometer, as shown schematicallyin fig. 1.11, provides a completely different approach to the recording ofinfrared spectra. Its advantages and disadvantages may be appreciatedfrom a brief consideration of the principles involved.
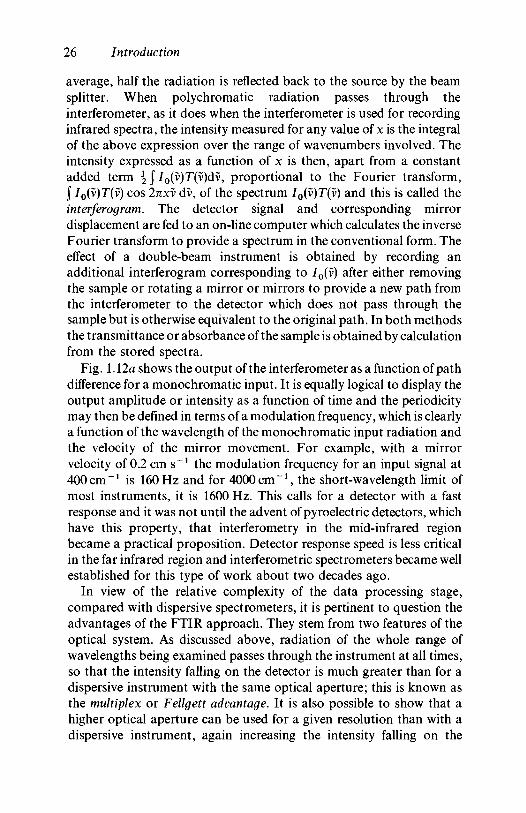
Referring to fig. 1.11, consider first the effect of movement of themirror Ml if monochromatic radiation of wavelength X passes throughthe interferometer. When the path difference between the two beams isan odd integral multiple of X/2 destructive interference will occur forradiation transmitted in the direction of the detector and the measuredintensity of the recombined beams will be zero. When, however, the pathdifference is nk, where n is an integer, the two beams constructivelyinterfere, to give maximum measured intensity. The intensity measuredby the detector varies cosinusoidally with the displacement of themirror, as shown in fig. 1.12a. If the radiation passing through theinterferometer and reaching the detector consists of two wavelengths ofequal intensity, the intensity of the combined beam at the detector is amore complex but still symmetrical function of the displacement of themirror, as shown in fig. 1.12b. When the two wavelengths are of unequalintensity owing, for example, to the presence of material at the sampleposition which absorbs at one of them, the pattern is further modified(fig. 1.12c).
For monochromatic illumination of wavenumber v(= I/A) and pathdifference x, the measured intensity, /(v), is related to the incidentintensity, /0(v), from the source by the equation
j(x) = i/0(v)T(v)(l + cos 2nxv) (1.4)
where T(v) is the transmittance of the sample at v. The path difference xis equal to twice the mirror displacement, measured from the positionwhere the two paths are equal, and the factor \ arises because, on
1.5 Spectrometers and experimental methods-IR 25
Fig. 1.11. Schematic diagram of a Fourier transform infrared spectrophoto-meter based on a Michelson interferometer.
Source
Detector
Fig. 1.12. Output from a Michelson interferometer, shown on the right, fordifferent spectral distributions of radiation, shown on the left: (a)monochromatic radiation; (b) two wavelengths of equal intensity; (c) twowavelengths of different intensities; (d) seven wavelengths of different intensitiesand spacings. In infrared spectroscopy the spectrum is essentially continuousexcept for 'missing' regions where absorption has taken place, and this leads toa very large peak in I{x) for x = 0. To obtain resolution w wavenumbers theoutput must be scanned up to a path difference 1/w.
HP)
1
a
>
C
<
vwwwA/vwWAAAAAA/
\mN\N\[\/\r-Mj\\A/wv\A
0 500 1000Wavenumber, v (cm"
1500 - 8l)
- 4 0 4Path difference, x (10~3 cm)
26 Introduction
average, half the radiation is reflected back to the source by the beamsplitter. When polychromatic radiation passes through theinterferometer, as it does when the interferometer is used for recordinginfrared spectra, the intensity measured for any value of x is the integralof the above expression over the range of wavenumbers involved. Theintensity expressed as a function of x is then, apart from a constantadded term \ j/0(v)T(v)dv, proportional to the Fourier transform,j /0(v)T(v) cos 27ixv dv, of the spectrum /0(v)T(v) and this is called theinterferogram. The detector signal and corresponding mirrordisplacement are fed to an on-line computer which calculates the inverseFourier transform to provide a spectrum in the conventional form. Theeffect of a double-beam instrument is obtained by recording anadditional interferogram corresponding to J0(v) after either removingthe sample or rotating a mirror or mirrors to provide a new path fromthe interferometer to the detector which does not pass through thesample but is otherwise equivalent to the original path. In both methodsthe transmittance or absorbance of the sample is obtained by calculationfrom the stored spectra.
Fig. 1.12a shows the output of the interferometer as a function of pathdifference for a monochromatic input. It is equally logical to display theoutput amplitude or intensity as a function of time and the periodicitymay then be defined in terms of a modulation frequency, which is clearlya function of the wavelength of the monochromatic input radiation andthe velocity of the mirror movement. For example, with a mirrorvelocity of 0.2 c m s " 1 the modulation frequency for an input signal at400cm"1 is 160Hz and for 4000cm"1, the short-wavelength limit ofmost instruments, it is 1600 Hz. This calls for a detector with a fastresponse and it was not until the advent of pyroelectric detectors, whichhave this property, that interferometry in the mid-infrared regionbecame a practical proposition. Detector response speed is less criticalin the far infrared region and interferometric spectrometers became wellestablished for this type of work about two decades ago.
In view of the relative complexity of the data processing stage,compared with dispersive spectrometers, it is pertinent to question theadvantages of the FTIR approach. They stem from two features of theoptical system. As discussed above, radiation of the whole range ofwavelengths being examined passes through the instrument at all times,so that the intensity falling on the detector is much greater than for adispersive instrument with the same optical aperture; this is known asthe multiplex or Fellgett advantage. It is also possible to show that ahigher optical aperture can be used for a given resolution than with adispersive instrument, again increasing the intensity falling on the
1.5 Spectrometers and experimental methods-IR 27
detector; this is called the throughput or Jacquinot advantage. Thecombined effect is to give a very much higher signal-to-noise ratio for agiven time taken to record a spectrum. As a consequence, and alsobecause spectral scanning merely involves the linear displacement of amirror through a distance l/(2w), where w is the spectral resolution inwavenumbers, it is possible to record spectra of similar quality muchmore rapidly than with dispersive instruments, sometimes in seconds orless rather than minutes. The higher signal-to-noise ratio also permitsthe study of more highly absorbing samples and so provides a greaterrange of options for specimen thickness than is provided by dispersiveinstruments, particularly those of the null-balance type. This isparticularly useful in polymer spectroscopy.
Since FTIR instruments are necessarily equipped with a computerthey are usually also provided with a wide range of data processingfacilities. The value of the information they can provide, given theseadvantages, often justifies the somewhat increased cost of an FTIRspectrometer over that of a medium performance dispersive instrument,and the technique is coming into increasing use. It should be noted,however, that dispersive instruments are increasingly being equippedwith dedicated computer systems and, since ratio recording instrumentscan deal with absorbances up to about 3, it may be that the rapidscanning ability of Fourier transform instruments, which makes themuseful for dynamic studies, will turn out to be their major advantage inthe future.
1.5.4 Sources, detectors and polarizersThe source of the infrared radiation is a heated rod, usually of a
ceramic material. The temperature of operation is about 1200°C andthis represents a compromise between total radiative output, theproportion of energy at longer wavelengths and the life of the source.The output approximates to the spectrum of a black body with itsmaximum in the near infrared region. The relative energy in the interval400-600 cm"1 , close to the long-wavelength limit of some instruments,is some two orders of magnitude lower than at the emission maximum,and many instruments now scan down to 250-200 cm"1 . Thespectrometer energy throughput is held approximately constant indispersive instruments by increasing the monochromator slit width inscanning from short to long wavelengths.
The important properties of a detector are its sensitivity and its speedof response. High sensitivity is essential because the energy falling on thedetector of a dispersive instrument is in the microwatt range, and thespeed of response must be such as to cope with the chopping frequency
28 Introduction
of a dispersive instrument, typically about 15 Hz, or with the muchhigher modulation frequencies involved in Fourier transforminstruments, discussed in subsection 1.5.3. Until recently, thermaldetectors have been dominant because they can respond to allwavelengths and, of these, the thermocouple has been used mostfrequently, with the sensitive but mechanically not very robust Golaypneumatic cell falling into disfavour. There is now a move towardspyroelectric detectors, typified by doped triglycine sulphate. These aresomewhat less sensitive then thermocouples but have a considerablyfaster response and this makes them particularly suitable for use inFTIR spectrometers.
For a number of investigations on oriented samples it is necessary tostudy the absorption of polarized infrared radiation and manyinstruments incorporate a polarizer or polarizers to permit such studies.The most important type of polarizer in use at present is the wire gridpolarizer, which consists of a set of parallel, equally spaced strips ofmetal on a substrate transparent to the infrared radiation. If theseparation of the strips is less than about a quarter of a wavelength ahigh degree of polarization is produced in infrared radiation whichpasses through the grid, and the electric vector of the transmitted beamis normal to the strips. Since spectrometers of any type have differenttransmission factors for two principal polarization directions at rightangles, the polarization direction of the polarizer should be set at 45° tothese directions if it, rather than the sample, is to be rotated whenmaking polarization measurements on oriented samples. The polarizeris sometimes placed in the common beam of a double-beam instrument,but for the most accurate work it should be placed next to the sample,with a compensating absorber in the reference beam if necessary.
1.5.5 The preparation of samples for transmission spectroscopyIn most instances transmission measurements provide the
simplest and most direct approach for the recording of infrared spectra.As explained in subsection 1.5.1, the requirement here is to obtain theoptimum sample thickness or optical density. Transmission spectra oflow molecular weight organic compounds are obtained by four widelyapplicable sampling techniques. Liquids may be examined as thin films,obtained by squeezing a drop between a pair of infrared transmittingplates, or as solutions in solvents such as carbon tetrachloride,cyclohexane, carbon disulphide and chloroform, which are reasonablytransparent over the range 400-4000 cm"* and have good solvatingproperties. Solids may be examined in solution or, as powders, by
1.5 Spectrometers and experimental methods-1R 29
mulling them with liquid paraffin (Nujol) or other suitable liquids orincorporating them in potassium bromide (or other alkali halide) disks;these techniques considerably reduce the scattering. Potassium bromidedisks are made by mixing about 1 % of the sample, as a finely dividedpowder, with potassium bromide and cold sintering under pressure togive an optically clear material.
These four sampling methods, using thin films, solutions, mulls orpotassium bromide disks, are applicable to polymers but more care,experience and sometimes ingenuity are required to obtain satisfactoryresults. The two principal problems are the relative intractability ofmany polymeric materials and the wide intensity range of the variousabsorptions encountered. The majority of polymer solvents have anumber of strong infrared absorption peaks and examination insolution is therefore not usually a practical proposition. Nevertheless,the approach is useful in some circumstances, particularly forquantitative work, and should not be overlooked. Most polymers arestudied in the solid state, either as thin films or powders.
If thin films are used, thicknesses differing by an order of magnitudemay be required for different polymers or spectral regions. For asaturated hydrocarbon polymer, such as polyethylene, 300 /mi may besatisfactory whereas with materials containing oxygenated groups, e.g.poly(methyl methacrylate), a reduction to 30 /im, or less, is necessary.The latter represents the limit obtainable by hot pressing, which is aconvenient and relatively rapid method for preparing films ofthermoplastic materials. The polymer is pressed between polishedstainless steel plates, using a temperature at which plastic flow occursreadily, in a small hydraulic press which generates a ram pressure ofabout 2 kN cm"2 . For films with thicknesses greater than about 0.1 mmfeeler gauge blades may be used as spacers, but for thinner films thesample thickness is adjusted by altering the amount of material used, orthe pressing temperature, or by using a commercial thin film maker.
Thin films of strongly absorbing material are often best prepared bycasting from solution. A good solvent for the polymer is required and itmust not be so volatile that poor quality films are produced by too rapidevaporation or of such low volatility that it is difficult to remove, so thatsolvent peaks occur in the spectrum. Films may be cast on a glass plateand subsequently stripped off, or cast directly on a sodium chloride orpotassium bromide plate. Aqueous latices may be cast on silverchloride or KRS5 (thallium bromoiodide) plates. Solvent may beremoved from the film by the use of an infrared lamp and vacuum ovenor by washing with a suitable liquid with which the solvent is miscible;extraneous peaks may, however, still occur with solvents such as
30 Introduction
tetrahydrofuran which form relatively involatile oxidation products onstorage.
It may also be possible to prepare thin films by the use of a microtome.Rigid and tough polymers are best suited to this approach and somecontrol and ease of cutting may be obtained by warming or cooling thespecimen, as appropriate. Swelling with a solvent prior to sectioningmay also prove beneficial. In general, however, use of the microtome isbest reserved for the limited number of samples for which other methodshave failed.
Polymer samples are not usually available in powder form and areoften difficult to comminute. Nevertheless, it may be necessary toexamine materials which are insoluble, and which will not press, aspowders. Low temperature grinding is the best method of producingsuch powders, particularly for rubbers, and suitable equipment is nowavailable commercially. The other principal source of powder samples ismaterial recovered from solution following separational proceduressuch as gel permeation chromatography. In this case, the small amountof material available precludes hot pressing into a film. Powders areexamined as mulls or potassium bromide disks, but the formertechnique suffers from the disadvantage that if liquid paraffin is used formulling it gives peaks which interfere badly with the spectra ofhydrocarbon polymers and although quantitative work on powdersamples is not particularly easy, pressed disks have considerableadvantages over mulls for this type of work.
1.5.6 Reflection spectroscopyAlthough diffuse reflectance spectra may be recorded, as yet
they are little used and attenuated total reflection spectroscopy (ATR)dominates the reflectance approach. The recognition of the opticalprinciples involved dates back to Newton, who noted that if lightpropagating in one optical medium meets the boundary with a less densemedium at a suitable angle of incidence, it will transverse a small air gap'above the ten hundred thousandth part of an inch' before beingreflected back into the first material without penetrating the second.There have subsequently been many elegant demonstrations of theeffect, which may be described in terms of a standing wave normal to thesurface in the denser medium and an evanescent, non-propagating fieldin the rarer medium, whose electric field amplitude decays exponentiallywith distance from the surface. In practice, the effective depth ofpenetration is usually a few /im, and depends on the angle of incidenceand the difference between the refractive indices of the two media.
1.6 Spectrometers and experimental methods-Raman 31
Despite the antiquity of the principle involved, the technique has onlybeen in use for about two decades for the recording of infrared spectra.The sample under examination is the medium of lower refractive indexand a hybrid type of reflection/absorption spectrum, commonly knownas an ATR spectrum, is obtained. Although, as predicted by theory, theintensities of the peaks at shorter wavelengths are reduced relative tothose of peaks at longer wavelengths, by comparison with conventionaltransmission spectra, the ATR spectra of polymers prove very suitablefor certain characterizational purposes.
The medium of higher refractive index must, of course, be transparentto infrared radiation and three materials, silver chloride, KRS5 andgermanium are in common use. As the difference between the refractiveindices of the sample and the other medium increases the ATR spectrumapproximates more closely to the absorption spectrum, but the peakintensities decrease. A compromise is necessary and the choice maydepend upon the polymer being examined. In view of the small depth ofpenetration, the greatest practical problem is to achieve good opticalcontact between the sample and the material of higher refractive index,which is flat and polished. Hence, the sample must be reasonablysmooth and planar, and have some flexibility, so that it may be squeezedto promote good contact. Predictably, elastomers often give the bestresults. Attachments are available for both dispersive and FTIRinstruments which permit ATR rather than transmission spectra to berecorded. The absorption intensities are often low and this has led to thewidespread use of multireflection units, which are reasonably effective.ATR spectroscopy is an essentially qualitative technique but it hasproved of considerable value and its largest area of application in thepolymer field is probably for the examination of surface coatings.
1.6 Spectrometers and experimental methods inRaman spectroscopy
1.6.1 IntroductionAlthough infrared and Raman spectra both originate from the
vibrational modes of molecules, the frequencies of the modes areobserved, in essence, directly and indirectly, respectively. As implied insubsection 1.1.2, the two methods are also to some extent overlappingand to some extent complementary in the information that they provide.Although the Raman effect was discovered in 1928 and the first Ramanspectrum of a polymer (polystyrene) was obtained in 1932, Ramanspectroscopy has only become widely used since laser sources becameavailable in the early 1960s, and even now it is not as widely used asinfrared spectroscopy because of the high capital outlay required, which
32 Introduction
is almost an order of magnitude greater than that for a mediumperformance infrared spectrometer. Its simplicity and versatility withrespect to sampling are, however, leading to a steadily increased use,particularly for the examination of polymers. The measurements aremade in the visible spectrum, which permits the use of glass containersfor liquid samples. In addition, water is both transparent to the excitingradiation and weak in Raman scattering, so that aqueous solutions arereadily amenable to examination, in marked contrast to infraredspectroscopy, and this is a particular advantage for studies ofbiopolymers and some synthetic polymers.
The use of a laser as source confers a further advantage because thesmall diameter of the incident beam, which can be reduced to about10 jum, makes it ideal for the examination of small samples, such asinclusions in polymers in sheet or rod form. Conversely, large samplesmay be accommodated, in contrast to infrared transmissionspectroscopy, and this provides a potentially valuable approach to thecharacterization of orientation and strain in compression mouldedsheets and extruded pipes. For these reasons Raman spectroscopy isincreasingly gaining acceptance as a technique to be used in conjunctionwith infrared spectroscopy in the study of polymers. It is worth notinghere an important difference between infrared and Raman spectroscopywhich is relevant to quantitative studies. In infrared spectroscopy theabsorbance of a sample is directly proportional to the concentration ofthe absorbing species. In Raman scattering the total intensity scatteredin all directions from unit volume would be proportional to theconcentration, but it is usual to make only relative intensitymeasurements, using an internal standard of some kind, for instance asolvent peak for a solution or a peak due to one component of a mixture.
In principle, all that is needed for obtaining a Raman spectrum is asource of high intensity monochromatic light, which is used to irradiatethe sample, a lens system to collect scattered radiation and aspectrometer to disperse it into its component wavelengths and recordthe intensity as a function of wavelength or wavenumber. A blockdiagram of such a system is shown in fig. 1.13. The main difficulties arisebecause the efficiency of Raman scattering is very low, the scatteredenergy being typically about 10 ~8 to 10 ~6 of that of the incident energyand about 10~3 of that of the elastic Rayleigh scattering, and becausepolymer samples often produce a background scattering (see, e.g., fig.5.3), which is usually called fluorescence, over a wide range ofwavelengths. The true origin of this background is often notfluorescence in the generally accepted technical meaning and is often notunderstood.
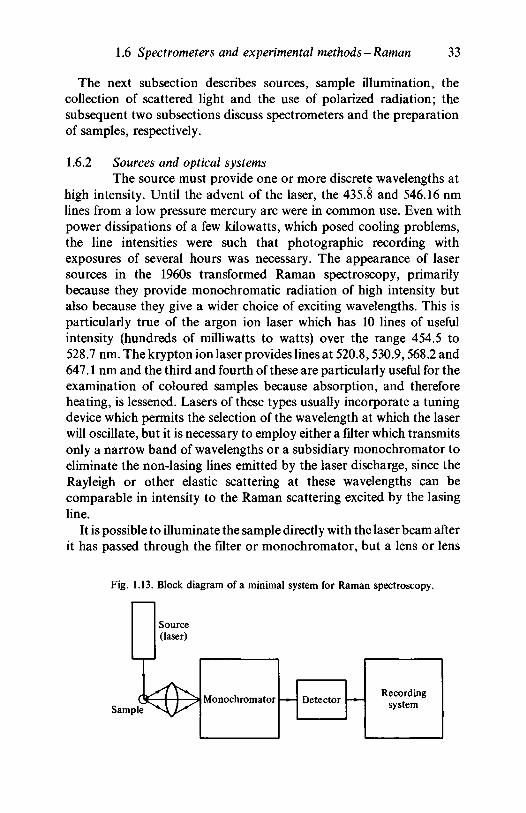
1.6 Spectrometers and experimental methods—Raman 33
The next subsection describes sources, sample illumination, thecollection of scattered light and the use of polarized radiation; thesubsequent two subsections discuss spectrometers and the preparationof samples, respectively.
1.6.2 Sources and optical systemsThe source must provide one or more discrete wavelengths at
high intensity. Until the advent of the laser, the 435.8 and 546.16 nmlines from a low pressure mercury arc were in common use. Even withpower dissipations of a few kilowatts, which posed cooling problems,the line intensities were such that photographic recording withexposures of several hours was necessary. The appearance of lasersources in the 1960s transformed Raman spectroscopy, primarilybecause they provide monochromatic radiation of high intensity butalso because they give a wider choice of exciting wavelengths. This isparticularly true of the argon ion laser which has 10 lines of usefulintensity (hundreds of milliwatts to watts) over the range 454.5 to528.7 nm. The krypton ion laser provides lines at 520.8,530.9,568.2 and647.1 nm and the third and fourth of these are particularly useful for theexamination of coloured samples because absorption, and thereforeheating, is lessened. Lasers of these types usually incorporate a tuningdevice which permits the selection of the wavelength at which the laserwill oscillate, but it is necessary to employ either a filter which transmitsonly a narrow band of wavelengths or a subsidiary monochromator toeliminate the non-lasing lines emitted by the laser discharge, since theRayleigh or other elastic scattering at these wavelengths can becomparable in intensity to the Raman scattering excited by the lasingline.
It is possible to illuminate the sample directly with the laser beam afterit has passed through the filter or monochromator, but a lens or lens
Fig. 1.13. Block diagram of a minimal system for Raman spectroscopy.
cpie
Source(laser)
Mono chrom ator — DetectorRecording
system
34 Introduction
system may be used to focus the beam into a very small sample or regionof a sample if required. The laser radiation is almost always linearlypolarized and this makes studies using polarized light easy (see chapters4 and 6). For these studies it is usual to pass the beam from the laserthrough a suitably oriented half-wave plate so that its polarizationdirection can be rotated through 90° by rotation of the half-wave platethrough 45°. It is not easy to get exact equality of intensity for the twopolarization directions and in accurate work it is necessary to allow forthis. The scattered radiation is usually collected in a direction at 90° tothat of the incident radiation, although 180° scattering is also used,particularly for studies of oriented samples or crystals. The lens systemwhich collects the light images the sample on the entrance slit of themonochromator. Because the scattering is weak, high aperture systemsare often used, up to f/1.0, and multipass systems are also sometimesused to increase the observed scattering, but systems involving eitherhigh apertures or multiple reflections are best avoided in polarizationstudies. For such studies an analyser, usually of high quality polaroidsheet, is included either in the collection optics or between them and theentrance slit of the monochromator. Since the fraction of the energyentering the monochromator which is transmitted to the exit slit, for anygiven wavelength, usually depends strongly on the polarization of thelight it is necessary to place a polarization scrambler, such as a quartzwedge, between the analyser and the monochromator. A quarter-waveplate may be used to produce an equivalent effect. Perfect scramblingis difficult to achieve and for accurate work it is necessary to allow forthe residual differential polarization sensitivity of the system.
1.6.3 Monochromators and detectorsThe problem posed by the disproportionate intensities of the
elastically and inelastically scattered radiation calls for amonochromator which offers high rejection of light at the laserwavelength, particularly when low frequency modes are beingexamined. An example is the longitudinal acoustic mode of polyethylene(chapter 6), which frequently appears in the interval 10-20 cm"1 . For anexciting wavelength of 488.0 nm the scattered radiation lies between488.2 and 488.4 nm, on the 'wing' of the much stronger elasticscattering. The high intensity observed in the wings of the exciting line,and the general background scattering observed throughout thespectrum, is due to imperfections in the diffraction gratings and mirrorswhich scatter the light within the monochromator. The only way thatsufficiently high rejection can be obtained so that low frequencies can bestudied and the noise at higher frequencies can be reduced to an
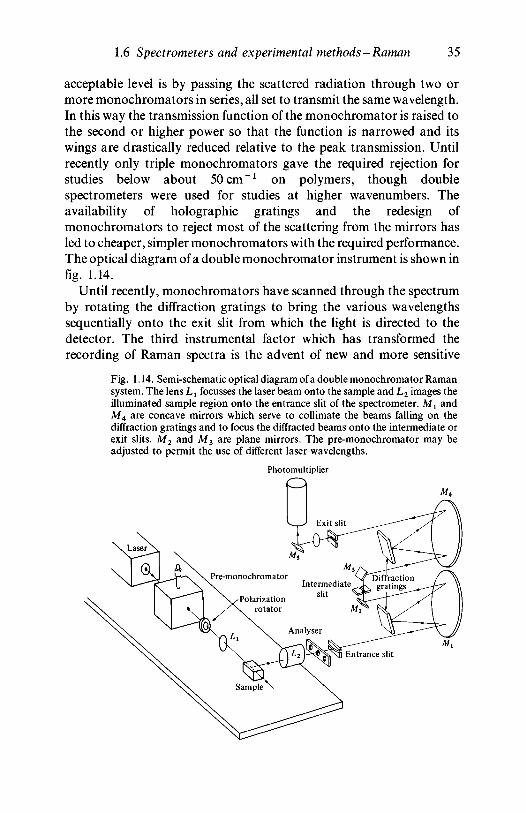
1.6 Spectrometers and experimental methods - Raman 35
acceptable level is by passing the scattered radiation through two ormore monochromators in series, all set to transmit the same wavelength.In this way the transmission function of the monochromator is raised tothe second or higher power so that the function is narrowed and itswings are drastically reduced relative to the peak transmission. Untilrecently only triple monochromators gave the required rejection forstudies below about 50 cm"1 on polymers, though doublespectrometers were used for studies at higher wavenumbers. Theavailability of holographic gratings and the redesign ofmonochromators to reject most of the scattering from the mirrors hasled to cheaper, simpler monochromators with the required performance.The optical diagram of a double monochromator instrument is shown infig. 1.14.
Until recently, monochromators have scanned through the spectrumby rotating the diffraction gratings to bring the various wavelengthssequentially onto the exit slit from which the light is directed to thedetector. The third instrumental factor which has transformed therecording of Raman spectra is the advent of new and more sensitive
Fig. 1.14. Semi-schematic optical diagram of a double monochromator Ramansystem. The lens Lx focusses the laser beam onto the sample and L2 images theilluminated sample region onto the entrance slit of the spectrometer. Mx andM 4 are concave mirrors which serve to collimate the beams falling on thediffraction gratings and to focus the diffracted beams onto the intermediate orexit slits. M 2 and M 3 are plane mirrors. The pre-monochromator may beadjusted to permit the use of different laser wavelengths.
Photomultiplier
36 Introduction
detectors, typified by the gallium arsenide photomultiplier. The overallimprovement is such that the average time to record a spectrum over therange 50-2000 cm"1 is about 20 minutes. This is still very long butrecently it has become possible to record Raman spectra in times asshort as those permitted by FTIR spectroscopy. This has been achievedby the use of multidetector arrays. Typically, 1024 diode detectors arelocated at the focal surface of the monochromator in place of the exit slitand detector of the more conventional instrument. Each of thesedetectors records the signal within an interval of 1 cm"1 simultaneouslywith the others so that the scanning involved in the conventionalinstrument is eliminated and it is possible, for instance, to obtain asatisfactory spectrum from a polyethylene pellet in a fraction of asecond. In addition to speeding up the recording of Raman spectra forgeneral work and providing the means for accumulating spectra fromweak scatterers in a shorter time than was possible before, this newapproach makes it possible to undertake dynamic measurements, suchas those on polymers being drawn at strain rates as high as 100 % perminute, to complement comparable studies by FTIR spectroscopy.Other novel forms of Raman spectrometer have also been introducedwith which microscopic images of samples can be obtained in theRaman scattered light at a particular frequency. This permits theidentification of small inclusions and makes possible other specializedstudies.
1.6.4 Sample preparation and mountingIt has already been pointed out that one of the advantages that
Raman spectroscopy has over infrared spectroscopy is that it may beused for a very wide variety of sizes and forms of sample and it is truethat a Raman spectrum of some sort can usually be obtained from anysample of polymer in powder, chip or sheet form by placing it in the laserbeam in almost any way. If, however, the best possible spectrum is to beobtained some simple precautions and perhaps preparative treatmentare necessary.
If the sample is available only in the form of a thin sheet and if 90°collection optics are to be used it is best to place the sample so that itsplane is parallel or nearly parallel to the laser beam, since in this way it ispossible to image a long length of illuminated sample on thespectrometer slit and there is no danger of reflecting a large fraction ofthe incident laser beam into the spectrometer, with the possibility ofoverloading the detector, producing a spectrum with a rather poorsignal-to-noise ratio or producing grating ghosts of significant intensity.Opaque samples and surface coatings may be studied in a similar way,
1.6 Spectrometers and experimental methods - Raman 37
but the spectrum of the substrate will of course be strongly observed inthe latter type of study. If thick transparent samples are available it ispreferable to allow the laser beam to traverse the sample parallel to thesurface but just inside it and the points of entry and exit shouldpreferably not be imaged on the spectrometer slit so as again tominimize the amount of scattered light at the exciting wavelength whichenters the spectrometer slit. If the surfaces of the sample can be polished,including that at which the Raman scattered light leaves, it is useful to doso. In careful polarization studies such polishing of the sample face isimportant and it is also necessary to check that neither the exciting beamnor the Raman light passes through a large enough thickness of samplefor significant polarization scrambling to take place. Some scramblingalways takes place because of inhomogeneities in the sample and this ismore serious at optical wavelengths than at infrared wavelengths. If asample shows the background fluorescence referred to in subsection1.6.1 it is often possible to diminish the level of this background by'burning out', which involves leaving the sample in the laser beam forperiods of as much as a few hours before recording a spectrum.
Samples in powder form or in the form of thin fibres are rather difficultto examine without scattering large amounts of the exciting radiationinto the spectrometer. Fibres may be examined by illuminating themend-on so that they behave like waveguides but it is difficult to getreliable polarization data from them unless they are illuminated normalto their axes and immersed in a liquid of similar refractive index to cutdown multiple reflections which tend to scramble the polarization. If aliquid is used its spectrum will also be recorded and will need to besubtracted. It is usually almost impossible to obtain reliablepolarization data from powder samples, although immersion of thepowder in a liquid of similar refractive index may help and will also cutdown the scattered light of the exciting wavelength at the expense ofcomplicating the observed spectrum. Dry powders may be examined bypacking them into the open end of a glass capillary tube with a pointedtool which produces a conical depression in the powder. If the capillaryis placed parallel to the laser beam, which is focussed into thisdepression, good illumination of the powder is obtained without toomuch scatter of the exciting light into the spectrometer, but nopolarization data can be obtained.
Solutions or melts can be studied in glass containers, preferably withoptical quality faces for the best spectra, particularly for polarizationstudies, and although the Raman scattering from most glasses is ratherweak, care should be taken not to image the points of entry and exit ofthe beam into the sample on the spectrometer slit.
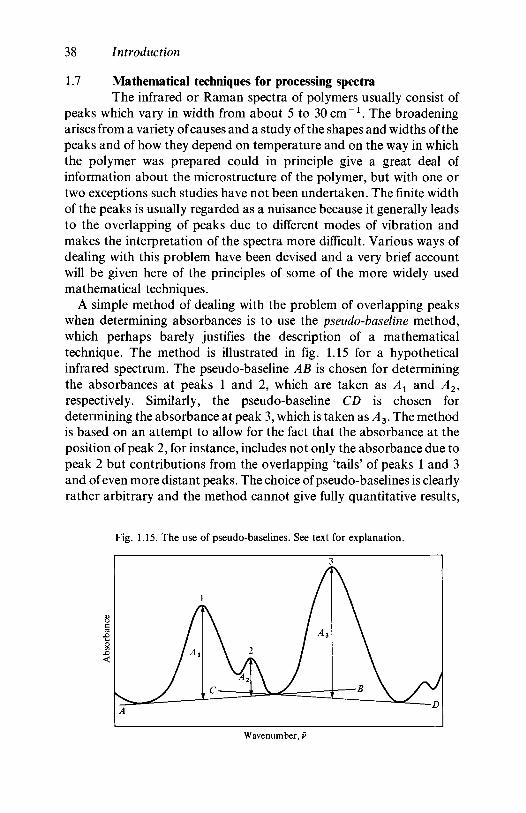
38 Introduction
1.7 Mathematical techniques for processing spectraThe infrared or Raman spectra of polymers usually consist of
peaks which vary in width from about 5 to 30 cm"1 . The broadeningarises from a variety of causes and a study of the shapes and widths of thepeaks and of how they depend on temperature and on the way in whichthe polymer was prepared could in principle give a great deal ofinformation about the microstructure of the polymer, but with one ortwo exceptions such studies have not been undertaken. The finite widthof the peaks is usually regarded as a nuisance because it generally leadsto the overlapping of peaks due to different modes of vibration andmakes the interpretation of the spectra more difficult. Various ways ofdealing with this problem have been devised and a very brief accountwill be given here of the principles of some of the more widely usedmathematical techniques.
A simple method of dealing with the problem of overlapping peakswhen determining absorbances is to use the pseudo-baseline method,which perhaps barely justifies the description of a mathematicaltechnique. The method is illustrated in fig. 1.15 for a hypotheticalinfrared spectrum. The pseudo-baseline AB is chosen for determiningthe absorbances at peaks 1 and 2, which are taken as Ax and A2,respectively. Similarly, the pseudo-baseline CD is chosen fordetermining the absorbance at peak 3, which is taken as A3. The methodis based on an attempt to allow for the fact that the absorbance at theposition of peak 2, for instance, includes not only the absorbance due topeak 2 but contributions from the overlapping 'tails' of peaks 1 and 3and of even more distant peaks. The choice of pseudo-baselines is clearlyrather arbitrary and the method cannot give fully quantitative results,
Fig. 1.15. The use of pseudo-baselines. See text for explanation.
Wavenumber, v
1.7 Mathematical techniques for processing spectra 39
particularly if there is a great deal of peak overlap. Nevertheless, if usedin a systematic way on suitable spectra it can sometimes give usefulsemiquantitative results. A similar technique can be used for estimatingintensities from a Raman spectrum. The method has been largelysuperseded by the more quantitative methods which will now bediscussed.
Another simple method of processing spectra is simply to scale onespectrum and subtract it from another. This subtraction method may beused, for instance, in finding the spectrum of one component of a two-component mixture by subtracting the known spectrum of the othercomponent from the spectrum of the mixture. The known spectrum isrepeatedly scaled and subtracted until a suitable peak, which occursonly in its spectrum, disappears from the resulting difference spectrum.A similar method may be used to deduce the changes introduced into aspectrum by the crystallization of a polymer by subtracting from it thespectrum of the totally amorphous polymer. This simple methodassumes that the spectrum of the mixture is simply the weighted sum ofthe spectra of the individual components and this may not be so. Inaddition, the method does not help in separating the overlapping peaksdue to a single component and other methods have therefore beendevised for separating peaks. These methods may be broadly dividedinto two types: curve-fitting methods and peak-narrowing methods.
It has been shown empirically that many isolated infrared absorbanceand Raman scattering peaks conform fairly closely to a Lorentzian lineshape (see fig. 1.16), of the form
/0(w/2)2
V / ( v -v o ) 2 + (w/2)2
where v0 is the wavenumber at the line centre, w is the width of the line athalf the peak intensity, L(v) represents the infrared absorbance or theintensity of Raman scattering at wavenumber v and / 0 is the peak valueof L(v). If a complex region of overlapping peaks is assumed to becomposed of a known number of Lorentzian peaks with unknowncentres, half-widths and heights the region can be computer fitted tofind the values of these quantities. Such fits can also be made for otherassumed line shapes, such as the Gaussian form,G(v) = /Oexp[ — 4(v — vo)2ln2/w2], or combinations of Gaussian andLorentzian shapes. Since real peaks may deviate somewhat from theform assumed and real spectra are noisy, the fit obtained may not beunique, particularly if there is any doubt about the number ofcomponent peaks. For this reason peak-narrowing methods are often
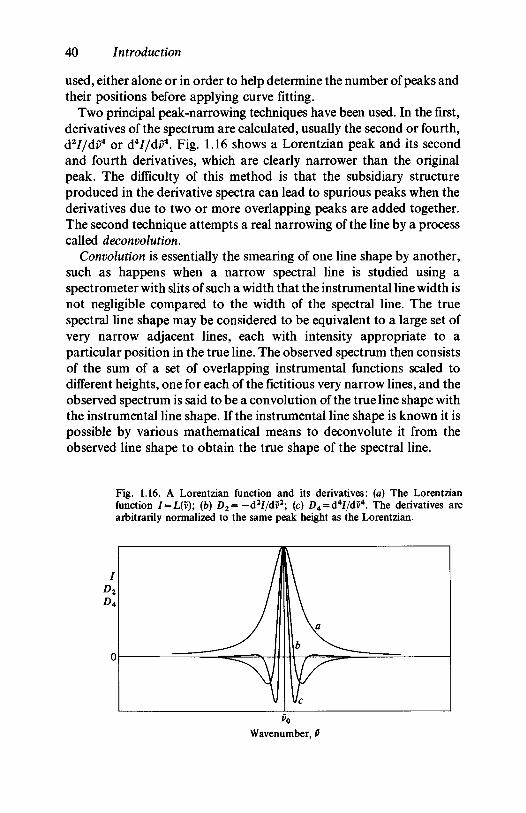
40 Introduction
used, either alone or in order to help determine the number of peaks andtheir positions before applying curve fitting.
Two principal peak-narrowing techniques have been used. In the first,derivatives of the spectrum are calculated, usually the second or fourth,d2//di>4 or d4//d£4. Fig. 1.16 shows a Lorentzian peak and its secondand fourth derivatives, which are clearly narrower than the originalpeak. The difficulty of this method is that the subsidiary structureproduced in the derivative spectra can lead to spurious peaks when thederivatives due to two or more overlapping peaks are added together.The second technique attempts a real narrowing of the line by a processcalled deconvolution.
Convolution is essentially the smearing of one line shape by another,such as happens when a narrow spectral line is studied using aspectrometer with slits of such a width that the instrumental line width isnot negligible compared to the width of the spectral line. The truespectral line shape may be considered to be equivalent to a large set ofvery narrow adjacent lines, each with intensity appropriate to aparticular position in the true line. The observed spectrum then consistsof the sum of a set of overlapping instrumental functions scaled todifferent heights, one for each of the fictitious very narrow lines, and theobserved spectrum is said to be a convolution of the true line shape withthe instrumental line shape. If the instrumental line shape is known it ispossible by various mathematical means to deconvolute it from theobserved line shape to obtain the true shape of the spectral line.
Fig. 1.16. A Lorentzian function and its derivatives: (a) The Lorentzianfunction 7 = L(v); (b) D2= -d*//dv2; (c) D4 = d4//dv4. The derivatives arearbitrarily normalized to the same peak height as the Lorentzian.
D2
D4
II V
Wavenumber, v
1.8 Further reading 41
It may be shown that if two Lorentzians are convoluted the result is athird Lorentzian with a width equal to the sum of those of the other two.Thus a Lorentzian line can be narrowed by deconvolution with aLorentzian of suitably chosen width without introducing any spuriousstructure and if a whole overlapping complex of Lorentzians isdeconvoluted with a Lorentzian improved resolution will result. Inpractice, this method is not as easy to apply as it sounds because thedeconvoluting Lorentzian must be narrower than any of the peaks in theline complex or spurious peaks may be introduced. Furthermore, noisein the original spectrum is greatly magnified by the deconvolutionprocess. Nevertheless the method is beginning to come into use,particularly as better signal-to-noise ratios are available with moderninstrumentation.
1.8 Further readingIn this chapter we have attempted to give only sufficient general
background information on polymers to enable the complete beginnerin the study of polymers to follow the subsequent chapters. Such acomplete beginner may find the book Introduction to Polymer Science byL. R. G. Treloar in the Wykeham Science Series (WykehamPublications, London, 1970) useful in giving further details at about thesame level. Another introductory book at a somewhat more advancedlevel is Introduction to Polymers 2nd Edn, by R. J. Young andP. A. Lovell, Chapman and Hall, London, 1991.
The sections on experimental methods are intended to provide anintroduction to these topics which should enable the beginner invibrational spectroscopy not only to understand how the types ofspectra discussed in the book may be obtained, but also to have someidea of the difficulties involved and of the possible sources of error. Avery useful book on the instrumental aspects of infrared and Ramanspectroscopy, which gives many more details and which has chaptersspecifically about polymers, is Laboratory Methods in VibrationalSpectroscopy 3rd Edn edited by H. A. Willis, J. H. van der Maas andR. G. J. Miller, John Wiley and Sons, 1987.
Symmetry and normal modes of vibration
2.1 Interatomic forces and molecular vibrationsBefore considering the vibrations of polymers we shall consider
those of isolated small molecules. The vibrational motion of such amolecule is independent of its overall translational motion and we shallneglect the effect of overall rotational motion of the molecule on itsvibrational motion, since it can be shown that the two types of motionare independent to a good approximation. For polymers, particularly inthe solid state, there is no significant rotational or translational motionof the molecules as a whole, but we shall see later, in chapter 3, that thereare vibrational modes of crystalline polymers which are related to thesetypes of motion.
When talking about the vibrations of a molecule it is convenient toconsider the molecule to be a collection of atoms held together bychemical bonds. The atoms are imagined to be point masses and thebonds rather like springs, so that the whole assembly can vibrate as themasses move to and fro and the springs stretch and compress. This is thesimple classical model that will be adopted in this chapter and it is wortha brief justification because at first sight it appears, when the true naturesof the atoms and of the bonds are considered, to be rather far from thetruth.
2.1.1 Interatomic forcesA more correct picture of a simple diatomic molecule is that it
consists of two atomic nuclei, each of which is closely surrounded by anumber of core electrons and a number of bonding electrons. The coreelectrons interact mainly with the particular nucleus which theysurround and with each other, whereas the bonding electrons interactstrongly with both nuclei and their surrounding core electrons, as well aswith each other. The bonding electrons are thus shared between the twocores (nucleus + core electrons). When two atoms form a molecule thebonding electrons thus interact with two cores rather than with a singleone. The consequent lowering of their potential energy is an importantcontribution to the binding energy of the molecule. The other majorcontribution is a lowering of the kinetic energy of the bonding electrons.This is due to the quantum-mechanical effect that the kinetic energy of a
2.1 Interatomic forces and molecular vibrations 43
system of particles can be lower when they move in a larger region ofspace.
When the atoms come together to form the molecule the motions ofthe core electrons are perturbed, though considerably less so than thoseof the bonding electrons, so that the picture given is oversimplified. Themolecule is in fact a single assemblage of particles all interacting witheach other, and the quantum-mechanical wave-function which describesit is a function of the coordinates of the two nuclei and of all theelectrons. When the energy of the system changes it can only change byan amount which corresponds to the difference between two energylevels of the complete system. Fortunately, because of the large differencebetween the masses of the atomic nuclei and those of the electrons whichsurround them and bind them together, the motions of the electrons aremuch faster than those of the nuclei. It is thus possible, when consideringthe quantum-mechanical description of the electronic states, to regardthe nuclei of the molecule as being effectively at rest. The electronic-statewave-functions depend, however, on the instantaneous positions of thenuclei, and so do the corresponding energies of these states. The forcebetween the nuclei which causes them to tend to return to theirequilibrium separation when disturbed arises from the dependence ofboth the electronic energy and the direct coulomb interaction energy ofthe nuclei on their separation. The motions of the nuclei can thus bediscussed in terms of an effective interaction force between them whichdepends on their separation, and the fact that this force is due in part tothe rearrangement of the electrons and their motions can be forgotten,provided that the electrons do not make a discontinuous change of state.Such a discontinuous change of state of the electrons, an electronictransition, corresponds to a large change in the energy of the moleculeand usually gives rise to the emission or absorption of radiation in theultraviolet or visible region of the spectrum. Such transitions will not beconsidered in this book, except when discussing the resonance Ramaneffect in chapter 5.
The motion of the interacting nuclei is most correctly described interms of quantum mechanics, as has already been indicated. We shallsee, however, that the effective mutual potential energy is approximatelyof the form which gives rise in a classical system to simple harmonicmotion. The quantum-mechanical treatment of a simple harmonicoscillator shows that the frequency of the radiation emitted or absorbedwhen a transition between two energy levels of such a system takesplace is exactly the same as the frequency of vibration of a classicalsystem with the same potential energy function. We shall thereforediscuss the vibrations of molecules using classical dynamics, and
44 Symmetry and normal modes of vibration
because we think of atoms joined together by bonds in the simplifiedpicture we shall generally refer to the positions or motions of atomsrather than nuclei.
2.1.2 Normal modes of vibrationWe are concerned only with the degrees of freedom of a
molecule that are associated with the translational motions of itsconstituent atoms, and then only with those motions that do notcorrespond to translation or rotation of the whole molecule but togenuine vibrational modes. A diatomic molecule has only one vibrationaldegree of freedom, associated with changes in the separation of theatoms. More generally, a molecule consisting of N atoms has 3N — 6vibrational degrees of freedom. The six degrees of freedom subtractedfrom the total of 3N translational degrees of freedom of AT atoms are thedegrees of freedom of the undistorted molecule, i.e. the translations androtations of the whole molecule parallel to or about three mutuallyperpendicular axes. For a linear molecule there is no rotational degree offreedom around the axis of the molecule associated with translations ofthe atoms; such a degree of freedom can only be associated with theelectronic states or with internal states of the nuclei, and therefore thenumber of vibrational degrees of freedom for such a molecule is 3N — 5.
Let the masses of the atoms in a diatomic molecule be mx and m2 andlet their separation be r. If it is assumed that the potential energy V(r) ofthe molecule is given by
V(r)=V0+±k(r-r0)2 (2.1)
where Vo and k are constants and r0 is the equilibrium separation of theatoms, it is easy to show that when the molecule is disturbed fromequilibrium it will vibrate with simple harmonic motion of frequency v,where
1 k(m1+m2)
In \j m1m2
The quantity k is called a force constant and the restoring force acting oneither atom when r ̂ r0 is k(r — r0). Equation (2.1) does not, however,represent the exact form of the potential energy function for a realmolecule. V(r) cannot contain a term linear in (r — r0), since r0 would notthen be the equilibrium separation, but it can, and generally will,contain terms in powers of (r — r0) higher than two. Neglect of theseterms is called the harmonic approximation.
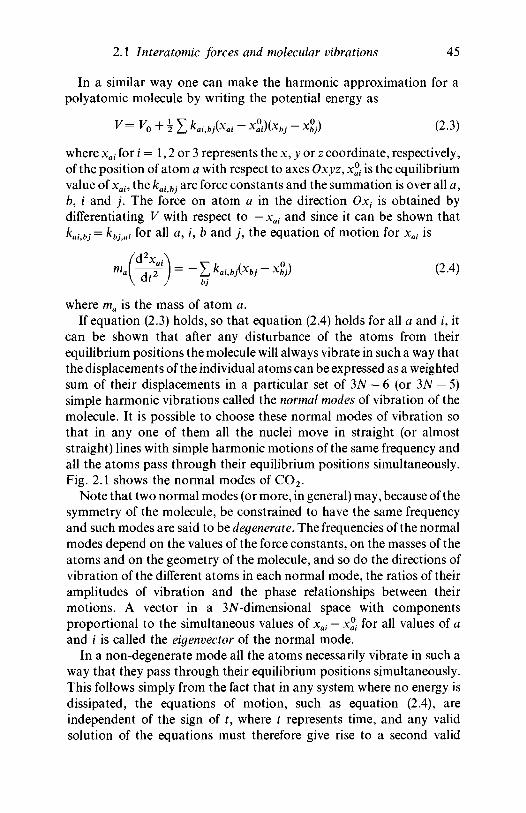
2.1 Interatomic forces and molecular vibrations 45
In a similar way one can make the harmonic approximation for apolyatomic molecule by writing the potential energy as
V= Vo + \ X kaUbj{xai - x°ai)(xbj - <•) (2.3)
where xai for i = 1,2 or 3 represents the x, y or z coordinate, respectively,of the position of atom a with respect to axes Oxyz, x®( is the equilibriumvalue of xai, the kaibj are force constants and the summation is over all a,b, i and j . The force on atom a in the direction Ox, is obtained bydifferentiating V with respect to — xai and since it can be shown thatKi,bj= Kj,ai f° r a ^ a> U b and j , the equation of motion for xai is
-EW* W -*? . , ) (2-4)
where ma is the mass of atom a.If equation (2.3) holds, so that equation (2.4) holds for all a and i, it
can be shown that after any disturbance of the atoms from theirequilibrium positions the molecule will always vibrate in such a way thatthe displacements of the individual atoms can be expressed as a weightedsum of their displacements in a particular set of 3N — 6 (or 3N — 5)simple harmonic vibrations called the normal modes of vibration of themolecule. It is possible to choose these normal modes of vibration sothat in any one of them all the nuclei move in straight (or almoststraight) lines with simple harmonic motions of the same frequency andall the atoms pass through their equilibrium positions simultaneously.Fig. 2.1 shows the normal modes of CO2.
Note that two normal modes (or more, in general) may, because of thesymmetry of the molecule, be constrained to have the same frequencyand such modes are said to be degenerate. The frequencies of the normalmodes depend on the values of the force constants, on the masses of theatoms and on the geometry of the molecule, and so do the directions ofvibration of the different atoms in each normal mode, the ratios of theiramplitudes of vibration and the phase relationships between theirmotions. A vector in a 3AT-dimensional space with componentsproportional to the simultaneous values of xai — x% for all values of aand i is called the eigenvector of the normal mode.
In a non-degenerate mode all the atoms necessarily vibrate in such away that they pass through their equilibrium positions simultaneously.This follows simply from the fact that in any system where no energy isdissipated, the equations of motion, such as equation (2.4), areindependent of the sign of t, where t represents time, and any validsolution of the equations must therefore give rise to a second valid
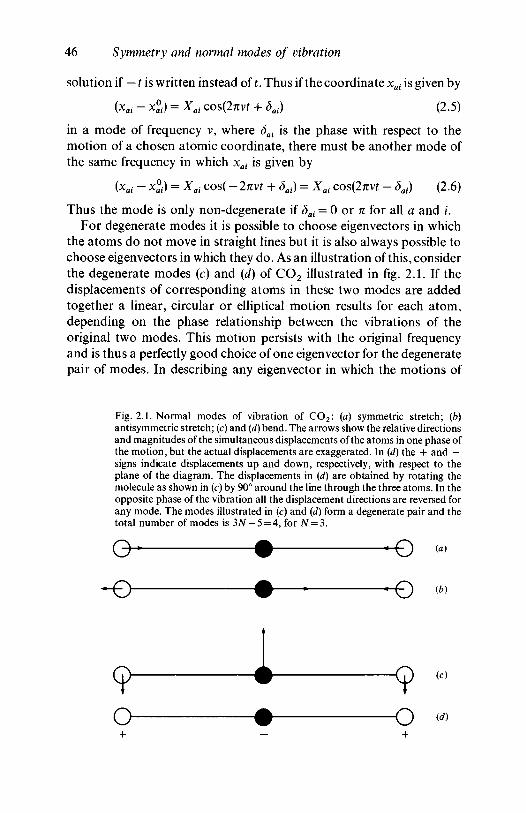
46 Symmetry and normal modes of vibration
solution if — r is written instead of t. Thus if the coordinate xai is given by
(*«i " *«° ) = *ai COS(27TVt + Sai) (2.5)
in a mode of frequency v, where <5fli is the phase with respect to themotion of a chosen atomic coordinate, there must be another mode ofthe same frequency in which xai is given by
(Xat ~*ai) = *ai cos(-2nvt + Sai) = X ai cos(2nvt - Sai) (2.6)
Thus the mode is only non-degenerate if Sai = 0 or n for all a and i.For degenerate modes it is possible to choose eigenvectors in which
the atoms do not move in straight lines but it is also always possible tochoose eigenvectors in which they do. As an illustration of this, considerthe degenerate modes (c) and (d) of CO2 illustrated in fig. 2.1. If thedisplacements of corresponding atoms in these two modes are addedtogether a linear, circular or elliptical motion results for each atom,depending on the phase relationship between the vibrations of theoriginal two modes. This motion persists with the original frequencyand is thus a perfectly good choice of one eigenvector for the degeneratepair of modes. In describing any eigenvector in which the motions of
Fig. 2.1. Normal modes of vibration of CO2 : (a) symmetric stretch; (b)antisymmetric stretch; (c) and (d) bend. The arrows show the relative directionsand magnitudes of the simultaneous displacements of the atoms in one phase ofthe motion, but the actual displacements are exaggerated. In (d) the + and —signs indicate displacements up and down, respectively, with respect to theplane of the diagram. The displacements in (d) are obtained by rotating themolecule as shown in (c) by 90° around the line through the three atoms. In theopposite phase of the vibration all the displacement directions are reversed forany mode. The modes illustrated in (c) and (d) form a degenerate pair and thetotal number of modes is 3iV — 5 = 4, for JV = 3.
(b)
(c)
o • o
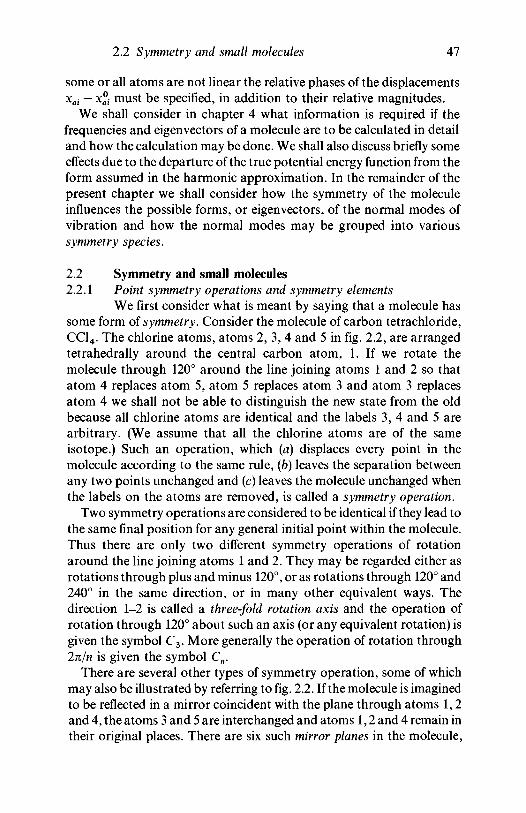
2.2 Symmetry and small molecules 47
some or all atoms are not linear the relative phases of the displacementsxai — x^i must be specified, in addition to their relative magnitudes.
We shall consider in chapter 4 what information is required if thefrequencies and eigenvectors of a molecule are to be calculated in detailand how the calculation may be done. We shall also discuss briefly someeffects due to the departure of the true potential energy function from theform assumed in the harmonic approximation. In the remainder of thepresent chapter we shall consider how the symmetry of the moleculeinfluences the possible forms, or eigenvectors, of the normal modes ofvibration and how the normal modes may be grouped into varioussymmetry species.
2.2 Symmetry and small molecules2.2.1 Point symmetry operations and symmetry elements
We first consider what is meant by saying that a molecule hassome form of symmetry. Consider the molecule of carbon tetrachloride,CC14. The chlorine atoms, atoms 2, 3, 4 and 5 in fig. 2.2, are arrangedtetrahedrally around the central carbon atom, 1. If we rotate themolecule through 120° around the line joining atoms 1 and 2 so thatatom 4 replaces atom 5, atom 5 replaces atom 3 and atom 3 replacesatom 4 we shall not be able to distinguish the new state from the oldbecause all chlorine atoms are identical and the labels 3, 4 and 5 arearbitrary. (We assume that all the chlorine atoms are of the sameisotope.) Such an operation, which (a) displaces every point in themolecule according to the same rule, (b) leaves the separation betweenany two points unchanged and (c) leaves the molecule unchanged whenthe labels on the atoms are removed, is called a symmetry operation.
Two symmetry operations are considered to be identical if they lead tothe same final position for any general initial point within the molecule.Thus there are only two different symmetry operations of rotationaround the line joining atoms 1 and 2. They may be regarded either asrotations through plus and minus 120°, or as rotations through 120° and240° in the same direction, or in many other equivalent ways. Thedirection 1-2 is called a three-fold rotation axis and the operation ofrotation through 120° about such an axis (or any equivalent rotation) isgiven the symbol C3. More generally the operation of rotation through2n/n is given the symbol Cn.
There are several other types of symmetry operation, some of whichmay also be illustrated by referring to fig. 2.2. If the molecule is imaginedto be reflected in a mirror coincident with the plane through atoms 1,2and 4, the atoms 3 and 5 are interchanged and atoms 1,2 and 4 remain intheir original places. There are six such mirror planes in the molecule,
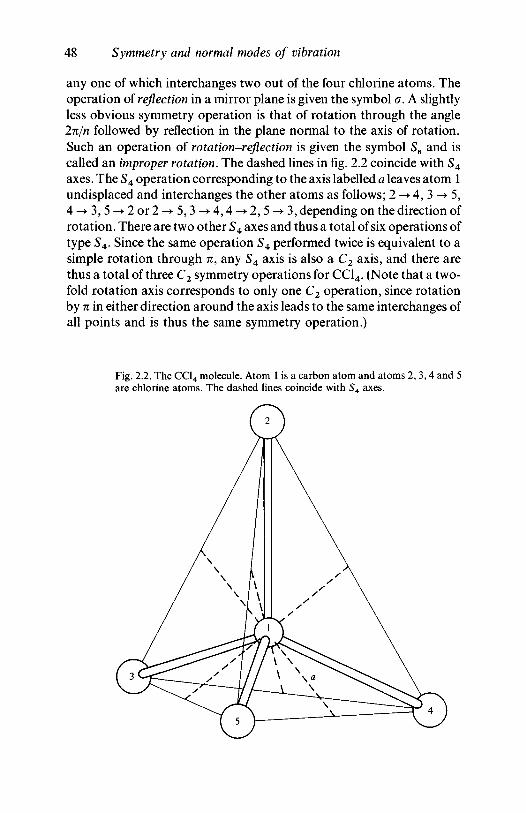
48 Symmetry and normal modes of vibration
any one of which interchanges two out of the four chlorine atoms. Theoperation of reflection in a mirror plane is given the symbol a. A slightlyless obvious symmetry operation is that of rotation through the angle2n/n followed by reflection in the plane normal to the axis of rotation.Such an operation of rotation-reflection is given the symbol Sn and iscalled an improper rotation. The dashed lines in fig. 2.2 coincide with S4
axes. The S4 operation corresponding to the axis labelled a leaves atom 1undisplaced and interchanges the other atoms as follows; 2 -• 4, 3 -• 5,4 -> 3, 5 -• 2 or 2 -» 5,3 -* 4,4->2,5-> 3, depending on the direction ofrotation. There are two other S4 axes and thus a total of six operations oftype S4. Since the same operation S4 performed twice is equivalent to asimple rotation through n, any S4 axis is also a C2 axis, and there arethus a total of three C2 symmetry operations for CC14. (Note that a two-fold rotation axis corresponds to only one C2 operation, since rotationby n in either direction around the axis leads to the same interchanges ofall points and is thus the same symmetry operation.)
Fig. 2.2. The CC14 molecule. Atom 1 is a carbon atom and atoms 2, 3,4 and 5are chlorine atoms. The dashed lines coincide with S4 axes.
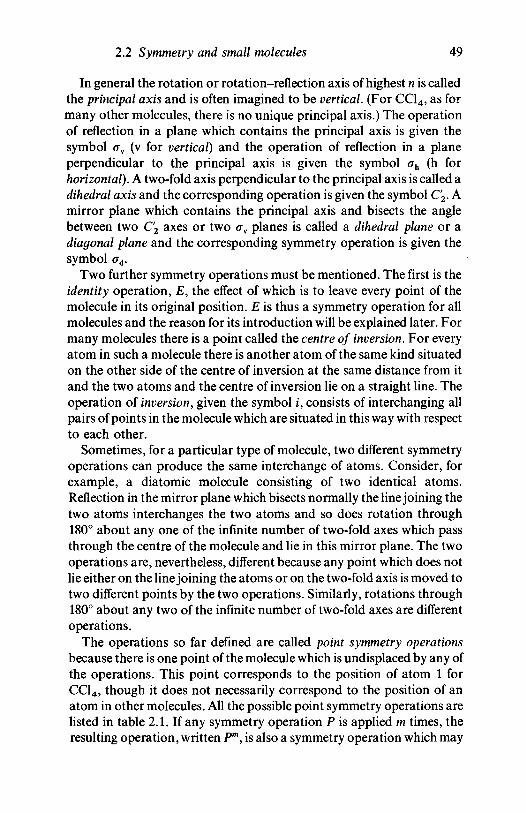
2.2 Symmetry and small molecules 49
In general the rotation or rotation-reflection axis of highest n is calledthe principal axis and is often imagined to be vertical. (For CC14, as formany other molecules, there is no unique principal axis.) The operationof reflection in a plane which contains the principal axis is given thesymbol <rv (v for vertical) and the operation of reflection in a planeperpendicular to the principal axis is given the symbol <xh (h forhorizontal). A two-fold axis perpendicular to the principal axis is called adihedral axis and the corresponding operation is given the symbol C2. Amirror plane which contains the principal axis and bisects the anglebetween two C'2 axes or two ov planes is called a dihedral plane or adiagonal plane and the corresponding symmetry operation is given thesymbol ad.
Two further symmetry operations must be mentioned. The first is theidentity operation, £, the effect of which is to leave every point of themolecule in its original position. E is thus a symmetry operation for allmolecules and the reason for its introduction will be explained later. Formany molecules there is a point called the centre of inversion. For everyatom in such a molecule there is another atom of the same kind situatedon the other side of the centre of inversion at the same distance from itand the two atoms and the centre of inversion lie on a straight line. Theoperation of inversion, given the symbol i, consists of interchanging allpairs of points in the molecule which are situated in this way with respectto each other.
Sometimes, for a particular type of molecule, two different symmetryoperations can produce the same interchange of atoms. Consider, forexample, a diatomic molecule consisting of two identical atoms.Reflection in the mirror plane which bisects normally the line joining thetwo atoms interchanges the two atoms and so does rotation through180° about any one of the infinite number of two-fold axes which passthrough the centre of the molecule and lie in this mirror plane. The twooperations are, nevertheless, different because any point which does notlie either on the line joining the atoms or on the two-fold axis is moved totwo different points by the two operations. Similarly, rotations through180° about any two of the infinite number of two-fold axes are differentoperations.
The operations so far defined are called point symmetry operationsbecause there is one point of the molecule which is undisplaced by any ofthe operations. This point corresponds to the position of atom 1 forCC14, though it does not necessarily correspond to the position of anatom in other molecules. All the possible point symmetry operations arelisted in table 2.1. If any symmetry operation P is applied m times, theresulting operation, written Pm, is also a symmetry operation which may
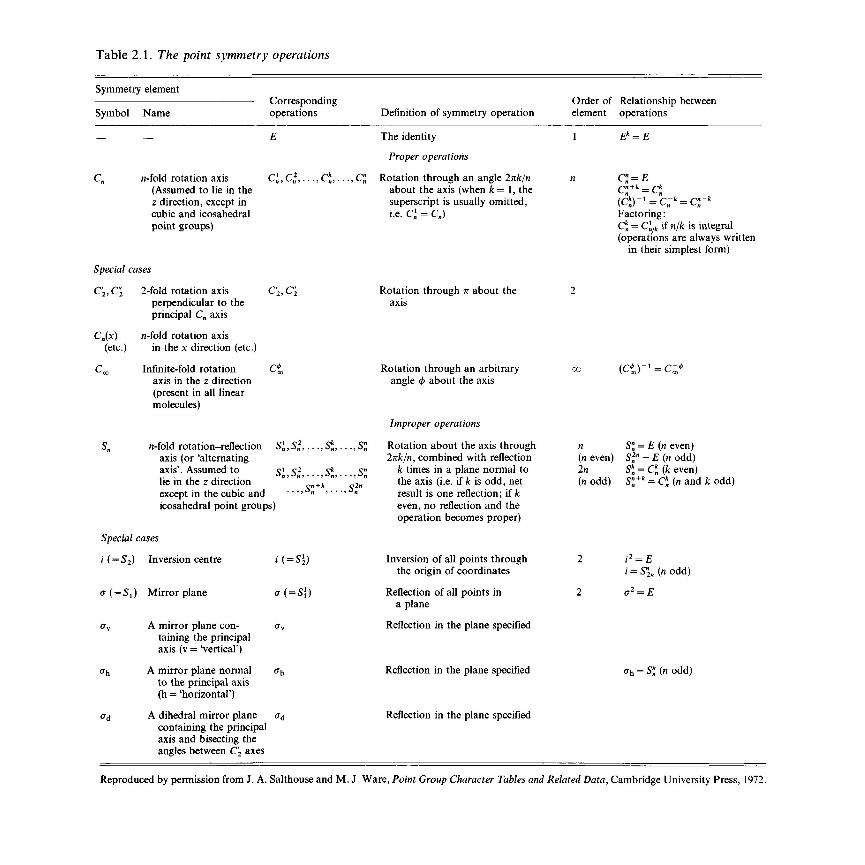
Table 2.1. The point symmetry operations
Symmetry element
Symbol NameCorrespondingoperations Definition of symmetry operation
Order of Relationship betweenelement operations
cic2,...,cka,...,c
nn
C2,C"2
n-fold rotation axis(Assumed to lie in thez direction, except incubic and icosahedralpoint groups)
Special cases
C2, C2 2-fold rotation axisperpendicular to theprincipal Cn axis
Cn(x) n-fold rotation axis(etc.) in the x direction (etc.)
Cm Infinite-fold rotationaxis in the z direction(present in all linearmolecules)
n-fold rotation-reflection Si, S2,..., Sk,...,axis (or 'alternatingaxis'. Assumed tolie in the z directionexcept in the cubic andicosahedral point groups)
Si,S2, ...,S*,...,S;cn+fc O2n
. . . , On , . . . , O n
Special cases
i (= S2) Inversion centre
<T ( = 5 ^ Mirror plane
i ( = S2)
A mirror plane con-taining the principalaxis (v = 'vertical')
A mirror plane normalto the principal axis(h = 'horizontal')
A dihedral mirror planecontaining the principalaxis and bisecting theangles between C'2 axes
The identity
Proper operations
Rotation through an angle 2nk/nabout the axis (when k = 1, thesuperscript is usually omitted,i.e. C\ = C J
Rotation through n about theaxis
Rotation through an arbitraryangle <j> about the axis
Improper operations
Rotation about the axis through2nk/n, combined with reflection
k times in a plane normal tothe axis (i.e. if k is odd, netresult is one reflection; if keven, no reflection and theoperation becomes proper)
Inversion of all points throughthe origin of coordinates
Reflection of all points ina plane
Reflection in the plane specified
Reflection in the plane specified
Reflection in the plane specified
£* = £
Factoring:C* = Cl
nlk if n/k is integral(operations are always written
in their simplest form)
=C~
n S" = E (n even)(n even) S2" = E (n odd)In Sk
n = Cn {k even)(nodd) S ; + t = Cj (wand fc odd)
i = S"2n (n odd)
<rh = S; (n odd)
Reproduced by permission from J. A. Salthouse and M. J. Ware, Point Group Character Tables and Related Data, Cambridge University Press, 1972.
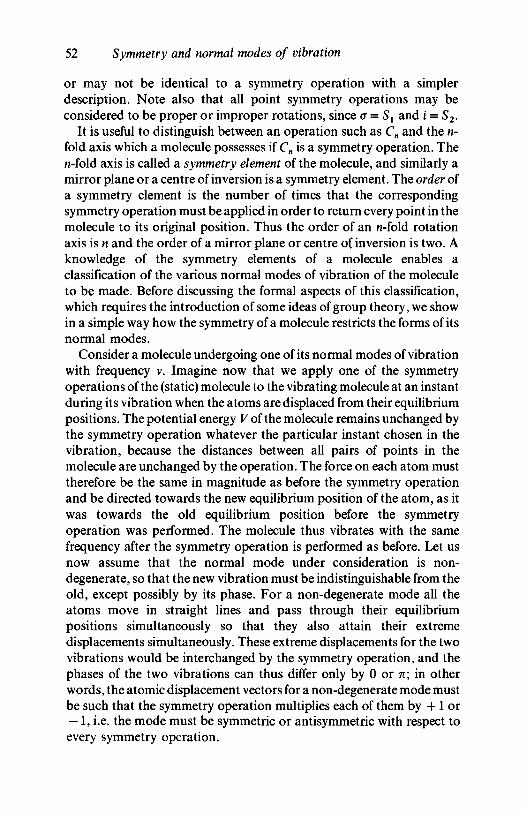
52 Symmetry and normal modes of vibration
or may not be identical to a symmetry operation with a simplerdescription. Note also that all point symmetry operations may beconsidered to be proper or improper rotations, since G = S1 and i = S2.
It is useful to distinguish between an operation such as Cn and the n-fold axis which a molecule possesses if Cn is a symmetry operation. Therc-fold axis is called a symmetry element of the molecule, and similarly amirror plane or a centre of inversion is a symmetry element. The order ofa symmetry element is the number of times that the correspondingsymmetry operation must be applied in order to return every point in themolecule to its original position. Thus the order of an n-fold rotationaxis is n and the order of a mirror plane or centre of inversion is two. Aknowledge of the symmetry elements of a molecule enables aclassification of the various normal modes of vibration of the moleculeto be made. Before discussing the formal aspects of this classification,which requires the introduction of some ideas of group theory, we showin a simple way how the symmetry of a molecule restricts the forms of itsnormal modes.
Consider a molecule undergoing one of its normal modes of vibrationwith frequency v. Imagine now that we apply one of the symmetryoperations of the (static) molecule to the vibrating molecule at an instantduring its vibration when the atoms are displaced from their equilibriumpositions. The potential energy V of the molecule remains unchanged bythe symmetry operation whatever the particular instant chosen in thevibration, because the distances between all pairs of points in themolecule are unchanged by the operation. The force on each atom musttherefore be the same in magnitude as before the symmetry operationand be directed towards the new equilibrium position of the atom, as itwas towards the old equilibrium position before the symmetryoperation was performed. The molecule thus vibrates with the samefrequency after the symmetry operation is performed as before. Let usnow assume that the normal mode under consideration is non-degenerate, so that the new vibration must be indistinguishable from theold, except possibly by its phase. For a non-degenerate mode all theatoms move in straight lines and pass through their equilibriumpositions simultaneously so that they also attain their extremedisplacements simultaneously. These extreme displacements for the twovibrations would be interchanged by the symmetry operation, and thephases of the two vibrations can thus differ only by 0 or n; in otherwords, the atomic displacement vectors for a non-degenerate mode mustbe such that the symmetry operation multiplies each of them by + 1 or— 1, i.e. the mode must be symmetric or antisymmetric with respect toevery symmetry operation.
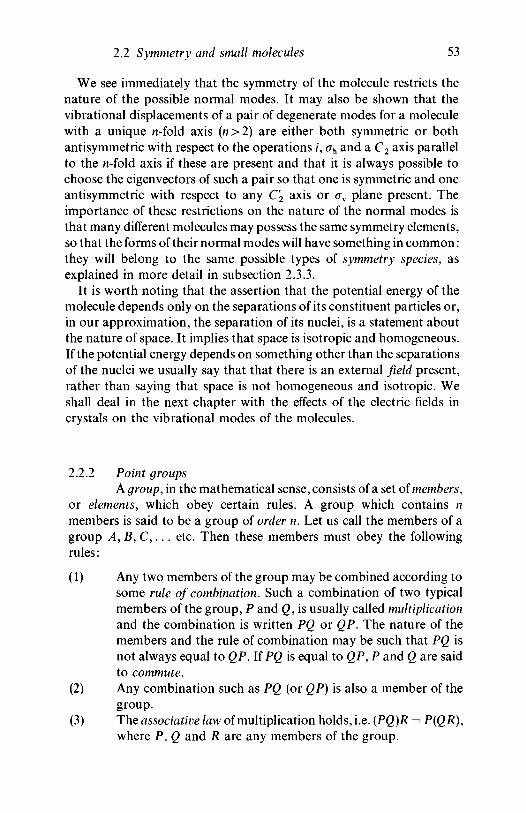
2.2 Symmetry and small molecules 53
We see immediately that the symmetry of the molecule restricts thenature of the possible normal modes. It may also be shown that thevibrational displacements of a pair of degenerate modes for a moleculewith a unique n-fold axis (n>2) are either both symmetric or bothantisymmetric with respect to the operations i, erh and a C2 axis parallelto the rc-fold axis if these are present and that it is always possible tochoose the eigenvectors of such a pair so that one is symmetric and oneantisymmetric with respect to any C'2 axis or aw plane present. Theimportance of these restrictions on the nature of the normal modes isthat many different molecules may possess the same symmetry elements,so that the forms of their normal modes will have something in common:they will belong to the same possible types of symmetry species, asexplained in more detail in subsection 2.3.3.
It is worth noting that the assertion that the potential energy of themolecule depends only on the separations of its constituent particles or,in our approximation, the separation of its nuclei, is a statement aboutthe nature of space. It implies that space is isotropic and homogeneous.If the potential energy depends on something other than the separationsof the nuclei we usually say that that there is an external field present,rather than saying that space is not homogeneous and isotropic. Weshall deal in the next chapter with the effects of the electric fields incrystals on the vibrational modes of the molecules.
2.2.2 Point groupsA group, in the mathematical sense, consists of a set of members,
or elements, which obey certain rules. A group which contains nmembers is said to be a group of order n. Let us call the members of agroup A, B, C,... etc. Then these members must obey the followingrules:
(1) Any two members of the group may be combined according tosome rule of combination. Such a combination of two typicalmembers of the group, P and Q, is usually called multiplicationand the combination is written PQ or QP. The nature of themembers and the rule of combination may be such that PQ isnot always equal to QP. If PQ is equal to QP, P and Q are saidto commute.
(2) Any combination such as PQ (or QP) is also a member of thegroup.
(3) The associative law of multiplication holds, i.e. (PQ)R = P(QR),where P, Q and R are any members of the group.
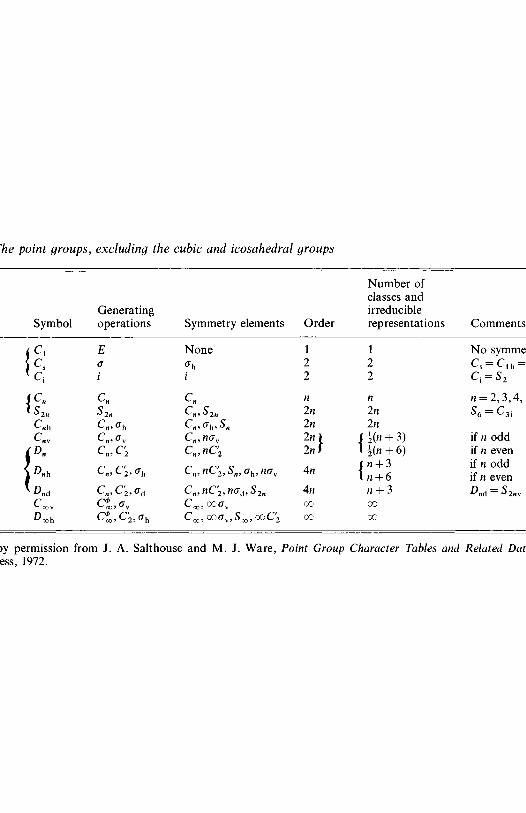
Table 2.2. The point groups, excluding the cubic and icosahedral groups
Type
Non-axial
Axial: RCyclic
R
Dihedral
Linear
Symbol
\s2ncnh
r-\Dnh
Ad^ OOV
Generatingoperations
Eai
c.s2n
Cn,dv
cn, c2
clc2 > f f hCn9C2,Gd
C<tD,av
Ct,C'2,ffh
Symmetry elements
None
i
cm,s2HCn,ah,Sn
Cn,nav
CH,nC2
CH9nC29nad9S2n
C^, oocv
Cm9coay9Sn9coC2
Order
122
2n2n2*12n)
4w
4n00
oo
Number ofclasses andirreduciblerepresentations
122
nInIn
( ^(n + 3)
( w + 3l n + 6
n + 3oooo
Comments
No symmetryCs = Cl h = Cl v = SjCj = S2
w = 2 , 3 , 4 , . . .S6 = C 3 i
if n oddif n even D 2 = Vif w odd £ _ T/
if n even 2fl"" h
£>nd = S2 n v Z)2d - Fd
Reproduced by permission from J. A. Salthouse and M. J. Ware, Point Group Character Tables and Related Data, CambridgeUniversity Press, 1972.
2.2 Symmetry and small molecules 55
(4) One member of the group is the identity, usually given thesymbol E. E has the property that PE = EP = P, where P is anymember of the group.
(5) For each member of the group, such as P, there is an inverse,written P ~x, which is also a member of the group and which hasthe property PP'1 =P~1P = E. (Note that P may sometimesbe its own inverse, so that P2 = E)
It is important to realize that groups may be formed with members ofmany different types and suitable combination rules.
If we define multiplication, i.e. the rule of combination, as successiveoperation, then the point symmetry operations for a molecule form agroup, called its point group. It is obvious from the definition of thesymmetry operations of a molecule that they form a set which satisfies allthe above rules, provided that the identity operation is included but nototherwise. We need, however, to define multiplication slightly moreprecisely: if P and Q are symmetry operations then by PQ we shall meanthe operation Q followed by the operation P.
A list of the point groups is given in table 2.2, excluding the cubic andicosahedral groups which have no direct relevance for polymers andwhich will not be considered in any detail in this book. All theoperations of any particular group can be generated as powers orproducts of at most three generating operations which may usually bechosen in many different ways. A possible set of generating operationsfor each group is shown in table 2.2.
Any group has a multiplication table which expresses the results ofmultiplying all possible ordered pairs of members of the group. Toillustrate this we shall consider the point group C3v to which theammonia molecule, fig. 2.3, belongs. (This group is simpler than that towhich carbon tetrachloride belongs, which is one of the cubic groups,Td.)
There is a C3 axis which passes through atom 1 and is normal to theplane of atoms 2,3 and 4. We define the direction of the operation C3 sothat it takes atom 2 to atom 3 and atom 3 to atom 4. The operation C\then takes atom 2 to atom 4 and atom 3 to atom 2. The other symmetryelements are the <rv mirror planes ff(2), cr(3) and cr(4), which contain theC3 axis and the positions originally occupied by atoms 2, 3 and 4,respectively. (The symmetry elements are to be considered fixed inspace.) The multiplication table is shown as table 2.3. Each operationshown is that obtained by multiplying the operation at the left of the rowcontaining it by the operation at the top of the column containing it sothat the latter operation is the right-hand factor in the multiplication, i.e.
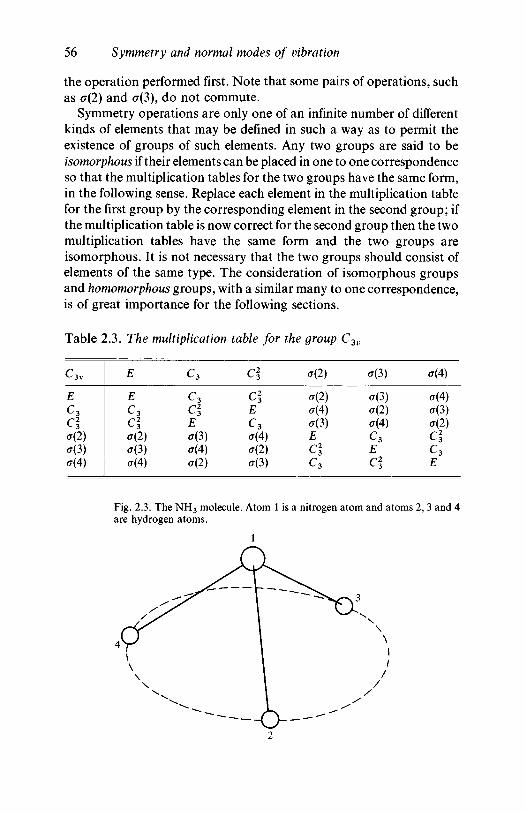
56 Symmetry and normal modes of vibration
the operation performed first. Note that some pairs of operations, suchas a(2) and <J(3), do not commute.
Symmetry operations are only one of an infinite number of differentkinds of elements that may be defined in such a way as to permit theexistence of groups of such elements. Any two groups are said to beisomorphous if their elements can be placed in one to one correspondenceso that the multiplication tables for the two groups have the same form,in the following sense. Replace each element in the multiplication tablefor the first group by the corresponding element in the second group; ifthe multiplication table is now correct for the second group then the twomultiplication tables have the same form and the two groups areisomorphous. It is not necessary that the two groups should consist ofelements of the same type. The consideration of isomorphous groupsand homomorphous groups, with a similar many to one correspondence,is of great importance for the following sections.
Table 2.3. The multiplication table for the group C3v
c3vE
cl<T(2)(7(3)(7(4)
E
Ec3cl(7(2)(7(3)(7(4)
c3c3clE(7(3)(7(4)(7(2)
clclEc3(7(4)(T(2)(7(3)
(7(2)
(7(2)(7(4)(7(3)
Er2
c3
(7(3)
(7(3)(7(2)(7(4)
c3Ecl
(7(4)
(7(4)(7(3)(7(2)
clc3E
Fig. 2.3. The NH 3 molecule. Atom 1 is a nitrogen atom and atoms 2, 3 and 4are hydrogen atoms.
2.3 Group representations 57
2.3. Group representations2.3.1 Representation of groups by matrices
Any set of elements which combine under a specified rule toform a group which is isomorphous or homomorphous with a par-ticular group is said to form a representation of that group. The mostuseful representations of point groups for our purposes are those inwhich the elements are square matrices and the rule of combination ismatrix multiplication. A set of square matrices, each o f n x n elements,which form a representation of a group is called an n-dimensionalrepresentation. It is possible to find one or more representations of anypoint group for all possible values of n. In particular, if n = 1 we can findthe trivial representation of any point group in which each matrix issimply the number 1. This is called the identity representation. For most,but not all, point groups there exists at least one other one-dimensionalrepresentation, in which some members of the group are represented by+ 1 and others by — 1. We have already said that the atomicdisplacements of a non-degenerate normal mode of vibration aremultiplied by ± 1 when any symmetry operation is applied to themolecule and it should now be clear that this set of multipliers, one foreach symmetry operation, forms a one-dimensional representation ofthe point group of the molecule. Let us now consider a two-folddegenerate mode.
Suppose that we could directly observe a molecule undergoing itsnormal modes of vibration and that we found two different modes whichhad the same frequency v. This means that there are at least two possibleeigenvectors corresponding to the frequency v. Let us now imagineapplying each of the symmetry operations of the group to either of theseeigenvectors or, more precisely, to the molecule with its atoms displacedas specified by the eigenvector. It was shown in subsection 2.2.1 that thiscan only lead to a vibration of the same frequency. If we represent the setof displacements for the two eigenvectors by the symbols S and T thereare three possibilities: (a) each member of the set of displacements Stransforms into ± itself under each of the symmetry operations; (b) foreach of the symmetry operations the set S transforms into a linearcombination of S and T; (c) the set S transforms in some other way. Aset, W, of displacements of the atoms is a linear combination of the sets Sand T if, for every atom a in the molecule, the displacement vector wa ofthe atom in the set W is given by
wa = asa + flta (2.7)
where sa and ta are the displacement vectors of the atom in the sets S andT, respectively, and a and /? are the same for every atom.
58 Symmetry and normal modes of vibration
If the eigenvector transforms as in (a) it is clear that the two modes arenot related to each other by symmetry and for some change of forceconstants, masses or geometry which do not change the symmetry of themolecule the corresponding frequencies will be different. Such modes aresaid to be accidentally degenerate. If the eigenvector transforms as in (c)there is at least one more mode of frequency v for which the eigenvectoris not a linear combination of the eigenvectors of the first two degeneratemodes considered. If these are not accidentally degenerate the mode isthus at least three-fold degenerate. For eigenvectors which transform asin (b) we have true symmetry-determined two-fold degeneracy, and this isthe only type of symmetry-determined degeneracy which can occur forthe point groups listed in table 2.2.
All the sets of displacements generated by operations of the group oneither of the pair of original eigenvectors of a symmetry-determined two-fold degenerate mode are given by
W=aS+$T (2.8)
where W, S and T each represent 3AT-dimensional vectors whosecomponents are the N sets of components of the vectors wa9 sa and ta.Because the equations of motion, equation (2.4), are linear in thedisplacements, any W given by any values of a and /? must also be apossible eigenvector with the same frequency. The possible eigenvectorsare therefore said to 'span' a two-dimensional sub-space of the 3N-dimensional space spanned by any general set of displacement vectorswa. The 3AT-dimensional vector specifies what will be called thegeneralized position of the molecule, or its 'position'. Note that S and Tcannot be parallel or the mode is not degenerate because 5 and T wouldthen simply correspond to vibrations of different amplitude and possiblydifferent phase.
In a two-dimensonal space we can choose any two non-parallelvectors and refer all other vectors in that space to this basis set. It isconvenient, but not necessary, to choose basis vectors which areorthogonal and of unit length. If So and To are two such orthonormalbasis vectors then
So-To = 0, S0-S0=l, TO-TO=\ (2.9)
It is now possible to represent any vector in the two-dimensionalsubspace by a two-component column matrix W and to represent theeffect of any operation P of the symmetry group on this vector as thepremultiplication of the matrix W by a 2 x 2 matrix P. From now onitalic boldface characters will represent vectors and roman boldfacecharacters will represent matrices.
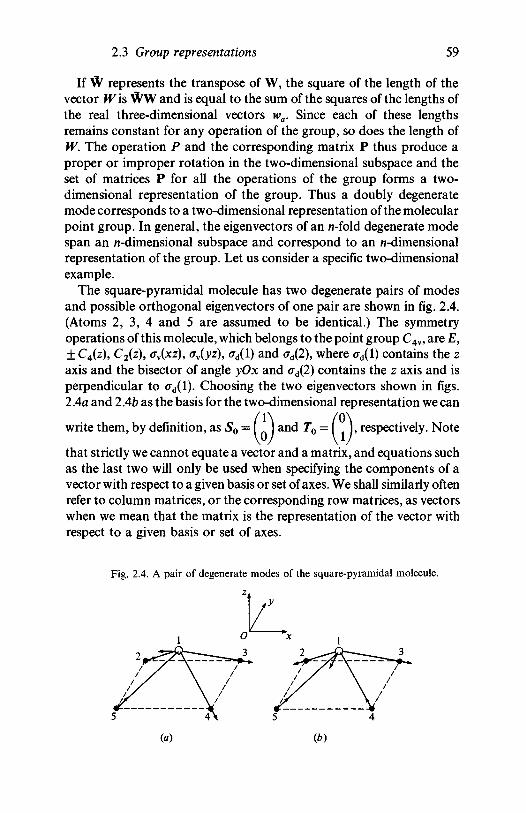
2.3 Group representations 59
If W represents the transpose of W, the square of the length of thevector Wis WW and is equal to the sum of the squares of the lengths ofthe real three-dimensional vectors wa. Since each of these lengthsremains constant for any operation of the group, so does the length ofW. The operation P and the corresponding matrix P thus produce aproper or improper rotation in the two-dimensional subspace and theset of matrices P for all the operations of the group forms a two-dimensional representation of the group. Thus a doubly degeneratemode corresponds to a two-dimensional representation of the molecularpoint group. In general, the eigenvectors of an n-fold degenerate modespan an n-dimensional subspace and correspond to an n-dimensionalrepresentation of the group. Let us consider a specific two-dimensionalexample.
The square-pyramidal molecule has two degenerate pairs of modesand possible orthogonal eigenvectors of one pair are shown in fig. 2.4.(Atoms 2, 3, 4 and 5 are assumed to be identical.) The symmetryoperations of this molecule, which belongs to the point group C4v, are E,±C4(z), C2(z), (Tv(xz), (Tv(yz), <rd(l) and ad(2), where ad(i) contains the zaxis and the bisector of angle yOx and <rd(2) contains the z axis and isperpendicular to <rd(l). Choosing the two eigenvectors shown in figs.2.4a and 2.4b as the basis for the two-dimensional representation we can
write them, by definition, as So = ( J and To = ( ), respectively. Note
that strictly we cannot equate a vector and a matrix, and equations suchas the last two will only be used when specifying the components of avector with respect to a given basis or set of axes. We shall similarly oftenrefer to column matrices, or the corresponding row matrices, as vectorswhen we mean that the matrix is the representation of the vector withrespect to a given basis or set of axes.
Fig. 2.4. A pair of degenerate modes of the square-pyramidal molecule.
4y
(a) (b)
60 Symmetry and normal modes of vibration
If we consider the operations of the group in turn we find that the2 x 2 matrices corresponding to them are as follows:
For example, the statement that the operation C4 converts theeigenvector So into the eigenvector To corresponds to the equation
-JX.K)and the statement that the operation av(xz) followed by the operation C4
is equivalent to the operation <rd(l) corresponds to the equations
C>v(xz) = <7d(l) (2.12a)
and
(0 - 1 \ / 1 0\ /0o; {2A2b)
The reader is encouraged first to construct the multiplication table forthe group C4v using the definitions of the operations and then to checkthat the matrices (2.10) do indeed form a representation.
2.3.2 Reducible, irreducible and equivalent representationsA particularly simple choice of basis was made for the
representation we have just given, but any two different linearcombinations of the two eigenvectors shown in figs. 2Aa and 2Ab could
be chosen as a basis, say X= ( x ) and Y = I 2 ) with respect to the old
basis, provided that they do not represent parallel vectors. By definition,
these two combinations would then become vectors I J and ( J with
respect to the new basis. Each operation P, which is represented by a2 x 2 matrix P in the old representation, will be represented by a new2 x 2 matrix P' in the new representation. It is important to considerwhether any basis could be chosen which would produce a set of
2.3 Group representations 61
representation matrices every one of which had the diagonal form
) (2.13)PI)
If this were possible, then for any two operations P and Q it would betrue that
FQ, /PI oy* o\jPiqi o \V° P2A 0 *2j V 0 p2q2)
and thus each of the sets of numbers px, q1 etc., and p2, q2 etc., wouldseparately form a one-dimensional representation of the group, i.e. thetwo-dimensional representation would be reducible to one-dimensionalrepresentations. It would also follow, however, that neither of the new
eigenvectors I } and ( j would be converted into a linear combination
of itself and the other by any of the symmetry operations of the group.This is contrary to the assumption that such a pair corresponds to adoubly degenerate mode. Thus the two-dimensional representationcorresponding to a doubly degenerate mode is irreducible; it cannot bereduced to two one-dimensional representations by choosing a newbasis. More generally, the n-dimensional representation correspondingto an /t-fold degenerate mode is irreducible in the sense that it cannot bereduced to two or more representations of dimension less than n.
Whether a representation of a group is reducible or not, the newmatrices P' form an alternative representation to the matrices P. Let the
original eigenvectors 5 0 and To take the form S'o = ( Ox) and\SOyJ
/ T \ / \T'o = I °* I with respect to the new basis. Then any vector w = I I with
K'J \tj
respect to the old basis takes the form w' = with respect to the
basis, where
tj
new
(2.15)/s\
Let I ! I represent a particular initial vector with respect to the old basis
/ s \and let I f I represent (still with respect to the old basis) the final vector
into which it is transformed by multiplying by the matrix P which
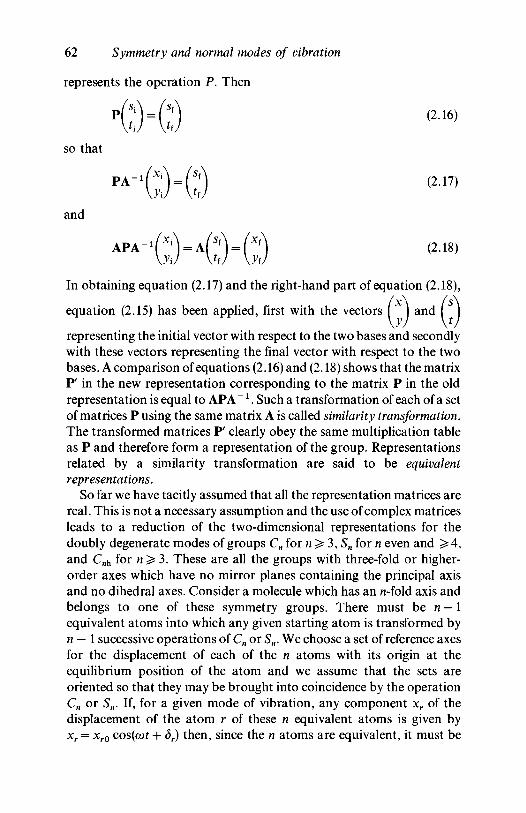
62 Symmetry and normal modes of vibration
represents the operation P. Then
so that
PA-'^'Wf) (2.17)
and
(2.18)
In obtaining equation (2.17) and the right-hand part of equation (2.18),
equation (2.15) has been applied, first with the vectors I I and
representing the initial vector with respect to the two bases and secondlywith these vectors representing the final vector with respect to the twobases. A comparison of equations (2.16) and (2.18) shows that the matrixF in the new representation corresponding to the matrix P in the oldrepresentation is equal to APA~ *. Such a transformation of each of a setof matrices P using the same matrix A is called similarity transformation.The transformed matrices F clearly obey the same multiplication tableas P and therefore form a representation of the group. Representationsrelated by a similarity transformation are said to be equivalentrepresentations.
So far we have tacitly assumed that all the representation matrices arereal. This is not a necessary assumption and the use of complex matricesleads to a reduction of the two-dimensional representations for thedoubly degenerate modes of groups Cn for n ̂ 3, Sn for n even and ^ 4 ,and Cnh for n ^ 3. These are all the groups with three-fold or higher-order axes which have no mirror planes containing the principal axisand no dihedral axes. Consider a molecule which has an n-fold axis andbelongs to one of these symmetry groups. There must be n - 1equivalent atoms into which any given starting atom is transformed byn — 1 successive operations of Cn or Sn. We choose a set of reference axesfor the displacement of each of the n atoms with its origin at theequilibrium position of the atom and we assume that the sets areoriented so that they may be brought into coincidence by the operationCn or Sn. If, for a given mode of vibration, any component xr of thedisplacement of the atom r of these n equivalent atoms is given byxr = xr0 cos(cot + dr) then, since the n atoms are equivalent, it must be
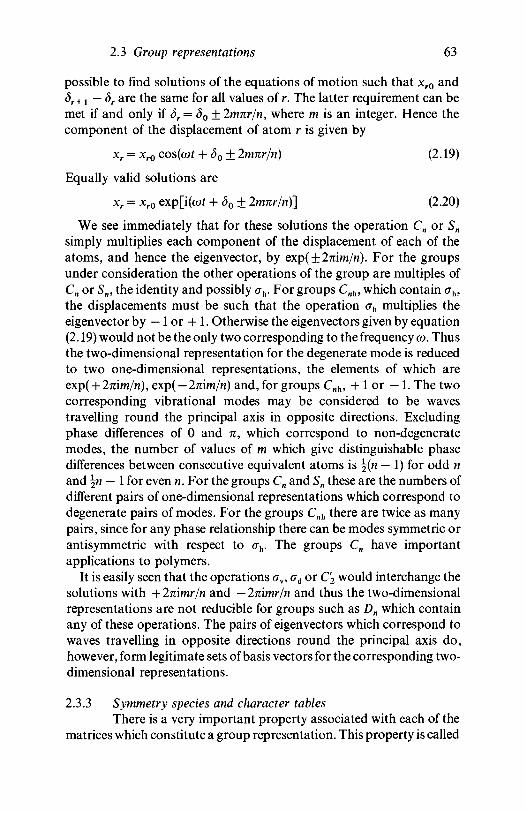
2.3 Group representations 63
possible to find solutions of the equations of motion such that xr0 and5r+l — 5r are the same for all values of r. The latter requirement can bemet if and only if dr = do± 2mnr/n9 where m is an integer. Hence thecomponent of the displacement of atom r is given by
xr = xr0 cos(cot + 30 ± 2mnr/n) (2.19)
Equally valid solutions are
xr = xr0 exp[i(cof + do± 2mnr/n)] (2.20)
We see immediately that for these solutions the operation Cn or Sn
simply multiplies each component of the displacement of each of theatoms, and hence the eigenvector, by Qxp(±2nim/n). For the groupsunder consideration the other operations of the group are multiples ofCn or Sn, the identity and possibly ah. For groups Cnh, which contain (jh,the displacements must be such that the operation ah multiplies theeigenvector by — 1 or + 1. Otherwise the eigenvectors given by equation(2.19) would not be the only two corresponding to the frequency co. Thusthe two-dimensional representation for the degenerate mode is reducedto two one-dimensional representations, the elements of which areexp( + 27iira/n), exp( — 2nim/n) and, for groups Cnh, + 1 or — 1. The twocorresponding vibrational modes may be considered to be wavestravelling round the principal axis in opposite directions. Excludingphase differences of 0 and n, which correspond to non-degeneratemodes, the number of values of m which give distinguishable phasedifferences between consecutive equivalent atoms is %(n — 1) for odd nand \n — 1 for even n. For the groups Cn and Sn these are the numbers ofdifferent pairs of one-dimensional representations which correspond todegenerate pairs of modes. For the groups Cnh there are twice as manypairs, since for any phase relationship there can be modes symmetric orantisymmetric with respect to <rh. The groups Cn have importantapplications to polymers.
It is easily seen that the operations <rv, crd or C2 would interchange thesolutions with +2nimr/n and —2nimr/n and thus the two-dimensionalrepresentations are not reducible for groups such as Dn which containany of these operations. The pairs of eigenvectors which correspond towaves travelling in opposite directions round the principal axis do,however, form legitimate sets of basis vectors for the corresponding two-dimensional representations.
2.3.3 Symmetry species and character tablesThere is a very important property associated with each of the
matrices which constitute a group representation. This property is called
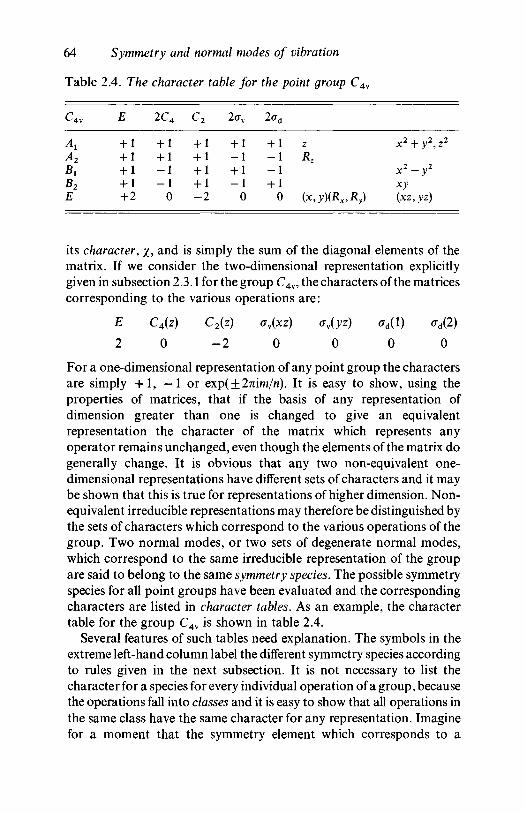
64 Symmetry and normal modes of vibration
Table 2.4. The character table for the point group C4v
C4v
A,A2
BiB7E
E
+ 1+ 1+ 1+ 1+ 2
2C4
+ 1+ 1- 1- 1
0
c2
+ 1+ 1+ 1+ 1- 2
2<7V
+ 1- 1+ 1- 1
0
+ 1- 1- 1+ 1
0
z
(x,y)(Rx,Ry)
x2 + y2,z2
x2-y2
xy(xz, yz)
its character, #, and is simply the sum of the diagonal elements of thematrix. If we consider the two-dimensional representation explicitlygiven in subsection 2.3.1 for the group C4v, the characters of the matricescorresponding to the various operations are:
E
2
C4(z)
0
C2(z)
-2
<jv(xz)
0oAyz)
0ffd(l)
0 0
For a one-dimensional representation of any point group the charactersare simply + 1 , —1 or exp(±27rim/rc). It is easy to show, using theproperties of matrices, that if the basis of any representation ofdimension greater than one is changed to give an equivalentrepresentation the character of the matrix which represents anyoperator remains unchanged, even though the elements of the matrix dogenerally change. It is obvious that any two non-equivalent one-dimensional representations have different sets of characters and it maybe shown that this is true for representations of higher dimension. Non-equivalent irreducible representations may therefore be distinguished bythe sets of characters which correspond to the various operations of thegroup. Two normal modes, or two sets of degenerate normal modes,which correspond to the same irreducible representation of the groupare said to belong to the same symmetry species. The possible symmetryspecies for all point groups have been evaluated and the correspondingcharacters are listed in character tables. As an example, the charactertable for the group C4v is shown in table 2.4.
Several features of such tables need explanation. The symbols in theextreme left-hand column label the different symmetry species accordingto rules given in the next subsection. It is not necessary to list thecharacter for a species for every individual operation of a group, becausethe operations fall into classes and it is easy to show that all operations inthe same class have the same character for any representation. Imaginefor a moment that the symmetry element which corresponds to a
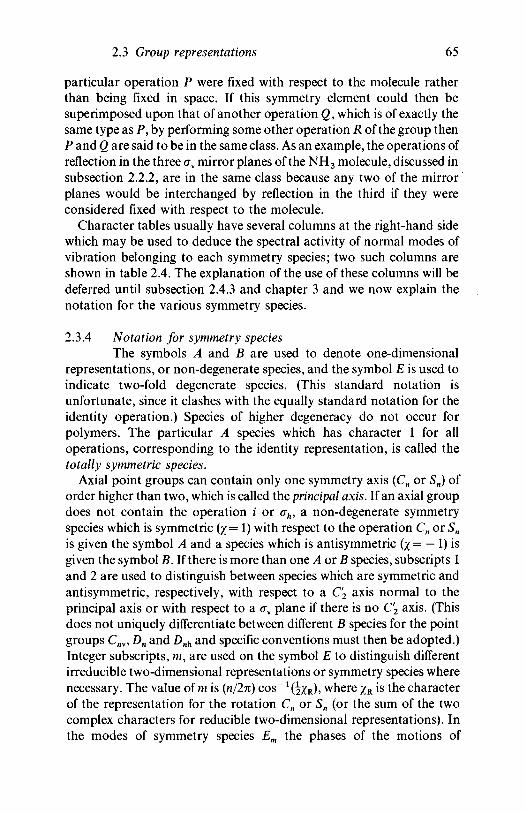
2.3 Group representations 65
particular operation P were fixed with respect to the molecule ratherthan being fixed in space. If this symmetry element could then besuperimposed upon that of another operation Q, which is of exactly thesame type as P, by performing some other operation R of the group thenP and Q are said to be in the same class. As an example, the operations ofreflection in the three <rv mirror planes of the NH3 molecule, discussed insubsection 2.2.2, are in the same class because any two of the mirrorplanes would be interchanged by reflection in the third if they wereconsidered fixed with respect to the molecule.
Character tables usually have several columns at the right-hand sidewhich may be used to deduce the spectral activity of normal modes ofvibration belonging to each symmetry species; two such columns areshown in table 2.4. The explanation of the use of these columns will bedeferred until subsection 2.4.3 and chapter 3 and we now explain thenotation for the various symmetry species.
2.3.4 Notation for symmetry speciesThe symbols A and B are used to denote one-dimensional
representations, or non-degenerate species, and the symbol E is used toindicate two-fold degenerate species. (This standard notation isunfortunate, since it clashes with the equally standard notation for theidentity operation.) Species of higher degeneracy do not occur forpolymers. The particular A species which has character 1 for alloperations, corresponding to the identity representation, is called thetotally symmetric species.
Axial point groups can contain only one symmetry axis (Cn or Sn) oforder higher than two, which is called the principal axis. If an axial groupdoes not contain the operation i or ah, a non-degenerate symmetryspecies which is symmetric (x = 1) with respect to the operation Cn or Sn
is given the symbol A and a species which is antisymmetric (x = — 1) isgiven the symbol B. If there is more than one A or B species, subscripts 1and 2 are used to distinguish between species which are symmetric andantisymmetric, respectively, with respect to a C2 axis normal to theprincipal axis or with respect to a av plane if there is no C2 axis. (Thisdoes not uniquely differentiate between different B species for the pointgroups Cm, Dn and Dnh and specific conventions must then be adopted.)Integer subscripts, m, are used on the symbol E to distinguish differentirreducible two-dimensional representations or symmetry species wherenecessary. The value of m is (n/ln) C O S ' ^ / R ) , where XR is the characterof the representation for the rotation Cn or Sn (or the sum of the twocomplex characters for reducible two-dimensional representations). Inthe modes of symmetry species Em the phases of the motions of
66 Symmetry and normal modes of vibration
corresponding atoms (atoms related by Cn or Sn) differ by 2mn/n (seesubsection 2.3.2). Species with degeneracy higher than two do not occurfor axial point groups.
If an axial point group, which we shall call G, contains the operationi ( = S2), i t s operations may be divided into two sets. One set consists ofthe identity and the real rotations of G; these together form a pointgroup which we shall call G'. The other set consists of the operations ofG' multiplied by i. G is said to be the direct product of the groups G' andCi9 since its elements are all the possible products of an element of G andan element of C{ (C{ contains only E and i). Such a group G has twosymmetry species for each species of the corresponding group G', andeach pair is given the same label as the corresponding species of G'together with an additional subscript g (gerade) or u (ungerade)according to whether the species is symmetric or antisymmetric,respectively, with respect to i.
Similarly, if an axial point group G contains <jh but not i it is the directproduct of the groups G' and Cs, where G' again contains the identityand the real rotations of the group and Cs contains E and <jh. The groupG again has two symmetry species for each species of the correspondinggroup G', and each pair is given the same label as the correspondingspecies of G' but single and double dashes are used to distinguishbetween species which are symmetric and antisymmetric, respectively,with respect to ah.
The groups D2 and D2h, which are important for polymers, eachcontain three C2 axes which are in different classes. The group D2 hasonly one A species but three different B species. If axes Oxyz are chosenin the molecule, Bx, B2 and B3 species modes are defined to be symmetricwith respect to the C2(z), C2(y) and C2(x) axes, respectively. The groupD2h is the direct product of D2 and Cs and the rules for subscripts u and gare as for the simpler axial groups. Unfortunately there is not alwaysagreement about the orientation of the set of axes Oxyz for a particularmolecule and great care must therefore be taken when specifyingsymmetry species for molecules belonging to these groups.
The groups Ct and Cs each have only two symmetry species, which arelabelled Ag or Au and A' and A", respectively, according to theirsymmetry with respect to i or <rh. The cubic and icosahedral groups willnot be considered, since they are not directly relevant to a study ofpolymers.
2.4 The number of normal modes of each symmetry speciesWe turn now to a consideration of how the character table for
the point group of a molecule may be used to calculate the number of
2.4 Number of normal modes of each symmetry species 67
normal modes of vibration of the molecule which belong to eachsymmetry species. The importance of being able to do this is that thesymmetry species of a normal mode determines its spectral activity, i.e.whether it is infrared or Raman active and, if it is, how the observedintensity depends on the polarization of the radiation involved. Weconsider first a 3A/-dimensional representation of the point group, whereN is, as usual, the total number of atoms in the molecule.
2.4.1 A reducible 3N-dimensional representation of the point groupImagine a set of coordinate axes Oxayaza to be defined with its
origin at the equilibrium position of atom a and let such a set be definedfor each of the atoms of the molecule. It is convenient for the moment tothink of these sets of axes as all being rectangular and all having the sameorientation in space, although this is not necessary for the argument andit will later be convenient to define the axes in a different way. Imaginenow a general set of displacements of the atoms from their equilibriumpositions. This set of displacements can be expressed in terms of a set of3 JV vectors, each of which is a unit vector parallel to one of the 3 AT axes ofthe N sets of axes of type Oxa, Oya or Oza. This set of vectors forms a basisfor a representation of the group in terms of 3 AT x 3 AT matrices.Equivalently, as already indicated in subsection 2.3.1, we can say thatthe 'position' of the molecule can be expressed in terms of 3Ncoordinates. Consider the effect of any one of the symmetry operations,say P, on the set of displacements. In performing the operation we leavethe sets of axes where they are in space and move all points in themolecule according to the rule appropriate to P. Since individual atomsof the same type are indistinguishable, the effect of the operation P is toproduce a different 'position' of the molecule, i.e. a different set of 3 ATcoordinates, each of which depends linearly on the original set of 3Ncoordinates. The operation P can thus be represented by a 3N x 3Nmatrix which, when it multiplies the 3AT x 1 column matrix of originalcoordinates, produces the 3N x 1 column matrix of new coordinates. Letus consider a simple example.
Fig. 2.5a illustrates a bent triatomic molecule, in which the twooutermost atoms, a and c, are identical (e.g. the water molecule). Thethree sets of axes are shown located at the equilibrium positions of theatoms. The Oz axes have been chosen parallel to the C2 axis and the Oxaxes are directed vertically out of the page. Fig. 2.5b illustrates a general'position', or set of displacements from equilibrium, and fig. 2.5cillustrates the new 'position' after the operation C2 is performed. If thecolumn vector I which represents the initial position of the molecule
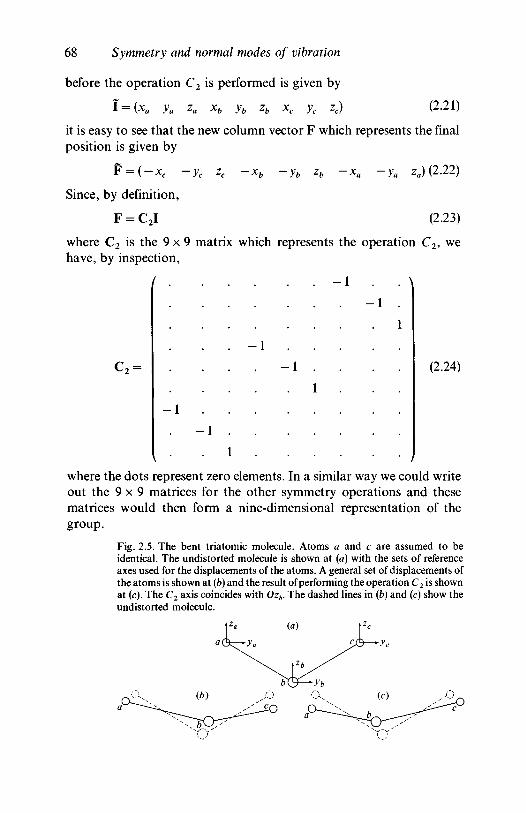
68 Symmetry and normal modes of vibration
before the operation C2 is performed is given by
i = (*« ya za *b yb zb *c yc *c) (2.21)
it is easy to see that the new column vector F which represents the finalposition is given by
F = ( -* c ~yc zc -xb -yb zb -xa -ya za)(222)
Since, by definition,
F = C2I (2.23)
where C2 is the 9 x 9 matrix which represents the operation C2, wehave, by inspection,
. - l
- 1
- 1
- 1
- 1
- 1
1
(2.24)
where the dots represent zero elements. In a similar way we could writeout the 9 x 9 matrices for the other symmetry operations and thesematrices would then form a nine-dimensional representation of thegroup.
Fig. 2.5. The bent triatomic molecule. Atoms a and c are assumed to beidentical. The undistorted molecule is shown at (a) with the sets of referenceaxes used for the displacements of the atoms. A general set of displacements ofthe atoms is shown at (b) and the result of performing the operation C2 is shownat (c). The C2 axis coincides with Ozb. The dashed lines in (b) and (c) show theundistorted molecule.
2.4 Number of normal modes of each symmetry species 69
2.4.2 Reduction of the 3N-dimensional representation by the useof normal coordinatesThe 'position' of any molecule can be expanded as a linear
combination of the 3N normal-mode eigenvectors, where the threetranslations and three rotations are regarded as normal modes of zerofrequency. This is because the 3N eigenvectors are linearly independent.It may be shown (see subsection 4.4.3) that if distances are measuredalong the axes Oxa etc. in units of length proportional to m~% where ma
is the mass of atom a, the eigenvectors are also orthogonal in the sensethat the scalar product of the 3iV-dimensional vectors for any twonormal modes is zero, provided that the vectors for degenerate modesare suitably chosen.
Suppose that the molecule is vibrating in the normal mode k and thatat a particular instant during the vibration its 'position' can be describedby the 3iV-dimensional displacement vector fcd, where
k* = (kxa kya
k z a k x b . . . k z 3 N ) (2.25)
where the kxa etc. are assumed to be the mass-weighted displacementsjust defined. We can define a unit vector
Dk = kd/lk (2.26a)
where
'*2 = I(fcxfl2 + Va
2 + \ 2 ) (2.26b)a
If we do this for each normal mode we can express the vector Icorresponding to any 'position' of the molecule as
I = U.D, + U2B2 + . . . + U3ND3N = £ UkBk (2.27)jt=i
i.e. as a weighted sum of orthogonal unit vectors whose 'directions' inthe generalized mass-weighted position space are those of theeigenvectors of the normal modes. Thus by taking these unit vectors asnew coordinates axes in the 'position' space the vector I can be expressedas
T = (U1U2...Ui...U9N) (2.28)
where U1, U2 etc. are called the normal coordinates of the 'position'. The'position' vector is now written I' in matrix form because although it isthe same vector as that represented by I its coordinates are expressed interms of a new set of axes which form the basis for a new representationof the group.
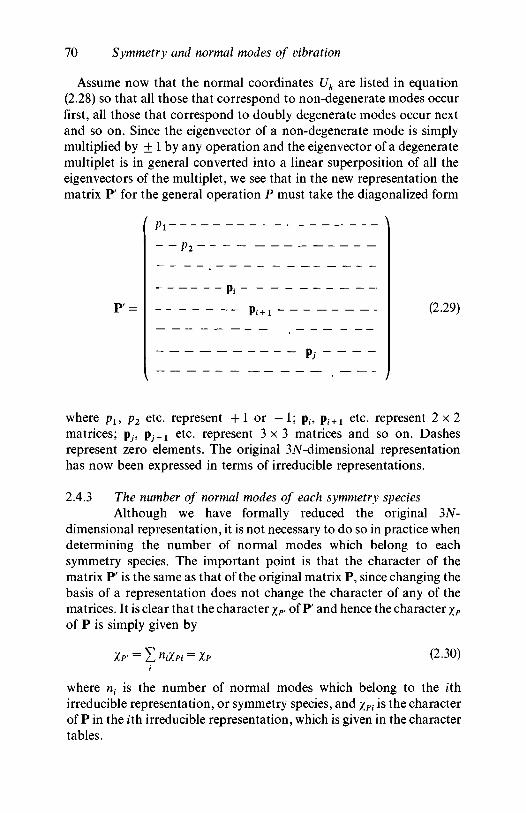
70 Symmetry and normal modes of vibration
Assume now that the normal coordinates Uk are listed in equation(2.28) so that all those that correspond to non-degenerate modes occurfirst, all those that correspond to doubly degenerate modes occur nextand so on. Since the eigenvector of a non-degenerate mode is simplymultiplied by ± 1 by any operation and the eigenvector of a degeneratemultiplet is in general converted into a linear superposition of all theeigenvectors of the multiplet, we see that in the new representation thematrix P' for the general operation P must take the diagonalized form
P' =
Pi-
Pi
p.p. + 1 (2.29)
where pl9 p2 etc. represent + 1 or — 1; p£, p/ + 1 etc. represent 2 x 2matrices; pJ? pJ + 1 etc. represent 3 x 3 matrices and so on. Dashesrepresent zero elements. The original 3AT-dimensional representationhas now been expressed in terms of irreducible representations.
2.4.3 The number of normal modes of each symmetry speciesAlthough we have formally reduced the original 3N-
dimensional representation, it is not necessary to do so in practice whendetermining the number of normal modes which belong to eachsymmetry species. The important point is that the character of thematrix P' is the same as that of the original matrix P, since changing thebasis of a representation does not change the character of any of thematrices. It is clear that the character XP> of P' and hence the character XPof P is simply given by
X r = y w X • = X (2.30)
where nt is the number of normal modes which belong to the fthirreducible representation, or symmetry species, and xPi is the characterof P in the fth irreducible representation, which is given in the charactertables.
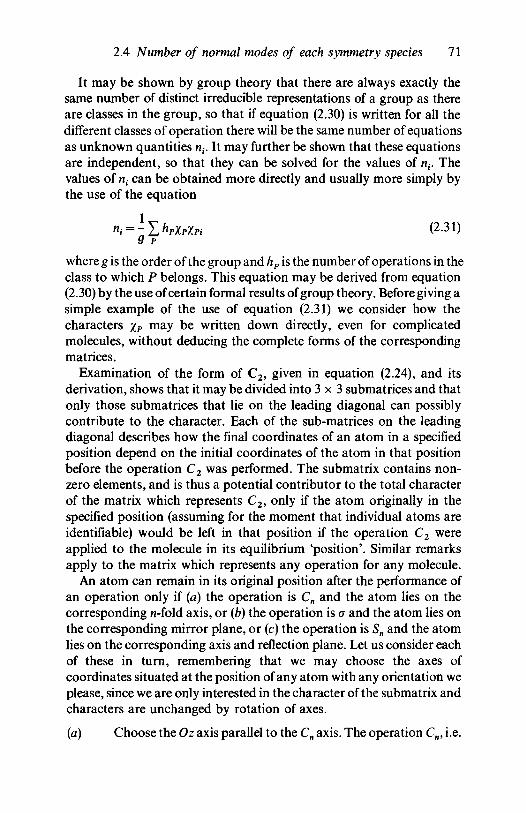
2.4 Number of normal modes of each symmetry species 71
It may be shown by group theory that there are always exactly thesame number of distinct irreducible representations of a group as thereare classes in the group, so that if equation (2.30) is written for all thedifferent classes of operation there will be the same number of equationsas unknown quantities nt. It may further be shown that these equationsare independent, so that they can be solved for the values of nt. Thevalues of ni can be obtained more directly and usually more simply bythe use of the equation
G p
where g is the order of the group and hp is the number of operations in theclass to which P belongs. This equation may be derived from equation(2.30) by the use of certain formal results of group theory. Before giving asimple example of the use of equation (2.31) we consider how thecharacters XP m a y be written down directly, even for complicatedmolecules, without deducing the complete forms of the correspondingmatrices.
Examination of the form of C2, given in equation (2.24), and itsderivation, shows that it may be divided into 3 x 3 submatrices and thatonly those submatrices that lie on the leading diagonal can possiblycontribute to the character. Each of the sub-matrices on the leadingdiagonal describes how the final coordinates of an atom in a specifiedposition depend on the initial coordinates of the atom in that positionbefore the operation C2 was performed. The submatrix contains non-zero elements, and is thus a potential contributor to the total characterof the matrix which represents C2, only if the atom originally in thespecified position (assuming for the moment that individual atoms areidentifiable) would be left in that position if the operation C2 wereapplied to the molecule in its equilibrium 'position'. Similar remarksapply to the matrix which represents any operation for any molecule.
An atom can remain in its original position after the performance ofan operation only if (a) the operation is Cn and the atom lies on thecorresponding n-fold axis, or (b) the operation is o and the atom lies onthe corresponding mirror plane, or (c) the operation is Sn and the atomlies on the corresponding axis and reflection plane. Let us consider eachof these in turn, remembering that we may choose the axes ofcoordinates situated at the position of any atom with any orientation weplease, since we are only interested in the character of the submatrix andcharacters are unchanged by rotation of axes.
(a) Choose the Oz axis parallel to the Cn axis. The operation Cn, i.e.
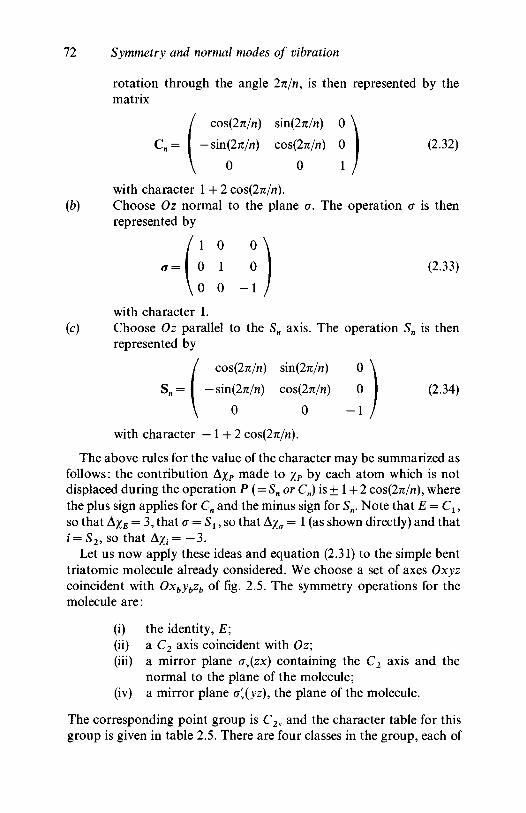
72 Symmetry and normal modes of vibration
rotation through the angle 2n/n, is then represented by thematrix
( cos(27i/n) sin(27i/n) 0
-sm(2n/n) cos(2n/n) 0 | (2.32)
0 0 1with character 1 + 2 COS(2T0I).
(b) Choose Oz normal to the plane a. The operation o is thenrepresented by
(2.33)
with character 1.(c) Choose Oz parallel to the Sn axis. The operation Sn is then
represented by
cos(27r/rc) sin(27i/n) 0
S n = | -sin(27i/n) cos(2n/n) 0 | (2.34)
0 0 - 1
with character —1+2 cos(27r/rc).
The above rules for the value of the character may be summarized asfollows: the contribution AxP made to XP by each atom which is notdisplaced during the operation P (= Sn or Cn) is + 1 + 2 cos(27i/rc), wherethe plus sign applies for Cn and the minus sign for Sn. Note that E = CX,so that AXE — 3, that a = S1,so that Axa = 1 (as shown directly) and thati = S2, so that Axt = — 3.
Let us now apply these ideas and equation (2.31) to the simple benttriatomic molecule already considered. We choose a set of axes Oxyzcoincident with Oxbybzb of fig. 2.5. The symmetry operations for themolecule are:
(i) the identity, E;(ii) a C2 axis coincident with Oz;(iii) a mirror plane cy(zx) containing the C2 axis and the
normal to the plane of the molecule;(iv) a mirror plane a[(yz), the plane of the molecule.
The corresponding point group is C2v and the character table for thisgroup is given in table 2.5. There are four classes in the group, each of
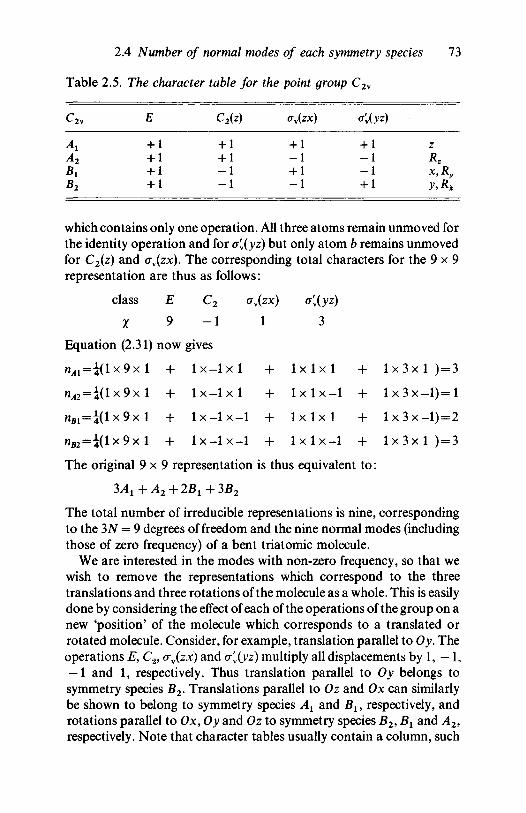
2.4 Number of normal modes of each symmetry species 73
Table 2.5. The character table for the point group C2v
c2v
A2
B2
E
+ 1+ 1+ 1+ 1
C2(z)
+ 1+ 1- 1- 1
(TW(ZX)
+ 1- 1+ 1- 1
<(yz)
+ 1
- l- l+ 1
zR*x,Ry
y,R*
which contains only one operation. All three atoms remain unmoved forthe identity operation and for af
v(yz) but only atom b remains unmovedfor C2(z) and <rv(zx). The corresponding total characters for the 9 x 9representation are thus as follows:
class E C2 ov(zx)
1 9 - 1 1 3
Equation (2.31) now gives
^ = 1 ( 1 x 9 x 1 + l x - l x l + l x l x l + 1 x 3 x 1 ) = 3
n ^ 2 = i ( l x 9 x l + l x - l x l + l x l x - 1 + I x 3 x - l ) = l
nBl=\(lx9xl + l x - l x - 1 + l x l x l + Ix3x-1) = 2
n B 2 = i ( l x 9 x l + l x - l x - 1 + l x l x - 1 + 1x3x1 ) = 3
The original 9 x 9 representation is thus equivalent to:
3AX +A2 + 2B1 + 3B2
The total number of irreducible representations is nine, correspondingto the 3N = 9 degrees of freedom and the nine normal modes (includingthose of zero frequency) of a bent triatomic molecule.
We are interested in the modes with non-zero frequency, so that wewish to remove the representations which correspond to the threetranslations and three rotations of the molecule as a whole. This is easilydone by considering the effect of each of the operations of the group on anew 'position' of the molecule which corresponds to a translated orrotated molecule. Consider, for example, translation parallel to Oy. Theoperations E, C2, (rv(zx) and (r'w(yz) multiply all displacements by 1, — 1,— 1 and 1, respectively. Thus translation parallel to Oy belongs tosymmetry species B2. Translations parallel to Oz and Ox can similarlybe shown to belong to symmetry species Ax and Bl9 respectively, androtations parallel to Ox, Oy and Oz to symmetry species B2, Bt and A2,respectively. Note that character tables usually contain a column, such
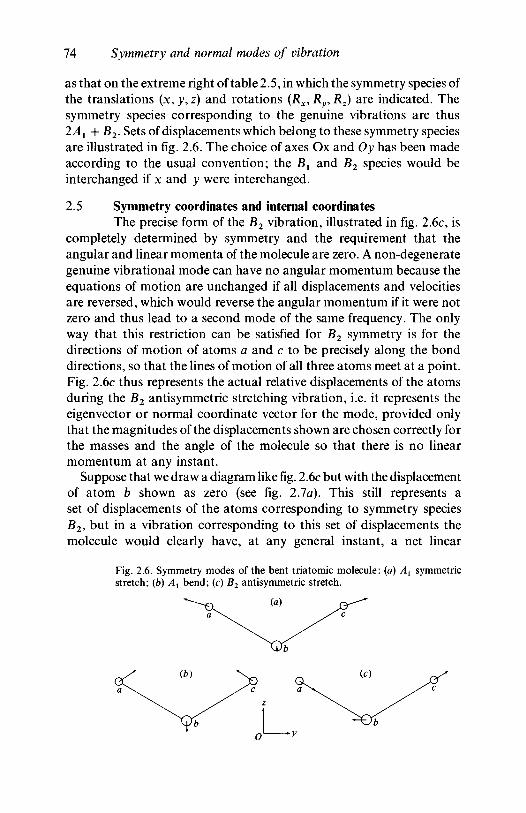
74 Symmetry and normal modes of vibration
as that on the extreme right of table 2.5, in which the symmetry species ofthe translations (x, y,z) and rotations (Rx, Ry, Rz) are indicated. Thesymmetry species corresponding to the genuine vibrations are thus2AX + B2. Sets of displacements which belong to these symmetry speciesare illustrated in fig. 2.6. The choice of axes Ox and Oy has been madeaccording to the usual convention; the Bx and B2 species would beinterchanged if x and y were interchanged.
2.5 Symmetry coordinates and internal coordinatesThe precise form of the B2 vibration, illustrated in fig. 2.6c, is
completely determined by symmetry and the requirement that theangular and linear momenta of the molecule are zero. A non-degenerategenuine vibrational mode can have no angular momentum because theequations of motion are unchanged if all displacements and velocitiesare reversed, which would reverse the angular momentum if it were notzero and thus lead to a second mode of the same frequency. The onlyway that this restriction can be satisfied for B2 symmetry is for thedirections of motion of atoms a and c to be precisely along the bonddirections, so that the lines of motion of all three atoms meet at a point.Fig. 2.6c thus represents the actual relative displacements of the atomsduring the B2 antisymmetric stretching vibration, i.e. it represents theeigenvector or normal coordinate vector for the mode, provided onlythat the magnitudes of the displacements shown are chosen correctly forthe masses and the angle of the molecule so that there is no linearmomentum at any instant.
Suppose that we draw a diagram like fig. 2.6c but with the displacementof atom b shown as zero (see fig. 2.7a). This still represents aset of displacements of the atoms corresponding to symmetry speciesB2, but in a vibration corresponding to this set of displacements themolecule would clearly have, at any general instant, a net linear
Fig. 2.6. Symmetry modes of the bent triatomic molecule: (a) Ax symmetricstretch; (b) Ax bend; (c) B2 antisymmetric stretch.
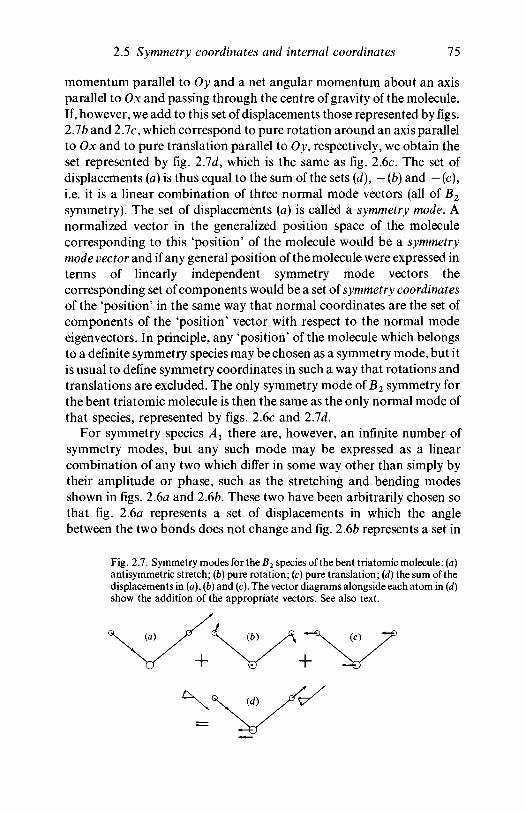
2.5 Symmetry coordinates and internal coordinates 75
momentum parallel to Oy and a net angular momentum about an axisparallel to Ox and passing through the centre of gravity of the molecule.If, however, we add to this set of displacements those represented by figs.2.1b and 2.7c, which correspond to pure rotation around an axis parallelto Ox and to pure translation parallel to Oy, respectively, we obtain theset represented by fig. 2.1d, which is the same as fig. 2.6c. The set ofdisplacements (a) is thus equal to the sum of the sets (d), — (b) and — (c),i.e. it is a linear combination of three normal mode vectors (all of B2
symmetry). The set of displacements (a) is called a symmetry mode. Anormalized vector in the generalized position space of the moleculecorresponding to this 'position' of the molecule would be a symmetrymode vector and if any general position of the molecule were expressed interms of linearly independent symmetry mode vectors thecorresponding set of components would be a set of symmetry coordinatesof the 'position' in the same way that normal coordinates are the set ofcomponents of the 'position' vector with respect to the normal modeeigenvectors. In principle, any 'position' of the molecule which belongsto a definite symmetry species may be chosen as a symmetry mode, but itis usual to define symmetry coordinates in such a way that rotations andtranslations are excluded. The only symmetry mode of B2 symmetry forthe bent triatomic molecule is then the same as the only normal mode ofthat species, represented by figs. 2.6c and 2Jd.
For symmetry species Ax there are, however, an infinite number ofsymmetry modes, but any such mode may be expressed as a linearcombination of any two which differ in some way other than simply bytheir amplitude or phase, such as the stretching and bending modesshown in figs. 2.6a and 2.6ft. These two have been arbitrarily chosen sothat fig. 2.6a represents a set of displacements in which the anglebetween the two bonds does not change and fig. 2.6b represents a set in
Fig. 2.7. Symmetry modes for the B2 species of the bent triatomic molecule: (a)antisymmetric stretch; (b) pure rotation; (c) pure translation; (d) the sum of thedisplacements in (a), (b) and (c). The vector diagrams alongside each atom in (d)show the addition of the appropriate vectors. See also text.
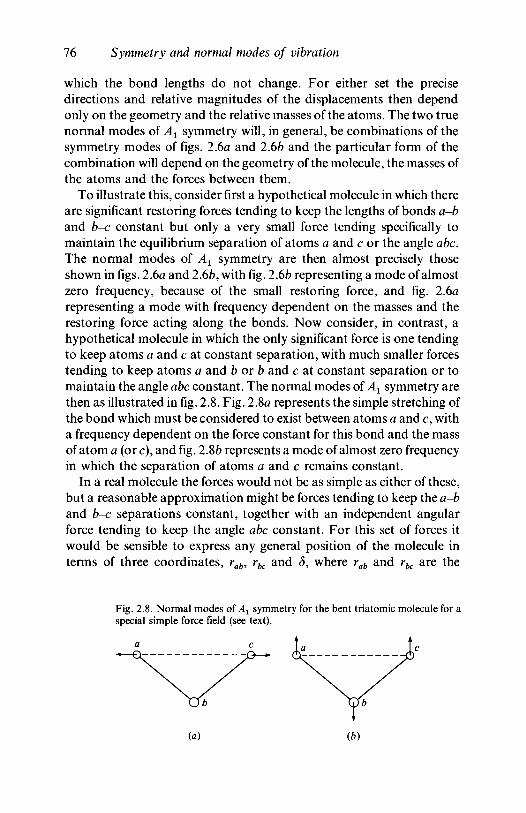
76 Symmetry and normal modes of vibration
which the bond lengths do not change. For either set the precisedirections and relative magnitudes of the displacements then dependonly on the geometry and the relative masses of the atoms. The two truenormal modes of Ax symmetry will, in general, be combinations of thesymmetry modes of figs. 2.6a and 2.6b and the particular form of thecombination will depend on the geometry of the molecule, the masses ofthe atoms and the forces between them.
To illustrate this, consider first a hypothetical molecule in which thereare significant restoring forces tending to keep the lengths of bonds a-band b-c constant but only a very small force tending specifically tomaintain the equilibrium separation of atoms a and c or the angle abc.The normal modes of Ax symmetry are then almost precisely thoseshown in figs. 2.6a and 2.6b, with fig. 2.6b representing a mode of almostzero frequency, because of the small restoring force, and fig. 2.6arepresenting a mode with frequency dependent on the masses and therestoring force acting along the bonds. Now consider, in contrast, ahypothetical molecule in which the only significant force is one tendingto keep atoms a and c at constant separation, with much smaller forcestending to keep atoms a and b or b and c at constant separation or tomaintain the angle abc constant. The normal modes of Ax symmetry arethen as illustrated in fig. 2.8. Fig. 2.8a represents the simple stretching ofthe bond which must be considered to exist between atoms a and c, witha frequency dependent on the force constant for this bond and the massof atom a (or c), and fig. 2.8b represents a mode of almost zero frequencyin which the separation of atoms a and c remains constant.
In a real molecule the forces would not be as simple as either of these,but a reasonable approximation might be forces tending to keep the a-band b-c separations constant, together with an independent angularforce tending to keep the angle abc constant. For this set of forces itwould be sensible to express any general position of the molecule interms of three coordinates, rab, rbc and S, where rab and rbc are the
Fig. 2.8. Normal modes of Al symmetry for the bent triatomic molecule for aspecial simple force field (see text).
(a) (b)
2.5 Symmetry coordinates and internal coordinates 11
increases in length of the corresponding bonds and S is the increase inthe angle abc. Such a set of coordinates is called a set of internalcoordinates because it is not possible to express any translational orrotatonal motion of the molecule as a whole (i.e. any external motion) interms of them. A different set of internal coordinates would be^1 = rab + rbo & a n ( i #2 = rab - rbo a n d t n e s e latter would be a set ofinternal symmetry coordinates, since the set of displacements of fig. 2.6ahas R2 = S = 0, the set of fig. 2.6b has Rx =R2 = 0 and the set of fig. 2.6chas S = R1 = 0, so that each of the symmetry modes has only one non-zero internal symmetry coordinate.
The main reason for introducing symmetry coordinates is that if theyare used as the basis of a representation of the group the calculation ofthe normal mode frequencies is made easier. The use of internalsymmetry coordinates enables a further simplification in the calculationand, of course, eliminates the translations and rotations from theproblem at the outset. We shall briefly discuss the use of symmetry andinternal coordinates for the calculation of the frequencies of normalmodes in chapter 4 but consider here a secondary use of symmetrycoordinates.
It is often easy to write down the possible symmetry mode vectors byinspection, because each can readily be associated with a simple type ofmotion of certain atoms in the molecule, as in the illustrations just given.Under certain circumstances, i.e. for particular values of the masses andforce constants, these symmetry modes approximate quite closely totrue normal modes of the corresponding symmetry species. They maythus be used to describe the normal modes when the purpose is only todistinguish between two normal modes of the same symmetry speciesand not to describe them accurately. Let us consider a further example.
Fig. 2.9 shows three symmetry modes of Ag species for the ethylenemolecule. The reader is encouraged to check that this molecule belongsto point group Z)2h
a n d that there are three genuine normal modes of Ag
symmetry. Since the three symmetry modes illustrated are independent(only (a) involves displacements of carbon atoms and the displacementsof the H atoms in (b) are at right angles to those in (c)), the true normalmode vectors of Ag symmetry must be linear combinations of thesethree. The masses of the hydrogen atoms are, however, very much lowerthan those of the carbon atoms and, since the restoring force for anglebending is very much smaller than that for bond stretching, the threenormal modes are not very different from the symmetry modes shown.The true normal mode which involves mainly C—H stretching will,however, obviously involve a small amount of C = C stretching, sincethe corresponding symmetry mode could only be the true normal mode
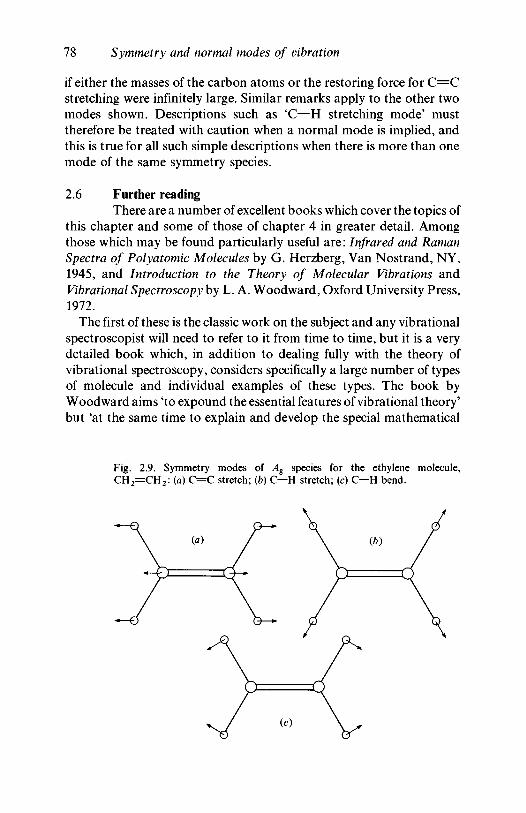
78 Symmetry and normal modes of vibration
if either the masses of the carbon atoms or the restoring force for C = Cstretching were infinitely large. Similar remarks apply to the other twomodes shown. Descriptions such as 'C—H stretching mode' musttherefore be treated with caution when a normal mode is implied, andthis is true for all such simple descriptions when there is more than onemode of the same symmetry species.
2.6 Further readingThere are a number of excellent books which cover the topics of
this chapter and some of those of chapter 4 in greater detail. Amongthose which may be found particularly useful are: Infrared and RamanSpectra of Polyatomic Molecules by G. Herzberg, Van Nostrand, NY,1945, and Introduction to the Theory of Molecular Vibrations andVibrational Spectroscopy by L. A. Woodward, Oxford University Press,1972.
The first of these is the classic work on the subject and any vibrationalspectroscopist will need to refer to it from time to time, but it is a verydetailed book which, in addition to dealing fully with the theory ofvibrational spectroscopy, considers specifically a large number of typesof molecule and individual examples of these types. The book byWoodward aims 'to expound the essential features of vibrational theory'but 'at the same time to explain and develop the special mathematical
Fig. 2.9. Symmetry modes of Ag species for the ethylene molecule,C H 2 = C H 2 : (a) C = C stretch; (b) C—H stretch; (c) C—U bend.

2.6 Further reading 79
ideas and methods involved'. This includes a treatment of the relevantproperties of matrices. A more general book on this latter topic whichmay be found useful is Matrix Theory for Physicists by J. Heading,Longmans, Green and Co., London, 1958.
The reader will by now have realized that access to a set of charactertables is essential for the vibrational spectroscopist. A handycompendium of such tables and much other very useful material relatingto molecular spectroscopy and group theory is Point Group CharacterTables and Related Data by J. A. Salthouse and M. J. Ware, CambridgeUniversity Press, 1972.
The vibrational modes of polymers
3.1 The vibrations of regular polymer chains3.1.1 Introduction
It has been pointed out already, in section 1.3, that the spectraof polymers are a great deal simpler than might at first be expected,because of the repetitive nature of the structure of the polymer chain. Inthis section we wish to make the arguments presented earlier moreprecise by first considering the vibrations of a single perfectly regularpolymer chain.
We define a perfectly regular chain to be one with which a straight linecan be associated in such a way that all translations of the chain parallelto this line by integral multiples of some basic distance are symmetryoperations, i.e. they bring the chain into exact coincidence with itselfwhen the indistinguishability of all atoms of the same type is taken intoaccount. Such a polymer chain cannot exist in reality, since it wouldhave to be of infinite length, but in polymer crystals there areconsiderable lengths of chain for which such translations may beconsidered to be symmetry operations to a first approximation. Even inthe non-crystalline regions of solid polymers there can sometimes beappreciable lengths of such straight chains. Since the interactionsbetween the atoms in the same chain are often, but not always,considerably greater than those between the atoms in adjacent chains,the isolated perfectly regular polymer chain is a good starting point forthe discussion of the normal vibrations and vibrational spectra ofpolymers. The effects of interactions between chains in a crystal will beconsidered in the next section and the effects of departures from perfectregularity in the next chapter.
In the remainder of this chapter we shall restrict attention to thelimited set of vibrational modes of regular polymer chains to which allinfrared- or Raman-active modes belong. These are modes in whichcorresponding atoms in all translational repeat units of the chain vibratein phase with each other. In anticipation of the next subsection we shallcall these the factor group modes. As explained in section 1.3, all theother modes of a regular chain are definitely inactive for both infraredabsorption and Raman scattering, because the interactions of thedifferent repeat units with the radiation cancel out. Whether any one ofthe factor group modes is in fact active in infrared absorption or Raman
80
3.1 The vibrations of regular polymer chains 81
scattering depends on its symmetry species. We consider now how todetermine the symmetry species of the factor group modes and deferuntil the next chapter a discussion of the selection rules which determinethe activities of the modes of various symmetry species. The results of theapplication of the selection rules will, however, sometimes be quoted indiscussing the illustrative examples.
3.1.2 Line group and factor group: polyethyleneConsider the perfect polyethylene chain, a section of which is
illustrated in fig. 3.1. There are six different ways in which theorientation of the reference axes Oxyz may be chosen. (The handednessof the axes is not important here.) Different authors make differentchoices and this affects the designations of the 2?-type symmetry species,as pointed out in subsection 2.3.4. The choice of orientation in fig. 3.1 ismade so that the comparison of the symmetry of the vinyl polymers withthat of polyethylene in the next subsection is simplified. Later in thissection the relationships between the species designations for all thepossible orientations of the axes are tabulated (table 3.2). Thetranslational repeat unit of any chain is the smallest unit from which thewhole molecule can be constructed by repeating the unit at intervals ofits length, a, along the direction of the molecule without rotating orchanging it in any way. For polyethylene it is two methylene (—CH2—)groups, whereas the chemical repeat unit is one methylene group. Thedistance a is called the translational period of the molecule.
The notation for the symmetry operations shown in fig. 3.1 is anextension of that already used for point groups. For instance, C2(z, k)and C2 (z, k) are different C2 axes parallel to Oz in repeat unit k. Symbolsfor symmetry elements with and without a superscript + will be used inthis section to indicate the two operations of the same type for aparticular translational repeat unit. A similar notation will be used forthe two carbon atoms of the repeat unit. The only other operations thatrequire further explanation, since they are different from those involvedin point groups, are T(x), c%(xy) and C2(x). The symbol T(x) stands for atranslation axis and the corresponding operation is translation parallelto Ox through a distance a. The symbol crg(xy) stands for a glide planeand the corresponding operation is reflection in the plane Oxy followedby translation parallel to Ox through a/2. The symbol Cn(x) stands for ascrew axis and the corresponding operation is rotation through theangle 2n/n about Ox followed by translation parallel to Ox by a/n. If it isnecessary to specify the translational part of ag(xy) or Cn(x) the symbolsag(xy,d) or Cn(x,d) will be used, where d is the distance through whichthe translation is made. Since there are an infinite number of symmetry
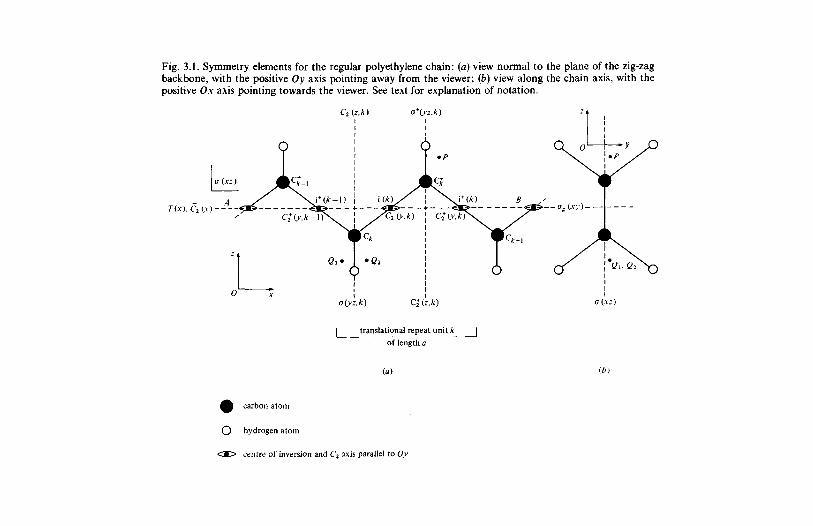
Fig. 3.1. Symmetry elements for the regular polyethylene chain: {a) view normal to the plane of the zig-zagbackbone, with the positive Oy axis pointing away from the viewer; (b) view along the chain axis, with thepositive Ox axis pointing towards the viewer. See text for explanation of notation.
C2 (z.k) o+(yz,k)
oiyz.k)
| translational repeat unit k |of length a
(a)
a(xz)
(b)
^ft carbon atom
O hydrogen atom
<X> centre of inversion and C2 axis parallel to Oy
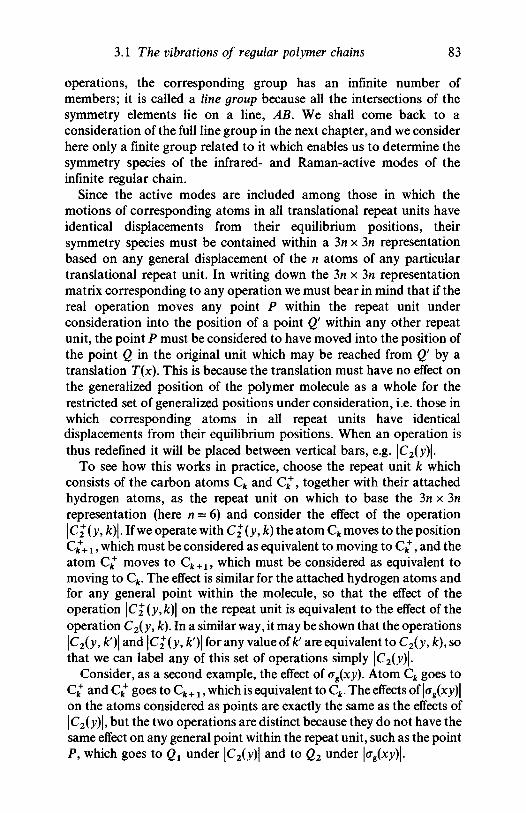
3.1 The vibrations of regular polymer chains 83
operations, the corresponding group has an infinite number ofmembers; it is called a line group because all the intersections of thesymmetry elements lie on a line, AB. We shall come back to aconsideration of the full line group in the next chapter, and we considerhere only a finite group related to it which enables us to determine thesymmetry species of the infrared- and Raman-active modes of theinfinite regular chain.
Since the active modes are included among those in which themotions of corresponding atoms in all translational repeat units haveidentical displacements from their equilibrium positions, theirsymmetry species must be contained within a 3n x 3n representationbased on any general displacement of the n atoms of any particulartranslational repeat unit. In writing down the 3n x 3n representationmatrix corresponding to any operation we must bear in mind that if thereal operation moves any point P within the repeat unit underconsideration into the position of a point Qf within any other repeatunit, the point P must be considered to have moved into the position ofthe point Q in the original unit which may be reached from Q' by atranslation T(x). This is because the translation must have no effect onthe generalized position of the polymer molecule as a whole for therestricted set of generalized positions under consideration, i.e. those inwhich corresponding atoms in all repeat units have identicaldisplacements from their equilibrium positions. When an operation isthus redefined it will be placed between vertical bars, e.g. |C2()0|.
To see how this works in practice, choose the repeat unit k whichconsists of the carbon atoms Ck and Ck
+, together with their attachedhydrogen atoms, as the repeat unit on which to base the 3n x 3nrepresentation (here n = 6) and consider the effect of the operation|C^"(y, fc)|. If we operate with C2(y, k) the atom Ck moves to the positionCk
++ x, which must be considered as equivalent to moving to Ck+, and the
atom Ck+ moves to Ck + 1 , which must be considered as equivalent to
moving to Ck. The effect is similar for the attached hydrogen atoms andfor any general point within the molecule, so that the effect of theoperation \C2 (y,k)\ on the repeat unit is equivalent to the effect of theoperation C2(y, k). In a similar way, it may be shown that the operations\C2{y, k')\ and \C2 (y, k')\ for any value of k! are equivalent to C2(y, k), sothat we can label any of this set of operations simply |C2()0|.
Consider, as a second example, the effect of og(xy). Atom Ck goes toCk
+ and Ck+ goes to Ck + x, which is equivalent to Ck. The effects of |<7g(xj0|
on the atoms considered as points are exactly the same as the effects of|C2(y)|, but the two operations are distinct because they do not have thesame effect on any general point within the repeat unit, such as the pointP, which goes to Qx under \C2(y)\ and to Q2 under |<rg(xj0|.
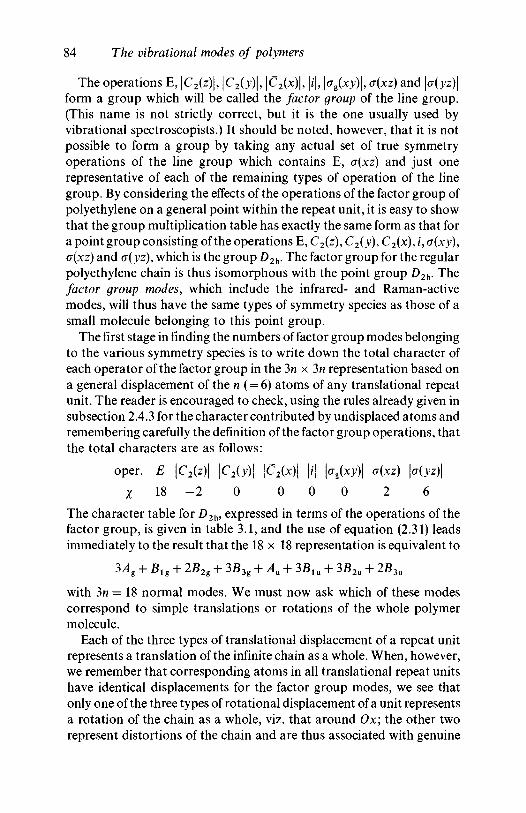
84 The vibrational modes of polymers
The operations E, |C2(z)|, \C2(y)\, |C2(x)|, |i|, |crg(jcy)|, ff(xz) and |<r( j,z)|form a group which will be called the factor group of the line group.(This name is not strictly correct, but it is the one usually used byvibrational spectroscopists.) It should be noted, however, that it is notpossible to form a group by taking any actual set of true symmetryoperations of the line group which contains E, o(xz) and just onerepresentative of each of the remaining types of operation of the linegroup. By considering the effects of the operations of the factor group ofpolyethylene on a general point within the repeat unit, it is easy to showthat the group multiplication table has exactly the same form as that fora point group consisting of the operations E, C2(z), C2(y), C2(x), i, v(xy),o{xz) and <r(yz), which is the group D2h. The factor group for the regularpolyethylene chain is thus isomorphous with the point group D2h. Thefactor group modes, which include the infrared- and Raman-activemodes, will thus have the same types of symmetry species as those of asmall molecule belonging to this point group.
The first stage in finding the numbers of factor group modes belongingto the various symmetry species is to write down the total character ofeach operator of the factor group in the 3n x 3n representation based ona general displacement of the n (= 6) atoms of any translational repeatunit. The reader is encouraged to check, using the rules already given insubsection 2.4.3 for the character contributed by undisplaced atoms andremembering carefully the definition of the factor group operations, thatthe total characters are as follows:
oper. E \C2(z)\ \C2(y)\ |C2(x)| \i\ \ag(xy)\ o{xz) \<j(yz)\
X 18 - 2 0 0 0 0 2 6
The character table for D2h, expressed in terms of the operations of thefactor group, is given in table 3.1, and the use of equation (2.31) leadsimmediately to the result that the 18 x 18 representation is equivalent to
3Ag + Blg + 2B2g + 3£3g + AU + 3Blu + 3B2u + 2B3u
with 3n = 18 normal modes. We must now ask which of these modescorrespond to simple translations or rotations of the whole polymermolecule.
Each of the three types of translational displacement of a repeat unitrepresents a translation of the infinite chain as a whole. When, however,we remember that corresponding atoms in all translational repeat unitshave identical displacements for the factor group modes, we see thatonly one of the three types of rotational displacement of a unit representsa rotation of the chain as a whole, viz. that around Ox; the other tworepresent distortions of the chain and are thus associated with genuine
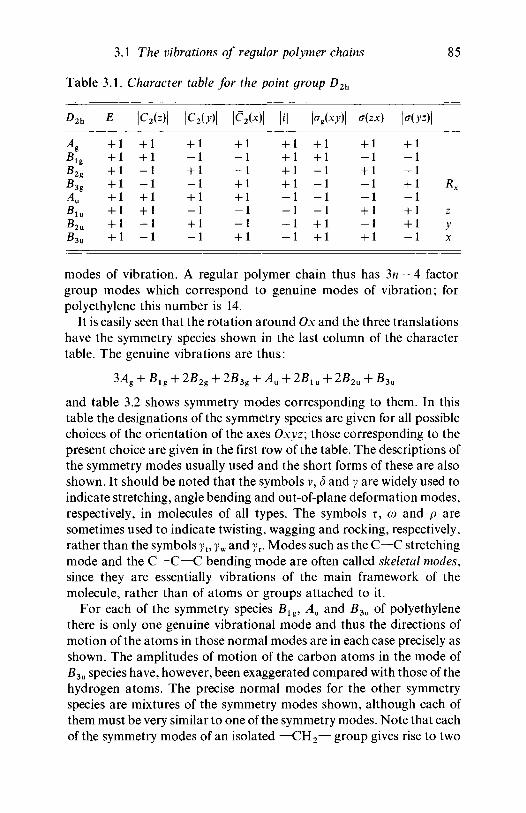
3.1 The vibrations of regular polymer chains
Table 3.1. Character table for the point group D2h
85
D E
Ag + 1
B2g + 1B3g + 1Au + 1B l u + 1B2u + 1B3u + 1
C2(z)\
+ 1+ 1— 1— 1+ 1+ 1- 1— 1
\c2(y)\
+ i- l+ i- l+ i- l+ i- l
C (x\\
+ 1- 1- 1+ 1+ 1- 1- 1+ 1
i
+ 1+ 1+ 1+ ]— 1—;- ]
— .
°g(xy)
+ 1+ 1- 1- 1
[ - 1
I - 11 + 1i + 1
| o{zx) o{yz)\
+ 1 +1
+ 1 -- 1 +
+ 1 +- 1 ++ 1
I Rx
zi yI X
modes of vibration. A regular polymer chain thus has 3n — 4 factorgroup modes which correspond to genuine modes of vibration; forpolyethylene this number is 14.
It is easily seen that the rotation around Ox and the three translationshave the symmetry species shown in the last column of the charactertable. The genuine vibrations are thus:
3Ag + Blg
2B2g
2B3g + Au 2Bla + 2B2
and table 3.2 shows symmetry modes corresponding to them. In thistable the designations of the symmetry species are given for all possiblechoices of the orientation of the axes Oxyz; those corresponding to thepresent choice are given in the first row of the table. The descriptions ofthe symmetry modes usually used and the short forms of these are alsoshown. It should be noted that the symbols v, S and y are widely used toindicate stretching, angle bending and out-of-plane deformation modes,respectively, in molecules of all types. The symbols i, co and p aresometimes used to indicate twisting, wagging and rocking, respectively,rather than the symbols yt, yw and yr. Modes such as the C—C stretchingmode and the C—C—C bending mode are often called skeletal modes,since they are essentially vibrations of the main framework of themolecule, rather than of atoms or groups attached to it.
For each of the symmetry species Blg, Au and B3u of polyethylenethere is only one genuine vibrational mode and thus the directions ofmotion of the atoms in those normal modes are in each case precisely asshown. The amplitudes of motion of the carbon atoms in the mode ofB3u species have, however, been exaggerated compared with those of thehydrogen atoms. The precise normal modes for the other symmetryspecies are mixtures of the symmetry modes shown, although each ofthem must be very similar to one of the symmetry modes. Note that eachof the symmetry modes of an isolated —CH2— group gives rise to two
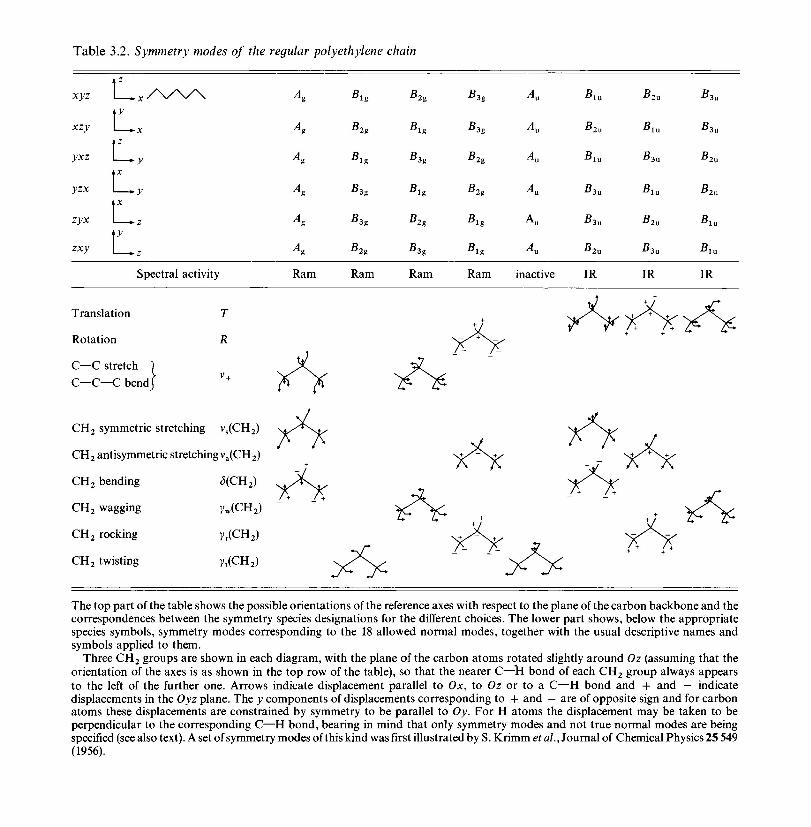
Table 3.2. Symmetry modes of the regular polyethylene chain
xyz
xzy
yxz
yzx
zyx
zxy
11,11,1 Zt l ,11,11,11.
Big
B2g
Big
B3g
B3g
B2g
Ram
B2g
Big
B 3 g
Big
B2g
B3g
Ram
B 3 g
B3g
B2g
B2g
Big
Big
Ram
Aa
Au
Au
Au
Au
Au
inactive
Biu
B2u
Biu
B3u
B3u
B2u
IR
B2U
Biu
B3u
Biu
B2u
B3u
IR
B3u
B3U
B2U
B2U
Biu
B,u
IRSpectral activity Ram
Translation
Rotation
C—C stretch ")
C—C—C bendj
T
R
CH2 symmetric stretching vs(CH2)
CH2 antisymmetric stretching va(CH2)
CH2 bending <5(CH2)
CH2 wagging Tw(CH2)
CH2 rocking yr(CH2)
CH2 twisting ?t(CH2)
The top part of the table shows the possible orientations of the reference axes with respect to the plane of the carbon backbone and thecorrespondences between the symmetry species designations for the different choices. The lower part shows, below the appropriatespecies symbols, symmetry modes corresponding to the 18 allowed normal modes, together with the usual descriptive names andsymbols applied to them.
Three CH2 groups are shown in each diagram, with the plane of the carbon atoms rotated slightly around Oz (assuming that theorientation of the axes is as shown in the top row of the table), so that the nearer C—"H bond of each CH2 group always appearsto the left of the further one. Arrows indicate displacement parallel to Ox, to Oz or to a C—H bond and + and — indicatedisplacements in the Oyz plane. The y components of displacements corresponding to + and — are of opposite sign and for carbonatoms these displacements are constrained by symmetry to be parallel to Oy. For H atoms the displacement may be taken to beperpendicular to the corresponding C—H bond, bearing in mind that only symmetry modes and not true normal modes are beingspecified (see also text). A set of symmetry modes of this kind was first illustrated by S. Krimm et al., Journal of Chemical Physics 25 549(1956).
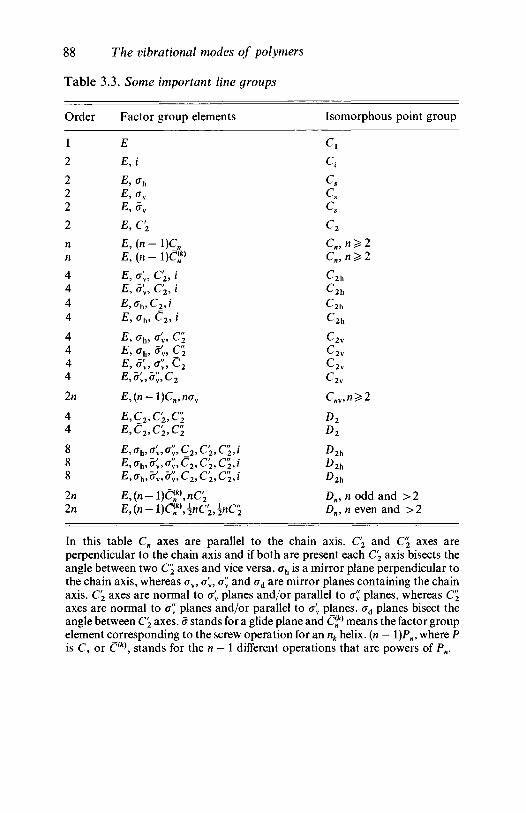
88 The vibrational modes of polymers
Table 3.3. Some important line groups
Order
1
2
222
2
4444
4444
2n
44
888
i
Factor group elements
E
E,i
E.%
E,C2
E, (n - 1)Q
E, < , C2, iIL, (Tv, C 2 , I
E, c^, C 2 , i£ , (Th, C 2 , i
E, ah9 e'v, C"2
xi , (7^5 ^v> ^ 2
£,(n-l)Cn,n<rv
£» 0h> "•« "•« C 2 , C 2 , C 2 , i•E, Ch> ^v> <Jv> C 2 , C 2 , C 2 , j
£,(«-l)C«,nQ i
Isomorphous point group
c!
c2
C^n^2
c2 h
c2 hc 2 hc2 vc 2 v
ellCm,n>2
1:Dn, n odd and >2/)„, n even and >2
In this table Cn axes are parallel to the chain axis. C2 and C"2 axes areperpendicular to the chain axis and if both are present each C2 axis bisects theangle between two C"2 axes and vice versa. crh is a mirror plane perpendicular tothe chain axis, whereas <rv, <T'V, C" and od are mirror planes containing the chainaxis. C2 axes are normal to o'v planes and/or parallel to a^ planes, whereas C"2
axes are normal to <r" planes and/or parallel to a'v planes. ad planes bisect theangle between C'2 axes, a stands for a glide plane and Cjf) means the factor groupelement corresponding to the screw operation for an nk helix, (n — l)Pn9 where Pis C, or C{k\ stands for the n — 1 different operations that are powers of Pn.
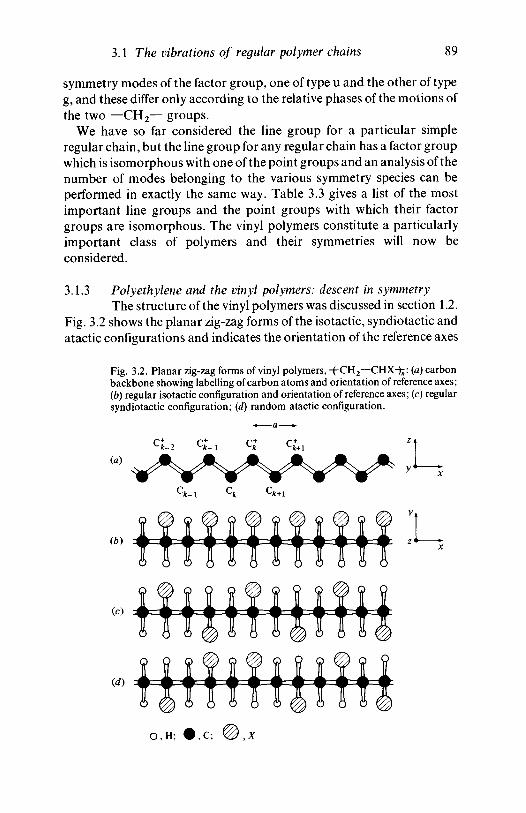
3.1 The vibrations of regular polymer chains 89
symmetry modes of the factor group, one of type u and the other of typeg, and these differ only according to the relative phases of the motions ofthe two —CH2— groups.
We have so far considered the line group for a particular simpleregular chain, but the line group for any regular chain has a factor groupwhich is isomorphous with one of the point groups and an analysis of thenumber of modes belonging to the various symmetry species can beperformed in exactly the same way. Table 3.3 gives a list of the mostimportant line groups and the point groups with which their factorgroups are isomorphous. The vinyl polymers constitute a particularlyimportant class of polymers and their symmetries will now beconsidered.
3.1.3 Polyethylene and the vinyl polymers: descent in symmetryThe structure of the vinyl polymers was discussed in section 1.2.
Fig. 3.2 shows the planar zig-zag forms of the isotactic, syndiotactic andatactic configurations and indicates the orientation of the reference axes
Fig. 3.2. Planar zig-zag forms of vinyl polymers, -frCH2—CHX-^: (a) carbonbackbone showing labelling of carbon atoms and orientation of reference axes;(b) regular isotactic configuration and orientation of reference axes; (c) regularsyndiotactic configuration; (d) random atactic configuration.
(a)
(b)
(c)
(d)
O,H;
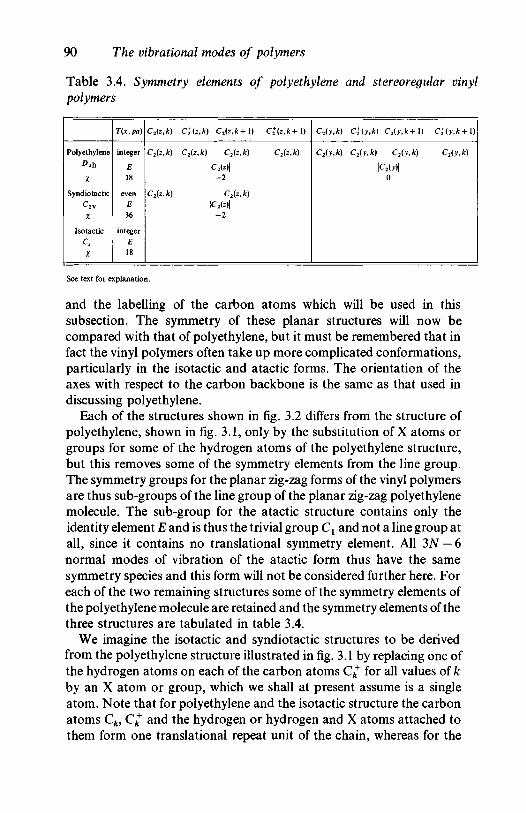
90 The vibrational modes of polymers
Table 3.4. Symmetry elements of polyethylene and stereoregular vinylpolymers
Polyethylene
X
Syndiotactic
c 2 VX
Isotactic
X
T(x,pa)
integer
E18
evenE36
integerE18
C2(z,
C2(z,
C2(z,
See text for explanation.
k)
k)
k)
C2+(z,fc) C2(z
C2(z,k) C2
-2
C2
|C2(z)|- 2
fe+1)
(z,k)
(z,k)
CUz^l)
C2(z,k)
C2(y,k) C2+(y,k)
C2(y,k) C2(y,k)
C2(y,k+1) C2+{y,k+\)
C2(y,k) C2(y,k)
C2(y)\0
and the labelling of the carbon atoms which will be used in thissubsection. The symmetry of these planar structures will now becompared with that of polyethylene, but it must be remembered that infact the vinyl polymers often take up more complicated conformations,particularly in the isotactic and atactic forms. The orientation of theaxes with respect to the carbon backbone is the same as that used indiscussing polyethylene.
Each of the structures shown in fig. 3.2 differs from the structure ofpolyethylene, shown in fig. 3.1, only by the substitution of X atoms orgroups for some of the hydrogen atoms of the polyethylene structure,but this removes some of the symmetry elements from the line group.The symmetry groups for the planar zig-zag forms of the vinyl polymersare thus sub-groups of the line group of the planar zig-zag polyethylenemolecule. The sub-group for the atactic structure contains only theidentity element E and is thus the trivial group Cx and not a line group atall, since it contains no translational symmetry element. All 3N — 6normal modes of vibration of the atactic form thus have the samesymmetry species and this form will not be considered further here. Foreach of the two remaining structures some of the symmetry elements ofthe polyethylene molecule are retained and the symmetry elements of thethree structures are tabulated in table 3.4.
We imagine the isotactic and syndiotactic structures to be derivedfrom the polyethylene structure illustrated in fig. 3.1 by replacing one ofthe hydrogen atoms on each of the carbon atoms Cfc
+ for all values of kby an X atom or group, which we shall at present assume is a singleatom. Note that for polyethylene and the isotactic structure the carbonatoms Ck, Cfc
+ and the hydrogen or hydrogen and X atoms attached tothem form one translational repeat unit of the chain, whereas for the
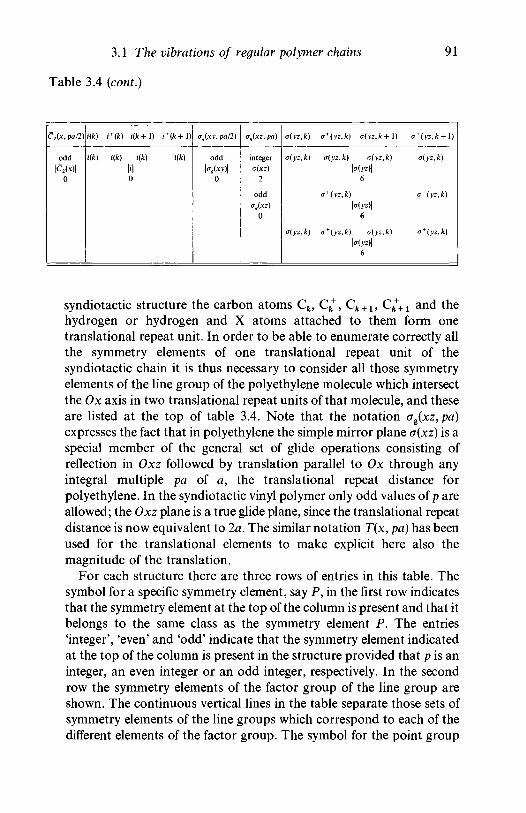
3.1 The vibrations of regular polymer chains
Table 3.4 (cont.)
91
C2(x, pa/2)
odd
|C2(x)|0
i(k) i + (k) i(k+\) i + (k+l)
{k) i(k) i(k)
0
<jg(xy, pa/2)
odd
'o
ag{xz, pa)
integera(xz)
2
odd<Tg(xz)
0
a(yz,k)
a{yz,k)
o{yz,k)
a + (yz,k)
a(yz,k)
o + (yz,k)
o+{yz,k)
°{yz,k
a(yz,a(yz)\
6
a(yz)\6
a{yz,o(yz)\
6
. . )
k)
k)
a + {yz,k+ 1)
a{yz,k)
c + {yz,k)
v+(yz,k)
syndiotactic structure the carbon atoms Ck, Ck+, Ck + 1, Cfc
++1 and the
hydrogen or hydrogen and X atoms attached to them form onetranslational repeat unit. In order to be able to enumerate correctly allthe symmetry elements of one translational repeat unit of thesyndiotactic chain it is thus necessary to consider all those symmetryelements of the line group of the polyethylene molecule which intersectthe Ox axis in two translational repeat units of that molecule, and theseare listed at the top of table 3.4. Note that the notation ag(xz,pa)expresses the fact that in polyethylene the simple mirror plane o(xz) is aspecial member of the general set of glide operations consisting ofreflection in Oxz followed by translation parallel to Ox through anyintegral multiple pa of a, the translational repeat distance forpolyethylene. In the syndiotactic vinyl polymer only odd values of p areallowed; the Oxz plane is a true glide plane, since the translational repeatdistance is now equivalent to 2a. The similar notation T(x, pa) has beenused for the translational elements to make explicit here also themagnitude of the translation.
For each structure there are three rows of entries in this table. Thesymbol for a specific symmetry element, say P, in the first row indicatesthat the symmetry element at the top of the column is present and that itbelongs to the same class as the symmetry element P. The entries'integer', 'even' and 'odd' indicate that the symmetry element indicatedat the top of the column is present in the structure provided that p is aninteger, an even integer or an odd integer, respectively. In the secondrow the symmetry elements of the factor group of the line group areshown. The continuous vertical lines in the table separate those sets ofsymmetry elements of the line groups which correspond to each of thedifferent elements of the factor group. The symbol for the point group
92 The vibrational modes of polymers
isomorphous with the factor group is shown at the extreme left. Thethird row gives the total character for one true translational repeat unitof each structure (including polyethylene) for each factor group element.
By using equation (2.31) with the total characters shown in table 3.4and the characters given in the standard tables for groups Cs and C2v itmay be shown that the symmetry species for the genuine vibrationalnormal modes of the factor group of the planar zig-zag isotactic vinylchain are
9 A' + 5 A"
and that for the planar syndiotactic chain they are
9AX + 1A2 + 1B1 + 9B2
Note that if the Ox and Oy axes are interchanged, as they frequently arein the literature, the designations Bx and B2 for the group C2v are alsointerchanged. Note also that in the standard character table for Cs thenormal to the mirror plane is called Oz, and the rotation parallel to thechain thus corresponds to Rz in the table.
The group Cs is a subgroup of the group C2v, which is in turn asubgroup of the group D2h. The full line group of the isotactic chain isnot, however, a subgroup of the line group of the syndiotactic chain,although both of them are subgroups of the line group of thepolyethylene chain. Because of the descent in symmetry D2h -• C2v -• Cs,the symmetry species of these three groups may be correlated with eachother.
For any general descent in symmetry it is easy to deduce thecorrespondences between the non-degenerate species of the groups oflower and higher symmetry, since the characters of correspondingspecies must be the same for all the operations that are common to thetwo groups. This is because the character for a non-degenerate modeshows directly the effect that the corresponding class of operation has onthe eigenvector. Each set of degenerate modes of the group of highersymmetry corresponds to an w-dimensional representation of the groupfor n > 1. The appropriate subset of matrices, i.e. those corresponding tothe common operations, forms a representation of the subgroup, andtheir characters, given in the character table for the group of highersymmetry, form the set of total characters for the corresponding n-dimensional representation of the subgroup. Equation (2.31) may thusbe used, in conjunction with the character table for the subgroup, to findthe corresponding symmetry species for the subgroup. For the exampleunder consideration, where no degenerate species occur, we easily findthe correspondences shown in fig. 3.3. Standard correlation tables fordescent in symmetry are available which show the correlations for all sets
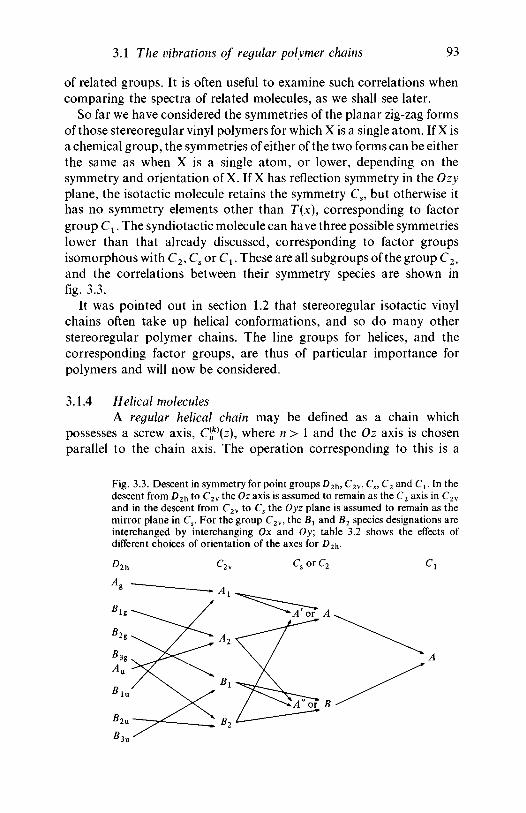
3.1 The vibrations of regular polymer chains 93
of related groups. It is often useful to examine such correlations whencomparing the spectra of related molecules, as we shall see later.
So far we have considered the symmetries of the planar zig-zag formsof those stereoregular vinyl polymers for which X is a single atom. If X isa chemical group, the symmetries of either of the two forms can be eitherthe same as when X is a single atom, or lower, depending on thesymmetry and orientation of X. If X has reflection symmetry in the Ozyplane, the isotactic molecule retains the symmetry Cs, but otherwise ithas no symmetry elements other than T(x), corresponding to factorgroup Cx. The syndiotactic molecule can have three possible symmetrieslower than that already discussed, corresponding to factor groupsisomorphous with C2, Cs or Cx. These are all subgroups of the group C2v
and the correlations between their symmetry species are shown infig. 3.3.
It was pointed out in section 1.2 that stereoregular isotactic vinylchains often take up helical conformations, and so do many otherstereoregular polymer chains. The line groups for helices, and thecorresponding factor groups, are thus of particular importance forpolymers and will now be considered.
3.1.4 Helical moleculesA regular helical chain may be defined as a chain which
possesses a screw axis, Cf\z), where n > 1 and the Oz axis is chosenparallel to the chain axis. The operation corresponding to this is a
Fig. 3.3. Descent in symmetry for point groups D2u, C2w, Cs, C2 and C t . In thedescent from D2h to C2v the Oz axis is assumed to remain as the C2 axis in C2v
and in the descent from C2v to Cs the Oyz plane is assumed to remain as themirror plane in Cs. For the group C2V, the Bx and B2 species designations areinterchanged by interchanging Ox and Oy; table 3.2 shows the effects ofdifferent choices of orientation of the axes for D2^.
Cs or C2
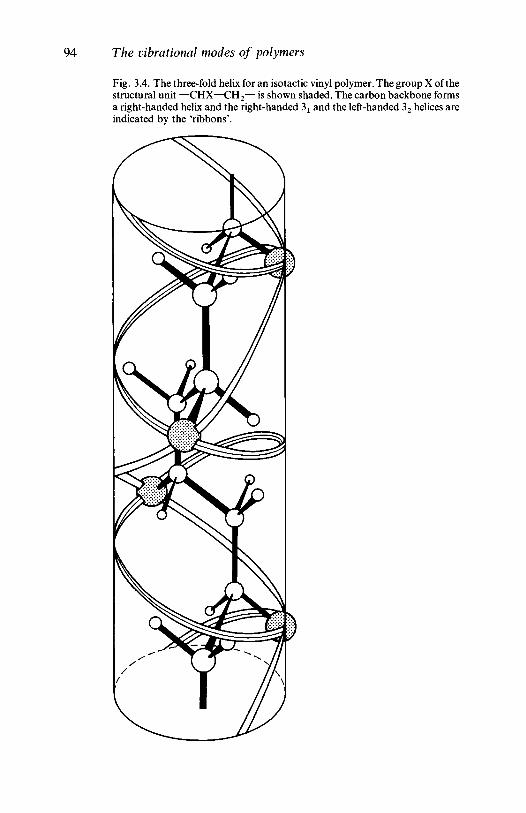
94 The vibrational modes of polymers
Fig. 3.4. The three-fold helix for an isotactic vinyl polymer. The group X of thestructural unit —CHX—CH2— is shown shaded. The carbon backbone formsa right-handed helix and the right-handed 3l and the left-handed 32 helices areindicated by the 'ribbons'.
3.1 The vibrations of regular polymer chains 95
rotation through 2nk/n about Oz followed by translation through adistance a/n parallel to Oz, where a is the translational period of thechain. The helix may thus be described as consisting of n physical repeatunits in k turns, which constitute one translational period, and it is calledan nk helix. If k= 1 it is usually omitted from the symbol for theoperation or element. The planar zig-zag polyethylene chain possesses aC{2} axis, for which the simpler notation C2 was used in the previoussubsection, and may thus be considered to be a 2X helix, whereas theconformation often assumed by isotactic vinyl polymers is the 3X helixillustrated in fig. 3.4. The physical repeat unit is often the same as thechemical repeat unit but need not be.
In specifying a helix, and in deriving its symmetry, several pointsshould be noted. First, n and k should have no common factor,otherwise more than one translational repeat unit is being referred to.Secondly, the value of k is arbitrary to the extent that any integralmultiple pn of n may be added to it or subtracted from it, since thiswill simply insert p extra whole turns per physical repeat unit to givean identical molecule. Thus k should always be less than n to excludesuch redundant turns. For greatest simplicity of description k<n/2 (ork = n/2 for n even), since a helix consisting of n physical repeat units in kclockwise turns can equally well be described as consisting of n physicalrepeat units in n — k anticlockwise turns. This is illustrated for n = 3 infig. 3.4. The helix with k < n/2 is not, however, always of the samehandedness, or chirality, as the helix described by the bonds in thebackbone of the molecule, as it is in fig. 3.4, and the description with thehigher value of k may then be preferred. The two helices can, however,differ in chirality only if there is more than one backbone bond perphysical repeat unit. For some purposes it may be necessary to specifythe chirality of a helix, but not for specifying its line group or thecorresponding factor group.
If an nk helix has no symmetry elements other than products andpowers of T(z) and C{f\z), the factor group of the line group isisomorphous with the point group Cn. If the physical repeat unit issufficiently symmetric there may in addition be two classes of dihedralaxes, C2 and C2,which intersect the Oz axis alternately at equal distancesa/(2n) along it. The adjacent members of either class make the angle2nk/n with each other. The factor group of the line group is thenisomorphous with the point group Dn; for n odd the two classes ofdihedral axes in the line group gives rise to only one class in the factorgroup. No higher symmetry is possible, except for n = 2, since theoperation of reflection reverses the chirality of a helix. Helices with n = 2can have factor groups isomorphous with C2v, C2h or D2h, in addition toC2 or D2.
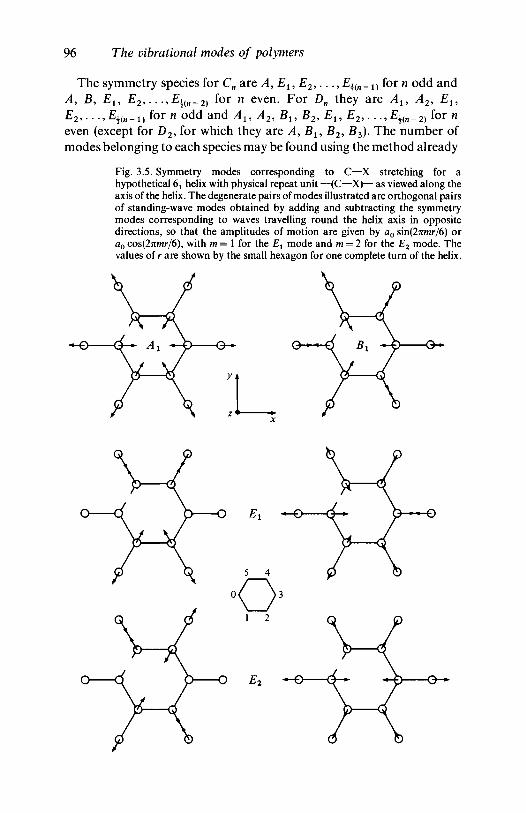
96 The vibrational modes of polymers
The symmetry species for Cn are A, El, E2,..., E±in_ 1} for n odd andA, B, El9 £ 2 , . . . ,£i ( n_2 ) for n even. For Dn they are Al9 ,42, El9
E2,...,E,{n_1)forn odd and 4 l 9 A2, Bu B2, El9 £ 2 , . . . , % _ 2 ) for rceven (except for D2, for which they are A, Bl9 B2, B3). The number ofmodes belonging to each species may be found using the method already
Fig. 3.5. Symmetry modes corresponding to C—X stretching for ahypothetical 6X helix with physical repeat unit —(C—X)— as viewed along theaxis of the helix. The degenerate pairs of modes illustrated are orthogonal pairsof standing-wave modes obtained by adding and subtracting the symmetrymodes corresponding to waves travelling round the helix axis in oppositedirections, so that the amplitudes of motion are given by a0 sin(2nmr/6) ora0 cos{2nmr/6), with m = 1 for the Ex mode and m = 2 for the E2 mode. Thevalues of r are shown by the small hexagon for one complete turn of the helix.
3.2 The vibrations of polymer crystals 97
described. In the modes of A, Ax or A2 symmetry all physical repeatunits vibrate in phase, when related by the screw operation, and in themodes of B, Bx or B2 symmetry alternate units vibrate n out of phase(except for D2, for which B1 species vibrate in phase and B2 and B3
species vibrate n out of phase). The two modes of a degenerate pair ofspecies Em may be chosen so that there is a phase angle of + Inrnk/nbetween the vibrations of adjacent physical units along the helix and aphase angle of + 2nm/n between consecutive units taken in order roundthe Oz axis. A more detailed discussion of the degenerate species of pointgroups Cn and Dn is given in subsection 2.3.2. Symmetry modescorresponding to C—X stretching are shown in fig. 3.5 for ahypothetical 6^ helix for which the factor group of the line group isisomorphous with D6.
3.2 The vibrations of polymer crystalsWe have so far considered only the vibrations of idealized,
isolated polymer chains and we now consider the vibrations of apolymer crystal in which the chains each have essentially the sameconformation as the original isolated chain. When the chains arebrought together to form a crystal several changes in the nature of thefactor group modes take place, since these, like all the normal modes,must now be modes of the crystal as a whole.
A primitive unit cell of any crystal is any one of an infinite number ofpossible choices of parallelepiped of smallest possible volume fromwhich the crystal may be imagined to be built. The crystal is built by therepetition of the contents of this cell in all the volumes which theparallelepiped occupies if it is displaced, without rotation, through allvectors /a + rab + nc, where /, m and n take all possible integral valuesand a, b and c are vectors which correspond to the three edges of theparallelepiped. The symmetry elements of a crystal are of similar types tothose already considered for single polymer chains, but they no longermeet on a line and they form a space group. The set of modes to which theinfrared- and Raman-active modes belong are now the modes in whichthe contents of each primitive unit cell move in phase with those of everyother primitive unit cell and the symmetry species of these modes may beobtained by considering the factor group of the space group, in a manneranalogous to that already used in determining the symmetry species forthe corresponding modes of the single chain by considering the factorgroup of the line group.
From now on the word 'primitive' will be dropped in references to theunit cell but it must be understood to be implied. We shall not discussthe larger unit cells sometimes defined for crystals of certain symmetryclasses.
98 The vibrational modes of polymers
3.2.1 The nature of the factor group modesIn a polymer crystal all the chain axes are parallel and one of the
edges of the unit cell may be chosen parallel to them. If this edge isdefined to be the Oc axis there will be only one chain crossing the Oabplane per unit cell in the simplest type of crystal; more generally therewill be m chains per unit cell.
For crystals with only one chain per unit cell there are twopossibilities:
(a) The factor group of the space group is the same as that of theline group of the isolated chain.
(b) The factor group of the space group is of lower order than thatof the line group of the isolated chain and is a subgroup of it.
If (a) holds, the symmetry species of the factor group modes are thesame as those of the single chain but there is one more mode, a latticemode, which corresponds to a rotatory vibration, or libration, of thewhole chain about the chain axis. This mode replaces the free rotation ofthe isolated chain and is sometimes called an external mode todistinguish it from the other internal modes of vibration of the chain. Itwill generally be of rather low frequency, since the intermolecular forcesare generally much lower than the intramolecular forces and themoment of inertia of the chain per unit length is usually rather high.
For any symmetry species which contains only one mode thedirections of motion of the atoms in the normal mode vibration will beidentical to those of the corresponding mode of the single chain,although its frequency will be slightly changed because of theintermolecular forces. The forms of the modes for symmetry species withmore than one mode will be changed as well as the frequencies, althoughthe changes will often be small.
If (b) holds, not only will there be an additional mode, the latticemode, but modes which were degenerate for the single chain may nolonger be degenerate for the crystal, though in general the frequencysplitting will not be very great. Such splitting is called (static) crystalfield splitting, since it is possible to describe the factor group modes asthose of a single chain which has been distorted by the forces due to thesurrounding chains - the crystal field - so that it has the lower symmetryof the crystal. In addition to the possible crystal field splitting, certainmodes inactive in the infrared or Raman spectrum of the single chainmay become active for the crystal because of the lowering of thesymmetry.
For crystals with more than one chain per unit cell there are also twopossibilities:
3.2 The vibrations of polymer crystals 99
(a) The factor group of the space group is of greater order than thatof the line group for the isolated chain, which is a subgroup of it.
(b) The factor group of the space group contains some but not all ofthe elements of the factor group of the line group for the isolatedchain and contains some new elements.
If (a) holds, no crystal field splitting or activation of modes inactive forthe single chain occurs, whereas if (b) holds, both effects may occur. Forboth (a) and (b) a second type of splitting of modes takes place, calledcorrelation (field) splitting. Any mode of the single chain (including eachof the components of a mode split by crystal field splitting for (b)) is splitinto m modes which differ, to a first approximation, only in the relativephases of the motions of the m chains in each unit cell; the motions of them chains are correlated. The form of the motion for each chain is again,to a first approximation, the same as it would be in the isolated chain. Inaddition, for both (a) and (b), 4m — 3 new lattice modes appear. Of these,m correspond essentially to rotatory vibrations of the m chains aroundtheir axes, each differing from the others primarily in the relative phasesof the motions of the m chains in any unit cell, and the remaining 3m — 3correspond essentially to vibrations in which whole chains translatebodily with respect to each other. All these lattice modes usually haverather low frequencies.
It is possible to deduce which two symmetry species correspond to theoriginal single symmetry species for modes split by crystal field orcorrelation splitting by using the ideas discussed in subsection 3.1.3,where descent in symmetry was considered. Note that it may happen,even when there is more than one chain per unit cell, that the factorgroups for the single chain and for the crystal are isomorphous with thesame point group. The actual elements of the factor groups themselvesmust, however, be different in spite of this, and the crystal belongs tocategory (fo). (See the following subsection for an example.)
It will be realized, from the description given of the effects ofcrystallinity on the factor group modes, that changes in the vibrationalspectra of a polymer on crystallization can give valuable informationabout the crystal structure, and some examples of this will be discussedin chapter 6. Some words of caution are, however, appropriate. Thetreatment just given is an idealized one in two ways. It assumes first thatthe intermolecular forces are small compared with the intramolecularforces, so that the perturbation of the single-chain vibrations is small. Ifthis is not so, the vibrations of the crystal will not be related in a simpleway to those of the single chain. The form of the chain may be severelydistorted and the modes will not be clearly divisible into internal andexternal or lattice modes - there will be no modes in which the individual
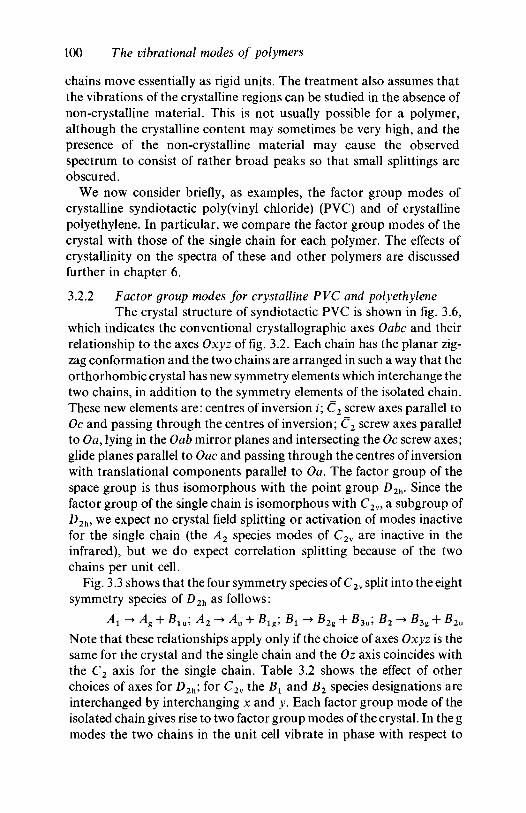
100 The vibrational modes of polymers
chains move essentially as rigid units. The treatment also assumes thatthe vibrations of the crystalline regions can be studied in the absence ofnon-crystalline material. This is not usually possible for a polymer,although the crystalline content may sometimes be very high, and thepresence of the non-crystalline material may cause the observedspectrum to consist of rather broad peaks so that small splittings areobscured.
We now consider briefly, as examples, the factor group modes ofcrystalline syndiotactic poly(vinyl chloride) (PVC) and of crystallinepolyethylene. In particular, we compare the factor group modes of thecrystal with those of the single chain for each polymer. The effects ofcrystallinity on the spectra of these and other polymers are discussedfurther in chapter 6.
3.2.2 Factor group modes for crystalline PVC and polyethyleneThe crystal structure of syndiotactic PVC is shown in fig. 3.6,
which indicates the conventional crystallographic axes Oabc and theirrelationship to the axes Oxyz of fig. 3.2. Each chain has the planar zig-zag conformation and the two chains are arranged in such a way that theorthorhombic crystal has new symmetry elements which interchange thetwo chains, in addition to the symmetry elements of the isolated chain.These new elements are: centres of inversion i; C2 screw axes parallel toOc and passing through the centres of inversion; C2 screw axes parallelto Oa, lying in the Oab mirror planes and intersecting the Oc screw axes;glide planes parallel to Oac and passing through the centres of inversionwith translational components parallel to Oa. The factor group of thespace group is thus isomorphous with the point group D2h. Since thefactor group of the single chain is isomorphous with C2v, a subgroup ofD2h, we expect no crystal field splitting or activation of modes inactivefor the single chain (the A2 species modes of C2v are inactive in theinfrared), but we do expect correlation splitting because of the twochains per unit cell.
Fig. 3.3 shows that the four symmetry species of C2v split into the eightsymmetry species of D2h as follows:
A^Ag + Blu; A2 -> Au + £ l g ; Bx -> B2g + B3u; B2 -* B3g + B2u
Note that these relationships apply only if the choice of axes Oxyz is thesame for the crystal and the single chain and the Oz axis coincides withthe C2 axis for the single chain. Table 3.2 shows the effect of otherchoices of axes for D2h; for C2v the Bx and B2 species designations areinterchanged by interchanging x and y. Each factor group mode of theisolated chain gives rise to two factor group modes of the crystal. In the gmodes the two chains in the unit cell vibrate in phase with respect to
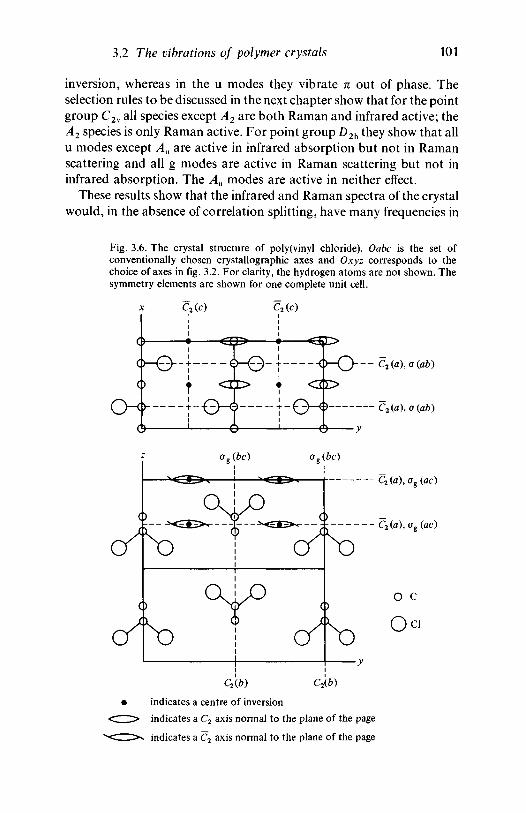
3.2 The vibrations of polymer crystals 101
inversion, whereas in the u modes they vibrate n out of phase. Theselection rules to be discussed in the next chapter show that for the pointgroup C2v all species except A2 are both Raman and infrared active; theA2 species is only Raman active. For point group D2h they show that allu modes except Au are active in infrared absorption but not in Ramanscattering and all g modes are active in Raman scattering but not ininfrared absorption. The Au modes are active in neither effect.
These results show that the infrared and Raman spectra of the crystalwould, in the absence of correlation splitting, have many frequencies in
Fig. 3.6. The crystal structure of poly(vinyl chloride). Oabc is the set ofconventionally chosen crystallographic axes and Oxyz corresponds to thechoice of axes in fig. 3.2. For clarity, the hydrogen atoms are not shown. Thesymmetry elements are shown for one complete unit cell.
__ c2(a),o(ab)
C2(a),o(ab)
C2(b)
indicates a centre of inversion
indicates a C2 axis normal to the plane of the page
indicates a C2 axis normal to the plane of the page
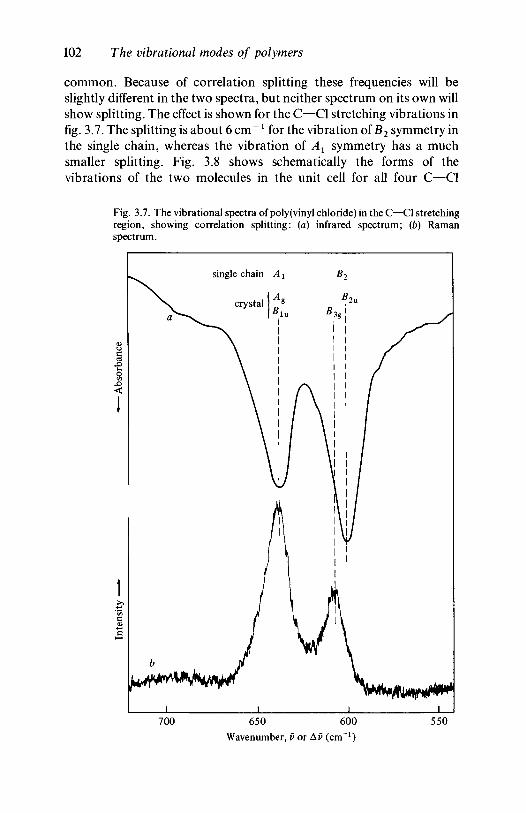
102 The vibrational modes of polymers
common. Because of correlation splitting these frequencies will beslightly different in the two spectra, but neither spectrum on its own willshow splitting. The effect is shown for the C—Cl stretching vibrations infig. 3.7. The splitting is about 6 cm"1 for the vibration of B2 symmetry inthe single chain, whereas the vibration of Ax symmetry has a muchsmaller splitting. Fig. 3.8 shows schematically the forms of thevibrations of the two molecules in the unit cell for all four C—Cl
Fig. 3.7. The vibrational spectra of poly(vinyl chloride) in the C—Cl stretchingregion, showing correlation splitting: (a) infrared spectrum; (b) Ramanspectrum.
700 650 600Wavenumber, v or A0 (cm"1)
550
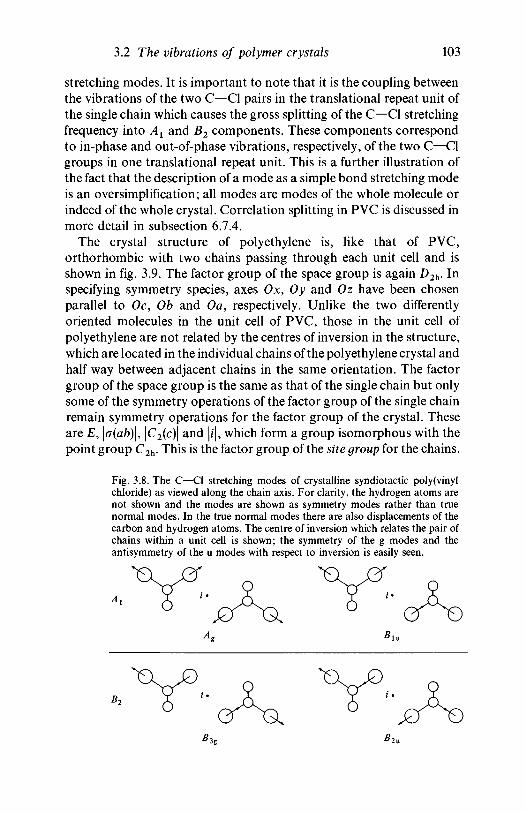
3.2 The vibrations of polymer crystals 103
stretching modes. It is important to note that it is the coupling betweenthe vibrations of the two C—Cl pairs in the translational repeat unit ofthe single chain which causes the gross splitting of the C—Cl stretchingfrequency into Ax and B2 components. These components correspondto in-phase and out-of-phase vibrations, respectively, of the two C—Clgroups in one translational repeat unit. This is a further illustration ofthe fact that the description of a mode as a simple bond stretching modeis an oversimplification; all modes are modes of the whole molecule orindeed of the whole crystal. Correlation splitting in PVC is discussed inmore detail in subsection 6.7.4.
The crystal structure of polyethylene is, like that of PVC,orthorhombic with two chains passing through each unit cell and isshown in fig. 3.9. The factor group of the space group is again D2h- Inspecifying symmetry species, axes Ox, Oy and Oz have been chosenparallel to Oc, Ob and Oa, respectively. Unlike the two differentlyoriented molecules in the unit cell of PVC, those in the unit cell ofpolyethylene are not related by the centres of inversion in the structure,which are located in the individual chains of the polyethylene crystal andhalf way between adjacent chains in the same orientation. The factorgroup of the space group is the same as that of the single chain but onlysome of the symmetry operations of the factor group of the single chainremain symmetry operations for the factor group of the crystal. Theseare E, \a(ab)\, \C2{c)\ and |i|, which form a group isomorphous with thepoint group C2h- This is the factor group of the site group for the chains.
Fig. 3.8. The C—Cl stretching modes of crystalline syndiotactic poly (vinylchloride) as viewed along the chain axis. For clarity, the hydrogen atoms arenot shown and the modes are shown as symmetry modes rather than truenormal modes. In the true normal modes there are also displacements of thecarbon and hydrogen atoms. The centre of inversion which relates the pair ofchains within a unit cell is shown; the symmetry of the g modes and theantisymmetry of the u modes with respect to inversion is easily seen.
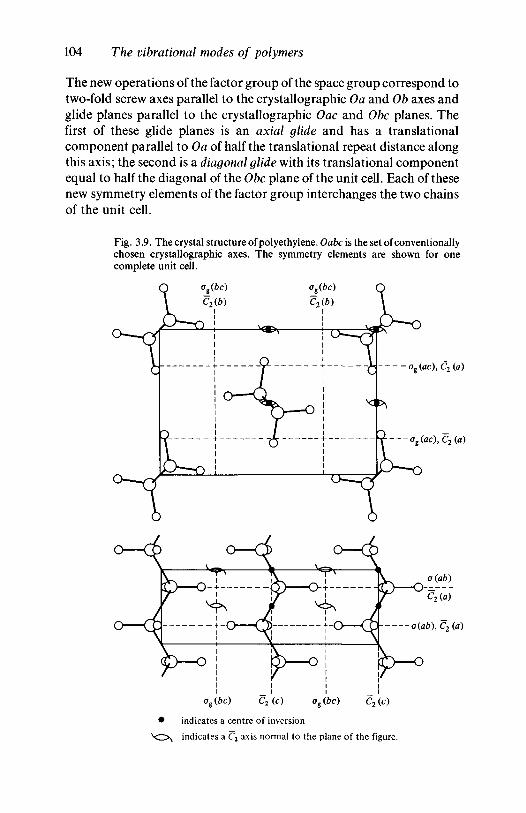
104 The vibrational modes of polymers
The new operations of the factor group of the space group correspond totwo-fold screw axes parallel to the crystallographic Oa and Ob axes andglide planes parallel to the crystallographic Oac and Obc planes. Thefirst of these glide planes is an axial glide and has a translationalcomponent parallel to Oa of half the translational repeat distance alongthis axis; the second is a diagonal glide with its translational componentequal to half the diagonal of the Obc plane of the unit cell. Each of thesenew symmetry elements of the factor group interchanges the two chainsof the unit cell.
Fig. 3.9. The crystal structure of polyethylene. Oabc is the set of conventionallychosen crystallographic axes. The symmetry elements are shown for onecomplete unit cell.
ag(ac),C2(a)
ag (ac), C2 (a)
o(flb), C2 (a)
og (be) C2 (c) ag (be) C2 (c)
• indicates a centre of inversion
indicates a C2 axis normal to the plane of the figure.
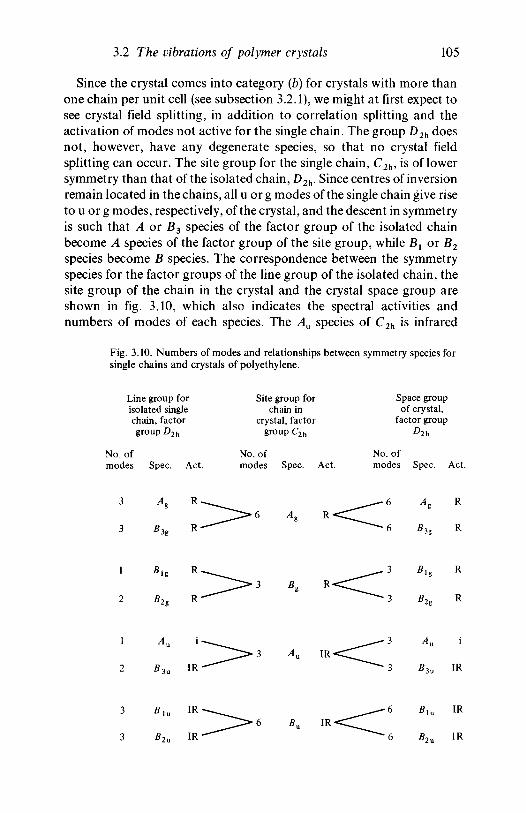
3.2 The vibrations of polymer crystals 105
Since the crystal comes into category (b) for crystals with more thanone chain per unit cell (see subsection 3.2.1), we might at first expect tosee crystal field splitting, in addition to correlation splitting and theactivation of modes not active for the single chain. The group D2h doesnot, however, have any degenerate species, so that no crystal fieldsplitting can occur. The site group for the single chain, C2h, is of lowersymmetry than that of the isolated chain, D2h. Since centres of inversionremain located in the chains, all u or g modes of the single chain give riseto u or g modes, respectively, of the crystal, and the descent in symmetryis such that A or B3 species of the factor group of the isolated chainbecome A species of the factor group of the site group, while Bx or B2
species become B species. The correspondence between the symmetryspecies for the factor groups of the line group of the isolated chain, thesite group of the chain in the crystal and the crystal space group areshown in fig. 3.10, which also indicates the spectral activities andnumbers of modes of each species. The Au species of C2h is infrared
Fig. 3.10. Numbers of modes and relationships between symmetry species forsingle chains and crystals of polyethylene.
Line group forisolated singlechain, factorgroup D2h
No. ofmodes Spec. Act.
Site group forchain in
crystal, factorgroup C2h
No. ofmodes Spec. Act.
Space groupof crystal,
factor group
No. ofmodes Spec. Act.
3g
R
R
B2g R-
R
R
B3u IR
IR
106 The vibrational modes of polymers
active, so that the inactive Au species —CH2— twisting mode of theisolated single chain (see table 3.2) becomes infrared active for the chainin the crystal. In addition to this crystal field activation of a mode, thereis now correlation splitting of all the modes into pairs of modes, the twomembers of a pair differing according to whether the two chains vibratein phase or out of phase when related by a particular symmetryoperation.
Correlation splitting should not be observable for the Au species—CH2— twisting mode, since it gives rise to an infrared active B3u
species and an inactive Au species in the crystal; for all other modescorrelation splitting is directly observable in principle. It has beenobserved in practice for a number of infrared- and Raman-active modesin polyethylene, as discussed in detail in subsection 6.7.2.
In the present section, and elsewhere in this chapter, we have simplystated that certain symmetry species are active or inactive for the IR orRaman spectrum and in the next chapter we shall explain how theactivities are derived and how two Raman-active modes of differentspecies or two IR-active modes of different species may be distinguishedby the use of polarized radiation, at least in principle. Whether this maybe done in practice depends on a variety of factors, some of which will beconsidered in chapters 5 and 6.
3.3 Further readingThe following books contain further details on the topics of this
chapter and some of the topics of chapters 4 and 5: InfraredSpectroscopy of High Polymers by R. Zbinden, Academic Press, NY,1964; The Theory of Vibrational Spectroscopy and its Application toPolymeric Materials by P. C. Painter, M. M. Coleman and J. L. Koenig,Wiley 1982.
In addition, the following reviews, among others, may be foundhelpful: 'Infrared Spectra of High Polymers' by S. Krimm, Advances inPolymer Science, vol. 2, p. 51 (1960); 'Vibrational Analysis of HighlyOrdered Polymers' by H. Tadokoro and M. Kobayashi in PolymerSpectroscopy edited by D. O. Hummel, VCH, 1974. The detailed studiesof individual polymers described in the first of these reviews are nowsomewhat out of date but the introductory section is in large measurestill applicable and the review is an important landmark in the subject.
Infrared and Raman spectra
4.1 Semiclassical treatment of origins of spectra4.1.1 Polarizability tensors and dipole moments
In this section we explain the origins of infrared absorption andRaman scattering, using as far as possible the ideas of classical physics.Quantum mechanics is introduced only where its use makes thetreatment easier or where classical physics is inadequate for explaining aphenomenon or deriving a result. In addition to an explanation of theorigins of the effects, an explanation is also given of the selection ruleswhich determine which modes of vibration are actually active forinfrared or Raman spectroscopy. Since infrared absorption and Ramanscattering involve the interaction of molecules with electromagneticwaves, in particular with the oscillating electric field of the waves, it isnecessary to consider the electrical properties of the molecules. We beginby defining the molecular polarizability tensor.
Imagine first a non-vibrating molecule which belongs to one of thepoint groups Z>2, D2h) ^2d o r C2v- For such a molecule the intersectionsof the symmetry elements define a unique set of three mutuallyperpendicular axes, which will be called Oxyz. The molecule consists of alarge number of charged particles, the nuclei and the electrons, but iselectrically neutral overall. If a steady electric field E is applied to themolecule in a direction parallel to one of the reference axes it will cause aredistribution of the charges in the molecule so that the molecule attainsa net electric dipole moment, or undergoes a change in an alreadyexisting dipole moment, of amount JI. For low values of E the inducedmoment |i is proportional to E but its magnitude usually depends onwhether E is parallel to Ox, Oy or Oz. The ratio of the induced dipolemoment to the applied field is called the polarizability and the threevalues for £ parallel to each of the symmetry axes are called the principalpolarizabilities of the molecule, px9 py9 pz.
If the electric field is applied in a direction which is not parallel to oneof the symmetry axes the induced dipole moment will usually not beparallel to E\ its components may, however, be deduced by resolving Eparallel to the symmetry axes and using the equations
\ix = pxEx9 fiy = pyEy9 fiz = pzEz (4.1)
107
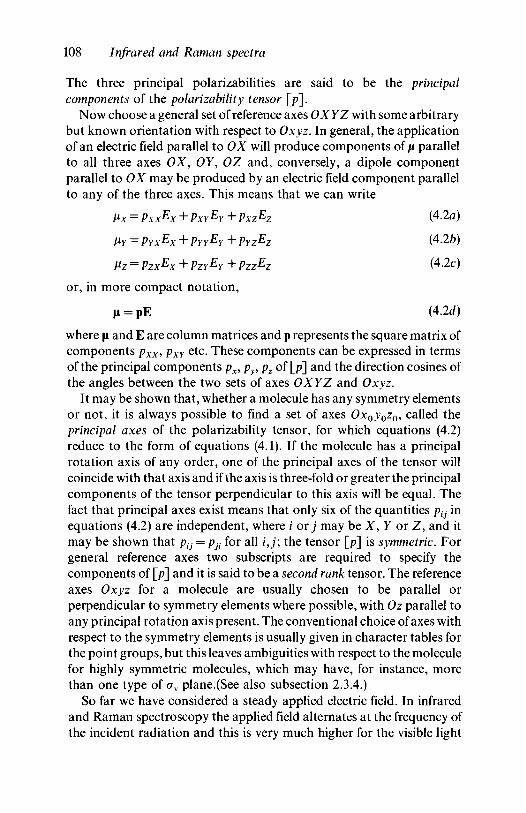
108 Infrared and Raman spectra
The three principal polarizabilities are said to be the principalcomponents of the polarizability tensor [/?].
Now choose a general set of reference axes OXYZ with some arbitrarybut known orientation with respect to Oxyz. In general, the applicationof an electric field parallel to OX will produce components of /i parallelto all three axes OX, OY, OZ and, conversely, a dipole componentparallel to OX may be produced by an electric field component parallelto any of the three axes. This means that we can write
Hx = PxxEx + PXYEY + PxzEz (4.2a)
fiY = pYxEx + PYYEY + PYZEZ (42b)
Vz = PzxEx + PZYEY + PzzEz (4.2c)
or, in more compact notation,
*i = pE (4.2d)
where \i and E are column matrices and p represents the square matrix ofcomponents pxx, pXY etc. These components can be expressed in termsof the principal components px, py, pz of [/?] and the direction cosines ofthe angles between the two sets of axes OXYZ and Oxyz.
It may be shown that, whether a molecule has any symmetry elementsor not, it is always possible to find a set of axes Ox0y0z0, called theprincipal axes of the polarizability tensor, for which equations (4.2)reduce to the form of equations (4.1). If the molecule has a principalrotation axis of any order, one of the principal axes of the tensor willcoincide with that axis and if the axis is three-fold or greater the principalcomponents of the tensor perpendicular to this axis will be equal. Thefact that principal axes exist means that only six of the quantities ptj inequations (4.2) are independent, where i or j may be X, Y or Z, and itmay be shown that ptj = pjt for all ij; the tensor [p] is symmetric. Forgeneral reference axes two subscripts are required to specify thecomponents of [p\ and it is said to be a second rank tensor. The referenceaxes Oxyz for a molecule are usually chosen to be parallel orperpendicular to symmetry elements where possible, with Oz parallel toany principal rotation axis present. The conventional choice of axes withrespect to the symmetry elements is usually given in character tables forthe point groups, but this leaves ambiguities with respect to the moleculefor highly symmetric molecules, which may have, for instance, morethan one type of crv plane.(See also subsection 2.3.4.)
So far we have considered a steady applied electric field. In infraredand Raman spectroscopy the applied field alternates at the frequency ofthe incident radiation and this is very much higher for the visible light
4.1 Semiclassical treatment of origins of spectra 109
used in Raman spectroscopy than for the radiation absorbed in infraredspectroscopy, for which it is equal to the frequency of the normal modeof vibration involved. In Raman spectroscopy the polarization of themolecule therefore takes place by distortion of the electronic wave-function, with essentially no effect on the motion of the nuclei, which canonly respond at much lower frequencies. The polarizability will,however, depend on the instantaneous positions of the nuclei becausethey determine the precise form of the electronic wave-function that isdistorted by the field. It is the modification of the polarizability by thevibrational motion of the molecule which gives rise to Raman scattering,as discussed in detail in subsection 4.1.3. When infrared radiation ofappropriate frequency interacts with the molecule the nuclei andelectrons can respond together. It is therefore usual to consider theresulting oscillating electric dipole of the molecule to be produced by thechange in magnitude or direction of pre-existing bond dipoles and theterms 'polarizability' and 'induced dipole', though strictly applicable,are not used. The mechanism for infrared activity will now be consideredin more detail and the selection rule will be deduced.
4.1.2 Infrared absorption - mechanism and selection ruleImagine the effect of irradiating a molecule with radiation of
frequency v. In the simplest picture, each atom carries an effectivefractional charge which depends on the nature of the atoms to which it isbonded. The electric field acting on these charges causes a distortion ofthe molecule and in so doing causes a change in the net electric dipolemoment of the molecule. Since E varies sinusoidally with frequency v,the molecule tends to be set into vibration at this frequency. If vcoincides with the frequency of a suitable mode this mode can be set intoresonant vibration and the radiation will then be absorbed. This is themechanism of infrared absorption according to the classical picture. It isimportant to realize, however, that not all modes of vibration canabsorb radiation in this way.
A mode can only resonate with the oscillatory distortion of themolecule caused by the electric field of the radiation if it belongs to thesame symmetry species as the distortion, and this must necessarily be thespecies to which both the electric field and the vib rational dipole changebelong. These are vectors and thus have the same symmetry species as atranslation parallel to the electric field. We thus have the followingselection rule for infrared absorption: a mode of vibration can onlyabsorb radiation polarized parallel to Ox {Oy or Oz) if the mode belongsto the same symmetry species as a translation parallel to Ox (Oy or Oz).We can thus use the column usually given in character tables to indicate
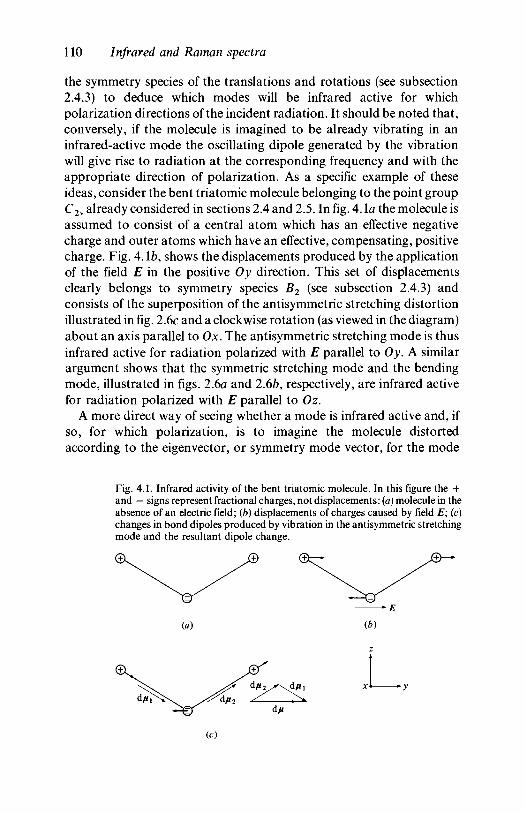
110 Infrared and Raman spectra
the symmetry species of the translations and rotations (see subsection2.4.3) to deduce which modes will be infrared active for whichpolarization directions of the incident radiation. It should be noted that,conversely, if the molecule is imagined to be already vibrating in aninfrared-active mode the oscillating dipole generated by the vibrationwill give rise to radiation at the corresponding frequency and with theappropriate direction of polarization. As a specific example of theseideas, consider the bent triatomic molecule belonging to the point groupC2v already considered in sections 2.4 and 2.5. In fig. 4. la the molecule isassumed to consist of a central atom which has an effective negativecharge and outer atoms which have an effective, compensating, positivecharge. Fig. 4.1b, shows the displacements produced by the applicationof the field E in the positive Oy direction. This set of displacementsclearly belongs to symmetry species B2 (see subsection 2.4.3) andconsists of the superposition of the antisymmetric stretching distortionillustrated in fig. 2.6c and a clockwise rotation (as viewed in the diagram)about an axis parallel to Ox. The antisymmetric stretching mode is thusinfrared active for radiation polarized with E parallel to Oy. A similarargument shows that the symmetric stretching mode and the bendingmode, illustrated in figs. 2.6a and 2.6b, respectively, are infrared activefor radiation polarized with E parallel to Oz.
A more direct way of seeing whether a mode is infrared active and, ifso, for which polarization, is to imagine the molecule distortedaccording to the eigenvector, or symmetry mode vector, for the mode
Fig. 4.1. Infrared activity of the bent triatomic molecule. In this figure the +and — signs represent fractional charges, not displacements: (a) molecule in theabsence of an electric field; (b) displacements of charges caused by field E; (c)changes in bond dipoles produced by vibration in the antisymmetric stretchingmode and the resultant dipole change.
(a) (b)
(c)
4.1 Semiclassical treatment of origins of spectra 111
and to consider the changes in the dipole moments due to the individualbonds. These changes are illustrated for the antisymmetric stretchingmode in fig. 4.1c and their resultant, the total dipole moment change, d/iis also shown. This is, as expected, parallel to Oy9 which confirms thatthis is the required direction for the E vector for absorption to occur atthe frequency of the antisymmetric stretching mode. For a randomlyoriented assemblage of molecules, the Oy axes would point randomly inspace, so that radiation of any polarization would be absorbed equally,but for oriented systems polarization effects are important and they areconsidered in section 4.2.
4.1.3 The origin of Raman scatteringWe now consider the origin of Raman scattering according to
classical physics. Imagine a molecule vibrating in a particular normalmode, m, of frequency vm and let radiation of frequency v0 be incident onit. At any particular instant during the vibration of the molecule it willhave a polarizability tensor [p], the components of which varysinusoidally at the frequency vm because their precise values will dependon the instantaneous distortion of the molecule. Let Um be the normalcoordinate corresponding to the frequency vm. We can then expand eachcomponent p(j of [p] as a Taylor series
^ J ^ + ... (4-3)
where pij0 is the value of ptj in the equilibrium state and the derivativesare understood to be evaluated at Um = 0. We shall neglect all but thefirst two terms of the series. If the electric field E of the incident radiationis parallel to Oxj9 so that the only non-zero component of E is Ej9 theinduced dipole fit is given by /^ = p̂ JE,-, and substitution of theapproximate form of ptj from the first two terms of equation (4.3) leadsto
( V ^ J J (4.4)
Now
Ej = Ej0 cos(2nv0t + 0O) (4.5)
and
Um=Um0cos(27ivmt + <l>m) (4.6)
where Ej0 and Um0 are the maximum values of Ej and Um; 0O and 0m are
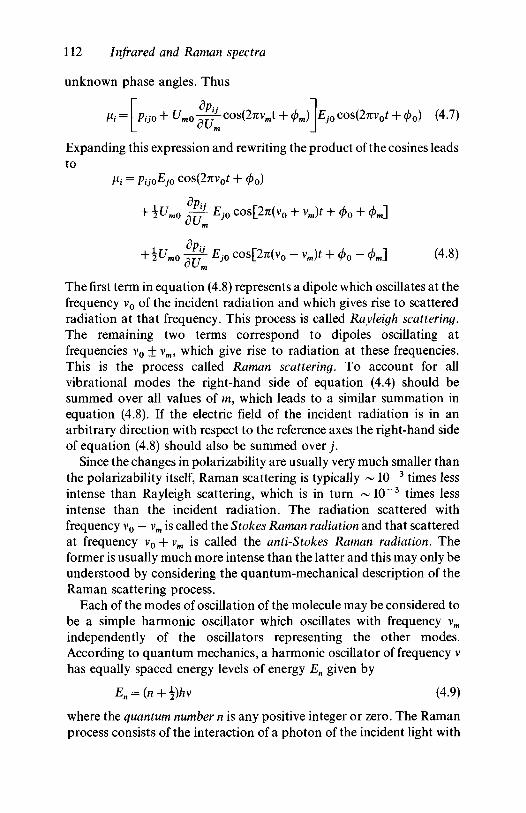
112 Infrared and Raman spectra
unknown phase angles. Thus
Um0 -^- cos(2nvj + 4>J \EJO cos(2nv0t + (j>0) (4.7)
Expanding this expression and rewriting the product of the cosines leadsto
fit = pij0Ej0 cos(2nv0t + 0O)
+ 2 ^mO ^77^ Ej0 COS[271(V0 + Vm)t + (/>0 + 0m]
dp--+Wm0 -jf- Ej0 COS[2TT(V0 - vm)t + </>0 - 0m] (4.8)
The first term in equation (4.8) represents a dipole which oscillates at thefrequency v0 of the incident radiation and which gives rise to scatteredradiation at that frequency. This process is called Rayleigh scattering.The remaining two terms correspond to dipoles oscillating atfrequencies v0 ± vw, which give rise to radiation at these frequencies.This is the process called Raman scattering. To account for allvibrational modes the right-hand side of equation (4.4) should besummed over all values of m, which leads to a similar summation inequation (4.8). If the electric field of the incident radiation is in anarbitrary direction with respect to the reference axes the right-hand sideof equation (4.8) should also be summed over j .
Since the changes in polarizability are usually very much smaller thanthe polarizability itself, Raman scattering is typically ~ 10 ~3 times lessintense than Rayleigh scattering, which is in turn ~10~ 3 times lessintense than the incident radiation. The radiation scattered withfrequency v0 — vm is called the Stokes Raman radiation and that scatteredat frequency v0 + vm is called the anti-Stokes Raman radiation. Theformer is usually much more intense than the latter and this may only beunderstood by considering the quantum-mechanical description of theRaman scattering process.
Each of the modes of oscillation of the molecule may be considered tobe a simple harmonic oscillator which oscillates with frequency vm
independently of the oscillators representing the other modes.According to quantum mechanics, a harmonic oscillator of frequency vhas equally spaced energy levels of energy En given by
En = (n + \)hv (4.9)
where the quantum number n is any positive integer or zero. The Ramanprocess consists of the interaction of a photon of the incident light with
4.1 Semiclassical treatment of origins of spectra 113
the molecule in which the molecule loses or gains energy equal to thedifference in energy, hvm, between adjacent energy levels and the photonis scattered with an increase or decrease, respectively, of energy of thisamount. For any assembly of harmonic oscillators in thermalequilibrium at temperature T the ratio Rn of the number of oscillators inthe state with quantum number n to the number in the ground state withn = 0 is given by the Boltzmann factor:
Rn = e x p [ - (En - E0)/kT] = exp( -nhv/kT). (4.10)
Thus, unless hvm<kT there will be many more molecules in theground state than in any of the excited states and the number ofmolecules that will be excited to the level n—\ from the ground state bythe incident radiation will be significantly greater than the number thatare de-excited, since the intrinsic probabilities of these two processesoccurring are the same. If T = 300 K, then hv = kT for v = 6 x 10¹² Hz,a frequency which corresponds to 200 cm"1 . Most of the vibrationalmodes observed in Raman spectroscopy have frequencies higher thanthis, generally between about 400 and 3500 cm"1 , so that hvm >̂ kT. Amore complete treatment shows that there is also a frequency dependentterm [(v0 — vm)/(v0 + vm)]4 in the ratio of the intensities of the Stokes andanti-Stokes scattering, but the Boltzmann factor is the dominant one sothat the Stokes process predominates. It is therefore usual to scan onlythe Stokes side of the exciting line and Raman spectrometers are usuallydesigned to read wavenumber shifts from the exciting line as positive ifthe true wavenumber of the detected light is lower than that of theincident light. It should, however, be noted that many lattice modevibrations in crystals, and some torsional modes in individualmolecules, are at lower frequencies and it is sometimes useful to scan theanti-Stokes spectrum when the frequencies of interest are low enough forit to have appreciable intensity.
4.1.4 Raman scattering and the rule of mutual exclusionIt follows from the previous subsection that if a particular
normal mode with normal coordinate Um is to be Raman active it isnecessary for the partial derivative with respect to Um of at least onecomponent of the polarizability tensor [/?] to be different from zero. Ifwe define Gctj by
then the quantities 0Ltj are the components of a new symmetric secondrank tensor [a], the derivative polarizability tensor, or Raman tensor. It
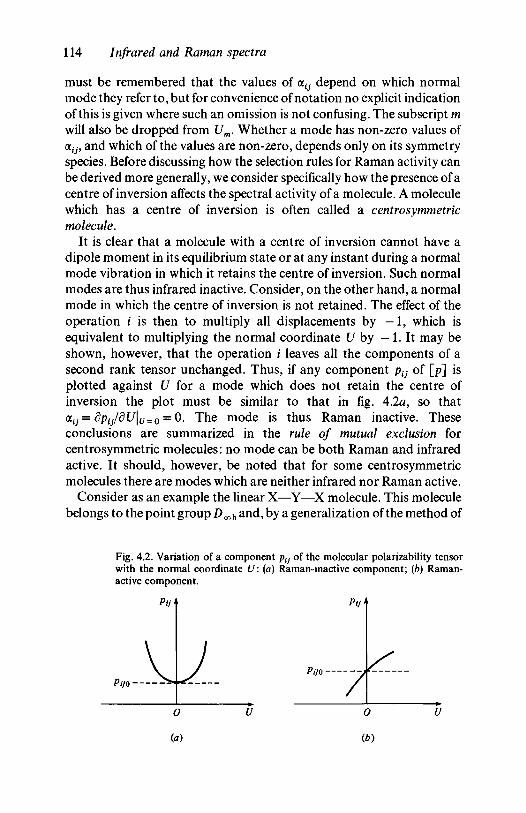
114 Infrared and Raman spectra
must be remembered that the values of OL{J depend on which normalmode they refer to, but for convenience of notation no explicit indicationof this is given where such an omission is not confusing. The subscript mwill also be dropped from Um. Whether a mode has non-zero values ofa,7, and which of the values are non-zero, depends only on its symmetryspecies. Before discussing how the selection rules for Raman activity canbe derived more generally, we consider specifically how the presence of acentre of inversion affects the spectral activity of a molecule. A moleculewhich has a centre of inversion is often called a centrosymmetricmolecule.
It is clear that a molecule with a centre of inversion cannot have adipole moment in its equilibrium state or at any instant during a normalmode vibration in which it retains the centre of inversion. Such normalmodes are thus infrared inactive. Consider, on the other hand, a normalmode in which the centre of inversion is not retained. The effect of theoperation i is then to multiply all displacements by — 1, which isequivalent to multiplying the normal coordinate U by — 1. It may beshown, however, that the operation i leaves all the components of asecond rank tensor unchanged. Thus, if any component ptj of [p] isplotted against U for a mode which does not retain the centre ofinversion the plot must be similar to that in fig. 4.2a, so that(xij=dpij/dU\u = o = 0. The mode is thus Raman inactive. Theseconclusions are summarized in the rule of mutual exclusion forcentrosymmetric molecules: no mode can be both Raman and infraredactive. It should, however, be noted that for some centrosymmetricmolecules there are modes which are neither infrared nor Raman active.
Consider as an example the linear X—Y—X molecule. This moleculebelongs to the point group D ^ and, by a generalization of the method of
Fig. 4.2. Variation of a component ptj of the molecular polarizability tensorwith the normal coordinate U: (a) Raman-inactive component; {b) Raman-active component.
Pif
Pi/o
Pif
O
(a)
O
(b)
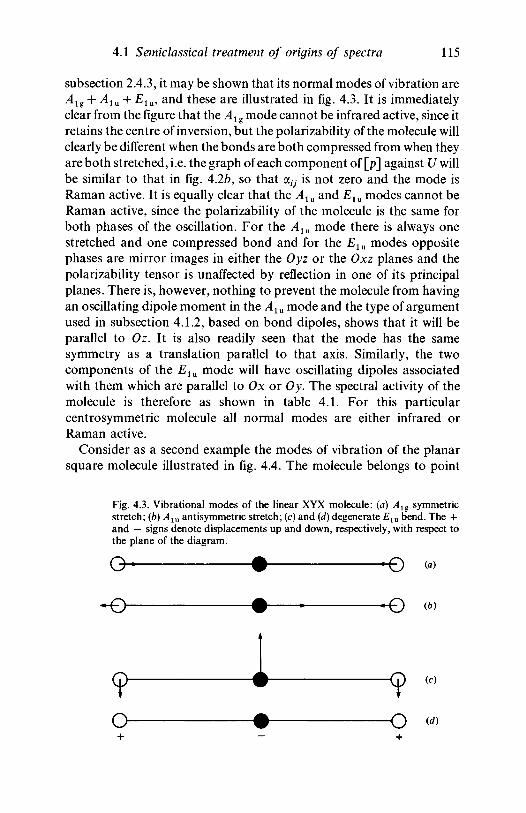
4.1 Semiclassical treatment of origins of spectra 115
subsection 2.4.3, it may be shown that its normal modes of vibration areAlg + Alu + Elu, and these are illustrated in fig. 4.3. It is immediatelyclear from the figure that the Alg mode cannot be infrared active, since itretains the centre of inversion, but the polarizability of the molecule willclearly be different when the bonds are both compressed from when theyare both stretched, i.e. the graph of each component of [p] against U willbe similar to that in fig. 4.2b, so that a0 is not zero and the mode isRaman active. It is equally clear that the Alu and Elu modes cannot beRaman active, since the polarizability of the molecule is the same forboth phases of the oscillation. For the Alu mode there is always onestretched and one compressed bond and for the Elu modes oppositephases are mirror images in either the Oyz or the Oxz planes and thepolarizability tensor is unaffected by reflection in one of its principalplanes. There is, however, nothing to prevent the molecule from havingan oscillating dipole moment in the Alu mode and the type of argumentused in subsection 4.1.2, based on bond dipoles, shows that it will beparallel to Oz. It is also readily seen that the mode has the samesymmetry as a translation parallel to that axis. Similarly, the twocomponents of the Elu mode will have oscillating dipoles associatedwith them which are parallel to Ox or 0y. The spectral activity of themolecule is therefore as shown in table 4.1. For this particularcentrosymmetric molecule all normal modes are either infrared orRaman active.
Consider as a second example the modes of vibration of the planarsquare molecule illustrated in fig. 4.4. The molecule belongs to point
Fig. 4.3. Vibrational modes of the linear XYX molecule: (a) Alg symmetricstretch; (b) Alu antisymmetric stretch; (c) and (d) degenerate Elu bend. The +and — signs denote displacements up and down, respectively, with respect tothe plane of the diagram.
(b)
(c)
o • o
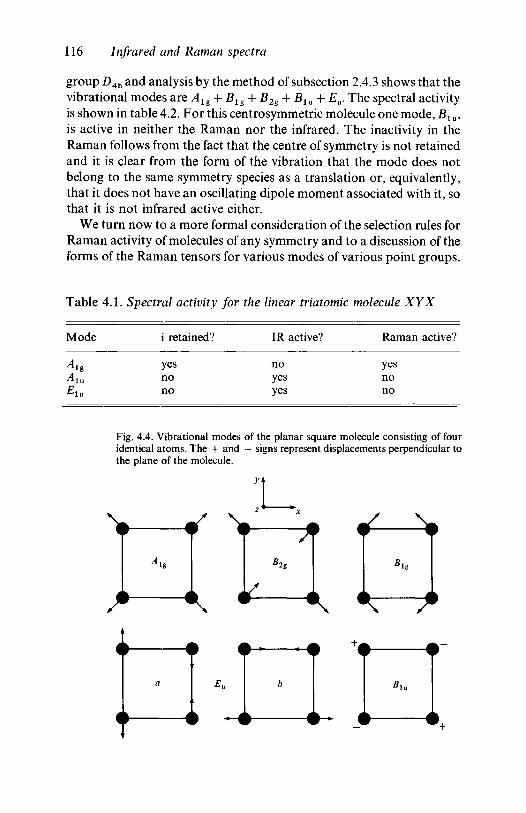
116 Infrared and Raman spectra
group D4h and analysis by the method of subsection 2.4.3 shows that thevibrational modes are Alg + Blg + B2g + Blu + Eu. The spectral activityis shown in table 4.2. For this centrosymmetric molecule one mode, Blu,is active in neither the Raman nor the infrared. The inactivity in theRaman follows from the fact that the centre of symmetry is not retainedand it is clear from the form of the vibration that the mode does notbelong to the same symmetry species as a translation or, equivalently,that it does not have an oscillating dipole moment associated with it, sothat it is not infrared active either.
We turn now to a more formal consideration of the selection rules forRaman activity of molecules of any symmetry and to a discussion of theforms of the Raman tensors for various modes of various point groups.
Table 4.1. Spectral activity for the linear triatomic molecule XYX
Mode i retained? IR active? Raman active?
Alg yes no yesAlu no yes noEiu no yes no
Fig. 4.4. Vibrational modes of the planar square molecule consisting of fouridentical atoms. The + and — signs represent displacements perpendicular tothe plane of the molecule.
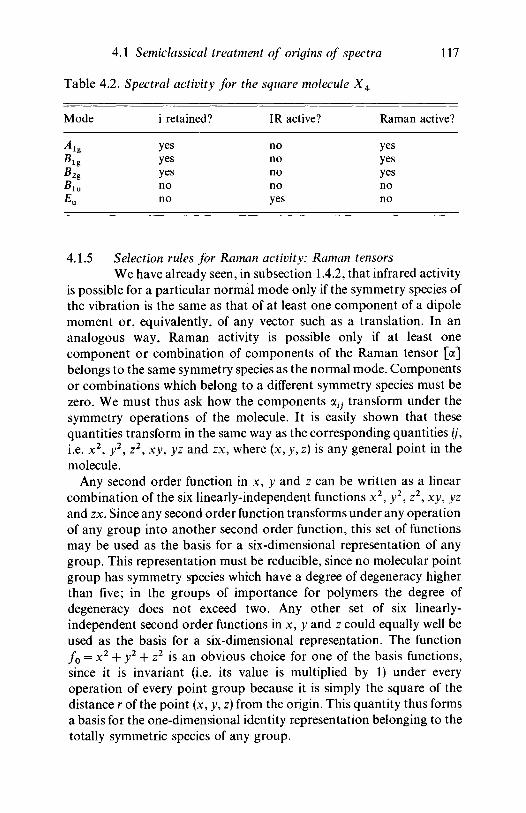
4.1 Semiclassical treatment of origins of spectra 117
Table 4.2. Spectral activity for the square molecule X4
Mode
Alg
* i .
Eu
i retained?
yesyesyesnono
IR active?
nonononoyes
Raman active?
yesyesyesnono
4.1.5 Selection rules for Raman activity: Raman tensorsWe have already seen, in subsection 1.4.2, that infrared activity
is possible for a particular normal mode only if the symmetry species ofthe vibration is the same as that of at least one component of a dipolemoment or, equivalently, of any vector such as a translation. In ananalogous way, Raman activity is possible only if at least onecomponent or combination of components of the Raman tensor [a]belongs to the same symmetry species as the normal mode. Componentsor combinations which belong to a different symmetry species must bezero. We must thus ask how the components a0 transform under thesymmetry operations of the molecule. It is easily shown that thesequantities transform in the same way as the corresponding quantities ij,i.e. x2, y2, z2, xy, yz and zx, where (x, y, z) is any general point in themolecule.
Any second order function in x, y and z can be written as a linearcombination of the six linearly-independent functions x2, y2, z2, xy, yzand zx. Since any second order function transforms under any operationof any group into another second order function, this set of functionsmay be used as the basis for a six-dimensional representation of anygroup. This representation must be reducible, since no molecular pointgroup has symmetry species which have a degree of degeneracy higherthan five; in the groups of importance for polymers the degree ofdegeneracy does not exceed two. Any other set of six linearly-independent second order functions in x, y and z could equally well beused as the basis for a six-dimensional representation. The functionf0 = x2 + y2 + z2 is an obvious choice for one of the basis functions,since it is invariant (i.e. its value is multiplied by 1) under everyoperation of every point group because it is simply the square of thedistance r of the point (x, y, z) from the origin. This quantity thus formsa basis for the one-dimensional identity representation belonging to thetotally symmetric species of any group.
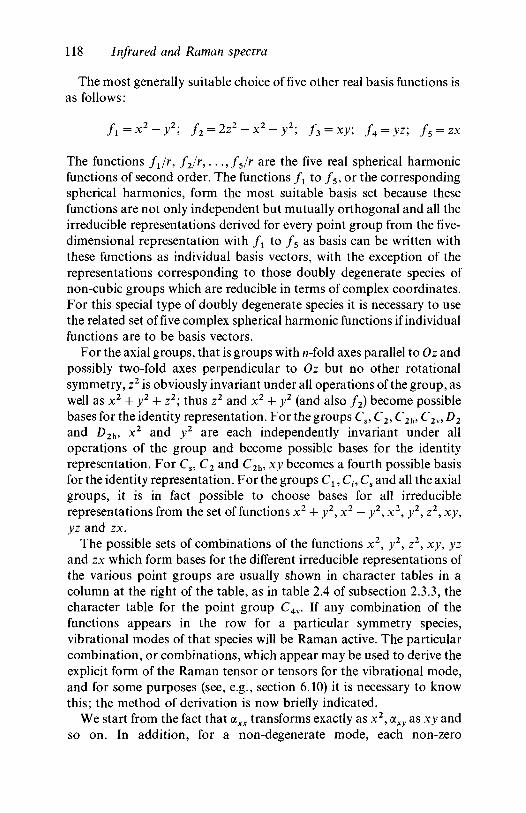
118 Infrared and Raman spectra
The most generally suitable choice of five other real basis functions isas follows:
f =X2 — V2' f, — 272 — X2 — V2' f —XV f — V7' f — 7Y
The functions f1/r, f2/r,.. .,f5/r are the five real spherical harmonicfunctions of second order. The functions / x to f5, or the correspondingspherical harmonics, form the most suitable basis set because thesefunctions are not only independent but mutually orthogonal and all theirreducible representations derived for every point group from the five-dimensional representation with fx to f5 as basis can be written withthese functions as individual basis vectors, with the exception of therepresentations corresponding to those doubly degenerate species ofnon-cubic groups which are reducible in terms of complex coordinates.For this special type of doubly degenerate species it is necessary to usethe related set of five complex spherical harmonic functions if individualfunctions are to be basis vectors.
For the axial groups, that is groups with n-fold axes parallel to Oz andpossibly two-fold axes perpendicular to Oz but no other rotationalsymmetry, z2 is obviously invariant under all operations of the group, aswell as x2 + y2 + z2; thus z2 and x2 + y2 (and also f2) become possiblebases for the identity representation. For the groups Cs, C2, C2h, C2v, D2
and D2h, x2 and y2 are each independently invariant under alloperations of the group and become possible bases for the identityrepresentation. For Cs, C2 and C2h, xy becomes a fourth possible basisfor the identity representation. For the groups C1, Ct, Cs and all the axialgroups, it is in fact possible to choose bases for all irreduciblerepresentations from the set of functions x2 + y2, x2 — y2, x2, y2, z2, xy,yz and zx.
The possible sets of combinations of the functions x2, y2, z2, xy, yzand zx which form bases for the different irreducible representations ofthe various point groups are usually shown in character tables in acolumn at the right of the table, as in table 2.4 of subsection 2.3.3, thecharacter table for the point group C4v. If any combination of thefunctions appears in the row for a particular symmetry species,vibrational modes of that species will be Raman active. The particularcombination, or combinations, which appear may be used to derive theexplicit form of the Raman tensor or tensors for the vibrational mode,and for some purposes (see, e.g., section 6.10) it is necessary to knowthis; the method of derivation is now briefly indicated.
We start from the fact that axx transforms exactly as x2, ccxy as xy andso on. In addition, for a non-degenerate mode, each non-zero
4.1 Semiclassical treatment of origins of spectra 119
component of the tensor must belong to the same symmetry species asthe normal mode. Consider a specific example: can axx be non-zero forthe Ax species of point group C4v? Now axx = (OLXX + ayy)/2 +(aXJC — ocyy)/2 and the last column of table 2.4 shows that x2 + y2, andthus aixx + CLyy, belongs to the Ax species whereas x2 — y2, and henceOLXX — ocyy, does not. Thus axx can only belong to this species if <xxx = <xyy.In a similar way it is possible, by setting equal to zero the combinationsof tensor components corresponding to any of f0 to f5 which do notbelong to that particular species, to deduce any relationships whichmust exist between the Raman tensor components of any non-degenerate species and also whether any components must be zero. Thefollowing relationships can thus be found between expressions in thecolumn of the character table relating to second order functions and theRaman tensors for the corresponding non-degenerate species:
x2 + y2 implies ocxx = ayy
x2 + y2 + z2 implies ocxx = ocyy = azz
x2 — y2 implies ocxx = — ayy
The entry x2, y2, z2,xy, yz or zx implies simply that the correspondingcomponent <xxx or ocyy, etc. may be non-zero. For C4v the forms of theRaman tensors corresponding to non-degenerate modes are thus of theform
a
a
b
— c
B,:
where the dots signify zero components, and the A2 mode is Ramaninactive.
Similarly, for the pairs of tensors corresponding to doubly degeneratespecies of axial point groups (other than those for which the individualcomplex spherical harmonic functions form bases for two separatecomplex one-dimensional representations) we can deduce the simplestforms of each of the individual tensors in the following way:
(i) First set equal to zero any of f'o to / '5 which does not belong tothat symmetry species, where f\ is the combination of tensorcomponents corresponding to f.
(ii) For any tensor of the degenerate multiplet which contains f'i9set to zero all those f\ to f'5 which do not have the samesymmetry as f\ with respect to any C2 or ov element parallel toOx or Oy.
120 Infrared and Raman spectra
(iii) Use the condition that the total intensity due to any multipletmust be invariant for any operation of the group to relate thecomponents of the tensors of a pair quantitatively to each other.
Consideration of these three point shows, for instance, that the pair oftensors corresponding to the degenerate Eg modes for the point groupD3d are of the form
-c d
d .
-c -d
— c
-d
For those doubly degenerate species so far excluded it may be shownthat the entries (x2 — y2, xy) or (yz, zx) imply tensor pairs of the forms
a b
b -a
b -a
-a —bor -d
c
-d c
respectively. If both pairs of functions belong to the same doublydegenerate species then the possible pairs of tensors have only oczz = 0.
4.2 Polarization effects4.2.1 Polarized infrared spectroscopy - dichroic ratios
If a polymer is allowed to solidify from the melt or fromsolution, to give a rubbery, glassy or partially crystalline solid, the axesof the molecular segments or crystallites are usually randomly or nearlyrandomly oriented, i.e. there is no tendency for the axes to be parallel toany particular direction in the solid rather than another. It is difficult toproduce perfectly random orientation, but if there is no preferredorientation the material is isotropic in its physical properties. Inparticular, if an infrared spectrum is obtained using polarized infraredradiation incident normally on a thin film sample produced in such away that its molecules are randomly oriented the spectrum will be thesame for any orientation of the polarization vector within the plane ofthe film. If, however, the film is stretched before the spectrum is obtainedit will generally be found that the spectrum is no longer independent ofthe orientation of the polarization vector. This is because the stretchingcauses a partial alignment of the axes of the molecules, usually towardsthe direction of stretching, so that the material is no longer isotropic.
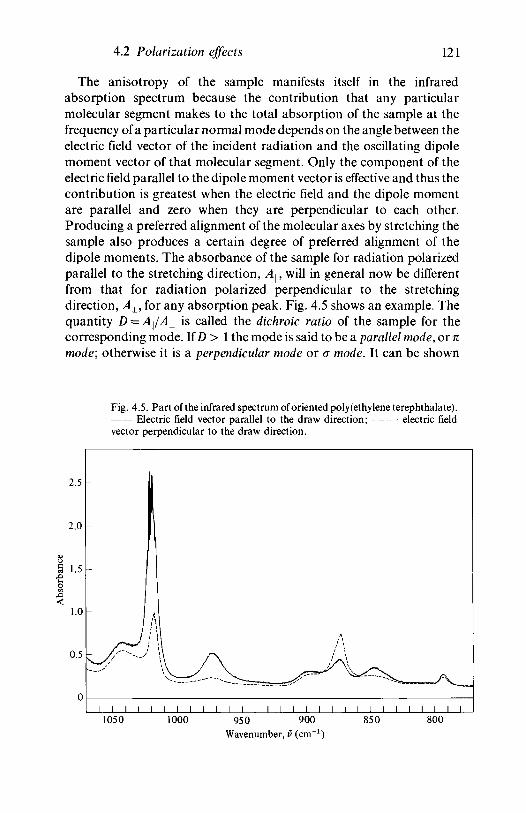
4.2 Polarization effects 121
The anisotropy of the sample manifests itself in the infraredabsorption spectrum because the contribution that any particularmolecular segment makes to the total absorption of the sample at thefrequency of a particular normal mode depends on the angle between theelectric field vector of the incident radiation and the oscillating dipolemoment vector of that molecular segment. Only the component of theelectric field parallel to the dipole moment vector is effective and thus thecontribution is greatest when the electric field and the dipole momentare parallel and zero when they are perpendicular to each other.Producing a preferred alignment of the molecular axes by stretching thesample also produces a certain degree of preferred alignment of thedipole moments. The absorbance of the sample for radiation polarizedparallel to the stretching direction, Ap will in general now be differentfrom that for radiation polarized perpendicular to the stretchingdirection, Al9 for any absorption peak. Fig. 4.5 shows an example. Thequantity D = A^AL is called the dichroic ratio of the sample for thecorresponding mode. If D > 1 the mode is said to be a parallel mode, or nmode; otherwise it is a perpendicular mode or a mode. It can be shown
Fig. 4.5. Part of the infrared spectrum of oriented poly(ethylene terephthalate).Electric field vector parallel to the draw direction; electric field
vector perpendicular to the draw direction.
2.5
1050 1000 950 900 850 800Wavenumber, v (cm"1)
122 Infrared and Raman spectra
that, for the simplest kind of distribution of molecular orientationsproduced by stretching, n modes are those for which the angle 6 betweenthe dipole moment due to any molecular segment and the axis of thatsegment is less than 54.7° and that o modes are those for which6 > 54.7°. Information about whether a particular mode is a n or a modemay help to identify the origin of the mode, as will be explained insubsection 4.3.2. Measurements of infrared dichroism can also give usefulinformation about the degree of molecular orientation in polymersamples and their use for this purpose is discussed in chapter 6.
4.2.2 Polarized Raman spectroscopy - depolarization ratiosTwo beams of radiation are necessarily involved in the
recording of a Raman spectrum; the incident beam and the scatteredbeam. The fact that the state of polarization of both beams must beconsidered makes a discussion of polarization effects in Ramanspectroscopy necessarily more complicated than that just given forinfrared spectroscopy. It also has the effect of making Ramanspectroscopy a more powerful tool than infrared spectroscopy forstudying both oriented and isotropic systems of molecules because moreinformation can be obtained about them. In this section we shallconsider only the information obtainable about isotropic systems;oriented systems are discussed in chapter 6.
Equations (4.2d), (4.8) and (4.11) show that the amplitude of theinduced dipole moment which gives rise to Raman scattering is given by
H = const-aE0 (4.12)
Let polarized light be incident on a single molecule with the electric fieldof the light wave parallel to the axis Ox} of a set of axes Oxxx2X3 fixed inspace, so that the only non-zero component of the electric field is Ejm Ifthe scattered radiation is observed through an analyser which allowsonly light with its electric vector parallel to Oxt to pass, the amplitudetransmitted by the analyser is proportional to fxt. Thus, the observedintensity is proportional to a?. The constant of proportionality dependson Ej0, i.e. on the incident light intensity, and on instrumental factorswhich govern the efficiency with which the Raman scattered light iscollected. Provided that the observed intensities have been corrected forany polarization sensitivity of the spectrometer, we can thus write
/y = /o«5 (4.13)
where Itj is the intensity observed for incident and scattered lightpolarization vectors E parallel to OXJ and Oxi9 respectively, and / 0 is aconstant independent of i and j .
4.2 Polarization effects 123
We now evaluate the ratio pl = IJI\\ = /*//«, with i^j, for anassembly of randomly oriented molecules, where 7| is the intensitymeasured for parallel polarization vectors and I± that for perpendicularpolarization vectors of the incident and scattered light, respectively. Thequantity pl is called the linear depolarization ratio, linear because theincident and the scattered radiation are linearly polarized. Thus
where the summations extend over all the molecules which contribute tothe observed scattered light and the brackets < > denote valuesaveraged over the random distribution of these molecules.
In order to perform the averages we introduce the principalcomponents a l9 a2 and a3 of [a] and use the expression
^ij = Y,aikajk^k (4.15)k
where atj are the elements of the direction cosine matrix which relates theprincipal axes of [a] to the axes Ox1x2x3 fixed in space. Thus
Iw *k*i(alfiii>
It can be shown that the values of the averages are
<flffcfl</fcflMfli/7> = - 3 0 0" *h k # 0 ; <<4> = 5
Hence
ccf + ocl + OL\ — ct1a2 ~ a 2 a 3 "" a 3 a i iPl ~ 3 ( a 2 + a | + a | ) + 2 ( ^ + a a + a a ) " 4 5 a 23(a2 + a | + a|) + 2 ( ^ 2 + a2a3 + a3a2) 45a2 + 4j82
where <4-17>
a=3(a i + a 2 + as) (4.18a)
2P2 = ( a i - a 2 ) 2 + (a2 - a 3 ) 2 + (a3 - a j 2 (4.18b)
The quantity a is the mean value of the three principal components of[a] and is often called the spherical part of the tensor. The quantity /?
124 Infrared and Raman spectra
measures the anisotropy of the tensor, since it is only zero if all threeprincipal components are equal, in which case [a] has sphericalsymmetry.
A second depolarization ratio pn is sometimes defined for illuminationwith unpolarized or natural light when the scattered light is observed ina direction at right angles to that along which the incident lightpropagates:
where /j and I'± are the intensities for the observed light polarizedparallel or perpendicular, respectively, to the propagation direction ofthe incident light. It may be shown, by a method similar to the above,that
^ 2 2P |
Since the laser beams used nowadays for exciting Raman spectra areusually polarized, pn is not often quoted and will not be consideredfurther. The importance of the depolarization ratio pl is that its valuegives information about the symmetry species to which a mode belongsand thus the determination of depolarization ratios providesinformation about the symmetry of the molecule.
It is a property of any second rank tensor [T] that the quantityTx x + T22 + T33 is independent of the choice of reference axes, i.e. it is atensor invariant. Let 5^ be the change in the component ptj of themolecular polarizability tensor produced by any distortion of themolecule from its equilibrium state, so that any component oeI7 of theRaman tensor [a] is equal to the value of dtj for unit positive vibrationaldistortion of the molecule from its equilibrium state according to theform of the eigenvector for the mode in question. Let this be a non-degenerate mode not belonging to the totally symmetric species, so thatthere must be at least one symmetry operation which has character — 1.Consider the molecule with the unit positive distortion and imagine arotation of axes, with respect to the fixed molecule, which produces thesame relative reorientation of the molecule with respect to the axes aswould a particular operation with character — 1, where the operationmoves the molecule and the axes are regarded as fixed. Since it is a tensorinvariant, the quantity S11 + b22 + ^33 is unchanged by the rotation ofaxes. The operation on the molecule for fixed axes would, however,reverse the displacements of all the atoms and hence would reverse thesigns of all the 5tj (see fig. 4.2b). It follows that S1X + S22 + ^33 must bezero for this mode and so therefore must ^(axl + a22 + a33) =
4.3 Vibrational assignments 125
-5(0̂ + a2 + a3) = a. A slightly more difficult argument shows that a mustalso be zero for degenerate modes, so that a = 0 for all modes which donot belong to totally symmetric species. Thus the depolarization ratiotakes the following values:
for totally symmetric species, 0^p z ^3 /4 (4.2 la)
for all other species, pl = 3/4 (4.21b)
If P/ = 0, the Raman peak, or the corresponding mode, is said to betotally polarized, and /? must be zero; the polarizability is isotropic at allinstants during the vibration so that light is scattered only with the samepolarization as that of the incident light. The only species for whichPi = 0 are the totally symmetric species of cubic or icosahedralsymmetry, so that this value does not occur for the vibrational modes ofpolymers. If pt < | the peak or mode is said to be polarized or partiallypolarized (p) and if px = \ the line is said to be depolarized (d). Modeswith pt = | are sometimes said to be 'completely depolarized' but this is ausage best avoided since, by definition, completely depolarizedscattering would have pt=l.
It should be noted that measurements of depolarization ratios,particularly on polymers, often give results that are higher than wouldbe given by an ideal sample because of polarization scrambling causedby inhomogeneities in the sample, and care must be taken in interpretingthem. Care must also be taken to avoid molecular orientation in thesample.
4.3 Vibrational assignments4.3.1 Introduction
The observed vibrational spectrum of any polymer consists of alarge number of peaks and any peak is said to have been assigned whenits origin is understood. This understanding, or assignment, may, inprinciple, be at one of several levels of refinement. In practice, theprocess of determining the assignment may involve tackling the problemat several levels simultaneously. The levels at which the assignment maybe known for a polymer are, in order of increasing detail:
(1) to a chemical species or molecular configuration;(2) to the crystalline or amorphous region;(3) to a specific molecular conformation;(4) to a symmetry species;(5) to a specific normal mode, i.e. to a specific eigenvector.
It is clear that assignment to a chemical species or molecularconfiguration is required only if more than one species or configuration
126 Infrared and Raman spectra
is present in the sample, but this is often so, particularly in commercialpolymers. If samples are available in which the concentrations of thespecies or configurations vary sufficiently it should be possible,particularly for a simple binary mixture, to divide the observed peaks inthe spectrum into two sets such that the intensities of the peaks in one setall increase with respect to those of the peaks in the other set when theconcentration is changed. Each subspectrum corresponding to aparticular set can then be treated as a separate spectrum for furtherassignment. Some peaks may not be sensitive to concentration and mustbe treated as belonging partially to both subspectra, since such a peakmust be the result of the overlap of peaks belonging to each of the twocomponents.
In a similar manner, if the crystallinity of a sample can be variedsubstantially, for instance by suitable heat treatment, it should bepossible to assign some peaks to the crystalline regions and some to theamorphous regions. It should be noted that heat treatment of a samplemay produce changes of molecular conformation in the non-crystallineregions and spectral changes will generally accompany these in additionto any due to changes in crystallinity or crystalline perfection.
Examples of these kinds of assignment, which are at the first two levelsof refinement, and of their usefulness in providing information about thestructure of polymers will be discussed in subsequent chapters. Thepractical difficulties that arise because of the finite widths andconsequent overlapping of the peaks will be discussed there. In theremainder of this section we shall consider various methods which maybe used to give information about assignments at the higher levels ofrefinement, or at the lower levels when simpler methods fail. We firstindicate how the ideas of symmetry, selection rules and polarizationeffects discussed in earlier sections may be used in principle to produceassignments for the spectrum of a polymer consisting of a singlechemical species with a single configuration and a regularconformational structure. We then consider three related techniques:the use of group frequencies, model compounds and isotopesubstitution. A more theoretical approach to detailed vibrationalassignment and to the overall understanding of molecular dynamicsinvolves the attempt to calculate vibrational mode frequencies and abrief introduction to vibrational calculations is given in section 4.4.
4.3.2 Factor group analysis - chain or local symmetryConsider a monosubstituted vinyl polymer consisting largely of
molecules of only one tacticity. The first column of table 4.3 shows allthe reasonably likely structures for each tacticity, together with the
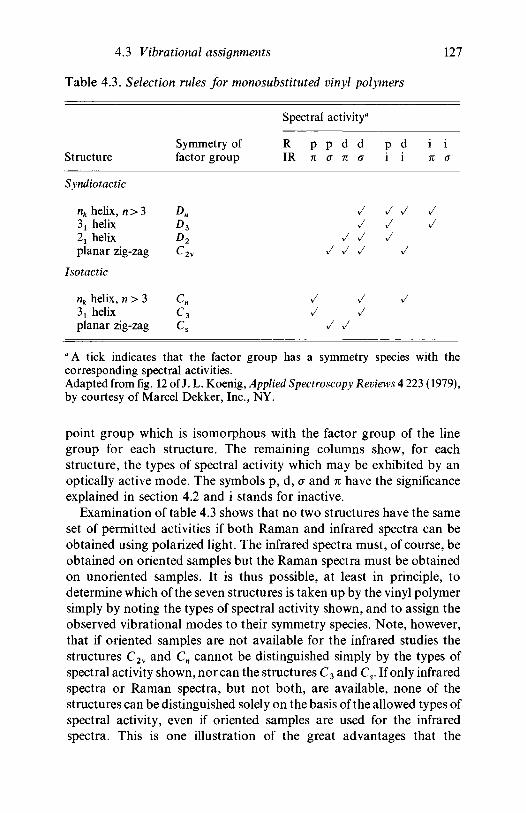
4.3 Vibrational assignments 127
Table 4.3. Selection rules for monosubstituted vinyl polymers
Spectral activity0
Symmetry of R p p d d p d i i
Structure factor group IR n a n a i i no
Syndiotactic
Hfc helix, n>3 Dn / / / /31 helix D3 / / %/2X helix D2 / / /planar zig-zag C2v / / / /
nfc helix, n>3 Cn / / /3j helix C3 >/ %/planar zig-zag Cs / /
"A tick indicates that the factor group has a symmetry species with thecorresponding spectral activities.Adapted from fig. 12 of J. L. Koenig, Applied Spectroscopy Reviews 4 223 (1979),by courtesy of Marcel Dekker, Inc., NY.
point group which is isomorphous with the factor group of the linegroup for each structure. The remaining columns show, for eachstructure, the types of spectral activity which may be exhibited by anoptically active mode. The symbols p, d, o and n have the significanceexplained in section 4.2 and i stands for inactive.
Examination of table 4.3 shows that no two structures have the sameset of permitted activities if both Raman and infrared spectra can beobtained using polarized light. The infrared spectra must, of course, beobtained on oriented samples but the Raman spectra must be obtainedon unoriented samples. It is thus possible, at least in principle, todetermine which of the seven structures is taken up by the vinyl polymersimply by noting the types of spectral activity shown, and to assign theobserved vibrational modes to their symmetry species. Note, however,that if oriented samples are not available for the infrared studies thestructures C2v and Cn cannot be distinguished simply by the types ofspectral activity shown, nor can the structures C3 and Cs. If only infraredspectra or Raman spectra, but not both, are available, none of thestructures can be distinguished solely on the basis of the allowed types ofspectral activity, even if oriented samples are used for the infraredspectra. This is one illustration of the great advantages that the
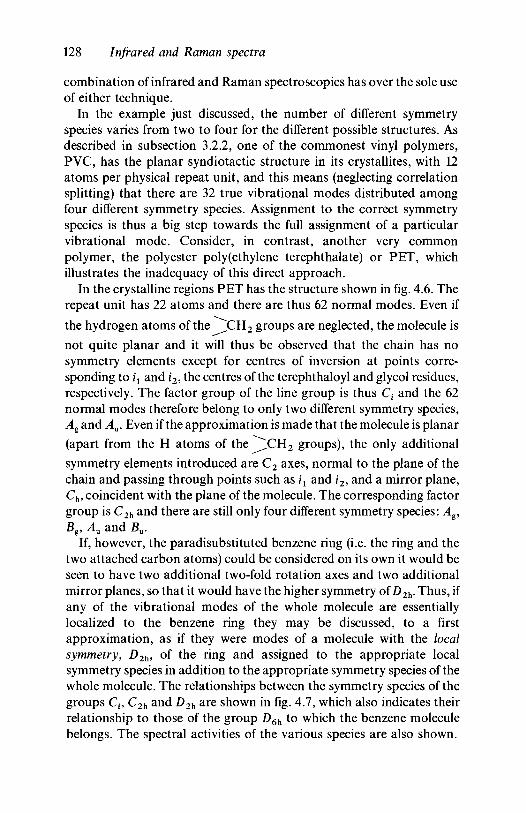
128 Infrared and Raman spectra
combination of infrared and Raman spectroscopies has over the sole useof either technique.
In the example just discussed, the number of different symmetryspecies varies from two to four for the different possible structures. Asdescribed in subsection 3.2.2, one of the commonest vinyl polymers,PVC, has the planar syndiotactic structure in its crystallites, with 12atoms per physical repeat unit, and this means (neglecting correlationsplitting) that there are 32 true vibrational modes distributed amongfour different symmetry species. Assignment to the correct symmetryspecies is thus a big step towards the full assignment of a particularvibrational mode. Consider, in contrast, another very commonpolymer, the polyester poly(ethylene terephthalate) or PET, whichillustrates the inadequacy of this direct approach.
In the crystalline regions PET has the structure shown in fig. 4.6. Therepeat unit has 22 atoms and there are thus 62 normal modes. Even if
the hydrogen atoms of the CH2 groups are neglected, the molecule is
not quite planar and it will thus be observed that the chain has nosymmetry elements except for centres of inversion at points corre-sponding to ix and i2, the centres of the terephthaloyl and glycol residues,respectively. The factor group of the line group is thus C{ and the 62normal modes therefore belong to only two different symmetry species,Ag and Au. Even if the approximation is made that the molecule is planar
(apart from the H atoms of the ^ C H 2 groups), the only additional
symmetry elements introduced are C2 axes, normal to the plane of thechain and passing through points such as ix and i2, and a mirror plane,Ch, coincident with the plane of the molecule. The corresponding factorgroup is C2h and there are still only four different symmetry species: Av
JBg, Au and Bu.If, however, the paradisubstituted benzene ring (i.e. the ring and the
two attached carbon atoms) could be considered on its own it would beseen to have two additional two-fold rotation axes and two additionalmirror planes, so that it would have the higher symmetry of D2h. Thus, ifany of the vibrational modes of the whole molecule are essentiallylocalized to the benzene ring they may be discussed, to a firstapproximation, as if they were modes of a molecule with the localsymmetry, D2h, of the ring and assigned to the appropriate localsymmetry species in addition to the appropriate symmetry species of thewhole molecule. The relationships between the symmetry species of thegroups Ch C2h and D2h are shown in fig. 4.7, which also indicates theirrelationship to those of the group D6h to which the benzene moleculebelongs. The spectral activities of the various species are also shown.
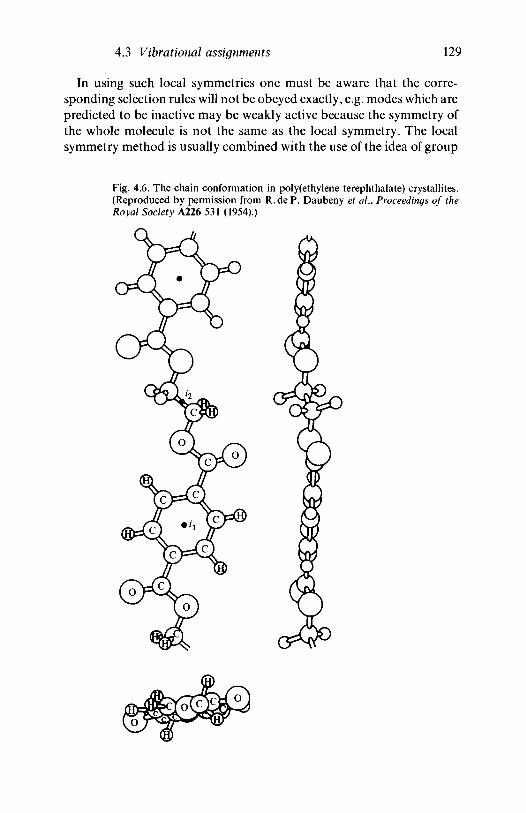
4.3 Vibrational assignments 129
In using such local symmetries one must be aware that the corre-sponding selection rules will not be obeyed exactly, e.g. modes which arepredicted to be inactive may be weakly active because the symmetry ofthe whole molecule is not the same as the local symmetry. The localsymmetry method is usually combined with the use of the idea of group
Fig. 4.6. The chain conformation in poly(ethylene terephthalate) crystallites.(Reproduced by permission from R. de P. Daubeny et al., Proceedings of theRoyal Society A226 531 (1954).)
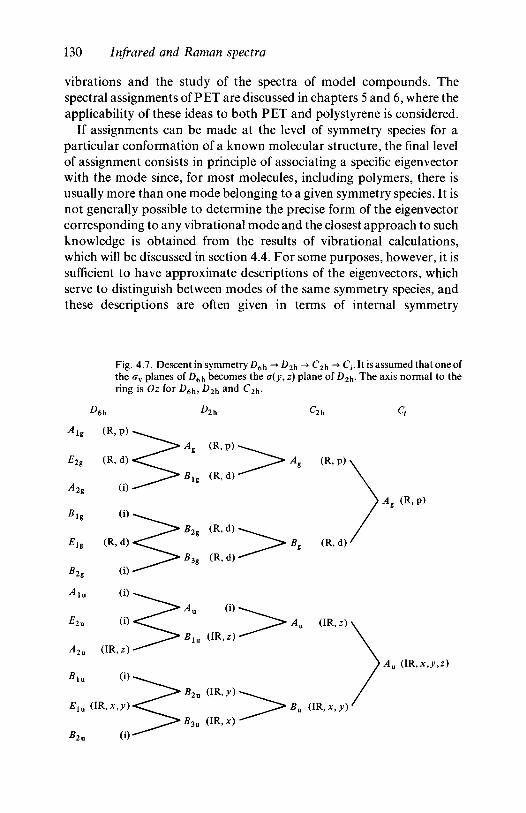
130 Infrared and Raman spectra
vibrations and the study of the spectra of model compounds. Thespectral assignments of PET are discussed in chapters 5 and 6, where theapplicability of these ideas to both PET and polystyrene is considered.
If assignments can be made at the level of symmetry species for aparticular conformation of a known molecular structure, the final levelof assignment consists in principle of associating a specific eigenvectorwith the mode since, for most molecules, including polymers, there isusually more than one mode belonging to a given symmetry species. It isnot generally possible to determine the precise form of the eigenvectorcorresponding to any vibrational mode and the closest approach to suchknowledge is obtained from the results of vibrational calculations,which will be discussed in section 4.4. For some purposes, however, it issufficient to have approximate descriptions of the eigenvectors, whichserve to distinguish between modes of the same symmetry species, andthese descriptions are often given in terms of internal symmetry
Fig. 4.7. Descent in symmetry D6h -• D2h -*• C2h -+ Ct. It is assumed that one ofthe crv planes of D6h becomes the a(y, z) plane of D2h- The axis normal to thering is Oz for D6h, D2h and C2h.
Ag (R, P)
, x,y,z)
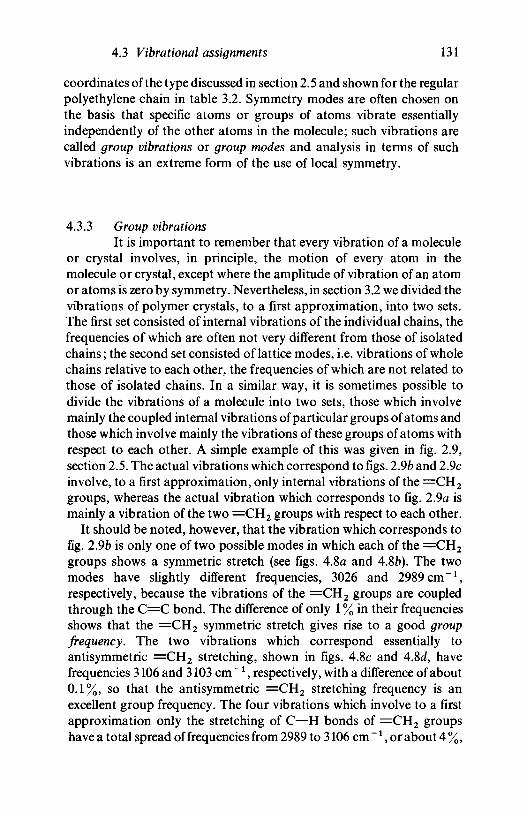
4.3 Vibrational assignments 131
coordinates of the type discussed in section 2.5 and shown for the regularpolyethylene chain in table 3.2. Symmetry modes are often chosen onthe basis that specific atoms or groups of atoms vibrate essentiallyindependently of the other atoms in the molecule; such vibrations arecalled group vibrations or group modes and analysis in terms of suchvibrations is an extreme form of the use of local symmetry.
4.3.3 Group vibrationsIt is important to remember that every vibration of a molecule
or crystal involves, in principle, the motion of every atom in themolecule or crystal, except where the amplitude of vibration of an atomor atoms is zero by symmetry. Nevertheless, in section 3.2 we divided thevibrations of polymer crystals, to a first approximation, into two sets.The first set consisted of internal vibrations of the individual chains, thefrequencies of which are often not very different from those of isolatedchains; the second set consisted of lattice modes, i.e. vibrations of wholechains relative to each other, the frequencies of which are not related tothose of isolated chains. In a similar way, it is sometimes possible todivide the vibrations of a molecule into two sets, those which involvemainly the coupled internal vibrations of particular groups of atoms andthose which involve mainly the vibrations of these groups of atoms withrespect to each other. A simple example of this was given in fig. 2.9,section 2.5. The actual vibrations which correspond to figs. 2.9ft and 2.9cinvolve, to a first approximation, only internal vibrations of the = C H 2
groups, whereas the actual vibration which corresponds to fig. 2.9a ismainly a vibration of the two = C H 2 groups with respect to each other.
It should be noted, however, that the vibration which corresponds tofig. 2.9b is only one of two possible modes in which each of the = C H 2
groups shows a symmetric stretch (see figs. 4.8a and 4.8ft). The twomodes have slightly different frequencies, 3026 and 2989 cm"1 ,respectively, because the vibrations of the = C H 2 groups are coupledthrough the C = C bond. The difference of only 1 % in their frequenciesshows that the = C H 2 symmetric stretch gives rise to a good groupfrequency. The two vibrations which correspond essentially toantisymmetric = C H 2 stretching, shown in figs. 4.8c and 4.8d, havefrequencies 3106 and 3103 cm"1 , respectively, with a difference of about0.1%, so that the antisymmetric =CH2 stretching frequency is anexcellent group frequency. The four vibrations which involve to a firstapproximation only the stretching of C—H bonds of = C H 2 groupshave a total spread of frequencies from 2989 to 3106 cm"1 , or about 4 %,
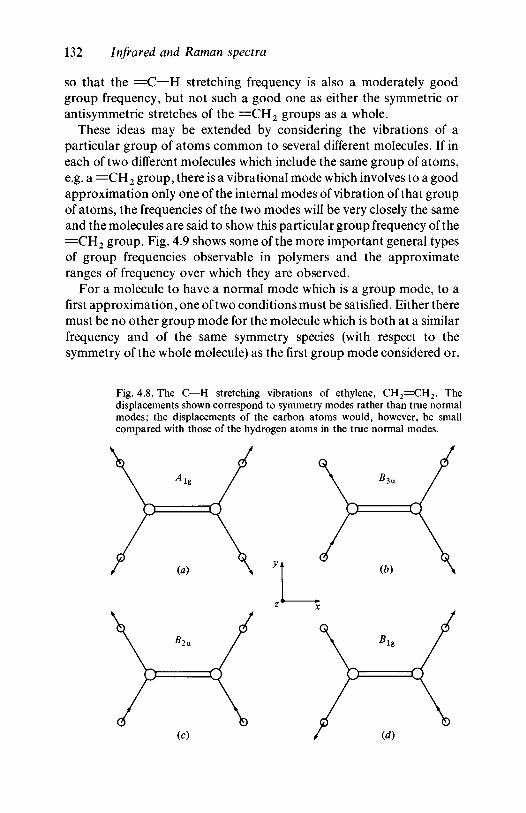
132 Infrared and Raman spectra
so that the =C—H stretching frequency is also a moderately goodgroup frequency, but not such a good one as either the symmetric orantisymmetric stretches of the = C H 2 groups as a whole.
These ideas may be extended by considering the vibrations of aparticular group of atoms common to several different molecules. If ineach of two different molecules which include the same group of atoms,e.g. a = C H 2 group, there is a vibrational mode which involves to a goodapproximation only one of the internal modes of vibration of that groupof atoms, the frequencies of the two modes will be very closely the sameand the molecules are said to show this particular group frequency of the= C H 2 group. Fig. 4.9 shows some of the more important general typesof group frequencies observable in polymers and the approximateranges of frequency over which they are observed.
For a molecule to have a normal mode which is a group mode, to afirst approximation, one of two conditions must be satisfied. Either theremust be no other group mode for the molecule which is both at a similarfrequency and of the same symmetry species (with respect to thesymmetry of the whole molecule) as the first group mode considered or,
Fig. 4.8. The C—H stretching vibrations of ethylene, CH 2 =CH 2 . Thedisplacements shown correspond to symmetry modes rather than true normalmodes; the displacements of the carbon atoms would, however, be smallcompared with those of the hydrogen atoms in the true normal modes.
(a) y\ (b)
(c) id)
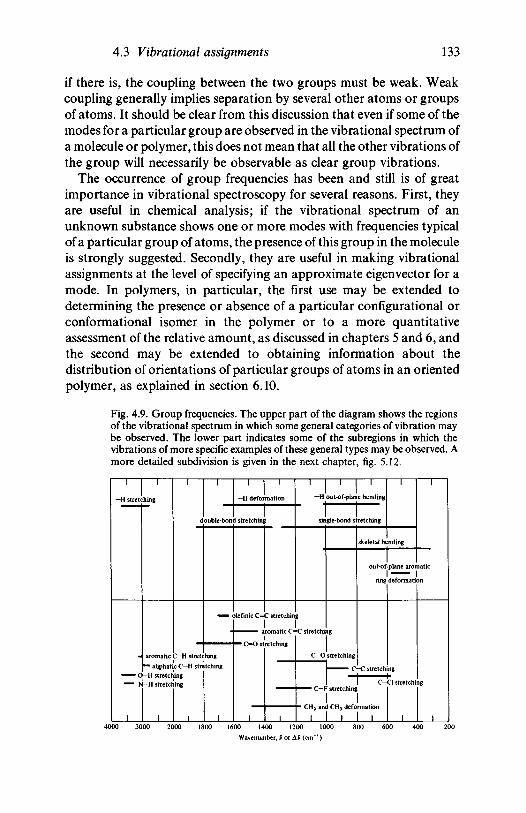
4.3 Vibrational assignments 133
if there is, the coupling between the two groups must be weak. Weakcoupling generally implies separation by several other atoms or groupsof atoms. It should be clear from this discussion that even if some of themodes for a particular group are observed in the vibrational spectrum ofa molecule or polymer, this does not mean that all the other vibrations ofthe group will necessarily be observable as clear group vibrations.
The occurrence of group frequencies has been and still is of greatimportance in vibrational spectroscopy for several reasons. First, theyare useful in chemical analysis; if the vibrational spectrum of anunknown substance shows one or more modes with frequencies typicalof a particular group of atoms, the presence of this group in the moleculeis strongly suggested. Secondly, they are useful in making vibrationalassignments at the level of specifying an approximate eigenvector for amode. In polymers, in particular, the first use may be extended todetermining the presence or absence of a particular configurational orconformational isomer in the polymer or to a more quantitativeassessment of the relative amount, as discussed in chapters 5 and 6, andthe second may be extended to obtaining information about thedistribution of orientations of particular groups of atoms in an orientedpolymer, as explained in section 6.10.
Fig. 4.9. Group frequencies. The upper part of the diagram shows the regionsof the vibrational spectrum in which some general categories of vibration maybe observed. The lower part indicates some of the sub regions in which thevibrations of more specific examples of these general types may be observed. Amore detailed subdivision is given in the next chapter, fig. 5.12.
1
- H stretc
— 0— >
1
1
hing
1
c
1
ouble-bon
aromatic C—H stretching
— aliphati•-H stretcl- H stretcl
1
c C-H streinging
1
tching
1
1
- H defor
1 stretchini
)lefinic C=
I
mation
: stretchin
—^^— aromatic C=
— C=O stretching
1 1
1
- H
sir
5
C stretchi
1
out-of-plai
gle-bond s
C-O stretching
h-"™~™ C—F stretching
1 1
1
e bending
retching
skeletal be
out-of
ring
-C stretch
1
1
nding
plane aroi
deformati
ng1-Cl stretchi
1
1
latic
>n
ig
11600 1400 1200 1000
Wavenumber, v or Ai> (cm"1)
134 Infrared and Raman spectra
4.3.4 Model compoundsAs indicated above, not all the vibrational modes of a molecule
or polymer chain can be described as simple group modes and, evenwhen they can, there may be similar groups in different environmentswhich have significantly different frequencies, such as the C—X groupsin an atactic or conformationally irregular isotactic or syndiotactic vinylpolymer. A useful approach to assignment may then be the use of modelcompounds. These compounds have small molecules with certainfeatures in common with the polymer chain. The assumption is madethat many of their vibrational modes will have frequencies which arevery close to those of the corresponding part of the polymer chain. Thepolymer modes can accordingly be assigned to vibrations of theappropriate part of the molecule.
Good examples of this approach, which will be discussed further inchapters 5 and 6, are the use of compounds such as dimethyl tereph-
thalate, CH3 .O.CO—<^>—CO.O.CH3 , and other compounds
containing the terephthaloyl group, as model compounds for the tereph-thaloyl regions of PET and the use of various secondary chlorides,such as CH3.CHCl.CH3 and CH3.CHC1.(CH2)2.CHC1.CH3,as model compounds for various specific configurational andconformational isomers which may be present in an atactic PVCchain. This approach to assignment has been and remains a useful one,but it must be made with caution, because any structural differencebetween two molecules affects the frequency and eigenvector of everymode of vibration to some extent. It is not always easy to predict whatthe effect will be without detailed calculation, which presupposes aknowledge of the relevant force constants and precise moleculargeometry. The model compound method is therefore best used not inisolation, but in combination with other methods.
4.3.5 Isotope substitutionThe frequency of a vibrational mode depends on the masses of
the atoms as well as on the geometry of the molecule and the forceconstants. If the mass of one type of atom can be changed by substitutinga different isotope from the normally predominant one, the other factorswhich determine the frequencies of the modes remain constant, andcertain simple predictions can be made about the changes in frequencywhich will be observed. Clearly, if the type of atom for which thesubstitution is made does not move in a particular mode, the frequencyof that mode will be unchanged, whereas if the mode involves
4.3 Vibrational assignments 135
predominantly the movement of this type of atom the change offrequency may be quite large. Isotope substitution may thus be a usefulaid in making vibrational assignments.
Consider, for instance, the totally symmetric 'breathing mode' of themethane molecule, in which all four hydrogen atoms move radially inand out in phase with each other. In the simplest model the frequency ofthis mode is given by
v = f /— (4.22)
where mH is the mass of the hydrogen atom and k is the force constant forC—H stretching, since in this mode the carbon atom does not move andthe vibration has the same frequency as that of a diatomic moleculeconsisting of a hydrogen atom bonded to an atom of infinite mass by abond with force constant k. Since the frequency of this mode isindependent of the mass of the carbon atom it would not change if themass of the carbon atom were changed from the usual 12 to 13 amu(atomic mass units) by isotope substitution, whereas if the masses of allthe hydrogen atoms were changed from 1 to 2 amu by the substitution ofdeuterium the frequency would, in the harmonic approximation, bereduced by a factor J2 = 1.414.
This example is extreme, but illustrates that the substitution ofdeuterium for hydrogen is a very useful aid in vibrational assignmentbecause the shifts produced may be very large if the motion involved in aparticular mode is predominantly that of hydrogen atoms. Even if thecarbon atom to which a hydrogen atom is attached did move, andbehaved as if it were completely free except for its bond to the hydrogenatom, the effective masses entering the equations for C—H or C—Dmodes would be the reduced masses mcmH/(rac + mH) andmcmvl(mc + mD)>so that the ratio of the frequencies would be the squareroot of the ratio of these quantities, i.e. J{2 x 13/14)= 1.363. For avibration in which the C of the C—H bond is strongly involved butwhich is not predominantly a C—H vibration, the H and C atoms movetogether to a first approximation and thus the frequency will only bechanged by a factor of approximately J\(mc + mD)/(mc + raH)] =7(14/13)= 1.038.
The effect of isotope substitution on the frequency of any particularnormal mode could only be predicted accurately if the precise moleculargeometry and force constants were known, and in practice onlyapproximate shifts can be calculated. There is however, an importantrule which gives an exact relationship between all the vibrations of a
136 Infrared and Raman spectra
given symmetry species of two molecules which differ only by isotopesubstitution. This rule, which was derived independently by Teller andRedlich and is generally known as the Teller-Redlich product rule, states
where all primed symbols refer to the molecule with isotope substitutionand the unprimed symbols refer to the same quantities for the 'original'molecule. The quantities vx, v 2 , . . . , vn are the frequencies of the n normalvibrations of the given symmetry species, the quantities ml,m2,... arethe masses of an individual member of each of the symmetry-related setsof atoms which make up the molecule. M is the total mass of themolecule and t is the number of translations of the given symmetryspecies. The function / ( / , / ' ) is the product of the quantities /J//f forthose values of i = x, y or z for which rotation about Oi belongs to thegiven symmetry species, where /, is the moment of inertia of the moleculeabout Oi. The powers a,b,.. are the numbers of vibrational modes(including non-genuine ones) that each symmetry-related set of atomscontributes to the symmetry species, i.e. the numbers which would becalculated from equation (2.31) if only the atoms of each set were used inthe calculation.
The frequencies which occur in equation (4.23) are strictly speakingthose which would be observed if the anharmonic contributions to theforces between the atoms were zero, but the equation will hold to a goodapproximation for the observed fundamental frequencies. It may beshown that if the prime indicates the heavier isotope, the left-hand side ofequation (4.23) should be slightly greater than the right-hand side if theobserved, slightly anharmonic, fundamental frequencies are used.
The simplest application of the Teller-Redlich rule occurs if there isonly one genuine vibration of a particular symmetry species, whenequation (4.23) gives directly the ratio of the frequencies, and it is then asimple matter to check a proposed assignment to a symmetry species.More generally, assignments of all the modes belonging to a givenspecies must be attempted before the rule can be used to check whetherthe assignments constitute a possibly correct set or not. As an example ofthe simpler type of application, consider the CH2 twisting mode of Blg
symmetry and the CH2 wagging mode of B3xl symmetry forpolyethylene, which each belong to symmetry species with only onegenuine normal vibration (see table 3.2). For polyethylene all hydrogenatoms belong to the same symmetry-related set and all carbon atomsbelong to the same set. Neither of the symmetry species considered has a
4.4 Force fields and vibrational calculations 137
rotation as a non-genuine vibration, so that / ( / , / ' ) = 1. There is onetranslation belonging to the B3u species but none belonging to the Blg
species. Hence, with fully deuterated polyethylene as the isotopesubstituted molecule and ordinary polyethylene as the 'original'molecule, we have
2 g l .1=0.707=1/1.414
^o) x 1 = 0.756=1/1.323
since for each species the H atoms contribute one vibrational mode andthe carbon atoms contribute one vibrational mode to the B3u speciesand none to the Blg species. The experimental results are in extremelygood agreement with the predicted ratios. The result for the Blg speciesis, of course, easily obtained by the physical argument that the carbonatoms do not move in the corresponding CH2 twisting vibration and theresult for the B3u species by the argument that two hydrogen atomsmove in the opposite direction to each carbon atom, so that the ratio ofthe frequencies will be the square root of the ratio of the reduced masses,(mH/mD)(mc + 2mD)/(mc + 2mH). Such simple arguments are, however,not always available. For polymers there are generally many modesbelonging to a given symmetry species, as pointed out in subsection4.3.2, so that the Teller-Redlich rule is difficult to apply. It has, however,been used to check assignments in a number of polymers, includingpoly(ethylene terephthalate). A simpler approximate expression hasbeen given by Krimm, which applies to a single vibrational frequency.(See the review by Krimm cited in section 3.3.)
4.4 Force fields and vibrational calculationsSo far we have explained how to calculate the numbers of
normal modes of each symmetry species for any molecule, but thefrequencies of the modes have been taken as quantities to be determinedempirically, using the methods of assignment outlined in the previoussection. Often such methods will allow many modes to be correctlyassigned at the level of specific symmetry modes of the molecule orparticular groups within it. There are, however, often other modeswhich resist such assignments because they are mixtures of simplesymmetry or group modes of the same symmetry species in which nosingle component mode is dominant. Further information on thenature of these modes can, in principle, be obtained by calculating the
138 Infrared and Raman spectra
normal mode frequencies and eigenvectors from the geometry of themolecule and the interatomic force constants. Such calculations can alsoshow to what extent assignments made to symmetry or group modes arereally approximations.
We give in this section an elementary introduction to the methodsused in vibrational calculations. Sufficient detail is included to cover thegeneral principles of the methods and the terminology, so that with thissection as background the reader should be able to understand thereferences to vibrational calculations in chapters 5 and 6 and in thegeneral literature. The subject is, however, highly technical and thereader is referred to the books and papers indicated in section 4.7 forfurther details. Many practising polymer spectroscopists will neverperform a full vibrational calculation, but it is important to understandthe assumptions and approximations made in such calculations and todevelop a critical approach to the conclusions drawn from them. Thediscussion is given first in terms of small molecules; the modificationsrequired to apply it to polymers are explained in subsection 4.4.7.
4.4.1 The vibrational problem in Cartesian coordinatesWe start from equation (2.4), viz.
d ^ _ _ _a dt2
bj
and first simplify the notation. Since x% is independent of t, xai can bereplaced by (xai — x°,) on the left-hand side of the equation; animmediate simplification then results by replacing the quantities(xai — JC°), which are the displacements from the equilibrium positions,by xai. This simply moves the origin of the coordinates referring to anygiven atom to the equilibrium position of that atom. If we further replacethe labels ai by i, where the new set of values of i goes from 1 to 3N, sothat the old al, a2, a3, for example, become simply three different valuesof the new j , the equation reduces to
».^r=-Zto (4-24)
where, for consistency, ma has been replaced by mt.Equation (4.24) holds for all values of i. Assume that a solution of this
set of 3N simultaneous equations can be found which corresponds tosimple harmonic vibrations of all atoms about their equilibriumpositions with a common angular frequency co = 2nv. For such asolution the following equation must hold for all values of; from 1 to
4.4 Force fields and vibrational calculations 139
3N:
(4.25)
where the quantities Xj represent the amplitudes of vibration.Substituting in equation (4.24) leads to
CO^X—^JXJ (4.26)j
This set of simultaneous equations can be represented in matrix form by
co2MX = KX (4.27)
where
( xi \
0
and X =x2
x,
X 3N }
(4.28)
The equations can only be solved for non-zero values of the amplitudesXt if the value of co satisfies the secular equation
|K-co 2 M|=0 (4.29)
or
I M ^ K - E A ^ O (4.30)
where E is the unit 3 AT x 3N matrix and X = co2. For any solution ofequation (4.30), say Xk, corresponding to the normal mode /c, it ispossible to find a column matrix kX which satisfies equation (4.27). Asuitably normalized set of displacements kX is the eigenvector for thenormal mode k.
In section 2.5 other types of coordinate system than the Cartesian oneused here were introduced, viz. those based on symmetry coordinates orinternal coordinates, and we now consider how the use of othercoordinate systems can simplify the calculation of the normal modes.We consider first a generalized set of coordinates.
4.4.2 Generalized coordinates - the Wilson G and F matricesSuppose that a general system of coordinates zt is related to the
set xt by the transformation
z = Rx (4.31)
140 Infrared and Raman spectra
We shall assume to start with that z represents a complete independentset of 3N coordinates, so that R is a 3iV x 3N matrix. Since the set iscomplete it must be possible to write the variable part of the potentialenergy, in the harmonic approximation, in the form
7=i£FyZ,z, = izFz (4.32)V
where the matrix F corresponds to the force constant matrix K in thetreatment in Cartesian coordinates. Now consider the kinetic energy T.This is given by
r = i ^ m . i 2 = i iMx (4.33)
in terms of the Cartesian coordinates. It follows from equation (4.31)that
R"1z = x and z R 1 ^ (4.34)
Hence
1t=\Y.Glj1i,ij (4.35)
where GJ1 means the ij component of G"1 and
G = R M 1 R (4 36)
Substituting V and T into Lagrange's equation of motion
dV d dT
dzt at ozi
leads, for all i, to
^ . + G J ^ H O (4.38)j
Assuming a solution to the vibrational problem of the form of equation(4.25) with z replacing x and Z replacing X leads to
YJ(Fij-co2Grji)Zj = 0 (4.39)j
for all i. Equation (4.39) is a set of simultaneous equations whichrepresent a generalization of the set in equation (4.26). It follows that thegeneralized secular equation is
|GF - EA| = 0 (4.40)
4.4 Force fields and vibrational calculations 141
This is the most important equation of the GF matrix method, first givenby Wilson, for solving the vibrational problem. We now consider somespecial coordinate systems.
4.4.3 Mass-weighted Cartesian coordinates and normal coordinatesLet R in equation (4.31) be the diagonal matrix with elements
Ru = Jmt and let the corresponding specific new set of coordinates be y.Then
y. = Xiy/m. and Ftj = /c^/VK™;) (4.41)
and the new coordinates yt are called mass-weighted coordinates. Itfollows from equation (4.36) that
G = R M 1 R = E = G 1 (4.42)
Equation (4.39) now becomes
v2Yi = YJFijYj (4.43)j
and for the normal mode k
^Yki = YjFiJYkj (4.44)j
(Note that when two subscripts are used on the symbol for a columnvector the first will refer to the mode and the second will identify thecomponent, i.e. Yki =
kYt.) Multiplying both sides by Yu and summingover i leads to
< I YklYu = X F,.,yt,y/; = X FnYuYl} (4.45)i U ij
Using Fji = F(j and the first part of equation (4.45) with k and /interchanged leads to
aflYuY^ZFjWu (4.46)i ij
Equations (4.45) and (4.46) show immediately that if cok # col9 then
X F^fr = X YkiYH = 0 for all l,k (I * k) (4.47)ij i
The second part of equation (4.47) expresses the orthogonality of theeigenvectors of non-degenerate modes. Orthogonal eigenvectors canalways be chosen for the modes of any degenerate set and we shallassume from now on that the kY represent a complete orthogonal set of
142 Infrared and Raman spectra
eigenvectors. We shall further assume that they have been normalized sothat
£ Yl = 1 for all k (4.48)i
Putting / = k in equation (4.45) now shows that
tjYkjYkiFtjYkjYki = oil £ Yl = co* (4.49)ij
If we define new coordinates Ut by the equation
y = %/U (4.50)
where ^ i s the square matrix with columns fcY, so that ®J ik = Yki we have
•̂ = I ^ t4 = L^A (4-51)k k
This equation indicates that the overall distortion of the molecule givenby the coordinates yt can be regarded as a sum over distortions each ofthe form of one of the individual normalized eigenvectors, the coefficientof the contribution from the mode k being Uk. The coefficients Uk aretherefore called the normal coordinates and have already been referred toin earlier sections, e.g. subsection 2.4.2. Here y replaces I and kY replacesDfc in equation (2.27).
Since G" 1 = E, substitution of y for z in equation (4.35) and use ofequation (4.51) leads to
W) (4.52)kl
Use of equations (4.47) and (4.48) now shows that
(4-53)k
Similarly, equation (4.32) becomes
y=\ I
Equations (4.47) and (4.49) show that this reduces to
V= £ £ col Ui = iUAU (4.55)k
where the matrix A is defined by
A0. = 0 fo r i#7 , Aii = cof = Xi (4.56)
4.4 Force fields and vibrational calculations 143
Equations (4.53) and (4.55) show that both the kinetic and potentialenergies are simply sums over separate contributions from each of thenormal mode vibrations, with no cross terms.
4.4.4 The solution in principle; potential energy distributionsLet any general complete set of coordinates be related to the
normal coordinates by
z = LU (4.57)
The displacements zt in the eigenvector of normal mode k are now givenby Lik (Uk = 1, all other Ut = 0), so that the columns of L represent thenormal mode eigenvectors expressed in terms of the set of coordinates zand are thus proportional to the solutions feZ of equation (4.39). Itfollows from equations (4.32) and (4.35) that
F=^ULFLU (4.58a)
T=^i]tG1L\J (4.58&)
Comparison of equations (4.58) with equations (4.55) and (4.53) showsthat
LFL = A (4.59a)
LG"1L = E (4.59b)
and thus
LL = G (4.60)
Equations (4.59a) and (4.60) yield immediately the matrix equivalent ofequation (4.39), viz.
GF = LAL"1 (4.61)
The relationship expressed in equation (4.60) replaces the orthogonalityand normality of the eigenvectors Y expressed by equations (4.47) and(4.48).
It has so far been tacitly assumed that the coordinates are real. Ifcomplex coordinates are chosen, as is sometimes convenient, thetreatment given in subsections 4.4.2, 4.4.3 and the present subsectionstill applies, provided that the transposed matrices that appear arereplaced by their complex conjugates.
The complete solution of the vibrational problem expressed in termsof any set of coordinates z now reduces in principle to the followingsteps, although more sophisticated methods of solution are generally
144 Infrared and Raman spectra
used for molecules consisting of more than a few atoms:
(i) Write down expressions for the F and G matrices appropriateto the chosen set of coordinates. (See subsections 4.4.5 and4.4.6.)
(ii) Solve the equations (4.40) to find the possible values of thequantities Xk and hence the normal mode (angular) frequencies,cok = Jhk.
(iii) Substitute any one of these values Xk into the simultaneousequations (4.39) and solve for kZ.
(iv) Normalize the eigenvectors kZ so that the matrix L which haskZ as its columns satisfies equation (4.59b) or equation (4.60).
Although the best description of the form of a normal mode k isprovided by specifying the components of its eigenvector kZ with respectto some suitable system of coordinates, because this description iscomplete, a less complete description is often given in terms of a so-called potential energy distribution, derived as follows. Equation (4.55)shows that the potential energy associated with a single mode k is\a>l = \Xk for unit displacement (Uk = 1). Equation (4.59a) shows that
^Fy (4.62)
If we assume that the off-diagonal terms (i^j) of F are small comparedwith the diagonal terms, then
K = Y,LfkFu (4.63)i
and to this approximation the potential energy associated with the modek is the sum of terms each of which is associated with only one of thecoordinates zt. The set of quantities
Vki = LlFu/Xk (4.64)
for all i is called the potential energy distribution for the mode k and givesan indication of the importance of each of the coordinates zi to the mode.Usually the Vki are expressed as percentages. It is clear from thedefinition that the term 'potential energy distribution' is confusing, sincethe sum of the values Vki over all coordinates i does not have to be unity(or 100%). In addition, contributions less than (say) 10% are oftenneglected, so that quoted values may add up to more or less than unity(or 100%). Nevertheless they give a useful simple indication of thenature of a normal mode, particularly if the coordinates z are chosenappropriately.
4.4 Force fields and vibrational calculations 145
We now turn to a discussion of some further simplifications which canbe made to the problem of determining the frequencies and eigenvectorsof the normal modes by choosing suitable coordinate systems.
4.4.5 Symmetry coordinates and internal symmetry coordinatesIt was shown in chapter 2 that every normal mode or set of
degenerate normal modes belongs to a symmetry species and the idea ofsymmetry modes, symmetry mode vectors and symmetry coordinateswas introduced. Any eigenvector of a given symmetry species can beexpressed as a sum over any complete set of independent symmetrymode vectors of the same symmetry species. The coefficients in this sumare the values of the symmetry coordinates for the eigenvector. To becomplete the set of symmetry modes must clearly contain the samenumber of members as there are normal modes of the given species. Bycomparison with equation (4.57) it follows that the symmetrycoordinates aS of any general set of displacements of a particularsymmetry species a are given by
aS = aVV (4.65)
where a5t represents a particular symmetry coordinate of symmetryspecies a, altj represents the component i of the eigenvector j of species awith respect to the symmetry coordinates and aUj represents thecontribution of the eigenvector j to the general set of displacementsconsidered. Any totally general set of displacements of the molecule canbe written in terms of a set of symmetry coordinates S composed of thesubsets appropriate to each of its symmetry species and we can thuswrite
a\b\
0
(aubu
(4.66a)
or
= LSU (4.66b)
where the diagonal block matrix Ls is the equivalent of the more generalmatrix L in equation (4.57).
Equation (4.61) becomes
GSFS = LSALS * (4.67)
146 Infrared and Raman spectra
Now the inverse of a block matrix is a block matrix consisting of theinverses of the individual blocks in the original matrix and multiplyingtwo block matrices of the same form leads to a further matrix of the sameform. Equation (4.67) thus shows that GSFS is of block diagonal form.This means that equations (4.39) split up into separate sets, one for eachblock of GSFS, i.e. one set for each symmetry species. It may be shownthat a special method of choice of the symmetry coordinatesproduces a further simplification whereby the block for an n-dimensionally degenerate species splits up into n equal blocks. Themethod of solution of the vibrational problem listed in steps (i) to (iv) ofsubsection 4.4.4 can now be applied separately to the modes of eachsymmetry species in turn, which greatly simplifies the problem.
In the argument just given the vital factor leading to the diagonalblock nature of GSFS was the separation of both the normal modes andthe reference coordinates into sets in such a way that each set of normalmodes corresponded to a different set of reference coordinates. The setswere actually chosen so that each set contained all modes of a givensymmetry species. Suppose, however, that we had used only two sets ofnormal modes, one corresponding to all genuine modes of vibration andone corresponding to all translations and rotations. The correspondingsets of coordinates would then have been one consisting only of internalcoordinates, for which we shall later use the symbol q, and oneconsisting only of translational or rotational coordinates. The argumentwould then have led to a separation of equations (4.39) into two sets, onecorresponding to the true vibrations and the other to the translationsand rotations.
Use of internal symmetry coordinates will clearly give the greatestsimplification of the vibrational problem. Special techniques may beused to generate suitable symmetry coordinates from internalcoordinates; it is then easy to generate the Gs and Fs matrices from thecorresponding matrices for the internal coordinates. We now considerthe nature of the force fields and force constants which must be specifiedin order to calculate the F matrix.
4.4.6 Force fields and force constantsSince there are 3N — 6 internal coordinates for a molecule
consisting of N atoms it is necessary, in principle, to specifyi(3N — 6)(3N — 5) independent force constants if the molecule has nosymmetry elements. The molecule has only 3N — 6 genuine normalmodes of vibration, so that the number of force constants requiredusually exceeds the number of modes of vibration even when thesymmetry of the molecule is taken into account. The previous subsection
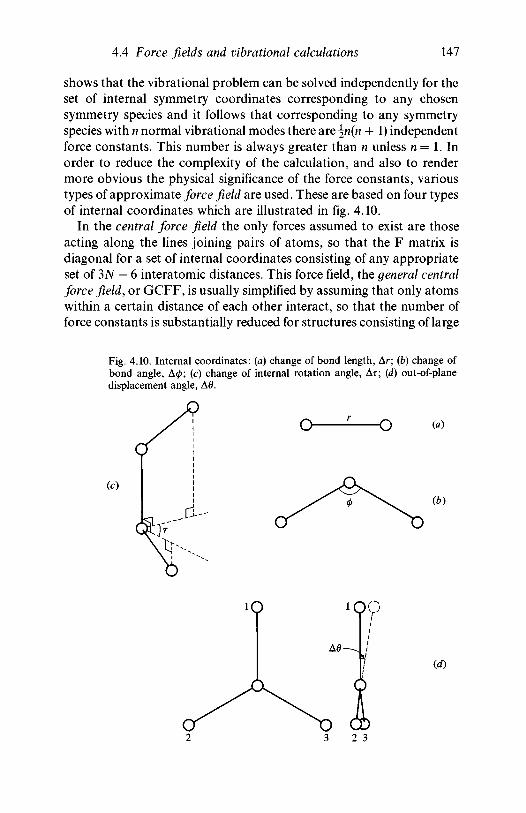
4.4 Force fields and vibrational calculations 147
shows that the vibrational problem can be solved independently for theset of internal symmetry coordinates corresponding to any chosensymmetry species and it follows that corresponding to any symmetryspecies with n normal vibrational modes there are \n(n + 1) independentforce constants. This number is always greater than n unless n = 1. Inorder to reduce the complexity of the calculation, and also to rendermore obvious the physical significance of the force constants, varioustypes of approximate force field are used. These are based on four typesof internal coordinates which are illustrated in fig. 4.10.
In the central force field the only forces assumed to exist are thoseacting along the lines joining pairs of atoms, so that the F matrix isdiagonal for a set of internal coordinates consisting of any appropriateset of 3AT — 6 interatomic distances. This force field, the general centralforce field, or GCFF, is usually simplified by assuming that only atomswithin a certain distance of each other interact, so that the number offorce constants is substantially reduced for structures consisting of large
Fig. 4.10. Internal coordinates: {a) change of bond length, Ar; (b) change ofbond angle, A0; (c) change of internal rotation angle, AT; (d) out-of-planedisplacement angle, A0.
(c)
o o (a)
(b)
Ad-
2 3
id)
148 Infrared and Raman spectra
number of atoms. This force field is not very realistic for covalentlybonded molecules because it includes no forces which tend specifically tomaintain the angles between the covalent bonds at their equilibriumvalues. The valence force field, or VFF, is more realistic for suchmolecules, including, of course, polymers. In this force field there areforces which resist the changes of any of the internal coordinates of thetypes shown in fig. 4.10.
In the simplest version of the VFF, the simple valence force field, orSVFF, the F matrix has only the diagonal terms, Fii9 not equal to zero.Such a simple force field is usually incapable of giving good agreementwith observed vib rational frequencies; it is necessary to allow for variousinteractions between the internal coordinates, such as interactionsbetween the coordinates corresponding to the stretching of two bonds tothe same atom and to the bending of the angle between them. If twointernal coordinates qt and qj interact, the element Ftj of the F matrixwill be non-zero and such force constants are called interaction forceconstants. For the GVFF all Ftj are non-zero. A further force fieldrelated to the VFFs is the Urey-Bradley-Shimanouchi force field, orUBSFF, in which the force constants of the SVFF are supplemented byrepulsive forces between non-bonded atoms rather than by the explicitinteraction force constants of the GVFF. These repulsive forces simulatethe van der Waals forces between the non-bonded atoms. Theinteratomic distances for the non-bonded atoms depend on the bondlengths and angles which are used to specify the internal coordinates inthe VFFs and do not constitute additional internal coordinates. It maybe shown that when this dependence is taken into account theintroduction of the forces between non-bonded atoms leads to non-zerooff-diagonal terms in the F matrix. The total number of independentforce constants required is, however, less than for the GVFF and this isan additional reason for using the UBSFF. Further reductions in thenumber of independent force constants can be made by neglecting theinteraction between any pair of atoms unless they are bonded to a thirdcommon atom and by assuming a specific form for the repulsiveinteraction, such as the form V= k/r9 assumed by Shimanouchi.
Once an approximate force field has been chosen it is necessary tochoose the numerical values of the force constants before the frequenciescan be calculated. This usually involves making use of force constantsalready available for similar, usually smaller, molecules which containthe same chemical groups, i.e. it is usually assumed that to a firstapproximation force constants can be transferred from one molecule toanother. For very small molecules it is often possible to deduce forceconstants directly or almost directly from frequencies; for instance the
4.4 Force fields and vibrational calculations 149
frequencies of the totally symmetric modes of CC14 or CH4, in which thecarbon atom does not move, give directly the force constant forstretching of the C—Cl or C—H bond, respectively, in the SVFF model.Since the time when vibrational calculations were first made, a greatdeal of information has gradually been built up about the values andtransfer ability of force constants for small molecules and this has beenincreasingly applied to larger molecules, including polymers.
The way in which a vibrational calculation is now usually made is, inoutline, as follows:
(i) A set of force constants is chosen, using data in the literature,and the vibrational frequencies are calculated by theprocedures outlined in subsections 4.4.1 to 4.4.5.
(ii) The difference between each calculated frequency and thecorresponding observed frequency is found.
(iii) These differences are used with the partial derivative of everyfrequency with respect to every force constant to find a betterset of force constants, i.e. a set which predicts the observedfrequencies better.
(iv) Steps (ii) and (iii) are repeated until an acceptably good fit isfound between the observed and calculated frequencies.
It is not necessary to use all frequencies or force constants in therefinement process provided that the number of frequencies used isgreater than or equal to the number of force constants that are allowedto vary. It is this aspect of the procedure which makes a vibrationalcalculation potentially predictive, and hence an aid to assignment,rather than simply a fitting exercise from which a set of force constants isobtained.
This procedure sounds straightforward until one realizes that at eachstep there is a degree of arbitrariness. Step (i) already implies a choice offorce field, an approximation in itself. Step (ii) implies either that thecalculated and observed frequencies agree so well with each other thatno doubt exists as to which are corresponding frequencies in the two setsor that the observed frequencies have been assigned unambiguously atleast to a symmetry species and that this eliminates the possibility ofincorrect assumptions about correspondences. In practice it is notusually possible to eliminate ambiguities completely. Steps (iii) and (iv)assume the convergence of an iterative process, which is only guaranteedif the force field chosen is able to describe well enough the realinteractions in the molecule and if the initial set of force constants isreasonably close to the most appropriate ones. We conclude thissubsection with a quotation, reprinted by permisson, from Introduction
150 Infrared and Raman spectra
to the Theory of Molecular Vibrations and Vibrational Spectroscopy byL. A. Woodward, Oxford University Press, 1972, p. 228:
the calculation of force fields from observed frequency data has become almostas much an art as a science. There is indeed little that is reliable to go upon inchoosing the type of approximate field to be used, for approximate fields that arephysically incompatible with one another may turn out to give equally good'best fits' with the observed frequency data. Nor is there any firm principle uponwhich to base the guess of the initial set of force constants which are to besubjected to improvement. Lastly, in difficult cases it may be necessary toimpose constraints in order to obtain the desired convergence; and there is ameasure of arbitrariness as to how this shall be done. It should not be forgottenthat in the end the force constants that are obtained are at best only the mostsatisfactory set that can be constructed with the particular type of approximateforce field that was arbitrarily adopted as the basis of the calculation. If theconstants happen to give an excellent fit between calculated and observedfrequencies, this does not necessarily mean that the field is a correspondinglygood approximation to the real one.
To this we merely add that any 'predicted' frequencies are subject tosimilar uncertainties which it is impossible to specify numerically.
4.4.7 Application to polymersWe shall consider first the normal vibrational modes of an
isolated perfect polymer chain in the form of an nk helix and we shall nolonger, as in chapter 3, restrict attention to the factor group modes. Wedefine a set of coordinates xr within each physical repeat unit r so thatthe sets are related by the screw axis and we use each set to describe thedisplacements of the atoms of the corresponding repeat unit. We alsointroduce Borns cyclic boundary condition, which means that we assumethat any disturbance of the polymer chain repeats itself exactly in everyset of Jf adjacent physical repeat units, where Jf must be a multiple ofn. Sums over r will be taken over Jf terms and Jf will later be allowed totend to infinity.
We define new sets of coordinates xd by
*s=l~I,Xrelrd (4.68)
where S takes one of the values 0 or + Inmjjf for m an integer between 1and \Jf (we arbitrarily choose Jf to be even). Now consider a mode inwhich
x r = / - L A o e - w ' (4.69)
4.4 Force fields and vibrational calculations 151
i.e. a mode in which the corresponding atoms in each repeat unit vibratewith the same frequency and amplitude but with a phase which changesprogressively by 6' for each repeat unit along the chain. The possiblevalues of 5' which give distinguishable modes are restricted by the cyclicboundary condition to be those given for S. The column matrix ofamplitudes Ao, which may be complex to allow for differences in phaseof the motions of the different components of xr, is assumed to includethe time-dependent factor elto', where CD is the angular frequency of themode. Then
= Ao for d = S'
= 0 for 5 # 5f (4.70)
Thus xd is a set of coordinates associated only with the set of modes forwhich xr = x/(l/yT)Aoe~lf'<5. These are the modes of a particularsymmetry species for a pseudo-factor group obtained by redefining allthe operations of the line group in a similar way to that used in definingthe true factor group, but considering Jfjn true translational units as theeffective translational unit. This pseudo-factor group is isomorphouswith the group C^, or possibly a group of higher order if the helix hasother symmetry elements in addition to the screw axis. (See subsections2.3.2 and 3.1.4 for further discussion of the normal modes of moleculeswhich belong to these point groups.) The secular equation may thereforebe separated into Jf sets of equations in the way described in subsection4.4.5 and solved to obtain the frequencies. Each set of equations, whichrepresents only modes corresponding to a given value of S, has 3risolutions, where n' is the number of atoms per physical repeat unit.There are only Jf sets of equations because phase differences S = + nand S = — n between adjacent units are equivalent.
As Jf tends to infinity the sets of 3n' solutions for the frequencies tendtowards a set of continuous functions of S; plots of these functionsagainst S are called the frequency-phase-difference curves or dispersioncurves for the vibrational modes of the polymer chain. The modes forwhich 5 = 0 or ± 2nm'/n for mf an integer between 1 and \n (or \{n — 1) forodd n) are the true factor group modes. The modes for other values of Sare usually inactive in infrared or Raman spectroscopy but it issometimes possible to obtain information about them by means ofinelastic neutron scattering. Modes related to them may, however,become activated under certain conditions to be discussed in the nextsubsection. It should be noted that although an nk helix has been
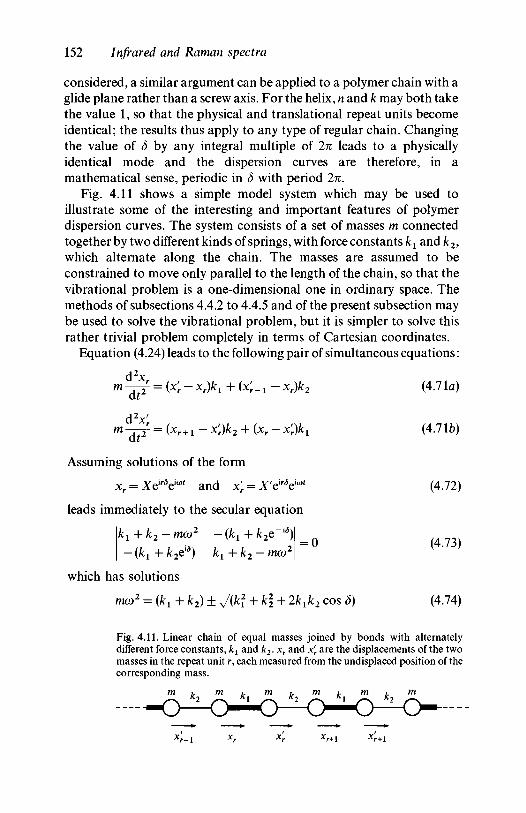
152 Infrared and Raman spectra
considered, a similar argument can be applied to a polymer chain with aglide plane rather than a screw axis. For the helix, n and k may both takethe value 1, so that the physical and translational repeat units becomeidentical; the results thus apply to any type of regular chain. Changingthe value of 3 by any integral multiple of 2n leads to a physicallyidentical mode and the dispersion curves are therefore, in amathematical sense, periodic in 3 with period 2n.
Fig. 4.11 shows a simple model system which may be used toillustrate some of the interesting and important features of polymerdispersion curves. The system consists of a set of masses m connectedtogether by two different kinds of springs, with force constants kx and k2,which alternate along the chain. The masses are assumed to beconstrained to move only parallel to the length of the chain, so that thevibrational problem is a one-dimensional one in ordinary space. Themethods of subsections 4.4.2 to 4.4.5 and of the present subsection maybe used to solve the vibrational problem, but it is simpler to solve thisrather trivial problem completely in terms of Cartesian coordinates.
Equation (4.24) leads to the following pair of simultaneous equations:
md\
dt2 = {x'r-xr)kl +(* ;_! -xr)k2
d2xm dt
- = (xr+l - x'r)k2 + (xr -
Assuming solutions of the form
xr = Xeir3eiiot and x'r = X'eir3eiiot
leads immediately to the secular equation
k1 + k2-mco2 -(/c1+/c2e" i5) _
- (/cx + k2ei3) kx + k2 - mod2 ~
which has solutions
ma,2 = (/cx + k2) ± J(k\ + kl + 2k1k2 cos 3)
(4.71a)
(4.71b)
(4.72)
(4.73)
(4.74)
Fig. 4.11. Linear chain of equal masses joined by bonds with alternatelydifferent force constants, k1 and k2. xr and x'r are the displacements of the twomasses in the repeat unit r, each measured from the undisplaced position of thecorresponding mass.
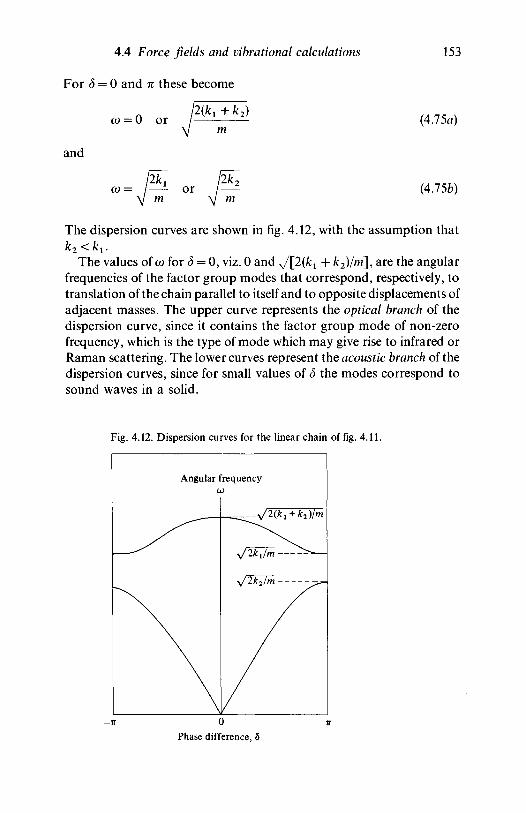
4.4 Force fields and vibrational calculations
For 8 = 0 and n these become
= 0 or 2(k1+k2)
m
and
2k, 2k2co= I—- or /
m v m
153
(4.75a)
(4.75ft)
The dispersion curves are shown in fig. 4.12, with the assumption thatk2<k1.
The values of a; for 8 = 0, viz. 0 and ^ [ 2 ^ + /c2)/m], are the angularfrequencies of the factor group modes that correspond, respectively, totranslation of the chain parallel to itself and to opposite displacements ofadjacent masses. The upper curve represents the optical branch of thedispersion curve, since it contains the factor group mode of non-zerofrequency, which is the type of mode which may give rise to infrared orRaman scattering. The lower curves represent the acoustic branch of thedispersion curves, since for small values of 3 the modes correspond tosound waves in a solid.
Fig. 4.12. Dispersion curves for the linear chain of fig. 4.11.
Angular frequency
Phase difference, 8
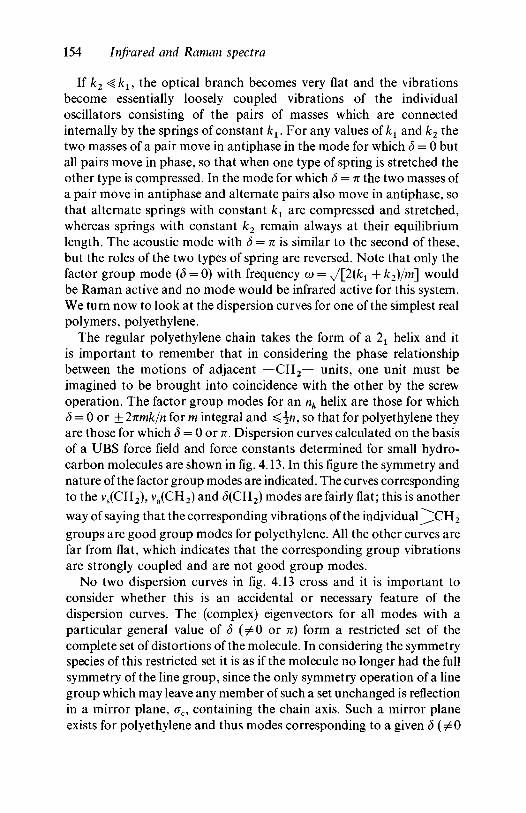
154 Infrared and Raman spectra
If k2 <^k1, the optical branch becomes very flat and the vibrationsbecome essentially loosely coupled vibrations of the individualoscillators consisting of the pairs of masses which are connectedinternally by the springs of constant /q. For any values of k1 and k2 thetwo masses of a pair move in antiphase in the mode for which 3 = 0 butall pairs move in phase, so that when one type of spring is stretched theother type is compressed. In the mode for which 3 = n the two masses ofa pair move in antiphase and alternate pairs also move in antiphase, sothat alternate springs with constant k1 are compressed and stretched,whereas springs with constant k2 remain always at their equilibriumlength. The acoustic mode with 3 = n is similar to the second of these,but the roles of the two types of spring are reversed. Note that only thefactor group mode (3 = 0) with frequency co = y/[2(kl + k2)/ni] wouldbe Raman active and no mode would be infrared active for this system.We turn now to look at the dispersion curves for one of the simplest realpolymers, polyethylene.
The regular polyethylene chain takes the form of a 2X helix and itis important to remember that in considering the phase relationshipbetween the motions of adjacent —CH2— units, one unit must beimagined to be brought into coincidence with the other by the screwoperation. The factor group modes for an nk helix are those for which3 = 0 or ±2nmk/n for m integral and ^ n , so that for polyethylene theyare those for which 3 = 0 or n. Dispersion curves calculated on the basisof a UBS force field and force constants determined for small hydro-carbon molecules are shown in fig. 4.13. In this figure the symmetry andnature of the factor group modes are indicated. The curves correspondingto the vs(CH2), va(CH2) and <5(CH2) modes are fairly flat; this is another
way of saying that the corresponding vibrations of the individual ^^CH2
groups are good group modes for polyethylene. All the other curves arefar from flat, which indicates that the corresponding group vibrationsare strongly coupled and are not good group modes.
No two dispersion curves in fig. 4.13 cross and it is important toconsider whether this is an accidental or necessary feature of thedispersion curves. The (complex) eigenvectors for all modes with aparticular general value of 3 (^0 or n) form a restricted set of thecomplete set of distortions of the molecule. In considering the symmetryspecies of this restricted set it is as if the molecule no longer had the fullsymmetry of the line group, since the only symmetry operation of a linegroup which may leave any member of such a set unchanged is reflectionin a mirror plane, oc, containing the chain axis. Such a mirror planeexists for polyethylene and thus modes corresponding to a given 3
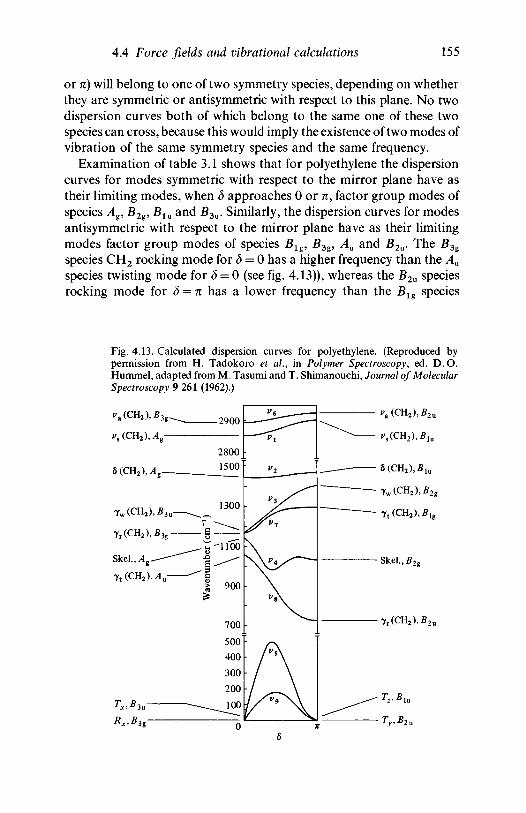
4.4 Force fields and vibrational calculations 155
or n) will belong to one of two symmetry species, depending on whetherthey are symmetric or antisymmetric with respect to this plane. No twodispersion curves both of which belong to the same one of these twospecies can cross, because this would imply the existence of two modes ofvibration of the same symmetry species and the same frequency.
Examination of table 3.1 shows that for polyethylene the dispersioncurves for modes symmetric with respect to the mirror plane have astheir limiting modes, when 3 approaches 0 or TT, factor group modes ofspecies Ag, B2g, Blu and B3u. Similarly, the dispersion curves for modesantisymmetric with respect to the mirror plane have as their limitingmodes factor group modes of species Blg, B3g, Au and B2u. The B3g
species CH2 rocking mode for 3 = 0 has a higher frequency than the Au
species twisting mode for 3 = 0 (see fig. 4.13)), whereas the B2u speciesrocking mode for 3 = n has a lower frequency than the Blg species
Fig. 4.13. Calculated dispersion curves for polyethylene. (Reproduced bypermission from H. Tadokoro et ai, in Polymer Spectroscopy; ed. D.O.Hummel, adapted from M. Tasumi and T. Shimanouchi, Journal of MolecularSpectroscopy 9 261 (1962).)
",(CH2),2?lu
HCH2),Ag
7w(CH2),/?3u
7r(CH2),2?3g
Skel.,i4g
yt(CH2),Au
Rx,B3g
Tw(CH2),i?2g
7 t(CH 2) ,5 l g
Skel.,£2g
7r(CH2),i?2u
156 Infrared and Raman spectra
twisting mode for S = n. All four species go over, for d ^ 0 or TC, to thesame species, but instead of one curve joining the two rocking factorgroup modes and another joining the two twisting factor group modes,which would cross, there is in fact one curve joining the B3g rockingmode to the BH twisting mode and one joining the Au twisting mode tothe B2u rocking mode. It is as if there were a 'repulsion' betweendispersion curves belonging to the same symmetry species.
Apart from such restrictions on crossing, it is essentially accidentalthat there are no crossings of dispersion curves for polyethylene. If,however, we consider a helical molecule which has a three-fold or higherscrew axis, there can be no mirror plane, so that, for all helical moleculesof this type, no two dispersion curves can cross. In practice, theinteractions which couple different types of motion may sometimes be soweak that this non-crossing rule is of little practical consequence.
4.5 Finite chainsIn the previous subsection the vibrations of infinite, perfect
polymer chains were considered. In a typical crystal of polyethylene thelength of chain between folds is about 125 A or about a hundred CH2
groups. We neglect, for the moment, the interactions between chainsand consider how the vibrational modes of these finite lengths of chainare related to those of the infinite perfect chain and how the observedinfrared or Raman spectra will differ from those expected for the perfectinfinite chain.
It is easy to show, by a method similar to that used in discussing thediatomic chain in the previous subsection, that the normal modes ofvibration of a linear chain of m coupled oscillators correspond tovibrations in which the phase difference S between adjacent oscillators iseither kn/m or kn/(m + 1) for a chain with free or fixed ends, respectively,where k takes integral values 0 to m — 1 for free ends and 1 to m for fixedends. For a real polymer chain in a crystal, where the ends correspond tochain folds, or for a short-chain normal paraffin (normal alkane),consisting of a linear chain of CH2 groups with CH3 end groups, therewill be conditions which do not correspond exactly to either simple freeor fixed ends. As m becomes large the frequency of each of the modes willtend towards that of one of the modes of the infinite chain which has thesame value of (5, but will differ increasingly from it as m becomes smallerbecause of the effects of the ends. The modes with the closest frequenciesto those of the corresponding factor group modes for the infinite chainwill be those for which S differs by approximately n/m from 0 or n. For apolyethylene chain with a hundred CH2 groups this difference is TT/IOO.
4.5 Finite chains 157
A study of fig. 4.13 shows that for most optical branches of thedispersion curves the frequency of a mode with S = TT/IOO orS = n — 71/100 will be virtually indistinguishable from that of thecorresponding factor group mode. These modes will also be the modesof greatest intensity in the vibrational spectrum because all thetranslational units of the chain vibrate almost in phase. If, on the otherhand, we choose a value of S for which the frequency is significantlydifferent from that of the corresponding factor group mode the intensitywill be much lower because the interactions of the different translationalunits of the chain with the radiation field will tend to cancel out. Inaddition, the lengths of chain present in crystallites are not all the same,so that the allowed values of S, and hence the frequencies, are not all thesame. The weak peaks corresponding to modes with such values of Sare therefore spread over the whole frequency range of the particularbranch of the dispersion curve involved and tend to give rise tobackground scattering rather than to individual peaks. For mostcrystalline polymers we do not, therefore, usually have to consider thefinite lengths of the chains when studying the contribution of thecrystalline regions to the infrared or Raman spectrum unless thecrystallites are very small.
It is often useful, as explained in subsection 4.3.4, to study the spectraof small molecules as model compounds for a polymer. An importantexample is the study of the linear paraffins as models for polyethylene.For each different paraffin there are only a small number of widely-spaced allowed values of d corresponding to the allowed values of k; thefrequencies of the corresponding modes will approximate closely tothose given by the dispersion curves for the polymer for the same valueof (5, the differences being due to the effects of the end groups. Most of themodes with activity allowed by the selection rules will be observabledespite their low intensity (see, e.g., fig. 5.2), because every chain is nowof the same length, so that the modes are at well-defined frequencies.Cooling the sample to liquid nitrogen temperatures increases the clarityof the spectrum by removing some of the combination frequencies withacoustic modes (see section 4.6). The observed frequencies for the short-chain paraffins may be used, when corrected for the effects of end groups,to provide data for the empirical construction of dispersion curves of thepolymer, since S can be deduced provided that k is known. Fig. 4.14shows such an empirically constructed dispersion curve for the rocking-twisting mode of polyethylene, corresponding to v8 of fig. 4.13. (See alsosubsection 5.2.1.) Note the large departures of the observed frequenciesof the shorter chains from the common curve because of the greaterrelative importance of the end groups. As already indicated, dispersion
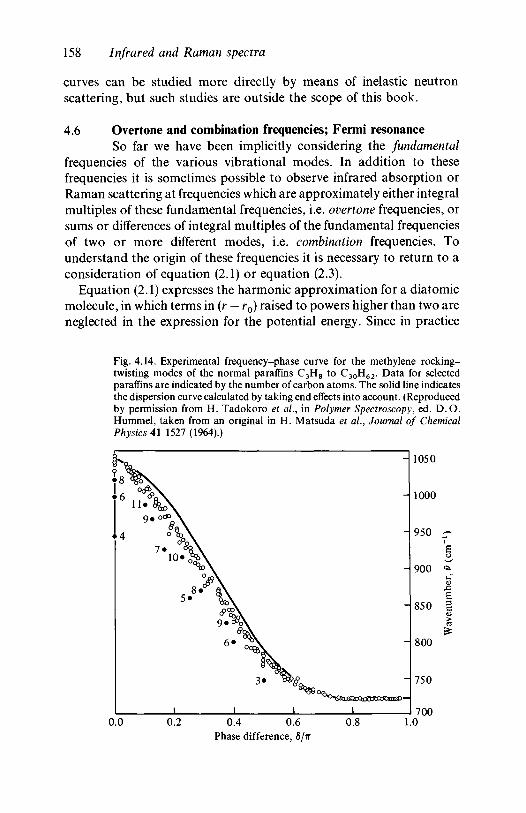
158 Infrared and Raman spectra
curves can be studied more directly by means of inelastic neutronscattering, but such studies are outside the scope of this book.
4.6 Overtone and combination frequencies; Fermi resonanceSo far we have been implicitly considering the fundamental
frequencies of the various vibrational modes. In addition to thesefrequencies it is sometimes possible to observe infrared absorption orRaman scattering at frequencies which are approximately either integralmultiples of these fundamental frequencies, i.e. overtone frequencies, orsums or differences of integral multiples of the fundamental frequenciesof two or more different modes, i.e. combination frequencies. Tounderstand the origin of these frequencies it is necessary to return to aconsideration of equation (2.1) or equation (2.3).
Equation (2.1) expresses the harmonic approximation for a diatomicmolecule, in which terms in (r — r0) raised to powers higher than two areneglected in the expression for the potential energy. Since in practice
Fig. 4.14. Experimental frequency-phase curve for the methylene rocking-twisting modes of the normal paraffins C3H8 to C30H62. Data for selectedparaffins are indicated by the number of carbon atoms. The solid line indicatesthe dispersion curve calculated by taking end effects into account. (Reproducedby permission from H. Tadokoro et al., in Polymer Spectroscopy, ed. D. O.Hummel, taken from an original in H. Matsuda et al., Journal of ChemicalPhysics 41 1527 (1964).)
- 1050
- 1000
- 950
- 900
- 850
- 800
- 750
0.2 0.4 0.6Phase difference, 8/ir
0.8 1.0700
4.6 Overtone and combination frequencies 159
higher order terms are small, rather than zero, the vibration of the pairof atoms is not truly simple harmonic. It will, nevertheless, have aregular repetition with a period T which is very close to the periodT=l /v , with v calculated from equation (2.2), which applies in theharmonic approximation. It is a well-known result that any regularlyperiodic function can be expressed as a Fourier series of simpleharmonic functions, the frequencies of which are integral multiples ofthe repetition frequency. The latter is usually called the fundamentalfrequency and corresponds to 1/T' = v' rather than to 1/T.
Classically, we should expect to observe a series of frequencies in thevibrational spectrum at exact multiples of the fundamental frequency v'.Quantum mechanics shows, however, that the energy levels are in factgiven approximately by the expression
= \v + \x + n(y + x) + n2x (4.76)
where v is the frequency which would be observed in the harmonicapproximation, x is a small quantity which depends on the coefficientsof the cubic and quartic terms in the non-harmonic expression for thepotential energy and n is an integer quantum number. This expressionmay be written
EJh = E0/h + nv° + n(n - l)x (4.77)
where Eo represents the zero point energy h(^v + \x) and the observablefundamental frequency, i.e. the frequency for the transition n = 1 ton = 0, is v° = (v + 2x), corresponding to the classical value v'.
It is not generally possible to observe transitions between all possiblepairs of energy levels in the infrared or Raman spectrum but equation(4.77) shows that the frequencies for those transitions which areobservable will not be simple multiples of v° unless x = 0. At normaltemperatures most molecules are in the ground state (n = 0) beforeinteracting with radiation, so that the transitions observed usually leadto frequencies of the form nv° + n(n — l)x. Since x is generally negative,the observed overtone frequencies are usually slightly lower than wholemultiples of the fundamental frequency v°.
For a system such as a molecule with more than two atoms quantummechanics shows that the energy levels are given approximately by
E(nx,n29.. .)/h = EJh + (nxv? + n2v°2 + . . . )
+ |>i(wi - !)xii +n2{n2- l)x22 + . . . ]
+ n2 + 2n in2)x1 2 + . . .] (4.78)
160 Infrared and Raman spectra
where v?, v2 etc. are the fundamental frequencies of the normal modesand nx, n2 etc. are the corresponding vibrational quantum numbers. Thequantities xip corresponding to x for the system with only one normalmode, are again usually negative, so that the observed overtone orsummation frequencies are usually slightly lower than thecorresponding integral multiples or sums of integral multiples of thefundamental frequencies. In order to predict which frequencies will beobservable in the infrared or Raman spectrum it is necessary to considerthe selection rules, which in turn leads to a consideration of thesymmetry species to which the wave functions belong.
Consider first an energy level E(n1, n2,..., nk,...) for which all of thequantum numbers corresponding to degenerate species (if there are any)are zero. It may then be shown that the corresponding wave-function issymmetric with respect to a particular operation of the point group ofthe molecule if the sum £nk , extended over all normal vibrations thatare antisymmetric with respect to that symmetry operation, is even andthat the wave-function \j/ is antisymmetric with respect to that symmetryoperation if the sum is odd. It is thus easy to deduce the symmetryspecies of the wave-function using character tables. If any onedegenerate vibration is excited with nk = 1 then it may be shown that thesymmetry species of the wave-function is that of the original degeneratespecies or of a different species of the same degree of degeneracy. If adegenerate species has quantum number >1 or if more than onedegenerate species is involved the evaluation of the resulting symmetryspecies is complicated and will not be dealt with; standard tables areavailable showing the results for all combinations and overtones.
Quantum mechanics shows that the selection rule for the infraredactivity of a transition between two states Et and E2 is that the transitionis active if the product \l/1\j/2 has the same symmetry as a translation,where i/^ and ij/2 are the wave-functions for the two levels. Similarly, theselection rule for Raman scattering is that the transition is active if theproduct of the wave-functions has the same symmetry species as acomponent of the polarizability tensor, i.e. as one of the quantities x2,y2
9 z2, xy9 yz9 zx. If the lower state of the transition is the ground state,which is always symmetric with respect to every symmetry operation,the symmetry species of the upper state determines the spectral activity.
Transitions in which the ground state is not the lower level can takeplace at elevated temperatures for all modes and at ordinarytemperatures for low frequency modes; such transitions can take placefor any mode and temperature for which hv^kT. Transitions in whichonly one of the vibrational quantum numbers changes by 1 but which donot involve the ground state give rise to series of hot bands with
4.7 Further reading 161
frequencies of the form v° + 2nx9 i.e. frequencies displaced by equalmultiples of 2x from the fundamental frequency. Since x is usuallynegative, this gives rise to asymmetric broadening on the low frequencyside of the observed peak. Another source of broadening is theoccurrence of weakly active combination vibrations of optical andacoustic modes for non-zero values of <5, for which it may be shown thatthe appropriate selection rule is that only modes with the same value of Scan combine. Since the occurrence of difference combinations (but notsum combinations) requires the thermal excitation of the acoustic mode,the intensities of these combinations will fall as the temperature isreduced, as will the intensities of hot bands.
The intensities of peaks due to overtone or combination excitationsare usually low because the departures from harmonic forces are usuallysmall. An important exception occurs through the phenomenon ofFermi resonance. This phenomenon, which is sometimes observed in thespectra of polymers, arises when an energy level corresponding to anovertone or combination accidentally occurs at an energy which is closeto that corresponding to a fundamental of the same symmetry species.There is then a mixing of the wave-functions corresponding to thedifferent excitations and two new energy levels appear, one on each sideof the expected common level. This is analogous to the mixing ofsymmetry modes of the same symmetry species discussed in earlierchapters, although here cubic or higher order potential energy terms areinvolved rather than quadratic ones. Its particular importance lies in thefact that the two new levels usually give rise to infrared absorption orRaman scattering of similar intensity, rather than there being a strongfundamental and a weak overtone or combination.
4.7 Further readingMost of the topics in this chapter are dealt with more fully in the
books cited in section 2.6 and the books and reviews cited in section 3.3.For an excellent introduction to the use of tensors in physical science,the reader is referred to the book Physical Properties of Crystals TheirRepresentation by Tensors and Matrices, revised edn by J. F. Nye,Clarendon Press, 1985.
The characterization of polymers
5.1 IntroductionThis chapter is largely concerned with two aspects of the
vibrational spectroscopy of polymers. The first of these is theinterpretation of spectra, i.e. the assignment of the observed peaks in theinfrared and Raman spectra at one or more of the levels listed insubsection 4.3.1, and the second is the application of a knowledge ofsuch assignments to various aspects of the chemical analysis of polymers.Chapter 6 deals with applications aimed at understanding variousaspects of the microstructure of the polymer which are generally classedas physical rather than chemical aspects, although the distinction issometimes rather arbitrary. It should be emphasized that the division ofspectral studies into separate phases of'interpretation' and 'application'is somewhat artificial, since the two processes often take place side byside. Generally speaking, however, the aims of individual studies will belargely directed towards one or the other of these two aspects ofvibrational spectroscopy.
The approach adopted for the interpretation of a particularvibrational spectrum depends upon the nature of the polymer underexamination and the information being sought. If the purpose is simplythe identification of the polymer, the spectrum is used on a 'finger-print'basis; strong peaks are assigned to various chemical groups and detailedassignments in terms of specific vibrational modes are unnecessary. Ifthe objective is the quantitative analysis of a mixture, or of a copolymer,a rather less superficial approach is required. A detailed understandingof specific portions of the spectrum will be necessary for theidentification of defect structures of the kinds discussed in subsection1.2.3 and for the study of molecular orientation. A full assignment of thevarious vibrational modes is required for detailed studies of molecularstructure.
We start by considering in section 5.2 a number of polymers for whichrather detailed interpretations of the infrared and Raman spectra havebeen obtained and consider in section 5.3 some materials for which thegroup frequency approach has proved useful. In the tables which follow,n and a indicate parallel and perpendicularly polarized infrared-activemodes (see subsection 4.2.1); m indicates a mode of'mixed' polarization,i.e. neither pure n nor pure c\ p and d indicate polarized or depolarized
162
5.2 Polymer spectra: factor group analysis 163
Raman-active modes (see subsection 4.2.2); i indicates an inactive mode.The symbols v, 3, yr, yw and yt describe the approximate nature ofeigenvectors and have the significances explained in subsection 3.1.2; vs
and va indicate symmetric and antisymmetric CX2 stretching. Thesymbols w, s and m are used to describe weak, strong and mediumabsorption or scattering and v is used to mean 'very', e.g. vs = verystrong.
5.2 The interpretation of polymer spectra: factor group analysisIn this section the infrared and Raman spectra of a number of
polymers are interpreted in detail. The aim is to illustrate the use of themethods of assignment discussed in subsections 4.3.2 to 4.3.5 and the useof vibrational calculations where appropriate. All methods are to someextent applicable to all polymers, but the most suitable methods and thedepth of interpretation possible for a given polymer depend on thedegree of complexity of its structure. The polymers discussed have beenchosen to illustrate this.
The discussion starts with polyethylene and illustrates the use of thefull factor group analysis for the perfect isolated polymer chain. Themethods used in arriving at the present interpretation and the errorsmade on the way illustrate well many important applications of theprinciples discussed in earlier chapters and we shall therefore describe inmore detail than for the remaining polymers how the interpretation wasarrived at.
5.2.1 PolyethyleneIt is natural to start a discussion of the interpretation of the
vibrational spectra of polymers by considering the infrared and Ramanspectra of polyethylene. This polymer is one of the commonest in currentuse and it also has the simplest basic chemical structure. Theinterpretation of its spectrum is therefore of great practical andfundamental significance. Most forms of solid polyethylene are morethan 50% crystalline and may be as much as 85% crystalline, so thatmost of the strong peaks in the infrared or Raman spectrum should bedue to chains in crystallites. Since intermolecular interactions are weakin a polymer with no polar groups, it should be possible to assign mostof these peaks to fundamental frequencies of the factor group modes ofthe isolated single chain and then to account for many other, generallyweak, features as overtone or combination frequencies of thesefundamentals. A much smaller number of features will then remain to beassigned to vibrations of various defect structures or end groups. Theinfrared and Raman spectra of polyethylene are shown in fig. 5.1.
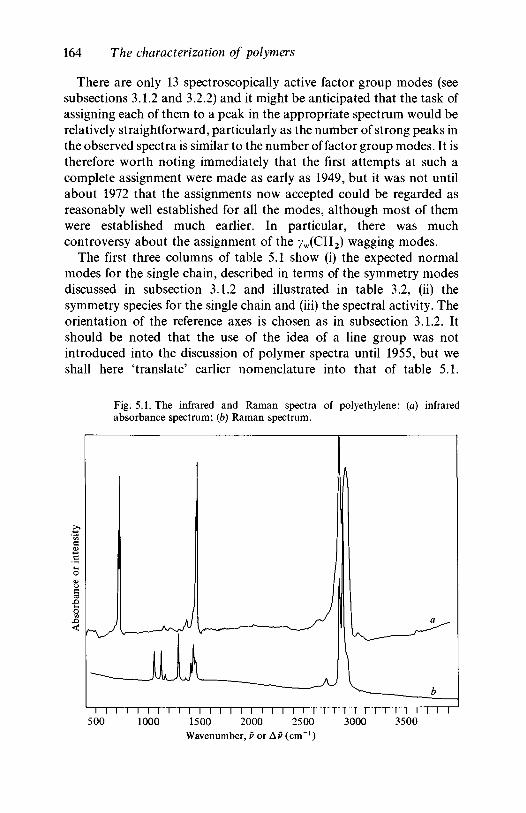
164 The characterization of polymers
There are only 13 spectroscopically active factor group modes (seesubsections 3.1.2 and 3.2.2) and it might be anticipated that the task ofassigning each of them to a peak in the appropriate spectrum would berelatively straightforward, particularly as the number of strong peaks inthe observed spectra is similar to the number of factor group modes. It istherefore worth noting immediately that the first attempts at such acomplete assignment were made as early as 1949, but it was not untilabout 1972 that the assignments now accepted could be regarded asreasonably well established for all the modes, although most of themwere established much earlier. In particular, there was muchcontroversy about the assignment of the yw(CH2) wagging modes.
The first three columns of table 5.1 show (i) the expected normalmodes for the single chain, described in terms of the symmetry modesdiscussed in subsection 3.1.2 and illustrated in table 3.2, (ii) thesymmetry species for the single chain and (iii) the spectral activity. Theorientation of the reference axes is chosen as in subsection 3.1.2. Itshould be noted that the use of the idea of a line group was notintroduced into the discussion of polymer spectra until 1955, but weshall here 'translate' earlier nomenclature into that of table 5.1.
Fig. 5.1. The infrared and Raman spectra of polyethylene: (a) infraredabsorbance spectrum; (b) Raman spectrum.
i I 1 I I I T i l I I I I I I I I I T500 1000 1500 2000
Wavenumber, v or Av (cm"1)
n i n i r i T I I I I I I2500 3000 3500
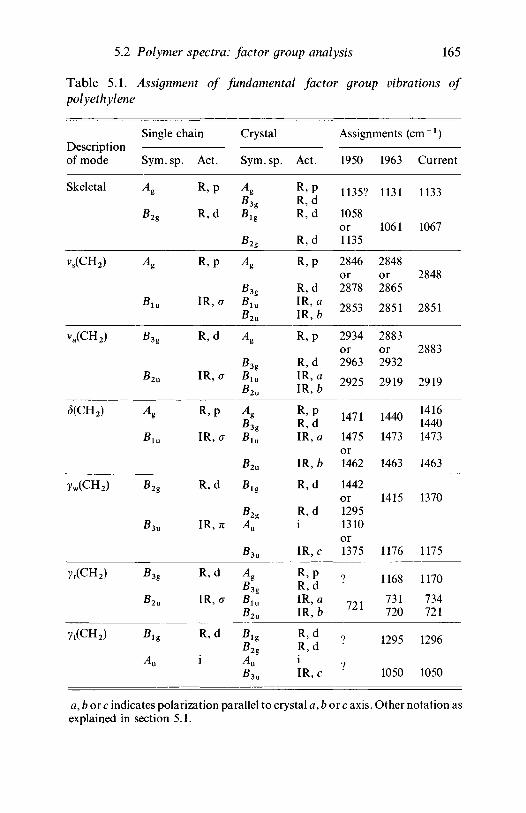
5.2 Polymer spectra: factor group analysis 165
Table 5.1. Assignment of fundamental factor group vibrations ofpolyethylene
Descriptionof mode
Skeletal
vs(CH2)
va(CH2)
<5(CH2)
7w(CH2)
7r(CH2)
7,(CH2)
Single (
Sym. sp
As
B2
A i
BIU
B3g
B2a
\
B,u
B2g
B3u
B2u
Big
Au
:hain
>. Act.
R,P
R, d
R,P
IR, a
R, d
IR, o
R,P
IR, a
R,d
IR, n
R,d
IR, a
R, d
1
Crystal
Sym. sp.
Bx
B 2 g
Ag
B3
B!
Ag
B3
52u
BIBlu
B2u
BH
B2
A»
5 3 u
Bg
Blu
B2U
Blg
B2g
Au
Act.
R,PR dR, d
R, d
R,P
R,dIR, aIR, b
R,P
R, dIR, aIR, b
R,PR, dIR, a
IR, b
R, d
R, di
IR,c
R,PR, dIR, aIR, b
R, dR, d1
IR,c
Assignments
1950
1135?
1058or1135
2846or2878
2853
2934or2963
2925
1471
1475or1462
1442or12951310or1375
?
721
?
1963
1131
1061
2848or2865
2851
2883or2932
2919
1440
1473
1463
1415
1176
1168
731720
1295
1050
(cm l)
Current
1133
1067
2848
2851
2883
2919
141614401473
1463
1370
1175
1170
734721
1296
1050
a,bore indicates polarization parallel to crystal a,bore axis. Other notation asexplained in section 5.1.
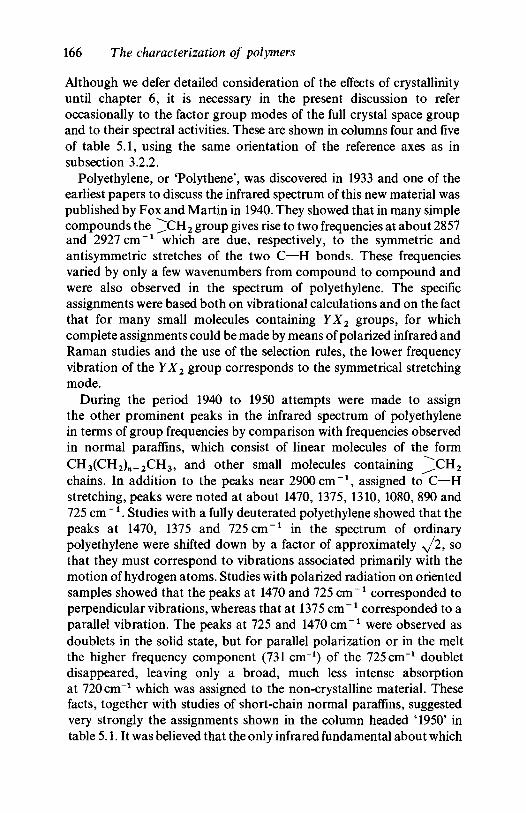
166 The characterization of polymers
Although we defer detailed consideration of the effects of crystallinityuntil chapter 6, it is necessary in the present discussion to referoccasionally to the factor group modes of the full crystal space groupand to their spectral activities. These are shown in columns four and fiveof table 5.1, using the same orientation of the reference axes as insubsection 3.2.2.
Polyethylene, or 'Polythene', was discovered in 1933 and one of theearliest papers to discuss the infrared spectrum of this new material waspublished by Fox and Martin in 1940. They showed that in many simplecompounds the ^ C H 2 group gives rise to two frequencies at about 2857and 2927 cm"1 which are due, respectively, to the symmetric andantisymmetric stretches of the two C—H bonds. These frequenciesvaried by only a few wavenumbers from compound to compound andwere also observed in the spectrum of polyethylene. The specificassignments were based both on vibrational calculations and on the factthat for many small molecules containing YX2 groups, for whichcomplete assignments could be made by means of polarized infrared andRaman studies and the use of the selection rules, the lower frequencyvibration of the YX2 group corresponds to the symmetrical stretchingmode.
During the period 1940 to 1950 attempts were made to assignthe other prominent peaks in the infrared spectrum of polyethylenein terms of group frequencies by comparison with frequencies observedin normal paraffins, which consist of linear molecules of the formCH3(CH2)W_2CH3, and other small molecules containing ^ C H 2
chains. In addition to the peaks near 2900 cm"1 , assigned to C—Hstretching, peaks were noted at about 1470, 1375, 1310, 1080, 890 and725 cm"1 . Studies with a fully deuterated polyethylene showed that thepeaks at 1470, 1375 and 725 cm"1 in the spectrum of ordinarypolyethylene were shifted down by a factor of approximately y/29 sothat they must correspond to vibrations associated primarily with themotion of hydrogen atoms. Studies with polarized radiation on orientedsamples showed that the peaks at 1470 and 725 cm"1 corresponded toperpendicular vibrations, whereas that at 1375 cm"1 corresponded to aparallel vibration. The peaks at 725 and 1470 cm"1 were observed asdoublets in the solid state, but for parallel polarization or in the meltthe higher frequency component (731 cm"1) of the 725 cm"1 doubletdisappeared, leaving only a broad, much less intense absorptionat 720 cm"1 which was assigned to the non-crystalline material. Thesefacts, together with studies of short-chain normal paraffins, suggestedvery strongly the assignments shown in the column headed '1950' intable 5.1. It was believed that the only infrared fundamental about which
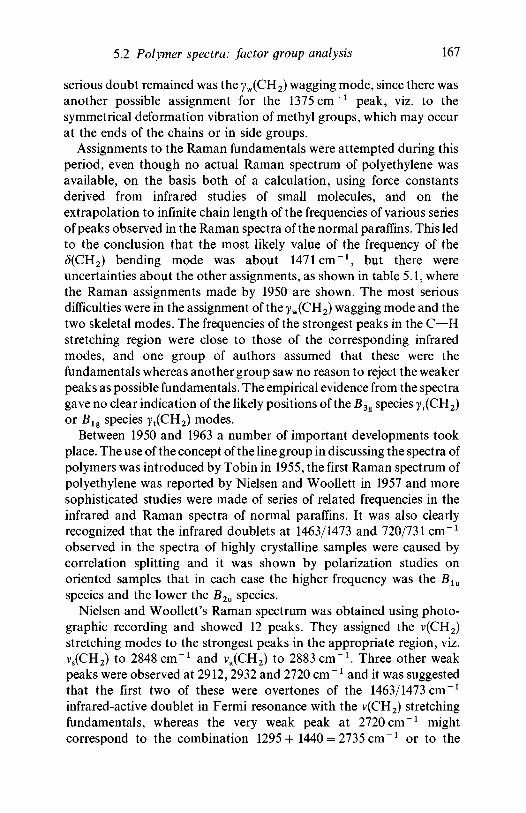
5.2 Polymer spectra: factor group analysis 167
serious doubt remained was the yw(CH2) wagging mode, since there wasanother possible assignment for the 1375 cm"1 peak, viz. to thesymmetrical deformation vibration of methyl groups, which may occurat the ends of the chains or in side groups.
Assignments to the Raman fundamentals were attempted during thisperiod, even though no actual Raman spectrum of polyethylene wasavailable, on the basis both of a calculation, using force constantsderived from infrared studies of small molecules, and on theextrapolation to infinite chain length of the frequencies of various seriesof peaks observed in the Raman spectra of the normal paraffins. This ledto the conclusion that the most likely value of the frequency of the<5(CH2) bending mode was about 1471cm"1, but there wereuncertainties about the other assignments, as shown in table 5.1, wherethe Raman assignments made by 1950 are shown. The most seriousdifficulties were in the assignment of the yw(CH2) wagging mode and thetwo skeletal modes. The frequencies of the strongest peaks in the C—Hstretching region were close to those of the corresponding infraredmodes, and one group of authors assumed that these were thefundamentals whereas another group saw no reason to reject the weakerpeaks as possible fundamentals. The empirical evidence from the spectragave no clear indication of the likely positions of the B3g species yr(CH2)or BH species yt(CH2) modes.
Between 1950 and 1963 a number of important developments tookplace. The use of the concept of the line group in discussing the spectra ofpolymers was introduced by Tobin in 1955, the first Raman spectrum ofpolyethylene was reported by Nielsen and Woollett in 1957 and moresophisticated studies were made of series of related frequencies in theinfrared and Raman spectra of normal paraffins. It was also clearlyrecognized that the infrared doublets at 1463/1473 and 720/731 cm"1
observed in the spectra of highly crystalline samples were caused bycorrelation splitting and it was shown by polarization studies onoriented samples that in each case the higher frequency was the Blu
species and the lower the B2u species.Nielsen and Woollett's Raman spectrum was obtained using photo-
graphic recording and showed 12 peaks. They assigned the v(CH2)stretching modes to the strongest peaks in the appropriate region, viz.vs(CH2) to 2848 cm"1 and va(CH2) to 2883 cm"1 . Three other weakpeaks were observed at 2912,2932 and 2720 cm"1 and it was suggestedthat the first two of these were overtones of the 1463/1473 cm"1
infrared-active doublet in Fermi resonance with the v(CH2) stretchingfundamentals, whereas the very weak peak at 2720 cm"1 mightcorrespond to the combination 1295 + 1440 = 2735 cm"1 or to the
168 The characterization of polymers
overtone of the methyl end group. Two peaks were observed at 1440 and1463 cm"1 and the first was assigned to the S(CH2) bending mode,because it was much the stronger. The 1463 cm"1 peak was assigned toeither an overtone of the infrared active 720/731 cm ~x doublet in Fermiresonance with the (5(CH2) fundamental or to the infrared active (5(CH2)fundamental at 1463 cm"1 which may be Raman active in theamorphous regions. The lowest two observed frequencies, 1131 and1061 cm ~1, were assigned to the B2g and Ag skeletal modes, respectively,by comparison with the corresponding values 1137 and 1037 cm"1
calculated by Liang et al. using a very simple model in which the CH2
groups were treated as point masses.Nielsen and Woollett's assignment of the remaining three observed
peaks, at 1415,1295 and 1168 cm"1 , which were assumed to be the threeremaining Raman-active fundamentals, illustrates an interesting use ofthe relationship, explained in section 4.6, between the symmetry speciesof a combination vibration and that of the corresponding fundamentals.Peaks observed in the infrared spectrum at 2016 and 1894 cm"1 wereassigned, respectively, to combinations of the 1295 and 1168 cm"1
Raman-active fundamentals with the 720/731 cm"1 B2u speciesinfrared-active fundamental. Since the 2016 cm"1 absorption showsparallel polarization with oriented samples, and is therefore of speciesB3u, the 1295 cm"1 mode must be of Blg symmetry (see character tablefor D2h, table 3.1), and was therefore assigned to the only remainingmode of that symmetry, the yt(CH2) twisting mode. Similarly, since the1894 cm"1 absorption is perpendicularly polarized and is therefore ofspecies Blu or B2u, the 1168 cm"1 mode must be B3g or Ag. All Ag modesare, however, already accounted for, so that it must be the B3g yr(CH2)mode, leaving as the only possibility the assignment of the 1415 cm"1
peak to the yw(CH2) mode.The new studies of the normal paraffins were refinements of earlier
studies, taking account of both Raman and infrared data and usingselection rules to identify modes. Simple coupled oscillator theoryindicates (see section 4.5) that any group vibration, such as the yr(CH2)vibration, should split into n — 2 components for a normal paraffin withn carbon atoms and n — 2 CH2 groups. Each component corresponds toa different phase difference, S, between adjacent oscillators and to a goodapproximation should have a frequency equal to that for a mode of theinfinite chain which has the same value of S. Extrapolation of the modesof highest and lowest frequency to infinite n should lead to the factorgroup modes for the infinite chain, for which S = 0 or n. A secondmethod of finding these limiting modes was to assign values of k, andhence <S, to each mode and to plot dispersion curves for a given type of
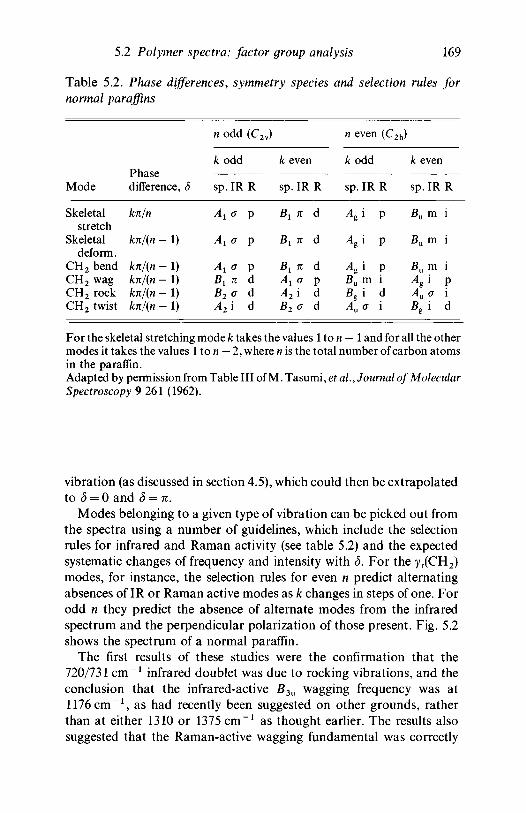
5.2 Polymer spectra: factor group analysis 169
Table 5.2. Phase differences, symmetry species and selection rules fornormal paraffins
n odd (C2v) n even (C2h)
/codd k even kodd k evenPhase
Mode difference, S sp. IR R sp. IR R sp. IR R sp. IR R
Skeletalstretch
Skeletaldeform.
CH2 bendCH2 wagCH2 rockCH2 twist
kn/n
kn/(n - 1)
kn/(n - 1)kn/(n - 1)kn/(n - 1)kn/(n - 1)
A1 G p
AXG pB1 n dB2 a dA2\ d
Bx n d
Bx n d
Ai a Pyl2i dB? G d
Ag i p
Agi p
Ag i pBum iBg i d
Bu m i
Bu m i
Bu m i
Ag i pAu G iB'\ d
For the skeletal stretching mode k takes the values 1 to n — 1 and for all the othermodes it takes the values 1 to n — 2, where n is the total number of carbon atomsin the paraffin.Adapted by permission from Table III of M. Tasumi, et al., Journal of MolecularSpectroscopy 9 261 (1962).
vibration (as discussed in section 4.5), which could then be extrapolatedto d = 0 and d = n.
Modes belonging to a given type of vibration can be picked out fromthe spectra using a number of guidelines, which include the selectionrules for infrared and Raman activity (see table 5.2) and the expectedsystematic changes of frequency and intensity with S. For the yr(CH2)modes, for instance, the selection rules for even n predict alternatingabsences of IR or Raman active modes as k changes in steps of one. Forodd n they predict the absence of alternate modes from the infraredspectrum and the perpendicular polarization of those present. Fig. 5.2shows the spectrum of a normal paraffin.
The first results of these studies were the confirmation that the720/731 cm"1 infrared doublet was due to rocking vibrations, and theconclusion that the infrared-active B3u wagging frequency was at1176 cm"1 , as had recently been suggested on other grounds, ratherthan at either 1310 or 1375 cm"1 as thought earlier. The results alsosuggested that the Raman-active wagging fundamental was correctly
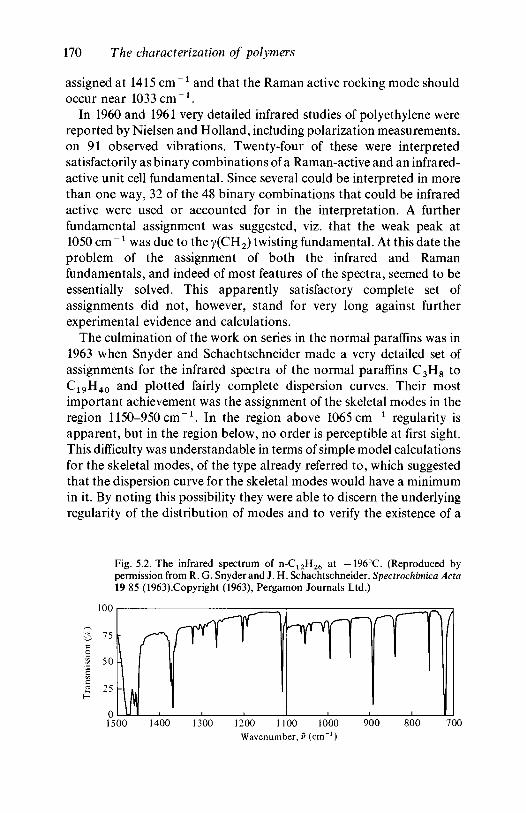
170 The characterization of polymers
assigned at 1415 cm"1 and that the Raman active rocking mode shouldoccur near 1033 cm"1 .
In 1960 and 1961 very detailed infrared studies of polyethylene werereported by Nielsen and Holland, including polarization measurements,on 91 observed vibrations. Twenty-four of these were interpretedsatisfactorily as binary combinations of a Raman-active and an infrared-active unit cell fundamental. Since several could be interpreted in morethan one way, 32 of the 48 binary combinations that could be infraredactive were used or accounted for in the interpretation. A furtherfundamental assignment was suggested, viz. that the weak peak at1050 cm ~1 was due to the y(CH2) twisting fundamental. At this date theproblem of the assignment of both the infrared and Ramanfundamentals, and indeed of most features of the spectra, seemed to beessentially solved. This apparently satisfactory complete set ofassignments did not, however, stand for very long against furtherexperimental evidence and calculations.
The culmination of the work on series in the normal paraffins was in1963 when Snyder and Schachtschneider made a very detailed set ofassignments for the infrared spectra of the normal paraffins C3H8 toC1 9H4 0 and plotted fairly complete dispersion curves. Their mostimportant achievement was the assignment of the skeletal modes in theregion 1150-950 cm"1 . In the region above 1065 cm"1 regularity isapparent, but in the region below, no order is perceptible at first sight.This difficulty was understandable in terms of simple model calculationsfor the skeletal modes, of the type already referred to, which suggestedthat the dispersion curve for the skeletal modes would have a minimumin it. By noting this possibility they were able to discern the underlyingregularity of the distribution of modes and to verify the existence of a
Fig. 5.2. The infrared spectrum of n-C12H26 at — 196°C. (Reproduced bypermission from R. G. Snyder and J. H. Schachtschneider, Spectrochimica Ada19 85 (1963).Copyright (1963), Pergamon Journals Ltd.)
1500 1400 1300 1200 1100 1000Wavenumber, v (cm"1)
900 800 700
5.2 Polymer spectra: factor group analysis 111
minimum in the dispersion curve. Limiting frequencies near 1135 and1065 cm"1 were clearly indicated, confirming that the Raman lines at1131 and 1061cm"1 in polyethylene are indeed due to the skeletalmodes. Earlier infrared studies on the normal paraffins indicated thatthe 1135 cm"1 limit was that of a series of perpendicularly polarizedmodes and therefore corresponded to the Ag mode, whereas the simplecalculations which led to the prediction of a minimum in the dispersioncurve had led Nielsen and Woollet, incorrectly, to believe that the Ag
mode should have a lower frequency than the B2g mode.During the course of the work, high speed computer methods of
solving the vibrational problem came into use, and once all theassignments had been made it was possible to adjust a set of forceconstants common to a group of molecules to give a simultaneous leastsquares fit of their frequencies to the observed values. A set of 35 valenceforce constants was fitted in this way to 270 frequencies of C2H6, C3H8,the normal paraffins C4H1 0 to C1 0H2 2 and polyethylene. The fit wasexcellent, with an average deviation of only 0.25%. It was possible, inaddition, to predict from the fitted force constants the frequencies of 240modes of C2D6 , C3D8 and the branched hydrocarbons isobutane,CH3 .CH(CH3) .CH3 , and neopentane, C(CH3)4. The calculationssupported the reassignment of the skeletal fundamentals in polyethyleneand the earlier assignment of the Raman-active CH2 wagging mode to1415cm"1. No other changes of assignment were indicated.
The calculations supplied normal mode eigenvectors as well asfrequencies and the only surprise provided by these was the fact that thedispersion curve which starts out at (5 = 0 from the 720 cm"1 purerocking mode in polyethylene gradually mixes with the twistingsymmetry mode to become the pure twisting mode of polyethylene for(5 = 7i, at a predicted frequency of 1063 cm"1 . Since this mode isactivated by the crystal field, the calculations supported the earlierassignment of the observed weak infrared mode at 1050 cm"1 to theyt(CH2) mode. In a similar way, the mode which is the pure Blg Ramanactive twisting mode of polyethylene at 1295 cm"1 mixes with therocking mode and eventually becomes the pure B3g Raman activerocking mode at 1168 cm"1 . This mixing of modes occurs becauserocking and twisting modes not only have similar frequencies but alsohave the same symmetry for the infinite chain when S ^ 0, as explainedin subsection 4.4.7. Mixing of the symmetry modes therefore takes placeto produce the actual normal modes and the corresponding dispersioncurves, which do not cross. Dispersion curves for polyethylene,produced by a more recent calculation, have been shown already in fig.4.13.
172 The characterization of polymers
Snyder and Schachtschneider believed that the spectra ofpolyethylene were now correctly assigned and that, in particular, thequestion of the wagging assignments for the polymer was settled 'withfinality'. Ironically, it was Snyder himself who later provided some of themost important evidence for the reassignment of the Raman activewagging mode.
The first doubts about the assignment of the wagging mode wereexpressed in a paper concerned with the vibrational spectra of methyllaurate, H(CH2) r iCOOCH3, and related compounds, and analternative assignment was suggested. Further evidence that theassignment to 1415 cm"1 was incorrect was provided by an analysis ofthe vibrational spectra of non-planar polyethylene chains by Snyder, inwhich the wagging modes of shorter segments are infrared activatedbecause of the lowering of the symmetry. No modes of frequency higherthan 1370 cm"1 were observed, although there was good reason toexpect that there would be some measurable absorption very near to thefrequency of the B3g wagging fundamental of polyethylene. It should benoted that in the earlier work it had not been possible to trace theexperimental frequency-phase curve beyond 1360cm"1, so that thevalue of 1415 cm"1 represented a fairly large extrapolation.
In order to study the CH2 wagging modes further and to avoidoverlap with symmetric deformation modes of methyl groups Snyderstudied some a,co-dichloroalkanes (Cl(CH2)nCl). He showed that if theB2g wagging fundamental of polyethylene was given the frequency1382 cm"1 a set offeree constants could be found which 'predicted' thedichloroalkane frequencies in the region 1310-1378 cm"1 withoutessentially changing the predicted frequencies of 185 observed modes forthe normal paraffins. Snyder points out that 'although there areabundant illustrations in the literature of the dangers of "predicting" or"confirming" vibrational assignments using computer calculatedfrequencies, the present example is singularly spectacular'.
There remained two problems: to identify a mode near 1382 cm"1 inthe Raman spectrum of polyethylene, and to explain the origin of theobserved mode at 1415 cm"1 . Subsequent Raman studies by Snyderestablished the presence at 1370 cm"1 of a peak in polyethylene whichcould not be attributed to a methyl vibration because it appeared in thespectrum of a linear polyethylene with less than one methyl group per1000 carbon atoms. This spectrum showed no trace of the peak at890 cm"1 which occurs in the spectrum of some polyethylenes and isknown from vibrational calculations to be due to an in-plane rockingmode of methyl groups. Later Raman polarization studies, includingstudies on a single crystal of C2 3H4 8 and biaxially oriented 'single
5.2 Polymer spectra: factor group analysis 173
crystal texture' polyethylene, confirmed that the peak at 1370 cm"1
shows the polarization properties expected of a B2g species mode suchas the yw(CH2) mode and that all the other peaks assigned tofundamentals, including the skeletal modes, also show the expectedpolarization behaviour.
These studies have drawn further attention to the complex nature ofthe spectrum in the v(CH2) and (5(CH2) regions, particularly the latter.The three peaks observed, at 1416,1440 and 1464 cm"1 , are found to beof symmetry species Ag, B3g and B3g, respectively. On the basis of thesesymmetries, and the fact that the component at 1416 cm"1 is present inthe spectra of those normal paraffins that crystallize with the same unitcell as polyethylene but not in the spectra of those that have only onechain per unit cell, it would be reasonable to conclude that the peaks at1416 and 1440 cm"1 are the correlation split doublet corresponding tothe (5(CH2) mode of symmetry Ag for the single chain. Present evidencesuggests that the assignment of the peak at 1416 cm"1 to the A%
component of the correlation doublet is almost certainly correct, butthat the interpretation of the remainder of this region of the Ramanspectrum, which will be discussed further in subsection 6.7.2, is quitecomplicated.
The extreme right-hand column of table 5.1 shows the final assign-ments of the crystal fundamentals of polyethylene taking account ofevidence produced since 1963. The precise values quoted are thoseobtained near 90 K, where available.
5.2.2 Poly(vinyl chloride)Poly(vinyl chloride) (PVC) provides a convenient example with
which to begin the discussion of the vibrational spectra of vinylpolymers, -(-CH2 . CHX-)^, because the substituent X is monatomic. X-ray diffraction studies suggest that the crystalline regions in the polymerconsist of syndiotactic chains in which the carbon backbone is in theplanar zig-zag conformation. It is therefore instructive to attempt theassignment of the various peaks in the infrared and Raman spectra of thepolymer in terms of an isolated chain of this type. Most of the discussionwill refer to the infrared spectrum because the assignments wereoriginally made almost entirely on the basis of infrared spectra.
It is reasonable to suppose that the vibrational modes will be of threetypes: those involving principally the vibrations of C—H, C—C orC—Cl units. The discussion that follows will concentrate onexperimental evidence, particularly from deuterated polymers, forassignments in terms of these three types of vibrations, but reference willalso be made to the results of vibrational calculations based on force
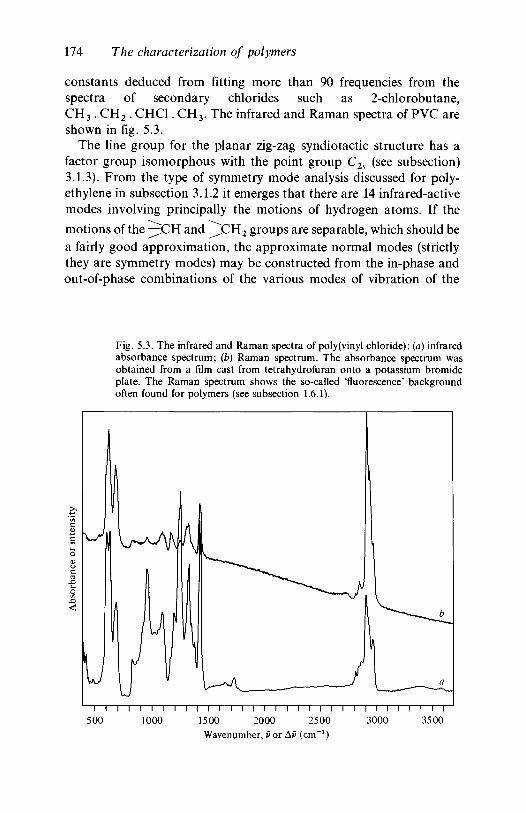
174 The characterization of polymers
constants deduced from fitting more than 90 frequencies from thespectra of secondary chlorides such as 2-chlorobutane,CH 3 . CH2 . CHC1. CH3. The infrared and Raman spectra of PVC areshown in fig. 5.3.
The line group for the planar zig-zag syndiotactic structure has afactor group isomorphous with the point group C2v (see subsection)3.1.3). From the type of symmetry mode analysis discussed for poly-ethylene in subsection 3.1.2 it emerges that there are 14 infrared-activemodes involving principally the motions of hydrogen atoms. If the
motions of the ^fCH and ^jCH2 groups are separable, which should bea fairly good approximation, the approximate normal modes (strictlythey are symmetry modes) may be constructed from the in-phase andout-of-phase combinations of the various modes of vibration of the
Fig. 5.3. The infrared and Raman spectra of poly(vinyl chloride): {a) infraredabsorbance spectrum; (b) Raman spectrum. The absorbance spectrum wasobtained from a film cast from tetrahydrofuran onto a potassium bromideplate. The Raman spectrum shows the so-called 'fluorescence' backgroundoften found for polymers (see subsection 1.6.1).
I l i r500
i r1000
I 1 I I I I I I I I I I I I I I 1 I r1500 2000 2500 3000Wavenumber, v or Av (cm"1)
T i l l3500
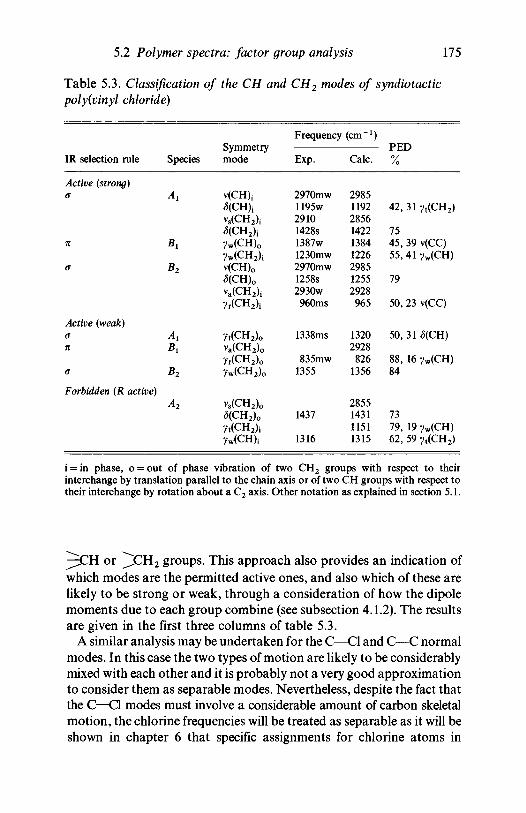
5.2 Polymer spectra: factor group analysis 175
Table 5.3. Classification of the CH and CH2 modes of syndiotacticpoly{vinyl chloride)
IR selection rule
Active (strong)a
n
a
Active (weak)an
a
Forbidden (R active)
Species
A,
B,
B2
A,B,
B2
A2
Symmetrymode
v(CH)i<5(CH)ivs(CH2)i<5(CH2)i7w(CH)0
7w(CH2)iv(CH)o
S(CH)0
Va(CH2)i7r(CH2)i
7t(CH2)o
va(CH2)o
y r(CH2)o
y w (CH 2 ) 0
v s(CH2)0
<5(CH2)O
7t(CH2)i7w(CH)i
Frequency
Exp.
2970mw1195w29101428s1387w1230mw2970mw1258s2930w
960ms
1338ms
835mw1355
1437
1316
(cm"1)
Calc.
298511922856142213841226298512552928
965
13202928
8261356
2855143111511315
PED
%
4 2 , 3 1 y t ( C H 2 )
7545, 39 v(CC)5 5 , 4 1 y w ( C H )
79
50, 23 v(CC)
50, 31(5(CH)
88, 16 yw(CH)84
7379, 19 yw(CH)62, 59 y t(CH2)
i = in phase, o = out of phase vibration of two C H 2 groups with respect to theirinterchange by translation parallel to the chain axis or of two CH groups with respect totheir interchange by rotation about a C 2 axis. Other notation as explained in section 5.1.
or ^jCH2 groups. This approach also provides an indication ofwhich modes are the permitted active ones, and also which of these arelikely to be strong or weak, through a consideration of how the dipolemoments due to each group combine (see subsection 4.1.2). The resultsare given in the first three columns of table 5.3.
A similar analysis may be undertaken for the C—Cl and C—C normalmodes. In this case the two types of motion are likely to be considerablymixed with each other and it is probably not a very good approximationto consider them as separable modes. Nevertheless, despite the fact thatthe C—Cl modes must involve a considerable amount of carbon skeletalmotion, the chlorine frequencies will be treated as separable as it will beshown in chapter 6 that specific assignments for chlorine atoms in
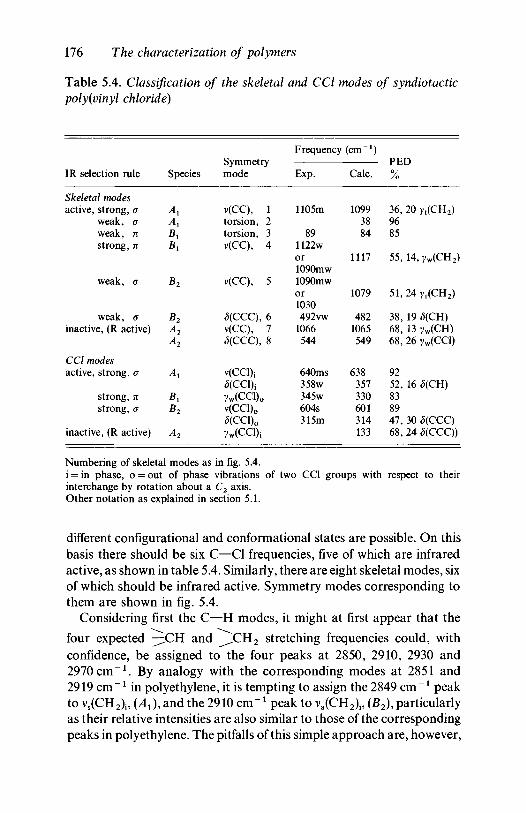
176 The characterization of polymers
Table 5.4. Classification of the skeletal and CCl modes of syndiotacticpoly(vinyl chloride)
IR selection rule
Skeletal modesactive, strong, a
weak, aweak, nstrong, n
weak, a
weak, Ginactive, (R active)
CCl modesactive, strong, G
strong, nstrong, G
inactive, (R active)
Species
A,A,Bl
B,
B2
B2
A2A2
A,
B,B2
A2
Symmetrymode
v(CC), 1torsion, 2torsion, 3v(CC), 4
v(CC), 5
<5(CCC), 6v(CC), 7<5(CCC), 8
v(CCl)i5(CCl)i7w(CCl)o
v(CCl)o
S(CC\)O
yw(cci)i
Frequency
Exp.
1105m
891122wor1090mw1090mwor1030492vw
1066544
640ms358w345w604s315m
(cm"1)
Calc.
10993884
1117
1079
4821065549
638357330601314133
PED0//o
36, 20 yt(CH2)9685
55, 14, yw(CH2)
51,24yr(CH2)
38, 19 (5(CH)68, 13 yw(CH)68, 26 yw(CCl)
9252, 16 <5(CH)838947, 30 <5(CCC)68, 24 S(CCQ)
Numbering of skeletal modes as in fig. 5.4.i = in phase, o = out of phase vibrations of two CCl groups with respect to theirinterchange by rotation about a C2 axis.Other notation as explained in section 5.1.
different configurational and conformational states are possible. On thisbasis there should be six C—Cl frequencies, five of which are infraredactive, as shown in table 5.4. Similarly, there are eight skeletal modes, sixof which should be infrared active. Symmetry modes corresponding tothem are shown in fig. 5.4.
Considering first the C—H modes, it might at first appear that the
four expected —CH and ^ ,CH 2 stretching frequencies could, withconfidence, be assigned to the four peaks at 2850, 2910, 2930 and2970 cm"1 . By analogy with the corresponding modes at 2851 and2919 cm"1 in polyethylene, it is tempting to assign the 2849 cm"1 peakto vs(CH2)i, (AJ, and the 2910 cm"1 peak to va(CH2)i, (B2), particularlyas their relative intensities are also similar to those of the correspondingpeaks in polyethylene. The pitfalls of this simple approach are, however,
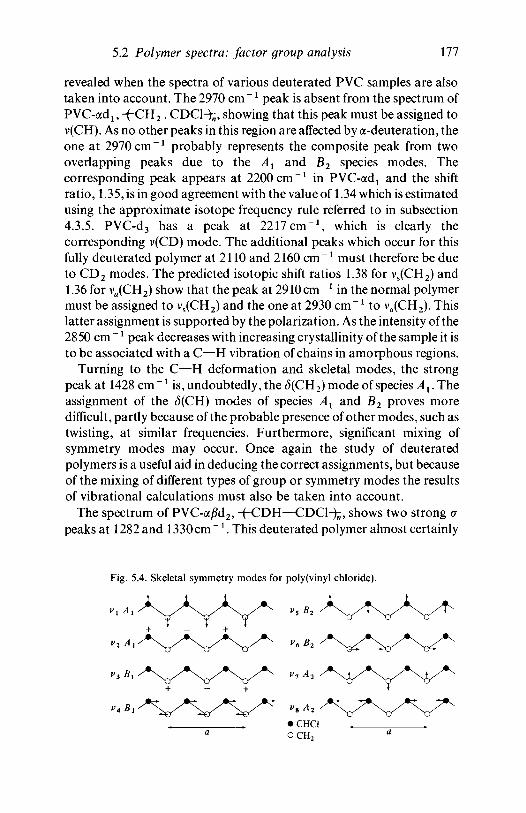
5.2 Polymer spectra: factor group analysis 111
revealed when the spectra of various deuterated PVC samples are alsotaken into account. The 2970 cm"1 peak is absent from the spectrum ofPVC-adj, -(-CH2 . CDCl-^, showing that this peak must be assigned tov(CH). As no other peaks in this region are affected by a-deuteration, theone at 2970 cm"1 probably represents the composite peak from twooverlapping peaks due to the A± and B2 species modes. Thecorresponding peak appears at 2200 cm"1 in PVC-ocd1 and the shiftratio, 1.35, is in good agreement with the value of 1.34 which is estimatedusing the approximate isotope frequency rule referred to in subsection4.3.5. PVC-d3 has a peak at 2217 cm"1 , which is clearly thecorresponding v(CD) mode. The additional peaks which occur for thisfully deuterated polymer at 2110 and 2160 cm ~1 must therefore be dueto CD2 modes. The predicted isotopic shift ratios 1.38 for vs(CH2) and1.36 for va(CH2) show that the peak at 2910 cm"1 in the normal polymermust be assigned to vs(CH2) and the one at 2930 cm"1 to va(CH2). Thislatter assignment is supported by the polarization. As the intensity of the2850 cm ~ : peak decreases with increasing crystallinity of the sample it isto be associated with a C—H vibration of chains in amorphous regions.
Turning to the C—H deformation and skeletal modes, the strongpeak at 1428 cm"1 is, undoubtedly, the S(CH2) mode of species Ax. Theassignment of the £(CH) modes of species A1 and B2 proves moredifficult, partly because of the probable presence of other modes, such astwisting, at similar frequencies. Furthermore, significant mixing ofsymmetry modes may occur. Once again the study of deuteratedpolymers is a useful aid in deducing the correct assignments, but becauseof the mixing of different types of group or symmetry modes the resultsof vibrational calculations must also be taken into account.
The spectrum of PVC-a£d2, -(-CDH—CDCl-fe, shows two strong apeaks at 1282 and 1330cm " 1 . This deuterated polymer almost certainly
Fig. 5.4. Skeletal symmetry modes for poly(vinyl chloride).
178 The characterization of polymers
has the hydrogen atoms, as well as the chlorine atoms, syndiotacticallyplaced, so that its planar zig-zag conformation belongs to the line groupCs and the only reasonable assignments for these two peaks are to thetwo (5(CH) modes expected for that structure. The fact that there is asplitting of 48 cm"1 between modes due to the motions of the CHgroups of /^-carbon atoms suggests that a large splitting may also beobserved for the modes of the CH groups on the a-carbon atoms ofnormal PVC, so that the strong peaks observed at 1338 and 1258 cm"1
are probably associated with the modes of A1 and B2 species, respectively.The spectrum of PYC-ocd1 shows three peaks: at 1297 cm"1 (cr),1353cm"1 (7i)and 1360 cm"1 (cr). Since this polymer contains methylene(^CH 2 ) groups but no lone CH groups, these peaks are mostreasonably assigned to the Ax species yt(CH2) and £x and B2 speciesyw(CH2) modes, respectively, of the C2v chain. In view of thesefrequencies it is necessary to consider the possibility that in normal PVCthe corresponding modes may interact with the S(CH) modes.
Polarization studies and the results of calculations of the normalmode frequencies lead to the assignments shown in table 5.3. Thecalculations show that in fact only the <5(CH2)i? <5(CH)0 and yw(CH2)0
modes may be considered as reasonably pure modes of the formsindicated. All other CH and CH2 bending or deformation modes aremixtures, several of which involve large components of C—C stretching.The last column in table 5.3 indicates the approximate nature of themode in terms of the calculated potential energy distribution (PED), thefirst figure being the percentage contribution of the dominant type ofmotion and the second the next most important contribution if this isgreater than 10 %, but it should be noted that the coordinates used in thecalculation were not precisely the symmetry coordinates discussed here.
Those skeletal modes which occur in the region 1050 to 1150 cm"1
are particularly difficult to assign even when empirical evidence and theresults of vibrational calculations are combined. There is generalagreement that the Ax species mode vx (see fig. 5.4) occurs at 1105cm"1,but the calculations show that it is very far from being a pure skeletalmode. Table 5.4 shows the alternative assignments which have beenmade for the Bt and B2 species modes. One of the difficulties of theassignment is that the absorption at 1090 cm"1 occurs as a weakshoulder on the 1105 cm"1 peak so that its dichroism is difficult toestablish with certainty. There is no ambiguity about the bending modeof B2 species, which is calculated to be at 482 cm"1 and observed at492 cm"1 . Only one of the two infrared-active torsional modes has beenobserved with certainty, at 89 cm"1 .
The C—Cl stretching region (600-700 cm"1) and, to a lesser extent,
5.2 Polymer spectra: factor group analysis 179
the C—Cl bending region (300^00 cm"1) are rich in information on theconfigurational and conformational isomerism of the chain; the formerregion will be considered in detail in the following chapter. Thevibrational calculations predict that the Ax and B1 species v(CCl) modesshould occur at 638 and 601 cm"1 , respectively. The main componentsof the observed complex of peaks are at about 640 and 604 cm"1 andexperiments with biaxially oriented samples show that these peaks havethe expected dichroisms. The Ax and B2 species <5(CC1) modes areassigned to 358 and 315 cm"1 , respectively, and the Bx species yw(CCl)mode to 345 cm ~x on the basis of vibrational calculations andpolarization measurements. The assignments for the C—Cl modes arelisted in table 5.4; the comments made about the PED in connectionwith table 5.3 also apply to this table.
There are a limited number of additional weak peaks in the spectrumthat may reasonably be assigned to the vibrational modes of variousconformational or configurational isomers of chains in amorphousregions. The fact that normal commercial poly(vinyl chloride) is largelydisordered and yet the above analysis, based on the planar zig-zagskeletal structure, is able to account for most of the observed peaksdemonstrates the value of this simplified approach to the understandingof the spectra of partially crystalline polymers. Its success is probablydue partly to the fact that chains in crystalline material, because of theirregular interactions with their neighbours, give sharper peaks withconsequently higher peak absorption than a comparable mass ofmaterial with a single isomeric structure in the amorphous regions.Additional factors are that the amorphous material contains a numberof different isomeric structures, so that the absorption due to similargroup vibrations is even further smeared out, and that modes such as theCH2 and skeletal modes are not very sensitive to configurationalisomerism because they do not involve much motion of the chlorine orlone hydrogen atoms, as the potential energy distribution shows.
Further empirical justification of the use of the simplified approachemerges from a comparison of the Raman spectra of a typicalcommercial polymer and a highly ordered polymer prepared frommonomer in the form of a urea clathrate complex. This latter polymer isknown, from X-ray diffraction evidence, to contain mainly planar zig-zag chains. Although its spectrum contains a few peaks not present inthat of the commercial polymer, the two spectra have a basic similarity.The various peaks are readily assignable to the symmetry speciesexpected for an isolated chain of C2v symmetry, using the type ofreasoning given in detail for the infrared assignments and taking intoaccount experimental depolarization ratios (Ax species are polarized,
180 The characterization of polymers
A2, Bt and B2 species are depolarized). The assignments for the A2
species, active only in the Raman effect, are shown in tables 5.3 and 5.4with the assignments already discussed.
5.2.3 Poly(vinylidene chloride)The molecule of poly(vinylidene chloride) (PVDC), with the
formula -(~CH2. CC1 2 ^ , has only one type of CH unit and it mighttherefore be supposed that the interpretation of its vibrational spectrumwould pose few problems. In practice, there are features which make theinterpretation a matter of considerable interest. The most important ofthese is that although PVDC is usually highly crystalline its crystalstructure is not known with certainty. X-ray studies show that there aretwo chains per unit cell and that the physical repeat unit, which mustinvolve two chemical repeat units, has a length of 4.68 A in the chain axisdirection. The conformation of the individual chains is, however, notknown.
In early attempts to assign the observed peaks in the infraredspectrum to vibrational modes of the perfect single chain two plausiblemodels were considered for the conformation. The first, due toReinhardt, has a planar carbon backbone of alternating cis and transbonds with all C—C—C bond angles equal to 120° (see fig. 5.5); theplanes of the CC12 and CH2 groups are not perpendicular to the fibreaxis, but inclined at an angle. The second structure, proposed by Fuller,has almost the normal planar zig-zag carbon chain, but it is shortenedslightly by rotations of about 34° around the C—C bonds and by areduction of the C—CC12—C angle to 99°, while the C—CH2—C bondangle remains at the tetrahedral angle; the planes of the CC12 groups areperpendicular to the fibre axis, neighbouring CC12 groups beingstaggered with respect to each other (see fig. 5.5). An attempt to decidebetween these two possible structures was made by comparing thecharacters of the CC12 stretching modes, as predicted by each of themodels, with the characters observed in the infrared spectrum. Theevidence from these modes unambiguously favoured the Fuller model,but there were some difficulties with the assignments of other modes.Later, particularly when Raman spectra became available, it becameclear that it was necessary to consider other models. Fig. 5.6 shows theinfrared and Raman spectra of PVDC.
All models must satisfy the requirement that the physical repeat unitconsists of two monomer units and has a length of 4.68 A in the chaindirection. Table 5.5 lists five of the structures that have been consideredmore recently, all of which satisfy these requirements, at least
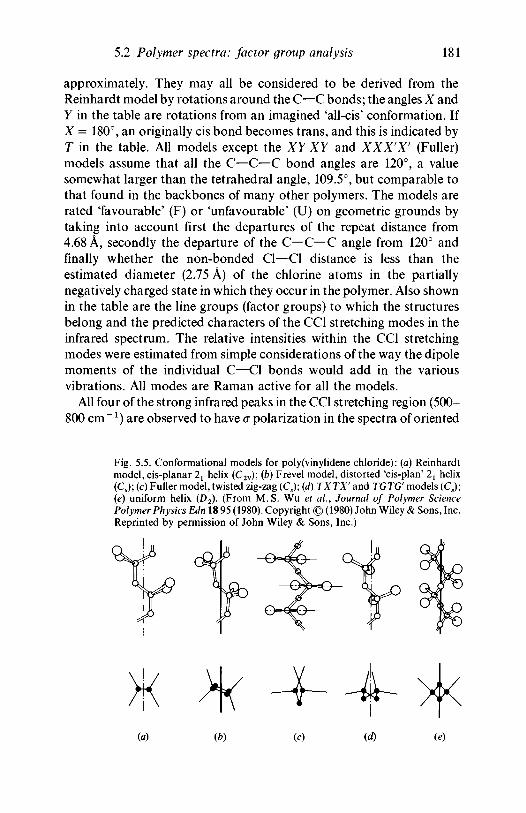
5.2 Polymer spectra: factor group analysis 181
approximately. They may all be considered to be derived from theReinhardt model by rotations around the C—C bonds; the angles X andY in the table are rotations from an imagined 'all-cis' conformation. IfX = 180°, an originally cis bond becomes trans, and this is indicated byT in the table. All models except the XY XY and XXX'X' (Fuller)models assume that all the C—C—C bond angles are 120°, a valuesomewhat larger than the tetrahedral angle, 109.5°, but comparable tothat found in the backbones of many other polymers. The models arerated 'favourable' (F) or 'unfavourable' (U) on geometric grounds bytaking into account first the departures of the repeat distance from4.68 A, secondly the departure of the C—C—C angle from 120° andfinally whether the non-bonded Cl—Cl distance is less than theestimated diameter (2.75 A) of the chlorine atoms in the partiallynegatively charged state in which they occur in the polymer. Also shownin the table are the line groups (factor groups) to which the structuresbelong and the predicted characters of the CCl stretching modes in theinfrared spectrum. The relative intensities within the CCl stretchingmodes were estimated from simple considerations of the way the dipolemoments of the individual C—Cl bonds would add in the variousvibrations. All modes are Raman active for all the models.
All four of the strong infrared peaks in the CCl stretching region (500-800 cm"1) are observed to have a polarization in the spectra of oriented
Fig. 5.5. Conformational models for poly(vinylidene chloride): (a) Reinhardtmodel, cis-planar 2l helix (C2V); (b) Frevel model, distorted 'cis-plan' 2X helix(Cs); (c) Fuller model, twisted zig-zag (Cs); (d) TXTX' and TGTG' models (Cs);(e) uniform helix (D2). (From M.S. Wu et al., Journal of Polymer SciencePolymer Physics Edn 18 95 (1980). Copyright © (1980) John Wiley & Sons, Inc.Reprinted by permission of John Wiley & Sons, Inc.)
(a) (b) (c) (d) (e)
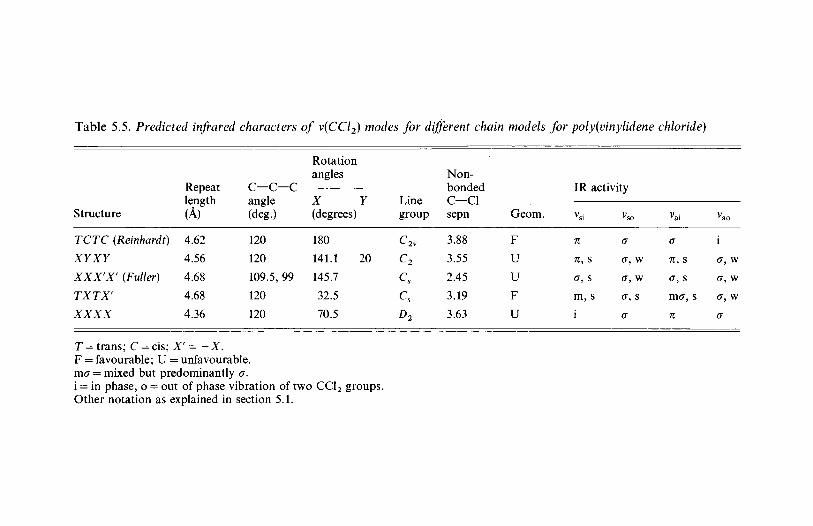
Table 5.5. Predicted infrared characters of v(CCl2) modes for different chain models for poly(vinylidene chloride)
Structure
TCTC (Reinhardt)XYXY
XXX'X' {Fuller)
TXTX'
XXXX
Repeatlength
(A)4.62
4.56
4.68
4.68
4.36
c—c—cangle(cleg.)
120
120
109.5, 99
120
120
Rotationangles
X Y(degrees)
180
141.1 20
145.7
32.5
70.5
Linegroup
c2vC2
cs
csD2
Non-bondedc—cisepn
3.88
3.55
2.45
3.19
3.63
Geom.
F
U
U
F
U
IR
n
71,
m,
i
activity
a
s G, w
s cr, w
S (7, S
G
vai
G
7T, S
G, S
mcr, s
n
Vao
i
G, W
G, W
G, W
G
T = trans; C = cis; X' = -X.F = favourable; U = unfavourable.mcr = mixed but predominantly G.i = in phase, o = out of phase vibration of two CC12 groups.Other notation as explained in section 5.1.
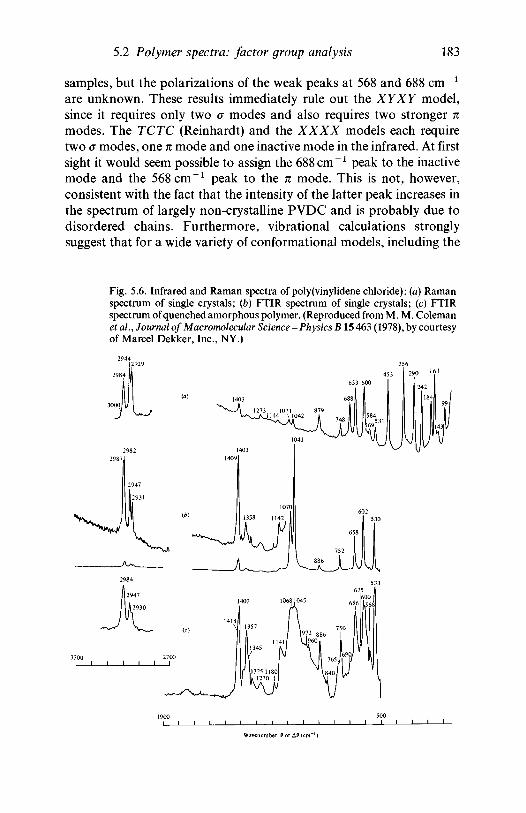
5.2 Polymer spectra: factor group analysis 183
samples, but the polarizations of the weak peaks at 568 and 688 cm x
are unknown. These results immediately rule out the XYXY model,since it requires only two o modes and also requires two stronger nmodes. The TCTC (Reinhardt) and the XXXX models each requiretwo G modes, one n mode and one inactive mode in the infrared. At firstsight it would seem possible to assign the 688 cm"1 peak to the inactivemode and the 568 cm"1 peak to the n mode. This is not, however,consistent with the fact that the intensity of the latter peak increases inthe spectrum of largely non-crystalline PVDC and is probably due todisordered chains. Furthermore, vibrational calculations stronglysuggest that for a wide variety of conformational models, including the
Fig. 5.6. Infrared and Raman spectra of poly(vinylidene chloride): (a) Ramanspectrum of single crystals; (b) FTIR spectrum of single crystals; (c) FTIRspectrum of quenched amorphous polymer. (Reproduced from M. M. Colemanet al.9 Journal of Macromolecular Science-Physics B15 463 (1978), by courtesyof Marcel Dekker, Inc., NY.)
i i i i i < i i i
Wavenumber, v or Av (cm"1)
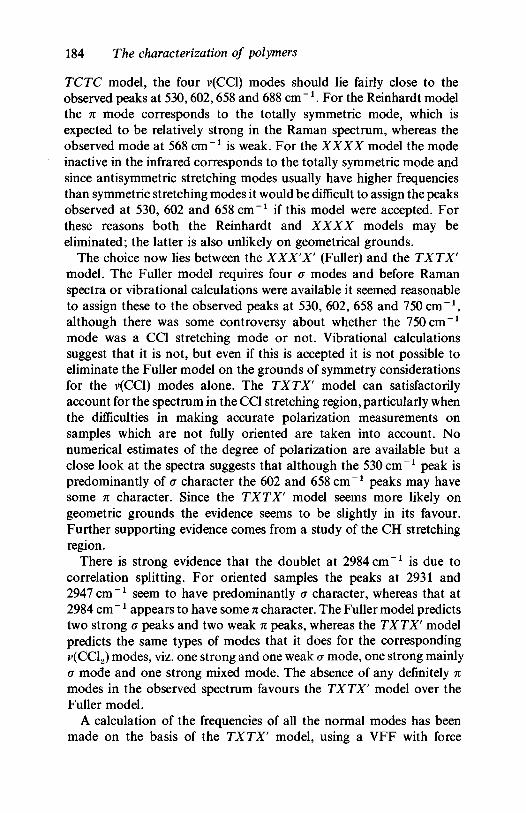
184 The characterization of polymers
TCTC model, the four v(CCl) modes should lie fairly close to theobserved peaks at 530,602,658 and 688 cm"1. For the Reinhardt modelthe n mode corresponds to the totally symmetric mode, which isexpected to be relatively strong in the Raman spectrum, whereas theobserved mode at 568 cm"1 is weak. For the XXXX model the modeinactive in the infrared corresponds to the totally symmetric mode andsince antisymmetric stretching modes usually have higher frequenciesthan symmetric stretching modes it would be difficult to assign the peaksobserved at 530, 602 and 658 cm"1 if this model were accepted. Forthese reasons both the Reinhardt and XXXX models may beeliminated; the latter is also unlikely on geometrical grounds.
The choice now lies between the XXX'X' (Fuller) and the TXTX'model. The Fuller model requires four a modes and before Ramanspectra or vibrational calculations were available it seemed reasonableto assign these to the observed peaks at 530, 602, 658 and 750 cm"1 ,although there was some controversy about whether the 750 cm"1
mode was a CC1 stretching mode or not. Vibrational calculationssuggest that it is not, but even if this is accepted it is not possible toeliminate the Fuller model on the grounds of symmetry considerationsfor the v(CCl) modes alone. The TXTX' model can satisfactorilyaccount for the spectrum in the CC1 stretching region, particularly whenthe difficulties in making accurate polarization measurements onsamples which are not fully oriented are taken into account. Nonumerical estimates of the degree of polarization are available but aclose look at the spectra suggests that although the 530 cm"1 peak ispredominantly of a character the 602 and 658 cm"1 peaks may havesome n character. Since the TXTX' model seems more likely ongeometric grounds the evidence seems to be slightly in its favour.Further supporting evidence comes from a study of the CH stretchingregion.
There is strong evidence that the doublet at 2984 cm"1 is due tocorrelation splitting. For oriented samples the peaks at 2931 and2947 cm"x seem to have predominantly o character, whereas that at2984 cm ~x appears to have some n character. The Fuller model predictstwo strong o peaks and two weak n peaks, whereas the TXTX' modelpredicts the same types of modes that it does for the correspondingy(CCl2) modes, viz. one strong and one weak cr mode, one strong mainlya mode and one strong mixed mode. The absence of any definitely nmodes in the observed spectrum favours the TXTX' model over theFuller model.
A calculation of the frequencies of all the normal modes has beenmade on the basis of the TXTX' model, using a VFF with force
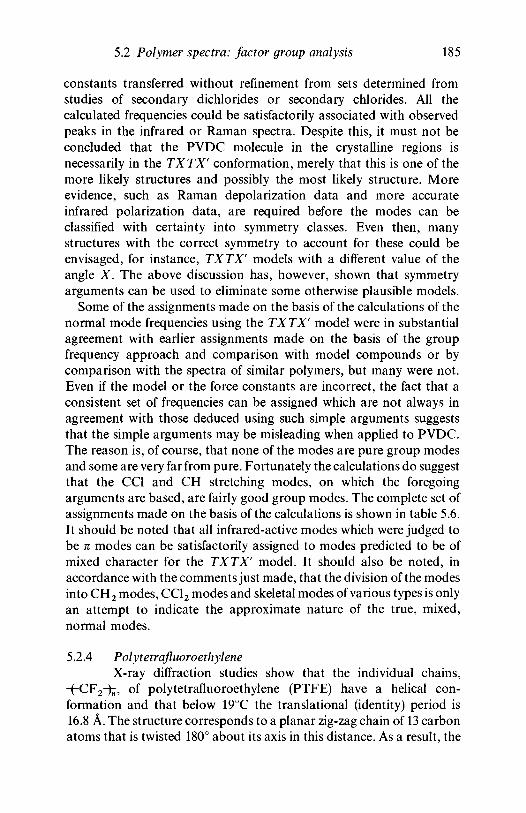
5.2 Polymer spectra: factor group analysis 185
constants transferred without refinement from sets determined fromstudies of secondary dichlorides or secondary chlorides. All thecalculated frequencies could be satisfactorily associated with observedpeaks in the infrared or Raman spectra. Despite this, it must not beconcluded that the PVDC molecule in the crystalline regions isnecessarily in the TXTX' conformation, merely that this is one of themore likely structures and possibly the most likely structure. Moreevidence, such as Raman depolarization data and more accurateinfrared polarization data, are required before the modes can beclassified with certainty into symmetry classes. Even then, manystructures with the correct symmetry to account for these could beenvisaged, for instance, TXTX' models with a different value of theangle X. The above discussion has, however, shown that symmetryarguments can be used to eliminate some otherwise plausible models.
Some of the assignments made on the basis of the calculations of thenormal mode frequencies using the TXTX' model were in substantialagreement with earlier assignments made on the basis of the groupfrequency approach and comparison with model compounds or bycomparison with the spectra of similar polymers, but many were not.Even if the model or the force constants are incorrect, the fact that aconsistent set of frequencies can be assigned which are not always inagreement with those deduced using such simple arguments suggeststhat the simple arguments may be misleading when applied to PVDC.The reason is, of course, that none of the modes are pure group modesand some are very far from pure. Fortunately the calculations do suggestthat the CC1 and CH stretching modes, on which the foregoingarguments are based, are fairly good group modes. The complete set ofassignments made on the basis of the calculations is shown in table 5.6.It should be noted that all infrared-active modes which were judged tobe n modes can be satisfactorily assigned to modes predicted to be ofmixed character for the TXTX' model. It should also be noted, inaccordance with the comments just made, that the division of the modesinto CH2 modes, CC12 modes and skeletal modes of various types is onlyan attempt to indicate the approximate nature of the true, mixed,normal modes.
5.2.4 PolytetrafluoroethyleneX-ray diffraction studies show that the individual chains,
-(-CF2-^, of polytetrafluoroethylene (PTFE) have a helical con-formation and that below 19°C the translational (identity) period is16.8 A. The structure corresponds to a planar zig-zag chain of 13 carbonatoms that is twisted 180° about its axis in this distance. As a result, the
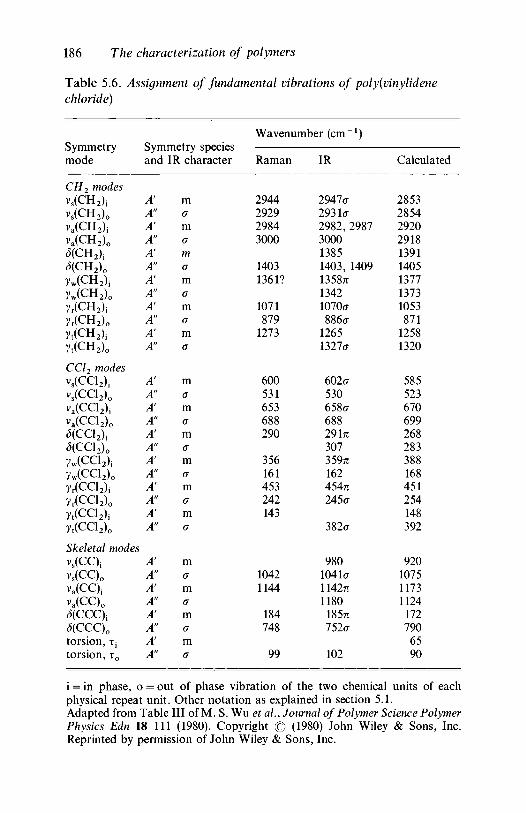
186 The characterization of polymers
Table 5.6. Assignment of fundamental vibrations of poly(vinylidenechloride)
Symmetrymode
CH2 modesVs(CH2)iv s(CH2)0
va(CH2)iVa(CH2)0
* C H 2 ) j<5(CH2)O
yw(CH2)i7w(CH2)0
^ C H 2 ) i?r(CH2)o
y t(CH2)ir,(CH2)o
CCl2 modesv,(ca2)iv s(CCl2)0
Va(CCl2)iv a ( C C l 2 ) 0
< 5 ( C C 1 2 ) J
<5(CC12)O
7w(cci2)jrw(cci2)07r(CCl2) i
7r(CCl2)o
7«(CC12)O
Skeletal modesvs(CC) i
vs(CC)o
Va(CC)iVa(CC)o
^(CCC)i<5(CCC)0
torsion, x{
torsion, TO
Symmetry speciesand ]
A'A'A'A'AA"AA"AA'AA"
AA"AAAA'AA'AA'AA'
AA'AA'AA'AA'
[R character
m(7
m(7
mG
mG
mG
mG
mG
mG
mG
mG
mG
mG
mG
mG
mG
mG
Wavenumber (cm l)
Raman
2944292929843000
14031361?
1071879
1273
600531653688290
356161453242143
10421144
184748
99
IR
2947a2931a2982, 2987300013851403, 14091358TC
13421070a886a
12651327a
602a530658a6882917T
307359TT
1624 5 4 T I
245a
382a
9801041a1142TT;
11801857T
752a
102
Calculated
285328542920291813911405137713731053871
12581320
585523670699268283388168451254148392
9201075117311241727906590
i = in phase, o = out of phase vibration of the two chemical units of eachphysical repeat unit. Other notation as explained in section 5.1.Adapted from Table III of M. S. Wu et ah, Journal of Polymer Science PolymerPhysics Edn 18 111 (1980). Copyright © (1980) John Wiley & Sons, Inc.Reprinted by permission of John Wiley & Sons, Inc.
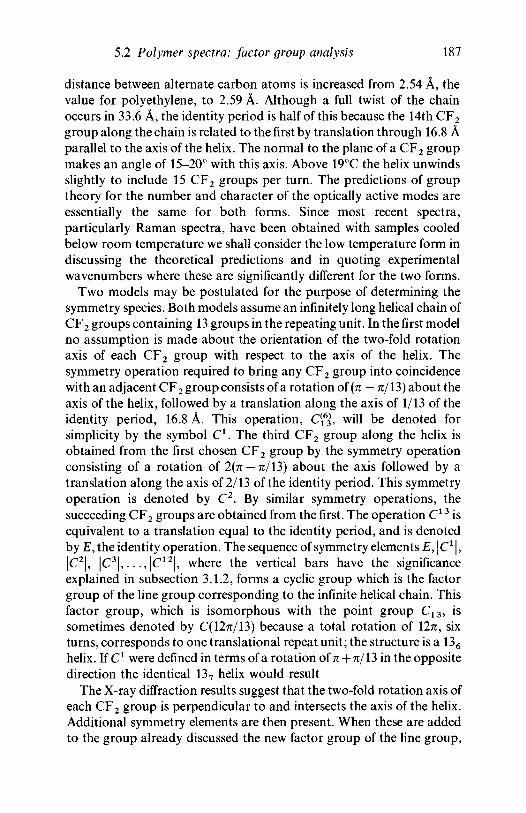
5.2 Polymer spectra: factor group analysis 187
distance between alternate carbon atoms is increased from 2.54 A, thevalue for polyethylene, to 2.59 A. Although a full twist of the chainoccurs in 33.6 A, the identity period is half of this because the 14th CF2
group along the chain is related to the first by translation through 16.8 Aparallel to the axis of the helix. The normal to the plane of a CF2 groupmakes an angle of 15-20° with this axis. Above 19°C the helix unwindsslightly to include 15 CF2 groups per turn. The predictions of grouptheory for the number and character of the optically active modes areessentially the same for both forms. Since most recent spectra,particularly Raman spectra, have been obtained with samples cooledbelow room temperature we shall consider the low temperature form indiscussing the theoretical predictions and in quoting experimentalwavenumbers where these are significantly different for the two forms.
Two models may be postulated for the purpose of determining thesymmetry species. Both models assume an infinitely long helical chain ofCF2 groups containing 13 groups in the repeating unit. In the first modelno assumption is made about the orientation of the two-fold rotationaxis of each CF2 group with respect to the axis of the helix. Thesymmetry operation required to bring any CF2 group into coincidencewith an adjacent CF2 group consists of a rotation of (n — 7i/13) about theaxis of the helix, followed by a translation along the axis of 1/13 of theidentity period, 16.8 A. This operation, Cfj, will be denoted forsimplicity by the symbol C1. The third CF2 group along the helix isobtained from the first chosen CF2 group by the symmetry operationconsisting of a rotation of 2(TT — TT/13) about the axis followed by atranslation along the axis of 2/13 of the identity period. This symmetryoperation is denoted by C2. By similar symmetry operations, thesucceeding CF2 groups are obtained from the first. The operation C13 isequivalent to a translation equal to the identity period, and is denotedby £, the identity operation. The sequence of symmetry elements £, \C* |,|C2|, |C 3 | , . . . , |C1 2 | , where the vertical bars have the significanceexplained in subsection 3.1.2, forms a cyclic group which is the factorgroup of the line group corresponding to the infinite helical chain. Thisfactor group, which is isomorphous with the point group C13, issometimes denoted by C(12TT/13) because a total rotation of 12TT, sixturns, corresponds to one translational repeat unit; the structure is a 136
helix. If C1 were defined in terms of a rotation of n + TT/13 in the oppositedirection the identical 137 helix would result
The X-ray diffraction results suggest that the two-fold rotation axis ofeach CF2 group is perpendicular to and intersects the axis of the helix.Additional symmetry elements are then present. When these are addedto the group already discussed the new factor group of the line group,
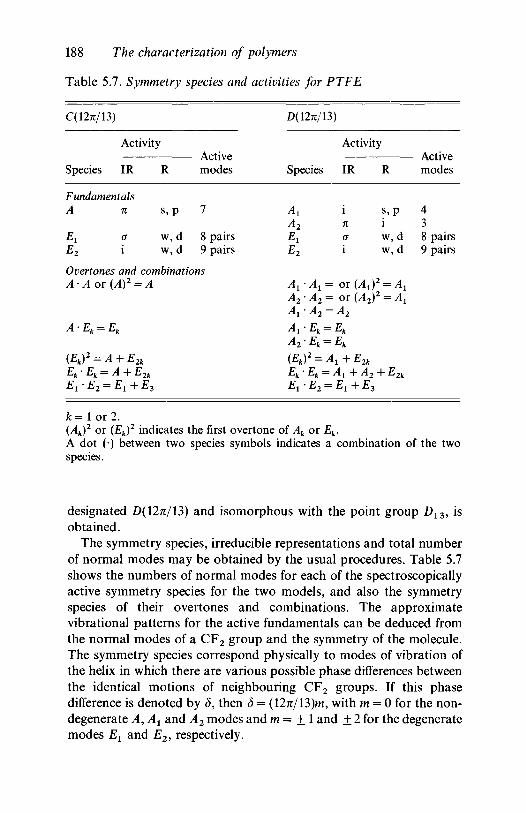
188 The characterization of polymers
Table 5.7. Symmetry species and activities for PTFE
C(12TT/13)
Activity
Species IR
FundamentalsA n
E2 i
R
s,
ww
p
,d,d
Activemodes
7
8 pairs9 pairs
Overtones and combinationsA A or {A)2 = A
Ek- Ek = A-\- E2k
E\ ' E2 = E^ -f- E-$
D( 12TT/13)
Species
A,
E\
A,-A,=A2-A2 =
A\-E\ = \{Ek)
2 = Ay
Ek-Ek = /El-E2 = i
Activity
IR
na
or (A2Y
+ E2k
i1+A2-{
R
s, piw, dw, d
= A\
^E2k
modes
438 pairs9 pairs
/ c = l o r 2 .(Ak)
2 or (Ek)2 indicates the first overtone of Ak or Ek.
A dot (•) between two species symbols indicates a combination of the twospecies.
designated D(127i/13) and isomorphous with the point group D13 , isobtained.
The symmetry species, irreducible representations and total numberof normal modes may be obtained by the usual procedures. Table 5.7shows the numbers of normal modes for each of the spectroscopicallyactive symmetry species for the two models, and also the symmetryspecies of their overtones and combinations. The approximatevibrational patterns for the active fundamentals can be deduced fromthe normal modes of a CF2 group and the symmetry of the molecule.The symmetry species correspond physically to modes of vibration ofthe helix in which there are various possible phase differences betweenthe identical motions of neighbouring CF2 groups. If this phasedifference is denoted by d, then S = (127t/13)m, with m = 0 for the non-degenerate A, Ax and A2 modes and m = ± 1 and ±2 for the degeneratemodes El and E2, respectively.

5.2 Polymer spectra: factor group analysis 189
Fig. 5.7 shows the infrared and Raman spectra of PTFE. Carefulstudies of the infrared spectra of samples with different degrees ofcrystallinity have enabled the infrared-active modes which areassociated specifically with the non-crystalline regions to be identifiedand studies on oriented samples have provided polarization data.Limited polarization data are available for the Raman-active modes,some of which have been deduced from the spectra of model compoundssuch as CF3(CF2)CF3 and CF3(CF2)4CF3 and some from the spectra ofperfluoropropylene copolymers, since PTFE itself is rather turbid.
The positions of the observed peaks and the polarization data aresummarized in table 5.8. In this table infrared peaks known to be
Fig. 5.7. Infrared and Raman spectra of polytetrafluoroethylene: {a) Infraredtransmittance spectrum of sample at room temperature. For the polarizedspectrum (350-1500cm"1). electric vector perpendicular to drawdirection; electric vector parallel to draw direction; (b) Raman spectrumof sample at — 50°C. ((a) reproduced by permission from C. Y. Liang and S.Krimm, J. Chem. Phys. 25 563 (1956); (b) reproduced by permission from J. L.Koenig and F. J. Boerio, J. Chem. Phys. 50 2823 (1969).)
500 1000Wavenumber, v or AP (cm"1)
1500
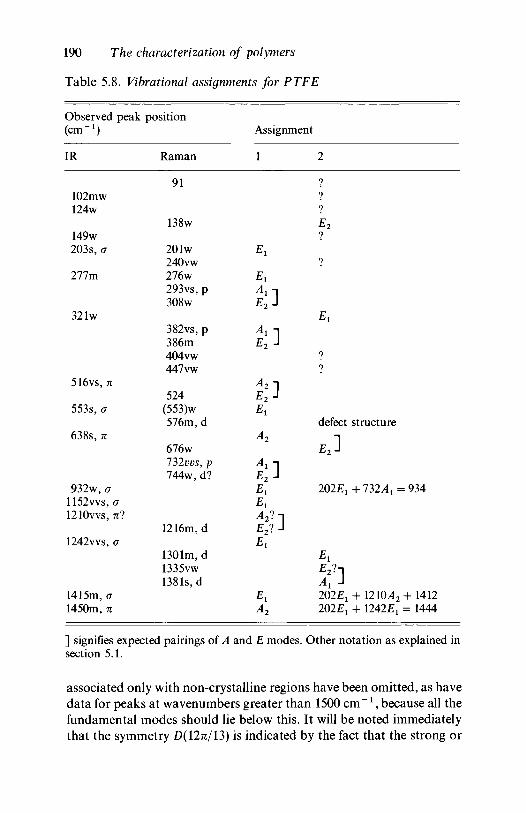
190 The characterization of polymers
Table 5.8. Vibrational assignments for PTFE
Observed peak(cm"1)
IR
102mw124w
149w203s, G
277m
32 lw
516vs, n
553s, G
638s, n
932w, G1152vvs, G1210VVS, 7T?
1242vvs, G
1415m, G1450m, n
position
Raman
91
138w
20 lw240vw276w293vs, p3O8w
382vs, p386m404 vw447 vw
524(553)w576m, d
676w132vvs, p744w, d?
1216m, d
1301m, d1335vw1381s, d
Assignment
1
Ei
EiAi "1E2J
Ai ~\E2 J
A2 -i
E2 -1Ex
A2
Ai 1E2 JEiEiy427 -1
£ 2 ? -IEi
A2
2
777E2
7
7
Ex
77
defect structure
E2 J
202£j + 732 Ax = 934
£2?-|Ai -I2 0 2 ^ +1210A2+ 1412202£j + \2A2El = 1444
] signifies expected pairings of A and E modes. Other notation as explained insection 5.1.
associated only with non-crystalline regions have been omitted, as havedata for peaks at wavenumbers greater than 1500 cm"1 , because all thefundamental modes should lie below this. It will be noted immediatelythat the symmetry D(12TT/13) is indicated by the fact that the strong or
5.2 Polymer spectra: factor group analysis 191
medium n polarized infrared peaks (at 516,638 and 1450 cm"1) are notobserved in Raman scattering and the strong polarized Raman peaks (at293,382 and 732 cm"1) are not observed in the infrared. Assignments tosymmetry species can be made fairly readily for many of the peaks usingthe information given in table 5.8 together with the fact that thefrequencies of E2 modes should lie close to those of the corresponding Amodes because S = 332° for the E2 modes. These 'obvious' assignmentsare shown in the column of the table labelled 'Assignment 1'.
Examination of this column shows that only three of the expected fourmodes of Ax species have been assigned. The strong peak at 1381 cm ~x
is the obvious possibility for the fourth, in spite of its apparentdepolarization. Three modes which are definitely of A2 species havebeen identified, and a possible fourth. Since only three A2 fundamentalsare expected, one of these modes must be an overtone or combination.There are no binary combinations or overtones which could account forthe peak at 638 cm"1 and it seems most unlikely that the very strongmodes at 516 and 1210 cm ~x are other than fundamentals. The mediumintensity n peak at 1450 cm"1 could, however, be due to 202(£J +1242(£x) = 1444 cm"1 . When an attempt is made to explain as many aspossible of the peaks observed in the infrared spectrum above1500 cm"1 as overtones or combinations it turns out that the1210 cm"1 mode, if assigned to an A2 fundamental, is considerablymore helpful than the 1450 cm"1 mode. It is particularly difficult toexplain the n mode observed at 2590 cm"1 except as the combination1210(A2)+ 1381(,41) = 259lcm"1 , which also further supports theassignment of the peak at 1381 cm"1 to a mode of A1 species.
Seven £x modes have been identified and eight fundamentals areexpected. One Ex mode is, however, expected at a frequency lower than100cm"1, since it corresponds to a mode at (5=166.2° on the v5
dispersion curve for polyethylene (see fig. 4.13). In addition, it does notseem possible to assign the infrared mode at 321 cm ~x as an overtone orcombination, so that it is most likely to be an Ex fundamental, givingone El species too many. The E1 mode at 932 cm"1 can, however, beaccounted for by several binary combinations, of which the most likelyis 202(£1) + 732(^1) = 934cm"1 , and the mode at 1415 cm"1 , unlikethose at 1152 and 1242 cm"1 , is not required for explaining anycombination modes so that it seems likely that it is itself a combinationmode, probably 1210(A2)+ 202(Ex)= 1412 cm"1 . There are twomedium depolarized peaks at 576 and 1301 cm ~ l , either of which couldbe assigned to the missing Ex species fundamental if both the 932 and1415 cm"1 peaks are accepted as combination modes. Some authorshave assumed that the 576 cm " l mode is due to a defect structure and
192 The characterization of polymers
have assigned the 1301cm"1 peak as the EA fundamental, whereasothers have assigned the 1301 cm"1 peak to an E2 species fundamental.This latter assignment seems unlikely, since there is no A speciesfundamental near 1301cm"1.
Finally, only five E2 species modes have been assigned, comparedwith an expected nine fundamentals. Two of these modes,corresponding to the modes on the v5 and v9 curves for polyethylene at(5 = 27.7°, are expected to lie below 200 cm"1 and do not have acorresponding A species mode; more precisely, the A species modeshave zero frequency and correspond, respectively, to translation parallelto and rotation about the chain axis. The higher of these two E2 speciesmodes is almost certainly to be assigned to the peak at 138 cm ~1 and theother probably lies near 20 cm ~x. The only unassigned Raman peakclose to the A2 species peak at 638 cm ~x is that at 676 cm ~ l , so that it isthe most likely corresponding E2 species mode. Similarly, the onlyunassigned Raman peak close to the A1 species peak at 1381 cm"1 is thevery weak peak at 1335 cm"1 , which may be the corresponding E2
species. The Raman peaks at 91, 404 and 447 cm"1 then remainunassigned, although some authors have considered them to be E2
species fundamentals. The infrared modes at 102,124 and 149 cm"1 alsoremain unassigned.
The column labelled 'Assignment 2' in table 5.8 shows the furtherassignments made by the preceding detailed arguments. In fig. 5.8 thefundamentals are plotted against the phase angle d and smoothcontinuous curves are drawn through the corresponding modes toindicate the smoothest dispersion curves which would be consistent withthese fundamentals. The dispersion curves cannot cross, so that theappropriate E1 species modes for the curves are determined simply bytheir order. As indicated earlier, to a first approximation each dispersioncurve represents vibrations of a similar nature, differing only in therelative phases of the motions of adjacent CF2 groups.
The totally symmetric A1 species must correspond to symmetrymodes which are of the types vs(CF2), <5(CF2), yt(CF2) or C—Cstretching, v(CC). There is no doubt that the two higher frequenciescorrespond to vs(CF2) and v(CC) and although there is some doubtabout which is which, most authors favour the assignment of the higherfrequency to a mode which is predominantly v(CF2), on the basis that itis unlikely that the v(CC) mode for PTFE can lie at a higher frequencythan that of the corresponding mode for polyethylene (1133cm"1),bearing in mind the increased mass of the CF2 group over the CH2
group. Such arguments can, however, be dangerous for highly coupledsystems of oscillators. There is also doubt about which of the other pair
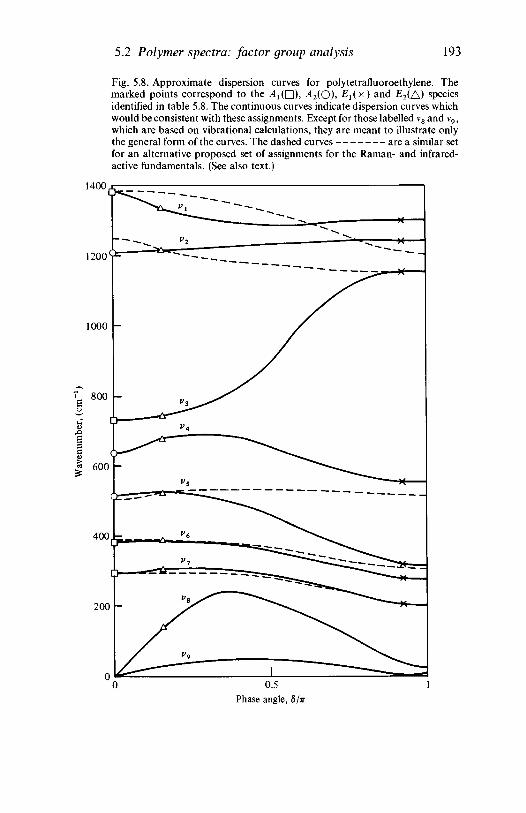
5.2 Polymer spectra: factor group analysis 193
Fig. 5.8. Approximate dispersion curves for polytetrafluoroethylene. Themarked points correspond to the ^ ( D ) , A2(O), Ex{x) and £2(A) speciesidentified in table 5.8. The continuous curves indicate dispersion curves whichwould be consistent with these assignments. Except for those labelled v8 and v9,which are based on vibrational calculations, they are meant to illustrate onlythe general form of the curves. The dashed curves are a similar setfor an alternative proposed set of assignments for the Raman- and infrared-active fundamentals. (See also text.)
1400
1200
1000 -
800 -
600 -
400 Jb
200 -
0.5Phase angle, 8/n
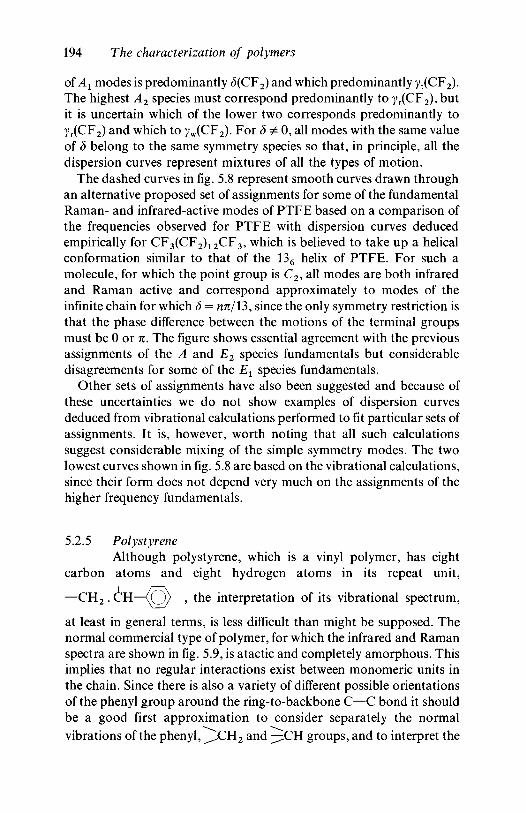
194 The characterization of polymers
of A1 modes is predominantly (5(CF2) and which predominantly yt(CF2).The highest A2 species must correspond predominantly to yr(CF2), butit is uncertain which of the lower two corresponds predominantly toyr(CF2) and which to yw(CF2). For 3 ̂ 0, all modes with the same valueof 3 belong to the same symmetry species so that, in principle, all thedispersion curves represent mixtures of all the types of motion.
The dashed curves in fig. 5.8 represent smooth curves drawn throughan alternative proposed set of assignments for some of the fundamentalRaman- and infrared-active modes of PTFE based on a comparison ofthe frequencies observed for PTFE with dispersion curves deducedempirically for CF3(CF2)12CF3, which is believed to take up a helicalconformation similar to that of the 136 helix of PTFE. For such amolecule, for which the point group is C2, all modes are both infraredand Raman active and correspond approximately to modes of theinfinite chain for which 3 = nn/13, since the only symmetry restriction isthat the phase difference between the motions of the terminal groupsmust be 0 or n. The figure shows essential agreement with the previousassignments of the A and E2 species fundamentals but considerabledisagreements for some of the Ex species fundamentals.
Other sets of assignments have also been suggested and because ofthese uncertainties we do not show examples of dispersion curvesdeduced from vibrational calculations performed to fit particular sets ofassignments. It is, however, worth noting that all such calculationssuggest considerable mixing of the simple symmetry modes. The twolowest curves shown in fig. 5.8 are based on the vibrational calculations,since their form does not depend very much on the assignments of thehigher frequency fundamentals.
5.2.5 PolystyreneAlthough polystyrene, which is a vinyl polymer, has eight
carbon atoms and eight hydrogen atoms in its repeat unit,
—CH2 . CH—(O) -> the interpretation of its vibrational spectrum,
at least in general terms, is less difficult than might be supposed. Thenormal commercial type of polymer, for which the infrared and Ramanspectra are shown in fig. 5.9, is atactic and completely amorphous. Thisimplies that no regular interactions exist between monomeric units inthe chain. Since there is also a variety of different possible orientationsof the phenyl group around the ring-to-backbone C—C bond it shouldbe a good first approximation to consider separately the normalvibrations of the phenyl, ^JCH2 and ^ C H groups, and to interpret the
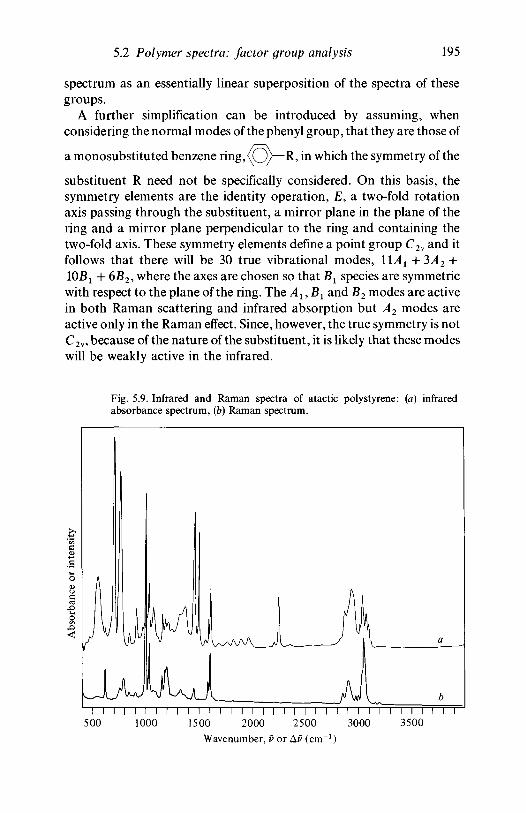
5.2 Polymer spectra: factor group analysis 195
spectrum as an essentially linear superposition of the spectra of thesegroups.
A further simplification can be introduced by assuming, whenconsidering the normal modes of the phenyl group, that they are those of
a monosubstituted benzene ring,<O)—R, in which the symmetry of the
substituent R need not be specifically considered. On this basis, thesymmetry elements are the identity operation, E, a two-fold rotationaxis passing through the substituent, a mirror plane in the plane of thering and a mirror plane perpendicular to the ring and containing thetwo-fold axis. These symmetry elements define a point group C2v and itfollows that there will be 30 true vibrational modes, 11A1 + ?>A2 +10B1 4- 6B2, where the axes are chosen so that Bx species are symmetricwith respect to the plane of the ring. The Al, Bx and B2 modes are activein both Raman scattering and infrared absorption but A2 modes areactive only in the Raman effect. Since, however, the true symmetry is notC2v, because of the nature of the substituent, it is likely that these modeswill be weakly active in the infrared.
Fig. 5.9. Infrared and Raman spectra of atactic polystyrene: {a) infraredabsorbance spectrum, (b) Raman spectrum.
I I I I I I I500 1000
1 \ 1 I I I1500 2000
1 I I I I I I I I I I500 3000 3500
Wavenumber, v or Av (cm !)
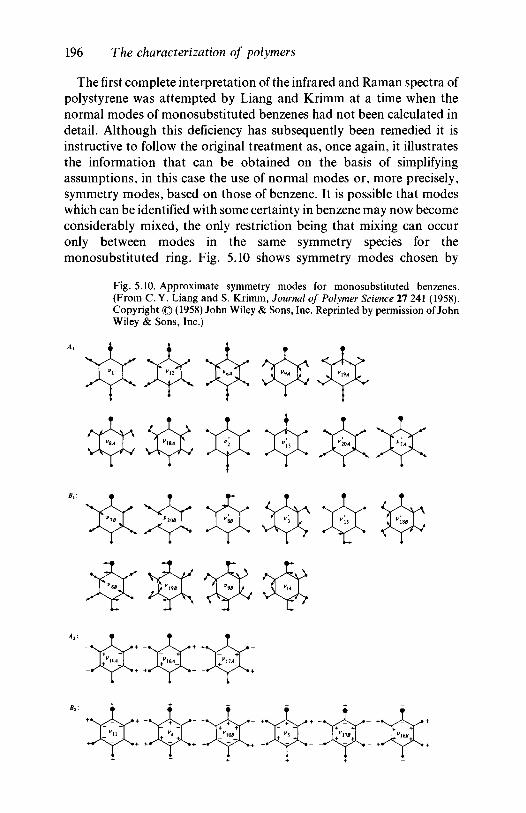
196 The characterization of polymers
The first complete interpretation of the infrared and Raman spectra ofpolystyrene was attempted by Liang and Krimm at a time when thenormal modes of monosubstituted benzenes had not been calculated indetail. Although this deficiency has subsequently been remedied it isinstructive to follow the original treatment as, once again, it illustratesthe information that can be obtained on the basis of simplifyingassumptions, in this case the use of normal modes or, more precisely,symmetry modes, based on those of benzene. It is possible that modeswhich can be identified with some certainty in benzene may now becomeconsiderably mixed, the only restriction being that mixing can occuronly between modes in the same symmetry species for themonosubstituted ring. Fig. 5.10 shows symmetry modes chosen by
Fig. 5.10. Approximate symmetry modes for monosubstituted benzenes.(From C. Y. Liang and S. Krimm, Journal of Polymer Science 27 241 (1958).Copyright © (1958) John Wiley & Sons, Inc. Reprinted by permission of JohnWiley & Sons, Inc.)
A2:
5.2 Polymer spectra: factor group analysis 197
Liang and Krimm as being likely to be reasonably close to the truenormal modes of the monosubstituted ring. The dashes signifysymmetry modes which are mixtures of those expected for benzene.Subscripts A and B signify the A and B species components of modeswhich are doubly degenerate for benzene.
The mixing of modes within a symmetry species can lead to a'borrowing' of intensity. Hence, a mode inactive for benzene may givestrong absorption in the infrared spectrum or strong Raman scatteringby mixing with a suitable infrared- or Raman-active mode. This seems tooccur for some of the B2 modes of the phenyl group in polystyrene.Where this effect is not present, the strong infrared peaks should bethose arising from vibrations which are essentially antisymmetric withrespect to inversion at the centre of the benzene ring, while Ramanactivity should be found mainly in modes which are essentiallysymmetric with respect to this operation. The study of overtone andcombination peaks is also of help in assigning fundamentals. Somemoderately intense combination peaks occur in the infrared spectrum ofbenzene and are also expected to occur for the monosubstituted ring.This proves to be the case and these combination peaks were of valuefor assigning some of the normal modes of species A2 and B2.
Table 5.9 shows the assignments suggested by Liang and Krimm, onthe basis of the considerations outlined above, for those fundamentalswhich correspond essentially to the vibrations of the carbon frameworkof the ring in its own plane, to ring C—C—H angle bending in the planeof the ring or to out-of-plane modes of the ring. For each mode thesymmetry species and observed activity are given and also the positionsand symmetry species of the corresponding modes of benzene. It may beobserved that many of the modes of polystyrene have frequencies veryclose to those of the corresponding modes of benzene.
The remaining modes associated with the ring are five C—Hstretching vibrations, v'2, v'7A, v7B, v20 and v20B and two modes associatedwith the C—C bond linking the ring to the chain, viz. the stretching ofthis bond, v\ 3, and the in-plane bending of the R—C—C angles, v'8B. Theout-of-plane bending of the R—C bond is accounted for within the sixout-of-plane ring modes of species B2 and no mode correspondingpredominantly to the bending of this bond was specifically postulated. Itwas not possible to assign all the individual ring C—H stretching modeswith certainty for various reasons, but tentative assignments were madeto specific peaks in the group of peaks lying between 3029 and3138 cm"1 . Equally, it was not possible to identify the v'13 stretchingmode, but it appeared likely that it contributed to the group of peaksnear 1000 cm"1 . The R—C—C bending mode was tentatively assignedto the Raman peak observed at 196 cm"1 .
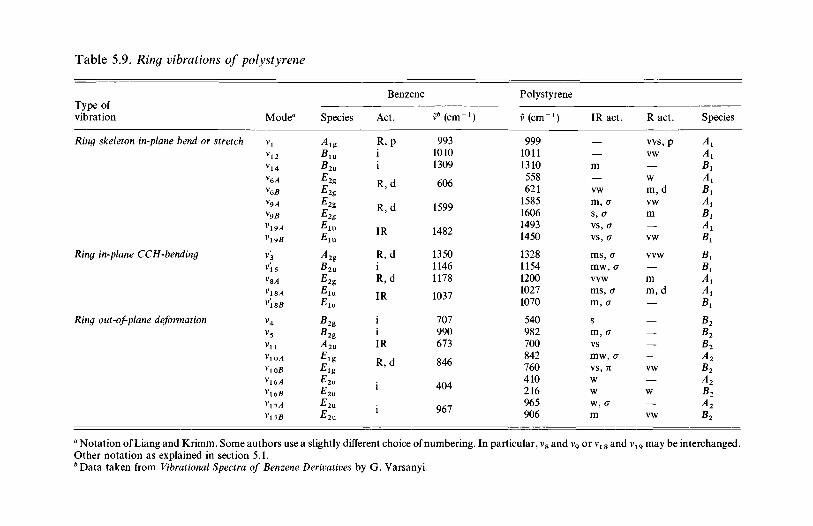
Table 5.9. Ring vibrations of polystyrene
Type ofvibration
Benzene Polystyrene
Mode" Species Act. vb (cm"1) v (cm 1) IR act. R act. Species
Ring skeleton in-plane bend or stretch vl
Ring in-plane CCH-bending
Ring out-of-plane deformation
vl0B
V16B
vnB
A^Mg
B2U
^2gE 2g
°2g
EZ
R,P
R,d
R, d
IR
R,diR,d
IR
IR
R,d
i
i
99310101309
606
1599
1482
135011461178
1037
707990673
846
404
967
99910111310558621
1585160614931450
13281154120010271070
540982700842760410216965906
——m
vwm, GS, G
VS, G
VS, G
ms, Gmw, Gvvwms, Gm, G
sm, Gvsmw, Gvs, n
wwW, Gm
vvs, pvw—wm, d
vwm—vw
vvw—mm, d
—
———vw—w—vw
*1
A\B\A\B,A,B,A,B,
B,B,A,A1By
B2B2B2A2B2A2B2A2B,
a Notation of Liang and Krimm. Some authors use a slightly different choice of numbering. In particular, v8 and v9 or vt 8 and v19 may be interchanged.Other notation as explained in section 5.1.bData taken from Vibrational Spectra of Benzene Derivatives by G. Varsanyi.
5.2 Polymer spectra: factor group analysis 199
The remaining modes of the atactic polystyrene chain should all beinfrared active. The CH2 modes were readily identified by comparisonwith the polyethylene spectrum. On this basis, the stretching modesvs(CH2) and va(CH2) were assigned to peaks at 2851 and 2923 cm"1 .The bending mode S(CH2) is found at about 1460 cm"1 for amorphouspolyethylene and is, undoubtedly, the main component of thepolystyrene peak at 1450 cm"1 . The fact that its intensity is greater thanthat of the stretching modes, contrary to what is found for polyethylene,led to the conclusion that it is a superposition of peaks, anothercomponent being the ring frequency v19B. The yw(CH2) wagging mode isvery weak in the spectrum of polyethylene and was not identified forpolystyrene. The CH2 rocking mode, yr(CH2), gives the well-knownstrong doublet at 720/731 cm"1 for polyethylene but is much moredifficult to identify for vinyl polymers as a whole, as it moves to higherfrequencies and weakens. It was suggested that for polystyrene it maycontribute part of the weak peak at 965 cm"1 . The yt(CH2) mode wassubsequently identified at 1298 cm"x from studies of isotacticpolystyrene.
With hydrocarbon polymers the stretching mode of the lone CHgroup is usually too weak to be easily identified and polystyrene provesno exception. This is also the case with the CH bending mode, 5(CH),which may contribute to the peak at 1376 cm"1 . The skeletal modes ofthe regular planar zig-zag carbon chain of polyethylene give rise to twochain stretching frequencies near 1100 cm"1 . For amorphouspolyethylene, with a random chain, the single peak at 1080 cm"1 hasbeen assigned to this mode. By analogous reasoning, a single peak isexpected for atactic polystyrene and the medium intensity peak at1070 cm"1 was assigned to this vibration. The peaks at 325 and446 cm"1 were assigned to chain bending modes. A number of otherpeaks in the spectrum were assigned to combinations of the fundamentalmodes already assigned and, in particular, the group of peaks whichappear in the infrared spectrum between 1675 and 1945 cm"1 wereassigned in that way.
Since the original assignments were given by Liang and Krimm,studies have been made on deuterated polystyrenes and on isotacticpolystyrene. The isotactic polymer is partially crystalline and the chainstake up a 3l helical conformation in the crystallites, so that accountmust be taken of the symmetry of the complete chain because of theregular interactions which now take place between adjacent repeatunits. The factor group of the line group is isomorphous with the pointgroup C3, so that there are only two symmetry species, A and £, both ofwhich are active for both Raman scattering and infrared absorption.
200 The characterization of polymers
Calculations of the vibrational spectrum of the isotactic form have beenperformed using force fields derived for hydrocarbons by Snyder andSchachtschneider (see subsection 5.2.1) and for monosubstituted alkylbenzenes. These studies have shown that the analysis of Liang andKrimm was correct in its general outlines, particularly for the ringmodes. It has, however, become clear that many of the ring modes areessentially strong mixtures, within a given species, of the symmetrymodes shown in fig. 5.10. As an example, the corresponding members ofthe two pairs of modes v18 and v19 are strongly mixed so that all four ofthe resulting modes involve both ring C—C—H bending and ring C—Cstretching. In addition, some normal modes involve strong mixing ofsymmetry modes of the ring and of the backbone, for example the modeslabelled v8A and v'18B in table 5.9. The calculations suggest that the peakassigned to v4 in table 5.9 is predominantly a backbone vibration butincludes considerable amounts of C—R out-of-plane bending, whilethat assigned to v16B is predominantly a backbone vibration butincludes a considerable amount of in-plane C—R bending. This mixingof ring and backbone vibrations leads to an explanation for a number ofdifferences observed when comparing the spectra of atactic polystyreneand amorphous and crystalline isotactic polystyrenes which are oftendescribed as being due to 'conformationally sensitive' peaks.
5.2.6 Poly(ethylene terephthalate)The results presented in subsection 5.2.5 show that reasonably
complete and certain assignments are possible for a polymer with arepeat unit as large as that of polystyrene. The work which has beendone on the interpretation of the vibrational spectrum of poly(ethyleneterephthalate) (PET), shown in fig. 5.11, is of particular interest inshowing what can be achieved for a still more complex molecule,
- f -OCH 2 CH 2 O—OC—(^y-CO^. The vibrational spectrum of PETis more complex than that of polystyrene for two reasons: the presenceof an oxygen-containing group and the fact that PET is usually partiallycrystalline, so that the intensities of several peaks depend upon thecrystalline/amorphous ratio. Nevertheless, it has been possible to makereasonably complete assignments. Two aspects of the problem will beconsidered briefly, first the approximate specification of the symmetryspecies of the repeat unit in terms of the symmetry species of two sub-units and secondly the assignment of the normal modes primarilyassociated with the oxygen-containing group.
X-ray diffraction studies suggest that in the crystalline regions thestructure takes up a centrosymmetric trans conformation. The moleculeis nearly planar and almost fully extended (see fig. 4.6). Departures from
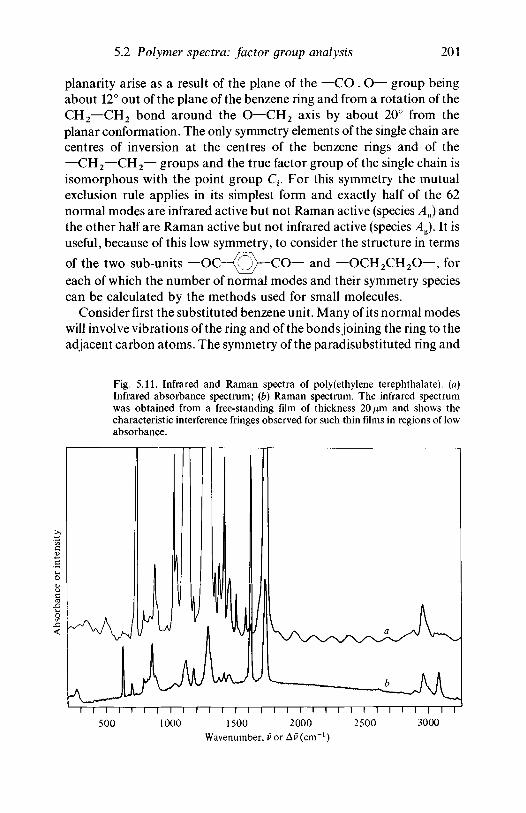
5.2 Polymer spectra: factor group analysis 201
planarity arise as a result of the plane of the —CO . O— group beingabout 12° out of the plane of the benzene ring and from a rotation of theCH2—CH2 bond around the O—CH2 axis by about 20° from theplanar conformation. The only symmetry elements of the single chain arecentres of inversion at the centres of the benzene rings and of the—CH2—CH2— groups and the true factor group of the single chain isisomorphous with the point group Ct. For this symmetry the mutualexclusion rule applies in its simplest form and exactly half of the 62normal modes are infrared active but not Raman active (species Au) andthe other half are Raman active but not infrared active (species Ag). It isuseful, because of this low symmetry, to consider the structure in terms
of the two sub-units — OC—<|3)— CO— and —OCH2CH2O—, foreach of which the number of normal modes and their symmetry speciescan be calculated by the methods used for small molecules.
Consider first the substituted benzene unit. Many of its normal modeswill involve vibrations of the ring and of the bonds joining the ring to theadjacent carbon atoms. The symmetry of the paradisubstituted ring and
Fig. 5.11. Infrared and Raman spectra of poly(ethylene terephthalate). (a)Infrared absorbance spectrum; (b) Raman spectrum. The infrared spectrumwas obtained from a free-standing film of thickness 20 fim and shows thecharacteristic interference fringes observed for such thin films in regions of lowabsorbance.
~i—i—i—i—i—i—i—i—i—i—i—i—i—i—i—i—i—i—i—i—i—i—i—i—i i—i i i r500 1000 1500 2000 2500 3000
Wavenumber, POT AP(cm~l)
202 The characterization of polymers
its relationship to that of the full structural unit was discussed briefly insubsection 4.3.2. Although the benzene ring now has two substituents inthe para positions, the principles involved in making assignments aresimilar to those involved for polystyrene and will not be considered indetail. It suffices to say that the assignment of a large number of theexpected ring modes can be satisfactorily made with the help of studieson model compounds such as dimethyl terephthalate,
and dihydroxyethylene tere-
phthalate, HO(CH2)2O . OC—<J3}-CO . O(CH2)2OH, and on
deuterated polymers.If there were no coupling with other groups there would be three
infrared-active modes involving the C = O group: the stretching mode,v(C=O), the deformation mode, yw(C=O), in which the oxygen atom
moves parallel to the plane of the —C—(0/—C— group, and the
rocking mode, y r(C=O), in which it moves in the perpendiculardirection. In view of the large amount of work on simple carbonylcompounds, it is evident that the strong peak at 1727 cm"1 must bev(C=O). The y r(C=O) mode should give a a peak. On the basis of itsassignment in ketones of low molecular weight to a peak at 390 cm"1 ,the o peak at 355 cm"1 in the PET spectrum is the obvious candidate.The yw(C=O) mode has been assigned to a peak at 639 cm"1 in thespectrum of methyl acetate, CH3COOCH3, and to one at 527 cm"1 inthe spectrum of acetylacetone, CH3COCH2COCH3, which indicatessome variability of position. It should show n polarization and, for thisreason, it has been suggested that the peak in the spectrum of PET at502 cm"1 may correspond to this mode.
Turning to the —OCH2CH2O— unit, it is necessary to rememberthat it adjoins the C = O group, so that all the stretching anddeformation vibrations of the —(C=O)—O—C— unit must beconsidered together. Simple esters have been studied in detail and it hasbeen clearly established that there are two strong peaks associated withthe stretching of the (C=O)—O and O—C bonds. In the present casethe former can be assigned with confidence to the strong n peak at1263 cm"1 . There are two peaks, at 1100 and 1120 cm"1 , that appear tobe assignable to the O—C stretching mode and if this assignment iscorrect the doubling may reflect the influence of the conformation of theneighbouring CH2 groups of chains in non-crystalline regions. There issome doubt as to the expected polarization of the (5(CCO) and (5(COC)modes, but they may well give n peaks. On this assumption, and thedetailed analysis for methyl acetate, <5(CCO) has been assigned to the
5.3 Polymer spectra: group frequencies 203
peak at 437cm"1 and S(COC) to the one at 383 cm"1 . Vibrationalcalculations have been made for a hypothetical completely planar PETmolecule and the results suggest that many of the vibrations of the—(C=O)—O—C— group, including the ring to (C=O) bond, are notreally assignable to simple vibrations of the constituent parts of thegroup, at least for the regular structure, so that some of the earliersuggested assignments may represent oversimplifications. Thecalculations do, however, confirm the assignment of the peak at1727 cm"1 and, to a lesser extent, that at 1263 cm"1 to essentially thesimple group vibrations indicated.
It is interesting to note that, in line with what is established for lowmolecular weight carbonyl-containing compounds, the presence ofoxygen adjacent to a C—H bond leads to a shift in the C—H stretchingfrequencies. It is clear that, for PET, vs(CH2) and va(CH2) are found at2908 and 2970 cm"1 , respectively, shifts of some 50 cm"1 bycomparison with polyethylene. Consideration of the remaining modesof the —CH2—CH2— group will be deferred until chapter 6 (subsection6.2.3), as they are sensitive to conformational isomerism about the C—Cbond.
5.3 The interpretation of polymer spectra: group frequencies5.3.1 Introduction
In subsection 4.3.3 we considered briefly the phenomenon ofgroup vibrations and group frequencies, i.e. the fact that a frequency orseveral frequencies of vibration of a particular group of atoms in amolecule may, under suitable conditions, be largely independent of thenature of adjacent groups of atoms. Good examples are the vibrations ofthe CH, CH2 and phenyl groups in polystyrene, discussed in subsection5.2.5. As this example illustrates,the simplest type of group with which agroup frequency may be associated is a bonded pair of atoms, such asC—H, C = O , C—N etc., but it may also be a larger group of atomsbonded in a particular way, such as the phenyl group, which shows anumber of characteristic group frequencies.
The examination of a very wide range of low molecular weight organiccompounds has led to extensive frequency/structure correlations andthese form the basis for the widespread use of infrared spectroscopy forthe characterization of organic compounds. A group frequency may bespecific not only for a particular group in a broad sense, but also for theenvironment of the group. This is exemplified by the stretchingfrequency of the carbonyl group, (C=O), which is readily identifiableand occurs within narrow ranges for specific types of carbonyl groups,such as aldehydes, acids, ketones and esters, and is also influenced by
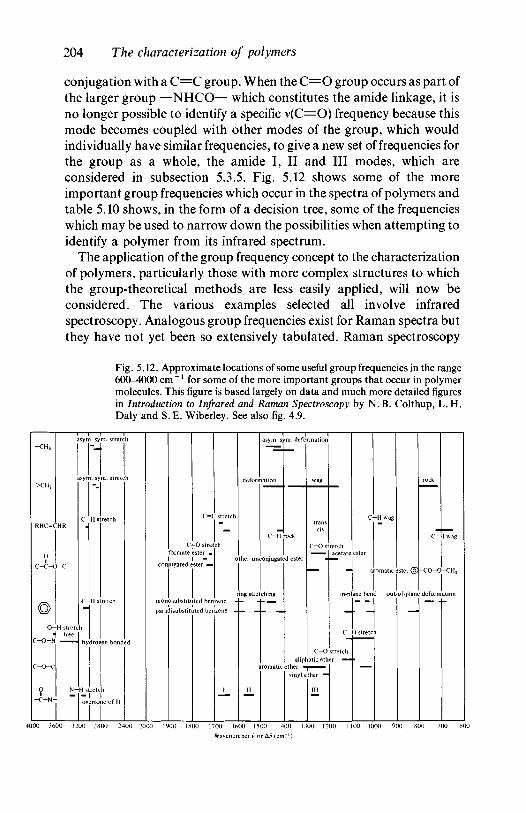
204 The characterization of polymers
conjugation with a C = C group. When the C = O group occurs as part ofthe larger group —NHCO— which constitutes the amide linkage, it isno longer possible to identify a specific v(C=O) frequency because thismode becomes coupled with other modes of the group, which wouldindividually have similar frequencies, to give a new set of frequencies forthe group as a whole, the amide I, II and III modes, which areconsidered in subsection 5.3.5. Fig. 5.12 shows some of the moreimportant group frequencies which occur in the spectra of polymers andtable 5.10 shows, in the form of a decision tree, some of the frequencieswhich may be used to narrow down the possibilities when attempting toidentify a polymer from its infrared spectrum.
The application of the group frequency concept to the characterizationof polymers, particularly those with more complex structures to whichthe group-theoretical methods are less easily applied, will now beconsidered. The various examples selected all involve infraredspectroscopy. Analogous group frequencies exist for Raman spectra butthey have not yet been so extensively tabulated. Raman spectroscopy
Fig. 5.12. Approximate locations of some useful group frequencies in the range600-4000 cm ~* for some of the more important groups that occur in polymermolecules. This figure is based largely on data and much more detailed figuresin Introduction to Infrared and Raman Spectroscopy by N. B. Colthup, L. H.Daly and S. E. Wiberley. See also fig. 4.9.
-CH3
>CH2
RHC=(
c-c-c
o-
HR
H stretc-\ free
C-O-H —
c-o-c
O
- C - N -
N-
sym. sym. stretch
sym. sym. stret
C- Hs
C-Hs
1h
|hydroj
Hs
ov
retc
•rto
retch
retch
en bone
h
le of 11
h
:d
C
C=C
=O streformate ester -I
con ugated e
monosubstiti
paradisubstit
—ster ^
stretch
o
ted benzene -
Jted benzene —
I
defon
her un
ng stre
II
asym. sym. deformation
C-H
onjugat
ching
- -
romatic
ock
d ester
trans
C-Os retchacetate
-
in-p
C -
C-O 'stretchaliphatic ether —
ether |vinyl ether —
HI
c
ester
a
ane ben
-Hwag
omatic
d out
~ ~ 1• H
1D stretch
:ster<5)
of-plan
rock
c-
-co-o
deform
iwag
-CH2
ation
4000 3600 3200 2800 2400 2000 1900 1800 1700 1600 1500 1400 1300 1200 1100 1000 900 800 700 600
Wavenumber v or Ai> (cm"1)
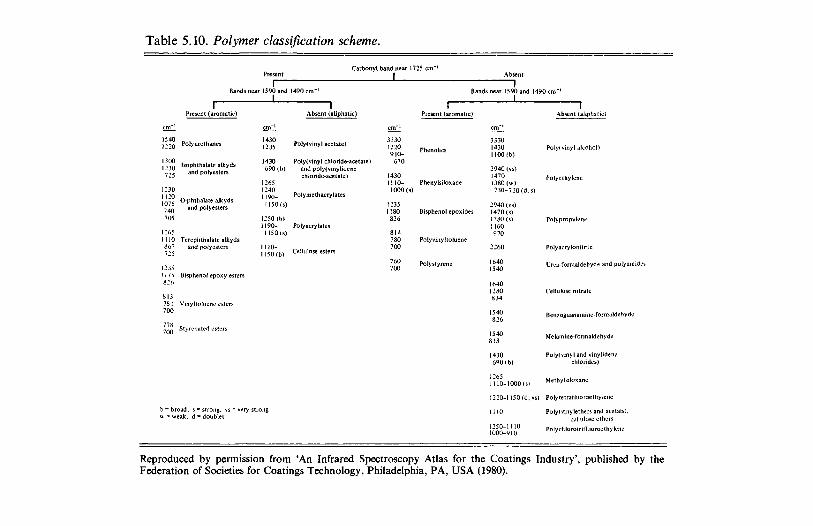
Table 5.10. Polymer classification scheme.
cm"'
1540
725
1230
705
12651 1 10867725
12351 175826
813781700
778700
PresentCarbonyl band near
1Bands near 1590 and 1490 cm"1
1
Present (aromatic)
Polyurethanes
Isophthalate alkydsand polyesters
O-phthalate alkydsand polyesters
Terephthalate alkydsand polyesters
Bisphenol epoxy esters
Vinyltoluene esters
Styrenated esters
cm"'
14301235
1430690 (b)
126512401190-
1150 (s)
1250 (b)1190-
1150(s)
1110-1150(b)
Absent (aliphatic)
Poly(vinyl acetate)
Poly(vinyl chloride-acetate)and poly(vinylidenechloride-acetate)
Polymethacryiates
Polyacrylates
Cellulose esters
I
crn^.
33301220910-
670
14301110-
1000 (
12351180
826
814780700
760700
1725 cm"1
Bands
IPresent (aromatic)
Phenolics
Phenylsiloxanes)
Bisphenol epoxides
Polyvinyltoluene
Polystyrene
Absent
1near 1590 and
1
cm"'
3330
2940 (vs)14701380 (w)730-720 (d.
2940 (vs)1470 (s)1380 (s)1160970
2260
16401540
16401280834
15408~>6
1540813
1430690(b)
1490 cm"1
Absent (aliphatic)
Polyl vinyl alcohol)
Polyethylene
s)
Polypropylene
Polyacrylonitrile
Urea-formaldehyde and polyamides
Cellulose nitrate
Benzoguanamine-fonnaldehydc
Melamine-formaldehyde
Poly(vinyl and vinylidenechlorides)
b = broad, s = strong, vw = weak, d = doublet
m 0 - 1 0 0 0 ( s ) Methylsiloxane
1220-1150 (d, vs) Poiytetrafluoroethylem
1110
1250-11101000-910
Poly(vinylethers and acetals).
cellulose ethers
Polychlorotrifluoroethylene
Reproduced by permission from 'An Infrared Spectroscopy Atlas for the Coatings Industry', published by theFederation of Societies for Coatings Technology, Philadelphia, PA, USA (1980).
206 The characterization of polymers
should be regarded as complementary to infrared, because it providesvibrational spectra for materials that are difficult to sample for infraredspectroscopy and also because modes inactive or weakly active in theinfrared spectra of highly symmetric molecules may be strongly activefor Raman scattering. For instance, Raman scattering often gives strongpeaks for modes involving skeletal vibrations. These may be useful fordiagnostic purposes, an example being the peak in the frequency range1000-1100 cm"1 that is specific for the isocyanurate ring present insome types of polyurethanes. This ring consists of three units of the form—NR—CO—, where the group R may be different for each of the threeunits.
For disordered structures, modes of groups which are not themselveshighly symmetric will usually be active in both Raman and infraredspectra at the same frequency, but the efficiencies may be very different.Whether Raman or infrared spectroscopy is used, it must always beremembered that any group frequency may be perturbed by the sur-rounding atoms in the molecule. In highly ordered structures couplingbetween groups may lead to significant splittings of group modes. Anextreme example of this is the coupling of the rocking and twistingmodes of individual ^jCH2 groups in polyethylene to give very differentfrequencies for the Raman and infrared active rocking and twistingmodes, which are almost pure, and highly mixed character to thecorresponding non-factor group modes.
5.3.2 Hydrocarbon polymers: polypropylene, polyisobuteneWe begin by considering the interpretation of the infrared
spectrum shown in fig. 5.13b. This is a simple spectrum which has only afew more peaks than that of polyethylene (figs. 5.1 and 5.13a). If it werenot known that the spectrum is in fact that of polypropylene, the onlypeak which would suggest the possibility that the polymer isunsaturated is that at 969 cm"1 . If, however, this peak was due to theout-of-plane deformation mode of a trans —CH=CH— group, thecorresponding C = C stretching mode would have appeared, thoughperhaps only weakly, as a peak at about 1650 cm"1 (see fig. 5.12). Itwould therefore be reasonable to conclude that the polymer is saturated,which considerably narrows the possibilities. This illustrates animportant working rule in the interpretation of vibrational spectra bythe group frequency approach; if possible, identify two or more peaksthat are characteristic for a particular chemical group.
By comparison with the spectrum of polyethylene, there are tworegions where additional peaks appear. They are the C—H stretching
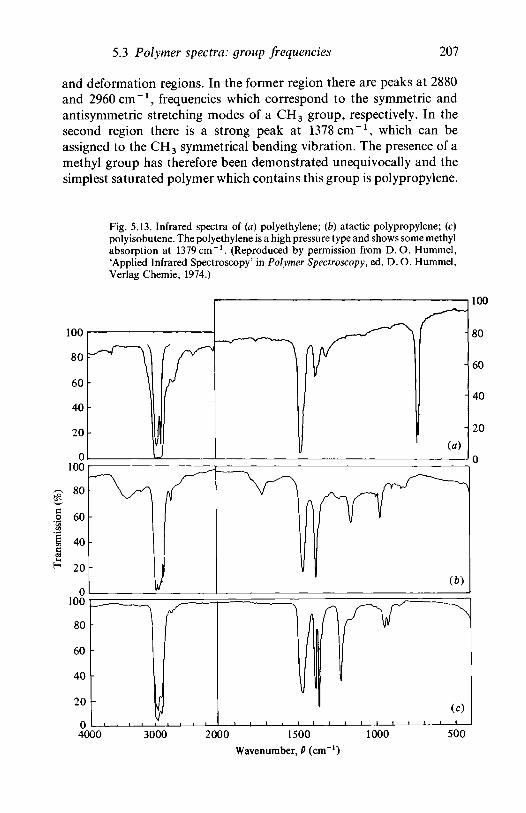
5.3 Polymer spectra: group frequencies 207
and deformation regions. In the former region there are peaks at 2880and 2960 cm"1, frequencies which correspond to the symmetric andantisymmetric stretching modes of a CH3 group, respectively. In thesecond region there is a strong peak at 1378 cm"1, which can beassigned to the CH3 symmetrical bending vibration. The presence of amethyl group has therefore been demonstrated unequivocally and thesimplest saturated polymer which contains this group is polypropylene.
100
80
60
40
20
0100
8 0
o 60
40
20
0100
80
60
40
20
0
Fig. 5.13. Infrared spectra of (a) polyethylene; (b) atactic polypropylene; (c)polyisobutene. The polyethylene is a high pressure type and shows some methylabsorption at 1379 cm"1. (Reproduced by permission from D.O. Hummel,'Applied Infrared Spectroscopy' in Polymer Spectroscopy, ed. D. O. Hummel,Verlag Chemie, 1974.)
(a)
100
80
60
40
20
(b)
4000 3000 2000 1500Wavenumber, v (cm"1)
1000 500
208 The characterization of polymers
The two moderately strong peaks at 969 and 1153 cm"1 in thespectrum of polypropylene both arise from coupled vibrations. Normalmode calculations show that the one at 1153cm"1 involves C—Cstretching both of the polymer backbone and of the bond joining themethyl group to the backbone, together with C—H bending and CH3
rocking vibrations. The peak at 969 cm"1 involves the coupling of theC—C backbone stretch with the CH3 rocking mode. Coupledvibrations of this type are unreliable as group frequencies, because theirpositions are very sensitive to the proportions of the componentvibrations. This is demonstrated very clearly by comparing thespectrum of polypropylene with that of polyisobutene,-(-CH2—C(CH3)2-)-, shown in fig. 5.13c. The 1153 cm"1 peak of theformer is replaced by a peak at 1227 cm"1 for the latter, which normalcoordinate calculations show to be due to a similar mixed mode,whereas the peak at 969 cm"1 splits into two components, at 922 and950cm"1 . The important diagnostic feature of the polyisobutenespectrum is the symmetrical CH3 bending doublet, at 1362 and1388 cm"1 , which is characteristic for two methyl groups attached to acommon carbon atom.
5.3.3 Polyesters: acetates, acrylates, methacrylatesPolymers containing ester groups are readily recognizable as a
class and it is often possible to identify an individual polyester.Poly(vinyl acetate), for which the infrared spectrum is shown in fig. 5.14,provides a particularly good example. All saturated esters have a strong,sharp absorption peak at about 1740 cm"1 , due to the v(C=O)stretching mode. The second oxygen atom of the ester group is involvedin a C—O linkage, and has its stretching mode at a lower frequency.Furthermore, as this is a skeletal mode it is much less stable in positionthan v(C=O). Nevertheless, examination of the spectra of a wide rangeof saturated esters has shown that there are some very useful groupfrequencies. Acetates have v(C—O) at about 1240 cm"1 and this peak isreadily identifiable in fig. 5.14. This frequency is not unique to acetatesbecause a peak also occurs in this position in the spectra of all aliphaticcarbonates, e.g. poly(diethylene glycol bisallyl carbonate). These latterdo not, however, show the peak at 1020 cm"1 due to the C—Ostretching of the O—CH group. Predictably, cellulose acetate also givespeaks near 1740 and 1240 cm"1 , but it can be distinguished frompoly (vinyl acetate) by differences in the two spectra at lower frequencies.
Acrylates and methacrylates are commonly encountered commercialpolymers and their characterization is typified by the best knownmaterial of this type, poly(methyl methacrylate), the spectrum of which
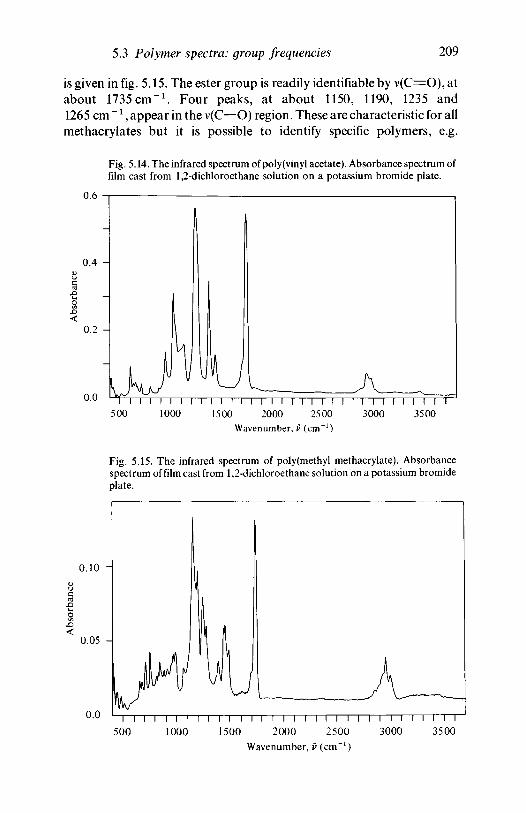
5.3 Polymer spectra: group frequencies 209
is given in fig. 5.15. The ester group is readily identifiable by v(C=O), atabout 1735 cm"1. Four peaks, at about 1150, 1190, 1235 and1265 cm"1, appear in the v(C—O) region. These are characteristic for allmethacrylates but it is possible to identify specific polymers, e.g.
Fig. 5.14. The infrared spectrum of poly(vinyl acetate). Absorbance spectrum offilm cast from 1,2-dichloroethane solution on a potassium bromide plate.
0.0 I I I I I I I I I I I I I I I I I I I I I I I I I I I I I I I I500 1000 1500 2000 2500 3000 3500
Wavenumber, v (cm"1)
Fig. 5.15. The infrared spectrum of poly(methyl methacrylate). Absorbancespectrum of film cast from 1,2-dichloroethane solution on a potassium bromideplate.
0.10 -
8<
0 . 0 5 -
0.0I I I I I I I I I I I I I 1 I I I I I I I I I I I I T 1 I I I I
5 0 0 1 0 0 0 1 5 0 0 2 0 0 0 2 5 0 0 3 0 0 0 3 5 0 0W a v e n u m b e r , v ( c m " 1 )
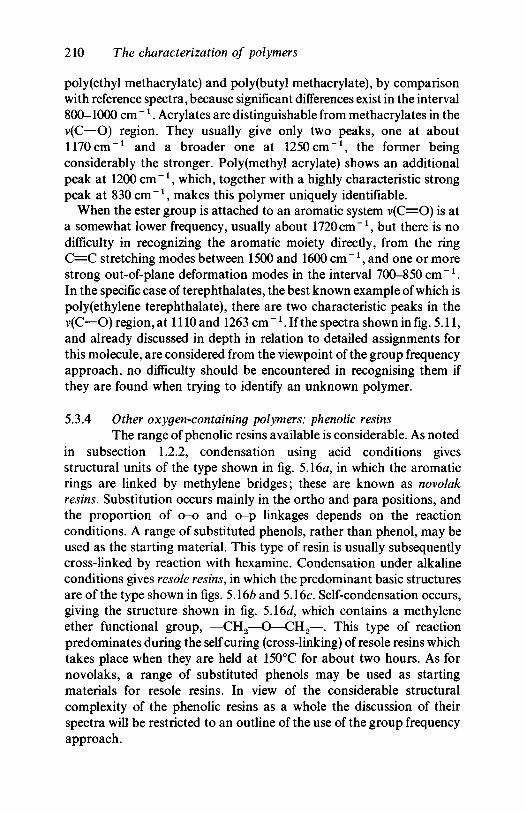
210 The characterization of polymers
poly (ethyl methacrylate) and poly (butyl methacrylate), by comparisonwith reference spectra, because significant differences exist in the interval800-1000 cm"1 . Acrylates are distinguishable from methacrylates in thev(C—O) region. They usually give only two peaks, one at about1170cm"1 and a broader one at 1250cm"1, the former beingconsiderably the stronger. Poly(methyl acrylate) shows an additionalpeak at 1200 cm"1 , which, together with a highly characteristic strongpeak at 830 cm"1 , makes this polymer uniquely identifiable.
When the ester group is attached to an aromatic system v(C=O) is ata somewhat lower frequency, usually about 1720cm"1, but there is nodifficulty in recognizing the aromatic moiety directly, from the ringC = C stretching modes between 1500 and 1600 cm"1 , and one or morestrong out-of-plane deformation modes in the interval 700-850 cm"1 .In the specific case of terephthalates, the best known example of which ispoly(ethylene terephthalate), there are two characteristic peaks in thev(C—O) region, at 1110 and 1263 cm"1 . If the spectra shown in fig. 5.11,and already discussed in depth in relation to detailed assignments forthis molecule, are considered from the viewpoint of the group frequencyapproach, no difficulty should be encountered in recognising them ifthey are found when trying to identify an unknown polymer.
5.3.4 Other oxygen-containing polymers: phenolic resinsThe range of phenolic resins available is considerable. As noted
in subsection 1.2.2, condensation using acid conditions givesstructural units of the type shown in fig. 5.160, in which the aromaticrings are linked by methylene bridges; these are known as novolakresins. Substitution occurs mainly in the ortho and para positions, andthe proportion of 0-0 and o-p linkages depends on the reactionconditions. A range of substituted phenols, rather than phenol, may beused as the starting material. This type of resin is usually subsequentlycross-linked by reaction with hexamine. Condensation under alkalineconditions gives resole resins, in which the predominant basic structuresare of the type shown in figs. 5.166 and 5.16c. Self-condensation occurs,giving the structure shown in fig. 5A6d, which contains a methyleneether functional group, —CH2—O—CH2—. This type of reactionpredominates during the self curing (cross-linking) of resole resins whichtakes place when they are held at 150°C for about two hours. As fornovolaks, a range of substituted phenols may be used as startingmaterials for resole resins. In view of the considerable structuralcomplexity of the phenolic resins as a whole the discussion of theirspectra will be restricted to an outline of the use of the group frequencyapproach.
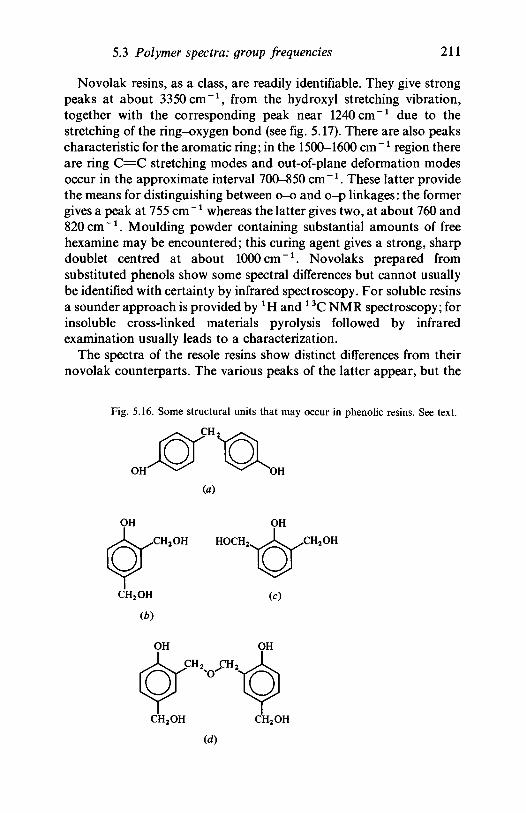
5.3 Polymer spectra: group frequencies 211
Novolak resins, as a class, are readily identifiable. They give strongpeaks at about 3350 cm"1, from the hydroxyl stretching vibration,together with the corresponding peak near 1240 cm"1 due to thestretching of the ring-oxygen bond (see fig. 5.17). There are also peakscharacteristic for the aromatic ring; in the 1500-1600 cm "x region thereare ring C=C stretching modes and out-of-plane deformation modesoccur in the approximate interval 700-850 cm"1. These latter providethe means for distinguishing between o-o and o-p linkages: the formergives a peak at 755 cm"1 whereas the latter gives two, at about 760 and820 cm"1. Moulding powder containing substantial amounts of freehexamine may be encountered; this curing agent gives a strong, sharpdoublet centred at about 1000cm"1. Novolaks prepared fromsubstituted phenols show some spectral differences but cannot usuallybe identified with certainty by infrared spectroscopy. For soluble resinsa sounder approach is provided by XH and x 3C NMR spectroscopy; forinsoluble cross-linked materials pyrolysis followed by infraredexamination usually leads to a characterization.
The spectra of the resole resins show distinct differences from theirnovolak counterparts. The various peaks of the latter appear, but the
Fig. 5.16. Some structural units that may occur in phenolic resins. See text.
CH2
(a)
OH OH
.CH2OH HOCH2
COCH2OH
00
CH2OH
(c)
OH
CH2OH
id)
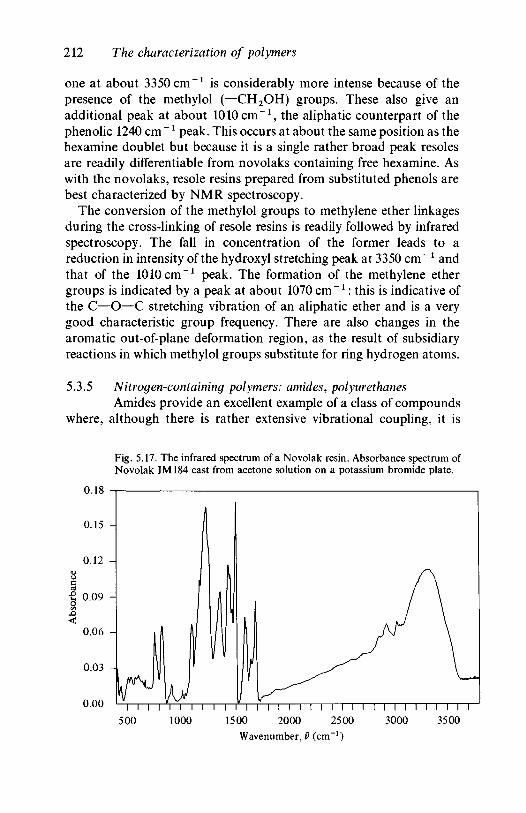
212 The characterization of polymers
one at about 3350 cm"1 is considerably more intense because of thepresence of the methylol (—CH2OH) groups. These also give anadditional peak at about 1010 cm"1 , the aliphatic counterpart of thephenolic 1240 cm"1 peak. This occurs at about the same position as thehexamine doublet but because it is a single rather broad peak resolesare readily differentiable from novolaks containing free hexamine. Aswith the novolaks, resole resins prepared from substituted phenols arebest characterized by NMR spectroscopy.
The conversion of the methylol groups to methylene ether linkagesduring the cross-linking of resole resins is readily followed by infraredspectroscopy. The fall in concentration of the former leads to areduction in intensity of the hydroxyl stretching peak at 3350 cm"1 andthat of the 1010 cm"1 peak. The formation of the methylene ethergroups is indicated by a peak at about 1070 cm"1 : this is indicative ofthe C—O—C stretching vibration of an aliphatic ether and is a verygood characteristic group frequency. There are also changes in thearomatic out-of-plane deformation region, as the result of subsidiaryreactions in which methylol groups substitute for ring hydrogen atoms.
5.3.5 Nitrogen-containing polymers: amides, polyurethanesAmides provide an excellent example of a class of compounds
where, although there is rather extensive vibrational coupling, it is
Fig. 5.17. The infrared spectrum of a Novolak resin. Absorbance spectrum ofNovolak IM184 cast from acetone solution on a potassium bromide plate.
0.18
0.001 1 1
500i i i i i i
10001 1 1 1 1 1 1 1
1500 2000Wavenumber,
i i i i i i i
2500v (cm"1)
i i i i i
3000i i i i i
3500
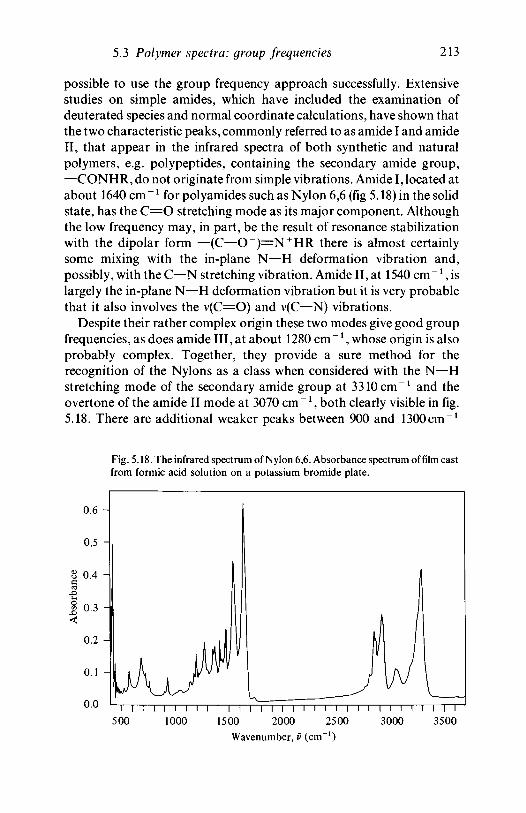
5.3 Polymer spectra: group frequencies 213
possible to use the group frequency approach successfully. Extensivestudies on simple amides, which have included the examination ofdeuterated species and normal coordinate calculations, have shown thatthe two characteristic peaks, commonly referred to as amide I and amideII, that appear in the infrared spectra of both synthetic and naturalpolymers, e.g. polypeptides, containing the secondary amide group,—CONHR, do not originate from simple vibrations. Amide I, located atabout 1640 cm " l for polyamides such as Nylon 6,6 (fig 5.18) in the solidstate, has the C = O stretching mode as its major component. Althoughthe low frequency may, in part, be the result of resonance stabilizationwith the dipolar form —(C—O~)=N + HR there is almost certainlysome mixing with the in-plane N—H deformation vibration and,possibly, with the C—N stretching vibration. Amide II, at 1540 cm " x , islargely the in-plane N—H deformation vibration but it is very probablethat it also involves the v(C=O) and v(C—N) vibrations.
Despite their rather complex origin these two modes give good groupfrequencies, as does amide III, at about 1280 cm"1 , whose origin is alsoprobably complex. Together, they provide a sure method for therecognition of the Nylons as a class when considered with the N—Hstretching mode of the secondary amide group at 3310 cm"1 and theovertone of the amide II mode at 3070 cm"1 , both clearly visible in fig.5.18. There are additional weaker peaks between 900 and 1300cm"1
Fig. 5.18. The infrared spectrum of Nylon 6,6. Absorbance spectrum of film castfrom formic acid solution on a potassium bromide plate.
0.6 -
i T I \ i i I i i I i I i i i i i i i r i I i i i i i r i i i i500 1000 1500 2000 2500 3000 3500
Wavenumber, v (cm"1)
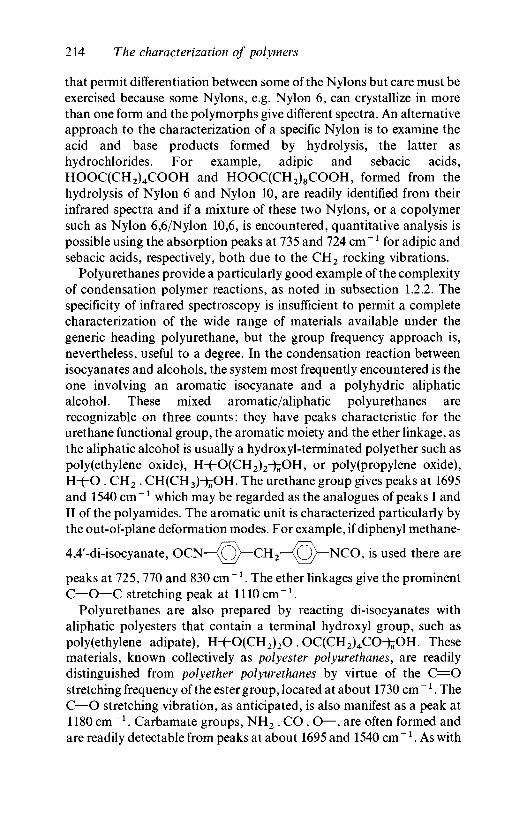
214 The characterization of polymers
that permit differentiation between some of the Nylons but care must beexercised because some Nylons, e.g. Nylon 6, can crystallize in morethan one form and the polymorphs give different spectra. An alternativeapproach to the characterization of a specific Nylon is to examine theacid and base products formed by hydrolysis, the latter ashydrochlorides. For example, adipic and sebacic acids,HOOC(CH2)4COOH and HOOC(CH2)8COOH, formed from thehydrolysis of Nylon 6 and Nylon 10, are readily identified from theirinfrared spectra and if a mixture of these two Nylons, or a copolymersuch as Nylon 6,6/Nylon 10,6, is encountered, quantitative analysis ispossible using the absorption peaks at 735 and 724 cm "1 for adipic andsebacic acids, respectively, both due to the CH2 rocking vibrations.
Polyurethanes provide a particularly good example of the complexityof condensation polymer reactions, as noted in subsection 1.2.2. Thespecificity of infrared spectroscopy is insufficient to permit a completecharacterization of the wide range of materials available under thegeneric heading polyurethane, but the group frequency approach is,nevertheless, useful to a degree. In the condensation reaction betweenisocyanates and alcohols, the system most frequently encountered is theone involving an aromatic isocyanate and a polyhydric aliphaticalcohol. These mixed aromatic/aliphatic polyurethanes arerecognizable on three counts: they have peaks characteristic for theurethane functional group, the aromatic moiety and the ether linkage, asthe aliphatic alcohol is usually a hydroxyl-terminated polyether such aspoly(ethylene oxide), H-(-O(CH2)2-^OH, or poly(propylene oxide),H-(-O . CH2 . CH(CH3)^OH. The urethane group gives peaks at 1695and 1540 cm"1 which may be regarded as the analogues of peaks I andII of the polyamides. The aromatic unit is characterized particularly bythe out-of-plane deformation modes. For example, if diphenyl methane-
4,4'-di-isocyanate, O C N - ^ 3 J ^ C H 2 — < C ^ - N C O , is used there are
peaks at 725, 770 and 830 cm"1 . The ether linkages give the prominentC—O—C stretching peak at 1110cm"1.
Polyurethanes are also prepared by reacting di-isocyanates withaliphatic polyesters that contain a terminal hydroxyl group, such aspolyethylene adipate), H-K)(CH2)2O . OC(CH2)4CO^OH. Thesematerials, known collectively as polyester polyurethanes, are readilydistinguished from polyether polyurethanes by virtue of the C = Ostretching frequency of the ester group, located at about 1730 cm"1 . TheC—O stretching vibration, as anticipated, is also manifest as a peak at1180 cm"1 . Carbamate groups, NH2 . CO . O—, are often formed andare readily detectable from peaks at about 1695 and 1540 cm"x . As with
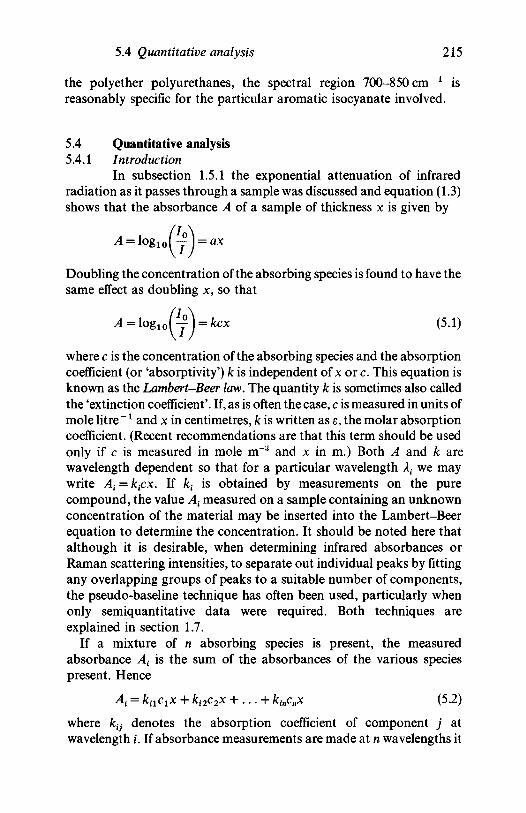
5.4 Quantitative analysis 215
the polyether polyurethanes, the spectral region 700-850 cm"1 isreasonably specific for the particular aromatic isocyanate involved.
5.4 Quantitative analysis5.4.1 Introduction
In subsection 1.5.1 the exponential attenuation of infraredradiation as it passes through a sample was discussed and equation (1.3)shows that the absorbance A of a sample of thickness x is given by
Doubling the concentration of the absorbing species is found to have thesame effect as doubling x, so that
(5.1)
where c is the concentration of the absorbing species and the absorptioncoefficient (or 'absorptivity') k is independent of x or c. This equation isknown as the Lambert-Beer law. The quantity k is sometimes also calledthe 'extinction coefficient'. If, as is often the case, c is measured in units ofmole litre" l and x in centimetres, k is written as e, the molar absorptioncoefficient. (Recent recommendations are that this term should be usedonly if c is measured in mole m"3 and x in m.) Both A and k arewavelength dependent so that for a particular wavelength Xt we maywrite A^kfx. If kt is obtained by measurements on the purecompound, the value At measured on a sample containing an unknownconcentration of the material may be inserted into the Lambert-Beerequation to determine the concentration. It should be noted here thatalthough it is desirable, when determining infrared absorbances orRaman scattering intensities, to separate out individual peaks by fittingany overlapping groups of peaks to a suitable number of components,the pseudo-baseline technique has often been used, particularly whenonly semiquantitative data were required. Both techniques areexplained in section 1.7.
If a mixture of n absorbing species is present, the measuredabsorbance At is the sum of the absorbances of the various speciespresent. Hence
Ai = kncxx + ki2c2x + . . . + kincnx (5.2)
where ktj denotes the absorption coefficient of component j atwavelength i. If absorbance measurements are made at n wavelengths it
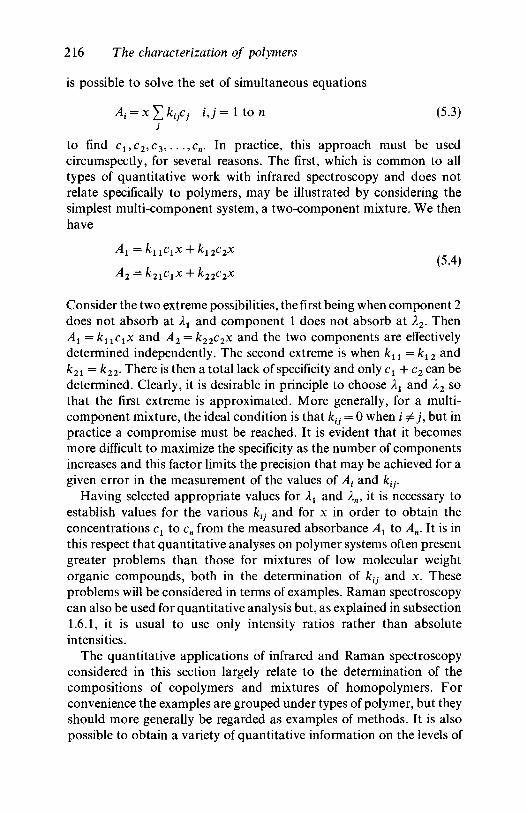
216 The characterization of polymers
is possible to solve the set of simultaneous equations
ij = 1 to n (5.3)
to find cl9c2,c39.. .,cn. In practice, this approach must be usedcircumspectly, for several reasons. The first, which is common to alltypes of quantitative work with infrared spectroscopy and does notrelate specifically to polymers, may be illustrated by considering thesimplest multi-component system, a two-component mixture. We thenhave
V T . j ^ r C j j C ^ X ~ T ~ K ^ 2 2
(5.4)VT.2 == K2^C^X i K22C2X
Consider the two extreme possibilities, the first being when component 2does not absorb at Ax and component 1 does not absorb at X2. ThenAx = k^c^x and A2 = k22c2x and the two components are effectivelydetermined independently. The second extreme is when k11=k12 and^21 = ^22- There is then a total lack of specificity and only cx + c2 can bedetermined. Clearly, it is desirable in principle to choose Xx and X2 sothat the first extreme is approximated. More generally, for a multi-component mixture, the ideal condition is that ktj = 0 when i # j , but inpractice a compromise must be reached. It is evident that it becomesmore difficult to maximize the specificity as the number of componentsincreases and this factor limits the precision that may be achieved for agiven error in the measurement of the values of At and ktj.
Having selected appropriate values for X1 and 2n, it is necessary toestablish values for the various ktj and for x in order to obtain theconcentrations cx to cn from the measured absorbance A1 to An. It is inthis respect that quantitative analyses on polymer systems often presentgreater problems than those for mixtures of low molecular weightorganic compounds, both in the determination of ktj and x. Theseproblems will be considered in terms of examples. Raman spectroscopycan also be used for quantitative analysis but, as explained in subsection1.6.1, it is usual to use only intensity ratios rather than absoluteintensities.
The quantitative applications of infrared and Raman spectroscopyconsidered in this section largely relate to the determination of thecompositions of copolymers and mixtures of homopolymers. Forconvenience the examples are grouped under types of polymer, but theyshould more generally be regarded as examples of methods. It is alsopossible to obtain a variety of quantitative information on the levels of
5.4 Quantitative analysis 217
defect structures in polymers; examples from this field will be given inthe following chapter, where copolymers will also be further considered.
5.4.2 Copolymers of vinyl chloride or ethylene with vinyl acetateThe simplest situation, one that approximates to the analysis of
mixtures of low molecular weight materials, is the examination of amixture of polymers or of a copolymer when the pure homopolymers areavailable and when all the polymers are soluble in a solvent that isreasonably transparent to infrared radiation. It is then possible to workwith a conventional liquid cell, for which x can be measured withadequate precision, and to measure the various ktj directly. The analysisof vinyl chloride/vinyl acetate copolymers provides a particularly goodexample. A solution in tetrahydrofuran is placed in a cell of thickness0.1-0.2 mm and the absorbance of the carbonyl peak at 1740 cm"1 ismeasured and compared with the corresponding value for poly(vinylacetate) to obtain the composition. Poly(vinyl chloride) does not absorbat 1740 cm"1 . This method tacitly assumes that the spectrum of thepoly(vinyl acetate) units in the copolymer is the same as that of thehomopolymer. This is substantially so in the case of block copolymersbut there may be some interaction effects with random copolymers,particularly in view of the fact that the concentration of vinyl chlorideunits is several times that of the vinyl acetate units in commercialcopolymers of this type. An alternative approach, which may also beused to check for the presence of interactions between the differentcomponents of a copolymer, is to examine several samples by a secondand more absolute method. In the case of vinyl chloride/vinyl acetatecopolymers direct oxygen determination proves very satisfactory.Alternatively, XH NMR spectroscopy is a convenient and accuratemethod for this and many other polymer systems.
Vinyl chloride/vinyl acetate copolymers may also be examined as thinfilms and this may sometimes prove more convenient. Although it ispossible, in principle, to measure the thicknesses of such films, whichmay be as low as 0.03 mm, they tend to be non-uniform and an averagevalue must be obtained. This often leads to significant errors and it ismore satisfactory to eliminate the parameter x in the Lambert-Beerequation by the use of absorbance ratios. In this particular case the ratioof the absorbance of the acetate peak at 1740 cm"1 to that of the vinylchloride methylene bending peak at 1430 cm"1 may be used. Acalibration is obtained from samples of known composition.
Copolymers of ethylene and vinyl acetate are not soluble in spectro-scopically useful solvents when the ester concentration is below the levelof a few per cent. Such materials, as thin films, are analysed by using the
218 The characterization of polymers
absorbance ratio of peaks at 1020 and 720 cm ~ *, characteristic for thevinyl acetate and ethylene units, respectively.
5.4.3 Styrene/'acrylonitrile copolymers and cross-linking in polystyreneThin films of styrene/acrylonitrile copolymers give infrared
spectra from which the ratio of the absorbances of the C = N nitrilestretching vibration at 2250 cm"1 and the polystyrene ring stretchingvibration at 1600 cm"1 may be determined as a measure of thecomposition. A calibration may be obtained by the chemical analysis ofseveral samples of varying acrylonitrile content.
Raman spectroscopy is often a particularly useful method forexamining cross-linked polymers. Such materials are usually insolubleand not amenable to examination by NMR spectroscopy. Furthermore,they may be difficult to hot press into the thin films required forquantitative infrared work. Powder or pellet samples do, however, givegood Raman spectra. The cross-linking of styrene by reaction with allylalcohol, CH 2=CH—CH 2OH, provides a good example. The ratio ofthe intensities of v(C=C) for the allyl group at 1645 cm"1 and v(C=C)for the aromatic ring at 1600 cm"1 is measured for both the startingmaterials and the reaction product. The degree of cross-linking is thencalculated from the fall in the relative intensity due to the allyl group.
5.4.4 Poly butadienes and styrene I butadiene copolymersThe analysis of polybutadiene provides a good example of a
mixture for which it is not possible to find wavelengths at which only onecomponent absorbs, and so resort must be made to the use ofsimultaneous equations. As explained in subsection 1.2.3, whenbutadiene polymerizes, successive units can add in the 1,2-position, togive a vinyl polymer, but 1,4-addition also occurs and the structural unitformed then can exhibit cis/trans isomerism about the double bond. Inmany cases, all three types of isomer are present in a sample and it istherefore necessary to analyse a three-component mixture. Although itis, in principle, possible to use the peaks originating from v(C=C), thosedue to the out-of-plane deformation vibrations are stronger and morecharacteristic. The vinyl-1,2 unit gives a strong, sharp peak at 910 cm ~1,and the trans-1,4 unit a comparable one at 965cm"1. The cis-1,4structure gives a much weaker and broader peak centred at about730 cm"1 .
The analysis proves comparatively straightforward, for two reasons:polybutadienes are soluble in carbon disulphide, a useful spectroscopicsolvent, and samples of pure 1,2- and cis- and trans-1,4 polymers areavailable, so that the nine required k(j values may be determined. The
5.5 Monomers and additives 219
values given by Silas, Yates and Thornton, who were the originators ofthe method, are approximately:
910 cm"1
730 cm"1
965 cm"1
1,2
184
5
7
cis
2
10
4
trans
2
1
133
It should be noted that these ktj values are not transferable betweenspectrometers, because of the effect of finite resolution and other factorspertaining to the spectrometer optics that vary between instruments.They do, however, show that although the interference from the weakercomponents at 910 and 965 cm"1 is not particularly serious, it is moreimportant at 730 cm"1. The estimation of the cis-1,4 units in thecommonly encountered styrene/butadiene copolymers is still moredifficult because the butadiene peak at 730 cm"1 is overlapped by themuch stronger polystyrene peak at 700 cm"1, whose origin is an out-of-plane deformation vibration of the five hydrogen atoms attached to themonosubstituted aromatic ring.
Raman spectroscopy provides an easier method for analysing suchmaterials, using v(C=C), which is considerably stronger and morecharacteristic than in the infrared spectrum. Fig. 5.19 shows the Ramanspectra near 1600 cm"1 for ordinary polystyrene, for a piece oftoughened polystyrene, which incorporates a small amount ofbutadiene, and for polybutadiene. In the spectrum of polybutadienethere are peaks at 1650 cm"1 (cis-1,4), 1655 cm"1 (1,2) and 1665 cm"1
(trans-1,4), the intensities of which are measures of the respectiveconcentrations of the isomers indicated. These intensities are mostconveniently measured as ratios against that of a convenient polystyrenepeak, such as the one at 999 cm"1. It is then necessary to calibrate andthis is best done with samples whose compositions have already beendetermined by 13C NMR spectroscopy. Alternatively, it is possible tomake up blends if the pure 1,2 and cis- and trans-1,4 polymers areavailable. By a similar process, the proportion of polystyrene may alsobe determined.
5.5 Monomers and additivesIn general, neither infrared nor Raman spectroscopy is well
suited to the measurement of minor components. In many instances, thelimit of detection is of the order of 1 %, although this may be improvedsignificantly in favourable cases. With the steadily increasing stringencyimposed by environmental health considerations, acceptable monomer
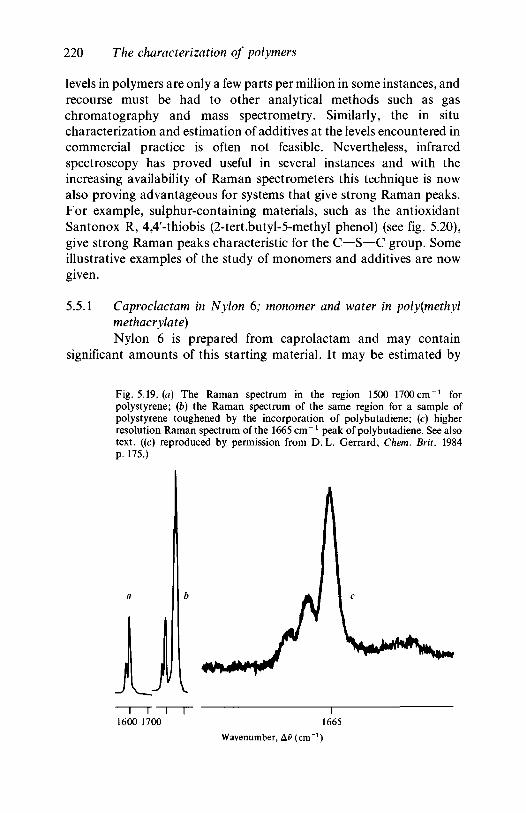
220 The characterization of polymers
levels in polymers are only a few parts per million in some instances, andrecourse must be had to other analytical methods such as gaschromatography and mass spectrometry. Similarly, the in situcharacterization and estimation of additives at the levels encountered incommercial practice is often not feasible. Nevertheless, infraredspectroscopy has proved useful in several instances and with theincreasing availability of Raman spectrometers this technique is nowalso proving advantageous for systems that give strong Raman peaks.For example, sulphur-containing materials, such as the antioxidantSantonox R, 4,4'-thiobis (2-tert.butyl-5-methyl phenol) (see fig. 5.20),give strong Raman peaks characteristic for the C—S—C group. Someillustrative examples of the study of monomers and additives are nowgiven.
5.5.1 Caproclactam in Nylon 6; monomer and water in poly(methylmethacrylate)Nylon 6 is prepared from caprolactam and may contain
significant amounts of this starting material. It may be estimated by
Fig. 5.19. (a) The Raman spectrum in the region 1500-1700 cm 1 forpolystyrene; (b) the Raman spectrum of the same region for a sample ofpolystyrene toughened by the incorporation of polybutadiene; (c) higherresolution Raman spectrum of the 1665 cm"1 peak of polybutadiene. See alsotext, ((c) reproduced by permission from D.L. Gerrard, Chem. Brit. 1984p. 175.)
1600 1700 1665Wavenumber, Av (cm 1)
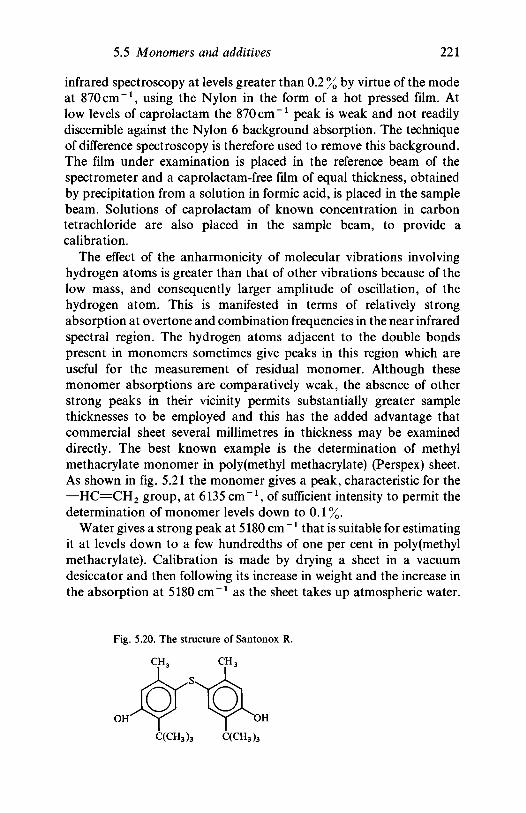
5.5 Monomers and additives 221
infrared spectroscopy at levels greater than 0.2 % by virtue of the modeat 870cm"1, using the Nylon in the form of a hot pressed film. Atlow levels of caprolactam the 870 cm"1 peak is weak and not readilydiscernible against the Nylon 6 background absorption. The techniqueof difference spectroscopy is therefore used to remove this background.The film under examination is placed in the reference beam of thespectrometer and a caprolactam-free film of equal thickness, obtainedby precipitation from a solution in formic acid, is placed in the samplebeam. Solutions of caprolactam of known concentration in carbontetrachloride are also placed in the sample beam, to provide acalibration.
The effect of the anharmonicity of molecular vibrations involvinghydrogen atoms is greater than that of other vibrations because of thelow mass, and consequently larger amplitude of oscillation, of thehydrogen atom. This is manifested in terms of relatively strongabsorption at overtone and combination frequencies in the near infraredspectral region. The hydrogen atoms adjacent to the double bondspresent in monomers sometimes give peaks in this region which areuseful for the measurement of residual monomer. Although thesemonomer absorptions are comparatively weak, the absence of otherstrong peaks in their vicinity permits substantially greater samplethicknesses to be employed and this has the added advantage thatcommercial sheet several millimetres in thickness may be examineddirectly. The best known example is the determination of methylmethacrylate monomer in poly (methyl methacrylate) (Perspex) sheet.As shown in fig. 5.21 the monomer gives a peak, characteristic for the—HC=CH 2 group, at 6135 cm"1 , of sufficient intensity to permit thedetermination of monomer levels down to 0.1%.
Water gives a strong peak at 5180 cm "x that is suitable for estimatingit at levels down to a few hundredths of one per cent in poly(methylmethacrylate). Calibration is made by drying a sheet in a vacuumdesiccator and then following its increase in weight and the increase inthe absorption at 5180 cm"1 as the sheet takes up atmospheric water.
Fig. 5.20. The structure of Santonox R.
C(CH3)3
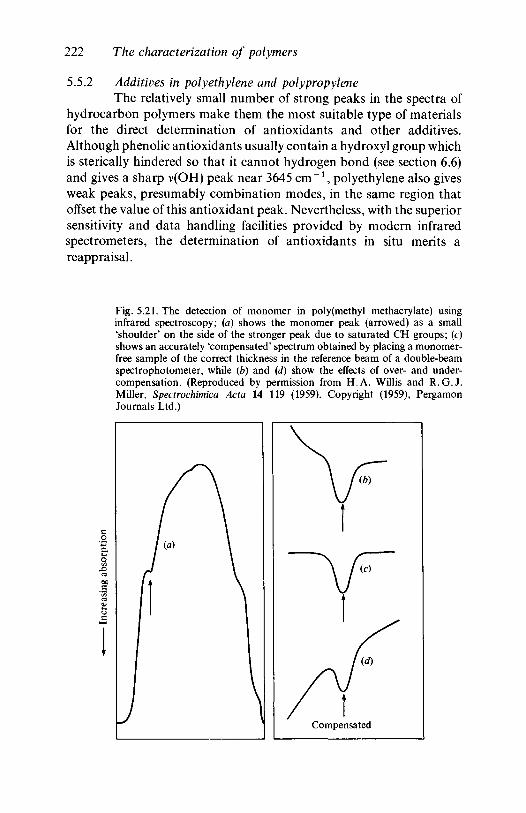
222 The characterization of polymers
5.5.2 Additives in polyethylene and polypropyleneThe relatively small number of strong peaks in the spectra of
hydrocarbon polymers make them the most suitable type of materialsfor the direct determination of antioxidants and other additives.Although phenolic antioxidants usually contain a hydroxyl group whichis sterically hindered so that it cannot hydrogen bond (see section 6.6)and gives a sharp v(OH) peak near 3645 cm ~ *, polyethylene also givesweak peaks, presumably combination modes, in the same region thatoffset the value of this antioxidant peak. Nevertheless, with the superiorsensitivity and data handling facilities provided by modern infraredspectrometers, the determination of antioxidants in situ merits areappraisal.
Fig. 5.21. The detection of monomer in poly (methyl methacrylate) usinginfrared spectroscopy; (a) shows the monomer peak (arrowed) as a small'shoulder' on the side of the stronger peak due to saturated CH groups; (c)shows an accurately 'compensated' spectrum obtained by placing a monomer-free sample of the correct thickness in the reference beam of a double-beamspectrophotometer, while (b) and (d) show the effects of over- and under-compensation. (Reproduced by permission from H.A. Willis and R.G.J.Miller, Spectrochimica Ada 14 119 (1959). Copyright (1959), PergamonJournals Ltd.)
5.6 Characterization of oxidation and degradation 223
Two proven examples of the direct determination of additives are theestimation of long-chain aliphatic amides (such as oleamide),incorporated as slip agents in polyethylene, and of dilaurylthiodipropionate in polypropylene. In the former case, which issatisfactory down to levels of about 1 %, the intensity of the amide I peakat 1640 cm"1 is used as a measure of the long-chain amideconcentration. In the latter instance the carbonyl peak at 1740 cm"1 isused and difference spectroscopy, with a sample free from dilaurylthiodipropionate in the spectrometer reference beam, providesenhanced sensitivity.
It is usually possible to increase the sensitivity by one or two orders ofmagnitude by prior extraction of the additive. Oleamide in polyethyleneprovides a case in point, the approach being to dissolve the sample intoluene, precipitate out the polymer by the addition of methanol,evaporate the remaining solution and dissolve the residue in carbondisulphide for infrared assay. In view of the diversity of antioxidants andother additives in commercial usage, prior extraction of unknownpolymers is almost mandatory for the characterization of suchmaterials. In some cases subsequent infrared examination may sufficefor an identification.
5.6 The characterization of oxidation and degradationThe stability of polymers is a very important commercial
consideration. They must not degrade appreciably at the temperaturesencountered during processing operations such as extrusion andblowing, and their photo-decomposition must be minimal. Infrared andRaman spectroscopies play an important role in assessing degradation,of which oxidation is one particular form, and can sometimes provideinformation which is valuable for determining degradation mechanisms.Some examples are now given.
5.6.1 Hydrocarbon polymers: polyethylene, polypropyleneThe role of infrared spectroscopy is exemplified by its use for the
characterization of heat- and photo-oxidized poly ethyl enes. The firststage in the heat oxidation process is the formation of hydroperoxidesbut as these are difficult to characterize spectroscopically it is normalpractice to examine their decomposition products, a range of carbonyl-containing compounds. These give a broad v(C=O) peak centred atabout 1725 cm"1 . It is of rather irregular shape and clearly consists ofseveral partially overlapping peaks. When such oxidized samples aretreated with alkali a shoulder at 1715 cm"1 disappears and is replacedby a well defined peak at about 1610 cm"1 . This is v(C=O) for the
224 The characterization of polymers
COO" ion of a salt, indicating that the shoulder at 1715 cm"1 ischaracteristic for saturated carboxylic acids. A second shoulder, at1735 cm " x , is indicative of saturated aldehydes but the major part of theoverall absorption is attributable to saturated ketones. This complexcarbonyl peak also appears in the spectra of photo-oxidizedpolyethylene specimens, which also give additional peaks at 910 and990 cm"1 . These are characteristic for vinyl groups, and their presenceshows that chain-terminating unsaturated groups are being formed,very probably as the result of chain scission.
Because saturated ketone groups are the major component of thecarbonyl-containing compounds present it is usual to assess the extentof the oxidation in terms of the concentration of a long-chain saturatedketone, such as distearone, [€113(0112)!6]2CO. This may becompounded into polyethylene at a known level or, alternatively,known concentrations in a paraffinic solvent may be prepared tosimulate the polyethylene environment. Polypropylene gives a similarrather complex v(C=O) peak upon oxidation and it is again customaryto make quantitative measurements in terms of saturated ketones. Thiscalls for a somewhat modified experimental approach, as polypropyleneshows some absorption in the vicinity of 1725 cm"1. This can beeliminated by difference spectroscopy, using carbonyl-freepolypropylene in the reference beam of the spectrometer.
5.6.2 Resonance Raman studies of degradation in PVCThe degradation of poly(vinyl chloride) proceeds by a quite
different route from those considered above, for both thermal andphotochemical decomposition. A molecule of hydrogen chloride iseliminated at an initiation site along the chain, probably a branch pointor an allylic end group, —CH=CH—CH2C1, and a double bond oradditional double bond is formed. This acts as a propagation point forsequential hydrogen chloride loss by an 'unzipping' process, andconjugated polyene sequences -f-CH=CH-^ of various lengths areformed. Those with about seven or more double bonds have electronicabsorption spectra in or near the visible spectral region, giving thecommercially unacceptable problem of sample discolouration.Although a range of stabilizers, notably tin compounds such as dibutyltin dilaurate, is available for limiting this degradation, there has been anincreasing interest in gaining a fundamental understanding of thedegradation process, in order to assess the possibilities of improving thestability of the polymer.
Until recently, only two methods were available for assessing thedegree of degradation. Measurement of the hydrogen chloride evolved
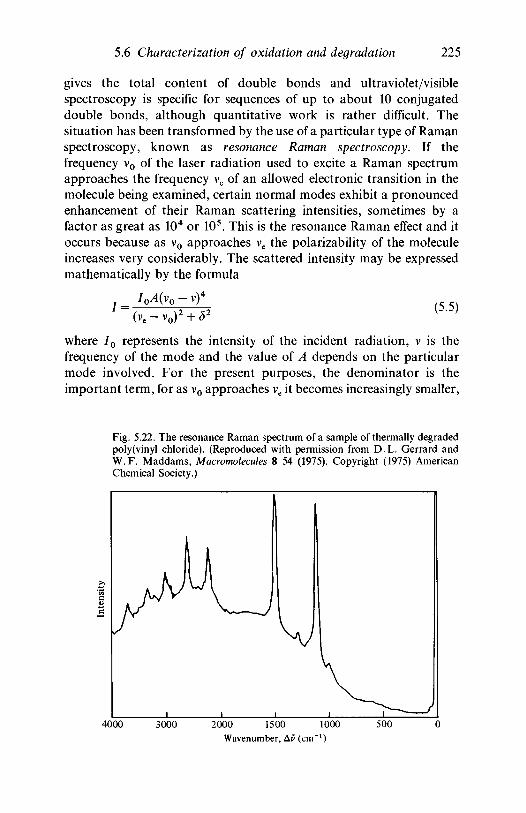
5.6 Characterization of oxidation and degradation 225
gives the total content of double bonds and ultraviolet/visiblespectroscopy is specific for sequences of up to about 10 conjugateddouble bonds, although quantitative work is rather difficult. Thesituation has been transformed by the use of a particular type of Ramanspectroscopy, known as resonance Raman spectroscopy. If thefrequency v0 of the laser radiation used to excite a Raman spectrumapproaches the frequency ve of an allowed electronic transition in themolecule being examined, certain normal modes exhibit a pronouncedenhancement of their Raman scattering intensities, sometimes by afactor as great as 104 or 105. This is the resonance Raman effect and itoccurs because as v0 approaches ve the polarizability of the moleculeincreases very considerably. The scattered intensity may be expressedmathematically by the formula
y i ( v o - v ) 4
(5.5)
where / 0 represents the intensity of the incident radiation, v is thefrequency of the mode and the value of A depends on the particularmode involved. For the present purposes, the denominator is theimportant term, for as v0 approaches ve it becomes increasingly smaller,
Fig. 5.22. The resonance Raman spectrum of a sample of thermally degradedpoly(vinyl chloride). (Reproduced with permission from D.L. Gerrard andW.F. Maddams, Macromolecules 8 54 (1975). Copyright (1975) AmericanChemical Society.)
4000 3000 2000 1500 1000Wavenumber, AP (cm"1)
500
226 The characterization of polymers
and / becomes correspondingly larger. Only the presence of thedamping factor 8 keeps / at a finite value when v0 = ve. Most, but not all,of the known cases that have been studied in detail involve totallysymmetric modes and intense electronic transitions. Both theseconditions are fulfilled in the case of the conjugated polyene sequencespresent in degraded PVC specimens and two resonance peaks appear, asshown in fig. 5.22. One, in the vicinity of 1500 cm"1 , designated v2, is theC = C stretching vibration and the other, at about 1120 cm"1 ,designated vl9 arises from the stretching of C—C bonds.
These peaks are important for two reasons. Their intensities are suchthat degradation can be detected down to levels of one part in 107, andthe frequencies of the peaks vary systematically with the conjugatedsequence length n. The variation is greater for v2 than for vl and it hasfound considerable use in estimating n from measured v2 values, using arelation of the form v2 = a + be"cw, where the values of a, b and c havebeen established from measurements on low molecular weightconjugated polyenes and polyacetylene, which contains very longsequences. The method has the additional advantage that by varying theexciting wavelength, by using different lines from an argon ion laser, or atunable dye laser, resonance may be excited in sequences of differentlengths for n = 9 and longer. It is then possible to form asemiquantitative idea of the relative concentrations of conjugatedpolyenes of varying lengths. These studies have been very important inallowing the correct choice of plasticizers and stabilizers to be made forcommercial applications of PVC.
5.7 Further readingThe books and reviews already cited in section 3.3 provide
further information about the topics covered in the earlier parts of thepresent chapter (sections 5.1-5.3). For deeper study of the later parts thefollowing books may be found useful: Infrared Spectra of ComplexMolecules (2 vols.) by L. J. Bellamy, Chapman and Hall, 1975, 1980(particularly for section 5.3); Infrared Analysis of Polymers Resins andAdditives (2 vols.) by D.O. Hummel, Wiley, 1969 (particularly forsection 5.3); The Identification and Analysis of Plastics by J. Haslam,H. A. Willis and D. C. M. Squirrell, Heyden, 1972 (particularly forsections 5.3-5.6).
A list of references to some of the more important papers on the topicscovered in this chapter and in chapter 6 is given following chapter 6.References given in figure captions or in connection with tables may alsobe found useful.
The microstructure of polymers
6.1 The distribution of copolymerized units in the polymer chain6.1.1 General principles
If a mixture is made of two or more types of monomer whichpolymerize by similar mechanisms, e.g. the free radical process, theymay be polymerized to form chains in which the structural units of therespective homopolymers are present to varying extents and insequences whose lengths depend on the polymerization conditions.Such copolymers are important commercially and they are also thesource of a considerable amount of information on polymerizationprocesses. Their commercial importance is that they provide the meansfor modifying to advantage the physical properties of the parenthomopolymers. They may provide a higher tensile strength, a greaterimpact strength, a superior stress crack resistance, an improvedresistance to thermal and photochemical degradation or a modifiedcrystallization behaviour. At the fundamental level, the molecularstructure of the copolymer can often provide information on thepolymerization mechanism, such as the factors which determine thereactivity of a particular radical. It is also possible to prepare polymerswith known structural defects in order to study their effects. Forexample, the copolymerization of small amounts of allyl chloride,CH2=CH—CH2C1, or acetylene, CH=CH, with vinyl chloride may beused to introduce chloromethyl branches, —CH2C1, or double bonds,respectively, into the vinyl chain in order to assess whether these types ofdefect are the sites of the initiation process for thermal degradation.
The overall composition of a copolymer is not determined solely bythe ratio of the concentrations of the monomers used in thepolymerization. This can be demonstrated by considering briefly the freeradical copolymerization of monomers A and B, both of the vinyl type.When the initiator is added, radicals A* and B# are formed, where A* andB' represent chains of any length terminating in —CH2—C'HA or—CH2—C'HB, respectively. There are four possible types of reaction,all of which usually occur simultaneously:
fcAA fcAB fcBA
A' + A • A'; A' + B • B'; B# + A • A'; and
B' + B • B*
227
228 The microstructure of polymers
where /cAA, kAB, kBA and kBB are the four rate constants for these reactions.The composition of the copolymer is determined by the probability withwhich A' adds to A rather than to B and the probability with which B'adds to B rather than to A. These two factors are usually expressed interms of reactivity ratios, defined as rx = kAA/kAB and r2 = kBB/kBA. Whenthe kinetics of the polymerization process are considered it is easy toshow that
d[A] [A]d[B] [B][A]+r2[B] {->
where [A] and [B] signify the concentrations of the unreactedmonomers A and B, respectively. It is evident from this equation thatonly if rx = r2 = 1, so that random copolymerization occurs, does thecomposition of the copolymer match that of the monomer feed.Furthermore, if this condition is not satisfied the proportions of A and Bin the remaining monomer will change as the polymerization proceeds,and hence the composition of the copolymer will also change. There istherefore a need for methods of determining the overall composition of acopolymer.
If random copolymerization occurs, the proportions of A and B in thecopolymer are fixed by the initial values of [A] and [B] and theprobability of finding a sequence of n successive A units or m successiveB units is calculable. If the proportion of A is considerably in excess ofthat of B the probability of finding long runs of A units will be muchgreater than that of finding similar runs of B units. At the oppositeextreme, if A and B are both present in substantial concentration, blockcopolymerization may occur, to give a structure in which there is a longrun of A units followed by a long run of B units, but such materials areusually made by an anionic polymerization process in which only onetype of monomer is present at a time. Not surprisingly, there are anumber of copolymer systems for which the polymerization is largelybut not completely random, so that the sequence distribution is alsolargely but not completely random. It is therefore necessary to havemethods for determining the sequence distribution, to characterize themicrostructures of these polymers in a way that cannot be done from aknowledge of their overall compositions alone.
6.1.2 The determination of overall copolymer compositionThe principles governing the determination of overall
copolymer composition by infrared and Raman spectroscopy have beendiscussed in section 5.4. It was then pointed out that one method incommon use is to interpret the copolymer spectra in terms of a
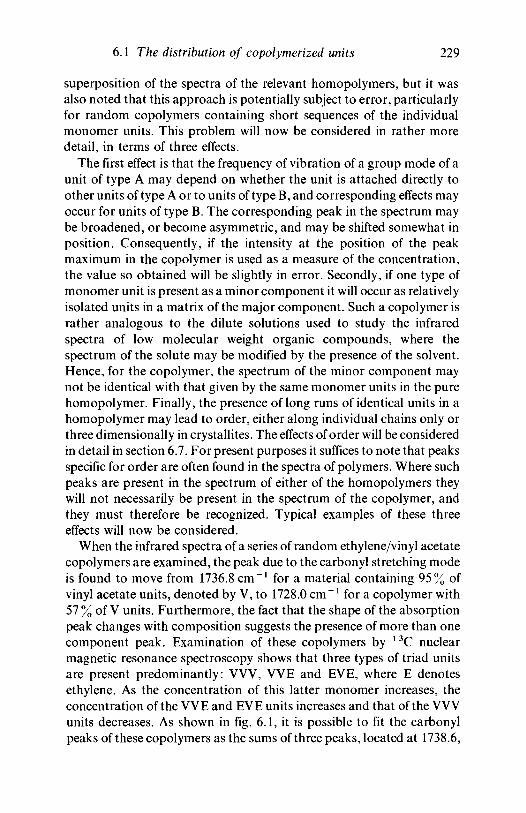
6.1 The distribution of copolymerized units 229
superposition of the spectra of the relevant homopolymers, but it wasalso noted that this approach is potentially subject to error, particularlyfor random copolymers containing short sequences of the individualmonomer units. This problem will now be considered in rather moredetail, in terms of three effects.
The first effect is that the frequency of vibration of a group mode of aunit of type A may depend on whether the unit is attached directly toother units of type A or to units of type B, and corresponding effects mayoccur for units of type B. The corresponding peak in the spectrum maybe broadened, or become asymmetric, and may be shifted somewhat inposition. Consequently, if the intensity at the position of the peakmaximum in the copolymer is used as a measure of the concentration,the value so obtained will be slightly in error. Secondly, if one type ofmonomer unit is present as a minor component it will occur as relativelyisolated units in a matrix of the major component. Such a copolymer israther analogous to the dilute solutions used to study the infraredspectra of low molecular weight organic compounds, where thespectrum of the solute may be modified by the presence of the solvent.Hence, for the copolymer, the spectrum of the minor component maynot be identical with that given by the same monomer units in the purehomopolymer. Finally, the presence of long runs of identical units in ahomopolymer may lead to order, either along individual chains only orthree dimensionally in crystallites. The effects of order will be consideredin detail in section 6.7. For present purposes it suffices to note that peaksspecific for order are often found in the spectra of polymers. Where suchpeaks are present in the spectrum of either of the homopolymers theywill not necessarily be present in the spectrum of the copolymer, andthey must therefore be recognized. Typical examples of these threeeffects will now be considered.
When the infrared spectra of a series of random ethylene/vinyl acetatecopolymers are examined, the peak due to the carbonyl stretching modeis found to move from 1736.8 cm"1 for a material containing 95% ofvinyl acetate units, denoted by V, to 1728.0 cm"1 for a copolymer with57 % of V units. Furthermore, the fact that the shape of the absorptionpeak changes with composition suggests the presence of more than onecomponent peak. Examination of these copolymers by 13C nuclearmagnetic resonance spectroscopy shows that three types of triad unitsare present predominantly: VVV, W E and EVE, where E denotesethylene. As the concentration of this latter monomer increases, theconcentration of the W E and EVE units increases and that of the VVVunits decreases. As shown in fig. 6.1, it is possible to fit the carbonylpeaks of these copolymers as the sums of three peaks, located at 1738.6,
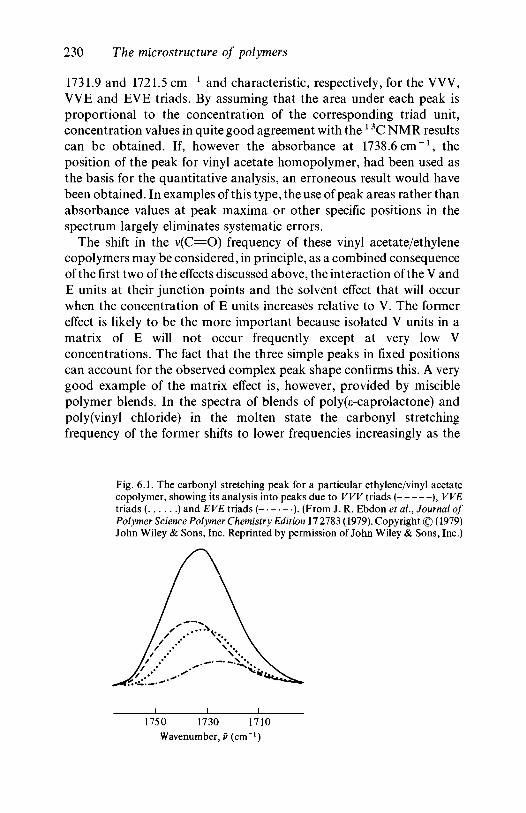
230 The micro structure of polymers
1731.9 and 1721.5 cm"1 and characteristic, respectively, for the VVV,W E and EVE triads. By assuming that the area under each peak isproportional to the concentration of the corresponding triad unit,concentration values in quite good agreement with the1 3C NMR resultscan be obtained. If, however the absorbance at 1738.6cm"1, theposition of the peak for vinyl acetate homopolymer, had been used asthe basis for the quantitative analysis, an erroneous result would havebeen obtained. In examples of this type, the use of peak areas rather thanabsorbance values at peak maxima or other specific positions in thespectrum largely eliminates systematic errors.
The shift in the v(C=O) frequency of these vinyl acetate/ethylenecopolymers may be considered, in principle, as a combined consequenceof the first two of the effects discussed above, the interaction of the V andE units at their junction points and the solvent effect that will occurwhen the concentration of E units increases relative to V. The formereffect is likely to be the more important because isolated V units in amatrix of E will not occur frequently except at very low Vconcentrations. The fact that the three simple peaks in fixed positionscan account for the observed complex peak shape confirms this. A verygood example of the matrix effect is, however, provided by misciblepolymer blends. In the spectra of blends of poly(e-caprolactone) andpoly(vinyl chloride) in the molten state the carbonyl stretchingfrequency of the former shifts to lower frequencies increasingly as the
Fig. 6.1. The carbonyl stretching peak for a particular ethylene/vinyl acetatecopolymer, showing its analysis into peaks due to VVV triads ( ), WEtriads ( ) and EVE triads ( ). (From J. R. Ebdon et ai, Journal ofPolymer Science Polymer Chemistry Edition 17 2783 (1979). Copyright © (1979)John Wiley & Sons, Inc. Reprinted by permission of John Wiley & Sons, Inc.)
1750 1730 1710Wavenumber, v (cm"1)
6.1 The distribution of copolymerized units 231
proportion of PVC is increased from 1:1, to 3:1 and finally to 5:1 molar,the shift for the last of these being about 3 cm"1 .
Ethylene/propylene copolymers provide a good example of a systemwhere absoprtion peaks present in the spectra of the homopolymersmay be absent from the spectra of the copolymers because of the lossof order. Polyethylene specimens vary appreciably in their crystallinity,for reasons that will be discussed in section 6.3, but all show the splittingof the^^.CH2 rocking mode into components at 720 and 731cm"1 ,characteristic for methylene sequences in crystalline regions. In ethyl ene/propylene block copolymers the long methylene sequences that arepresent crystallize and in the spectral region 720-731 cm"1 there is abasic similarity between the spectra of the copolymers and those ofethylene homopolymers. This is not so for random copolymers. If onlyisolated ethylene units are present the CH2 rocking mode gives a singlepeak at about 732 cm"1 . When small numbers of adjacent ethyleneunits occur a further peak appears at 720 cm"1 , which is characteristicfor these adjacent ethylene units in an amorphous environment. As theethylene content increases, crystallization of the longer sequences canoccur and the well-known doublet at 720/731 cm"1 appears in thespectrum. Similarly, in most samples of propylene homopolymer thechains take up a helical conformation and when this occurs additionalpeaks appear in the spectrum (see subsection 6.2.2). Such peaks arepresent in ethylene/propylene block copolymers but not in randomcopolymers.
6.1.3 The characterization of sequence lengthsIn a copolymer of the type . . . AAAA(B),,AAAA . . . , where n is
rather small, the contribution to the overall spectrum from the B unitsmay depend on n and this dependence then provides a means fordetermining n. Ethylene/propylene copolymers with rather low ethylenecontent provide an excellent example of this effect, a fact hinted at in theprevious subsection.
If there is one ethylene unit sandwiched between two propylene unitsin a head-to-tail arrangement the structure is
. CH3—CH2 i~(-CH2—CH2-H-CH . CH3—CH2-f-,
i.e. there are three consecutive methylene units, and if there are twoadjacent ethylene units it follows that there must be five consecutivemethylene units. It is well known, from the study of the infrared spectra
232 The microstructure of polymers
of simple hydrocarbon systems, that the frequency of the ^rocking mode depends on the number, n, of consecutive methyleneunits as follows:
n= 1 2 3 4 ^5
v(cm"1)= 815 752 733 726 722
The presence of discrete peaks characteristic for n= 1, 2, 3 and ^ 5is clearly evident in the infrared spectra of three ethylene/propylenecopolymers, covering a range of compositions, shown in fig. 6.2. Theconcentrations of the four types of methylene sequences may be estab-lished by measuring absorbance values at the four correspondingfrequencies and allowing for the overlap of contributions by setting upsimultaneous equations for the absorbance of individual peaks usingmolar absorptivities determined from measurements on model corn-
Fig. 6.2.The infrared spectra of ethylene/propylene copolymers in the region
where absorption due to the^jCH2 rocking modes occurs. The compositionsare: , 25%; , 50% and , 75% of propylene units,(From G. Bucci and T. Simonazzi, Journal of Polymer Science C7 203 (1964).Copyright © (1964) John Wiley & Sons, Inc. Reprinted by permission of JohnWiley & Sons, Inc.)
900 850 800 750
Wavenumber, v (cm"1)
6.1 The distribution of copolymerized units 233
pounds. For each odd value of n there is only one correspondingsequence of propylene and ethylene (E) units, viz.
. CH3-CH2^-E ( / l_1 ) / 2-eCH . C H 3 -
so that the concentrations of these sequences for n = 1 and n = 3 followdirectly from those of the corresponding sequences of^jCH2 groups.For each even value of n there are two possible sequences of propyleneand ethylene units, viz.
. CH 3 -CH 2 ^-E ( / 1 _ 2 ) / 2 -eCH 2 -CH .
and
2—CH . CH3^-En/2-eCH . CH3—
so that the concentrations of these two sequences for n = 2 cannot beseparately determined.
Ethylene/propylene copolymers provide a striking example of theappearance of peaks characteristic for sequences of various lengths but,in general, the changes are much less marked with other polymersystems. The ethylene/vinyl acetate polymers considered in subsection6.1.2 are more typical both in the changes that occur and the limiteddeductions that are possible. Propylene oxide homopolymers provideanother example of effects which lead to peak broadening rather thanthe appearance of discrete characteristic peaks. Poly (propylene oxide) isa molecule with asymmetric carbon atoms, —C*H . CH3—CH2—O—.When propylene oxide is polymerized in the presence of a stereospecificcatalyst to give the isotactic polymer it can give rather long / or dsequences (these sequences are mirror images of each other, whereas anisotactic sequence of a vinyl polymer is identical to its own mirrorimage), or a more random copolymer of/ and d sequences, depending onthe nature of the catalyst employed. Polymers with long regularsequences give a comparatively sharp peak at 1240 cm"1 but shortersequences have their maxima at slightly higher frequencies and whenthey are present the peak broadens. On the basis of some reasonableassumptions about the dependence of the frequency of the peakmaximum on the sequence length and about the individual peak shapesthis broadened peak has been analysed into separate peaks due tosequence lengths of 1,2,3-9 and 10 or more units.
Raman spectra may sometimes provide more information about thepresence of various sequence lengths, as they do for vinyl chloride/vinylidene chloride copolymers. A solitary vinyl chloride unit,
234 The microstructure of polymers
designated VC, in a run of vinylidene chloride (VDC) units, giving thestructure —VDC—YC—VDC—, has a characteristic peak at1197 cm"1 . For the structural unit —VDC—VC—VC—VDC— thepeak moves to 1235 cm "* and it is found at 1247 cm ~l for vinyl chloridehomopolymer. It is possible that a study of the shape of the line complexwould also show the presence of —VDC—VC—VC—VC—VDC—units.
6.2 Configurational and conformational isomerism6.2.1 Introduction
In subsection 1.2.3 the occurrence of configurational isomerismin vinyl polymers, -(-CH2—CHX-^, was discussed and the two types ofstereoregular configurational isomers, syndiotactic and isotactic, weredefined but the practical implications were not considered.Furthermore, it was pointed out that for a given configurational isomerthere may be rotation about C—C bonds to give conformationalisomers and that, in particular, when the substituent X is rather bulkysuch a rotation frequently occurs in the case of the isotacticconfiguration and leads to a non-planar conformation. Here, also,practical examples were not considered in detail.
The discovery by Ziegler of catalyst systems capable of promoting thestereoregular polymerization of vinyl monomers was exploitedbrilliantly by Natta and co-workers, who published their findings, from1956, in a series of seminal papers. The degree of regularity present inthese polymers is such that they are markedly more crystalline than theiratactic counterparts, which enhances those physical properties, such asrigidity, that depend on the degree of crystallinity. Furthermore, theZiegler-Natta catalysts have opened the way to the general use of suchpolymers, as they provide the means for their preparation on acommercial scale. Among early discoveries was a catalyst for thepreparation of isotactic polypropylene and this, in turn, promptedstudies on its very characteristic vibrational spectrum, which showsimportant features. Natta and co-workers also discovered catalystscapable of promoting the polymerization to the syndiotactic polymer,and the spectra of the two different types of polymer will now beconsidered as an example of the effects of configurational isomerism.
6.2.2 Configurational isomerism: polypropyleneHaving prepared isotactic polypropylene, Natta and co-
workers examined its molecular structure by X-ray diffraction studies.Their results show that it forms a regular helix with three monomer unitsper turn, i.e. a 3X helix (see fig. 3.4). This degree of chain regularity
6.2 Configurational and conformational isomerism 235
should lead to the appearance of additional peaks in the vibrationalspectrum and this expectation is confirmed experimentally. Comparisonof the infrared spectrum of isotactic polypropylene (fig. 6.3d) with that ofthe atactic polymer (fig. 6.3a) shows that whereas the former possessessharp, medium or strong peaks at 805, 840, 898, 972, 995 and1100 cm"1 , only the one at 972 cm"1 is present, in a rather broaderform, in the spectrum of atactic polypropylene. Furthermore, whenisotactic polypropylene is examined in the molten state the spectrumresembles that of the atactic polymer. This suggests that the remainingpeaks are specific for various vibrations of the regular helical structure ofthe isotactic polymer. Substantial confirmatory evidence for thistentative conclusion is provided by factor group analysis, normalcoordinate calculations, polarization studies and measurements ondeuterated polymers. These will now be considered briefly.
The factor group analysis will be considered in terms of a single chain,since detailed analyses have shown that there is no evidence forappreciable inter-chain interaction. The 3X helical chain belongs to a linegroup with a factor group isomorphous with the cyclic group C3.Analysis of this factor group indicates that the normal modes aredistributed among the symmetry species as 25 totally symmetric Amodes and 26 doubly degenerate E modes. Under species A there are 7skeletal modes and 18 C—H vibrational modes, and under species E thecorresponding numbers are 8 and 18, respectively.
The various C—H stretching, bending and twisting modes which leadto the appearance of peaks in the region 1200-3000 cm"* will not beconsidered as they are not germane to the present discussion. Theassignment of the peaks noted above as probably associated with theregular helical structure are shown in table 6.1. These peaks due toskeletal vibrations do not appear in the spectrum of the atactic structurebecause the loss of regularity causes them to be smeared out over a rangeof frequencies.
Syndiotactic polypropylene is capable of existing in two crystallineforms, which have appreciably different spectra, as shown in figs. 6.3band 6.3c. In the first form the molecule takes up a 2X helicalconformation, shown in fig. 6.4, in which the physical repeat unitconsists of two chemical repeat units, with a TGGTTG'GTconformation (T, trans; G, gauche), and in the second it takes up asimpler 2X helical conformation in which each physical repeat unit is asingle chemical repeat unit and all backbone bonds are trans, i.e. aplanar zig-zag structure. For the former, which has a factor groupisomorphous with D2,26 optically active modes are predicted for each ofthe Ax, B1, B2 and B3 species. The A modes are Raman active only but
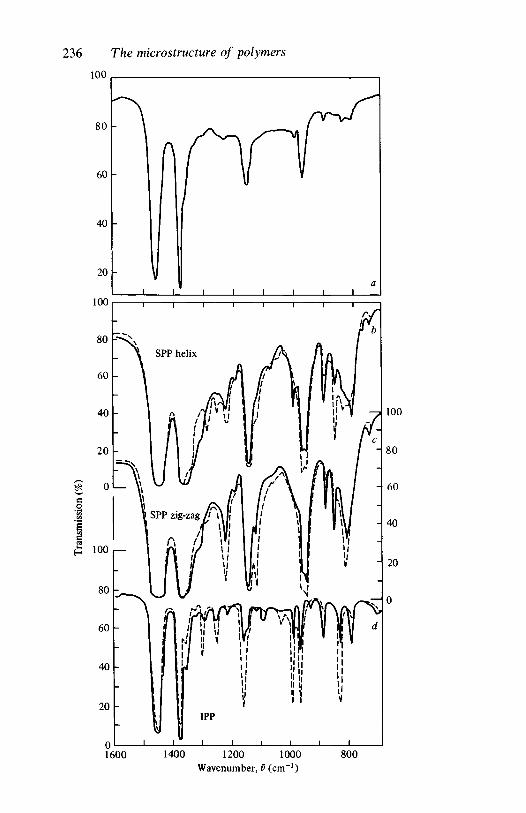
236 The microstructure of polymers
100
80 -
100 r -
80
60
40
20
- \ n
100
1600 1400 1200 1000Wavenumber, P (cm"1)
800
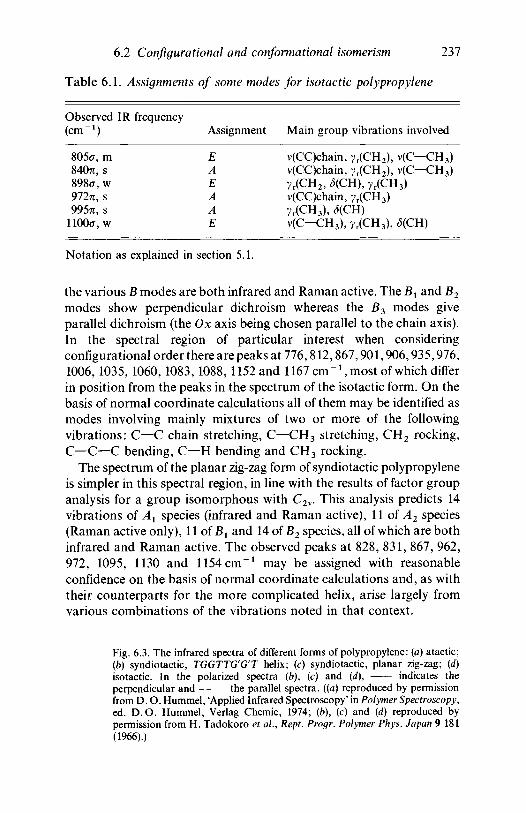
6.2 Configurational and conformational isomerism 237
Table 6.1. Assignments of some modes for isotactic polypropylene
Observed IR frequency(cm"1)
805<r, m84071, s898<r, w972TT, s
995TT, s
1100a,w
Assignment
EAEAAE
Main group vibrations involved
v(CC)chain, yr(CH2), v(C—CH3)v(CC)chain, yr(CH2), v(C-CH3)7r(CH2, <5(CH), yr(CH3)v(CC)chain, yr(CH3)yr(CH3), 5(CH)v(C-CH3), yr(CH3), S(CH)
Notation as explained in section 5.1.
the various B modes are both infrared and Raman active. The B± and B2
modes show perpendicular dichroism whereas the B3 modes giveparallel dichroism (the Ox axis being chosen parallel to the chain axis).In the spectral region of particular interest when consideringconfigurational order there are peaks at 776,812,867,901,906,935,976,1006, 1035, 1060, 1083, 1088,1152 and 1167 cm"1, most of which differin position from the peaks in the spectrum of the isotactic form. On thebasis of normal coordinate calculations all of them may be identified asmodes involving mainly mixtures of two or more of the followingvibrations: C—C chain stretching, C—CH3 stretching, CH2 rocking,C—C—C bending, C—H bending and CH3 rocking.
The spectrum of the planar zig-zag form of syndiotactic polypropyleneis simpler in this spectral region, in line with the results of factor groupanalysis for a group isomorphous with C2v. This analysis predicts 14vibrations of Ax species (infrared and Raman active), 11 of A2 species(Raman active only), 11 of Bl and 14 of B2 species, all of which are bothinfrared and Raman active. The observed peaks at 828, 831, 867, 962,972, 1095, 1130 and 1154 cm"1 may be assigned with reasonableconfidence on the basis of normal coordinate calculations and, as withtheir counterparts for the more complicated helix, arise largely fromvarious combinations of the vibrations noted in that context.
Fig. 6.3. The infrared spectra of different forms of polypropylene: {a) atactic;(b) syndiotactic, TGGTTG'G'T helix; (c) syndiotactic, planar zig-zag; (d)isotactic. In the polarized spectra (b), (c) and (d), indicates theperpendicular and the parallel spectra, {(a) reproduced by permissionfrom D. O. Hummel, 'Applied Infrared Spectroscopy' in Polymer Spectroscopy,ed. D.O. Hummel, Verlag Chemie, 1974; (b), (c) and (d) reproduced bypermission from H. Tadokoro et ai, Rept. Progr. Polymer Phys. Japan 9 181(1966).)
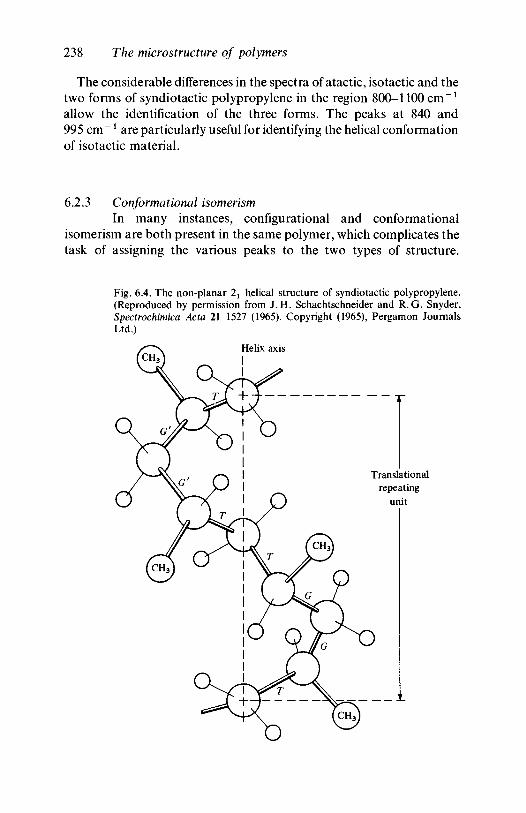
238 The microstructure of polymers
The considerable differences in the spectra of atactic, isotactic and thetwo forms of syndiotactic polypropylene in the region 800-1100 cm"1
allow the identification of the three forms. The peaks at 840 and995 cm ~1 are particularly useful for identifying the helical conformationof isotactic material.
6.2.3 Conformational isomerismIn many instances, configurational and conformational
isomerism are both present in the same polymer, which complicates thetask of assigning the various peaks to the two types of structure.
Fig. 6.4. The non-planar 21 helical structure of syndiotactic polypropylene.(Reproduced by permission from J.H. Schachtschneider and R.G. Snyder,Spectrochimica Ada 21 1527 (1965). Copyright (1965), Pergamon JournalsLtd.)
Helix axisI
Translationalrepeating
unit
6.2 Configurational and conformational isomerism 239
Poly(vinyl chloride), which will be considered in some detail below,provides an example of this. There are, however, polymers that exist inone configurational state only but which exhibit conformationalisomerism that is clearly manifest in the vibrational spectrum;poly(ethylene terephthalate), also considered below, provides anexcellent example of this type of polymer.
When two or more conformational isomers are present in a liquid theconcentrations in which they are present are determined by the Gibbsfree energy differences, AG, between them and in thermodynamicequilibrium the relative concentrations Cx and C2 of any two forms aregiven by the equation
C2 = C1 exp(-AG21/7cT) (6.2)
where AG21 is the increase in Gibbs free energy per molecule in goingfrom form 1 to form 2. This relationship applies for the low molecularweight halo-alkanes, which have been extensively investigated and someof which will be referred to below. In crystalline material one conformermay be present exclusively, because of the lowering of the Gibbs freeenergy by the specific intermolecular interactions which can then occur,and in the non-crystalline regions of solid polymers non-equilibriumconcentrations can arise as a result of rapid quenching or of deformationin the solid state. Nevertheless, comparison of the spectra in the moltenand solid states, particularly with and without quenching to vary thedegree of crystallinity present, usually permits the assignment of peaksto the various conformers present.
A comparison of the infrared spectra of poly(ethylene terephthalate)in the molten form and in solid samples with different degrees ofcrystallinity shows that there are five pairs of peaks where the intensityof one increases as the other decreases, a clear indication for con-formational isomerism. They are at 1470 and 1445 cm"1 ; 1340 and1370 cm"1 ; 1120 and 1110 cm"1 ; 975 and 1045 cm"1 ; 850 and896 cm"1 . The first pair are due to t h e ^ C H 2 bending mode and the
second to the ^ C H 2 wagging mode, which suggests that trans/gaucheisomerism about the C—C bond of the —CH2—CH2— group in the
basic structural unit —CH2CH2O . OC—<^>-CO . O— is the origin
of the pairs of modes. X-ray diffraction studies show that in thecrystalline state of the polymer the CH2—CH2 bond is in the transconformation (see fig. 4.6) and it may be deduced that the peaks at 1470,1340,1120,975and850cm"1 are characteristic for the trans isomer and
240 The microstructure of polymers
the remainder for its gauche counterpart. Further confirmation for theseconclusions is provided by the changes in the spectrum of the model
compound ethylene dibenzoate, (\Q)—CO . OCH2)2, in passing fromsolution to the crystalline state. The absorbances of the peaks at 975 and896 cm"1 have been used to follow quantitatively the conformationalchanges that take place in PET on orientation by drawing. For thispurpose it is necessary to combine absorbance measurements forpolarization directions parallel and perpendicular to the draw direction,as explained in subsection 6.10.2.
Several regions of the vibrational spectrum of poly(vinyl chloride)(PVC) are sensitive to configurational and conformational isomerism.In particular, the CH2 deformation mode and the C—Cl stretchingand bending modes are each split into several components due tovarious isomeric forms. The C—Cl stretching region (600-700 cm"1) isparticularly complex, but detailed studies involving several approacheshave proved very rewarding and the information so obtained is the basisof our current substantial knowledge of the conformational structure ofPVC.
The first clear indications of the value of infrared spectroscopy forstudying isomerism in PVC came from a study of the spectra of polymersprepared at temperatures between + 170°C and — 100°C. The spectrumin the interval 600-700 cm"1 changes markedly. The lower thepolymerization temperature the less intense is the peak at 692 cm"1 bycomparison with those at 615 and 638 cm"1 , as shown in fig. 6.5. Thissuggests that the peak at 692 cm " 1 is to be associated with defects in thepolymer chain. It also became evident from the spectra of polymersprepared at the lowest temperatures that there were two close peaks, atabout 605 and 615 cm ~1. The first of these, but not the second, is presentvery strongly in the spectrum of the polymer prepared from themonomer in the form of a urea clathrate. X-ray diffraction studies showthat this polymer is highly crystalline and syndiotactic, so that the605 cm"1 vibration may be assigned, with confidence, to v(CCl) for theplanar syndiotactic structure, as may that at about 638 cm"1 , becauseit, too, appears strongly in the spectrum of the urea clathrate polymer.
The complete interpretation of the overlapping peaks in the interval600-700 cm"1 resulted from a combination of approaches, alreadyfamiliar from the detailed assignment studies for a number of polymersset out in chapter 5. They comprise studies on simple modelchloroparaffins, on various deuterated PVC specimens, normalcoordinate calculations and the use of curve fitting to resolveoverlapping peaks (see section 1.7). Of these approaches, the
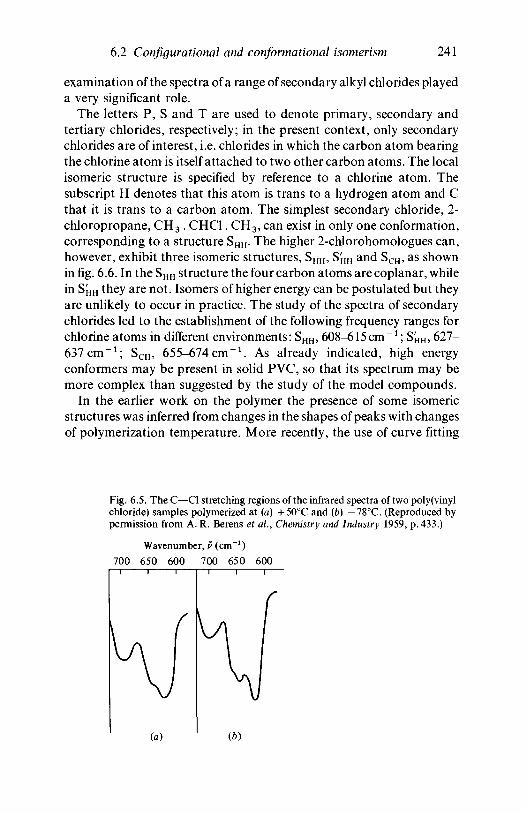
6.2 Configurational and conformational isomerism 241
examination of the spectra of a range of secondary alkyl chlorides playeda very significant role.
The letters P, S and T are used to denote primary, secondary andtertiary chlorides, respectively; in the present context, only secondarychlorides are of interest, i.e. chlorides in which the carbon atom bearingthe chlorine atom is itself attached to two other carbon atoms. The localisomeric structure is specified by reference to a chlorine atom. Thesubscript H denotes that this atom is trans to a hydrogen atom and Cthat it is trans to a carbon atom. The simplest secondary chloride, 2-chloropropane, CH 3 . CHC1. CH3, can exist in only one conformation,corresponding to a structure SHH. The higher 2-chlorohomologues can,however, exhibit three isomeric structures, SHH, S'HH and SCH, as shownin fig. 6.6. In the SHH structure the four carbon atoms are coplanar, whilein S'HH they are not. Isomers of higher energy can be postulated but theyare unlikely to occur in practice. The study of the spectra of secondarychlorides led to the establishment of the following frequency ranges forchlorine atoms in different environments: SHH, 608-615cm"*; S'm, 627-637cm"1; SCH, 655-674cm"1. As already indicated, high energyconformers may be present in solid PVC, so that its spectrum may bemore complex than suggested by the study of the model compounds.
In the earlier work on the polymer the presence of some isomericstructures was inferred from changes in the shapes of peaks with changesof polymerization temperature. More recently, the use of curve fitting
Fig. 6.5. The C—Cl stretching regions of the infrared spectra of two poly(vinylchloride) samples polymerized at (a) +50°C and {b) — 78°C. (Reproduced bypermission from A. R. Berens et ai, Chemistry and Industry 1959, p. 433.)
Wavenumber, v (cm"1)
700 650 600 700 650 600
(a) (b)
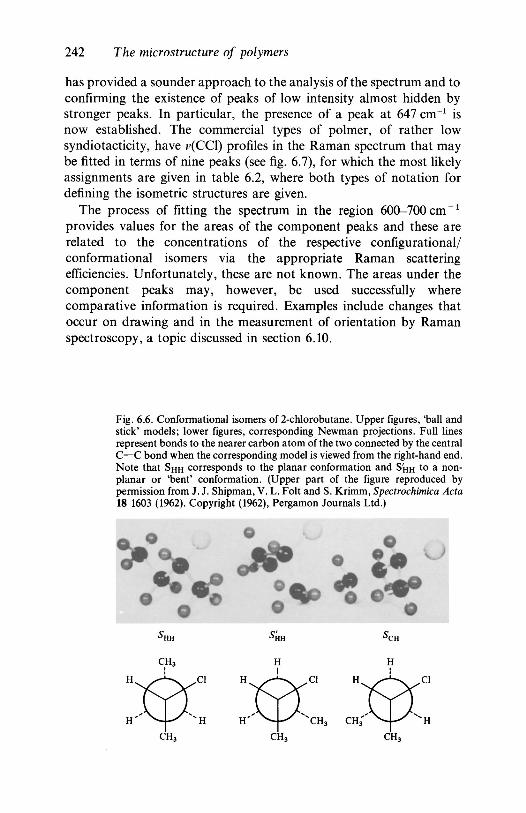
242 The microstructure of polymers
has provided a sounder approach to the analysis of the spectrum and toconfirming the existence of peaks of low intensity almost hidden bystronger peaks. In particular, the presence of a peak at 647 cm"1 isnow established. The commercial types of polmer, of rather lowsyndiotacticity, have y(CCl) profiles in the Raman spectrum that maybe fitted in terms of nine peaks (see fig. 6.7), for which the most likelyassignments are given in table 6.2, where both types of notation fordefining the isometric structures are given.
The process of fitting the spectrum in the region 600-700cm"1
provides values for the areas of the component peaks and these arerelated to the concentrations of the respective configurational/conformational isomers via the appropriate Raman scatteringefficiencies. Unfortunately, these are not known. The areas under thecomponent peaks may, however, be used successfully wherecomparative information is required. Examples include changes thatoccur on drawing and in the measurement of orientation by Ramanspectroscopy, a topic discussed in section 6.10.
Fig. 6.6. Conformational isomers of 2-chlorobutane. Upper figures, 'ball andstick' models; lower figures, corresponding Newman projections. Full linesrepresent bonds to the nearer carbon atom of the two connected by the centralC—C bond when the corresponding model is viewed from the right-hand end.Note that SHH corresponds to the planar conformation and S'HH to a non-planar or 'bent' conformation. (Upper part of the figure reproduced bypermission from J. J. Shipman, V. L. Folt and S. Krimm, Spectrochimica Acta18 1603 (1962). Copyright (1962), Pergamon Journals Ltd.)
CH3 CH3
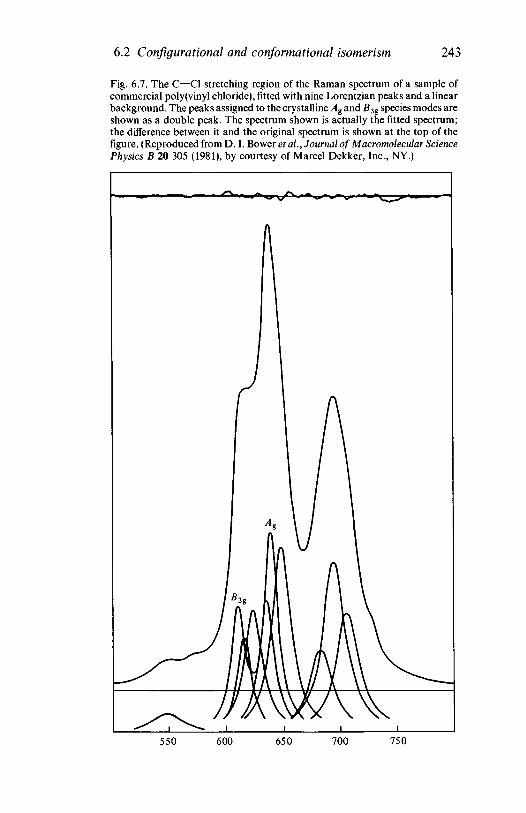
6.2 Conflgurational and conformational isomerism 243
Fig. 6.7. The C—Cl stretching region of the Raman spectrum of a sample ofcommercial poly (vinyl chloride), fitted with nine Lorentzian peaks and a linearbackground. The peaks assigned to the crystalline A% and B3g species modes areshown as a double peak. The spectrum shown is actually the fitted spectrum;the difference between it and the original spectrum is shown at the top of thefigure. (Reproduced from D. I. Bower et al., Journal of Macromolecular SciencePhysics B 20 305 (1981), by courtesy of Marcel Dekker, Inc., NY.)
550 600 650 700 750
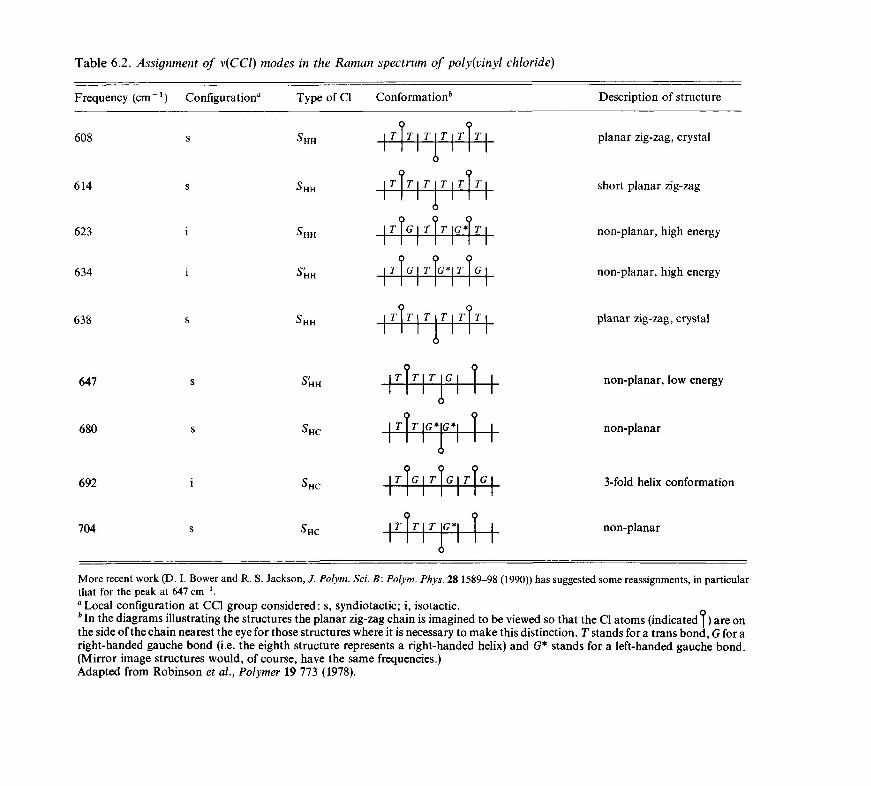
Table 6.2. Assignment of v(CCl) modes in the Raman spectrum of poly(vinyl chloride)
Frequency (cm ') Configuration" Type of Cl Conformation1' Description of structure
608
614
623
634
638
647
680
692
704
•>HH
5HH
S'H
>HH
>HC
>HC
T\T\ T\T\T\T
9 9n \ T \ T I T I T IT
"TG I r j r iG*]r
T\G\ Tr\G*\T\(
r T r i T IT I T\T
*|G
r T r i r i G * ! T
planar zig-zag, crystal
short planar zig-zag
non-planar, high energy
non-planar, high energy
planar zig-zag, crystal
non-planar, low energy
non-planar
3-fold helix conformation
non-planar
More recent work (D. I. Bower and R. S. Jackson, J. Polym. Sci. B: Polym. Phys. 28 1589-98 (1990)) has suggested some reassignments, in particularthat for the peak at 647 cm"1." Local configuration at CC1 group considered: s, syndiotactic; i, isotactic.""In the diagrams illustrating the structures the planar zig-zag chain is imagined to be viewed so that the Cl atoms (indicated | ) are onthe side of the chain nearest the eye for those structures where it is necessary to make this distinction. T stands for a trans bond, G for aright-handed gauche bond (i.e. the eighth structure represents a right-handed helix) and G* stands for a left-handed gauche bond.(Mirror image structures would, of course, have the same frequencies.)Adapted from Robinson et al., Polymer 19 773 (1978).
246 The microstructure of polymers
6.3 Chain branching6.3.1 Introduction
The measurement of the branching levels in polymers is ofconsiderable importance, as various physical properties may be affecteddirectly or indirectly by the branches present. In polyethylene, forexample, the branching level strongly affects crystallinity, which mayvary from about 50 % in a branched low density polyethylene to about85 % in a linear high density polyethylene. Butyl branches are sometimesintroduced deliberately, by the addition of a low level of 1-hexene,CH2=CH(CH2)3CH3, into the ethylene feed, to improve the stresscrack resistance. The assessment of the types and levels of the branchingpresent in poly(vinyl chloride) has recently attracted considerableinterest for a different reason, namely that branches are one of severalstructural defects present in this polymer that may provide initiationsites for the thermal degradation which occurs at a significant rate attemperatures in excess of about 150°C. In the following subsections thedetermination of branching content by vibrational spectroscopy will beconsidered.
6.3.2 PolyethyleneIf branches are present in polyethylene they will consist either of
methyl groups or of short methylene sequences, each terminated by amethyl group. They should thus be detectable in a system which consistsotherwise of methylene groups, apart from a very low concentration ofchain terminating groups, whose nature will be discussed in section 6.5.The presence of such branches was indeed noted during the earlyinfrared studies on the polymer.
There are basically three kinds of polyethylene produced commer-cially. The first to be produced, low density polyethylene, is made by ahigh pressure, high temperature uncatalyzed reaction involving freeradicals and has about 20-30 branches per thousand carbon atoms. Avariety of branches may occur, including ethyl, —CH2CH3, butyl,—(CH2)3CH3, pentyl, —(CH2)4CH3, hexyl, —(CH2)5CH3, and longer.High density polymers are made by the homopolymerization of ethyleneor the copolymerization of ethylene with a small amount of highera-olefin. Two processes, the Phillips process and the Ziegler-Nattaprocess, which differ according to the catalyst used, are of particularimportance. The emergence of a new generation of catalysts has led tothe appearance of linear low density polyethylenes. These have a higherlevel of co-monomer incorporation and have a higher level of branching,up to that of low density material, but the branches in any given polymerare of one type only, which may be ethyl, butyl, isobutyl or hexyl.
6.3 Chain branching 247
Evidence for the occurrence of methyl branches is manifest inseveral regions of the vibrational spectrum and the methyl deformationregion proves to be the most sensitive, despite the fact that thecharacteristic peak appearing at 1378 cm"1 in the infrared spectrum isconsiderably overlapped by a pair of stronger peaks at 1369 and1353cm"1, which are due to CH2 wagging modes of sequences ofmethylene groups in crystalline and amorphous regions, respectively. Itis possible to obtain a semiquantitative measure of the branching bytaking the ratio of the absorbances at 1378 and 1369 cm"1 . Thisapproach has the advantage that it avoids the need for measuring thethickness of the film used, but when the level of the branching is low, e.g.up to about five branches per thousand carbon atoms, as in most highdensity polyethylene specimens, the methyl absorption appears as nomore than an indistinct shoulder. The use of difference spectroscopy toseparate the peaks provides an excellent example of what may beachieved by this approach, as shown in fig. 6.8.
The absorption spectrum for methylene units only may be obtainedfrom measurements on specially prepared polymethylene or asubstantially linear polyethylene. Rigidex 9 is typical of severalcommercial materials of this type. The methylene absorption is thensubtracted from the complex peak, fig. 6.8a, to give the required methylabsorption peak, fig. 6.8fo. Until recently, this was done by placing awedge specimen of polymethylene or linear polyethylene, with anappropriate thickness range, in the reference beam of the spectrometerand adjusting it manually until there was complete cancellation of themethylene absorption in the sample beam. This method is beingsuperseded by the computer subtraction of a suitable stored spectrum. Itis not difficult to judge when the subtraction conditions areapproximately correct, as the 1460 cm"1 methylene peak is then ofnegligible intensity. Detailed studies have shown that the best criterionfor exact subtraction is equality of the absorbance values at 1364 and1401 cm " x . A precision of 5 % in the determination of the absorbance at1378 cm"1 is readily achievable with a medium performance infraredspectrometer.
The calculation of the branch content from the absorbance at1378 cm"1 requires an appropriate calibration factor and there aretwo approaches to this problem. The first is to use low molecularweight model compounds; for example, 19,28-dimethylhexatetracontane,CH3(CH2)17CHCH3(CH2)8CHCH3(CH2)17CH3, dissolved in knownconcentration in a normal paraffin of comparable molecular weightprovides a realistic approximation to the molecular environment of themethyl branches in high density polyethylene. Alternatively, samples
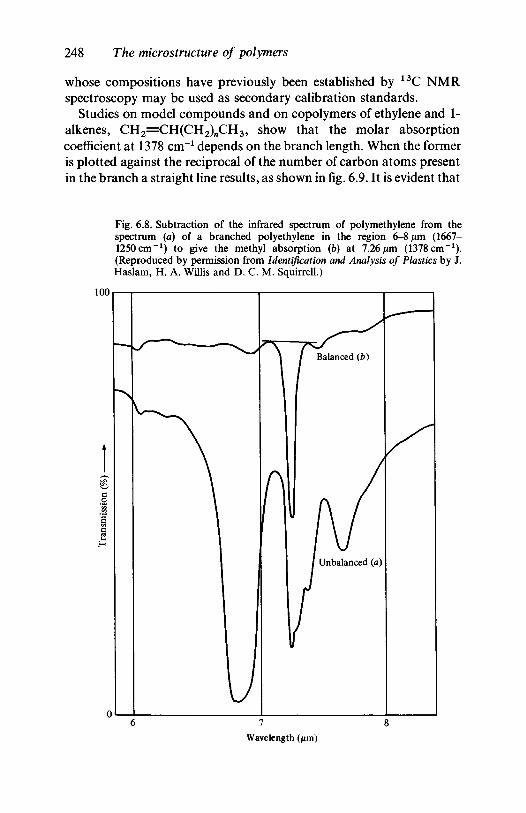
248 The microstructure of polymers
whose compositions have previously been established by 13C NMRspectroscopy may be used as secondary calibration standards.
Studies on model compounds and on copolymers of ethylene and 1-alkenes, CH2=CH(CH2)nCH3, show that the molar absorptioncoefficient at 1378 cm"1 depends on the branch length. When the formeris plotted against the reciprocal of the number of carbon atoms presentin the branch a straight line results, as shown in fig. 6.9. It is evident that
Fig. 6.8. Subtraction of the infrared spectrum of polymethylene from thespectrum (a) of a branched polyethylene in the region 6-8 /im (1667—1250 cm"1) to give the methyl absorption (b) at 7.26 /zm (1378 cm"1).(Reproduced by permission from Identification and Analysis of Plastics by J.Haslam, H. A. Willis and D. C. M. Squirrell.)
Wavelength (/im)
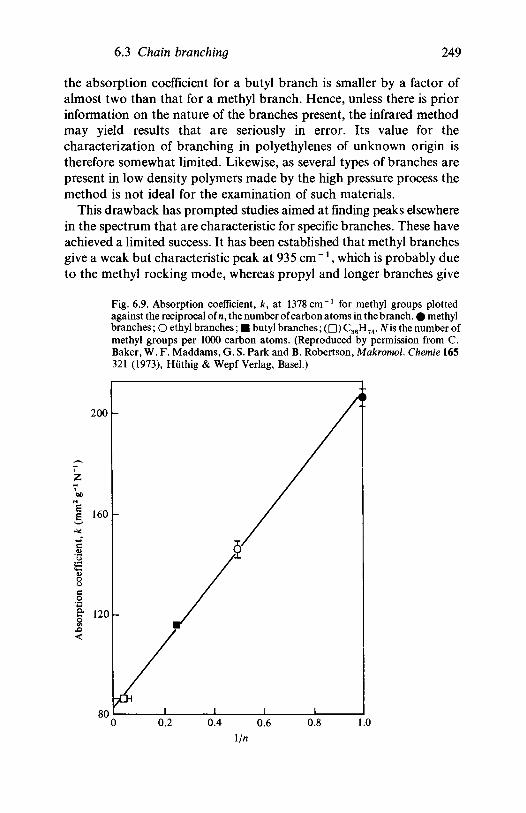
6.3 Chain branching 249
the absorption coefficient for a butyl branch is smaller by a factor ofalmost two than that for a methyl branch. Hence, unless there is priorinformation on the nature of the branches present, the infrared methodmay yield results that are seriously in error. Its value for thecharacterization of branching in polyethylenes of unknown origin istherefore somewhat limited. Likewise, as several types of branches arepresent in low density polymers made by the high pressure process themethod is not ideal for the examination of such materials.
This drawback has prompted studies aimed at finding peaks elsewherein the spectrum that are characteristic for specific branches. These haveachieved a limited success. It has been established that methyl branchesgive a weak but characteristic peak at 935 cm"1 , which is probably dueto the methyl rocking mode, whereas propyl and longer branches give
Fig. 6.9. Absorption coefficient, k, at 1378 cm"1 for methyl groups plottedagainst the reciprocal of n, the number of carbon atoms in the branch. # methylbranches; O ethyl branches; • butyl branches; ( • ) C36H74. TV is the number ofmethyl groups per 1000 carbon atoms. (Reproduced by permission from C.Baker, W. F. Maddams, G. S. Park and B. Robertson, Makromol Chemie 165321 (1973), Hiithig & Wepf Verlag, Basel.)
250 The micro structure of polymers
a peak at 890 cm"1 . The ^JCH2 rocking mode of ethyl branches isresponsible for the weak peak that appears at 770 cm ~1.
The measured branching levels in near-linear polymers are seriouslyin error if a correction is not applied for chain-terminating methylgroups. The number average molecular weight of a typical high densitypolymer is such that if both ends of the chain are terminated by methylgroups, their concentration is about two per thousand carbon atoms.Furthermore, as reference to fig. 6.9 shows, the molar absorptioncoefficient of such chain-terminating groups is smaller than that of amethyl branch by the factor 2.2, and this must be taken into accountwhen the correction is made. The correction for methyl end groups isrelatively simple for a polymer made by the Phillips process, as one endof each chain terminates in a methyl group and the other in a vinylgroup. The concentration of the vinyl groups may be estimated byinfrared spectroscopy, as explained in subsection 6.5.1.
Although * 3C NMR spectroscopy is far more specific for the varioustypes of branches that may be present in the range of commerciallyavailable poly ethyl enes, the wide availability of facilities for infraredspectroscopy and the fact that it is less time consuming go some waytowards countering its relatively poor specificity. At low branchinglevels it has superior sensitivity. It may also be applied indirectly topoly (vinyl chloride).
6.3.3 Poly(vinyl chloride)The examination of a range of PVC samples prepared in
different ways, and expected to show differences in their branchinglevels, reveals no significant differences in their infrared spectra. If,however, these materials are chemically reduced to polyethylene theinfrared method discussed above may be applied. It has been commonpractice recently to assume that the branches are methyl groups, anassumption that has been substantiated by 13C NMR studies on thereduced samples. In the case of commercial polymers, the level is aboutfour per thousand carbon atoms and it decreases somewhat, in line withexpectations, as the polymerization temperature is lowered. Thesebranches are, of course, present as chloromethyl groups, —CH2C1, inthe original poly (vinyl chloride).
6.4 Head-to-head placements in vinyl polymersThe presence of head-to-head (h-h) or tail-to-tail (t-t) units in
a vinyl polymer can cause a reduction in the degree of crystallinity. For
6.5 End groups 251
PVC it causes a lowering of thermal stability and it is therefore usefulto be able to estimate the concentration of such placements. The poss-ible occurrence of t-t units, -f CH.CH3—CH2)fCH2—CH.CH3^-,in polypropylene and their detection by virtue of a characteristic peakat 752 cm"1 has already been noted in subsection 6.1.3. In thisparticular instance it proved possible to predict, on the basis of simplecorrelations among the spectra of low molecular weight modelcompounds, what peaks would prove specific for the —CH2—CH2—group present in the t-t unit. In general this is difficult because suitablemodel compounds are not available and indirect approaches must beused to identify peaks characteristic for t-t or h-h units, particularly asthe concentration of such units is usually rather low and thecorresponding absorption peaks are therefore comparatively weak.
It is normally possible to predict with some certainty the resonancefrequencies of h-h and t-t units in 1H and 13C NMR spectra. Hence, iftwo or more samples are available which can be shown by this methodto have different h-h (and t-t) contents it may be possible to find peaksin the vibrational spectrum whose intensities parallel those in the NMRspectra. Alternatively, it may be possible to prepare the 'pure h-h'polymer, which is more precisely described as an alternating h-h, t-tpolymer, by an indirect route and thereby obtain a reference spectrum.This is then used to identify any weak h-h or t-t absorptions present inthe spectrum of a normal head-to-tail (h-t) polymer containing a lowconcentration of h-h and t-t units. This is often the more practical of thetwo approaches, particularly as the infrared spectra of several pure h-hpolymers, prepared by indirect routes, are available in the literature, forexample those of h-h poly(vinyl chloride) and of h-h polystyrene.
The infrared spectrum of h-h poly(vinyl chloride) differs somewhatfrom that of the conventional h-t polymer. In particular, it shows abroad peak at about 790 cm"1 that is probably the corresponding(CH2)2 rocking mode to that observed at 752 cm"1 with t-tpolypropylene. The conventional polymer shows only backgroundabsorption in the vicinity of 790 cm"1 and it is clear that theconcentration of t-t units cannot exceed 1-2 %. In fact, the absence of aresonance specific for this type of unit in the XH NMR spectrum sets anupper limit of one per thousand carbon atoms.
6.5 End groupsThe growth of a chain molecule during polymerization is
terminated by one of a number of factors which depend on thepolymerization conditions. It would be out of place in the present text to
252 The microstructure of polymers
embark upon a detailed discussion of these processes; it suffices to notethat they lead to a variety of chain-terminating chemical groups. Theseoften differ significantly from the repeat unit of the polymer chain,facilitating their detection by vibrational spectroscopy, even at therather low levels at which they occur in the many polymers whosemolecular weights are measured in units of tens of thousands. Oneobvious application of the ability to measure the concentration of theseend groups is the determination of number average molecular weight,which has an important effect on many properties of the polymer. Thecharacterization of the end groups, both qualitatively andquantitatively, may also be important for those polymers, e.g.polyoxymethylene, where they provide the initiation sites for thermaldegradation. Several examples of the determination of end groupconcentrations by means of vibrational spectroscopy will now beconsidered.
6.5.1 PolyethylenePolyethylene provides a particularly simple and striking
example of the ability of both infrared and Raman spectroscopy tocharacterize end groups. The various types of polyethylene that will bereferred to have already been described briefly in subsection 6.3.2.
The infrared spectra of high density polymers made by the Phillipsprocess show weak but sharp peaks at 910 and 990 cm"1 (see fig. 6.10).These are due to the out-of-plane deformation vibrations of thehydrogen atoms of the vinyl groups, —CH=CH 2 , that terminate oneend of each chain, the other terminating group being a methyl group, asnoted in subsection 6.3.2. These peaks fall in a region of the polyethylenespectrum that is virtually free from other absorptions and they aretherefore detectable at the low levels at which they occur with polymerswhose molecular weights are 105 or rather greater. It is possible toconvert the corresponding absorbances into vinyl group concentrationsby the use of a suitable calibration compound, such as 1-pentadecene,CH2=CH(CH2)1 2CH3 .
Low density polymers made by the high pressure polymerizationroute give a peak at 890cm"1. This is the = C H 2 out-of-planedeformation mode of the chain-terminating vinylidene group,—CR=CH 2 , where R is usually ethyl or butyl. The use of this peak forquantitative purposes is complicated by the fact that it is virtuallycoincident with one arising from the methyl rocking mode of the butyland longer branches present in this type of polymer. If, however, thepolymer films used for the infrared measurements are exposed tobromine vapour for a few minutes, addition of bromine occurs across
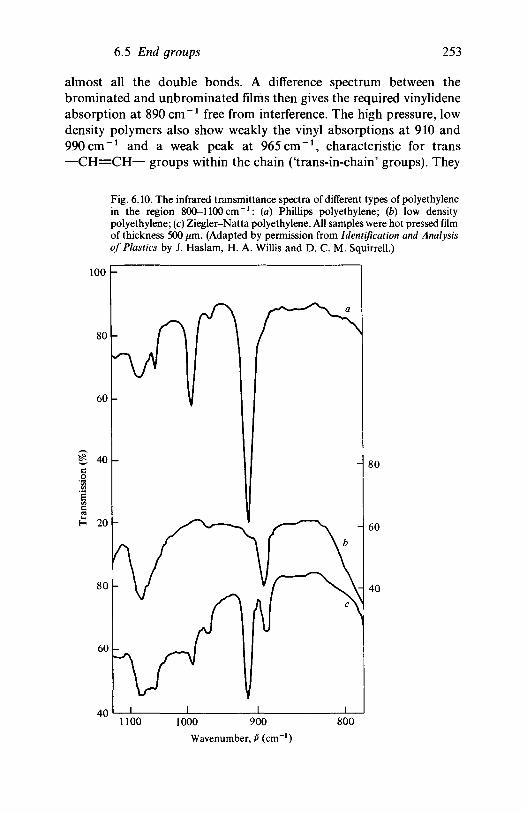
6.5 End groups 253
almost all the double bonds. A difference spectrum between thebrominated and unbrominated films then gives the required vinylideneabsorption at 890 cm"1 free from interference. The high pressure, lowdensity polymers also show weakly the vinyl absorptions at 910 and990cm"1 and a weak peak at 965 cm"1 , characteristic for trans—CH=CH— groups within the chain ('trans-in-chain' groups). They
Fig. 6.10. The infrared transmittance spectra of different types of polyethylenein the region 800-1100 cm" 1 : (a) Phillips polyethylene; (b) low densitypolyethylene; (c) Ziegler-Natta polyethylene. All samples were hot pressed filmof thickness 500 /im. (Adapted by permission from Identification and Analysisof Plastics by J. Haslam, H. A. Willis and D. C. M. Squirrell.)
r 40
1100 1000 900
Wavenumber, v (cm"1)
800
254 The microstructure of polymers
are therefore very heterogeneous with respect to unsaturation, as well asbranching, and this diversity of structural defects is not unexpected inview of the various reactions, such as back-biting (see subsection 1.2.3),that occur under the rather extreme conditions used for thepolymerization.
The third major type of polyethylene, high density polymer made bythe Ziegler-Natta route, tends to have rather low levels ofunsaturation, in which vinyl, vinylidene and 'trans-in-chain' groupsmay all occur. It is therefore clear that infrared spectroscopy provides aready means for distinguishing between the three types, on the basis ofthe peaks appearing in the region 890-1000 cm"1 . These peaks are weakin the Raman spectrum but the C = C stretching mode is useful foridentification purposes, particularly as the technique provides themeans for examining samples without prior preparation. It is alsovaluable for the examination of very small samples, such as inclusions orinhomogeneities in polyethylene specimens. Frequently, these occurbecause some high molecular weight polymer that is present isincompletely dispersed. Such higher molecular weight material is readilyidentifiable in Phillips type polymers because v(C=C) for the vinyl endgroups, at 1642 cm ~x, is of lower intensity than it is for the remainder ofthe polymer specimen. The corresponding stretching frequencies for thevinylidene and 'trans-in-chain' groups are 1655 and 1672 cm"1 ,respectively.
The changes that occur upon the irradiation of polyethylene with X-rays or y-rays involve the double bonds that are present at chain ends. Inthe case of the Phillips type polymers the concentration of vinyl groupsdecreases with increasing radiation dose. As the 910 and 990 cm"1
absorptions weaken, the one at 965 cm"1 , indicative of 'trans-in-chain'unsaturation, intensifies. Similarly, with the high pressure, low densitytype of polymer, the 890 cm"1 vinylidene absorption peak gives way tothe peak at 965 cm"1 . These changes are associated with the formationof cross-links, as evidenced by a decrease in polymer solubility, but thereare no peaks in the spectrum that are characteristic for cross-links.
6.5.2 Vinyl polymersVinylidene end groups are also present in polypropylene but
are difficult to estimate directly because the absorption at 890 cm"1
is overlapped by the stronger polypropylene absorption at 900cm"1.The method used to overcome this problem is identical to that employedfor the estimation of vinylidene groups in high pressure, low densitypolyethylene. A sample is brominated, to remove the double bonds, anda difference spectrum is then obtained from its spectrum and that of the
6.5 End groups 255
starting material. Although a similar approach could, in principle, beemployed for poly(vinyl chloride), it has not been pursued.
The residual unsaturation in this polymer has, however, been charac-terized by studies on the weak C = C stretching peak that appears at1667 cm"1 . This work is of interest more as a demonstration of thecapabilities of a Fourier transform spectrometer, both in terms ofsensitivity and data processing capability, than as a practical method.This is because the absorbance of the peak at 1667 cm"1 cannot beconverted into a double-bond concentration in the absence of acalibration factor, and a series of samples whose double-bond contentshave been established by a chemical method must be used as secondarystandards, whereas 1H NMR spectroscopy provides a more specific andeasier method. The value of 1667 cm"1 is at the upper end of theexpected range for v(C=C) but its assignment to chain-terminatingunsaturation is demonstrated by the appearance of a peak atcomparable frequencies in model compounds and by the fact that theone at 1667 cm"1 intensifies in low molecular weight extracts. Firmproof for the precise nature of the unsaturation comes from XH NMRspectroscopy, which shows that the chain-terminating allylic chlorinegroup, —CH=CH—CH2C1, is involved. The peak at 1667 cm "x is veryweak, both because it is due to a chain-terminating group and becausev(C=C) is rather weak in the infrared spectrum. It is therefore necessaryto use thick specimens, which give substantial background absorptionin the vicinity of 1667 cm ~x. This may be subtracted by commonlyavailable spectrometer data handling routines, leaving the requiredunsaturation peak.
6.5.3 Other polymersIt is readily predictable on chemical grounds that the ends of
polyoxymethylene chains will be terminated with hydroxyl groups, andthese are readily detectable in the infrared spectrum by virtue of thev(OH) mode at about 3300 cm"1 . The presence of these terminalhydroxyl groups leads to thermal instability, which makes processingdifficult. This has led to the introduction of chemical modifications inwhich, for example, the terminal hydroxyl groups are replaced byacetate groups. These are readily identified by the v(C=O) peak atabout 1730 cm"1 . It is possible, in principle, to use the intensity of thispeak to determine number average molecular weights but it is difficult toestablish a precise value for the molar absorptivity of the acetate endgroup.
The chain-terminating group of epoxy resins is the oxirane ring,
O—CH2—CH—, which gives a characteristic peak at 910 cm ~x. This is
256 The microstructure of polymers
useful for following the curing of such resins, as the chain-terminatingepoxy group is involved in the reactions. Quantitative information maybe obtained by using the ratio of the absorbances at 910 and 1610 cm " x ,the latter being a measure of the invariant aromatic content of the resin.
6.6 Hydrogen bonding6.6.1 Introduction
So far, in the present chapter, the vibrational spectrum of apolymer has been considered in terms of the chemical groups and orderpresent in an individual chain. It has been tacitly assumed that thespectrum of an ensemble of such chains does not differ from that of anisolated chain. It was pointed out in chapter 3, however, thatinteractions between chains in crystals can give rise to correlationsplitting, and this will be discussed further in section 6.7. There are othertypes of intermolecular interactions that influence the vibrationalspectrum and hydrogen bonding is by far the most important of these.Its occurrence is not restricted to crystalline systems, but it is oftenimportant in such systems.
There is a strong tendency for hydrogen bonds to form if a hydrogenatom attached to an electronegative atom, usually O or N, occupies aposition between the atom to which it is attached and an adjacent atom,such as O or N, which also carries a local concentration of negativecharge. The bond formed between this atom and the hydrogen atom iselectrostatic in nature and weaker than a covalent bond. It is usuallyindicated by a broken line. Amides provide an excellent example, the
hydrogen bond forming between the hydrogen atom of one NHgroup and the oxygen atom of a neighbouring carbonyl group (see fig.6.11). Most hydrogen bonding in synthetic polymers is of theintermolecular type, where the hydrogen atom and the acceptor groupare on different molecules. Occasionally, hydrogen bonds are able toform because of the close proximity of a hydrogen atom and an acceptorgroup in the same molecule. This is known as intramolecular bondingand it can survive the separation of the molecules spatially, as in a dilutesolution, whereas intermolecular bonding will be destroyed. Hydrogenbonding can modify the properties of polymers appreciably. Forexample, the bonds act as cross-links, conferring a degree of rigidity onthe system and increasing the softening temperature. The insolubility ofcellulose in water is a consequence of the very strong hydrogen bondingbetween chains, a result of the presence of many hydroxyl groups.
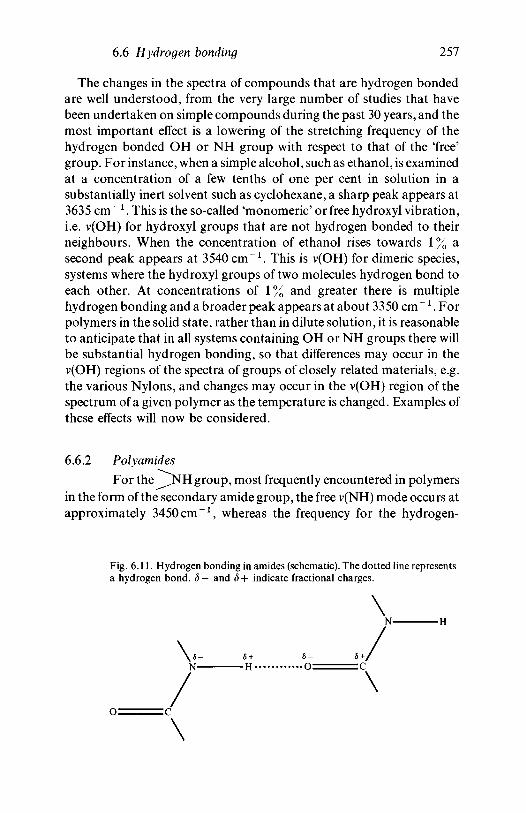
6.6 Hydrogen bonding 257
The changes in the spectra of compounds that are hydrogen bondedare well understood, from the very large number of studies that havebeen undertaken on simple compounds during the past 30 years, and themost important effect is a lowering of the stretching frequency of thehydrogen bonded OH or NH group with respect to that of the 'free'group. For instance, when a simple alcohol, such as ethanol, is examinedat a concentration of a few tenths of one per cent in solution in asubstantially inert solvent such as cyclohexane, a sharp peak appears at3635 cm"1 . This is the so-called 'monomeric' or free hydroxyl vibration,i.e. v(OH) for hydroxyl groups that are not hydrogen bonded to theirneighbours. When the concentration of ethanol rises towards 1 % asecond peak appears at 3540 cm"1 . This is v(OH) for dimeric species,systems where the hydroxyl groups of two molecules hydrogen bond toeach other. At concentrations of 1 % and greater there is multiplehydrogen bonding and a broader peak appears at about 3350 cm ~ l . Forpolymers in the solid state, rather than in dilute solution, it is reasonableto anticipate that in all systems containing OH or NH groups there willbe substantial hydrogen bonding, so that differences may occur in thev(OH) regions of the spectra of groups of closely related materials, e.g.the various Nylons, and changes may occur in the v(OH) region of thespectrum of a given polymer as the temperature is changed. Examples ofthese effects will now be considered.
6.6.2 Poly amides
For the^ ,NH group, most frequently encountered in polymersin the form of the secondary amide group, the free v(NH) mode occurs atapproximately 3450cm"1, whereas the frequency for the hydrogen-
Fig. 6.11. Hydrogen bonding in amides (schematic). The dotted line representsa hydrogen bond. S— and d+ indicate fractional charges.
\ .
\
\
y^
258 The microstructure of polymers
bonded group drops to about 3300cm"1. The amide I peak (seesubsection 5.3.5) is somewhat affected by hydrogen bonding, droppingby 30^40 cm"1 from the value found in dilute solutions, whereas for theamide II peak there is, on average, a rise of 20 cm ~ * in passing from thefree to the bonded form. Hence, v(NH) is of considerably greaterdiagnostic value than the amide I and II vibrations for hydrogen-bonding studies on amides.
At ambient temperature the spectrum of a typical polyamide, such asNylon 6,6, shows no evidence for unbonded ^JNFH. As the temperatureis raised v(NH) gradually broadens, a result of the general weakening ofthe hydrogen bonds and a concomitant broadening of the distribution oftheir force constants. Despite this broadening it is possible to detect adefinite shoulder at about 3450 cm"1 , indicative of free NH, at atemperature of about 200°C and at 250°C it increases in intensitysignificantly, indicating an appreciable concentration of NH groups ofthis type. At ambient temperature, however, the 3450 cm"1 peak is notdetectable and the concentration of free NH groups cannot exceed 1 %.This is also true for various other Nylons, e.g. Nylon 10.
6.6.3 PolyurethanesPolyurethanes, as explained in subsection 1.2.2, are
condensation products formed by the reaction between a di-isocyanateand a diol, and thermoplastic polyurethanes provide a particularlyinteresting and important example of the value of hydrogen-bondingstudies by infrared spectroscopy. The most important of these materialsare linear, block copolymers, consisting of alternate hard and softblocks. They are described as segmented block copolymers because theblocks are relatively short and numerous compared with those in someother types of copolymer chain and are usefully thought of as chainsegments. The hard segments contain the polyurethane linkages,whereas the soft segments are often low molecular weight polyethers orpolyesters. The copolymers have a two phase microstructure in whichthe hard segments separate from a rubbery matrix formed by the softsegments and aggregate in glassy or partially crystalline domains, sothat the materials show elastic properties typical of a compositematerial. They behave as elastomers at moderate temperatures butbecome thermoplastic at temperatures above the softening point of thehard segments.
Polyurethanes are extensively hydrogen bonded, the proton donorbeing the NH group of the urethane linkage (see subsection 1.2.2).
6.6 Hydrogen bonding 259
The hydrogen-bond acceptor may be in either the hard segment, thecarbonyl of the urethane group, or the soft segment, an ester carbonyl orether oxygen. The relative amounts of the two types of hydrogen bondsare determined by the degree of microphase separation; clearly, anincrease in this separation favours the inter-urethane hydrogen bonds.The distribution of NH bonding with respect to each type of acceptor isdependent on many factors, including the electron-donating ability,relative proportions and spatial arrangement of the various proton-acceptor groups in the polymer chain. Not surprisingly, infraredspectroscopy has been widely used to study this hydrogen bonding. Thetwo examples now to be considered are representative of theinformation that may be obtained. The first relates to the degree ofhydrogen bonding and the nature of the acceptor sites in polyetherurethanes, the particular example cited having polytetrahydrofuran,HO-^(CH2)4—O-^H, for the soft segment diol and p,p'-diphenyl-
methane di-isocyanate (MDI), OCN—<Q)—CH2—<^>—NCO,
chain-extended with 1,4-butanediol, HO(CH2)4OH, to give thestructure
CH 2—<<3^NH . CO . O(CH2)4O . OC .
for the hard segment di-isocyanate.The degree of hydrogen bonding of the NH groups was studied by
examining the v(NH) region of the spectrum (see fig. 6.12) and lookingfor the presence of a shoulder in the vicinity of 3450 cm"1 , indicative offree NH groups. This appears on the much stronger peak due to bondedNH groups at 3320 cm"1 and its intensity is difficult to measure withprecision, but it cannot amount to more than 15 % of the total, so that atleast 85% of the NH groups are hydrogen bonded.
The peak arising from the carbonyl stretching mode is split intotwo components, one at 1733cm"1 and the other at 1703cm"1.Studies on model compounds such as N-phenylurethane,
\O)—NH . CO . OC2H5 , show that the two maxima are assignable to
free and bonded carbonyl groups, respectively. In order to determine thedegree to which the carbonyl groups are bonded it is necessary to knowthe relative molar absorptivities of the 1733 and 1703 cm"1 modes.Studies on a range of model compounds suggest that there is some
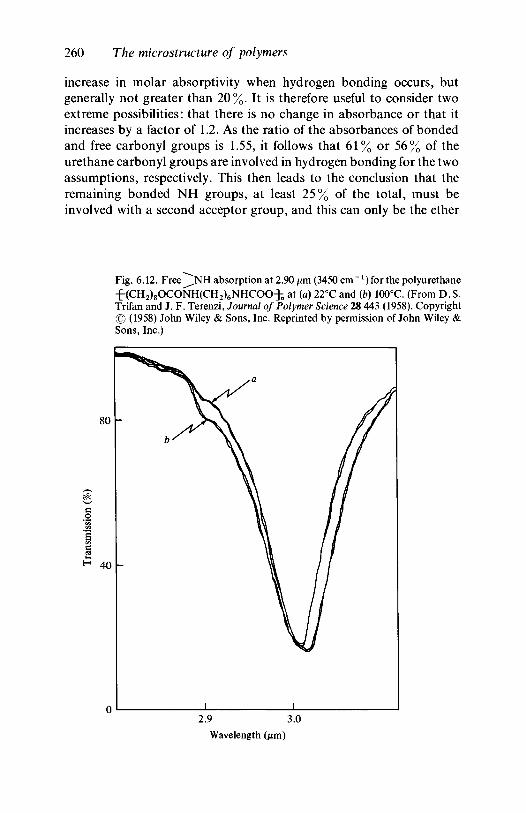
260 The microstructure of polymers
increase in molar absorptivity when hydrogen bonding occurs, butgenerally not greater than 20%. It is therefore useful to consider twoextreme possibilities: that there is no change in absorbance or that itincreases by a factor of 1.2. As the ratio of the absorbances of bondedand free carbonyl groups is 1.55, it follows that 61% or 56% of theurethane carbonyl groups are involved in hydrogen bonding for the twoassumptions, respectively. This then leads to the conclusion that theremaining bonded NH groups, at least 25% of the total, must beinvolved with a second acceptor group, and this can only be the ether
Fig. 6.12. F r e e ^ N H absorption at 2.90 ^01(3450 cm"1) for the polyurethane-f-(CH2)8OCONH(CH2)6NHCOO^; at (a) 22°C and (b) 100°C. (From D. S.Trifan and J. F. Terenzi, Journal of Polymer Science 28 443 (1958). Copyright© (1958) John Wiley & Sons, Inc. Reprinted by permission of John Wiley &Sons, Inc.)
s
2.9 3.0
Wavelength (jum)
6.6 Hydrogen bonding 261
oxygen linkage. The complexity of the peaks in the v(C=O) region forpolyester urethanes prevents the straightforward use of this approach.
The second example covers a more quantitative interpretation of theinfrared spectra and their temperature dependence for two types ofpolyurethane. For one type, a polyether polyurethane (ET), the softsegment diol is again polytetrahydrofuran, and for the other, a poly-ester polyurethane (ES), it is poly(tetramethylene adipate),
H-^O(CH2)4 . O . CO . (CH2)4 . CO^O(CH2)4OH.
For both types the hard block is MDI extended with butanediol, as forthe first example.
The v(NH) region of the spectrum was computer fitted with threeGaussian peaks, centred at 3420,3320 and 3185 cm"1 . The first of theseis due to free NH groups, the second to bonded NH groups and thethird, which is rather weak, is attributed to bonded NH groups in theconformation in which the NH group is cis to the C = O group ratherthan, as is more usual, trans to it. The area of this peak was thereforeadded to that of the peak at 3320 cm"1 in calculating the concentrationof bonded NH groups. The ratio of the molar absorptivities at 3320 and3420 cm"1 was assumed to be 3.46, a value based on studies on modelcompounds. The v(C=O) profile for the ET series was fitted with twoGaussian peaks at 1733 and 1703cm"1, characteristic for free andbonded carbonyl groups, respectively, whose molar absorptivities weretaken to be equal. It was not possible to fit the v(C=O) profile in the ESseries, because of the ester groups present in the soft segments.
The results for the ET series, covering a range of compositions interms of MDI hard segments, were, with one exception, very uniform,showing 82 ± 2 % of bonded NH with 66 ± 2 % of bonding to theurethane carbonyl group. The amount of bonding to the urethane ethervaried somewhat more, with upper and lower bounds of 20 % and 12 %.The exception was a material in which the soft segment was ofappreciably higher molecular weight, and the percentage of hardsegments was high. This material, which was semi-crystalline, had 78 %of the NH groups bonded, 73 % to the carbonyl group and only 5 % tothe urethane ether. This suggested a greater than average phaseseparation, in line with other properties of this material. The polymers ofthe ES series showed a comparable degree of NH bonding, rangingbetween 75% and 84%.
Studies of the temperature dependence of the degree of hydrogenbonding in the ET series showed, as expected, that it decreased withincreasing temperature and the results were used, together with otherinformation, to provide evidence about the influence of hard and soft
262 The micro structure of polymers
segment lengths on the perfection and purity of the hard and softsegment phases.
6.6.4 BiopolymersHydrogen bonds are important in stabilizing biopolymers in
their native conformations. In proteins, for example, many hydrogenbonds are formed between t h e ^ N H and C = O groups of the backbonepeptide groups and these tend to stabilize the backbone into one orother of a variety of helical conformations in which the hydrogen bondsare aligned in a cooperative fashion. Additional hydrogen bonds areformed from N—H, C = O and O—H groups of the protein side chainsand, in general, all potential hydrogen-bond forming groups are in factinvolved in hydrogen bonds either to other groups on the protein or tothe water molecules that are normally present in biological systems.Despite the stabilizing effects of hydrogen bonds and other interactionssuch as van der Waals interactions, the energy difference between thenative state of a protein and the unfolded, or 'denatured', state is quitelow, commonly of the order of 100 kJ mole"1; in an aqueousenvironment, denaturation can be promoted at temperatures not verygreatly above ambient, the favourable interactions within the proteinmolecule that are disrupted being replaced by only slightly lessfavourable interactions with water molecules surrounding the unfoldedstate. In fact, the stability of proteins is determined not so much by theenthalpic interactions as by the higher entropy of the bulk water whenthe protein is completely folded. The phenomenon of denaturationcauses changes in the infrared spectrum because of the greater strengthof the cooperative arrangement of hydrogen bonds in the native protein.
A particular and widely studied example of denaturation is that of thefibrous protein collagen, the material of tendon. This molecule consistsof three helical chains super-coiled around each other in the form of arope, stabilized by van der Waals interactions and hydrogen bondsbetween the three chains (see fig. 6.13). Denaturation, in which the fibrecollapses into a gelatinous state, involves a 'melting' of the triple helicalstructure with a concomitant change in v(NH) from 3330 to 3300 cm"1
Fig. 6.13. Schematic diagram of part of a collagen molecule, showing theregular pattern of hydrogen bonds that link the three helical chains of themolecule so that they super-coil round each other. (From J. R. Holum,Principles of Physical, Organic and Biological Chemistry. Copyright © (1969)John Wiley & Sons, Inc. Reprinted by permission of John Wiley & Sons, Inc.After an original drawing by A. Rich.)
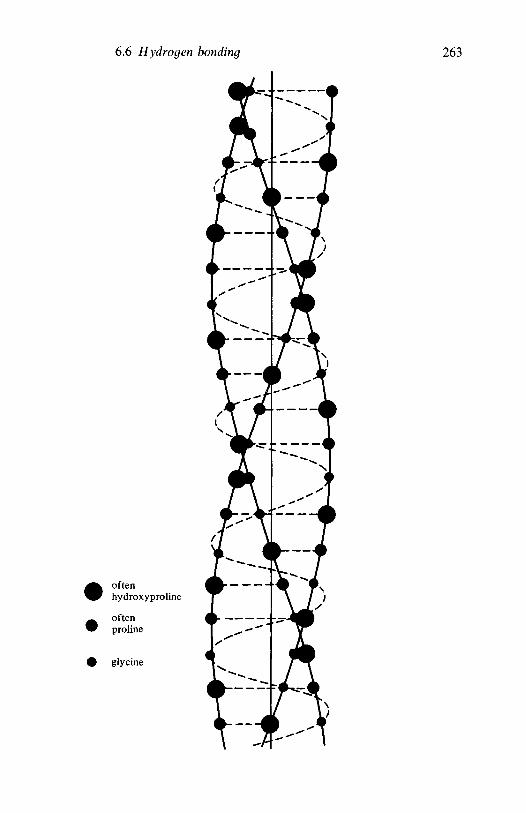
6.6 Hydrogen bonding 263
oftenhydroxyproline
oftenpro line
Nl
glycine
264 The microstructure of polymers
as the regular pattern of inter-chain hydrogen bonds is replaced by anirregular pattern of hydrogen bonds to neighbouring water molecules.
Raman spectroscopy is often the favoured approach withbiopolymers because of the ease of sampling and because of thegenerally high water content. This technique has been used to study the'melting' of DNA, the genetic material, whose double helicalconformation is stabilized by hydrogen bonds that provide specificinteractions between complementary planar nitrogenous bases attachedto the two sugar-phosphate backbone chains. In a synthetic analogueformed by one chain of polyribo-adenylic acid and one chain ofpolyribo-uridylic acid the Raman spectrum shows a clear peak at1681 cm"1 at low temperatures. This is one of the v(C=O) vibrationsfrom the uracil base when it is hydrogen bonded to adenine. At highertemperatures, the double helix 'melts' as the hydrogen bonds betweenpairs of bases are disrupted and at 59°C the 1681 cm"1 peak is replacedby two at 1660 and 1698 cm"1 characteristic of the free uracil moiety.
6.7 Chain order and crystallinity6.7.1 Introduction
The way in which the vibrational modes of polymers aremodified when the chains are present in crystalline regions has beendiscussed in chapter 3, primarily from the fundamental angle. Theconsequences will now be considered in more detail, by reference to fourpolymers, polyethylene, polyoxmethylene, poly (vinyl chloride) andpolytetrafluoroethylene, as will the practical implications. These includethe determination of crystallinity, the testing of postulatedintermolecular force fields, the provision of evidence for a third phase,neither crystalline nor amorphous, in polyethylenes and the provision ofevidence for or against particular crystal structures. In addition, it isnow known that certain vibrations that were previously assumed to bespecific for chains in crystalline regions are actually characteristic for nomore than one-dimensional order along the chain length. They can,nevertheless, sometimes still prove useful for obtaining an approximatemeasure of crystallinity, and the general question of chain order andregularity peaks in vibrational spectra will be discussed after someclear examples of the effects of crystallinity have been given. By way ofintroduction, it will be useful to summarize the principles set out in moredetail in chapter 3.
In essence, if there is a single chain passing through the crystallo-graphic unit cell the spectrum will differ only marginally from that of asingle, isolated chain or a group of chains with the same conformation inan amorphous region. Modes that were degenerate for a single chain
6.7 Chain order and crystallinity 265
may have different frequencies, though in general the splitting will not bevery great, and modes inactive for the single chain may be activated. Onthe other hand, by comparison with a group of chains in the amorphousregions the peaks will tend to be somewhat sharper because of theremoval of the spatial disorder which causes each vibrational frequencyto be spread over a small range. If there are m chains per unit cell,correlation splitting of the modes occurs for m > 1. Any mode of thesingle chain is split into m modes which differ, to a first approximation,only in the relative phases of the motions of the m chains in each unit cell;the motions are correlated. In addition, there are 4m — 3 low frequencylattice modes for all values of m, including m = 1.
Two assumptions are involved in this description of the effects ofcrystallinity. They are that the intermolecular forces are small comparedwith the intramolecular forces, so that the perturbation of the singlechain vibrations is small, and that the splitting is not obscured inpractice because the corresponding peaks in the spectrum are too broador are overlaid by peaks due to non-crystalline material.
6.7.2 PolyethyleneThe formal theoretical treatment of the factor group modes of
crystalline polyethylene has already been given in subsection 3.2.2. Thenature of the modes resulting from correlation splitting is very easilyillustrated and a simple vectorial approach allows an easy deduction ofthe directions of the infrared transition moment dipoles. Consider theCH2 rocking vibration of species B2u for the single chain, shown in fig.6.14a as it would appear if viewed along the length of the chain.
The dipole moment changes consequent upon the movements of thefour hydrogen atoms are shown resolved along axes parallel andperpendicular to the projected C—C bond direction in fig. 6.14b. It isclear that the net dipole moment change is perpendicular to the C—Cbond direction, as indicated by the broad arrow in fig. 6.14a. The unitcell of polyethylene is orthorhombic and contains two molecules: onemolecule passes through the centre of the cell and one molecule at eachcorner of the cell is shared with three other unit cells. The symmetry ofthe factor group allows only two different phase relationships betweenthe vibrations of the two chains in the unit cell and these are shown in fig.6.14c. When the net dipole moments of the chains are resolved parallelto the a and b axes of the unit cell and summed, bearing in mind that thecontribution per unit cell from the central chain will be four times thatfrom each of the corner chains, the overall dipole moment is seen to lieparallel to the b axis in the upper diagram and parallel to the a axis in thelower one.
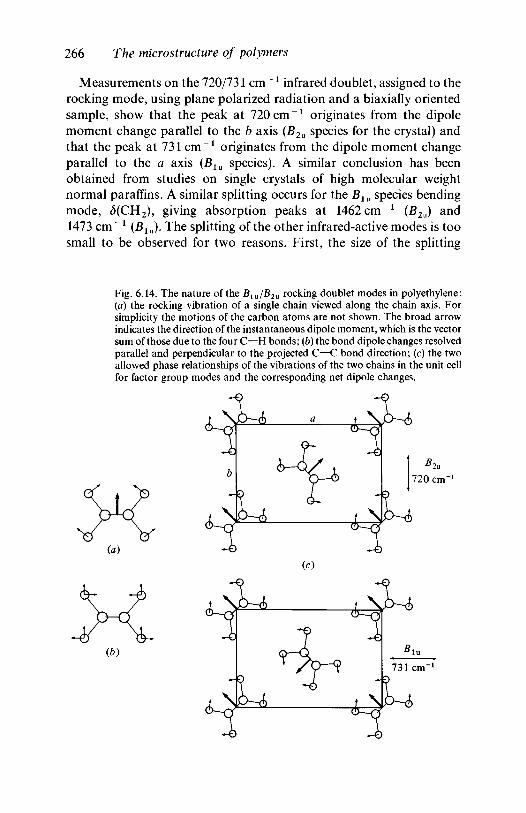
266 The micro structure of polymers
Measurements on the 720/731 cm~1 infrared doublet, assigned to therocking mode, using plane polarized radiation and a biaxially orientedsample, show that the peak at 720 cm"1 originates from the dipolemoment change parallel to the b axis (B2u species for the crystal) andthat the peak at 731 cm"1 originates from the dipole moment changeparallel to the a axis (Blu species). A similar conclusion has beenobtained from studies on single crystals of high molecular weightnormal paraffins. A similar splitting occurs for the Blu species bendingmode, (3(CH2), giving absorption peaks at 1462 cm"1 (B2u) and1473 cm"1 (Blu). The splitting of the other infrared-active modes is toosmall to be observed for two reasons. First, the size of the splitting
Fig. 6.14. The nature of the Biu/B2u rocking doublet modes in polyethylene:(a) the rocking vibration of a single chain viewed along the chain axis. Forsimplicity the motions of the carbon atoms are not shown. The broad arrowindicates the direction of the instantaneous dipole moment, which is the vectorsum of those due to the four C—H bonds; (b) the bond dipole changes resolvedparallel and perpendicular to the projected C—C bond direction; (c) the twoallowed phase relationships of the vibrations of the two chains in the unit cellfor factor group modes and the corresponding net dipole changes.
(ft)
w(b)
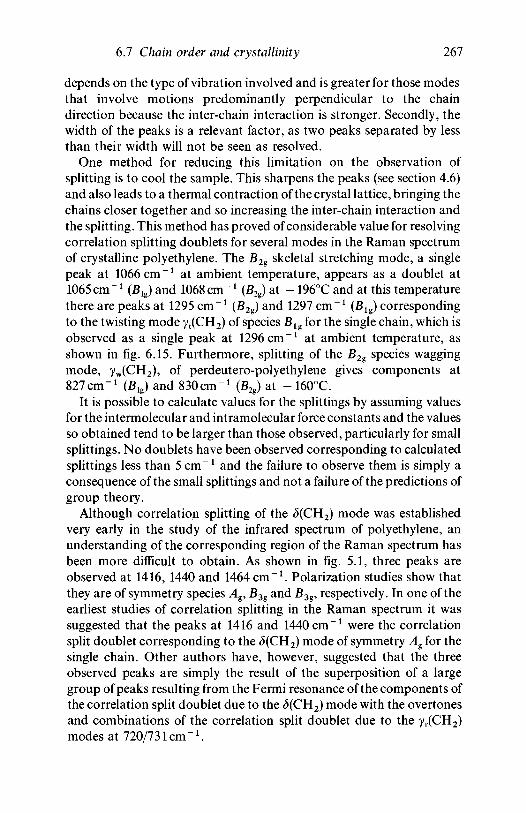
6.7 Chain order and crystallinity 267
depends on the type of vibration involved and is greater for those modesthat involve motions predominantly perpendicular to the chaindirection because the inter-chain interaction is stronger. Secondly, thewidth of the peaks is a relevant factor, as two peaks separated by lessthan their width will not be seen as resolved.
One method for reducing this limitation on the observation ofsplitting is to cool the sample. This sharpens the peaks (see section 4.6)and also leads to a thermal contraction of the crystal lattice, bringing thechains closer together and so increasing the inter-chain interaction andthe splitting. This method has proved of considerable value for resolvingcorrelation splitting doublets for several modes in the Raman spectrumof crystalline polyethylene. The B2g skeletal stretching mode, a singlepeak at 1066 cm"1 at ambient temperature, appears as a doublet at1065 cm"1 (Blg) and 1068 cm"1 (B2g) at - 196°C and at this temperaturethere are peaks at 1295 cm"1 (B2g) and 1297 cm"1 (Blg) correspondingto the twisting mode yt(CH2) of species Blg for the single chain, which isobserved as a single peak at 1296 cm"1 at ambient temperature, asshown in fig. 6.15. Furthermore, splitting of the B2g species waggingmode, yw(CH2), of perdeutero-polyethylene gives components at827cm"1 (Blg) and 830cm"1 (B2g) at - 160°C.
It is possible to calculate values for the splittings by assuming valuesfor the intermolecular and intramolecular force constants and the valuesso obtained tend to be larger than those observed, particularly for smallsplittings. No doublets have been observed corresponding to calculatedsplittings less than 5 cm"1 and the failure to observe them is simply aconsequence of the small splittings and not a failure of the predictions ofgroup theory.
Although correlation splitting of the <5(CH2) mode was establishedvery early in the study of the infrared spectrum of polyethylene, anunderstanding of the corresponding region of the Raman spectrum hasbeen more difficult to obtain. As shown in fig. 5.1, three peaks areobserved at 1416, 1440 and 1464 cm"1 . Polarization studies show thatthey are of symmetry species Ag, B3g and jB3g, respectively. In one of theearliest studies of correlation splitting in the Raman spectrum it wassuggested that the peaks at 1416 and 1440 cm"1 were the correlationsplit doublet corresponding to the <5(CH2) mode of symmetry Ag for thesingle chain. Other authors have, however, suggested that the threeobserved peaks are simply the result of the superposition of a largegroup of peaks resulting from the Fermi resonance of the components ofthe correlation split doublet due to the S(CH2) mode with the overtonesand combinations of the correlation split doublet due to the yr(CH2)modes at 7207731cm"1.
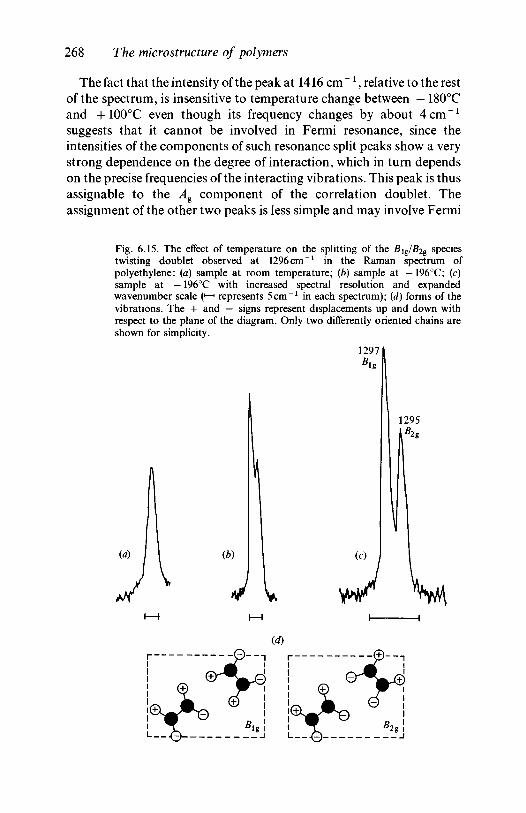
268 The microstructure of polymers
The fact that the intensity of the peak at 1416 cm " 1 , relative to the restof the spectrum, is insensitive to temperature change between — 180°Cand +100°C even though its frequency changes by about 4cm" 1
suggests that it cannot be involved in Fermi resonance, since theintensities of the components of such resonance split peaks show a verystrong dependence on the degree of interaction, which in turn dependson the precise frequencies of the interacting vibrations. This peak is thusassignable to the Ag component of the correlation doublet. Theassignment of the other two peaks is less simple and may involve Fermi
Fig. 6.15. The effect of temperature on the splitting of the B lg/B2g speciestwisting doublet observed at 1296 cm"1 in the Raman spectrum ofpolyethylene: {a) sample at room temperature; (b) sample at — 196°C; (c)sample at — 196°C with increased spectral resolution and expandedwavenumber scale (•—• represents 5cm"1 in each spectrum); {d) forms of thevibrations. The + and — signs represent displacements up and down withrespect to the plane of the diagram. Only two differently oriented chains areshown for simplicity.
(a)
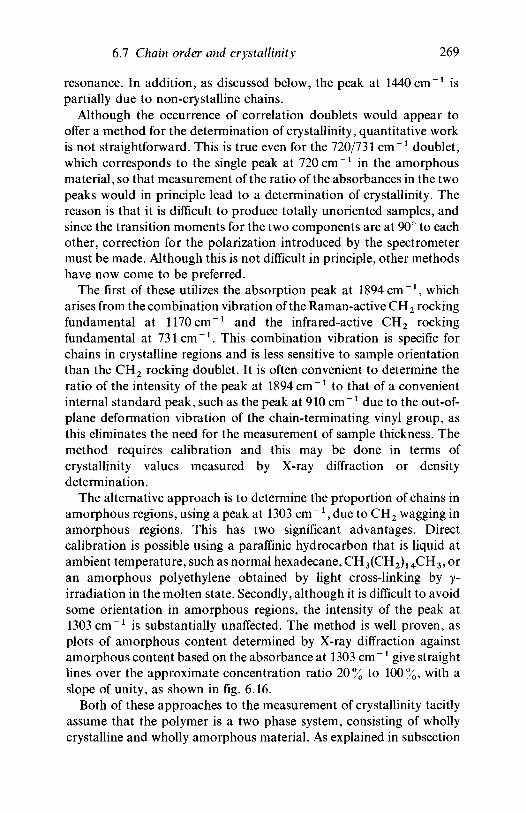
6.7 Chain order and crystallinity 269
resonance. In addition, as discussed below, the peak at 1440 cm"1 ispartially due to non-crystalline chains.
Although the occurrence of correlation doublets would appear tooffer a method for the determination of crystallinity, quantitative workis not straightforward. This is true even for the 720/731 cm"1 doublet,which corresponds to the single peak at 720 cm"1 in the amorphousmaterial, so that measurement of the ratio of the absorbances in the twopeaks would in principle lead to a determination of crystallinity. Thereason is that it is difficult to produce totally unoriented samples, andsince the transition moments for the two components are at 90° to eachother, correction for the polarization introduced by the spectrometermust be made. Although this is not difficult in principle, other methodshave now come to be preferred.
The first of these utilizes the absorption peak at 1894 cm"1 , whicharises from the combination vibration of the Raman-active CH2 rockingfundamental at 1170 cm"1 and the infrared-active CH2 rockingfundamental at 731cm"1 . This combination vibration is specific forchains in crystalline regions and is less sensitive to sample orientationthan the CH2 rocking doublet. It is often convenient to determine theratio of the intensity of the peak at 1894 cm"1 to that of a convenientinternal standard peak, such as the peak at 910 cm"1 due to the out-of-plane deformation vibration of the chain-terminating vinyl group, asthis eliminates the need for the measurement of sample thickness. Themethod requires calibration and this may be done in terms ofcrystallinity values measured by X-ray diffraction or densitydetermination.
The alternative approach is to determine the proportion of chains inamorphous regions, using a peak at 1303 c m ' 1 , due to CH2 wagging inamorphous regions. This has two significant advantages. Directcalibration is possible using a paraffinic hydrocarbon that is liquid atambient temperature, such as normal hexadecane, CH3(CH2)14CH3, oran amorphous polyethylene obtained by light cross-linking by y-irradiation in the molten state. Secondly, although it is difficult to avoidsome orientation in amorphous regions, the intensity of the peak at1303 cm"1 is substantially unaffected. The method is well proven, asplots of amorphous content determined by X-ray diffraction againstamorphous content based on the absorbance at 1303 cm"1 give straightlines over the approximate concentration ratio 20% to 100%, with aslope of unity, as shown in fig. 6.16.
Both of these approaches to the measurement of crystallinity tacitlyassume that the polymer is a two phase system, consisting of whollycrystalline and wholly amorphous material. As explained in subsection
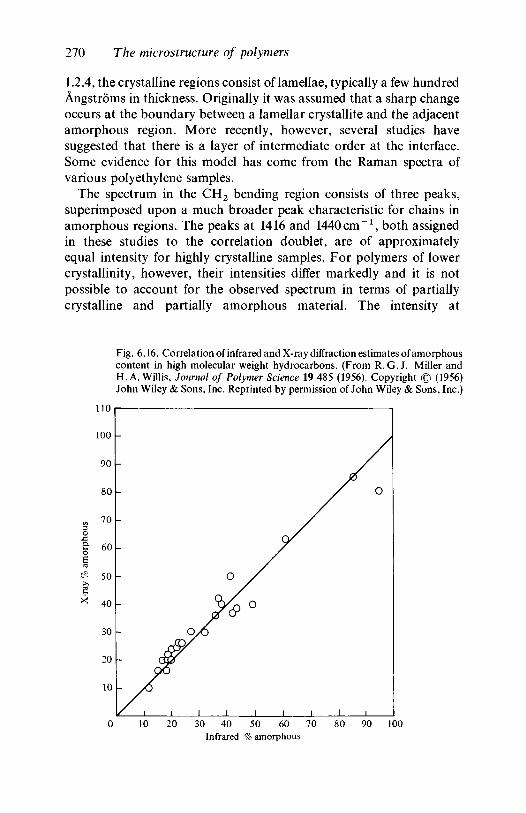
270 The microstructure of polymers
1.2 A, the crystalline regions consist of lamellae, typically a few hundredAngstroms in thickness. Originally it was assumed that a sharp changeoccurs at the boundary between a lamellar crystallite and the adjacentamorphous region. More recently, however, several studies havesuggested that there is a layer of intermediate order at the interface.Some evidence for this model has come from the Raman spectra ofvarious polyethylene samples.
The spectrum in the CH2 bending region consists of three peaks,superimposed upon a much broader peak characteristic for chains inamorphous regions. The peaks at 1416 and 1440cm"1, both assignedin these studies to the correlation doublet, are of approximatelyequal intensity for highly crystalline samples. For polymers of lowercrystallinity, however, their intensities differ markedly and it is notpossible to account for the observed spectrum in terms of partiallycrystalline and partially amorphous material. The intensity at
Fig. 6.16. Correlation of infrared and X-ray diffraction estimates of amorphouscontent in high molecular weight hydrocarbons. (From R.G.J. Miller andH.A.Willis, Journal of Polymer Science 19 485 (1956). Copyright © (1956)John Wiley & Sons, Inc. Reprinted by permission of John Wiley & Sons, Inc.)
110
10 20 30 40 50 60 70Infrared % amorphous
80 90 100
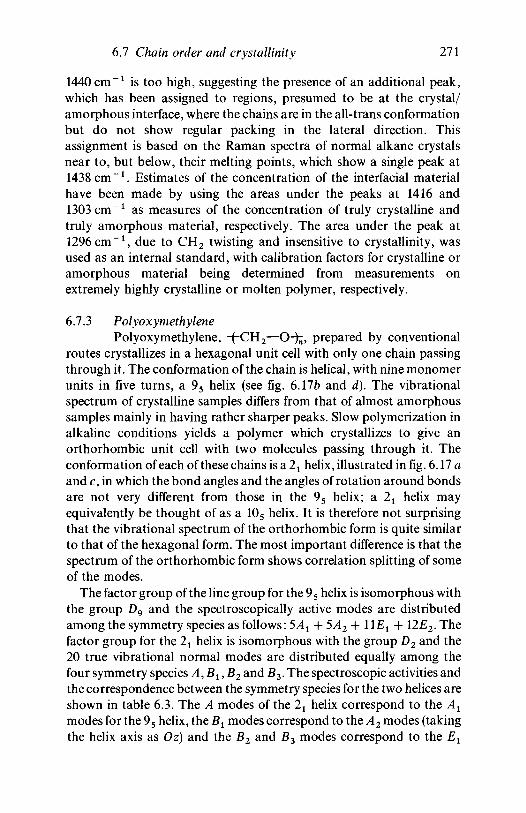
6.7 Chain order and crystallinity 271
1440 cm"1 is too high, suggesting the presence of an additional peak,which has been assigned to regions, presumed to be at the crystal/amorphous interface, where the chains are in the all-trans conformationbut do not show regular packing in the lateral direction. Thisassignment is based on the Raman spectra of normal alkane crystalsnear to, but below, their melting points, which show a single peak at1438 cm"1 . Estimates of the concentration of the interfacial materialhave been made by using the areas under the peaks at 1416 and1303 cm"1 as measures of the concentration of truly crystalline andtruly amorphous material, respectively. The area under the peak at1296 cm"1 , due to CH2 twisting and insensitive to crystallinity, wasused as an internal standard, with calibration factors for crystalline oramorphous material being determined from measurements onextremely highly crystalline or molten polymer, respectively.
6.7.3 PolyoxymethylenePolyoxymethylene, -(-CH2—O-fe, prepared by conventional
routes crystallizes in a hexagonal unit cell with only one chain passingthrough it. The conformation of the chain is helical, with nine monomerunits in five turns, a 95 helix (see fig. 6.17b and d). The vibrationalspectrum of crystalline samples differs from that of almost amorphoussamples mainly in having rather sharper peaks. Slow polymerization inalkaline conditions yields a polymer which crystallizes to give anorthorhombic unit cell with two molecules passing through it. Theconformation of each of these chains is a 21 helix, illustrated in fig. 6.17 aand c, in which the bond angles and the angles of rotation around bondsare not very different from those in the 95 helix; a 2l helix mayequivalently be thought of as a 105 helix. It is therefore not surprisingthat the vibrational spectrum of the orthorhombic form is quite similarto that of the hexagonal form. The most important difference is that thespectrum of the orthorhombic form shows correlation splitting of someof the modes.
The factor group of the line group for the 95 helix is isomorphous withthe group D9 and the spectroscopically active modes are distributedamong the symmetry species as follows: 5 ^ + 5A2 + 11E1 + 12£2- Thefactor group for the 2X helix is isomorphous with the group D2 and the20 true vibrational normal modes are distributed equally among thefour symmetry species A, B^, B2 and B3. The spectroscopic activities andthe correspondence between the symmetry species for the two helices areshown in table 6.3. The A modes of the 21 helix correspond to the A1
modes for the 95 helix, the B1 modes correspond to the A2 modes (takingthe helix axis as Oz) and the B2 and B3 modes correspond to the El
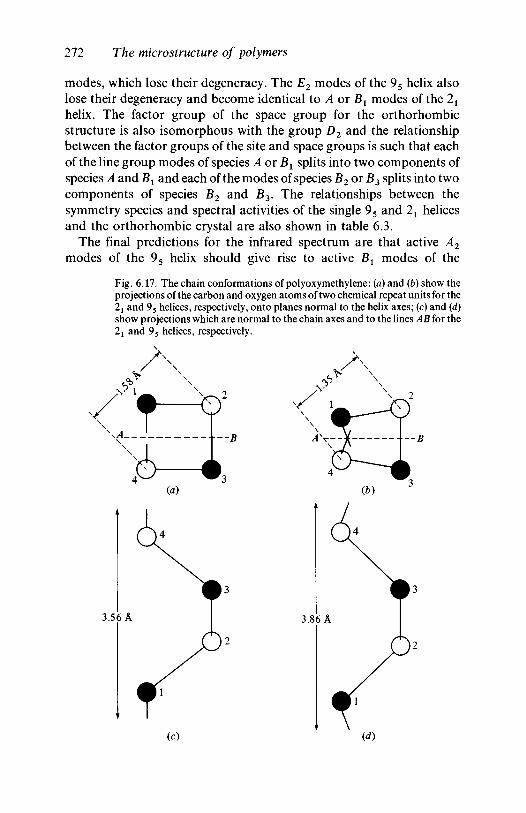
272 The microstructure of polymers
modes, which lose their degeneracy. The E2 modes of the 95 helix alsolose their degeneracy and become identical to A or Bx modes of the 2X
helix. The factor group of the space group for the orthorhombicstructure is also isomorphous with the group D2 and the relationshipbetween the factor groups of the site and space groups is such that eachof the line group modes of species A or Bl splits into two components ofspecies A and B1 and each of the modes of species B2 or B3 splits into twocomponents of species B2 and B3. The relationships between thesymmetry species and spectral activities of the single 95 and 21 helicesand the orthorhombic crystal are also shown in table 6.3.
The final predictions for the infrared spectrum are that active A2
modes of the 95 helix should give rise to active Bx modes of the
Fig. 6.17. The chain conformations of polyoxymethylene: {a) and (b) show theprojections of the carbon and oxygen atoms of two chemical repeat units for the2j and 95 helices, respectively, onto planes normal to the helix axes; (c) and (d)show projections which are normal to the chain axes and to the lines AB for the21 and 95 helices, respectively.
(c)
6.7 Chain order and crystallinity 273
Table 6.3. Relationships between symmetry species and spectroscopicactivities for the vibrational modes of different forms ofpolyoxymethylene
95 helix
species R IR
Single 21
species
helix
R IR
Orthorhombic
species R
crystal
IR
d
d o
B2,B3
B2,B3
P
d
P
d
d
d
Notation as explained in section 5.1.
orthorhombic crystal, active Ex modes should give rise to active B2, B3
doublets and inactive Ax or E2 modes should give rise to active Bl
species modes. Some of the correlation split doublets, thosecorresponding to Ex modes of the 95 helix, should thus be observabledirectly in the infrared spectrum, whereas others, corresponding to Al9
A2 or E2 modes, require the observation of Raman spectra.The task of assigning the modes in the infrared spectrum and of
seeking the B2 and B3 doublets, assuming that the intermolecularcoupling constants are large enough, is complicated by the fact that theorthorhombic form is unstable and reverts to the hexagonal form at70°C or on stretching. It is therefore necessary to examine the sample inpowder form and polarization information cannot be obtained. Suchinformation can, however, be obtained for the hexagonal form, forwhich A2 species should be n modes and Et species should be a modes. Acomparison of the infrared spectra of the hexagonal and orthorhombicforms then suffices to establish which modes are doubled in theorthorhombic form and to identify which line group modes theycorrespond to. The results are shown in table 6.4 for those modes whichcan be clearly established as doubled. The labelling in terms of groupmodes is, as usual, only approximate.
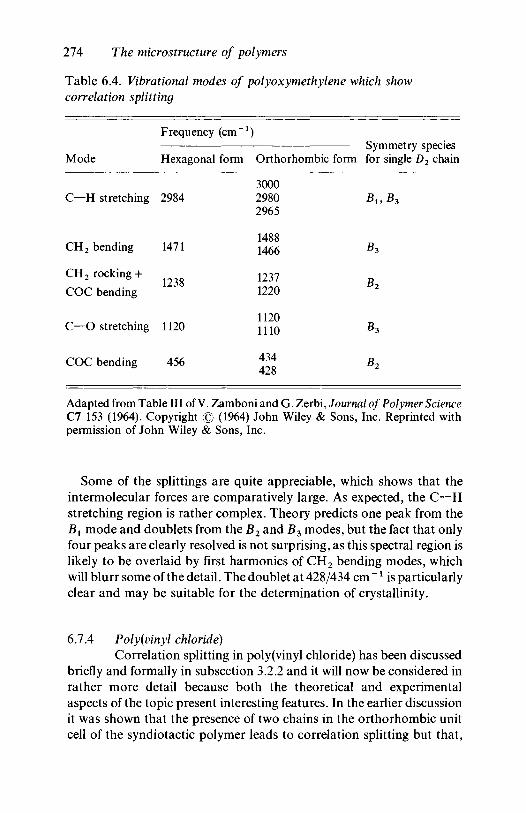
274 The microstructure of polymers
Table 6.4. Vibrational modes of polyoxymethylene which showcorrelation splitting
Mode
C—H stretching
CH2 bending
CH2 rocking +
COC bending
C—O stretching
COC bending
Frequency
Hexagonal
2984
1471
1238
1120
456
(cm"1)
form Orthorhombic form
300029802965
14881466
12371220
11201110
434428
Symmetry speciesfor single D2 chain
Bl9B3
B3
B2
B3
B2
Adapted from Table III of V. Zamboni and G. Zerbi, Journal of Polymer ScienceC7 153 (1964). Copyright © (1964) John Wiley & Sons, Inc. Reprinted withpermission of John Wiley & Sons, Inc.
Some of the splittings are quite appreciable, which shows that theintermolecular forces are comparatively large. As expected, the C—Hstretching region is rather complex. Theory predicts one peak from theBx mode and doublets from the B2 and B3 modes, but the fact that onlyfour peaks are clearly resolved is not surprising, as this spectral region islikely to be overlaid by first harmonics of CH2 bending modes, whichwill blurr some of the detail. The doublet at 428/434 cm " * is particularlyclear and may be suitable for the determination of crystallinity.
6.7.4 Poly(vinyl chloride)Correlation splitting in poly(vinyl chloride) has been discussed
briefly and formally in subsection 3.2.2 and it will now be considered inrather more detail because both the theoretical and experimentalaspects of the topic present interesting features. In the earlier discussionit was shown that the presence of two chains in the orthorhombic unitcell of the syndiotactic polymer leads to correlation splitting but that,
6.7 Chain order and crystallinity 275
unlike the examples considered so far, only one component of eachdoublet is infrared active while the other is only Raman active. Hencethe proof for the existence of the splitting requires the carefulcomparison of peak positions in the two types of spectrum.Furthermore, because the commercial type of polymer is onlymarginally syndiotactic and contains only about 10 % of crystallinematerial, the spectrum is complicated by the presence of peaks due tomany different conformational and configurational isomers, asexplained in subsection 6.2.3.
This latter problem can be overcome by the use of the highlysyndiotactic polymer made by the urea clathrate method. Nevertheless,only one measurement has been reported in which it was clearlyestablished that the peak positions were determined with sufficientaccuracy to prove the existence of the splitting. This study gavefrequencies of 601 ± 1 and 608 + 1 cm"1 for the antisymmetric C—Clstretching modes in the infrared and Raman spectra, respectively, andthe frequency 639 + 1 cm "x for the symmetric stretching mode for bothspectra. The C—Cl stretching regions of the infrared and Raman spectraare shown in fig. 3.7. The corresponding calculated values for theantisymmetric stretching mode are 604 and 602 cm"1 , and for thesymmetric stretching mode they are 637 and 642 cm"1 . The differencesbetween the observed and calculated values and the fact that the valuesare reversed in order for the antisymmetric modes shows that the inter-chain force field used for the calculations is incorrect. This is confirmedby the fact that the observed splittings for the C—C—Cl bendingvibrations of Ax and B2 species, at about 358 and 315 cm"1 ,respectively, are only about 3 cm"1 or less, whereas the correspondingcalculated splittings are 16 and 6 cm"1 .
Despite the difficulties involved in working with commercialpolymers, which have a low degree of syndiotacticity, the values of 608and 601 cm"1 obtained for the antisymmetric C—Cl stretching modefrom spectra of the urea clathrate polymer have been confirmed. It hasbeen possible to fit the observed Raman spectrum of the commercialpolymer with nine peaks over the interval 600-700 cm"1 , includingpeaks at 608 and 638 cm"1 (see fig. 6.7). Second and fourth derivativeinfrared spectra, which have sharper peaks than the normal spectrum(see section 1.7), also reveal peaks at about 601 and 638 cm"1 .Furthermore, it has proved possible to use the sum of the areas of thepeaks at 608 and 638 cm"1 in the Raman spectrum of a powder sample,expressed as a fraction of the total area under all the v(CCl) peaks, as anapproximate measure of crystallinity, although the complexity of thisapproach precludes it as a routine practical method.
276 The micro structure of polymers
6.7.5 Lattice modes in polyethylene and polytetrafluoroethyleneAs explained in subsection 3.2.1, the three-dimensional order
present in polymer crystallites leads to the occurrence of lattice modes.These modes are vibrations in which the distortion of the crystalcorresponds, to a first approximation, to the bodily movement of eachchain with respect to its neighbours. Vibrations of this type have beenmost extensively studied for polymers containing long methylenesequences, and for polyethylene in particular. The far infrared spectrumof polyethylene at low temperatures has two absorption peaks at about80 and 108 cm"1 . The assignments of these two peaks, based partly onthe results of normal coordinate calculations, are well established. Theone at 80 cm"1 results from a translational vibration in which the twochains in the unit cell move in opposite directions parallel to the b axis ofthe cell, whereas that at 108 cm ~* has its origin in a similar translationalvibration in which the chains move parallel to the a axis.
The interpretation of the low frequency spectrum of polytetrafluoro-ethylene (PTFE) has proved more challenging and the problem has beenattacked by a combination of normal coordinate calculations andcareful experimental measurements, including studies of the polarizedinfrared spectra of oriented samples. The early experimental studiesshowed that several new peaks appear in the far infrared region when thetemperature of the sample is below the transition temperature of 19°C(see subsection 5.2.4) and that splittings also appear in several peaks inthe Raman spectrum. These observations were difficult to reconcile withthe assumption that the change in structure at the transitiontemperature is purely intramolecular and involves only atransformation from a 157 to a 136 helix, since the most naturalexplanation would be that the low temperature form has at least twochains per unit cell. Early X-ray diffraction studies suggested, however,that both forms have a unit cell containing only one molecule. In anattempt to resolve this paradox it was suggested that the changes in thevibrational spectrum for samples at low temperature were aconsequence of a relaxation of the helical selection rules, due to the effectof neighbouring chains, or to conformational disorder. The two possibleinterpretations of the spectroscopic data stimulated further lowtemperature studies.
The original interpretation of the splitting observed in the Ramanspectrum, as correlation splitting, led to the conclusion that the crystalstructure was monoclinic, with space group P2X. This structure has twochains passing through the unit cell in such a way that they are related bya two-fold screw axis perpendicular to the chain axes and the factorgroup of the space group is isomorphous with the point group C2. For
6.7 Chain order and crystallinity 277
this factor group all five lattice modes are infrared active and it followsthat three of them are A modes polarized parallel to the C2 axis, i.e.perpendicular to the chain axis, and as a consequence they should beobserved as o modes in oriented samples. These are the libration of thetwo chains in the same direction around the chain axis, the translationalvibration of the two chains with respect to each other parallel to thechain axis and the translational vibration of the two chains with respectto each other perpendicular to the C2 axis. The other two modes are Bspecies modes and may have their oscillating dipoles anywhere in theplane perpendicular to the C2 axis, so that they are neither o nor nmodes. These correspond to the translational vibration parallel to theC2 axis and to the librational motion of the two chains in oppositedirections.
The experimental results show that there are at least seven absorptionpeaks in the region 30-90 cm"1 , four of which, at 45, 54, 58 and86 cm"1 , are a polarized and the other three of which, at 32, 71 and76 cm"1 , are without strong dichroism. Several slightly differentinterpretations of these peaks have been given, but it is generallyaccepted that the peak at 32 cm ~x is probably to be assigned to theinternal E1 mode on the dispersion curve labelled v8 in fig. 5.8 and thatthose at 45, 54, 58 and 71 cm"1 are probably to be assigned to latticemodes. The latter four show appropriate polarization for lattice modesassociated with C2 symmetry and are found to decrease in intensitywhen the samples are irradiated with y-rays, which leads to a lowering ofthe crystallinity. If they were due to defects they would be expected toincrease in intensity, and if they were due to changes in the selectionrules for the low temperature phase they would be expected to maintainessentially constant intensities, since the crystal structure is not furtherchanged by irradiation. In addition, lowering the temperature causes thepeaks at 45, 54 and 58 cm"1 to move towards higher frequencies, aswould be expected for lattice modes, since thermal contraction of thelattice leads to increased interaction between the molecules. Theobservations on the low frequency vibrational spectrum thus clearlysupport the idea that the low temperature form of PTFE has a structurewith two chains per unit cell.
The results of recent X-ray and electron diffraction studies of the lowtemperature form have been interpreted in terms of a unit cell with twochains passing through it. The two chains have helical conformations ofopposite chirality which correspond closely, but not exactly, to 136
helices. No definite space group symmetry could be assigned to thestructure. The gradual elucidation of the structure and spectralassignments of the low temperature form of PTFE, which is not yet
278 The microstructure of polymers
complete, provides a good example of the complementary role thatvibrational spectroscopy can play to conventional crystallographicstudies of polymers.
6.7.6 Differentiation between crystallinity and chain orderIt is clear from the results considered in the present chapter that
the major factor which differentiates the vibrational spectrum ofpolymer chains in crystalline regions from the spectrum of those inamorphous regions is the presence of order, i.e. translational symmetry,along the chain direction. The additional changes that result fromlateral order, due to crystalline packing of the chains, are small. Notsurprisingly, therefore, a careful distinction has not always been drawnbetween the two types of order and values of crystallinity have beenreported which were actually based on peaks characteristic for orderalong the chain direction only. It will therefore be useful to summarizehow the two types of order manifest themselves and to consider to whatextent peaks characteristic for the latter type of order may be used, albeitempirically, as a measure of crystallinity.
Over 20 years ago Zerbi, Ciampelli and Zamboni divided so-calledregularity peaks into three types and as their system is logical, and hasstood the test of time, it will be followed here. The first group of peakscharacterize conformational regularity or irregularity, of which the mostobvious example is trans/gauche rotational isomerism. For example, thepeaks at 1450 and 1435 cm"1 in the spectrum of trans-1,4-polybutadiene are characteristic for the trans and gauche conformers,respectively, of the CH2—CH2 bond. Such peaks may occur both in thesolid state and in the melt or solution, although the ratio of theconcentrations of the two conformers may be different for the two states.The trans isomer is often of lower energy than the gauche isomer and isthen found in the crystalline state. It is unwise, however, to assume thatthe intensities of peaks characteristic for trans conformers are a directmeasure of crystallinity. This has often been done for poly(ethyleneterephthalate), for which peaks at 975, 1340 and 1470 cm"1 in theinfrared spectrum are characteristic for the trans conformer. It has,however, been shown that trans units occur in amorphous regions inconcentrations which may depend on annealing temperature and timeor on the degree of molecular orientation. Crystallinity values based onthe intensity of a peak due to trans conformers may therefore be toohigh.
The second class of regularity peaks, often erroneously called'crystallinity peaks', consists of peaks associated with long stereoregularchain segments. Some examples have been discussed in section 6.2, of
6.7 Chain order and crystallinity 279
which the best known is isotactic polypropylene. This forms a regularhelix with three monomer units per turn and it was noted that peaks at805, 840, 898, 972, 995 and 1100 cm"1 are characteristic for the helicalstructure. This type of chain regularity peak is usually absent from thespectrum of the molten polymer, but occasionally it is replaced by amuch broader peak. Of the six peaks that are characteristic for thepolypropylene 3X helix, all are absent from the spectrum of the moltenpolymer except the one at 972 cm"1 , which is considerably broadened.A detailed analysis of the profile suggests that short helical units are stillpresent in the melt. For this reason, although regularity of individualchains is a necessary condition for the occurrence of crystallinity, theintensity of a particular peak characteristic for such regularity may notbe a direct measure of the crystallinity.
The third class of regularity peaks comprises the true crystallinitypeaks. Their occurrence is a consequence of inter-chain interaction andis predictable by group theory although, as is evident from the examplesconsidered in subsections 6.7.2 to 6.7.4, the magnitude of the correlationsplitting cannot, at present, be calculated with any degree of confidence.These true crystallinity peaks disappear when the sample is melted, butthis may not prove a useful diagnostic test because of the instability of anumber of polymers, e.g. polyoxymethylene and poly(vinyl chloride), attemperatures well below their melting points. Hence, there are often realpractical difficulties, particularly with new or unusual polymers forwhich detailed vibrational analyses are not available, in diagnosing withcertainty which, if any, of the observed peaks are specific for crystallinityand whose intensities may therefore be used as a measure of crystallinity,provided that allowance is made for complications such as those arisingfrom preferred orientation.
In these circumstances it is necessary to look for alternativeapproaches to the measurement of crystallinity. As noted above, modesspecific for chains in amorphous regions are sometimes more suitable forquantitative work although here also it may not always be easy toidentify such peaks with certainty. In addition, it must be recognizedthat the definition of the degree of crystallinity for a polymer is notstraightforward. States of order intermediate between the trulycrystalline state, with three-dimensional order over regions largecompared with a monomer unit, and the truly amorphous state, with noorder extending for distances more than a few monomer units, mayexist. Each different method of measuring crystallinity may then lead toa different result.
If, for a given polymer, samples are available covering a range ofcrystallinities, as determined by a technique such as X-ray diffraction or
280 The microstructure of polymers
density measurement, it may be possible to deduce an empiricalcorrelation between this measure of crystallinity and the intensity of oneor more peaks in the vibrational spectrum. Such correlations can beuseful, but should be treated with caution if the reason for thecorrelation is not understood. For example, although the peak at1141 cm ~1 in the infrared spectrum of poly (vinyl alcohol) has not beenshown to be a crystallinity peak its intensity correlates with values ofcrystallinity obtained by X-ray diffraction methods. Similarly, for thoseethylene/propylene/dicyclopentadiene terpolymers which contain morethan 65 % of ethylene and are partially crystalline, correlations havebeen found between the intensity of the C—C stretching mode, whichgives a peak at 1065 cm"1 in the Raman spectrum, and the degree ofcrystallinity determined by X-ray diffraction. The virtue of thisapproach is that once a calibration in terms of a second technique hasbeen established, vib rational spectroscopy usually provides a simpleand rapid method for the measurement of crystallinity.
6.8 Chain folding in polyethyleneIn the preceding section, lateral order between polymer chains
was considered in the important but specific context of interactionsbetween chains in the crystalline unit cell and the dimensions of thecrystallites were merely assumed to be much greater than those of theunit cell, so that surface effects could be neglected. As already pointedout in subsection 1.2.4, the crystals of polyethylene and various otherpolymers obtained from solution consist of lamellae a few hundredAngstroms in thickness, but with considerably larger lateral dimensions,and it is now well established by a variety of methods that the polymerchains fold back and forth so that their axes are approximately normalto the lamellar plane. This may be represented as shown schematically infig. 1.7.
Two assumptions have been made in drawing this figure: that themajority of the chains re-enter the lamella in a position adjacent towhere they emerge, by tight chain folds, and that the folding takes placealong a particular crystallographic plane. An alternative extremeassumption would be that the chains re-enter in positions randomlyrelated to those from which they emerge, the so-called 'switchboard'model. The identification by electron microscopy of the growth face ofthe diamond-shaped lamellar crystal of polyethylene (see fig. 6.18a) as a(110) crystallographic plane has led to the conclusion that folding occursin this plane, but it is possible to grow truncated crystals (see fig. 6.18fo)using different conditions, suggesting that chain folding may occur inthe (200) plane. The morphological characteristics of polyethylene
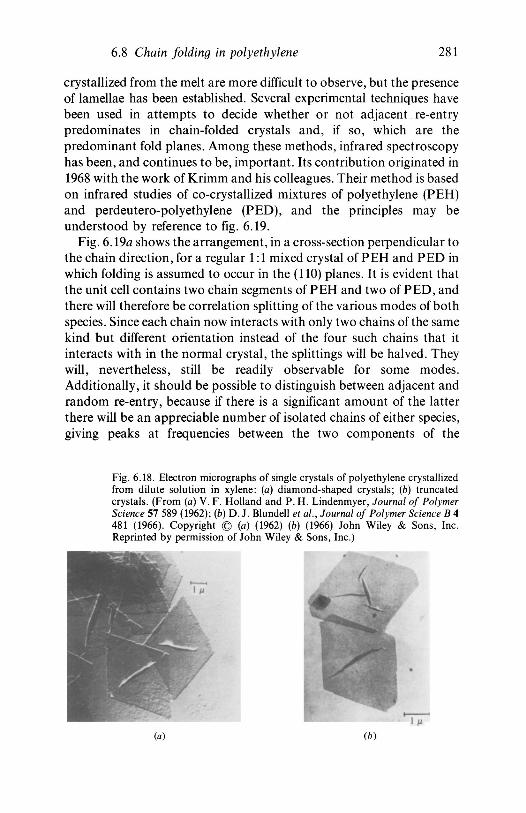
6.8 Chain folding in polyethylene 281
crystallized from the melt are more difficult to observe, but the presenceof lamellae has been established. Several experimental techniques havebeen used in attempts to decide whether or not adjacent re-entrypredominates in chain-folded crystals and, if so, which are thepredominant fold planes. Among these methods, infrared spectroscopyhas been, and continues to be, important. Its contribution originated in1968 with the work of Krimm and his colleagues. Their method is basedon infrared studies of co-crystallized mixtures of polyethylene (PEH)and perdeutero-polyethylene (PED), and the principles may beunderstood by reference to fig. 6.19.
Fig. 6.19a shows the arrangement, in a cross-section perpendicular tothe chain direction, for a regular 1:1 mixed crystal of PEH and PED inwhich folding is assumed to occur in the (110) planes. It is evident thatthe unit cell contains two chain segments of PEH and two of PED, andthere will therefore be correlation splitting of the various modes of bothspecies. Since each chain now interacts with only two chains of the samekind but different orientation instead of the four such chains that itinteracts with in the normal crystal, the splittings will be halved. Theywill, nevertheless, still be readily observable for some modes.Additionally, it should be possible to distinguish between adjacent andrandom re-entry, because if there is a significant amount of the latterthere will be an appreciable number of isolated chains of either species,giving peaks at frequencies between the two components of the
Fig. 6.18. Electron micrographs of single crystals of polyethylene crystallizedfrom dilute solution in xylene: (a) diamond-shaped crystals; {b) truncatedcrystals. (From (a) V. F. Holland and P. H. Lindenmyer, Journal of PolymerScience 57 589 (1962); (b) D. J. Blundell et al., Journal of Polymer Science B 4481 (1966). Copyright © (a) (1962) {b) (1966) John Wiley & Sons, Inc.Reprinted by permission of John Wiley & Sons, Inc.)
^ • ^
(a) (b)
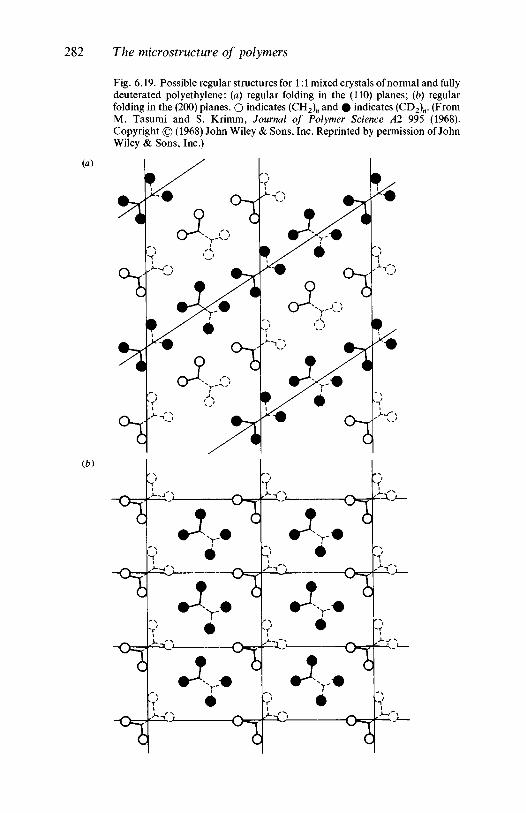
282 The microstructure of polymers
(a)
(b)
Fig. 6.19. Possible regular structures for 1:1 mixed crystals of normal and fullydeuterated polyethylene: (a) regular folding in the (110) planes; (b) regularfolding in the (200) planes. O indicates (CH2)n and # indicates (CD2)M. (FromM. Tasumi and S. Krimm, Journal of Polymer Science Al 995 (1968).Copyright © (1968) John Wiley & Sons, Inc. Reprinted by permission of JohnWiley & Sons, Inc.)
°T, st±ZJ")_
X*
X. °l
X.
°t^ • t ' - .
X. °rr̂
T"
°i&J—°r
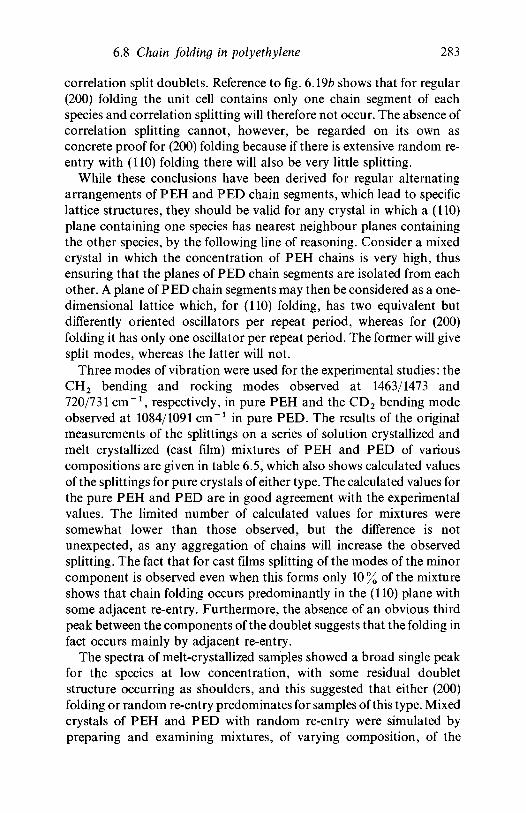
6.8 Chain folding in polyethylene 283
correlation split doublets. Reference to fig. 6.1% shows that for regular(200) folding the unit cell contains only one chain segment of eachspecies and correlation splitting will therefore not occur. The absence ofcorrelation splitting cannot, however, be regarded on its own asconcrete proof for (200) folding because if there is extensive random re-entry with (110) folding there will also be very little splitting.
While these conclusions have been derived for regular alternatingarrangements of PEH and PED chain segments, which lead to specificlattice structures, they should be valid for any crystal in which a (110)plane containing one species has nearest neighbour planes containingthe other species, by the following line of reasoning. Consider a mixedcrystal in which the concentration of PEH chains is very high, thusensuring that the planes of PED chain segments are isolated from eachother. A plane of PED chain segments may then be considered as a one-dimensional lattice which, for (110) folding, has two equivalent butdifferently oriented oscillators per repeat period, whereas for (200)folding it has only one oscillator per repeat period. The former will givesplit modes, whereas the latter will not.
Three modes of vibration were used for the experimental studies: theCH2 bending and rocking modes observed at 1463/1473 and720/731 cm"1 , respectively, in pure PEH and the CD2 bending modeobserved at 1084/1091 cm"1 in pure PED. The results of the originalmeasurements of the splittings on a series of solution crystallized andmelt crystallized (cast film) mixtures of PEH and PED of variouscompositions are given in table 6.5, which also shows calculated valuesof the splittings for pure crystals of either type. The calculated values forthe pure PEH and PED are in good agreement with the experimentalvalues. The limited number of calculated values for mixtures weresomewhat lower than those observed, but the difference is notunexpected, as any aggregation of chains will increase the observedsplitting. The fact that for cast films splitting of the modes of the minorcomponent is observed even when this forms only 10 % of the mixtureshows that chain folding occurs predominantly in the (110) plane withsome adjacent re-entry. Furthermore, the absence of an obvious thirdpeak between the components of the doublet suggests that the folding infact occurs mainly by adjacent re-entry.
The spectra of melt-crystallized samples showed a broad single peakfor the species at low concentration, with some residual doubletstructure occurring as shoulders, and this suggested that either (200)folding or random re-entry predominates for samples of this type. Mixedcrystals of PEH and PED with random re-entry were simulated bypreparing and examining mixtures, of varying composition, of the
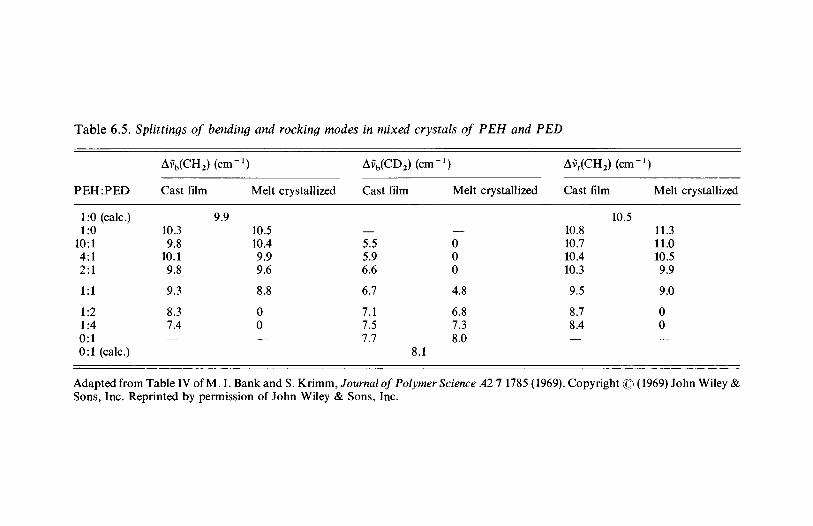
Table 6.5. Splittings of bending and rocking modes in mixed crystals of PEH and PED
PEH:PED
l:O(calc.)1:0
10:14:12:1
1:1
1:21:40:10:1 (calc.)
Avb(CH2) (cm-
Cast film
9.910.39.8
10.19.8
9.3
8.37.4
Melt crystallized
10.510.49.99.6
8.8
00—
Avb(CD2) (cm-
Cast film
—5.55.96.6
6.7
7.17.57.7
8.1
l)
Melt crystallized
—000
4.8
6.87.38.0
Avr(CH2)(cm"
Cast film
10.510.810.710.410.3
9.5
8.78.4—
Melt crystallized
11.311.010.59.9
9.0
00
Adapted from Table IV of M. I. Bank and S. Krimm, Journal of Polymer Science A2 71785 (1969). Copyright © (1969) John Wiley &Sons, Inc. Reprinted by permission of John Wiley & Sons, Inc.
6.8 Chain folding in polyethylene 285
normal paraffin C3 6H7 4 and its fully deuterated analogue. Since there isno chain folding in paraffin crystals, the distribution of hydrogenatedand deuterated chains in these mixed crystals will be random. Theobserved splittings for the species at high concentration in the paraffinmixtures were found to be appreciably less than for the correspondingmelt crystallized polymer mixture. It was therefore deduced that theremust be a substantial amount of adjacent re-entry in the polymer mixesand, as a corollary, that the chain folding is largely in the (200) plane. Itmust be noted, however, that the lattice dimensions of melt-crystallizedpolyethylene and normal paraffins are different at room temperature,and this conclusion is not supported by more recent work.
The interpretation of the results in the way indicated depends uponthe assumption that there is no segregation of the PEH and PED chains,since otherwise it does not follow that adjacent chain segments of thespecies with low concentration necessarily belong to the same molecule.It has been shown that although segregation can take place, because of adifference in the melting points of the two species, the conditions used inthe original work were close to those required to eliminate this effect.
Fig. 6.20. The CD2 bending region of the infrared spectrum of a PED/PEHmixed crystal grown from dilute solution in xylene and containing 0.5% PEDof MW 216 000. The spectrum was obtained with the sample at the temperatureof liquid nitrogen and is shown fitted with a singlet and two doublets; the sum ofthese is shown by the dashed line. Further increasing the number of doubletsimproves the fit. (Reproduced from S. J. Spells et al., Polymer 25 749 (1984), bypermission of the publishers, Butterworth & Co. (Publishers) Ltd. ©)
1070 1080 1090Wavenumber, v (cm"1)
1100
286 The microstructure of polymers
More recent studies have been made with samples cooled to liquidnitrogen temperature and it has become clear that the structures of theCH2 and CD2 bending regions of the spectrum are more complex thanoriginally thought. A detailed analysis of the regions into sets ofoverlapping peaks (see fig. 6.20) has shown that for solution crystallizedsamples they can be understood in terms of a model in which a moleculefolds in the (110) plane to give a sheet containing 10 to 20 parallel chainsegments. The folding is largely, but not completely, accompanied byadjacent re-entry, so that the chain segments occur within the sheet asblocks separated by blocks of chain segments from another molecule.For high molecular weights the molecule 'superfolds' to give multilayersheets of this type. The model is also consistent with the results ofneutron scattering experiments and was in fact originally developed toexplain those results. For melt-grown crystals the more recent infraredstudies, in which the broadened single peak observed for the CD2
bending mode has been analysed into several components, suggest thatrandom re-entry predominates but that there is possibly a small amountof (110), rather than (200), adjacent re-entry. The results of neutronscattering studies suggest a similar structure, in which groups of a fewchain segments related by adjacent or nearly adjacent re-entry occuramong chain segments for which re-entry is largely random.
6.9 Longitudinal acoustic modesAs long ago as 1949, in a general study of the Raman spectra of
solid normal paraffins (n-paraffins), it was noted that there was a peak inthe low frequency region whose frequency appeared to be inverselyproportional to the chain length. This observation was confirmed andextended nearly 20 years later, as was the original suggestion that thispeak has its origin in an accordian-like motion of the all-trans chainpresent in the crystals. There is maximum displacement of the atoms atthe surface of the crystal and a node of zero displacement at the centre ofthe crystal, as shown in fig. 6.21b. This motion will change thepolarizability of the crystal and the vibration will thus be Raman active.It is also evident that this vibration is the fundamental of a series oflongitudinal acoustic modes (LA modes or LAMs). The higher membersof the series will have two or more nodes within the crystal, as shown infig. 6.21c for three nodes. It is clear that those with an even number ofnodes will not produce a net change of polarizability for the crystal as awhole and so will not be Raman active, whereas those with an oddnumber of nodes will give peaks in the Raman spectrum at frequencieswhich, to a first approximation, will be the appropriate multiple of the
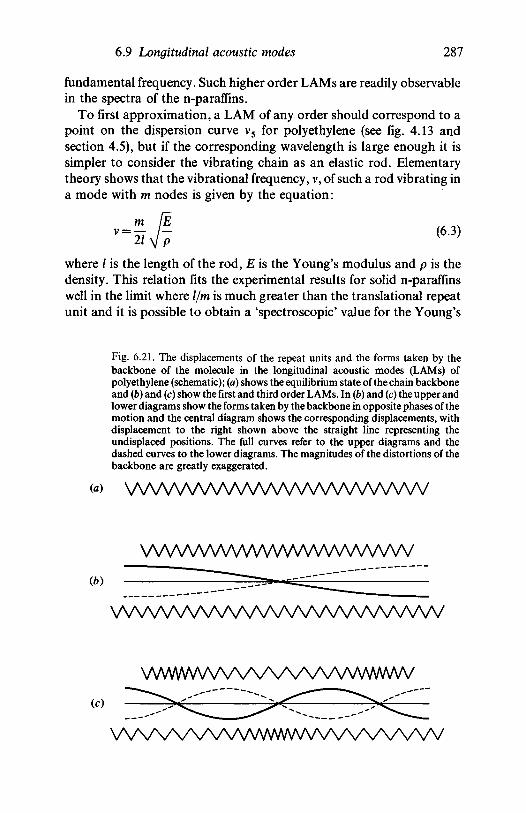
6.9 Longitudinal acoustic modes 287
fundamental frequency. Such higher order LAMs are readily observablein the spectra of the n-paraffins.
To first approximation, a LAM of any order should correspond to apoint on the dispersion curve v5 for polyethylene (see fig. 4.13 andsection 4.5), but if the corresponding wavelength is large enough it issimpler to consider the vibrating chain as an elastic rod. Elementarytheory shows that the vibrational frequency, v, of such a rod vibrating ina mode with m nodes is given by the equation:
m (6.3)
where / is the length of the rod, E is the Young's modulus and p is thedensity. This relation fits the experimental results for solid n-paraffinswell in the limit where l/m is much greater than the translational repeatunit and it is possible to obtain a 'spectroscopic' value for the Young's
Fig. 6.21. The displacements of the repeat units and the forms taken by thebackbone of the molecule in the longitudinal acoustic modes (LAMs) ofpolyethylene (schematic); (a) shows the equilibrium state of the chain backboneand (b) and (c) show the first and third order LAMs. In {b) and (c) the upper andlower diagrams show the forms taken by the backbone in opposite phases of themotion and the central diagram shows the corresponding displacements, withdisplacement to the right shown above the straight line representing theundisplaced positions. The full curves refer to the upper diagrams and thedashed curves to the lower diagrams. The magnitudes of the distortions of thebackbone are greatly exaggerated.
<«> wwwwwwwwwwwwv
vwwwwvwwwvwvwwv(b)
vwwwwwvwwwwwwv
WWWWWV\AAAA/WWWWV
(c)
V\MA/VWWVWWWWWWW
288 The microstructure of polymers
modulus of polyethylene from the limiting slope, at v = 0, of a plot of vagainst m//, since the density of crystalline polyethylene is known.
At the time that the later work on n-paraffins was in progress thelamellar nature of the single crystals of polyethylene obtained fromsolution (see subsection 1.2.4) was well established, as was the fact thatthe lamellar thickness is, typically, 200 A. It was therefore possible todeduce that the lowest LAM frequency for the chain segments in thelamellae occurs in the range 10-20cm"1, and the corresponding peakwill be difficult to observe as it will lie on the 'wing' of the intense line dueto Rayleigh scattering. For this reason, the LA mode was not observedin polyethylene until 1971. In this initial study it was clearly established,as anticipated, that the frequency decreased as single crystals wereannealed and so became thicker. The change in lamellar thickness withannealing temperature, as assessed by this approach using the value ofYoung's modulus obtained from the measurements on n-paraffins,proved to be very similar to that deduced from small angle X-raydiffraction measurements. Fig. 6.22 shows the peaks due to the LA modein the Raman spectra of two polyethylene samples prepared in differentways.
In the last decade, with the emergence of the holographic diffractiongrating which gives a high discrimination against the Rayleigh line, ithas proved comparatively easy to work within about 6 cm " * of this line,and there have been numerous studies on the LA mode of polyethyleneand, to a lesser degree, on that of other polymers which crystallize in thelamellar form. Higher order LA modes have been observed, but mosteffort has been concentrated on the lowest order LAM because of itsgreater intensity. There have also been a number of theoreticaltreatments of the LA mode, prompted largely by anomalies whichappeared in the experimental results. This work has proved interestingand has provoked several questions. For example, is it possible todetermine lamellar thicknesses with reasonable accuracy from thepositions of the corresponding LAM peaks by using the value ofYoung's modulus derived from measurements on solid n-paraffins? Inview of the all-trans conformation required for the LAM vibration, whatwill be the effect of an occasional defect structure in the crystallineregion, such as a gauche unit or a chain branch? Is it correct to assumethat the LAM frequency is determined only by the length of the straightchain segments ('stems') in the crystal lamellae so that it is unaffected bythe presence of disordered 'amorphous' material between lamellae orchain folds at their surfaces? Since a range of lamellar thicknesses willoccur in a given sample, the observed LAM peaks will be theconcentration-weighted sum of the peaks for each particular stem
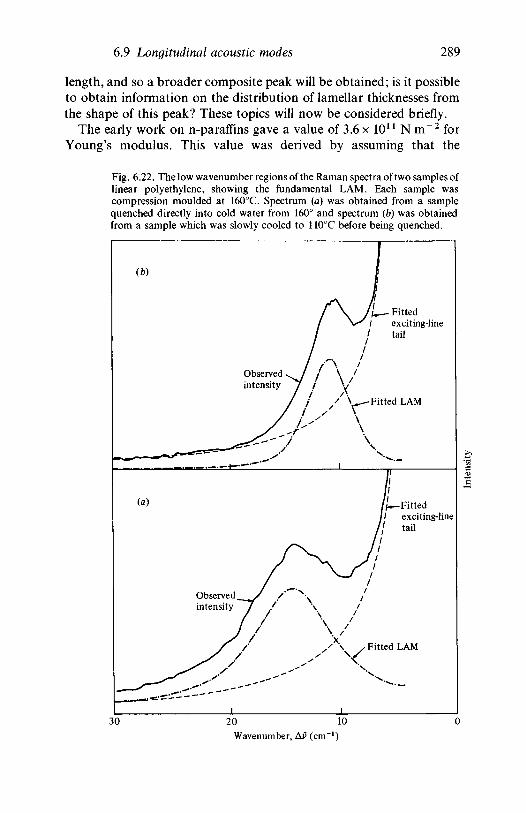
6.9 Longitudinal acoustic modes 289
length, and so a broader composite peak will be obtained; is it possibleto obtain information on the distribution of lamellar thicknesses fromthe shape of this peak? These topics will now be considered briefly.
The early work on n-paraffins gave a value of 3.6 x 10¹¹ N m~2 forYoung's modulus. This value was derived by assuming that the
Fig. 6.22. The low wavenumber regions of the Raman spectra of two samples oflinear polyethylene, showing the fundamental LAM. Each sample wascompression moulded at 160°C. Spectrum (a) was obtained from a samplequenched directly into cold water from 160° and spectrum (b) was obtainedfrom a sample which was slowly cooled to 110°C before being quenched.
(b)
- ^ -****
(a)
Observed __intensity
j
y/_i
Observed v /intensity j
yj-
r/ >i
X .\\
1
Jh1
//
\
\
\
— Fittedexciting-linetail
//—-Fitted/ exciting-line/ tail
y Fitted LAM
30 20 10Wavenumber, Ai> (cm"1)
290 The microstructure of polymers
frequency depends only on the length of the sequence of CH2 groups inan individual stem but later work indicated that weak interlamellarforces affect the peak position and an estimate of the magnitude of thiseffect led to a new value of 2.9 x 10¹¹ N m " 2 . This is in quite goodagreement with the value of 3.3 x 10¹¹ N m~2 obtained from inelasticneutron scattering data for the v5 dispersion curve of polyethylene. It isalso very close to the value obtained by direct stress/strainmeasurements on highly oriented samples of polyethylene and sincethese are not perfect single crystals the true crystal modulus must besomewhat higher, probably close to that obtained from the neutronscattering data.
Even if the correct crystal modulus and the observed LAM peakfrequency are substituted into equation (6.3) the value of / obtained willnot be the mean thickness of the lamellae in the sample, as might beexpected, since it has been shown that the peak position depends on thetemperature of the sample and the half-width of the peak. These factorswill not be discussed in detail and it will suffice to note that even in thefavourable circumstances of a narrow peak with a half-width of about6 cm ~1, corresponding to a narrow distribution of sequence lengths, thecorrection is about 1 cm ~x for a peak at 20 cm ~*; for a half-width threetimes larger the corresponding correction is about 7 cm ~x. Thecorrection, which reduces the observed frequency and so leads to ahigher value for the mean lamellar thickness, rises rapidly withdecreasing wavenumber of the peak position and may be comparablewith the measured value. In these circumstances it is not surprising thatthe absolute measurement of lamellar thicknesses from observed LAMfrequencies poses considerable problems and the method is of muchgreater value for following the changes that occur during treatmentssuch as annealing. It should also be noted that if the chains are inclinedat an angle to the normal to the lamellar surface, as is often observed, theangle of tilt must also be established. Nevertheless, by combining theresults of Raman measurements with those from small angle X-raydiffraction studies, which give the repeat distance of the 'sandwich'structure of lamellar crystalline and amorphous layers which usuallyoccurs, it has been possible to deduce reasonably reliable values for thethickness of the amorphous layers.
The evidence for the effect of defect structures comes primarily fromnormal mode calculations for models in which one or more successivegauche units are introduced near to the centre or to the end of a longstraight chain segment. They show that such a structure near to thechain end has little influence on the LAM vibration but when it is near tothe chain centre it reduces the intensity of the peak considerably without
6.9 Longitudinal acoustic modes 291
affecting its position perceptibly. Several pieces of evidence suggest thatthe presence of chain folds and amorphous material between lamellaedoes not affect the LAM frequency corresponding to a given stemlength. One important piece of experimental evidence is provided by theresults of measurements following treatment with nitric acid. Thismaterial selectively attacks the amorphous material and the chain folds,leaving isolated stems in the lamellae, but the LAM frequency does notchange significantly after this reaction. This evidence is supported by theresults of calculations based on an extension of the elastic rod model inwhich a composite rod is considered, which has one length, density andmodulus for that part of the molecule contained within a lamella, andtwo ends of different lengths, densities and moduli for the parts of aparticular chain lying within amorphous regions. Using this model it ispossible to obtain a modified expression for the LAM frequency which,when applied to the specific case of polyethylene, shows that thefrequency is only modified slightly by the fact that the stems traversingthe lamellae are parts of chains that also cross the interlamellar non-crystalline regions. A model of a similar nature, but which treats thechain more correctly at the microscopic level, shows similarly that thedispersion curves obtained by neutron scattering should be largelyunaffected by the interlamellar disordered material. These conclusionsprobably apply only for melt-crystallized samples, since there is someevidence that the LAM frequencies of 'mats' of sedimented solution-grown single crystals may be influenced by interactions between thelamellar surfaces, which consist of more regular chain folds than dothose of melt-grown crystals.
As noted above, if there is a range of lamellar thicknesses the LAMpeak will be broadened because of the superposition of the peaks,somewhat displaced with respect to each other, characteristic for eachstem length. Not surprisingly, there has been considerable interest in thepossibility of deducing information about the distribution of lengthsfrom the width of the LAM peak. Unfortunately, the half-width of thechain-length distribution function is not obtained from the observedintensity distribution simply by converting the frequencies at the half-intensity points to chain lengths using equation (6.3). Just as the peakposition depends on temperature and the distribution of stem lengths, asdiscussed above, so does the shape of the peak. The following equationrelating the distribution of stem lengths, /(/), and the line shape, J(v), hasbeen derived:
f(l) = Cv2B(v)I(v) (6.4)
where C is a constant, B(v) is the factor 1 — e~^c/fcT and / is the stem
292 The microstructure of polymers
length which gives rise to the LAM frequency v. An additional fact whichmust be taken into account is that the LAM peak has a finite width evenfor a sample consisting of stems of identical length; measurements oncrystalline n-paraffins lead to half-width values of 2.5-3.5 cm "* for peakpositions ranging from 6 to 30 cm"1 . The effect of these corrections,which have not been applied in several published studies, is to reduce thespread of the calculated stem lengths. For a particular sample ofsolution-crystallized polyethylene, the corrected spread was found to beas low as 15 A, in line with the results of small angle X-raymeasurements, whereas an earlier study in which the appropriatecorrections were not applied gave a spread of 40 A.
Although LAM studies on polyethylene have attracted the mostattention, a range of other polymers has been examined. These fall intotwo types: those that have (CH2)n sequences as part of the overallstructure and those that do not. The former category includes materialssuch as poly(decamethylene sebacate), poly(alkylene oxide)s andpoly(alkylene sulphide)s. The second category comprises a range ofordered polymers, such as polytetrahydrofuran, cis-l,4-polybutadiene,polytetrafluoroethylene, polyoxymethylene, poly(ethylene oxide) andisotactic polystyrene. Suitable short-chain molecules related to thesepolymers as the n-paraffins are to polyethylene are not available, norgenerally are neutron scattering data for constructing dispersion curves,so that spectroscopic values of Young's modulus cannot always beobtained. It has also been shown that values determined in other waysare usually less reliable. The use of LA mode frequencies inmorphological studies of these polymers is therefore more difficult thanit is for polyethylene and will not be discussed here.
6.10 Molecular orientation6.10.1 Introduction
In earlier sections it has been explained how infrared spectraobtained from samples in which the molecular chains have beenpreferentially oriented, by drawing or stretching the sample, can be usedas an aid to the assignment of vibrational modes. For this purpose it isusually desirable for the chains to be as highly oriented as possible, andin the ideal sample all chain axes would be parallel to the draw orstretching direction. Many polymers in practical use are oriented tosome degree, either intentionally, to improve the mechanical properties,or incidentally, during injection moulding, cold forming or otherprocesses. This latter type of orientation may lead to undesirabledistortions of the products when they are heated, because of relaxationof the orientation. Both intentional and incidental orientation are often
6.10 Molecular orientation 293
very far from complete and it is important to be able to characterize thedegree of orientation so that the properties of the products may be morefully understood and usefully modified.
A number of methods have been devised for studying orientation inpolymers. X-ray diffraction is often the preferred method for studying theorientations of crystallites, particularly if the degree of crystallinity ishigh, but it is quite difficult to obtain reliable information about theorientation of the non-crystalline chains from X-ray diffraction studies.Among the other available methods, infrared and Raman spectroscopiesusing polarized radiation are particularly important because they canpotentially give a great deal of information, about both crystalline andnon-crystalline chains, since measurements on any group mode can giveinformation specifically about the distribution of orientations of thecorresponding groups in the polymer.
Infrared spectroscopy provides the simpler method, but it cannot giveas much information about the distribution of orientations as Ramanspectroscopy because it involves only one beam of polarized radiationand the fraction of the radiation absorbed by a single molecule dependsonly on the orientation of the molecule with respect to the polarizationvector of the radiation. Raman scattering, in contrast, involves twobeams of radiation and the intensity scattered by a molecule depends onthe orientation of the molecule with respect to the polarization vectorsof both beams, which may be different. Suitable measurements ofscattered intensities can thus give more information about molecularorientation. In addition, infrared absorption measurements are usuallyrestricted to samples of thickness less than about 50 /im, because thickersamples are opaque to the infrared radiation, whereas Raman scatteringcan sometimes give good results on samples as thick as 1 cm. In the nextsubsection the theoretical background to the methods will be given andin subsection 6.10.3 some examples of their use.
6.10.2 Theoretical backgroundWe shall assume that the symmetry of the distribution of
orientations in the sample is such that a set of three mutuallyperpendicular axes OXYZ may be chosen within it so that rotating itthrough 180° about any one of them does not change the distribution oforientations with respect to a fixed observer. If the distribution isunchanged by rotation through any arbitrary angle around one of theseaxes, the sample is said to be uniaxially oriented, or transverselyisotropic, with respect to that axis; otherwise it is said to be biaxiallyoriented. These terms originate from crystal optics and are used becausethe optical properties of the samples are similar to those of uniaxial and
294 The microstructure of polymers
biaxial crystals, respectively. It is usual to label the unique direction of auniaxial sample OZ. We shall concentrate in detail on the simplest typeof uniaxial orientation and the information that can be obtained bymeans of infrared spectroscopy. A brief indication will then be given ofthe additional information which can be obtained if the samples arebiaxial or if Raman spectroscopy is used, or both.
We assume that the sample is made up of only one type, or possibly asmall number of different types, of structural unit and that the units ofany one type, such as a crystallite or a non-crystalline chain segment, areidentical. Each unit is imagined to have embedded within it a set of axesOxyz. In the simplest form of uniaxial orientation each type of unit has aspecial axis with the property that if this axis lies in a particular directionfor a typical unit, all orientations of units obtained by rotation aroundthat axis are equally represented in the distribution. If Oz is chosen tocoincide with this special axis we can then say that there is no preferredorientation of the structural units around their Oz axes. For this type ofuniaxial sample the distribution of orientations of a particular type ofunit can be described fully by a function N(6) such that N(6)d(omeasures the fraction of units for which the Oz axes lie within anyinfinitesimal solid angle dco at angle 6 to the OZ axis and2n JQ N(9) sin 6 dO = 1. The aim of orientation studies is to determine asmuch as possible about the form of N(6).
It is often convenient to expand the function N(6) in terms ofLegendre polynomials, as follows:
N{6)=hwhere, because of the orthogonality of the Legendre functions, it followsthat the coefficients ax are the averages, <Pj(cos 0)>, of the correspondingpolynomials P^cos 6) taken over the distribution of orientations. Fordistributions in which equal numbers of chains point in oppositedirections only even values of at are non-zero. The lowest values of ax arethen
a0 = 1 (6.6a)
a2 = <P2(cos 0)> = ^(3<cos2 6} - 1) (6.6b)
a4 = <P4(cos 0)> = i(3 - 30<cos2 6} + 35<cos4 0 » (6.6c)
Consider an infrared-active vibrational mode for which the oscillatingdipole moment /i of a particular unit makes the angle 0o with Oz and 6^with OZ, as shown in fig. 6.23. If infrared radiation, of the appropriatefrequency, polarized parallel to OZ falls normally on a sample in the
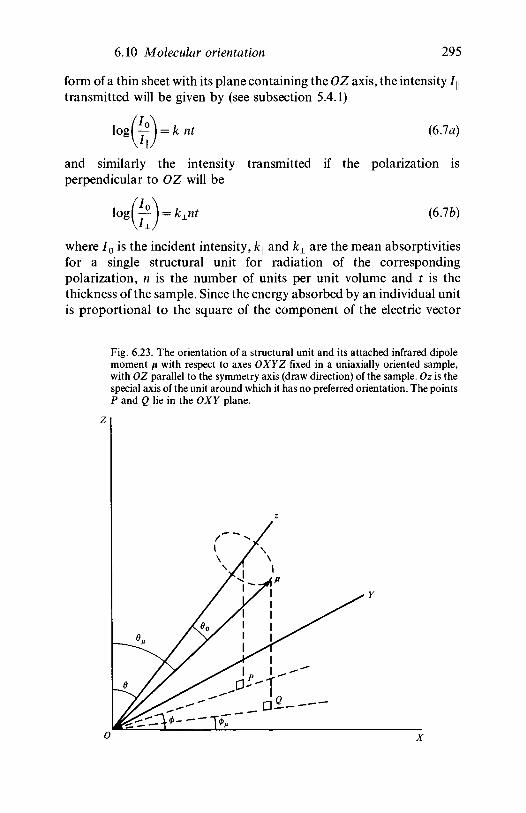
6.10 Molecular orientation 295
form of a thin sheet with its plane containing the OZ axis, the intensity / |transmitted will be given by (see subsection 5.4.1)
*•({;)-*.« (6.7a)
and similarly the intensity transmitted if the polarization isperpendicular to OZ will be
(6.7b)
where / 0 is the incident intensity, fc| and kL are the mean absorptivitiesfor a single structural unit for radiation of the correspondingpolarization, n is the number of units per unit volume and t is thethickness of the sample. Since the energy absorbed by an individual unitis proportional to the square of the component of the electric vector
Fig. 6.23. The orientation of a structural unit and its attached infrared dipolemoment \i with respect to axes OXYZ fixed in a uniaxially oriented sample,with OZ parallel to the symmetry axis (draw direction) of the sample. Oz is thespecial axis of the unit around which it has no preferred orientation. The pointsP and Q lie in the OXY plane.
296 The microstructure of polymers
parallel to the oscillating dipole moment, it follows that
fcn = 3/c<cos2 0M> (6.8a)
kL = 3/c<sin2 0M cos2 </>M> (6.8b)
where k is the mean absorptivity per structural unit for a randomlyoriented sample, for which < c o s 2 ^ > = 3 , and depends on thevibrational mode but not on the distribution of orientations. Because ofthe uniaxial nature of the sample, 0M takes random values,independently of 0M, and thus
/c± = |/c<sin20/x> (6.9)
Equations (6.8a) and (6.9) show immediately that
3/c = /c |+2/c1 (6.10)
and
It follows from equations (6.7) that
logl f I + 2 log! -± I = A,, + 2A± = nf(fc, + 2/c±)
= 3ntk = 3A (6.12)
lo<cos2 0^> = -?—-
logl — I H- 2 log! — 1
(6.13)Ay+2AL D + 2
where A^ and A± are the absorbances of the sample for radiationpolarized parallel and perpendicular, respectively, to the draw direction,OZ, and D is the dichroic ratio defined in section 4.2.1. The quantity A isthe absorbance of a randomly oriented sample with the same value of nt.
The average value of cos2 0̂ or, equivalently, <P2(COS ^)> *s ̂ e o n ' v
quantity related to molecular orientation which may be determineddirectly by means of infrared spectroscopy. It may be shown, however,that
<Pz(cos 0J> = <P,(cos 0)>Pf(cos 0o) (6.14)
6.10 Molecular orientation 297
for all /, so that if the angle 90 is known, a2 or <cos2 9} may bedetermined. Equation (6.12) shows that the quantity A^ + 2A± does notdepend on the distribution of orientations, but only on the nature of thevibrational mode and the number of structural units per unit area of thesheet, and can thus be used to follow changes in conformational contentwith orientation if the absorption mode is a conformationally sensitiveone.
For samples with more general distributions of orientations than thesimplest uniaxial type just considered it is possible to define a functionN(9, <j),il/)so that N(9,0, ij/) dco' measures the fraction of units orientedwithin the infinitesimal generalized unit solid angle dco' at 9, <j>, \j/, wherethe angle \j/ measures rotation around the Oz axis of the unit. Thisfunction may be expanded in terms of a set of generalized sphericalharmonics, of which the Legendre functions are the simplest type.Equations (6.8) are then replaced by three equations which relate theabsorptivities for radiation polarized parallel to OX, OY or OZ linearlyto the averages of four second order generalized spherical harmonics.The coefficients in these equations depend on the angles 90 and <f>0 whichspecify the orientation of the oscillatory dipole with respect to Oxyz.Equations (6.8) could have been written in a similar way by the use ofequations (6.6) and (6.14). It is therefore possible in principle, by makingabsorption measurements on more than one absorption peak for which90 and </>0 are known, to solve the resulting equations for the fourorientation averages.
Similarly, the intensities of Raman scattering from a sample with themost general type of biaxial orientation usually considered may beexpressed, for all possible combinations of polarization vectors ofincident and scattered radiation, as linear functions of the averages overthe distribution of orientations of the four second order and anadditional nine fourth order generalized spherical harmonic functions.The coefficients in these expressions are second order functions of theRaman tensor components referred to the symmetry axes of the unit.For the simplest type of uniaxial orientation the only non-zero averagesare <P2(cos 0)> and <P4(cos 0)> and if the ratios of the principal Ramantensor components and the orientation of the principal axes within thestructural unit are known it is possible to determine these two averages,or <cos2 6} and <cos4 0>. One of the difficulties of the Raman method isthat this information about the Raman tensor is not always available. Inaddition, for biaxially oriented samples it is not possible to determine allthe relevant averages from measurements on one mode and although, inprinciple, measurements on several Raman-active modes could becombined, this has not yet been satisfactorily done.
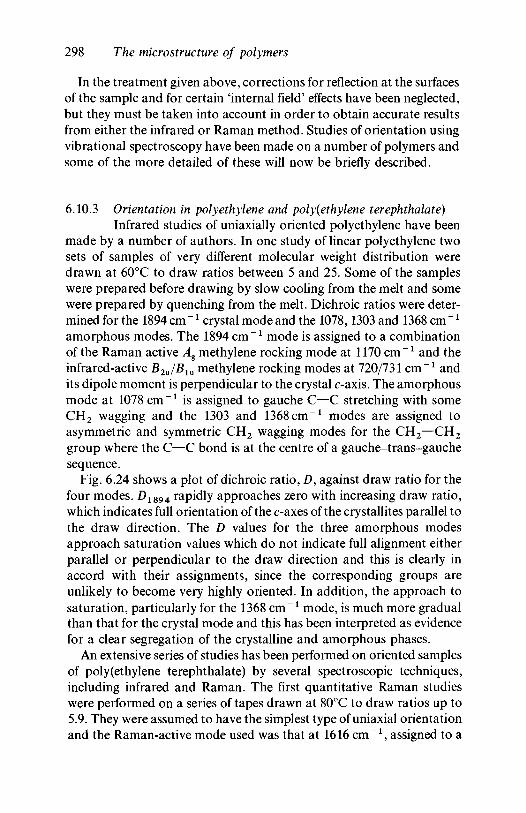
298 The micro structure of polymers
In the treatment given above, corrections for reflection at the surfacesof the sample and for certain 'internal field' effects have been neglected,but they must be taken into account in order to obtain accurate resultsfrom either the infrared or Raman method. Studies of orientation usingvibrational spectroscopy have been made on a number of polymers andsome of the more detailed of these will now be briefly described.
6.10.3 Orientation in polyethylene and polyethylene terephthalate)Infrared studies of uniaxially oriented polyethylene have been
made by a number of authors. In one study of linear polyethylene twosets of samples of very different molecular weight distribution weredrawn at 60°C to draw ratios between 5 and 25. Some of the sampleswere prepared before drawing by slow cooling from the melt and somewere prepared by quenching from the melt. Dichroic ratios were deter-mined for the 1894 cm "x crystal mode and the 1078,1303 and 1368 cm "x
amorphous modes. The 1894 cm"1 mode is assigned to a combinationof the Raman active Ag methylene rocking mode at 1170 cm"1 and theinfrared-active B2u/Blu methylene rocking modes at 720/731 cm"1 andits dipole moment is perpendicular to the crystal c-axis. The amorphousmode at 1078 cm"1 is assigned to gauche C—C stretching with someCH2 wagging and the 1303 and 1368 cm"1 modes are assigned toasymmetric and symmetric CH2 wagging modes for the CH2—CH2
group where the C—C bond is at the centre of a gauche-trans-gauchesequence.
Fig. 6.24 shows a plot of dichroic ratio, D, against draw ratio for thefour modes. D 1 8 9 4 rapidly approaches zero with increasing draw ratio,which indicates full orientation of the c-axes of the crystallites parallel tothe draw direction. The D values for the three amorphous modesapproach saturation values which do not indicate full alignment eitherparallel or perpendicular to the draw direction and this is clearly inaccord with their assignments, since the corresponding groups areunlikely to become very highly oriented. In addition, the approach tosaturation, particularly for the 1368 cm"1 mode, is much more gradualthan that for the crystal mode and this has been interpreted as evidencefor a clear segregation of the crystalline and amorphous phases.
An extensive series of studies has been performed on oriented samplesof poly(ethylene terephthalate) by several spectroscopic techniques,including infrared and Raman. The first quantitative Raman studieswere performed on a series of tapes drawn at 80°C to draw ratios up to5.9. They were assumed to have the simplest type of uniaxial orientationand the Raman-active mode used was that at 1616 cm " x , assigned to a
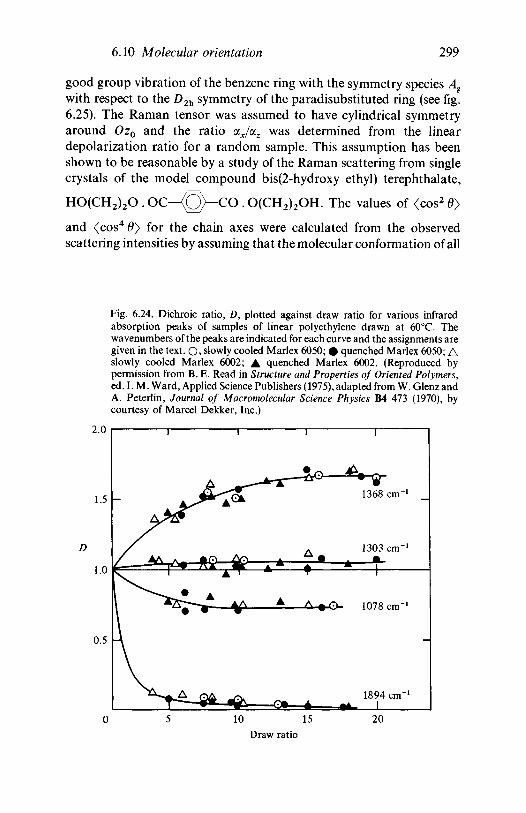
6.10 Molecular orientation 299
good group vibration of the benzene ring with the symmetry species Ag
with respect to the D2h symmetry of the paradisubstituted ring (see fig.6.25). The Raman tensor was assumed to have cylindrical symmetryaround Oz0 and the ratio ax/az was determined from the lineardepolarization ratio for a random sample. This assumption has beenshown to be reasonable by a study of the Raman scattering from singlecrystals of the model compound bis(2-hydroxy ethyl) terephthalate,
HO(CH2)2O . OC—<Q)-CO . O(CH2)2OH. The values of <cos2 6}
and <cos40> for the chain axes were calculated from the observedscattering intensities by assuming that the molecular conformation of all
Fig. 6.24. Dichroic ratio, D, plotted against draw ratio for various infraredabsorption peaks of samples of linear polyethylene drawn at 60°C. Thewavenumbers of the peaks are indicated for each curve and the assignments aregiven in the text. O» slowly cooled Marlex 6050; # quenched Marlex 6050; Aslowly cooled Marlex 6002; A quenched Marlex 6002. (Reproduced bypermission from B. E. Read in Structure and Properties of Oriented Polymers,ed. I. M. Ward, Applied Science Publishers (1975), adapted from W. Glenz andA. Peterlin, Journal of Macromolecular Science Physics B4 473 (1970), bycourtesy of Marcel Dekker, Inc.)
10 15
Draw ratio
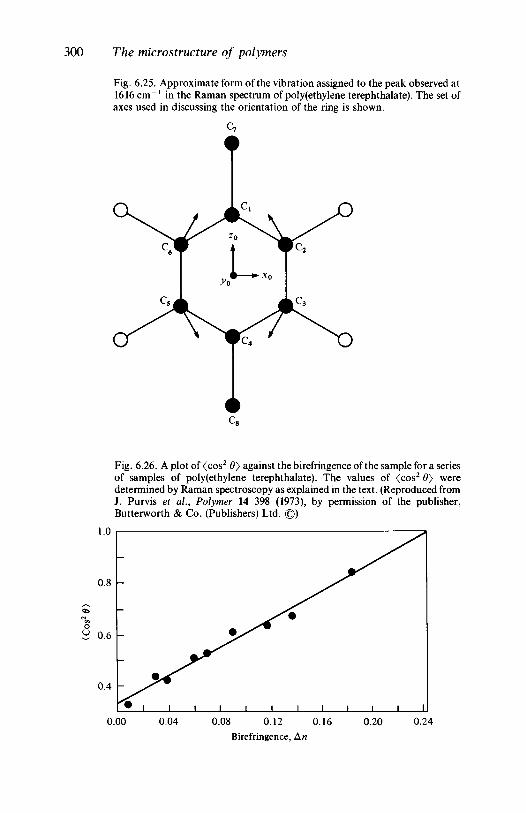
300 The microstructure of polymers
Fig. 6.25. Approximate form of the vibration assigned to the peak observed at1616 cm"1 in the Raman spectrum of poly(ethylene terephthalate). The set ofaxes used in discussing the orientation of the ring is shown.
Fig. 6.26. A plot of <cos2 6} against the birefringence of the sample for a seriesof samples of poly(ethylene terephthalate). The values of <cos2 6} weredetermined by Raman spectroscopy as explained in the text. (Reproduced fromJ. Purvis et al., Polymer 14 398 (1973), by permission of the publisher,Butterworth & Co. (Publishers) Ltd. ©)
0.4 -
0.00 0.04 0.08 0.12 0.16Birefringence, An
0.20 0.24
6.11 Further reading 301
chains in the polymer was similar to that in the crystalline regions exceptfor the possibility of gauche bonds in the —CH2—CH2— groups. Theresults were compared with the birefringences of the samples, i.e. thedifferences between the refractive indices for light polarized parallel andperpendicular to the draw direction, which may be shown to beapproximately equal to <P2(COS #)>Arcmax, where Anmax is thebirefringence of a fully oriented sample. A straight line resulted (see fig.6.26) which extrapolated to the value An = 0.24 at <cos 2#>=l, ingood agreement with the value for Arcmax calculated for a fully orientedsample from bond polarizability data. The points representing pairs ofvalues of <cos2 6} and <cos4 6} were also shown to lie close to curvesrelating them predicted by simple theoretical models for thedevelopment of molecular orientation in drawn polymers.
Later work showed that modes at 632, 857, 1286 and 1732 cm"1
could give information about molecular orientation in poly(ethyleneterephthalate) but that the interpretation of the results was notstraightforward. Subsequent Raman work has relied almost entirely onintensity measurements on the 1616 cm"1 mode and in one study theywere combined with infrared measurements on the 875 cm"1 mode ofthe paradisubstituted benzene ring, which is the out-of-plane bendingvibration of the C—H bonds in which all the H atoms move in phase. Itwas possible in this way to determine seven of the orientation averagesfor the benzene rings in a biaxially oriented sheet and the results showedclearly that the ring planes were preferentially oriented parallel to theplane of the sheet although the molecular chain axes were almostuniaxially oriented with respect to the draw direction. These resultsconfirm X-ray data which also show similar preferential orientation ofthe ring planes and they have been used in an attempt to understand thehigh degree of mechanical anisotropy of such biaxially oriented sheets.
6.11 Further readingThe following books and reviews, in addition to those referred
to in section 5.7, should be found particularly useful for further readingon the topics of this chapter: The Chemical Microstructure of PolymerChains by J. L. Koenig, Wiley, 1980; Infrared and Raman Spectroscopyof Polymers by H. W. Siesler and K. Holland-Moritz, Dekker, 1980;'Polymer Characterisation by Raman Spectroscopy' by D. L. Gerrardand W.F. Maddams in Applied Spectroscopy Reviews, 22(2-3) 251(1986); Biological Spectroscopy by I .D. Campbell and R. A. Dwek,Benjamin-Cummings, 1984; 'Determination of Molecular Orientation

302 The micro structure of polymers
by Spectroscopic Techniques' by I .M. Ward in Advances in PolymerScience 66 81 (1985).
A list of references to some of the more important papers on the topicscovered in this chapter and in chapter 5 is given on the following pages.References given in figure captions or in connection with tables may alsobe found useful.
References for chapters 5 and 6
The following are some specific references to topics in chapters 5 and 6. References given infigure captions or in connection with tables will also be found useful but they are notrepeated here.
5.2J. J. Fox and A. E. Martin, 'Investigations of infrared spectra. Determination of
C—H frequencies (~3000cm"1) in paraffins and olefins, with some observations on"polythenes"', Proc. Roy. Soc. A175 208-33 (1940).
M. C. Tobin, 'Selection rules for normal modes of chain molecules', J. Chem. Phys.23 891-6 (1955).
J. R. Nielsen and A. H. Woollett, 'Vibrational spectra of polyethylene and relatedsubstances', J. Chem. Phys. 26 1391-400 (1957).
C. Y. Liang, G. B. B. M. Sutherland and S. Krimm, 'Selection rules and frequenciesof the skeletal vibrations of long chain polymers in the crystalline state', J. Chem.Phys. 22 1468-9 (1954).
J. R. Nielsen and R. F. Holland, 'Dichroism and interpretation of the infrared bandsof oriented crystalline polyethylene', J. Mol. Spectroscopy 6 394-418 (1961).
R. G. Snyder and J. H. Schachtschneider, 'Vibrational analysis of the n-paraffins - 1 .Assignments of infrared bands in the spectra of C3H8 through n-C19H40 ' . ' . . . -II .Normal coordinate calculations', Spectrochim. Acta 19 85-116; 117-68 (1963).
R. G. Snyder, 'A revised assignment of the B2g methylene wagging fundamental of theplanar polyethylene chain', J. Mol. Spectroscopy 23 224-8 (1967).
J. Barnes and B. Fanconi, 'Critical review of vibrational data and force field constantsfor polyethylene', J. Phys. Chem. Ref. Data 1 1309-21 (1978).
S. Krimm and C. Y. Liang, 'Infrared spectra of high polymers. IV. Polyvinyl chloride,polyvinylidene chloride, and copolymers', J. Polymer Sci. 22 95-112 (1956).
W. H. Moore and W. Krimm, 'The vibrational spectrum of crystalline syndiotacticpoly(vinyl chloride), Makromol. Chemie Suppl. 1 491-506 (1975).
J. L. Koenig and F. J. Boerio, 'Raman scattering and band assignments in polytetra-fluoroethylene', J. Chem. Phys. 50 2823-9 (1969); 'Refinement of a valence forcefield for PTFE by a damped least squares method', J. Chem. Phys. 52 4826-9(1970).
C. Y. Liang and S. Krimm, 'Infrared spectra of high polymers. VI. Polystyrene', J.Polymer Sci. 27 241-54 (1958).
R. W. Snyder and P. C. Painter/Normal coordinate analysis of isotactic polystyrene:I. A force field for monosubstituted alkyl benzenes'; ' . . . II. The normal modes anddispersion curves of the polymer', Polymer 22 1629-32, 1633^1 (1981).
F. J. Boerio, S. K. Bahl and G. E. McGraw, 'Vibrational analysis of polyethyleneterephthalate and its deuterated derivatives', J. Polym. Sci.: Polym. Phys. 14 1092-46 (1976).
303
304 References for chapters 5 and 6
5.4J. G. Grasselli, M. A. S. Hazle, J. R. Mooney and M. Mehicic, 'Raman spectroscopy:
an update on industrial applications', Proc. 21st Colloq. Spectrosc. Int., Heyden,London, 1979, pp. 86-105.
R. S. Silas, J. Yates and V. Thornton, 'Determination of unsaturation distribution inpolybutadienes by infrared spectrometry', Anal. Chem. 31 529-32 (1959).
5.6G. Martinez, C. Mijangos, J. L. Millan, D. L. Gerrard and W. F. Maddams, 'Polyene
sequence distribution in degraded poly(vinyl chloride) as a function of the tacticity',Makromol. Chemie 180 2937^5 (1979).
D. L. Gerrard, W. F. Maddams and J. S. Shapiro, 'Influence of annealing on theformation of long polyenes during PVC degradation', Makromol. Chemie 185 1843-54 (1984).
6.1M. M. Coleman and J. Zarian, 'Fourier-transform infrared studies of polymer blends.
II. Poly(£-caprolactone)-poly(vinyl chloride) system', J. Polym. Sci.: Polym. Phys. 17837-50 (1979).
C. Tosi, P. Corradini, A. Valvassori and F. Ciampelli, 'Infrared determination ofsequence distributions and randomness in copolymers', J. Polym,. Sci. C 22 1085-92 (1969).
I. V. Kumpanenko and K. S. Kazanskii, 'Analysis of IR-band shapes in studies on themonomer sequence distribution in macromolecules', J. Polym. Sci. Symp. 42 973-80(1973).
M. Meeks and J. L. Koenig, 'Laser-Raman spectra of vinyl chloride-vinylidenechloride copolymers', J. Polym. Sci. A2 9 717-29 (1971).
6.2G. Natta, 'Precisely constructed polymers', Scientific American 205 No. 2 33—41
(1961).R. G. Snyder and J. H. Schactschneider, 'Valence force calculations of the vibrational
spectra of crystalline isotactic polypropylene and some deuterated polypropylenes',Spectrochim. Acta 20 853-69 (1964).
M. Peraldo and M. Cambini, 'Infrared spectra of syndiotactic polypropylene',Spectrochim. Acta 21 1509-25 (1965).
R. G. Snyder and J. H. Schactschneider, 'Valence force calculations of the vibrationalfrequencies of two forms of crystalline syndiotactic polypropylene', Spectrochim.Acta 21 1527-42 (1965).
6.3C. Baker and W. F. Maddams, 'Infrared spectroscopic studies on polyethylene. 1. The
measurement of low levels of chain branching', Makromol. Chemie 111 437-48(1976).
M. A. McRae and W. F. Maddams, 'Infrared spectroscopic studies on polyethylene.2. The characterisation of specific types of alkyl branches in low-branched ethylenepolymer and copolymers', Makromol. Chemie 111 449-59 (1976).
G. S. Park, 'Short chain branching in poly(vinyl chloride)', J. Vinyl Technol.(1985).
References for chapters 5 and 6 305
6.4S. Crawley and I. McNeill, 'Preparation and degradation of head-to-head PVC\ J.
Polym. Sci.: Polym., Chem. 16 2593-^06 (1978).
6.5C. Baker and W. F. Maddams, 'Infrared spectroscopic studies on polyethylene. 1. The
measurement of low levels of chain branching', Makromol. Chemie 111 437-48(1976).
M. A. McRae and W. F. Maddams, 'Infrared spectroscopic studies on polyethylene.3. The bromination of unsaturated groups', Makromol. Chemie 111 461-71 (1976).
W. F. Maddams, 'Spectroscopic studies on the characterisation of defects in themolecular structure of poly(vinyl chloride)', J. Vinyl TechnoL, 1 65-73 (1985).
6.6L. R. Schroeder and S. L. Cooper, 'Hydrogen bonding in polyamides', J. Appl. Phys.
47 4310-17 (1976).V. W. Srichatrapimuk and S. L. Cooper, 'Infrared thermal analysis of polyurethane
block polymers', J. Macromol. Sci. Phys. B 15 267-311 (1978).
6.7F. J. Boerio and J. L. Koenig, 'Raman scattering in crystalline polyethylene', J. Chem.
Phys. 52 3425-31(1970).M. Glotin and L. Mandelkern, 'A Raman spectroscopic study of the morphological
structure of the polyethylenes', Colloid and Polymer Sci. 260 182-92 (1982).M. E. R. Robinson, D. I. Bower and W. F. Maddams, 'Intermolecular forces and the
Raman spectrum of syndiotactic PVC, Polymer 17 355-7 (1976).W. Frank, H. Schmidt and W. Wulff, 'Complete temperature dependence of the far
infrared absorption spectrum of linear polyethylene from 14°K to the meltingpoint', J. Polym. Sci. Polym. Symp. 61 317-26 (1977).
J. F. Rabolt, 'Characterization of lattice disorder in the low temperature phase ofirradiated PTFE by vibrational spectroscopy', J. Polym. Sci.: Polym. Phys. 211797-805 (1983).
G. Zerbi, F. Ciampelli and V. Zamboni, 'Classification of crystallinity bands in theinfrared spectra of polymers', J. Polym. Sci. C 1 141-51 (1964).
6.9R. F. Schaufele and T. Shimanouchi, 'Longitudinal acoustic vibrations of finitepolymethylene chains', J. Chem. Phys. 47 3605-10 (1967).W. L. Peticolas, G. W. Hibler, J. L. Lippert, A. Peterlin and H. Olf, 'Raman
scattering from longitudinal acoustical vibrations of single crystals of polyethylene',Appl. Phys. Lett. 18 87-9 (1971).
B. Fanconi and J. F. Rabolt, 'The determination of longitudinal crystal moduli inpolymers by spectroscopic methods', J. Polym. Sci.: Polym. Phys. 23 1201-15 (1985).
6.10A. Cunningham, I. M. Ward, H. A. Willis and V. Zichy, 'An infrared spectroscopic
study of molecular orientation and conformational changes in poly(ethyleneterephthalate), Polymer 15 749-56 (1974).

306 References for chapters 5 and 6
D. I. Bower, 'Investigation of molecular orientation distributions by polarized Ramanscattering and polarized fluorescence', J. Polym. Sci.: Polym. Phys. 10 2135-53(1972).
D. I. Bower, D. A. Jarvis and I. M. Ward, 'Molecular orientation in biaxiallyoriented sheets of poly(ethylene terephthalate) I. Characterization of orientation andcomparison with models', J. Polym. Sci. B 24 1459-79 (1986).
A note on the use of the indexes
It is not possible to cite in the main index every occurrence of the use ofmany of the basic concepts introduced in chapters 1-4, and in generalonly selected examples have been given there. It is hoped that judicioususe of the specialised indexes, in conjunction with the main index, willenable others to be readily found. The following abbreviations have beenused in the indexes, in addition to more obvious ones:
ATR attenuated total reflection spectroscopyf.f. force fieldFTIR Fourier transform infrared spectroscopyH-bonding hydrogen bondingh-h head-to-headh.p. high pressureIR infrared spectroscopy or spectrumLA(M) longitudinal acoustic model.d. low densityPBD polybutadienePE polyethylenePED deuterated polyethylene; potential energy distributionPEH ordinary hydrogenated polyethylenePIB polyisobutenePMMA poly(methyl methacrylate)POM polyoxymethylenePP polypropylenePS polystyrenePTFE polytetrafluoroethylenePVC poly(vinyl chloride)PVDC poly(vinylidene chloride)R Raman spectroscopy or spectrumres. R resonance Raman spectroscopy or spectrum
307
Index of spectra illustrated
copolymer ofethylene and propylene
IR fig 6.2 232; various compositions, CH2 rocking region, 660-900cm"1
ethylene and vinyl acetateIR fig 6.1 230; v(C=O) region, 1690-1770cm"1, resolved into triads
normal paraffin C12H26
IR fig 5.2 170; 7OO-15OOcm"1, sample at -196°CNovolak resin IM184
IR fig 5.17 212; cast film, 400-3800cm"1
Nylon 6,6IR fig 5.18 213; cast film, 400-3700cm"1
polybutadieneIR fig 1.8 14; 1,2-polybutadiene, 65O-35OOcm~1
R fig 5.19c 220; 1600-1700 c m 1
polyethyleneIR and R fig 5.1 164; 400-4000cm"1
IR fig 5.13a 207; h.p. type, 400-4000cm"1, compared with PIB and PPIR fig 6.8 248; branched PE, methyl absorption region, 1200-1700cm"1
IR fig 6.10 253; Phillips, l.d. and Ziegler-Natta polymers, 800-1100cm"1
R fig 6.15 268; y,(CH2) doublet, 1290-1300cm"1, effect of temperatureIR fig 6.20 285; <5(CD2) region of mixed PED/PEH crystal, 1067-1104cm"1
R fig 6.22 289; LAM region, 8-30cm"1, effect of thermal historypoly(ethylene terephthalate)
IR fig 4.5 121; oriented sample, polarized spectra, 770-1070cm"1
IR and R fig 5.11 201; 200-3200cm"1, showing interference fringes in IRpolyisobutene
IR fig 5.13c 207; compared with PE and PP spectra, 400-4000cm"1
poly(methyl methacrylate)IR fig 5.15 209; cast film, 400-3700cm"1
IR fig 5.21 222; overtone region showing 6135cm"1 monomer peakpolypropylene
IR fig 5.13b 207; atactic, 400-4000cm"1, compared with h.p. PE and PIBIR fig 6.3 236; iso-, syndio- and atactic, polarized spectra, 700-1600cm"1
polystyreneIR and R fig 5.9 195; atactic sample, 400-4000cm"1
R fig 5.19a 220; 1500-1700cm"1, compared with sample toughened with PBDtoughened with polybutadieneR figs 5.19b 220; 1500-1700 cm"1, compared with pure PS spectrum
polytetrafluoroethyleneIR and R fig 5.7 189; 7O-15OOcm"1, polarized IR in region 35O-15OOcm~1
poly(vinyl acetate)IR fig 5.14 209; cast film, 400-3800cm"1
poly(vinyl chloride)IR and R fig 3.7 102; v(CCl) region, 540-720cm"1, correlation splittingIR and R fig 5.3 174; 400-3700cm"1, R spectrum shows 'fluorescence'res. R fig. 5.22 225; thermally degraded sample, 50-4000cm"1
IR fig 6.5 241; v(CCl) region, 590-720cm"1, samples polymerized at +50, -78°CR fig 6.7 243; v(CCl) region, 500-800cm"1, showing fitted Lorentzian peaks
308
Index of group modes 309
poly(vinylidene chloride)IR and R fig 5.6 183; single crystals and quenched sample, 5O-33OOcm~1
polyurethaneIR fig 6.12 260; v(NH) region, 3200-3600 cm" \ for £(CH2)8OCONH(CH2)6NHCOOJn
Index of point groupsCj 54, 66, 88, 118, 128-30, 201 D3 127Cs 54, 66, 88, 90-3, 118, 127, 178, 181-5 D6 96-7Cn 54, 62-3, 65-6, 88, 95-7, 127, 151 D9 271-3Cx 54, 88, 90, 93, 118 D13 187-94C2 88, 93, 95, 118, 182, 194, 276-7 D(12TC/13) 187-94C3 127, 199,235 Dnd 54C13 187-8 D2d 54, 107C(12TC/13) 187-9 D3d 120Cnh 54,62-3 Dnh 54,65C2h 88, 95, 103, 105, 118, 128-30, 169 D2h 54,66,77,84-8,90-3,95,100-6,107,Cnv 54, 65 118, 128-30, 154-6, 163-73, 265-7,C2v 72-3, 88, 90-3, 95, 100-1, 107, 110, 274-5, 276, 298-9
118, 127, 169, 174-9, 181-2, 195-8, 237 D4h 116-17C3v 55-6 D6h 128-30,197-8C4v 59-60,64,118-19 D^ 54,114C^ 54 Sn 54,62-3,65-6Dn 54, 63, 65, 88, 95-7, 127 S2 54D2 54,66,88,95-7,107,118,127,181-4, S6 54
235 ,271^ Td 55
Index of group modesSee, in addition, fig 4.9, p 133 and fig 5.12, p
204
amide I, II, III modes, 204,212^, 223,258backbone
see skeletal belowbenzene
for modes of benzene or modes involvinga substituted benzene ring, see mainindex: benzene
C—C stretchingin a terpolymer, 280in polyethylene, 298in polypropylene, 208, 235-8in poly(vinyl chloride), 226see also skeletal modes below
C = C stretchingin allyl alcohol, 218in ethylene, 77-8in polybutadiene, 218-9
C = C stretching (continued)in poly(vinyl chloride), 226, 255in unsaturated hydrocarbons, 206in unsaturated polyethylene, 254
C—C—C bendingin polypropylene, 237see also skeletal modes below
C—C—Cl bendingin poly(vinyl chloride), 275
C—(CH3) stretchingin polypropylene, 208, 237
C—C—O bendingin polyethylene terephthalate), 202-3
C—Cl bendingof —CC12— groups
in poly(vinylidene chloride), 186of lone CC1 groups
in poly(vinyl chloride), 176, 179, 240C—Cl2 rocking
in poly(vinylidene chloride), 186
310 Index of group modes
C—Cl stretchingin carbon tetrachloride, 149of —CC12— groups
in poly(vinylidene chloride), 181-5of lone CC1 groups
in poly(vinyl chloride), 102-3, 176,178-9, 240-5, 275
C—Cl2 twistingin poly(vinylidene chloride), 186
C—Cl waggingof —CC12— groups
in poly(vinylidene chloride), 186of lone CC1 groups
in poly (vinyl chloride), 176, 179CD2 bending
in deuterated polyethylene, 283-6CF2 bending
in polytetrafluoroethylene, 192-4CF2 rocking
in polytetrafluoroethylene, 194CF2 stretching
in polytetrafluoroethylene, 192-4CF2 twisting
in polytetrafluoroethylene, 192-4CF2 wagging
in polytetrafluoroethylene, 194C—H bending
of —CH2— groupsin polyethylene, 85-7, 154-5, 165-9,
173, 199, 266-8, 270-1, 283-6in poly(ethylene terephthalate), 239in polyoxymethylene, 274in polystyrene, 199in poly(vinyl chloride), 175, 177-8, 217
240in poly(vinylidene chloride), 186
of = C H 2 groupsin ethylene, 77-8
of CH3 groupsin polyethylene, 247-50in polyisobutene, 208in polypropylene, 207
of lone C—H groupsin polypropylene, 208, 235-8in polystyrene, 199in poly (vinyl chloride), 175, 177-8
= C H 2 out of plane deformationof vinylidene end group, 252-4
CH2 rockingin adipic and sebacic acids, 214in ethylene/propylene copolymers,
231-3in polyethylene, 85-7,155-8,165-9,171,
199, 206, 265-7, 269, 283-5, 298in polyoxymethylene, 274
CH2 rocking (continued)in polypropylene, 237in polystyrene, 199in poly(vinyl chloride), 175, 178in poly (vinylidene chloride), 186of ethyl branches in polyethylene, 250
(CH2)2 modesand trans/gauche isomerism in
polyethylene terephthalate), 239^0,278trans 1,4 polybutadiene, 278
in h-h poly(vinyl chloride) andpolypropylene, 251
CH3 rockingin polyethylene branches, 249, 252in polyisobutene, 208in polypropylene, 208, 237
C—H stretchingand early IR instruments, 23influence of nearby oxygen atom, 203in methane, 135, 149of —CH2— groups
in polyethylene, 85-7, 154-5, 165-7,173, 176, 199
in poly(ethylene terephthalate), 203in polyoxymethylene, 274in polystyrene, 199in poly (vinyl chloride), 175-7in poly (vinylidene chloride), 184-6
of = C H 2 groupsin ethylene, 77-8, 131-2
of CH3 groupsin polypropylene, 206-7
of lone CH groupsin poly (vinyl chloride), 175-7
CH2 twistingin polyethylene, 85-7,106,136-7,155-8,
165, 167-71, 206, 267, 271in polystyrene, 199in poly (vinyl chloride), 175, 178in poly (vinylidene chloride), 186
CH waggingof —CH2— groups in
polyethylene, 85-7,136-7,155,164-5,167-9, 171-3, 199, 247, 267, 269,271, 298
polyethylene terephthalate), 239polystyrene, 199poly(vinyl chloride), 175, 178poly (vinylidene chloride), 186
of lone CH groups inpoly(vinyl chloride), 175, 177-8
C—N stretchingin poly amides, 213
C = N stretchingin acrylonitrile copolymers, 218
Index of polymers 311
C—O stretchingin acetates, 208-9in acrylates, 210in aliphatic carbonates, 208in cellulose acetate, 208in poly(ethylene terephthalate),
202-3,210in polymethacrylates, 209-10in polyoxymethylene, 274in polyurethanes, 214in saturated esters/polyesters, 208-10in terephthalates, 202-3, 210
C = O rockingin poly(ethylene terephthalate), 202
C = O stretchingand hydrogen bonding, 259-64in aromatic polyesters, 210in biopolymers, 264in carbonyl compounds, 223in carboxylic acids, 223-4in cellulose acetate, 208in COO" ion 223-4in dilauryl thiodipropionate, 223in oxidised polyalkenes, 223-4in poly amides, 213in poly(e-caprolactone) blends 230-1in polyethylene terephthalate), 202-3,
301in poly(methyl methacrylate), 209in polyurethanes, 214, 259-61in poly (vinyl acetate), 229-30in saturated aldehydes, 224in saturated esters/polyesters, 202-3,
208-10, 301in saturated ketones, 224in vinyl acetate copolymers, 217,
229-30of acetate groups in polyoxymethylene,
255
C = O stretching (continued)variation of freq. with environment,
2 0 3 ^C = O wagging
in PET 202C—O—C bending
in polyethylene terephthalate), 202-3in polyoxymethylene, 274
C—O—C stretchingin an aliphatic ether, 212in polyurethanes, 214in resole resins, 212
N—H in-plane deformationin polyamides, 213
N—H stretchingand early IR instruments, 23and hydrogen bonding, 257-64in biopolymers, 262in Nylon 6, 6 and Nylon 10, 258in polyamides, 213, 257-8in polyurethanes, 258-61
O—H stretchingand early IR instruments, 23and hydrogen bonding, 257in novolak resins, 211-12in phenolic antioxidants, 222in resole resins, 212of end groups in polyoxymethylene, 255
out-of-plane deformationof unsaturated groups in polyethylene,
252^, 269vibrations in polybutadiene, 218-19
skeletal modes inpolyethylene, 85-7, 155, 165, 167-71,
173, 267polyisobutene, 208polypropylene, 208, 235-8poly(vinyl chloride), 176-9, 226
YX2 stretching vibrations, 166, 184
Index of polymersSee in addition table 5.10, p. 205, for apolymer classification scheme bycharacteristic infrared frequencies.
amino resins, 7
biopolymers, 3, 32, 213, 256, 262-4blends of polymers, 15-6, 214, 216
polybutadienes, 218-19poly(e-caprolactone) and PVC, 230-1
cellulose, 256
cellulose acetate, 208collagen, 262-4copolymers of
ethylene and 1-alkenes, 248ethylene and propylene, 231-3ethylene and vinyl acetate, 217-18,
229-30ethylene, propylene and
dicyclopentadiene, 280Nylons, 214styrene and acrylonitrile, 218
312 Index of polymers
copolymers of (continued)styrene and butadiene, 219vinyl chloride and vinyl acetate, 217vinyl chloride and vinylidene chloride,
233-4
DNA, 264
elastomers, 31epoxy resins, 255-6
gutta percha (trans 1,4-polyisoprene), 10
novolak resins, 210-12Nylons, 5-6, 212-14, 220-1, 257-8
perspex: see poly (methyl methacrylate)phenolic resins, 7, 210-12plexiglass; see poly (methyl methacrylate)polyacetates, 208-9polyacetylene, 4, 226polyacrylates, 208-10polyacrylonitrile, 3-4
see also copolymerspoly(alkylene oxide)s, LA modes, 292poly(alkylene sulphide)s, LA modes, 292polyamides, 5-6,204,212-14,220-1,257-8polybutadiene, 4, 218-19, 278, 292
see also copolymerspoly(butyl methacrylate), 210polycaprolactam (Nylon 6), 6, 214, 220-1poly(e-caprolactone), 230-1poly(decamethylene sebacate), 292polydicyclopentadiene, 280polydienes, 4, 10
see also individual polymerspoly(diethylene glycol bisallyl carbonate),
208polyenes, low MW, 226polyester polyurethanes, 6, 214-15, 259,
261polyesters, 5-6, 208-10, 214
see also individual polymerspolyether polyurethanes, 6,214-15,259-61polyethers, 4
see also individual polymerspolyethylene
additives, defects, end groups anddegradation, 11-12, 163, 167-8,172, 222-4, 246-50, 252-4, 269
chain dimensions, 187copolymers; see copolymerscross linking, 254, 269crystal structure and symmetry, 103-6,
166, 265crystallinity, morphology and chain
folding, 13, 156, 163, 246, 280-92deuterated, 136-7, 166, 267, 281-6
polyethylene (continued)discovery of, 166dispersion curves; finite chains, 154-8,
168-72, 192, 287, 290effects of crystallinity in, 103-6, 156-7,
163, 166-8, 171, 173, 231, 247,265-71, 276, 281-6, 298
longitudinal acoustic mode, 34, 286-92model compounds, 157, 166-73, 247-8,
269molten, 166, 271non-crystalline chains, 166, 168, 172,
247, 269, 271orientation, 166-7, 172, 266, 269, 290,
298-9overtones and combinations, 163,167-8,
170, 222, 267perfect single chain, 81-91, 154-6,
163-73polymerization and types, 3,172, 246-7,
249, 250, 252-4sample thickness for IR, 29single crystal texture, 172-3single crystals, 13, 280-6, 288, 291-2vibrational calculations, 154, 166-8,
170-2, 267, 276poly(ethyl methacrylate), 210poly(ethylene adipate), 214polyethylene oxide), 214, 292poly(ethylene terephthalate), 7
assignments and recognition, 200-3,210model compounds, 134, 202-3, 240, 299orientation, 121, 240, 298-301polymerization; structure; symmetry, 6,
128, 200-1rotational isomerism and amorphous
regions, 11,202-3,239-40,278,299vibrational calculations, 203
polyisobutene, 207-8polyisoprene, 4, 10polymethacrylates, 208-10poly(methyl acrylate), 210polymethylene, 247
see also polyethylenepoly(methyl methacrylate), 4, 13, 29,
208-10,221-2poly(a-methyl styrene), 4polyoxymethylene, 4,252,255,271^, 279,
292polypeptides, group frequencies, 213polypropylene, 3-4
additives, defects, end groups anddegradation, 223-4, 251, 254
conflgurational isomerism andspectrum, 234-8
copolymers; see copolymers
Main index 313
polypropylene (continued)group frequency approach, 206-8polymerization, 3-4, 234structure and symmetry, 3-4,231,234-5,
279vibrational calculations, 208, 235, 237
poly(propylene oxide), 214, 233polyribo-adenylic acid, 264polyribo-uridylic acid, 264polystyrene, 3-4,31,194-200,218-20,251,
292see also copolymers
polyterephthalates, 210see also poly(ethylene terephthalate)
polytetrafluoroethylene, 4, 185-94, 276-8,292
polytetrahydrofuran, 259, 261, 292poly(tetramethylene adipate), 261polythene, see polyethylenepolyurethanes, 5-6, 206, 214-15, 258-62poly(vinyl acetate), 3 ^ , 208-9, 230
see also copolymerspoly(vinyl alcohol), crystallinity, 280poly(vinyl chloride)
blend with poly(6-caprolactone), 230-1copolymers; see copolymersdefects, end groups and degradation,
224-6, 246, 250-1, 255, 279deuterated, 173, 177-8, 240
poly(vinyl chloride) (continued)effects of crystallinity, 100-3, 274-5isomerism, amorphous regions and
spectrum, 10, 134, 179, 239, 240-5,275
models for, 134, 240-2spectral assignment of, 173-80structure/symmetry, 3 ^ , 100-3, 128,
174syndiotactic, 100-3, 274-5
factor group modes of cry St., 100-3from urea clathrate, 179, 240, 275
vibrational calculations, 173,177-9,240,275
poly(vinyl fluoride), 8poly(vinylidene chloride), 4, 180—6
see also copolymerspoly(vinylidene fluoride), 8
resole resins, 210-12Rigidex9, 247rubber, natural (cis 1,4-polyisoprene), 10
vinyl polymers, 3-4, 8-10, 16symmetry and vibrational modes, 89-93symmetry and selection rules, 126-8see also individual polymers
vinylidene polymers, 3-4, 8-9see also individual polymers
Main indexabsorbance, infrared
definition, 20determination, 23, 26for oriented samples, 296ratios in analysis, 217-18, 247, 256, 269
absorption coefficient, 20,215,218-19,248absorptivity, molar, 215, 259-60acceptor group, in H-bonding, 256,259-60acetate end groups in POM, 255acetylacetone, 202acetylene, 4, 227acoustic modes: see modes, acousticactivated species, 3activity, spectral, 2, 65, 8 1 ^ , 100-1,105-6
and crystal field, 98-100, 105-6, 265for model 'polymer' chain, 154see also selection rules
addition polymerization,3-4, 8additives, 219-20, 222-3adipic acid, 5, 214
adjacent re-entry, 13, 280-6aldehydes as oxidation products, 224aliphatic alcohols, 214aliphatic amides, 223aliphatic carbonates, 208aliphatic polyesters, 214alkanes; see paraffin1-alkenes, 246, 248, 252alkyl benzenes, 200alkyl chlorides; see chloridesallyl alcohol, 218allyl chloride, 227allylic chlorine group, 224,255amide group/linkage, 5-6, 204, 212-14,
223, 256-8amino resins, 7ammonia molecule, symmetry of, 55, 65amorphous regions; see non-crystalline
regionsamplitude of vibration, 85, 139, 221
314 Main index
analysischemical, 218spectroscopic, 15-16, 133
qualitative, 162, 203-15quantitative, 215-26, 242, 247, 252-6
angular momentum, 74-5anharmonic vibrations, 136, 158-61, 221anisotropy
of tensor, 1 2 3 ^see also orientation
annealing and lamellar thickness, 288,290antioxidants, 220, 222antisymmetric species, 52, 65-6, 74antisymmetric stretching modes, 46, 74-5,
275see also index of group modes
application of known assignments, 162various applications, 215, 301
areas under peaks, 229-30, 242, 271, 275aromatic isocyanates, 214-15
see also benzeneassignment, 162
for various polymers, 163-203meaning and methods, 122,125-38,149,
292associative law and group elements, 53asymmetric carbon atom, 233asymmetric peaks, 161, 229atactic polymer, definition, 8atomic radius, 8, 181atomic structure and nucleus, 42-4ATR, attenuated total reflection, 20, 30-1axes
choice of orientationand symmetry species designation, 66,
74,81,85-6,92-3,100,103,237,271within structural unit, 294
symmetry, definitions and types, 47-52,65, 81, 93
axial glide; see glide, axialaxial point group, 54, 65, 118-20
back-biting, 12, 254basis for representation, 58-63, 67, 70, 77,
117-19Beer's law; see Lambert-Beer lawbending; see modes, bending; index of
group modesbenzene, 128
fundamental and symmetry modes,195-8
ringmonosubstituted, 195-200paradisubstituted, 128, 201-2
see also: phenolic resins; polyesters;polystyrene; polyurethanes in indexof polymers
biaxial orientation, 266, 293, 301binding energy of molecule, 42biopolymers, 3, 32, 213, 256, 262-^birefringence, 300-1bis(2-hydroxy ethyl) terephthalate, 299blends (of polymers), 15-16, 216,
219, 230-1blowing, 223Boltzmann factor, 113bond
angle, 1, 75-7, 147-8, 181-2chemical, nature of, 1, 42dipole, 109-11, 265-6double
and cis/trans isomerism, 10and end groups or defects, 227, 252-5and resonance Raman, 224-6in monomers, 4, 221
electrostatic; see hydrogen bond(ing)hydrogen; see hydrogen bond(ing)length, 76, 147-8rotation around and trans/gauche, 9-10
bonding, tetrahedral, 8, 47Born's cyclic boundary conditions, 150borrowing of intensity, 197branch/branching
and degradation in PVC, 224, 246as defect structure, 8, 11effect on
crystallinity, 246longitudinal acoustic mode, 288
mechanism for, 11-12studied by spectroscopy, 246-50see also methyl group(s)
breathing mode of methane, 135bridged structures, 7, 210broadening of peaks
asymmetric, 161, 229in copolymer, 229, 233in the melt, 279involving non-factor group modes, 161see also width of peaks
bromination of polymers, 252-51,4-butanediol in polyurethanes, 259
calculation of frequencies; see vibrationalcalculations
calibrationfor analysis, 247, 252, 255for crystallinity determination, 280
caprolactam, 6, 220-1carbamate groups, 214carbon
dioxide, normal modes, 45-6disulphide, 218, 223tetrachloride, 47-8, 149, 221
Main index 315
carbonyl compounds/group, 202-3, 223and hydrogen bonding, 256, 259-64see also C = O in index of group modes
carboxylic acids, 223-4casting of samples, 29catalyst, 233, 234, 246, 254cellulose, 256cellulose acetate, 208central force field; see force fieldcentre of inversion, 49centrosymmetric molecule, 81-9, 114-16,
200-1chain
folding, 13, 280-6, 288, 291transfer during polymerization, 12terminating groups; see end groupsnumber per unit cell, 98-106, 264-5; see
also splitting, correlationregular, 7, 15, 80-96; see also: order;
isolated regular chaincharacter
of a representation matrix, 63-5contribution of each atom, 71-2, 84
table, 64^7, 72-3,79,84-5,109,118,168chemical analysis, 218chemical repeat unit, 2, 15, 81, 95chirality, 94^5chlorides, secondary
as models for PVC, 134, 240-2as models for PVDC, 185force constants, 173^, 185
chlorine atom, diameter, 181chloromethyl branches in PVC, 227, 250chloroparaffins
2-chlorobutane, 174, 2422-chloropropane, 241see also chlorides
chromatography, 30, 220CH3 group; see methyl groupCH4 (methane), 135, 149cis configuration/conformation, 10-12,
class of operation, 64^5, 71, 72, 95coatings, 20, 31, 36collagen and hydrogen bonding, 262-4coloured samples, 33column matrix; see matrix, columncomb, in dispersive, IR, 23combination; see overtone/combination
frequenciescombination rule in group theory, 53-6, 57commutation of elements/operators, 53,56complex eigenvectors, 63, 143, 150-1, 154complex matrices, 62-3, 119, 143composite material, 258computers and IR, 21, 26-7, 247, 255
concentration; see analysiscondensation reactions, 5-7, 214configuration; see isomer/isomerismconformation; see isomer/isomerismconformer; see isomer/isomerism,
conformationalconjugated double bonds, 224-6convolution, 40-1cooling; see temperaturecoordinates
Cartesian, 67-8, 138-9, 152complex, 63, 143for helical molecule, 150-1generalized, 139-41internal, 76-7, 139, 146-8internal symmetry, 77, 130-1, 146mass weighted, 69, 141normal, 69-70, 75, 111-14, 142-3, 145rotational and translational, 146symmetry, 74^8, 139, 145-6, 178
copolymeranalysis, 16, 216-19, 227-31and crystallization, 227and polymerization mechanisms, 227-8block, 217, 228, 258definition, 2, 8distribution of units, 227, 229-34interactions in, 217, 228-31random, 217, 228-9, 231segmented block, 258see also index of polymers
correlationsplitting; see splittingtables for descent in symmetry, 92
coupled oscillators, 1, 156, 168, 192coupling of group vibrations, 133, 154
see also mixingcross-linking, 7, 210-12, 218,254,256,
269crystal
field; see field, crystalsize and spectrum, 156-7structure
hexagonal, 271monoclinic, 276orthorhombic, 100, 103, 265, 271spectroscopic study of, 99, 264, 276-8
crystallinityand isomerism, 234, 240, 250, 278and order, 278-80degree of, 163, 246, 275determination of degree of by
density measurement, 269, 279-80spectroscopy, 264, 269-71, 275,
278-80X-ray diffraction, 269, 279-80
316 Main index
crystallinity (continued)effects on
properties, 13, 234spectrum, 97-106, 126, 166-7, 264-80;
see also splitting, correlation; field,crystal
peaks, 278-9crystallization
and polymer morphology, 12-13effect of branching on, 246in copolymers, 227, 231
crystallitesdimensions of, 13-14, 270, 280, 288lamellar, 13-14, 270, 280-6, 288-92
crystalsand regular chains, 15, 80single, 13-14, 266, 280-1, 288, 291vibrational modes and activity, 17,
97-106, 113, 156-7,264-5cubic groups and symmetry, 55,66, 125cubic terms in potential energy, 159, 161curing of resins, 210, 256curve fitting, 39-40, 215, 229-30, 240-3,
261, 275, 285-6, 289cyclic boundary conditions, 150cyclohexane, 257
damping, 225-6data processing and IR, 26-7, 247, 255deconvolution, 40-1defect structure(s), 8
and copolymerization, 227effect on LAM, 288, 290-1quantitative information on, 217see also: branch/branching; end groups;
isomer/isomerismdegeneracy
accidental, 58, 161lifting/loss of, 265,272; see also splitting,
crystal fielddegenerate modes; see modes, degeneratedegradation, 223-7, 246, 251, 252, 255,
279degrees of freedom, 44denaturation of proteins, 262—4density and crystallinity, 269, 279-80depolarized Raman peaks, 125, 180depolarization ratio, 123-5, 299derivative spectra, 40descent in symmetry, 89-93, 99, 105detectors
for IR spectroscopy, 27-8for Raman spectroscopy, 35-6, 167
deuterated polymerspolyethylene, 136-7, 166, 267, 281-6other polymers, 173,177-8,199,202,240
deuterium substitution, 135-7di-phenyl methane-4,4'-di-isocyanate, 214diagonal glide, 104diagonal matrix, 61, 70; see also matrixdiagonal plane, 49diatomic molecule, 42-4, 49dibutyl tin dilaurate, 224a,co-dichloroalkanes, spectra, 172dichroism/dichroic ratio, 120-2, 296,
298-9see also polarization
differencefrequency, 161; see also
overtone/combination frequenciesspectroscopy, 39,221,223,224,247,253,
255diffraction, electron, 13, 277diffraction grating, 17, 24, 34-5, 288dihedral axis/plane, definitions, 49dihydroxyethylene terephthalate, 202dilauryl thiodipropionate, 223dimethyl terephthalate, 6, 202dimethylhexatetracontane, 247diphenylmethane di-isocyanate, 214, 259dipole (moment), electric, 107-12
addition and IR, 110-11, 175, 265-6and IR selection rule, 109-11and orientation studies, 294of bond or segment, 109-11, 121, 265-6
direct product group, 66direction cosines, 108, 123disorder, spatial, 265disordered structures and group modes, 15,
206dispersion curves, 150-8
for model 'polymer' system, 152-4for PE,154-8,168-72,191-2,287,290-1for PTFE, 192-4, 277non-crossing and repulsion, 154-6
dispersive spectrometers, 21-4, 34-6distearone, 224distortion of oriented samples, 292distribution
of lamellar thicknesses, 289, 291-2of orientations of units, 293-301
DNA, 264donor group, in H-bonding, 258double bond; see bond, doubledouble helix of DNA, 264drawing (stretching), 120, 240, 242, 273,
292, 298, 301dynamic studies, 27, 36
eigenvector (s)and symmetry, 47, 52-3, 70, 74and vibrational calculations, 138-45
Main index 317
eigenvectors (continued)as sum over symmetry mode vectors,
74-5, 145assignment to, 125, 130, 134approximate, symbols for, 85, 163complex, 63, 143, 150-1, 154definition, 45-7for degenerate modes, 46, 57-63, 70for modes in crystals, 98-9, 103, 265-6,
268for PE 171normalization, 69, 142-3orthogonality of, 69, 141-3
elastic rod model and LAM, 287, 291elastomers and ATR, 31electric dipole; see dipoleelectric field; see fieldelectromagnetic spectrum, 17-18electron diffraction, 13, 277electron microscopy, 280-1electron volt, definition, 18electronegative atom, 256electronic states/transitions, 43, 44, 224-5electrostatic bond; see hydrogen bond(ing)element of group, 53elevated temperatures, 160-1
see also temperatureend groups
as defect structures, 8concentration by spectroscopy, 251-6effects on modes and activity, 156-7in various polymers, 224, 251-6, 269see also methyl group(s)
energykinetic, 42, 140-3levels, 17-18, 112-13, 159-60of isomeric forms, 10, 13, 239, 278potential, 42-5, 52-3, 140, 142-4, 158-9
distribution (PED), 144, 175-9thermal, 18
enthalpy and protein stability, 262entropy and protein stability, 262environment and group frequency, 203environmental health, 219epoxy resins, 255-6equations of motion, 45, 58, 74, 138, 140,
152equilibrium, thermal, 113esterification reaction, 5-6esters, saturated, 208-10; see also
polyesters in index of polymersethanol, 257ether bridges in phenolic resins, 7, 210ether linkage in polyurethanes, 214ethers, cyclic, polymerization of, 4
ethylene, vibrational modes, 77-8, 131-2ethylene dibenzoate, 240ethylene glycol, 6, 128excited states, 113external modes; see mode(s), externalextinction coefficient, definition, 215extrusion, 223
F matrix, 139-48factor group; see: group, factor; mode(s),
factor groupanalysis for various polymers, 81-93,
100-6, 163-203, 235-8, 271-3far infrared region, definition, 17Fellgett advantage in FTIR, 26Fermi resonance, 161, 167-8, 267-9fibres and Raman spectroscopy, 37field
crystal, 53, 98-9, 100, 105-6electric, 295-6
and induced dipoles, 107-12internal, 298
films as samples for IR, 28-30'finger print', spectrum as, 162finite chains, vibrations of, 156-8fitting of spectra; see curve fitting'fluorescence' and Raman spectra, 32, 37,
174 (fig 5.3)fluorine atom, radius, 8folding of chains, 13-14, 280-6, 288, 291force constant(s), 44-5, 76-8, 134, 135,
138-50, 152-4derived from small molecules, 148-9,
154, 167, 171-2, 173-4, 184-5, 200for non-bonded atom interactions, 148interaction force constants, 148no. of independent, 146, 148refinement of, 149-50transferabilty of, 148-9
force field, 146-50central and general central, 147for hydrocarbons, 171, 200for monosubstituted alkyl benzenes, 200intermolecular, 264, 275Urey-Bradley-Shimanouchi, 148, 154valence/simple valence, 148-9, 171,
184-5forces
interatomic, 42-5, 52, 76-8, 80, 98-9,136, 148, 267; see also force field
interlamellar, 290intermolecular, 80, 98-9, 265, 267, 275;
see also splitting, correlationvan der Waals, 8, 148, 262
formic acid as solvent for Nylon 6, 221
318 Main index
Fourierseries, 159transform, 26transform IR, 24-7, 255
free energy, 10, 13, 239freedom, degrees of, 44frequency
angular, 62-3, 138, 152-4of electromagnetic wave, 17of modulation in FTIR spectroscopy, 26,
28range for normal modes, 17
frequency-phase-difference curves; seedispersion curves
frequency/structure correlations, 203see also mode(s), group
fringes, interference, 201 (fig 5.11)FTIR; see Fourier transform IRfundamental frequencies of unit cell, 170fundamental frequencies/modes for various
polymers, 163-203fundamental frequency, 136, 158-61fundamental LAM, 286-8
g (gerade) species defined, 66G matrix, 139-46gamma-irradiation, 254, 269, 277gauche; see isomer/isomerismGaussian line shape, 39, 261generalized coordinates, 139-41generalized position, 58, 67-76generating operations, 55genuine normal mode, 44,74,77,84-5,146geometry, molecular, 58, 134, 135Gibbs free energy, 10, 13, 239glasses, polymeric, 13glide
plane, 81, 100, 152axial, 81, 104diagonal, 104
glycols, 5-6, 128ground state, 113, 159-61group
axial point, 54, 65crystal space, 97-9, 100, 103, 166, 272,
276direct product, 66factor
and local symmetry, 126-31for helix, 95, 151of line group, 80, 84, 91, 98-9, 151of site group, 103, 105of space group, 97-9see also factor group
frequency; see mode(s), grouphomomorphous, 56-7
group (continued)isomorphous; see isomorphous groupsline, 83, 151, 167; see also factor abovemathematical, definition, 53mode; see mode(s), group; for specific
types see index of group modesmultiplication table, 55-6, 60, 84point, 53-6, 84, 85, 89pseudo-factor, 151representation; see representationsite, 103, 105space, 97-9, 100, 103, 166, 272, 276theory, 52, 53-74, 79vibration; see mode(s), group
gutta percha, 10
halo-alkanes, 172, 239see also chlorides
hard segment, 258-62harmonic approximation, 44-5, 158harmonic functions, 159harmonic oscillator, 1, 43-5, 112-13harmonic vibrations, 136harmonic wave, 17head-to-head/tail addition, 8,231-3,250-1health, environmental, 219heat treatment, 126
see also annealing and lamellar thicknesshelical molecules
biopolymers, 262-4CF3(CF2)12CF3> 194symmetry and normal modes, 93-7,
150-2various polymers, 10, 154, 185-94, 199,
234, 235, 271, 276-7, 279hexadecane, 269hexagonal unit cell, POM, 271hexamethylene diamine, 6hexamine, in novolak resins, 2111-hexene, 246highly symmetric molecules, 206hindrance, steric, 4, 8homomorphous groups, 56-7homopolymer, definition, 2horizontal mirror plane, definition, 49hot bands, 160-1hydrocarbons, force constants, 154, 200
see also paraffinhydrochlorides, 214hydrogen bond(ing), 222, 256-64
in biopolymers, 262-4in polyamides, 257-8in polyurethanes, 258-62temperature dependence, 257-8, 261
hydrogen chloride, 224hydrolysis of Nylons, 214
Main index 319
hydroperoxides, 223hydroxyl group, 222, 256-7, 262
see also index of group modes, OH
icosahedral group/symmetry, 55, 66, 125identification; see analysisidentity
element of group, 53-5operation, definition, 49period, 185-7; see also translational
periodrepresentation, 57, 65, 117-18
impact strength, 227improper rotation, definition, 48inclusions, study by Raman, 32, 36, 254infinite chain, modes of, 15, 80-97infrared
absorption mechanism, 109frequency range, 17selection rules, 107, 109-11
inhomogeneity, study by Raman, 254initiation site for degradation, 224initiation step in polymerization, 3instrumental line shape, 40intensity ratios in Raman, 32,216,219,268interaction force constants; see force
constantsinteractions
between repeat units, 15, 199, see alsocoupled oscillators
see also forcesinteratomic distances, non-bonded atoms,
148interatomic forces; see forces, interatomicinterchain interaction; see intermodular
forcesinterference fringes, 201 (fig 5.11)interferogram, 26interferometer, Michelson, 24-7intermolecular forces; see forces
in various polymers, 163, 239, 274, 277,281
see also hydrogen bond(ing)internal coordinates; see coordinatesinternal field, 298internal mode, 98-9, 131internal standard, 32, 256, 269, 271interpretation of polymer spectra, 162
for various polymers, 163-215intramolecular bonding, 256invariant, of tensor, 124inverse
of group element or operator, 55of block matrix, 146
inversion, centre of, definition, 49irradiation wth X- or y-rays, 254, 269, 277
isobutane, 171isocyanurate ring, 206isolated regular chain, 80-99, 150-6
examples, 163-203, 234-8, 271-4isomer/isomerism
cis/trans, definition, 10configurational/conformational, 8-11
and determ. of crystallinity, 278and group vibrations, 133characterization of, 234-45, 297config., examples, 179, 218-19, 275conform., examples, 179, 200-3, 275,
278, 298-9trans/gauche, definition, 10; see also
conformational abovesequence; see head-to-head/tail addition
isomorphous groups, 56-7examples, 84, 89, 91-2, 95, 97, 99, 100,
103, 127, 271, 272; see also section5.2
isotactic chain, definition, 8-9isotope substitution, 134-7
see also deuterated polymersiteration, 149-50
Jacquinot advantage in FTIR, 27
ketones, 202, 224kinetic energy, 42, 140-3KRS5, 29
LAM, 34, 286-92/ and d sequence distribution, 233Lagrange's equation of motion, 140Lambert-Beer law/equation, 215, 217lamellar crystals, 13, 270, 280-6, 288-92laser
for IR spectroscopy, 21for Raman spectroscopy, 18, 33-4, 36-7,
124for resonance Raman, 226
lattice modes, 17, 98-9, 113, 131, 265,276-7
least squares fit, 171Legendre polynomials, 294-7, 301librational modes, 98-9, 277light, velocity of, 17light scattering; see scatteringline group; see group, linelinear molecule, 44, 46, 114-15linear momentum, 74-5line shape, 39-41
see also shape of peak
320 Main index
linkages, amide, ester, urethane, 5, 258see also: amide group; esters; urethane
groupliquid cell, 217liquid nitrogen, 157, 286liquid paraffinic hydrocabon, 269local symmetry, 126-31, 194-200, 200-3lone CH group, 179, 199
see also index of group modeslongitudinal acoustic modes, 34, 286-92Lorentzian line shape, 39-41, 243low frequency modes, 17, 160, 276-7low temperature, 276-7
macroconformations and morphology, 12maleic anhydride, 6mass
reduced, 135, 137spectrometry, 220weighted coordinates, 69, 141
mathematical techniques, 38-41matrix effects on vibrations, 229-30matrix (mathematical), 79
character of; see charactercolumn, 58-62,67-9,108,139-45,150-1complex, 62-3, 119, 143, 150-1diagonal, 61diagonal block, 70, 145-6of direction cosines, 123of force constants, 139-50representation
of group elements, 57of operator, 57-63of tensor, 108
Wilson G and F, 139^18mats of single crystals, 291mechanical properties, 227,234,246,292,301melamine and amino resins, 7melt crystallization, 13, 280-6, 291member of group, 53, 55methane, 135, 149methanol, 223methyl acetate, 202methyl group(s), 172, 246
as end groupsin paraffins, 156, 172in PE, 167, 168, 250, 252
in/as branches, 167, 207-8, 246-50, 252methyl laurate, spectrum, 172methyl methacrylate in PMMA, 221-2methylene
bridges in phenolic resins, 210ether group in phenolic resins, 210-12group, definition, 81sequences, as branches in PE, 246see also index of group frequencies
methylol group, 7, 212Michelson interferometer, 24-7microconformations and morphology, 13microscope and Raman spectroscopy, 36microstructure of copolymers, 227-34microtome, for preparing IR samples, 30mirror plane, definition, 47-9
influence on dispersion curves, 154-6mixed crystals of PED and PEH, 281-6mixing or coupling of symmetry or group
modes in various polymers, 133,154, 156, 168, 171, 175, 177, 185,192,194, 197, 200, 202-3, 206, 208,212-13
mixtures of polymers; see blends (ofpolymers)
mode(s){for specific group modes, see index of
group modes)acoustic, 17, 153-4, 157, 161
longitudinal acoustic, 34, 286-92bending, 74^8, 110, 115breathing, methane, 135conformationally-sensitive, 200,239-45,
297degenerate, 57-65, 69, 70, 98
accidental degeneracy, 58defn. of symmetry determined, 45, 58eigenvectors for, 46-7, 58-63for helical molecules, 96-7overtones and combinations of, 160Raman tensors for, 119-20with 1-dim. representations, 62-3see also splitting, crystal field
external, 77, 98-9factor group
for helix, 95-7, 151for model 'polymer' system, 153of crystal space group, 97-9,100,103,
105of line group of isolated regular chain,
80-9see also main heading 'factor group'
genuine normal, 44, 74, 77, 84-5, 146group, 15, 131-3, 137, 203-15
and orientation, 133, 293interaction in copolymers, 229symbols for simple named types, 85-7see also mixing
internal, 98-9, 131lattice, 17, 98-9, 113, 131, 161, 265,
276-7librational, 98-9, 277low frequency, 17, 160, 276-7
non-factor group, 150-8, 161, 206; seealso dispersion curves
Main index 321
mode(s) (continued)non-genuine, 136; see also mode(s),
genuine normalnormal, 1, 14-5, 44-7, 52-3, 57-64, 66-78
for helical molecule, 96-7, 150-1for model 'polymer' system, 152-4no. of for each symmetry species, 70-4simple description of, 78see also: factor group above;
eigenvectors; vibrationalcalculations
optical, 153^ , 161skeletal, 85; see also index of group modesstretching, 74-8, 110-11symmetry, 74-8, 85-9, 131, 137
for helical molecule, 96-7mixing of; see mixing
torsional, frequency range, 17, 113true vibrational; see mode(s), genuine
normaltwisting, 85, 87zero frequency, 69, 73; see also: mode(s),
non-genuine; rotational modes;translation
model compounds, 130, 134for various polymers, 157, 166-72, 185,
189, 194, 202-3, 240-2, 248, 259,266, 269, 299
model 'polymer' system, vibrations of,152^
models for molecular orientation, 301modulation frequency in FTIR, 26, 28molar absorption coefficient, 215, 248,
259-60molecular weight, 217, 252, 254, 255molten polymers, 239, 271, 278, 279moment of inertia, 98, 136momentum, angular and linear, 74-5monochromators, 21-4, 33, 34-6monoclinic crystal, 276monomer,3, 12
determination of residual, 219-21monomeric OH vibration, 257monosubstituted benzene; see benzenemorphology, 12-13
see also lamellar crystalsmotion, equation(s) of, 45, 58, 74,138,140,
152mulls for IR spectroscopy, 28-30multicomponent mixtures, analysis, 215-16
examples, 217-26multidetector arrays and Raman, 36multiplex advantage in FTIR, 26multiplication (combination)
in group theory, 53-6, 57table, 55-6, 60, 84
mutual exclusion rule, 113-16, 201
N atom, electronegative, 256N atom in hydrogen bonding, 256near infrared, 17, 221neopentane, 171neutron scattering, 1, 151, 158, 286, 290-2Newman projection, 242 (fig 6.6)NH group and hydrogen bonding, 256-64nitric acid degradation and LAM, 291nitrogen-containing polymers, 212-15
see also index of polymersnitrogen, liquid, 157, 286NMR spectroscopy, 211, 212, 217, 218,
219, 229-30, 248, 250, 251, 255node in LAM, 286noise, 23, 27, 41non-crystalline region, 13, 80
between lamellae, 288, 290-1concentration of; see crystallinityconformational content, 238-45effect on spectrum, 100, 126, 265
of PE, 168, 247, 269-71of various polymers, 179, 194, 202
non-factor group modes, 150-8, 161, 206non-harmonic vibration, 136, 158-61, 221normal coordinate calculations; see
vibrational calculationsnormal coordinates, 69-70, 75, 111-14,
142-3, 145normal mode; see mode(s), normalnotation
for symmetryoperations, 47-52, 81-3, 93species, 65-6
used in tables, 162-3see also symbols
novolak resins, 210-12nucleus of atom, 42-4null balance in dispersive IR, 23, 27number of normal modes for species, 70-4,
84-5Nylons 5-6, 212-14, 220-1, 257-8
O atom, electronegative, 256O atom in hydrogen bonding, 256o-o and o-p linkages in novolaks, 210-11oleamide in polyethylene, 223opaque samples, 36operations, 47-52, 55, 81-3, 91-3, 104optical modes, 153-4, 161order
of a group, 53,71,98-9of a symmetry element, 52, 54
order (regularity)chain order and crystallinity, 264-80
322 Main index
order (regularity) (continued)intermediate, 269-71, 279loss of, 231, 235peaks characteristic for, 229,235-8, 264,
278-80orientation
averages, 294-301molecular
and assignment, 120-2, 126-30, 276,292; see also section 5.2 (163-203)for various examples
and conformational content, 240, 297and IR spectroscopy, 28, 120-2, 127and polymer processing, 16-7and Raman spectroscopy, 34, 125and Young's modulus, 290characterization of, 133, 242, 292-301corrections for, 240, 269, 279, 296
of axes; see axes, choice of orientationorthogonality
of eigenvectors, 69, 141-3of Legendre polynomials, 294
orthorhombic crystal, 100, 103, 265, 271oscillator, harmonic; see harmonic
oscillatoroverlapping peaks, 126, 247
see also curve fittingovertone/combination frequencies, 17,
158-61for PE, 163, 167, 168, 170, 222for various polymers, 191, 197, 213, 274for vibrations involving H atoms, 221
oxidation, degree of, 223-4oxirane ring, 255oxygen-containing groups, 200-3, 210-12
see also polyesters in index of polymersoxygen, direct determination of, 217
paradisubstituted benzene; see benzeneparaffin
branched, 171, 247normal
crystal structure, 173definition, 156, 166deuterated, 171, 283-5force constants, 171-2in liquid state, 269LAM, 286-90, 292models for PE, 156-8, 166-72, 266,
269selection rules and spectra, 168-71single crystals, 172, 266
parallel (n) mode, definition, 121partially polarized Raman peaks, 125peak
area, 229-30, 242, 271, 275
peak (continued)broadening; see width of peaksshapes, 3 9 ^ 1 , 229, 233, 241, 289, 291-2shift; see shift of peaksplitting; see splittingwidth; see width of peaks
PED (potential energy distribution), 144,175-9
1-pentadecene, 252perfect isolated chain; see isolated regular
chainperpendicular (or) mode, definition, 121-2perspex; see index of polymersphase (of vibration) relative
of atoms in normal modes, 45-7of chains
in correlation splitting, 99, 100, 102-3106, 265-6
in lattice modes, 99of groups within repeat unit, 103, 154,
174-6of masses for model 'polymer', 153-4of methylene groups in normal paraffins,
168-9of units in helical molecules, 96-7, 151,
188, 192, 194phase (type of structure)
in polyethylene, 264, 269-71, 298in polytetrafluoroethylene, 187, 276-7in polyurethanes, 258-62
phenolic antioxidants, 222phenols and phenolic resins, 7, 210-12phenyl group; see benzeneN-phenylurethane, 259Phillips process, 246, 252, 254photochemical decomposition, 223-6photographic recording for Raman, 167photon, 112phthalic anhydride, 6physical properties/structure, 227
and spectroscopy, 16-17see also mechanical properties
pi (n) mode, definition, 121-2planar square molecule, 115-16planar zig-zag, 8-10, 13, 82, 89-92, 100,
127, 173, 177-80, 185, 199, 235,237, 240
plane, see mirror planeplasticizers, 226plexiglass; see index of polymerspoint group and symmetry, 47-56polar groups, 163; see also hydrogen
bond(ing)polarizability
in longitudinal acoustic mode, 286derivative, 113; see also tensor, Raman
Main index 323
polarizability (continued)molecular, 107-9, 111-15, 160, 225see also tensor
polarizationand infrared spectra, 28, 67, 109-11,
120-2, 127; see also 266, 276-7 andsection 5.2 (163-203) for variousexamples
and orientation, 292-301; see alsoorientation, molecular
and Raman spectroscopy, 33-5, 37, 67,122-5,127; see also 267 and section5.2 (163-203) for various examples
instrumental, 28, 34, 122, 269polyene
low MW, 226sequences in PVC, 224-6
polymer, definition of, 2polymerization and polymerization
mechanisms, 3-7, 227-8, 233, 234,240, 246, 271
position, generalized, 58, 67-76potassium bromide disks, 29, 30potential energy; see energypowder samples, 28-30, 36, 37, 275prediction of frequencies, 149-50, 172preferred orientation around axis, 294pressing, hot for IR samples, 29principal axes of a tensor, 108principal axis of a molecule, 49, 65principal polarizabilities, 107-8prisms in IR spectrometers, 23processing of polymers, 16, 223, 292product rule, Teller-Redlich, 136-7propagation step in polymerization, 3propylene glycol, 6propylene oxide, polymerization, 233proteins, hydrogen bonding in, 262-4pseudo-baseline technique, 38-9, 215pyramid, square, molecule, 59pyrolysis of novolak resin, 211
qualitative analysis; see analysisquantitative analysis; see analysisquantum mechanics, 17-18, 43, 112-13,
159-61quartic terms in potential energy, 159
Raman; see scattering, Ramanrandom re-entry, 280, 283, 286randomly coiled chains, 13Rayleigh scattering, 2, 32, 33, 112, 288ratio recording IR spectrometer, 23ratios
of absorbances, 217-18, 247, 256, 269of Raman intensities, 32, 216, 219, 268
reactivity ratios, 228
reduced mass, 135, 137reflection
loss, correction for, 20, 298operation, 47-9spectroscopy, IR, 20, 30-1
refractive index, 301regular polymer chain; see chainregularity peaks, 229, 235-8, 264, 278-80
see also order (regularity)relaxation of orientation, 292repeat unit(s)
chemical, 2, 15, 81, 95, 180, 235dimensions, 15, 180, 187interactions between 15, 199; see also:
coupled oscillators; phasephysical, 15, 95, 97, 150-2, 235translational, 81-3, 90-1, 103, 151-2,
185-7, 238representation of a group
based on 2nd order functions, 117-20by matrices, 57-63reducible, irred. & equiv. reps, 60-33n-dimensional, 843N-dimensional, 67-70
repulsive forces, 148resole resins, 210-12resolution, spectral, 18, 21, 27resonance, Fermi, 161, 167-8, 267-8resonance Raman, 18, 43, 224-6rigidity, 234rotation
around bonds, 9-10; see alsoisomer/isomerism
axes/operations, definitions, 47-9, 65,81,93
rotational isomerism; seeisomer/isomerism, conformational
rotational modes/motion, 42,44,69, 73-5,77,84-7,98, 110, 146, 192
rotatory mode (libration), 98-9, 277rubber, natural, 10rule of mutual exclusion, 113-16, 201
SHH, SHH and SCH structures, 241-5sample preparation, 28-30, 36-7Santonox R, 220-1scattering
neutron, 1, 151, 158, 286, 290-2of light, 33
by gratings and mirrors, 34by spherulites, 13
Raman, 2, 18anti-Stokes, 112-13ease of sampling, 32, 36, 254, 264efficiencies, 242first polymer spectrum, 31
324 Main index
scattering (continued)Raman (continued)
for model 'polymer' chain, 154intensities, 112-13, 120origin of, 111-13selection rules, 107, 113-20Stokes, 2, 18, 112-13
Rayleigh, 2, 32,33, 112,288resonance Raman, 18, 43, 224-6
scission of chains, 224screw axis/operation, 81, 93, 150, 154
see also helical moleculessebacic acid, 6, 214second order functions, 117-20secondary amide group, 213; see also amide
group/linkagesecondary chlorides; see chloridessecular equation, 139-40, 152segregation in mixed crystals, 285selection rules, 81, 101, 107, 113-20, 129
applications; see section 5.2 (163-203)infrared, 109-11for overtones and combinations, 160Raman, 107, 113-20
sequence length, copolymers 227-8, 231-4shape of peak, 39-41, 229, 233, 241, 289,
291-2sharpening of peak
by cooling, 157, 267-8by crystallization, 265
shift of peakby isotope substitution, 134-7in copolymers, 229, 230, 233with temperature, 277; see also
temperatureside groups; see branch/branchingsigma (ar) mode, definition, 121-2signal-to-noise ratio, 23, 27, 41similarity transformation, 62simple harmonic; see under harmonicsingle crystal texture PE, 172-3single crystals, 13, 266, 280-6, 288, 291-2site group, 103, 105skeletal modes, 85
see also index of group modesslip agents, 223small samples and Raman, 32, 254soft segment, 258-62solid angle, 294, 297solubility of polymers, 254, 256solute/solvent interactions, 229-30solution
crystals from, 13, 280-6, 288, 291-2of polymer, 29, 221,278
solvents for polymers, 29,217,218,221,223sound waves; see mode(s), acoustic
sources for IR/Raman spectroscopy, 27, 33see also laser
space group; see group, spacespectrometer(s), 18-28, 31-6, 113spherical harmonics, 118-19, 297spherical part of tensor, 123spherulites, 13splitting of modes/peaks, 16
correlation, 99-100, 265, 279in PE, 105-6,167,173, 265-70, 281-6in various polymers, 100-3, 184, 272-6
crystal field, 98-100, 265due to isomerism, 239-45, 278obscured by amorphous peaks, 100, 265of group modes by order, 206
spring, 42, 152, 154square molecule, planar, 115-17square pyramidal molecule, 59stability; see degradationstabilizers, 224, 226standard, internal, 32, 256, 269, 271stereoregular polymerization), 8, 233,
234steric hindrance, 4, 8stress crack resistance, 227, 246stress/strain measurements, 290stretching, 273; see also drawing
modes, 46, 74-8, 275; see also: mode(s),stretching; index of group modes
structural defect; see defect structuresub-units and assignment, 128-30, 200-3subspectrum, 126substitution of isotopes, 134-7
see also deuterated polymerssubtraction of spectra; see differencesulphur-containing materials, 220-1summation frequency, 161
see also overtone/combinationfrequencies
superfolding in PE crystals, 286superposition of spectra, 126, 228-9surface coatings, 20, 31, 36switchboard model of chain folding, 280symbols
and electromagnetic waves, 17-18for types of group vibrations, 85-7see also notation
symmetric species, 52, 65-6symmetric stretching modes, 46, 74-8, 275
see also index of group modessymmetry
and nature of normal modes, 47, 52-3and spectral activity, 15, 67, 81, 180-5;
see also selection rulescoordinates, 74-8, 139, 145-6, 178descent in, 89-93, 99, 105
Main index 325
symmetry {continued)elements and operations
definitions, 47-52, 55, 81-3, 91, 93,104
local, 126-31, 200-3lowering of, 98, 172mode; see mode(s), symmetryspecies, 53
definitions and symbols, 53, 64-6no. of normal modes for each, 70-4,
84-5of dispersion curve, 154-6
translation^, 81, 90, 278symmetry-related set of atoms, 136syndiotactic chain, definition, 8-9
tacticity, definition, 8-9tail-to-tail addition, 8, 231-3, 250-1Taylor series, 111Teller-Redlich product rule, 136-7temperature
and intermolecular interactions, 267,277, 286
and structural transitions, 185-7, 273,276-7
effect onH-bonding, 257-8, 261, 2 6 2 ^LAM peak, 290-2peak position/width, 157, 267-8, 277
high anddegradation, 246excited states, 113, 160-1
of polymerization and tacticity, 240-1tensile strength, 227tensor, 161
anisotropy of, 123-4derivative polarizability, 113; see also
Raman belowinvariant of, 124molecular polarizability, 107-9, 111-15
160, 225principal axes and components, 108Raman, 113, 116-20, 122-5, 225, 297,
299second rank, 108spherical part of, 123spherically symmetric, 124-5symmetric, 108
terephthalates, 202, 210see also polyterephthalates in index of
polymersterephthaloyl residue or group, 128, 134terminating group; see end groupstermination of polymerization, 3tetrahedral angle/bonding, 8, 47, 181tetrahydrofuran, as solvent, 29-30, 217
thermal contraction, 267, 277thermal decomposition/degradation,
223-6, 251, 262-4thermal equilibrium, 113thermal excitation, 160-1thermodynamic equilibrium, 239throughput advantage in FTIR, 26-7tilt of chains in lamellar crystals, 290toluene as solvent for PE, 223torsional vibrations, 17, 113totally polarized Raman modes, 125totally symmetric mode/species, 65, 124-5,
135, 149, 226trans; see isomer/isomerismtrans-in-chain groups, 253-4transformation, similarity, 62transition
moment, 265, 269; see also dipolestructural, 185-7, 273, 276-7
translation/translationalmodes/motion, 42,44,69,73-5,77,84-6,
109-10, 146, 153, 192period, SI, 95; see also repeat unit(s)symmetry operation/element, 81,91,278
transmittance, 20, 23, 26transparency and polymer morphology, 13transverse isotropy, 293triad units in copolymers, 229-30triatomic molecule
bent, 67-8, 72-7, 110-11linear, 46, 114-15
triple helix of collagen, 262-3true vibrations; see mode(s), genuine
normalturbidity, of PTFE, 189twisting modes, 85, 87
see also index of group modes
u (ungerade) species defined, 66UBS force field, 148, 154ultraviolet/visible region, 43, 224, 225uniaxial orientation, 293unit
monomer, 3repeat; see repeat unitstructural, 7, 294
unit celldefinition, 97examples; see crystal structurefundamental modes of, 170; see also
mode(s), factor groupno. of chains through, 98-9, 264-5; see
also splitting, correlationunits and electromagnetic waves, 17-18unsaturated groups, 206, 224, 253-5; see
also vinyl and vinylidene end group
326 Main index
'unzipping' in PVC, 224uracil base, 264urea and amino resins, 7urea clathrate, 179, 240, 275urethane group/linkage 5-6, 214
see also polyurethanes in index ofpolymers
Urey-Bradley-Shimanouchi f.f., 148, 154
valence force field (VFF), 148-9, 171,184-5
van der Waals forces/radius, 8, 148, 262vector
basis, 58-62displacement, 58
velocityof light, 17of mirror in FTIR, 26
vertical axis/mirror plane defined, 49vibrational calculations, 135-56
and assignment, 126, 137-8, 149and 'prediction' of frequencies, 149-50,
172arbitrariness, 149-50for mixed PED/PEH, 283for polymers, 150-6for PE, 154, 166-8, 170-2, 267, 276for PVC, 173, 177-9, 240, 275for various polymers, 183-5,193-4, 200,
203, 208procedure, 149use of computers, 171
vibrations/vibrational frequenciescoupled; see mixingsee also mode(s)
vinyl chloride, 227vinyl end group in PE, 224,250,252^, 269vinyl fluoride, 8vinyl polymers, 3-4
and head-to-head addition, 8conformational/configurational
isomerism, 8-10, 234-45examples
atactic, 194-200;isotactic, 199-200, 234-6syndiotactic, 100-3, 173-80, 235-8
vinyl polymers (continued)symmetry of chains, 89-93, 126-7tacticity, definition, 8-9see also index of polymers
vinylidene end groups, 252-4vinylidene fluoride, 8vinylidene polymers, 3, 8
see also index of polymersvisible region of spectrum, 18, 43, 224, 225
water, 67and hydrogen bonding, 256, 262-4and Raman spectroscopy, 32, 264in poly (methyl methacrylate), 221-2
wave-function, 43, 160-1wavelength
of electromagnetic wave, 17typical for IR or Raman, 15, 17, 18
wavenumber of electromagnetic wave, 17waves, certain vibrational modes as, 63width of peaks, 15,16,18,157,267,270,271
and mathematical techniques, 38-41effect on resolution, 100, 265, 267for LA mode, 289, 291-2influence of crystallinity on, 271
Wilson G and F matrices, 139^48
X-raysand crystal structure, 173, 179, 185-7,
200-1, 234, 239, 240, 276-7and crystallinity determination, 269,
279-80and orientation, 293, 301and Young's modulus, 288irradiation of PE with, 254small angle diffraction of, 288, 290, 292
Young's modulus and LAM, 287-92and X-ray diffraction, 288
zero-frequency modes, 69, 73see also: mode(s), non-genuine;
rotational modes; translationalmodes
Ziegler-Natta catalysts, 234, 246, 254zig-zag, planar; see planar zig-zag