Embed Size (px)
Citation preview
Herbert Brücker1 Can International Migration Solve the Problems of European Labour Markets? 1. Introduction Migration is one of the most controversial issues in the current debate on economic and social policies in Europe. On the one hand, migration is blamed for unemployment and increasing inequality in the host countries. On the other hand, it is hoped that international migration can at least alleviate the burden of Europe’s rapidly ageing population. According the Eurobarometer survey, the attitude of a majority of natives in the host countries towards immigration can be summarised as follows: migrants cause unemployment; migrants abuse the welfare state; and the presence of foreign nationals has reached or even exceeded its saturation point. Interestingly enough, hostile attitudes towards immigration are positively correlated to the share of non-nationals in the population, but negatively correlated to actual unemployment rates in the respective countries (McCormick et al. 2002). The outcome of the elections in Austria, Denmark, and, recently, in France, indeed demonstrates that a considerable share of natives in host countries perceive immigration as a burden rather than a solution to their economic and social problems. European migration policies over the last few decades reflect the anxious attitude of natives in the host countries toward migration. Since the 1973 economic recession, labour migration from non-member countries of the European Union (EU) and the European Economic Area (EEA) has been heavily restricted in western Europe, although the barriers to migration of workers and other people between the members of the EU and the EEA have been largely removed. Nevertheless, the number of non-EU and non-EEA nationals has increased substantially in western Europe, while both the share and the absolute number of EU and EEA nationals among the foreign population in western Europe has declined. This does not necessarily mean that the restrictive migration policies in western Europe have had no impact on the scale and the structure of European migration: firstly, the scale of immigration in western Europe is, with the notable exception of Japan, below that of the other regions in the world with similar per capita income levels (northern America, Australia, New Zealand). Secondly, since migration from non-EU and non-EEA countries has been mainly channelled through family reunification and humanitarian migration, the composition of migrants with regard to their human capital characteristics still follows the patterns of the 1960s, which implies that the proportion of manual workers in the migrant population is still extraordinarily high. The current restrictive approach towards immigration in western Europe is challenged by two main facts: firstly, the restrictions to emigration have been dismantled in a region of almost 400 million people following the demise of socialism in Eastern Europe. Although per capita income levels in this region are similar to those of the traditional source countries of European migration in south and south eastern Europe, human capital endowments are substantially higher in this region than in the traditional source countries. This creates a large economic potential. Secondly, the populations in western Europe - but not only there - are ageing rapidly. Given this secular trend, the current structure of revenues and expenditures for public
1 German Institute for Economic Research (DIW), Berlin, Institute for Labour Market Studies (IZA), Bonn. Contact: phone: ++49-30-8 97 89 442; fax: ++49-30-8 97 89 108 ; Email: [email protected].
2
finances and social security systems is not sustainable. Migration could possibly alleviate this sustainability gap through their net contribution to the budget and an increase in the number of tax payers in future generations. Although the hostile attitude of natives in host countries towards any further immigration makes it rather unlikely that European migration policies will change substantially during the next few years, there are many signs that national governments and supranational bodies such as the European Commission have started to rethink their policies toward international labour migration. Three main questions are on the agenda: (i) should European migration policies increase the scale of labour migration?, (ii) how should the EU and the other members of the EEA regulate the entry of labour migrants from non-EU and non-EEA countries?, (iii) should the migration of labour, analogous to trade and capital movements, be regulated by supranational bodies such as the EU and the EEA? The objective of this paper is to contribute to this debate by analysing the labour market consequences of international migration from an economic perspective. International labour migration is, to a large extent, motivated by differences in wages and other sources of income across countries. Individuals or private households, which bear the non-negligible cost of moving, expect that the returns at least equal the costs of their investment. The economic gains from international labour migration result from the productivity of the migrant’s human resources being higher in the host country than in the source country. Labour migration is, hence, associated with an efficiency gain. Migration however not only improves the efficiency of resource allocation. It also affects the distribution of income between the factors of production in the host and the source countries as well as those between the host and the source countries. These distributive aspects form the core of public concerns about labour migration. Moreover, in economies affected by unemployment, migration may involve negative externalities: the replacement of native workers or the creation of fiscal costs for the welfare state. Thus, an economic analysis of the impact of international migration has to consider the effects of migration in economies exposed to persistent unemployment. Any analysis of the economic impact of migration is however incomplete if it focuses only on host countries. For a comprehensive analysis of the gains and losses from international migration we have to consider its impact on all the affected parties, i.e. natives in the host country, natives in the source country, and migrants. The remainder of the paper is organised as follows: firstly, in order to establish the institutional and quantitative background, key facts on European migration policies, the scale of European migration in the main host and source regions, and stylised facts about the socio-economic characteristics of European migrants are presented (Section 2). Secondly, we analyse the impact of labour migration on income, wages, unemployment and the distribution of income in both the host and the source regions. Models of migration in a closed economy form a natural starting point for the analysis, i.e. models which ignore the interaction of migration with trade and capital movements, because they allow the impact of migration to be analysed in isolation. Moreover, the majority of the empirical literature relies on this family of models. Using this basis we consider different assumptions on the economic environment in which migration takes place. Starting from a full-employment economy as a point of reference, the following issues are addressed: (i) the implications of migration in an economy with wage rigidity and unemployment, (ii) the impact of unemployment benefits on the scale and composition of migration, and (iii) the impact of migration when regional differences in wage and unemployment rates exist. Moreover, we consider the implications of alternative models for migration. The results from these calibrations are then compared with findings from empirical studies on the impact of migration in host countries (Section 3).
3
Thirdly, we discuss the fiscal implications of migration against the background of the rapidly ageing populations in Europe. A generational accounting approach is used to analyse whether international migration can help alleviate the sustainability gap in public finances (Section 4). Finally, the study’s findings are summarised (Section 5). 2. Key trends in European migration Before analysing the labour market implications of international migration in Europe, an overview of the key trends in European migration would be instructive in establishing the institutional and quantitative background. International migration in Europe has been greatly influenced by institutional barriers. On the one hand, the barriers to international migration have been removed among western European countries to an extent which is unique among regional trade areas. On the other hand, western European countries have also established restrictive barriers for immigration from the southern and south eastern European countries following the 1973 economic recession. Although the demise of socialism involved the removal of emigration barriers in a region of almost 400 million people, the present restrictions in western European countries effectively prevented large-scale migration from the east to the west (Section 2.1). In relative terms, the scale of European migration is well below that of northern America, Australia and New Zealand. Nevertheless, western Europe is in absolute terms the main target of international migration after northern America: it has welcomed some 15 million immigrants since World War II and its foreign population stood at around 20 million people in 2000. International migration in Europe is largely a regional phenomenon, i.e. three-quarters of the foreign population in western Europe originate from South and South Eastern Europe and neighbouring regions in northern Africa and Eastern Europe (Section 2.2). The country-of-origin mix of European migration has changed over the last three decades. In the 1960s and 1970s, most of the foreign population and labour force in western Europe originated from the southern members of the present EU. However, since then the main source of European migration has become non-EU and non-EEA countries in south eastern Europe and northern Africa. This change in the country-of-origin mix is associated with the increasing income gap and the increasing differences in human capital endowments between the host and the source countries for European migration (Section 2.3). The change in the country-of-origin-mix affects the socio-economic characteristics of migrants. On average, the human capital endowments of migrants are well below those of natives. As a consequence, the labour market performance of migrants lags behind that of natives and their welfare dependency ratios are also above those of natives. However, as is well known, averages can mask the differences between different groups. Migrants from other EU countries and, more importantly for the future, from Central and Eastern Europe possess better qualifications, and are less affected by unemployment and welfare dependency relative to other groups of immigrants and even to natives (Section 2.4). 2
2 This section draws partly on McCormick et al. (2002).
4
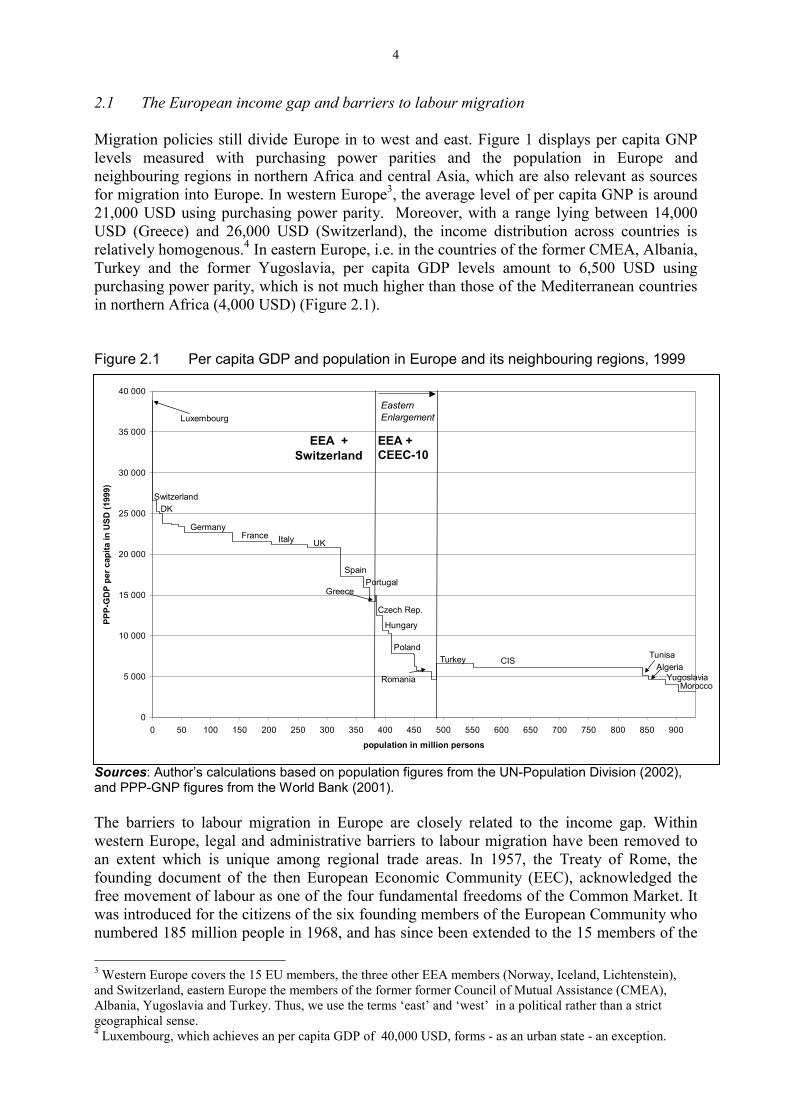
2.1 The European income gap and barriers to labour migration Migration policies still divide Europe in to west and east. Figure 1 displays per capita GNP levels measured with purchasing power parities and the population in Europe and neighbouring regions in northern Africa and central Asia, which are also relevant as sources for migration into Europe. In western Europe3, the average level of per capita GNP is around 21,000 USD using purchasing power parity. Moreover, with a range lying between 14,000 USD (Greece) and 26,000 USD (Switzerland), the income distribution across countries is relatively homogenous.4 In eastern Europe, i.e. in the countries of the former CMEA, Albania, Turkey and the former Yugoslavia, per capita GDP levels amount to 6,500 USD using purchasing power parity, which is not much higher than those of the Mediterranean countries in northern Africa (4,000 USD) (Figure 2.1). Figure 2.1 Per capita GDP and population in Europe and its neighbouring regions, 1999
Sources: Author’s calculations based on population figures from the UN-Population Division (2002), and PPP-GNP figures from the World Bank (2001). The barriers to labour migration in Europe are closely related to the income gap. Within western Europe, legal and administrative barriers to labour migration have been removed to an extent which is unique among regional trade areas. In 1957, the Treaty of Rome, the founding document of the then European Economic Community (EEC), acknowledged the free movement of labour as one of the four fundamental freedoms of the Common Market. It was introduced for the citizens of the six founding members of the European Community who numbered 185 million people in 1968, and has since been extended to the 15 members of the 3 Western Europe covers the 15 EU members, the three other EEA members (Norway, Iceland, Lichtenstein), and Switzerland, eastern Europe the members of the former former Council of Mutual Assistance (CMEA), Albania, Yugoslavia and Turkey. Thus, we use the terms ‘east’ and ‘west’ in a political rather than a strict geographical sense. 4 Luxembourg, which achieves an per capita GDP of 40,000 USD, forms - as an urban state - an exception.
0
5 000
10 000
15 000
20 000
25 000
30 000
35 000
40 000
0 50 100 150 200 250 300 350 400 450 500 550 600 650 700 750 800 850 900
population in million persons
PPP-
GD
P pe
r cap
ita in
USD
(199
9)
EEA +Switzerland
EEA +
Turkey CIS
Luxembourg
GermanyFrance Italy UK
Spain
Poland
Morocco
Tunisa
Czech Rep.
Hungary
EasternEnlargement
YugoslaviaAlgeria
Romania
DK
PortugalGreece
CEEC-10
Switzerland
5
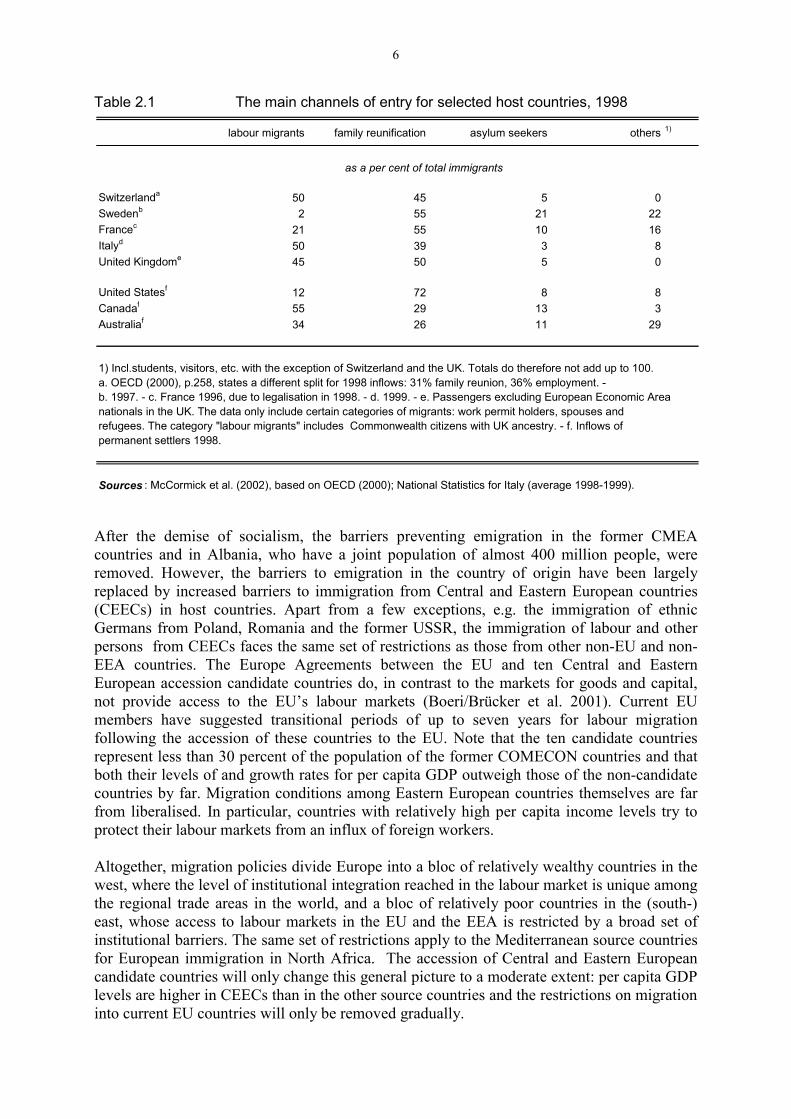
present European Union (EU)5 and the three other members of the European Economic Area (EEA) with a joint population of 380 million people.6 Among the European countries with a per capita GDP of above 20,000 USD, Switzerland is the only one which does not belong to the EEA. The free movement of labour entitles EEA citizens to work and to reside in other member countries. More specifically, this comprises the right to seek employment in other member countries, to move there to search for employment, to reside there for the purpose of employment, and to remain there following the completion of employment. The acquis communautaire, i.e. the common set of rules for the EU, demands the equal treatment of EU citizens in respect to employment, occupation, remuneration and other work-related conditions. The principle of equal treatment requires that EU and EEA citizens enjoy the same level of protection from the social security system as do natives. A number of EU regulations try, albeit with limited success, to prevent national pension schemes disadvantaging migrant workers. However, several provisions at EU and national levels protect social security systems against ‘welfare shoppers’: nationals from other EU and EEA countries are only admitted, if they can prove sufficient funds to finance their living costs; residence permits can be withdrawn, if households rely on social assistance. In some member countries special provisions exclude those foreigners who emigrated with the sole purpose of claiming benefits from social welfare. In practice, the access of EU and EEA citizens to the welfare benefits in host countries depends largely on the duration of their stay.7 Although barriers to labour migration have largely been removed within the EU and the EEA, no more than a third of the foreign population in the EEA originates from other EEA member countries. Migration policies vis-à-vis non-EU and non-EEA members remain however largely in the domain of national policies. Non-EU and non-EEA citizens are consequently excluded from the free movement of labour within the community: residency and work permits cannot be transferred to other EU and EEA countries. Both national and EU regulations give preferential treatment to nationals and citizens from other EU and EEA members vis-à-vis migrants from non-EU and non–EEA countries in the labour market: non-EEA citizens are only admitted to the labour market if it can be proved that the respective position cannot be filled by a citizen of an EEA country. In general, migration policies vis-à.vis non-EU and non-EEA members have become restrictive following the first oil-price shock in 1973. The active recruitment of foreign labour from non-EU and non-EEA countries has since then ceased in almost all EEA countries. These migration restrictions contributed to the reduction of migration flows in the 1970s and the 1980s, but the migration from non–EEA countries did not cease completely. Conversely, the share of non-EEA citizens in the foreign population in western Europe has increased continuously since the 1970s. As a consequence of the restrictions on labour immigration, family reunification, humanitarian migration and illegal migration have become the main channels for immigration from non-EU and non-EEA countries (Bauer/Zimmermann 2000, Gross 1999, Garson et al. 1997, Table 2.1).
5 Austria, Belgium, Denmark, Finland, France, Germany, Greece, Ireland, Italy, Luxembourg, Netherlands, Portugal, Spain, Sweden, United Kingdom. 6 Iceland, Norway, Liechtenstein. 7 For an in-depth description of the institutional conditions for labour migration in the EU and the EEA see McCormick et al. (2002), chapter 3, and Hänlein/Kruse/Reinhard/Schulte (2001) in Sinn et al. (2001).
6
Table 2.1 The main channels of entry for selected host countries, 1998
After the demise of socialism, the barriers preventing emigration in the former CMEA countries and in Albania, who have a joint population of almost 400 million people, were removed. However, the barriers to emigration in the country of origin have been largely replaced by increased barriers to immigration from Central and Eastern European countries (CEECs) in host countries. Apart from a few exceptions, e.g. the immigration of ethnic Germans from Poland, Romania and the former USSR, the immigration of labour and other persons from CEECs faces the same set of restrictions as those from other non-EU and non-EEA countries. The Europe Agreements between the EU and ten Central and Eastern European accession candidate countries do, in contrast to the markets for goods and capital, not provide access to the EU’s labour markets (Boeri/Brücker et al. 2001). Current EU members have suggested transitional periods of up to seven years for labour migration following the accession of these countries to the EU. Note that the ten candidate countries represent less than 30 percent of the population of the former COMECON countries and that both their levels of and growth rates for per capita GDP outweigh those of the non-candidate countries by far. Migration conditions among Eastern European countries themselves are far from liberalised. In particular, countries with relatively high per capita income levels try to protect their labour markets from an influx of foreign workers. Altogether, migration policies divide Europe into a bloc of relatively wealthy countries in the west, where the level of institutional integration reached in the labour market is unique among the regional trade areas in the world, and a bloc of relatively poor countries in the (south-) east, whose access to labour markets in the EU and the EEA is restricted by a broad set of institutional barriers. The same set of restrictions apply to the Mediterranean source countries for European immigration in North Africa. The accession of Central and Eastern European candidate countries will only change this general picture to a moderate extent: per capita GDP levels are higher in CEECs than in the other source countries and the restrictions on migration into current EU countries will only be removed gradually.
labour migrants family reunification asylum seekers others 1)
Switzerlanda 50 45 5 0Swedenb 2 55 21 22Francec 21 55 10 16Italyd 50 39 3 8United Kingdome 45 50 5 0
United Statesf 12 72 8 8Canadaf 55 29 13 3Australiaf 34 26 11 29
1) Incl.students, visitors, etc. with the exception of Switzerland and the UK. Totals do therefore not add up to 100. a. OECD (2000), p.258, states a different split for 1998 inflows: 31% family reunion, 36% employment. -b. 1997. - c. France 1996, due to legalisation in 1998. - d. 1999. - e. Passengers excluding European Economic Area nationals in the UK. The data only include certain categories of migrants: work permit holders, spouses and refugees. The category "labour migrants" includes Commonwealth citizens with UK ancestry. - f. Inflows of permanent settlers 1998.
Sources : McCormick et al. (2002), based on OECD (2000); National Statistics for Italy (average 1998-1999).
as a per cent of total immigrants
7
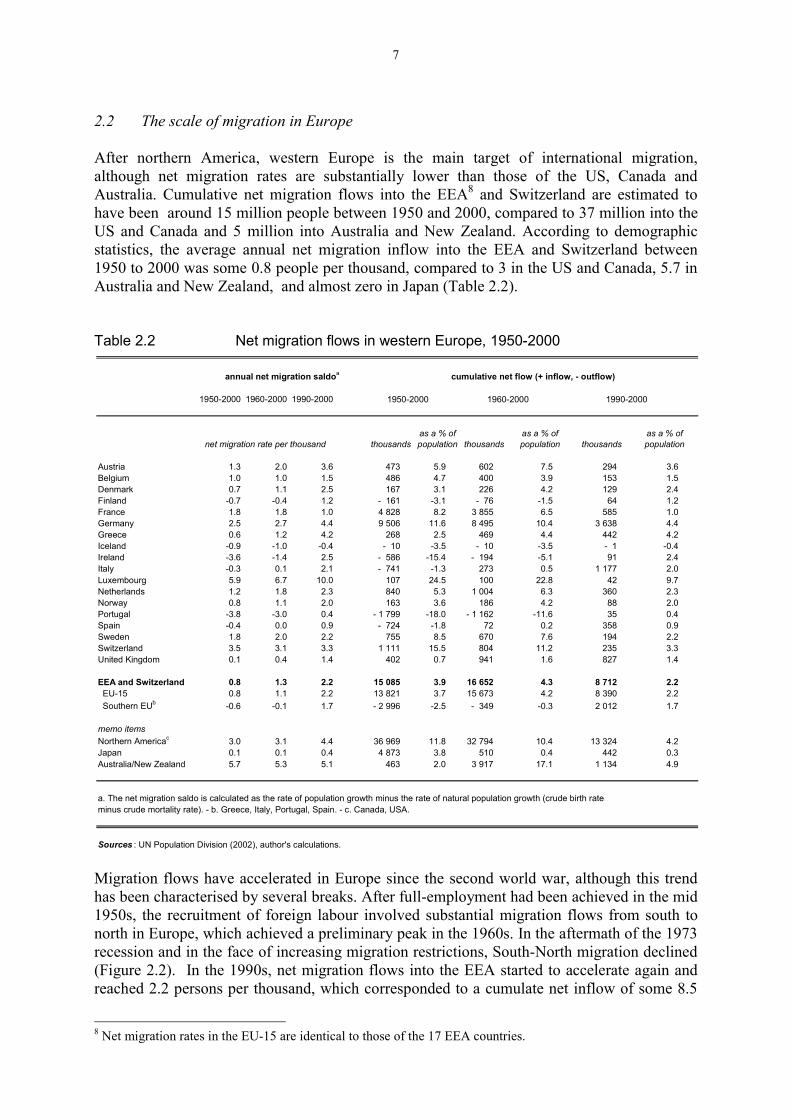
2.2 The scale of migration in Europe After northern America, western Europe is the main target of international migration, although net migration rates are substantially lower than those of the US, Canada and Australia. Cumulative net migration flows into the EEA8 and Switzerland are estimated to have been around 15 million people between 1950 and 2000, compared to 37 million into the US and Canada and 5 million into Australia and New Zealand. According to demographic statistics, the average annual net migration inflow into the EEA and Switzerland between 1950 to 2000 was some 0.8 people per thousand, compared to 3 in the US and Canada, 5.7 in Australia and New Zealand, and almost zero in Japan (Table 2.2). Table 2.2 Net migration flows in western Europe, 1950-2000
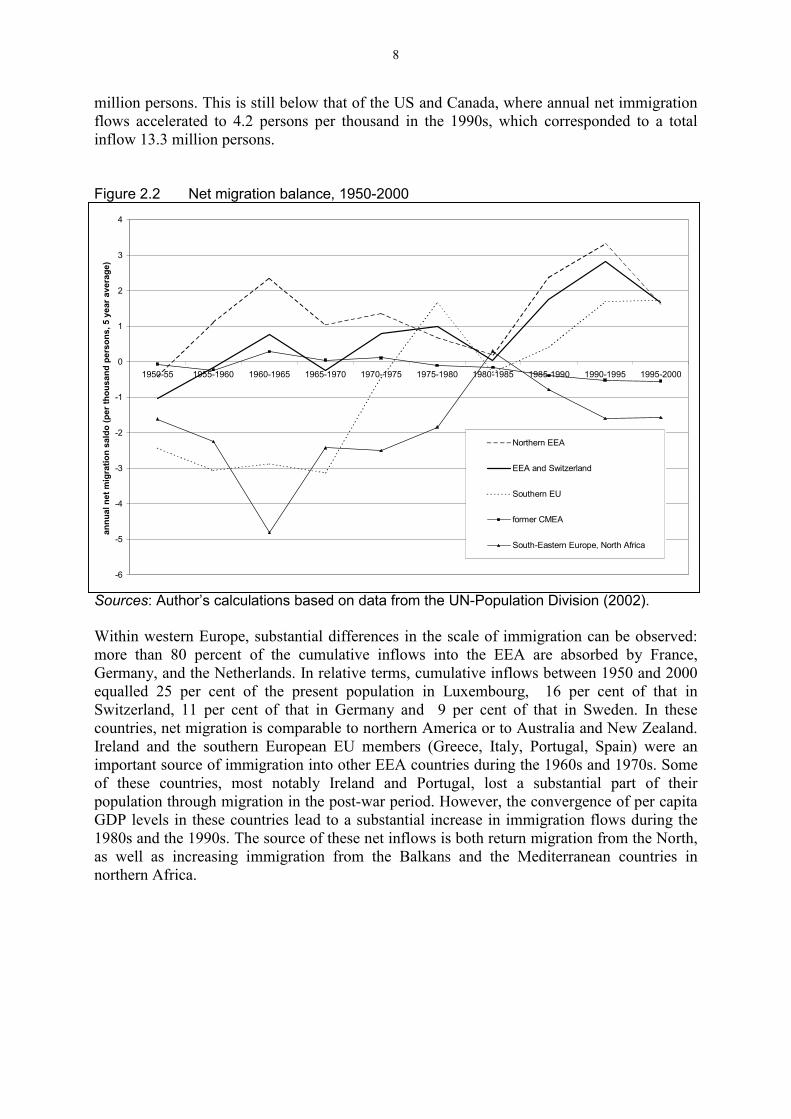
Migration flows have accelerated in Europe since the second world war, although this trend has been characterised by several breaks. After full-employment had been achieved in the mid 1950s, the recruitment of foreign labour involved substantial migration flows from south to north in Europe, which achieved a preliminary peak in the 1960s. In the aftermath of the 1973 recession and in the face of increasing migration restrictions, South-North migration declined (Figure 2.2). In the 1990s, net migration flows into the EEA started to accelerate again and reached 2.2 persons per thousand, which corresponded to a cumulate net inflow of some 8.5
8 Net migration rates in the EU-15 are identical to those of the 17 EEA countries.
1950-2000 1960-2000 1990-2000
Austria 1.3 2.0 3.6 473 5.9 602 7.5 294 3.6Belgium 1.0 1.0 1.5 486 4.7 400 3.9 153 1.5Denmark 0.7 1.1 2.5 167 3.1 226 4.2 129 2.4Finland -0.7 -0.4 1.2 - 161 -3.1 - 76 -1.5 64 1.2France 1.8 1.8 1.0 4 828 8.2 3 855 6.5 585 1.0Germany 2.5 2.7 4.4 9 506 11.6 8 495 10.4 3 638 4.4Greece 0.6 1.2 4.2 268 2.5 469 4.4 442 4.2Iceland -0.9 -1.0 -0.4 - 10 -3.5 - 10 -3.5 - 1 -0.4Ireland -3.6 -1.4 2.5 - 586 -15.4 - 194 -5.1 91 2.4Italy -0.3 0.1 2.1 - 741 -1.3 273 0.5 1 177 2.0Luxembourg 5.9 6.7 10.0 107 24.5 100 22.8 42 9.7Netherlands 1.2 1.8 2.3 840 5.3 1 004 6.3 360 2.3Norway 0.8 1.1 2.0 163 3.6 186 4.2 88 2.0Portugal -3.8 -3.0 0.4 - 1 799 -18.0 - 1 162 -11.6 35 0.4Spain -0.4 0.0 0.9 - 724 -1.8 72 0.2 358 0.9Sweden 1.8 2.0 2.2 755 8.5 670 7.6 194 2.2Switzerland 3.5 3.1 3.3 1 111 15.5 804 11.2 235 3.3United Kingdom 0.1 0.4 1.4 402 0.7 941 1.6 827 1.4
EEA and Switzerland 0.8 1.3 2.2 15 085 3.9 16 652 4.3 8 712 2.2 EU-15 0.8 1.1 2.2 13 821 3.7 15 673 4.2 8 390 2.2 Southern EUb -0.6 -0.1 1.7 - 2 996 -2.5 - 349 -0.3 2 012 1.7
memo itemsNorthern Americac 3.0 3.1 4.4 36 969 11.8 32 794 10.4 13 324 4.2Japan 0.1 0.1 0.4 4 873 3.8 510 0.4 442 0.3Australia/New Zealand 5.7 5.3 5.1 463 2.0 3 917 17.1 1 134 4.9
a. The net migration saldo is calculated as the rate of population growth minus the rate of natural population growth (crude birth rateminus crude mortality rate). - b. Greece, Italy, Portugal, Spain. - c. Canada, USA.
Sources : UN Population Division (2002), author's calculations.
1960-2000
thousandsnet migration rate per thousand
annual net migration saldoa
1950-2000
cumulative net flow (+ inflow, - outflow)
thousandsas a % of population
as a % of population
as a % of populationthousands
1990-2000
8
million persons. This is still below that of the US and Canada, where annual net immigration flows accelerated to 4.2 persons per thousand in the 1990s, which corresponded to a total inflow 13.3 million persons. Figure 2.2 Net migration balance, 1950-2000
Sources: Author’s calculations based on data from the UN-Population Division (2002). Within western Europe, substantial differences in the scale of immigration can be observed: more than 80 percent of the cumulative inflows into the EEA are absorbed by France, Germany, and the Netherlands. In relative terms, cumulative inflows between 1950 and 2000 equalled 25 per cent of the present population in Luxembourg, 16 per cent of that in Switzerland, 11 per cent of that in Germany and 9 per cent of that in Sweden. In these countries, net migration is comparable to northern America or to Australia and New Zealand. Ireland and the southern European EU members (Greece, Italy, Portugal, Spain) were an important source of immigration into other EEA countries during the 1960s and 1970s. Some of these countries, most notably Ireland and Portugal, lost a substantial part of their population through migration in the post-war period. However, the convergence of per capita GDP levels in these countries lead to a substantial increase in immigration flows during the 1980s and the 1990s. The source of these net inflows is both return migration from the North, as well as increasing immigration from the Balkans and the Mediterranean countries in northern Africa.
-6
-5
-4
-3
-2
-1
0
1
2
3
4
1950-55 1955-1960 1960-1965 1965-1970 1970-1975 1975-1980 1980-1985 1985-1990 1990-1995 1995-2000
annu
al n
et m
igra
tion
sald
o (p
er th
ousa
nd p
erso
ns, 5
yea
r ave
rage
)
Northern EEA
EEA and Switzerland
Southern EU
former CMEA
South-Eastern Europe, North Africa
9
Table 2.3
Foreign residents by source country, 1998
Austria 731
9.0na
na 474
64.9na
na 103
f14.1
nana
Belgium
8908.7
56062.8
808.9
15317.1
111.3
30.4
Denm
ark 238
4.5 49
20.6 69
29.0 4
1.8 9
3.94
0.4Finland
731.4
1419.3
67.7
11.2
1317.5
3012.7
France 3 597
6.1 1 322
36.7 250
7.01 393
38.7 22
f0.6
56.4
Germ
any 7 314
8.9 1 840
25.2 3 404
46.5 126
1.7 548
7.5254
7.1G
reece 161
1.5 45
28.0 43
26.5 1
0.6 20
12.522
0.3Iceland
51.8
247.1
nana
0.0
117.6
00.1
Ireland 114
3.0 81
71.1na
nana
na
f0.2
nana
Italy 885
1.5 134
15.1 89
10.1 168
19.0 56
6.36
5.0Luxem
bourg 143
32.7 128
89.6na
nana
na 1
f0.5
nana
Netherlands
6804.3
18827.7
16023.5
14120.8
111.7
53.5
Norw
ay 157
3.5 64
40.8 22
13.8 2
1.1na
na2
0.3Portugal
1731.7
4425.3
10.3
0.2
10.5
00.3
Spain 538
1.3 252
46.8 2
0.3 81
15.1 14
2.63
1.4Sw
eden 527
6.0 178
33.8 117
22.2 3
0.5 26
5.07
1.3Sw
itzerland 1 370
19.1827
60.4 388
28.3 11
0.8 7
0.56
1.1U
nited Kingdom 2 121
3.6 806
38.0 76
3.6 12
0.6 39
1.820
1.5
EEA and Switzerland
19 7155.1
6 53333.1
5 17926.3
2 09710.6
8824.5
3661.9
EU-15
18 0234.8
5 59431.0
4 72726.2
2 08411.6
8544.7
3361.9
southern EUe
1 7571.6
42924.4
1347.6
25114.3
915.2
311.8
a. Former Yugoslavia, Turkey. - b. Algeria, M
orocco, Tunisia. - c. Accession candidate countries from C
entral and Eastern Europe. - d. Com
monw
ealth of Independent States. -e. G
reece, Italy, Portugal, Spain. - f. Estimates based on Labour Force Survey data.
Sources: Eurostat Yearbook (2001), national sources, author's calculations.
northern Africab
south eastern Europea
CISd
CEEC-10
c
in thousandsas a %
of non-nationals
in thousandsas a %
of total
non-nationals
as a % of non-
nationals
non-nationals:EU-citizens
in thousandsin thousands
in thousandsin thousands
as a % of non-
nationalsas a %
of non-nationals
as a % of non-
nationals
10
10
The number of foreign residents reported by national statistics is higher than cumulative net inflows, because natural population growth contributes substantially to the stock of migrants. National statistics report around 20 million foreign residents in EEA countries and Switzerland, which corresponds to 5 per cent of the population (Eurostat 2001, SOPEMI 2001). The highest proportion of foreign residents in the population are again reported by Luxembourg (36 per cent), Switzerland (19 per cent), Austria (9 per cent) and Germany (9 per cent), while southern European countries report shares of around 2 per cent of the population (Table 2.3). Note that these figures rely on the concept of nationality, which implies that cross-country comparisons are affected by national differences in the concept of citizenship and different naturalisation rates. Statistics on the foreign-born population are compiled only by a minority of EEA countries, such that a uniform measure for the stock of migrants in Europe is missing. Moreover, illegal migration is only partially covered by national censuses and demographic statistics. In the 1990s, Europol (2000) estimated the annual inflow of illegal migrants into the EEA to be around 500 000 persons p.a.9 South eastern European countries (Turkey, the former Yugoslavia, Albania) and northern African countries bordering the Mediterranean (Algeria, Morocco, Tunisia) are the main source of migration into the EU and the EEA. The average net outflow from the south eastern European countries reached 1.7 persons per thousand during the period 1960 to 2000; this corresponds to a cumulative outflow of 5.8 million persons; the net outflow from northern African countries was 2.3 persons per thousand, which corresponds to a total net outflow of 5.1 million persons. Around 40 per cent of the foreign residents in the EEA originate from these two regions (Table 2.4). Relative to the income differential, migration from the former CMEA countries into western Europe has been fairly moderate. During the cold war, net migration rates were negligible in most Central and Eastern European countries, and even after the removal of barriers to emigration, migration flows remained so: an annual net outflow of 1.2 persons per thousand for the ten EU accession candidates, and 0.3 persons from the CIS. Contrary to conventional wisdom, this region contributed, with a net migration of around one million persons, only moderately to the total net immigration into the EEA during the 1990s. However, the turmoil in the former Yugoslavia and the economic crisis in Albania triggered substantial emigration flows. It is also worth noting that East-West migration is only one part of the story. The formation of new national states involved substantial migration flows between the successor states of the former USSR, which were driven by the segregation of the population by ethnic criteria rather then by economic factors, such as differences in per capita income (Locher 2001). Similarly, the civil wars in the former Yugoslavia not only triggered large emigration flows from this area, but also caused substantial flows within the region itself, motivated by the ethnic segregation of the population. In particular, net inflows led to a substantial increase in the population of Croatia as well as those in Serbia and Montenegro.
9 This figure cannot be compared with the legal inflow of some 850,000 persons p.a., since the latter figure refer to net inflows, while the estimates of illegal immigration refer to gross inflows.
11
11
Table 2.4 Net Migration flows in the source countries of European migration, 1950-2000
2.3 A secular shift in the country-of-origin mix Although EU migration policies and those of other EEA members vis-à-vis non EEA countries have been restrictive ever since the first oil-price shock took place in 1973, a secular shift in the country of origin mix towards non-EU countries can be observed for the EU’s foreign population. Since the early 1970s, the share of EU nationals residing in other countries has stagnated at around 1.5 per cent of the EU population, while the share of foreigners from non-EU countries increased from around 1.5 per cent to 3.3 per cent of the EU population between 1970 and 2000. This can be illustrated with the example of Germany: the number of EU citizens increased slightly from 1.6 million in 1970 to 1.8 million in 2000, while the share of non-EU nationals increased from 1.4 millions to 5.5 millions in the same period. Similar trends can be observed in many other EU and EEA countries.
1950-2000 1960-2000 1990-2000
net migration rate per thousand
Albania -5.4 -6.2 -21.8 - 661 -21.1 - 668 -21.3 - 690 -22.0Turkey -0.9 -1.0 -0.8 - 1 952 -2.9 - 1 977 -3.0 - 513 -0.8former Yugoslaviab -1.7 -1.5 -0.7 - 1 599 -7.5 - 1 175 -5.5 - 140 -0.7 Bosnia-Hercegovina -5.7 -5.6 -9.5 - 1 039 -26.1 - 857 -21.5 - 350 -8.8 Croatia -0.5 0.2 2.8 - 113 -2.4 27 0.6 130 2.8 FYR Yugoslavia -0.2 -0.2 1.0 - 78 -0.7 - 88 -0.8 105 1.0 Macedonia -4.3 -3.6 -1.3 - 368 -18.1 - 257 -12.7 - 25 -1.2
south eastern Europec -1.7 -1.4 -1.5 - 5 810 -6.4 - 3 820 -4.2 - 1 343 -1.5
Bulgaria -2.4 -2.5 -4.8 - 1 008 -12.7 - 843 -10.6 - 392 -4.9Czech Republic 0.3 0.3 0.8 153 1.5 116 1.1 88 0.9Estonia 1.9 1.3 -8.5 131 9.4 73 5.2 - 122 -8.7Hungary -0.9 -0.6 -0.5 - 439 -4.4 - 249 -2.5 - 50 -0.5Latvia 2.2 2.0 -5.5 264 10.9 202 8.4 - 135 -5.6Lithuania 0.4 1.3 -1.1 67 1.8 179 4.8 - 39 -1.1Poland -0.8 -0.8 -0.5 - 1 446 -3.7 - 1 138 -2.9 - 174 -0.4Romania -1.2 -1.2 -2.6 - 1 210 -5.4 - 1 031 -4.6 - 578 -2.6Slovak Republic -0.3 -0.7 0.4 - 65 -1.2 - 138 -2.6 22 0.4Slovenia 0.8 1.7 3.8 74 3.7 124 6.2 75 3.8
CEEC-10 -0.7 -0.7 -1.2 - 3 483 -3.3 - 2 732 -2.6 - 1 297 -1.2
Belarus -1.5 -0.5 1.4 - 615 -6.0 - 171 -1.7 139 1.3Kazakhstan -0.8 -4.0 -12.1 - 549 -3.4 - 2 373 -14.7 - 1 991 -12.3Russia 0.4 0.8 2.2 2 880 2.0 4 289 2.9 3 234 2.2Ukraine 0.2 0.4 -0.3 429 0.9 809 1.6 - 161 -0.3Uzbekistan -0.4 -0.6 -1.8 - 335 -1.3 - 382 -1.5 - 428 -1.7
CISd 0.0 0.0 -0.3 412 0.1 88 0.0 - 788 -0.3
Algeria -2.4 -1.8 -1.4 - 2 205 -7.3 - 1 451 -4.8 - 411 -1.4Morocco -2.0 -2.2 -1.5 - 1 907 -6.4 - 1 901 -6.4 - 428 -1.4Tunisia -3.1 -2.5 -0.9 - 982 -10.4 - 688 -7.3 - 83 -0.9
northern Africae -2.3 -2.1 -1.4 - 5 094 -7.3 - 4 040 -5.8 - 922 -1.3
a. The net migration saldo is calculated as the rate of population growth minus the rate of natural population growth (crude birth rateminus crude mortality rate). - b. Incl. Slovenia. - c. Albania, former Yugoslavia, Turkey. - d. Common Wealth of Independent States. - e. Algeria, Morocco, Tunesia.
Sources : UN Population Division (2002), author's calculations.
as a % of population
as a % of population thousandsthousands
as a % of population thousands
annual net migration saldoa
1990-20001960-20001950-2000
cumulative net flow (+ inflow, - outflow)
12
12
The shift in the country-of-origin mix of migrants in the EEA is associated with a change in the socio-economic characteristics of the source countries of European migration: Average GDP levels and human capital endowments in the source countries for the EEA have declined substantially. Between 1967 and 1998, average GDP levels for the source countries of immigration into Germany declined from two-thirds to one-third of German GDP, measured using purchasing power parities. Moreover, high and increasing differences in school enrolment rates exist in tertiary and secondary education between the receiving and the source countries for European migration. Finally, Gini-coefficients for per capita consumption are substantially higher in the source countries than in the main receiving countries for European migration, indicating a higher income inequality in the source countries (McCormick et al. 2002). The Central and Eastern European countries form an important exception to this general trend. Although per capita income levels amount to one-third or less of those in the main receiving countries, average education levels are similar to those in western Europe. The inequality in income distribution has increased in CEECs in the course of transition. However, Gini-coefficients indicate that the inequality in income distribution in the accession countries from Central and Eastern Europe is similar to that in present EU and EEA countries and is certainly below that of the traditional source countries for European migration. However, in the CIS countries the inequality in income distribution is substantially higher than that in the present EU. Thus, it is reasonable to expect that human capital endowments of migrants, at least of those from the accession candidates, will exceed those of migrants from traditional source countries of European immigration. Altogether, the shift in the country-of-origin mix for European migration is associated with a lower per capita income, lower education levels and a higher inequality in income in the source countries of European migration. Note that this trend occurred even though migration policies in western Europe have become more and more restrictive vis-à-vis non-EU and non-EEA countries. Immigration from these countries has been mainly channelled through the mechanisms of family reunification, humanitarian migration and illegal migration. The high and increasing share of non-EU and non-EEA countries does however not mean that the restrictive migration policies of the western European countries had no effects. The low immigration rates relative to northern America, Australia and New Zealand indicate that migration into other regions of the world with similar per capita income levels have been higher. Moreover, evidence from a time-series analysis of migration into Germany indicate that the shift in migration policies in the course of the 1973 recession had a substantial impact on the scale of migration, particularly from south eastern Europe (Boeri/Brücker 2001, Brücker 2001). Moreover, limiting the channels of entry to family reunification, humanitarian migration and illegal migration, certainly affected the composition of migrants with respect to their human capital characteristics. 2.4 What Do We Know About the Human Capital Characteristics of Migrants? The secular shift in the country-of-origin mix naturally had an impact on the human capital characteristics and labour market performance of migrants. The human capital characteristics of migrants in the EU and other EEA countries can be summarised by five stylised facts: 1. Migrants are younger than natives. While 17 per cent of the native population in the
EU belongs to the over 65 age group, the respective share of non-EU citizens amounts to only 4 per cent and that of EU-citizens to 11 per cent (Table 2.5). The age of recent
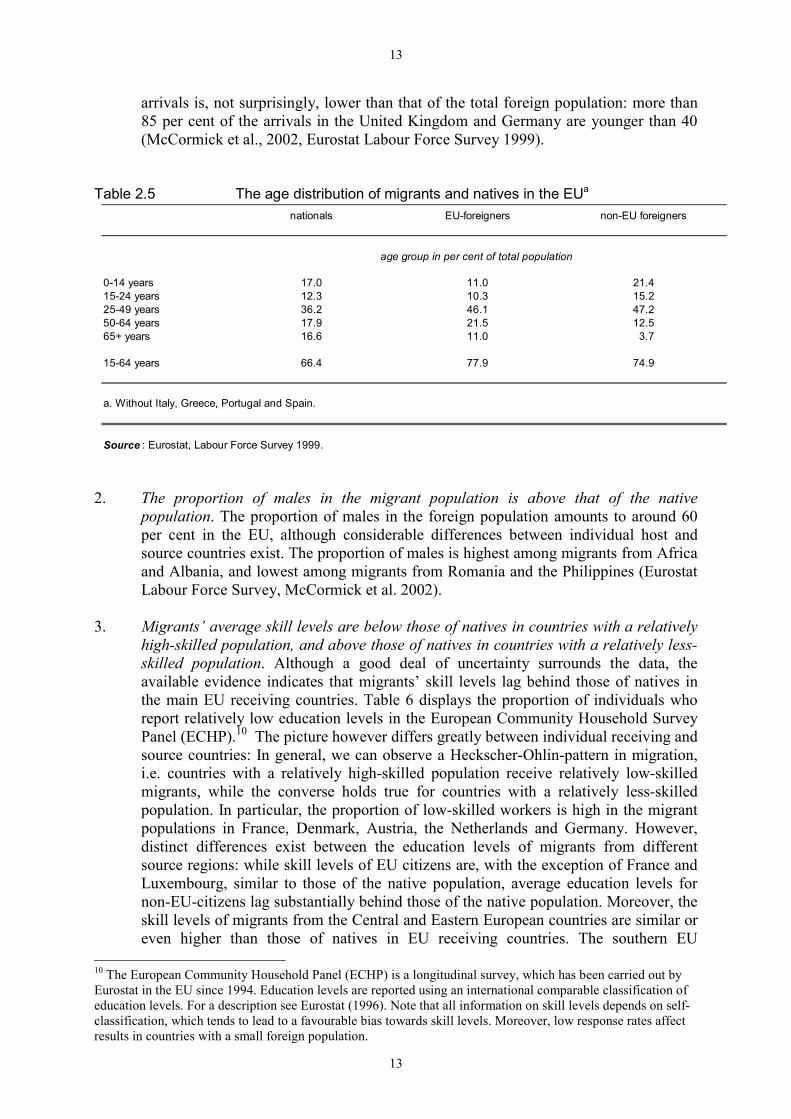
13
13
arrivals is, not surprisingly, lower than that of the total foreign population: more than 85 per cent of the arrivals in the United Kingdom and Germany are younger than 40 (McCormick et al., 2002, Eurostat Labour Force Survey 1999).
Table 2.5 The age distribution of migrants and natives in the EUa
2. The proportion of males in the migrant population is above that of the native
population. The proportion of males in the foreign population amounts to around 60 per cent in the EU, although considerable differences between individual host and source countries exist. The proportion of males is highest among migrants from Africa and Albania, and lowest among migrants from Romania and the Philippines (Eurostat Labour Force Survey, McCormick et al. 2002).
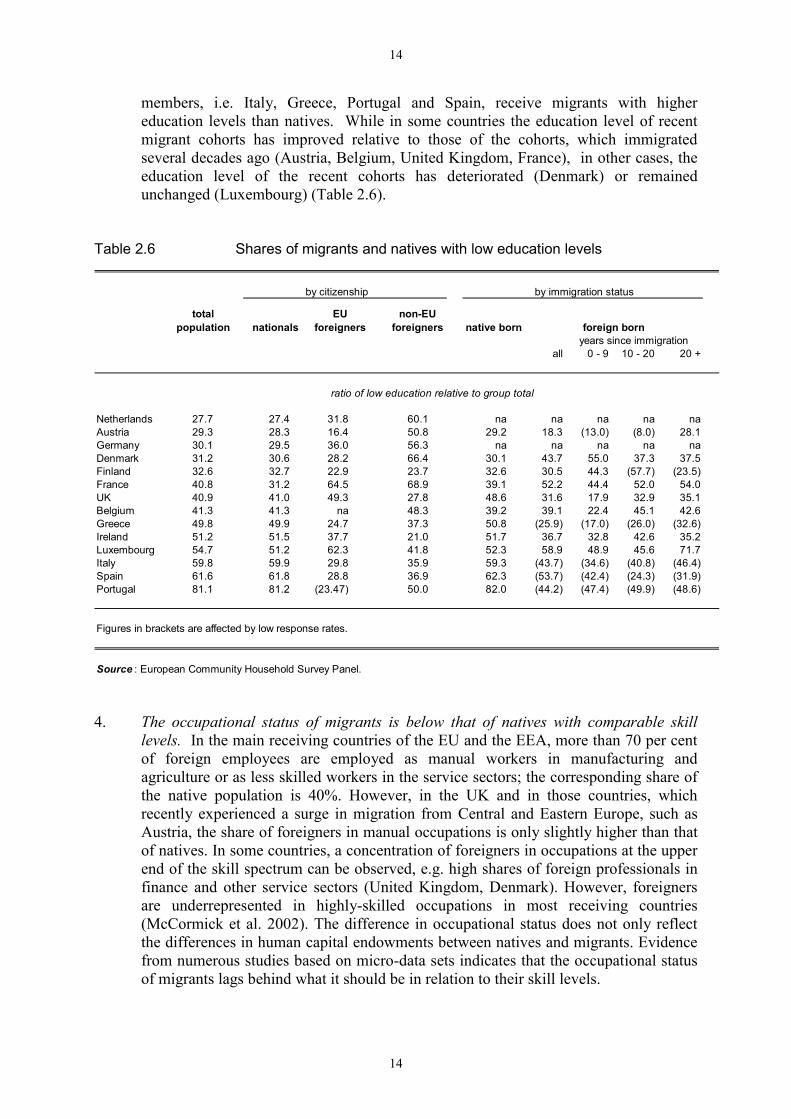
3. Migrants’ average skill levels are below those of natives in countries with a relatively
high-skilled population, and above those of natives in countries with a relatively less-skilled population. Although a good deal of uncertainty surrounds the data, the available evidence indicates that migrants’ skill levels lag behind those of natives in the main EU receiving countries. Table 6 displays the proportion of individuals who report relatively low education levels in the European Community Household Survey Panel (ECHP).10 The picture however differs greatly between individual receiving and source countries: In general, we can observe a Heckscher-Ohlin-pattern in migration, i.e. countries with a relatively high-skilled population receive relatively low-skilled migrants, while the converse holds true for countries with a relatively less-skilled population. In particular, the proportion of low-skilled workers is high in the migrant populations in France, Denmark, Austria, the Netherlands and Germany. However, distinct differences exist between the education levels of migrants from different source regions: while skill levels of EU citizens are, with the exception of France and Luxembourg, similar to those of the native population, average education levels for non-EU-citizens lag substantially behind those of the native population. Moreover, the skill levels of migrants from the Central and Eastern European countries are similar or even higher than those of natives in EU receiving countries. The southern EU
10 The European Community Household Panel (ECHP) is a longitudinal survey, which has been carried out by Eurostat in the EU since 1994. Education levels are reported using an international comparable classification of education levels. For a description see Eurostat (1996). Note that all information on skill levels depends on self-classification, which tends to lead to a favourable bias towards skill levels. Moreover, low response rates affect results in countries with a small foreign population.
0-14 years 17.0 11.0 21.415-24 years 12.3 10.3 15.225-49 years 36.2 46.1 47.250-64 years 17.9 21.5 12.565+ years 16.6 11.0 3.7
15-64 years 66.4 77.9 74.9
a. Without Italy, Greece, Portugal and Spain.
Source : Eurostat, Labour Force Survey 1999.
nationals EU-foreigners non-EU foreigners
age group in per cent of total population
14
14
members, i.e. Italy, Greece, Portugal and Spain, receive migrants with higher education levels than natives. While in some countries the education level of recent migrant cohorts has improved relative to those of the cohorts, which immigrated several decades ago (Austria, Belgium, United Kingdom, France), in other cases, the education level of the recent cohorts has deteriorated (Denmark) or remained unchanged (Luxembourg) (Table 2.6).
Table 2.6 Shares of migrants and natives with low education levels
4. The occupational status of migrants is below that of natives with comparable skill
levels. In the main receiving countries of the EU and the EEA, more than 70 per cent of foreign employees are employed as manual workers in manufacturing and agriculture or as less skilled workers in the service sectors; the corresponding share of the native population is 40%. However, in the UK and in those countries, which recently experienced a surge in migration from Central and Eastern Europe, such as Austria, the share of foreigners in manual occupations is only slightly higher than that of natives. In some countries, a concentration of foreigners in occupations at the upper end of the skill spectrum can be observed, e.g. high shares of foreign professionals in finance and other service sectors (United Kingdom, Denmark). However, foreigners are underrepresented in highly-skilled occupations in most receiving countries (McCormick et al. 2002). The difference in occupational status does not only reflect the differences in human capital endowments between natives and migrants. Evidence from numerous studies based on micro-data sets indicates that the occupational status of migrants lags behind what it should be in relation to their skill levels.
all 0 - 9 10 - 20 20 +
Netherlands 27.7 27.4 31.8 60.1 na na na na naAustria 29.3 28.3 16.4 50.8 29.2 18.3 (13.0) (8.0) 28.1Germany 30.1 29.5 36.0 56.3 na na na na naDenmark 31.2 30.6 28.2 66.4 30.1 43.7 55.0 37.3 37.5Finland 32.6 32.7 22.9 23.7 32.6 30.5 44.3 (57.7) (23.5)France 40.8 31.2 64.5 68.9 39.1 52.2 44.4 52.0 54.0UK 40.9 41.0 49.3 27.8 48.6 31.6 17.9 32.9 35.1Belgium 41.3 41.3 na 48.3 39.2 39.1 22.4 45.1 42.6Greece 49.8 49.9 24.7 37.3 50.8 (25.9) (17.0) (26.0) (32.6)Ireland 51.2 51.5 37.7 21.0 51.7 36.7 32.8 42.6 35.2Luxembourg 54.7 51.2 62.3 41.8 52.3 58.9 48.9 45.6 71.7Italy 59.8 59.9 29.8 35.9 59.3 (43.7) (34.6) (40.8) (46.4)Spain 61.6 61.8 28.8 36.9 62.3 (53.7) (42.4) (24.3) (31.9)Portugal 81.1 81.2 (23.47) 50.0 82.0 (44.2) (47.4) (49.9) (48.6)
Figures in brackets are affected by low response rates.
Source : European Community Household Survey Panel.
by citizenship by immigration status
ratio of low education relative to group total
total population nationals
EU foreigners
non-EU foreigners foreign born
years since immigrationnative born
15
15
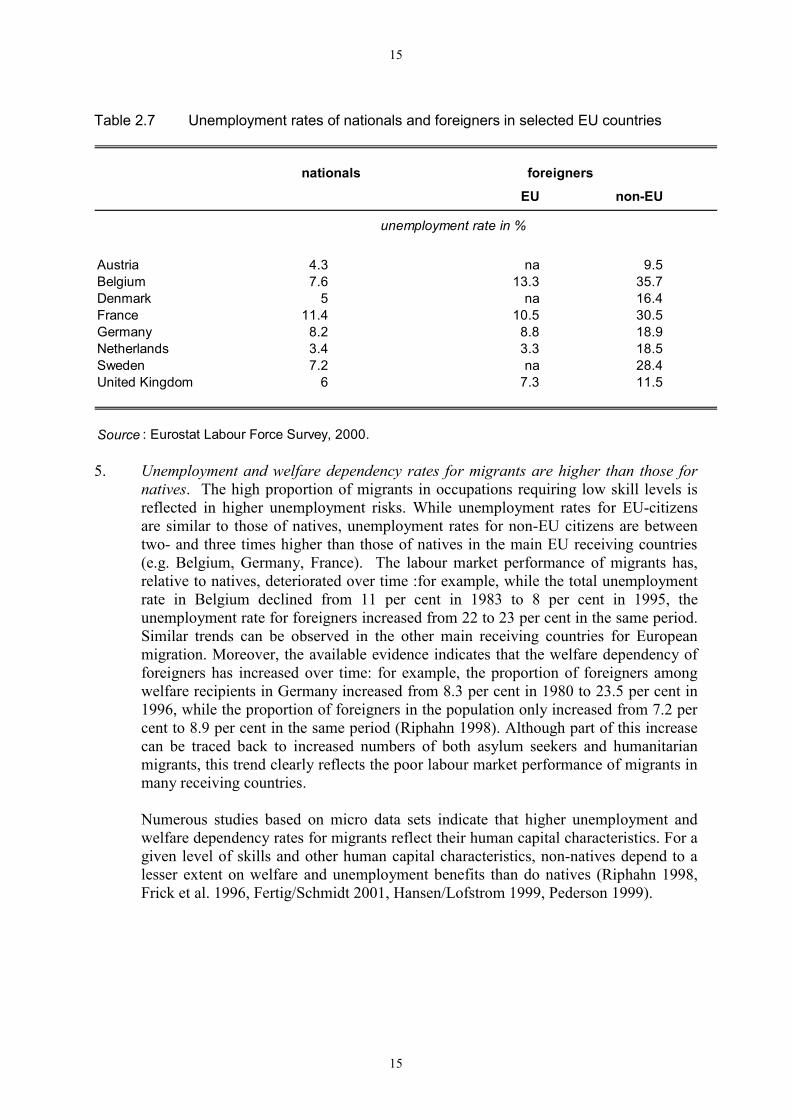
Table 2.7 Unemployment rates of nationals and foreigners in selected EU countries
5. Unemployment and welfare dependency rates for migrants are higher than those for
natives. The high proportion of migrants in occupations requiring low skill levels is reflected in higher unemployment risks. While unemployment rates for EU-citizens are similar to those of natives, unemployment rates for non-EU citizens are between two- and three times higher than those of natives in the main EU receiving countries (e.g. Belgium, Germany, France). The labour market performance of migrants has, relative to natives, deteriorated over time :for example, while the total unemployment rate in Belgium declined from 11 per cent in 1983 to 8 per cent in 1995, the unemployment rate for foreigners increased from 22 to 23 per cent in the same period. Similar trends can be observed in the other main receiving countries for European migration. Moreover, the available evidence indicates that the welfare dependency of foreigners has increased over time: for example, the proportion of foreigners among welfare recipients in Germany increased from 8.3 per cent in 1980 to 23.5 per cent in 1996, while the proportion of foreigners in the population only increased from 7.2 per cent to 8.9 per cent in the same period (Riphahn 1998). Although part of this increase can be traced back to increased numbers of both asylum seekers and humanitarian migrants, this trend clearly reflects the poor labour market performance of migrants in many receiving countries.
Numerous studies based on micro data sets indicate that higher unemployment and welfare dependency rates for migrants reflect their human capital characteristics. For a given level of skills and other human capital characteristics, non-natives depend to a lesser extent on welfare and unemployment benefits than do natives (Riphahn 1998, Frick et al. 1996, Fertig/Schmidt 2001, Hansen/Lofstrom 1999, Pederson 1999).
EU non-EU
Austria 4.3 na 9.5Belgium 7.6 13.3 35.7Denmark 5 na 16.4France 11.4 10.5 30.5Germany 8.2 8.8 18.9Netherlands 3.4 3.3 18.5Sweden 7.2 na 28.4United Kingdom 6 7.3 11.5
Source : Eurostat Labour Force Survey, 2000.
nationals
unemployment rate in %
foreigners
16
16
3. The impact of migration on the European Labour Market The high number of migrants in western Europe has raised increasing concerns that immigration will reduce the welfare of natives in host countries. These concerns focus primarily on the labour market implications of migration. Two aspects dominate the debate: (i) migration reduces the wages of natives, and (ii) migrants take jobs away from natives. The major part of empirical research addresses these questions. The impact of migration on the welfare of natives in the receiving countries is however only a part of the story. Migration also affects the welfare of natives in the source countries, and, more importantly, the welfare of migrants. A comprehensive analysis of the impact of international migration on the European labour market should therefore consider the impact of migration on natives in the source countries and as well as that on the migrants themselves. Predictions on the impact of migration on labour markets depend upon the model used. A natural starting point for the analysis is the case of a closed economy, where migrants increase the labour supply in an environment which either has clearing labour markets or persistent unemployment. This model forms the background of most of the empirical research. We also use this model as a workhorse for the calibration of the impact of migration on GDP and the distribution of income in both the host and the source countries under different economic and institutional conditions. These simulations should serve as an illustration of the quantitative implications of the different models of migration, they should not be misunderstood as an approximation of its actual impact. Section 3.1 starts with a brief review of the standard model and the presentation of the assumptions which form the background for our simulation model. The technical details are presented in the Annex. We then calibrate the impact of migration under the assumption that labour markets clear to create a point of reference (Section 3.2) and next consider the case where labour markets are characterised by persistent unemployment (Section 3.2). In this case, migration does not only affect welfare through its impact on wages and employment opportunities, but also through income redistribution by the welfare state. Moreover, welfare benefits may distort the incentives for migration and, hence, affect the size and composition of the migrant population. Section 3.3 therefore addresses the impact of varying levels of unemployment benefits on the structure of migration and its implications for GDP and income distribution. George Borjas recently made the point that the receiving countries’ traditional welfare gains from international migration increase relative to the standard case, if migrants reduce regional wage differentials in the receiving countries through arbitrage. Indeed, it can be shown that international migrants settle in prosperous regions of the receiving countries, where wage levels are significantly above, and unemployment rates below, the country average. As a consequence, the gains from migration may increase substantially relative to the case of homogenous regions if regional wage and employment differences are considered (Section 3.4). The calibration of the standard model indicates that the impact of migration on aggregate output and income distribution is substantial. This is particularly true, if we consider not only the impact of migration on natives in host countries, but also its impact on the welfare of migrants and natives in the source countries. This result relies essentially on the assumption that the economy is otherwise closed, and, hence, that labour markets bear the whole brunt of adjustment. The picture changes, if we consider the case of an open economy: in this case, the economy can adjust to an additional labour supply through migration by changing its output-mix and the composition of traded goods. Thus, migration may not affect relative wages and the distribution of income at all (Section 3.5).
17
17
It is an empirical question as to whether modelling a closed or an open economy is more appropriate in order to assess the actual impact of migration. The answer depends essentially on whether the marginal demand for labour is determined by sectors which produce tradable or non-tradable goods. The empirical literature relies largely on the standard model of a closed economy and focuses on the impact of migration on wages and the employment opportunities of natives in host countries. Findings in empirical literature indicate that the actual impact of migration on wages and the employment of natives is much smaller than the results from the calibration of the standard model - if we find an impact at all (Section 3.6). 3.1 The standard model of labour migration Public concerns about labour migration usually focus on the most simple case of an isolated economy, where only one good is produced and the labour supply of natives is inelastic. In this case, the labour market bears the whole brunt of adjustment. Assume that the good is produced with capital, skilled and unskilled labour, and that the production technology has constant returns to scale. Capital and both types of labour are complements, while high skilled labour and manual workers are imperfect substitutes. An additional supply of low-skilled labour will then raise the income of capital, reduce the wages of low-skilled labour and expand production. The impact of migration on high-skilled labour is ambiguous: the fall in wages for low-skilled workers may lead to the substitution of high-skilled workers by less-skilled ones, while the scale effect increases the demand for high-skilled labour. The total effects on the income of natives are positive in the receiving country. The converse case holds for the source country: wages for low-skilled labour increase, while income from capital falls, and the total effect on the income of those left behind is negative. Thus, the receiving country gains in terms of aggregate income and the source country loses; in the absence of transfers, the income inequality increases in the host countries and decreases in the source countries. The result that immigration increases the aggregate income of natives relies on the assumption that labour markets clear. This changes when we consider unemployment. Assume that wages for manual workers are fixed above equilibrium levels by a bargaining monopoly of unions and employer federations and that wages for high-skilled workers are flexible. As a consequence, part of the unskilled labour force is unemployed and the wages of skilled labour are below equilibrium levels. The impact of migration depends then on the collective wage setting: in the most extreme case, wages do not respond to unemployment at all. In this case, the immigration of unskilled workers simply increases aggregate unemployment for unskilled workers. The aggregate welfare of natives falls. If wages adjust partially to the additional labour supply, the effect on national income is ambiguous: production expands, the rate of return for capital increases and the wages of unskilled workers fall. The total effect (a rise or a fall) on employment depends on the scale of the wage response and the parameters of the model.
The quantitative implications of the one-good model can be illustrated by a simple simulation exercise. The technical annex describes a stylised model of a one-good economy, which draws on similar models by Levine (1999) and Bauer/Zimmermann (1997), although this study includes some additional features. The economy’s output is produced with skilled labour, unskilled labour and physical capital. Due to a lack of data we use the share of manual and non-manual workers in the labour force for the proportion of unskilled and skilled labour, although this yields only a very rough approximation of the actual proportions of skilled and unskilled labour. Production technologies are approximated by a Cobb-Douglas
18
18
function; the share of manual workers in total income has been estimated in the host countries as being 26 per cent, that of non-manual workers 45 per cent, and that of capital 29 per cent. This is an estimate for the actual factor shares in the EU (Bauer/Zimmermann, 1997). The proportion of manual workers in the labour force is estimated to be 40 per cent in the host countries. In the source countries, we assume that the proportion of manual workers is, at 70 per cent, substantially higher than that in the host countries. The factor shares in income are assumed to be 40 per cent for manual workers, 31 per cent for non-manual workers, and 29 per cent for capital. Total factor productivity and physical capital availability in the source countries are half of that in the host countries. Finally, we assume that the labour forces (manual and non-manual workers) in the host and the home country are the same size in the pre-migration state. Under these assumptions, GDP per capita in the countries of origin is almost 40 per cent of that in the host countries in the pre-migration state; the wages of manual workers are 34 per cent, and those of non-manual workers 54 per cent of those in the host countries. These proportions correspond roughly to those between the EU and the accession candidates in Central and Eastern Europe at the present, and for the North-South income gap in Europe during the 1960s. For convenience, the domestic labour supply is treated as inelastic, and physical capital and the human capital endowments of natives and migrants are treated as fixed. This means that we simulate the case of a short-term adjustment. In the long-run, the economy adjusts to migration by the accumulation of physical and human capital, such that the impact of migration on relative wages and employment is expected to be lower. 3.2 The impact of migration in a full-employment economy
Following Borjas (1995) and Bauer/Zimmermann (1997), we use the case of perfectly flexible labour markets as a point of reference. As a consequence, unemployment in both economies is zero and all migrants are immediately absorbed by host labour markets. Owing to the assumptions made on technology and factor proportions, the factor price elasticity for manual workers in the host country is –0.74, and for non-manual workers –0.55, i.e. the wages of manual workers fall by 0.74 per cent if the number of manual workers increases by one per cent, and the wages of non-manual workers fall by 0.55 per cent if their number increases by one per cent. In the source country, the factor price elasticity of manual labour is –0.6, and that of non-manual labour –0.69 respectively. The elasticity of the wage rate for manual labour with respect to a change in the number of non-manual workers is 0.45, and the elasticity of wages for non-manual workers with respect to a change in the number of manual workers is 0.26.
19
19
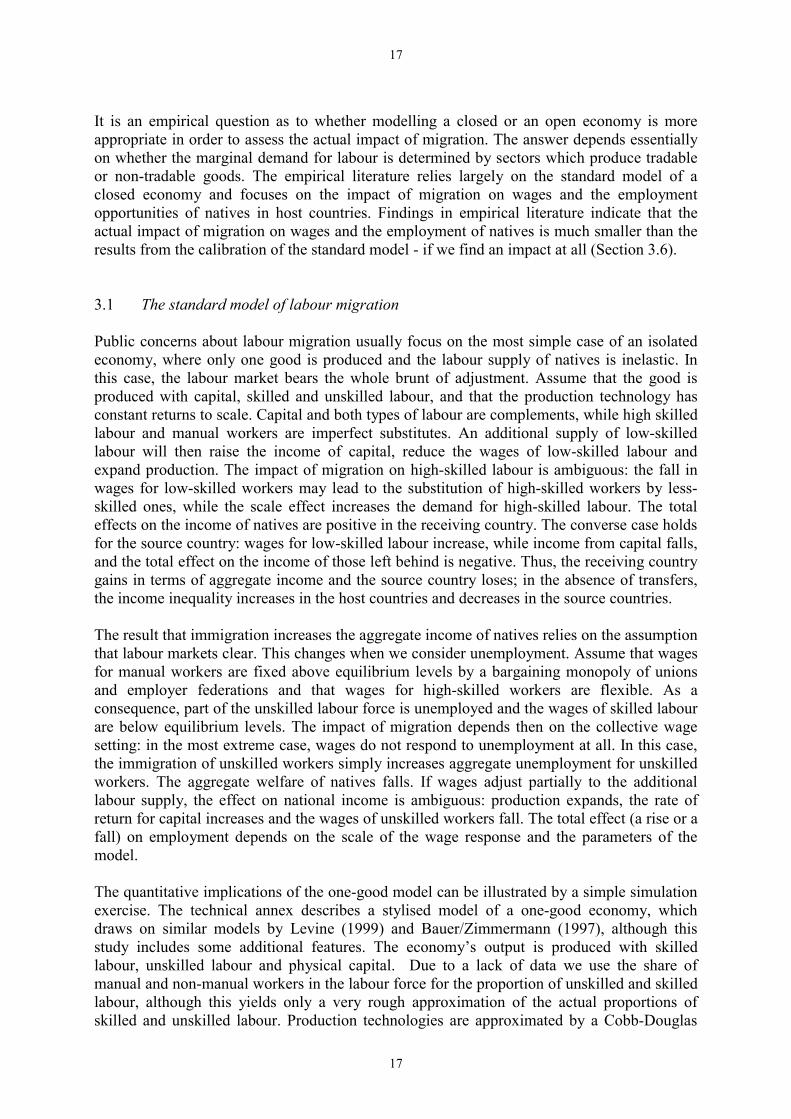
Table 3.1 The impact of migration on GDP and income distribution in an economy with full-employment
Notes: See text and technical Annex for the assumptions of the simulation model. Thus, the impact of migration depends essentially on the migrants’ human capital characteristics. Table 3.1 displays the impact of one per cent of the workforce immigrating (emigrating). As expected, total domestic income increases in the host region, while that in the country of origin falls. Interestingly enough, the benefits of migration are highest for the natives in the host countries at the extreme ends of the skill spectrum, i.e. if only manual workers or only non-manual workers immigrate. The higher the complementarity of the skills of migrants to those of natives, the higher the gains are. The aggregate impact of migration on native income is however, with a maximum of 0.006 per cent, negligible. Nevertheless, with the EU’s GDP of 7.6 trillion EURO in 1998, an increase in the labour force of 1 % through the immigration of manual workers would still have yielded 460 million EURO. The gains from migration become even more important when we consider the impact it has on all participants: the total gain in income for the host countries, the source countries and the migrants amounts to between 0.24 and 0.3 per cent of the region’s GDP, which with a total GDP of 10 trillion EURO is equivalent to between 24 and 30 billion EURO. Most of these gains accrue to the migrants. Moreover, migration has important implications on the income distribution among natives: capital gains substantially in the host country and loses substantially in the country of origin, while the impact on wages depends on the skill composition of migrants. In an extreme case where all migrants are manual workers, the wage for manual workers falls by almost 1.8 per cent, while the wage for skilled labour increases by almost 0.7 per cent. The wages of manual workers increase by almost 0.9 per cent, and those of non-manual workers fall by almost 0.6 per cent in the source countries, if all emigrants are manual workers. Thus, it depends on the perspective as to whether migration increases or reduces the inequality in income distribution: from the perspective of the source country, the
1 0.7 0.5 0.3 0
total GDP host country 0.64 0.68 0.70 0.72 0.75source country -0.57 -0.71 -0.80 -0.90 -1.05total region 0.30 0.29 0.28 0.26 0.24
total income of natives host country 0.006 0.002 0.001 0.001 0.003source country -0.003 -0.001 -0.002 -0.005 -0.013total region 0.004 0.001 0.000 -0.001 -0.001
total income of migrants 186.48 144.07 123.05 105.72 84.48
wage manual workers host country -1.81 -1.05 -0.54 -0.03 0.75source country 0.87 0.29 -0.09 -0.47 -1.05total region 0.19 0.16 0.14 0.11 0.07
wage non-manual workers host country 0.64 0.18 -0.13 -0.44 -0.90source country -0.57 0.29 0.88 1.47 2.37total region 0.39 0.38 0.38 0.38 0.37
real interest rate host country 0.64 0.68 0.70 0.72 0.75source country -0.57 -0.71 -0.80 -0.90 -1.05total region 0.30 0.29 0.28 0.26 0.24
share of manual workers in the migrant population
percentage change at an immigration (emigration) of 1 % of the labour force
20
20
income of labour increases while capital income declines; the converse holds for the host countries. In the region as a whole, income disparities tend to decline. 3.3 The impact of migration in an economy with persistent unemployment What are the implications of a change in migration, if we consider other labour market conditions. Consider the following stylised model for wage setting (Levine 1999): at the beginning of each period, wage rates are determined by a bilateral bargaining monopoly of trade unions and employer federations. In the second stage, firms hire manual and non-manual workers until their marginal product equals the negotiated wage rate; the participants in the wage negotiations are aware of this. Collective wage setting responds to an increase in unemployment, but does so imperfectly. As a consequence, a part of the labour force remains unemployed and not all migrants are absorbed by host labour markets. According to the classical approach from Harris and Todaro (1970), in each period jobs are allocated among members of the workforce – natives and migrants - using a random draw. The employment opportunities of migrants are however assumed to be below those of natives. Note that this implies that a part of the unemployment risk is shifted from natives to migrants. The unemployed receive an unemployment benefit, which is a uniform proportion of the post-tax wage. The unemployment benefit is financed by a uniform tax rate on all labour incomes. Taxes are set such that they just equal the unemployment benefit; all other taxes and public debts are ignored. Thus, migration can affect the income of natives and migrants in three ways: a change in (i) the (negotiated) wage rate, (ii) the employment opportunities, and (iii) the tax rate. Throughout this section, we assume that the unemployment risk of a migrant is, for a given skill level, twice as high as that of a native in the host country, and that the share of unemployment benefits in post-tax wages is 0.3. The former assumption corresponds to the relationship between unemployment rates for migrants and those for natives in the EU and the latter is a reasonable approximation for western European countries (Layard et al. 1991). The implications of a variation in the generosity of unemployment benefits are analysed in the next section. In order to analyse the impact of migration in an environment with unemployment, we consider different degrees of flexibility for wage setting in our calibrations. Table 3.2 reports the impact of a one per cent increase in the labour force through migration on GDP, on the income of the various production factors, on the nominal wage rate, on the post-tax wage rate, and on the unemployment rate. First consider the extreme case of wages for manual labour that do not respond to the unemployment rate at all, while the wages for non-manual labour are perfectly elastic. These restrictive assumptions are relaxed later. The average unemployment rate is assumed to be 10 per cent in both the host and the home country. Since wages for skilled labour are flexible, the unemployment of non-manual workers is zero. Given the shares of manual and non-manual workers in the total labour force, this implies that the unemployment rate for manual labour is 25 per cent in the host country, and 14.3 per cent in the source country. In the first column of Table 3.2, it is assumed that the share of manual workers in the migrant population is 70 per cent; in the second column that 70 per cent of migrants are non-manual workers. In the first case, if one per cent of the labour force emigrates, the unemployment rate in the host countries increases by 0.5 percentage points; although the migrants themselves bear a large part of this burden. The income of natives in the host country falls by almost 0.3 per cent, while that of natives in the source countries increases. Following our assumptions,
21
21
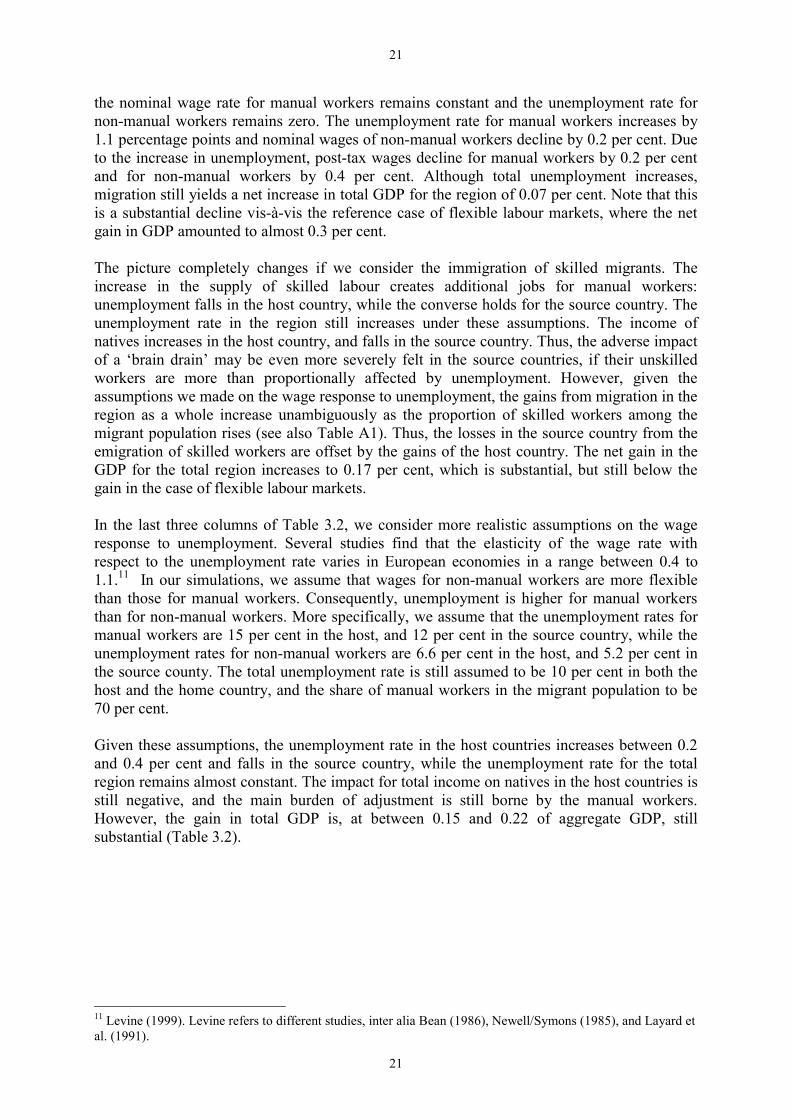
the nominal wage rate for manual workers remains constant and the unemployment rate for non-manual workers remains zero. The unemployment rate for manual workers increases by 1.1 percentage points and nominal wages of non-manual workers decline by 0.2 per cent. Due to the increase in unemployment, post-tax wages decline for manual workers by 0.2 per cent and for non-manual workers by 0.4 per cent. Although total unemployment increases, migration still yields a net increase in total GDP for the region of 0.07 per cent. Note that this is a substantial decline vis-à-vis the reference case of flexible labour markets, where the net gain in GDP amounted to almost 0.3 per cent. The picture completely changes if we consider the immigration of skilled migrants. The increase in the supply of skilled labour creates additional jobs for manual workers: unemployment falls in the host country, while the converse holds for the source country. The unemployment rate in the region still increases under these assumptions. The income of natives increases in the host country, and falls in the source country. Thus, the adverse impact of a ‘brain drain’ may be even more severely felt in the source countries, if their unskilled workers are more than proportionally affected by unemployment. However, given the assumptions we made on the wage response to unemployment, the gains from migration in the region as a whole increase unambiguously as the proportion of skilled workers among the migrant population rises (see also Table A1). Thus, the losses in the source country from the emigration of skilled workers are offset by the gains of the host country. The net gain in the GDP for the total region increases to 0.17 per cent, which is substantial, but still below the gain in the case of flexible labour markets. In the last three columns of Table 3.2, we consider more realistic assumptions on the wage response to unemployment. Several studies find that the elasticity of the wage rate with respect to the unemployment rate varies in European economies in a range between 0.4 to 1.1.11 In our simulations, we assume that wages for non-manual workers are more flexible than those for manual workers. Consequently, unemployment is higher for manual workers than for non-manual workers. More specifically, we assume that the unemployment rates for manual workers are 15 per cent in the host, and 12 per cent in the source country, while the unemployment rates for non-manual workers are 6.6 per cent in the host, and 5.2 per cent in the source county. The total unemployment rate is still assumed to be 10 per cent in both the host and the home country, and the share of manual workers in the migrant population to be 70 per cent. Given these assumptions, the unemployment rate in the host countries increases between 0.2 and 0.4 per cent and falls in the source country, while the unemployment rate for the total region remains almost constant. The impact for total income on natives in the host countries is still negative, and the main burden of adjustment is still borne by the manual workers. However, the gain in total GDP is, at between 0.15 and 0.22 of aggregate GDP, still substantial (Table 3.2).
11 Levine (1999). Levine refers to different studies, inter alia Bean (1986), Newell/Symons (1985), and Layard et al. (1991).
22
22
Table 3.2 The impact of migration in an economy with unemployment
Notes: See text and Annex for assumptions.
semi-elasticity of wage with respect tounemployment rate manual wages 0.0 0.0 -0.4 -1.0 -1.5 non-manual wages −∝ −∝ -1.0 -1.5 -3.0share of manual workersin migrant population 0.7 0.3 0.7 0.7 0.7
total GDP host country 0.30 0.71 0.39 0.50 0.55source country -0.52 -1.21 -0.47 -0.56 -0.61total region 0.07 0.17 0.15 0.20 0.22
total income host country -0.28 0.04 -0.22 -0.11 -0.07of natives source country 0.21 -0.36 0.26 0.16 0.10
total region -0.15 -0.07 -0.09 -0.04 -0.02of these: manual workers host country -0.72 0.13 -0.92 -0.87 -0.86
source country 0.42 -0.67 0.52 0.43 0.38total region -0.31 -0.17 -0.40 -0.40 -0.41
non-manual workers host country -0.40 -0.46 -0.21 -0.04 0.02source country 0.58 1.00 0.56 0.45 0.40total region -0.19 -0.16 -0.05 0.05 0.09
capital owners host country 0.30 0.71 0.39 0.50 0.55source country -0.52 -1.21 -0.47 -0.56 -0.61total region 0.07 0.17 0.15 0.20 0.22
total income of migrants 109.35 92.21 120.09 120.74 120.98
post-tax wage rate manual workers host country -0.20 -0.01 -0.48 -0.65 -0.73
source country 0.09 -0.16 0.25 0.28 0.27total region 0.15 0.49 0.15 0.19 0.19
non-manual workers host country -0.40 -0.46 -0.19 -0.08 -0.03source country 0.58 1.00 0.37 0.33 0.33total region 0.15 0.49 0.15 0.19 0.19
total unemployment host country 0.50 -0.01 0.40 0.25 0.20rate source country -0.29 0.53 -0.32 -0.20 -0.13
total region 0.11 0.26 0.04 0.03 0.03
manual workers host country 1.07 0.03 0.85 0.56 0.44source country -0.41 0.67 -0.35 -0.21 -0.15total region 0.20 0.46 0.11 0.10 0.09
non-manual workers host country 0.00 0.00 0.05 0.00 -0.01source country 0.00 0.00 -0.26 -0.17 -0.10total region 0.00 0.00 -0.05 -0.05 -0.03
percentage change at an immigration (emigration) of 1 % of the labour force
change of unemployment rate in percentage points
23
23
3.4 Do unemployment benefits reduce welfare? Welfare benefits can affect the gains and losses from migration in two ways: (i) directly, by redistributing income between natives and migrants, and, (ii) indirectly, by affecting the size and composition of the migrant population with regard to their human capital characteristics. The last point in particular attracted increasing attention in the theoretical and empirical discussion in the second half of the 1990s. Based on the Roy (1951) model, it argues that, ceteris paribus, the ‘quality’ of the migrant population with respect to their human capital characteristics and other abilities relevant to their labour market performance increases, if the inequality in the distribution of income rises in the host country relative to that in the source country (Borjas 1997), and vice versa. Thus, increasing the redistribution of income through welfare benefits reduces, ceteris paribus, the skill level and ability of the migrant population. Moreover, the scale of migration increases above the ‘optimal’ level if the incentives to migrate are distorted by welfare benefits (Sinn et al. 2001). However, the propositions of the Roy model rely on a set of restrictive assumptions on the structure of migration costs, and the pecuniary and human abilities of high-skilled individuals or households to move relative to the less-skilled. Other assumptions may yield converse conclusions (Chiswick 2000). The empirical evidence which has been provided so far for the Roy model is weak, since comparable data on the skill structure of the population in the host and the home country and that of the migrants is missing. Using our simple simulation model, we analyse the impact of welfare benefits in two steps. In the first step, we examine the impact on the distribution of income for a given rate of migration. The second step analyses how the migration rate may respond to a change in the size of unemployment benefits. It is worth noting that our simulations on the impact of welfare benefits rely on a set of arbitrary assumptions. Firstly, borrowing from the Harris/Todaro (1970) approach, it is assumed that jobs are allocated by a random draw among members of the workforce in each period. Thus, we cannot analyse the impact of welfare benefits on the migration propensity of individuals who face a high risk of long-term unemployment due to certain personal characteristics. Secondly, we limit the analysis to the impact of unemployment benefits and ignore other important aspects such as the intertemporal redistribution of income between generations. The latter can affect the redistribution of income to a higher extent than unemployment benefits (see Section 4). Thirdly, we treat the unemployment rate as given, i.e. we ignore the impact of unemployment benefits on wage bargaining and the labour market participation of individuals. An examination of these aspects is beyond the scope of our simple simulation model. Thus, we capture only a part of the problem.
24
24
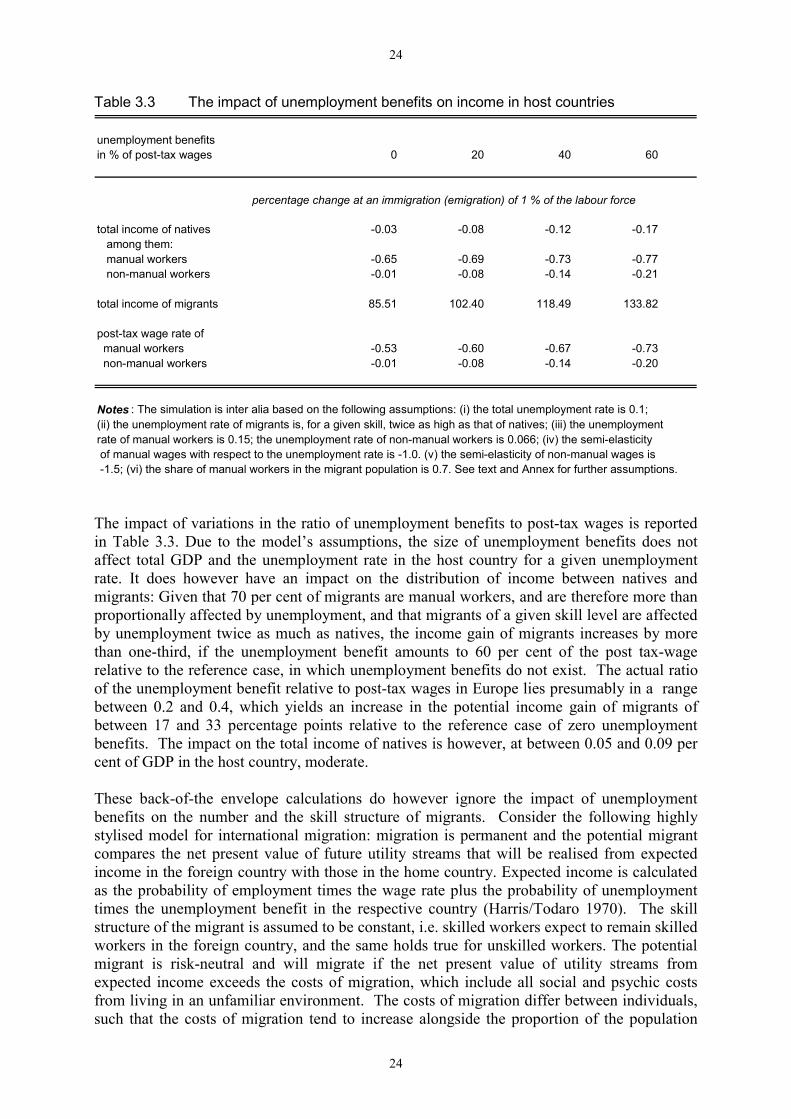
Table 3.3 The impact of unemployment benefits on income in host countries
The impact of variations in the ratio of unemployment benefits to post-tax wages is reported in Table 3.3. Due to the model’s assumptions, the size of unemployment benefits does not affect total GDP and the unemployment rate in the host country for a given unemployment rate. It does however have an impact on the distribution of income between natives and migrants: Given that 70 per cent of migrants are manual workers, and are therefore more than proportionally affected by unemployment, and that migrants of a given skill level are affected by unemployment twice as much as natives, the income gain of migrants increases by more than one-third, if the unemployment benefit amounts to 60 per cent of the post tax-wage relative to the reference case, in which unemployment benefits do not exist. The actual ratio of the unemployment benefit relative to post-tax wages in Europe lies presumably in a range between 0.2 and 0.4, which yields an increase in the potential income gain of migrants of between 17 and 33 percentage points relative to the reference case of zero unemployment benefits. The impact on the total income of natives is however, at between 0.05 and 0.09 per cent of GDP in the host country, moderate. These back-of-the envelope calculations do however ignore the impact of unemployment benefits on the number and the skill structure of migrants. Consider the following highly stylised model for international migration: migration is permanent and the potential migrant compares the net present value of future utility streams that will be realised from expected income in the foreign country with those in the home country. Expected income is calculated as the probability of employment times the wage rate plus the probability of unemployment times the unemployment benefit in the respective country (Harris/Todaro 1970). The skill structure of the migrant is assumed to be constant, i.e. skilled workers expect to remain skilled workers in the foreign country, and the same holds true for unskilled workers. The potential migrant is risk-neutral and will migrate if the net present value of utility streams from expected income exceeds the costs of migration, which include all social and psychic costs from living in an unfamiliar environment. The costs of migration differ between individuals, such that the costs of migration tend to increase alongside the proportion of the population
unemployment benefits in % of post-tax wages 0 20 40 60
total income of natives -0.03 -0.08 -0.12 -0.17 among them: manual workers -0.65 -0.69 -0.73 -0.77 non-manual workers -0.01 -0.08 -0.14 -0.21
total income of migrants 85.51 102.40 118.49 133.82
post-tax wage rate of manual workers -0.53 -0.60 -0.67 -0.73 non-manual workers -0.01 -0.08 -0.14 -0.20
Notes : The simulation is inter alia based on the following assumptions: (i) the total unemployment rate is 0.1; (ii) the unemployment rate of migrants is, for a given skill, twice as high as that of natives; (iii) the unemployment rate of manual workers is 0.15; the unemployment rate of non-manual workers is 0.066; (iv) the semi-elasticity of manual wages with respect to the unemployment rate is -1.0. (v) the semi-elasticity of non-manual wages is -1.5; (vi) the share of manual workers in the migrant population is 0.7. See text and Annex for further assumptions.
percentage change at an immigration (emigration) of 1 % of the labour force
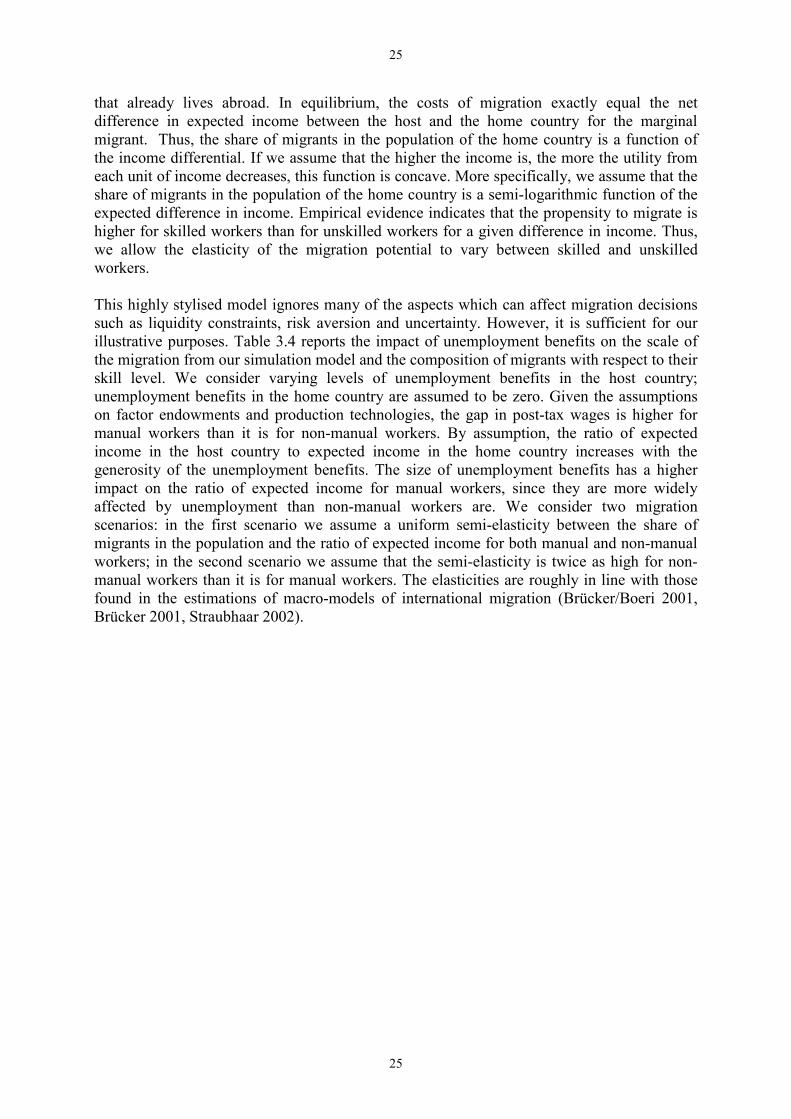
25
25
that already lives abroad. In equilibrium, the costs of migration exactly equal the net difference in expected income between the host and the home country for the marginal migrant. Thus, the share of migrants in the population of the home country is a function of the income differential. If we assume that the higher the income is, the more the utility from each unit of income decreases, this function is concave. More specifically, we assume that the share of migrants in the population of the home country is a semi-logarithmic function of the expected difference in income. Empirical evidence indicates that the propensity to migrate is higher for skilled workers than for unskilled workers for a given difference in income. Thus, we allow the elasticity of the migration potential to vary between skilled and unskilled workers. This highly stylised model ignores many of the aspects which can affect migration decisions such as liquidity constraints, risk aversion and uncertainty. However, it is sufficient for our illustrative purposes. Table 3.4 reports the impact of unemployment benefits on the scale of the migration from our simulation model and the composition of migrants with respect to their skill level. We consider varying levels of unemployment benefits in the host country; unemployment benefits in the home country are assumed to be zero. Given the assumptions on factor endowments and production technologies, the gap in post-tax wages is higher for manual workers than it is for non-manual workers. By assumption, the ratio of expected income in the host country to expected income in the home country increases with the generosity of the unemployment benefits. The size of unemployment benefits has a higher impact on the ratio of expected income for manual workers, since they are more widely affected by unemployment than non-manual workers are. We consider two migration scenarios: in the first scenario we assume a uniform semi-elasticity between the share of migrants in the population and the ratio of expected income for both manual and non-manual workers; in the second scenario we assume that the semi-elasticity is twice as high for non-manual workers than it is for manual workers. The elasticities are roughly in line with those found in the estimations of macro-models of international migration (Brücker/Boeri 2001, Brücker 2001, Straubhaar 2002).
26
26
Table 3.4 The impact of unemployment benefits on potential migration and income
Given these assumptions, an increase in unemployment benefits does indeed lead to (i) an increasing number of migrants, and (ii) an increase in the share of manual relative to the share of non-manual workers. However, the impact of unemployment on the scale and structure of migration is fairly moderate: an unemployment benefit of 60 per cent of the post-tax wage increases the share of migrants in the home population by 0.5 percentage points in both scenarios, and the share of manual workers in the migrant population increases in a range between 2 and 3 percentage points. These moderate results turn out to be robust to a wide
share of unemployment benefit in post-tax wage income 0 20 40 60
ratio of post-tax wages manual workers 3.00 2.99 2.99 2.98 non-manual workers 1.88 1.88 1.88 1.88
ratio of expected income manual workers 2.39 2.52 2.64 2.76 non-manual workers 1.72 1.73 1.73 1.74
total migration as a % of population 3.87 4.06 4.23 4.38 share of manual workers 0.79 0.80 0.81 0.81
total GDP host country 1.87 1.96 2.03 2.11source country -1.99 -2.07 -2.13 -2.21total region 0.79 0.82 0.86 0.89
income of natives host country -0.28 -0.42 -0.56 -0.70 manual workers -4.25 -4.39 -4.50 -4.52 non-manual workers 0.61 0.45 0.28 0.05 capital owners 1.87 1.96 2.03 2.11income of migrants 113.28 124.75 136.01 145.88
total migration as a % of population 4.68 4.88 5.05 5.21 share of manual workers 0.65 0.66 0.67 0.68
total GDP host country 2.41 2.50 2.58 2.65source country -2.75 -2.84 -2.92 -2.98total region 0.96 1.00 1.03 1.06
income of natives host country -0.33 -0.46 -0.60 -0.75 manual workers -3.73 -3.92 -4.09 -4.24 non-manual workers -0.12 -0.33 -0.54 -0.76 capital owners 2.41 2.50 2.58 2.65income of migrants 103.63 113.11 122.48 131.72
1) The semi-elasticity of the migration share with respect to expected income is 0.05. - 2) The semi-elasticity of the migration with respect to expected income is 0.05 for manual workers, and0.1 for non-manual workers.
Notes : The simulation is inter alia based on the following assumptions: (i) the total unemployment rate is 0.1; (ii) the unemployment rate of migrants is, for a given skill, twice as high as that of natives; (iii) the unemployment rate of manual workers is 0.15; the unemployment rate of non-manual workers is 0.066; (iv) the semi-elasticity of manual wages with respect to the unemployment rate is -1.0. (v) the semi-elasticity of non-manual wages is -1.5. See text and Annex for further assumptions.
migration scenario I 1)
migration scenario II 2)
percentage increase (decrease)
percentage increase (decrease)
27
27
range of assumptions. Note that the average share of unemployment benefits in post-tax wages hovers around 30 per cent in western Europe and that the assumption that unemployment benefits are zero in the source countries is an exaggeration. Thus, even under the assumptions of the Roy model, the impact of unemployment benefits on the size and composition of the migrant population seems to be rather small. Now let us finally consider the impact of unemployment benefits on the total income of natives and migrants. Increasing unemployment benefits mainly affects the income of natives and migrants through the direct redistribution of income. Given the assumptions for both scenarios, a share of unemployment benefits of 60 per cent in post-tax wages reduces the income of natives by around 0.4 per cent, while the income of migrants is increased by around 30 percentage points, relative to the reference case of zero unemployment benefits. Interestingly enough, given the assumptions for our model, the total GDP of both countries increases by 0.1 per cent if the share of unemployment benefits amount to 60 per cent of post-tax wage income, relative to the case of zero unemployment benefits. This can be traced back to the scale effect of migration, i.e. higher unemployment benefits motivate more migrants to move to the place where their human resources are more efficiently used. However, this result relies heavily on the arbitrary assumption that the size of unemployment benefits does not affect the unemployment rate and that it does not motivate individuals with lower abilities to move. 3.5 Can international migration grease the wheels of the labour market? Regional labour mobility is one - and probably the most important - way of absorbing economic shocks. An influential paper by Blanchard and Katz (1992) provides evidence that labour mobility has been the main factor in reducing differences in wages and unemployment rates across US regions in the wake of regional demand shocks. Regional labour mobility is however much lower in Europe than in the US: Barro and Sala-i-Martin (1995) show that the elasticity of migration with respect to regional wage differentials is around one-third of the US level in the EU. Recently, Borjas (2001) made the point that international migration may “grease the wheels of the labour market” in host countries by reducing regional wage differentials, especially if domestic labour mobility is low. Consider the following case: the host country consists of two regions, a low wage region and a high wage region. Domestic migration has already achieved an equilibrium, i.e. the costs for moving from the low-wage region into the high-wage region equal the net difference in expected income for the marginal native migrant. Hence, regional domestic migration has ceased in the host country. Now consider the impact of international migration. The difference between the wage in the high income region of the host country and the wage of the foreign country is higher than the wage difference between the high and the low income regions in the host country. Thus, pecuniary incentives for migration are higher for foreign workers than for natives. International migrants will move into the high wage region, since expected incomes are higher there. Hence, international migration reduces the regional wage differential in the host country. This increases the productivity of the remaining production factors, and the impact of international migration on the GDP in host countries is higher than that in the case with no regional wage differences. It is straightforward to extend these considerations to the case of regional differences in unemployment rates. Although the country’s average unemployment rates may be high, there may be a shortage of labour in the high-income region of the host country. Thus, the
28
28
international migration of labour may not affect the unemployment rate in the host country (or may even reduce it), while total GDP and income of the domestic production factors will increase. The calibration of the implications of regional wage and employment differences is straightforward. We assume that the host country consists of two regions, and that the proportion of manual and non-manual labour is the same in each region. The income shares of the production factors are the same as in our baseline model. Total factor productivity and the physical capital stock are 20 per cent above the country average in the high income region, and 20 per cent below the country average in the low-income region. Given the assumptions of our model, this implies that in case of full-employment GDP, wages for manual, and wages for non-manual labour are 26 per cent above the country average in the high income region, and 26 per cent below it in the low-income region. Note that regional income differences of this scale are not unfamiliar for European economies. The assumptions of the baseline model apply for the source country. The average difference in GDP and wages between the host country and the source country is the same as in the baseline model. We furthermore assume that all migrants move into the high-income region, and that 70 per cent of the migrants are manual workers. Given these assumptions, the gains from international migration increase substantially relative to the reference case of homogenous regions. In Table 3.5, we consider three different scenarios: In the first scenario, labour markets clear in both regions of the host country and the source country. The first column of Table 3.5 reports the impact of migration when a regional wage differential exists, the second column the reference case for homogenous regions. Relative to the reference case, the gain in total GDP from migration increases from 0.29 to 0.41 per cent, and the gain of natives in the host country from migration from 0.002 per cent to 0.005 per cent. In the second scenario, we consider the case where labour markets clear in the high wage region, but where substantial unemployment exists in the low-wage region. The minimum wage agreed on in collective bargaining is only of relevance in the low-income region, i.e. wages in the high-income region are elastic. In the reference case, we assume that unemployment is equally distributed across both regions and that the wage elasticity of both regions is higher than in the low wage region. In this case, the gains from migration even exceed the gains in the case of clearing labour markets. In the third scenario, it is assumed that both regions are affected by unemployment, but that a substantial difference in unemployment rates and the wage elasticity exists between the high and the low income region. This case might be more realistic than the first two examples. The gains from migration are still above that of the reference case with equal wage and unemployment rates, but below those of the examples with clearing labour markets in the high-wage region (Table 3.5).
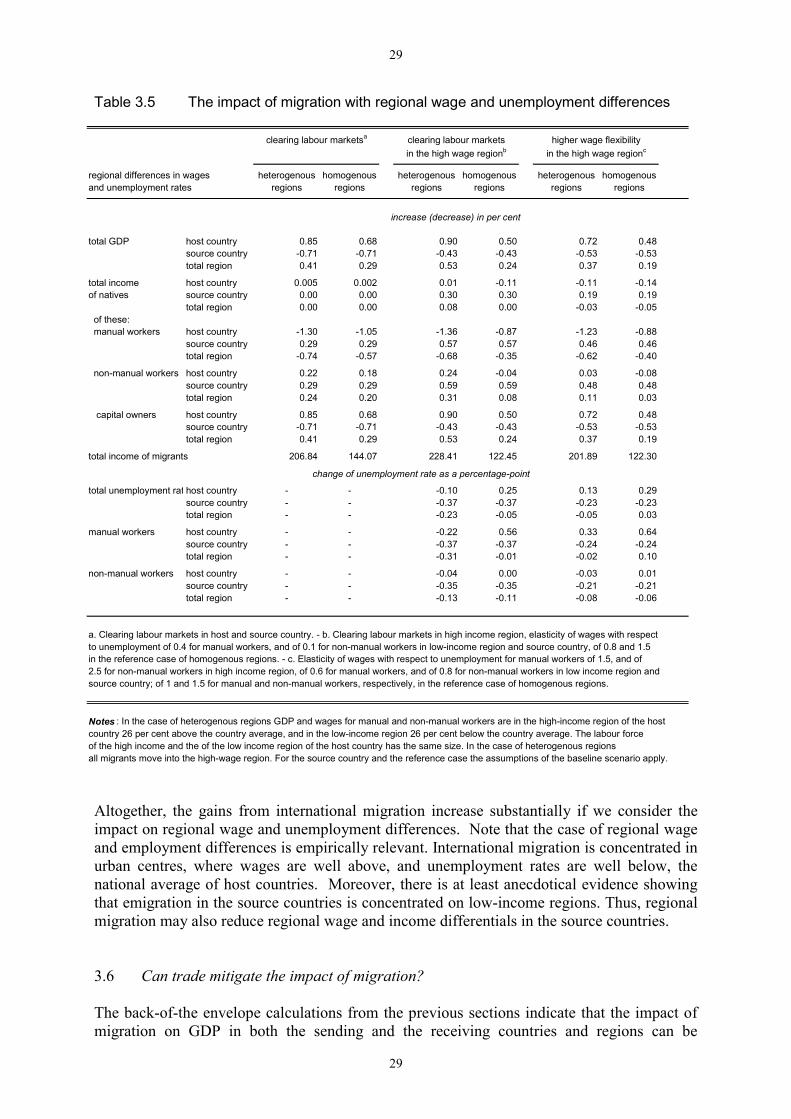
29
29
Table 3.5 The impact of migration with regional wage and unemployment differences
Altogether, the gains from international migration increase substantially if we consider the impact on regional wage and unemployment differences. Note that the case of regional wage and employment differences is empirically relevant. International migration is concentrated in urban centres, where wages are well above, and unemployment rates are well below, the national average of host countries. Moreover, there is at least anecdotical evidence showing that emigration in the source countries is concentrated on low-income regions. Thus, regional migration may also reduce regional wage and income differentials in the source countries. 3.6 Can trade mitigate the impact of migration? The back-of-the envelope calculations from the previous sections indicate that the impact of migration on GDP in both the sending and the receiving countries and regions can be
regional differences in wages heterogenous homogenous heterogenous homogenous heterogenous homogenousand unemployment rates regions regions regions regions regions regions
total GDP host country 0.85 0.68 0.90 0.50 0.72 0.48source country -0.71 -0.71 -0.43 -0.43 -0.53 -0.53total region 0.41 0.29 0.53 0.24 0.37 0.19
total income host country 0.005 0.002 0.01 -0.11 -0.11 -0.14of natives source country 0.00 0.00 0.30 0.30 0.19 0.19
total region 0.00 0.00 0.08 0.00 -0.03 -0.05 of these: manual workers host country -1.30 -1.05 -1.36 -0.87 -1.23 -0.88
source country 0.29 0.29 0.57 0.57 0.46 0.46total region -0.74 -0.57 -0.68 -0.35 -0.62 -0.40
non-manual workers host country 0.22 0.18 0.24 -0.04 0.03 -0.08source country 0.29 0.29 0.59 0.59 0.48 0.48total region 0.24 0.20 0.31 0.08 0.11 0.03
capital owners host country 0.85 0.68 0.90 0.50 0.72 0.48source country -0.71 -0.71 -0.43 -0.43 -0.53 -0.53total region 0.41 0.29 0.53 0.24 0.37 0.19
total income of migrants 206.84 144.07 228.41 122.45 201.89 122.30
total unemployment rat host country - - -0.10 0.25 0.13 0.29source country - - -0.37 -0.37 -0.23 -0.23total region - - -0.23 -0.05 -0.05 0.03
manual workers host country - - -0.22 0.56 0.33 0.64source country - - -0.37 -0.37 -0.24 -0.24total region - - -0.31 -0.01 -0.02 0.10
non-manual workers host country - - -0.04 0.00 -0.03 0.01source country - - -0.35 -0.35 -0.21 -0.21total region - - -0.13 -0.11 -0.08 -0.06
a. Clearing labour markets in host and source country. - b. Clearing labour markets in high income region, elasticity of wages with respectto unemployment of 0.4 for manual workers, and of 0.1 for non-manual workers in low-income region and source country, of 0.8 and 1.5in the reference case of homogenous regions. - c. Elasticity of wages with respect to unemployment for manual workers of 1.5, and of2.5 for non-manual workers in high income region, of 0.6 for manual workers, and of 0.8 for non-manual workers in low income region andsource country; of 1 and 1.5 for manual and non-manual workers, respectively, in the reference case of homogenous regions.
Notes : In the case of heterogenous regions GDP and wages for manual and non-manual workers are in the high-income region of the host country 26 per cent above the country average, and in the low-income region 26 per cent below the country average. The labour force of the high income and the of the low income region of the host country has the same size. In the case of heterogenous regions all migrants move into the high-wage region. For the source country and the reference case the assumptions of the baseline scenario apply.
clearing labour marketsa
increase (decrease) in per cent
change of unemployment rate as a percentage-point
clearing labour marketsin the high wage regionb
higher wage flexibilityin the high wage regionc
30
30
substantial: if the GDP in the source country amounts to 40 per cent of the host country, the one per cent of the labour force from the source country migrating to the host country yields a gain of between 0.1 and 0.5 per cent of the aggregate GDP of both countries, depending on the assumptions used on the flexibility of labour markets and regional wage differentials. Moreover, migration has a substantial impact on the distribution of income. The main losers in our model are manual workers in the host countries, their income can fall by between 0.5 and 1.2 per cent when 70 per cent of the migrants are manual workers. These results depend essentially on the assumption that the economy is closed, such that the labour market bears the whole brunt of adjustment. Immigration does not necessarily affect wages and employment when the case of an open economy is considered: in the standard case of trade theory, the Heckscher-Ohlin-Samuelson (HOS) model, factor prices depend on the prices of traded goods, but not on factor availability. An influx of manual workers is completely absorbed by an increase in the export of labour intensive goods, by a decrease in the export of capital or human capital intensive goods and by a shift in the output-mix (Rybczynski-effect). Thus, migration neither affects wages, the distribution of income nor the GDP per capita in the host and in the home country, when the assumptions of the standard case of trade theory hold. If the standard assumptions of the Heckscher-Ohlin-Samuelson model are relaxed, the picture may change: differences in the level of technology, the specialisation of countries in different technologies, immobile factors between sectors, and sectors which produce non-tradable goods can mean that trade may even complement migration and that the impact of migration on output and income distribution is even higher than in the case of a closed economy (for a detailed discussion see Venables 1999, Trefler 1997). A calibration of the impact of migration in an open economy is beyond the scope of this paper. One aspect does however deserve special attention from an empirical perspective: a large part of the output of the European economies consists of non-tradable goods, e.g. goods which are not traded on international markets. This holds true for large parts of the service sectors, crafts and, to a lesser extent, for the construction sector. An important question for an assessment of the impact of migration on host labour markets is therefore which sector determines the marginal demand for specific types of labour: if, for example, the marginal demand for manual workers is determined in a region by the cleaning sector, then, as expected in the closed economy framework, wages of manual workers will fall if migration occurs. If however the marginal demand for manual workers is determined by the automobile sector, the regional economy may adjust by increasing the production of automobiles, and wages of manual workers may then remain unchanged. Thus, it is basically an empirical question of whether the open or the closed economy framework is most appropriate for an analysis of the impact of migration on wages and employment. 3.7 The empirical evidence A large amount of literature has evolved, which assesses the impact of migration on native employment and wages in a number of European countries. Most of these studies rest explicitly or implicitly on the one-good framework. They rely either on a cross-section of regions or branches and use variations in the migrant density in order to identify the impact of migration on wages and employment. The first approach estimates a traditional wage equation, where the wage is explained by a vector of human capital characteristics, macro variables, which should control for regional demand shocks, and a measure for the density of
31
31
migrants. Another branch of the literature, following the example set by the seminal contribution of Grossman (1982), estimates the elasticity of substitutionality of different types of labour in the production function. Both approaches rely on the theoretical assumption that a change in the proportion of factors through migration involves a change in the income of the respective factor. The income of a factor will increase if labour migration affects the productivity of the factor positively, and will fall if the productivity of the factor declines. In the first case, immigrant labour is perceived as a complement to the respective factor, and in the second as a substitute. The impact of migration on capital income is usually not considered, because detailed data on capital stocks are rarely available.12 The approach which uses the variation in the migrant density across regions or industries to identify the impact of migration suffers from two fundamental problems (Borjas 1995, Friedberg/Hunt 1995): firstly, economies are not considered to be able to adjust to an increasing supply of labour through a change in the structure of traded goods and the output mix. Even if migration does affect wages or employment at a national level, the presence of trade between regions along with capital flows and the migration of natives may eventually result in the equalisation of factor prices across regions. As a consequence, the actual impact of migration cannot measured using the variance of wages across regions. However, these studies may capture the short-term impact of migration on labour markets, since it takes time until regional wage and employment differentials disappear. Secondly, migrants usually tend to move into prosperous regions or branches. A naive regression of local wage levels or unemployment rates against the share of foreign citizens may yield the spurious result that migration leads to higher wages or increasing employment. This problem can be circumvented by estimating using first differences, i.e. by regressing the change in wages or employment against the change in the migrant density, if migrants choose their location on the basis of present wage and employment levels. In this case, the migrant density is not affected by changes in wages or employment, such that we can attribute the correlation between the changes to the impact of a change in the migrant density on the change in wages or employment. However, if location decisions are affected by expectations for wage or employment growth, the problem remains (Friedberg/Hunt 1995). Many estimates rely therefore on the instrumental variable technique, in order to control for the endogeneity of migration decisions. The challenge is to find a suitable instrument, i.e. a variable which is sufficiently correlated to migration density, but which is also uncorrelated to the wage or employment variables. The choice of suitable instruments is a controversial topic in the literature, such that a good deal of uncertainty surrounds all empirical findings. Table 3.6 summarises the findings of a number of empirical studies on the wage impact of migration in Europe. Columns 6-9 report the elasticity between a change in wages as a percentage and an increase in the proportion of foreign citizens of one percentage point, which is equal to an increase in employment through migration by one percent. Some studies report the elasticity between a percentage change in wages and the increase of the proportion of foreign citizens as a percentage, even though it is hard to interpret, as the proportion of immigrants varies greatly across countries and different time periods. The elasticity between an increase in wages and the proportion of foreign citizens of one per cent has been therefore converted at the sample-mean.
12 As a consequence, the studies relying on a production function framework explicitly assume the separability of production functions between capital and labour. Many authors argue that this is not imprudent, because the assumption of separability between capital and labour is confirmed by some empirical evidence (Bauer 1997).
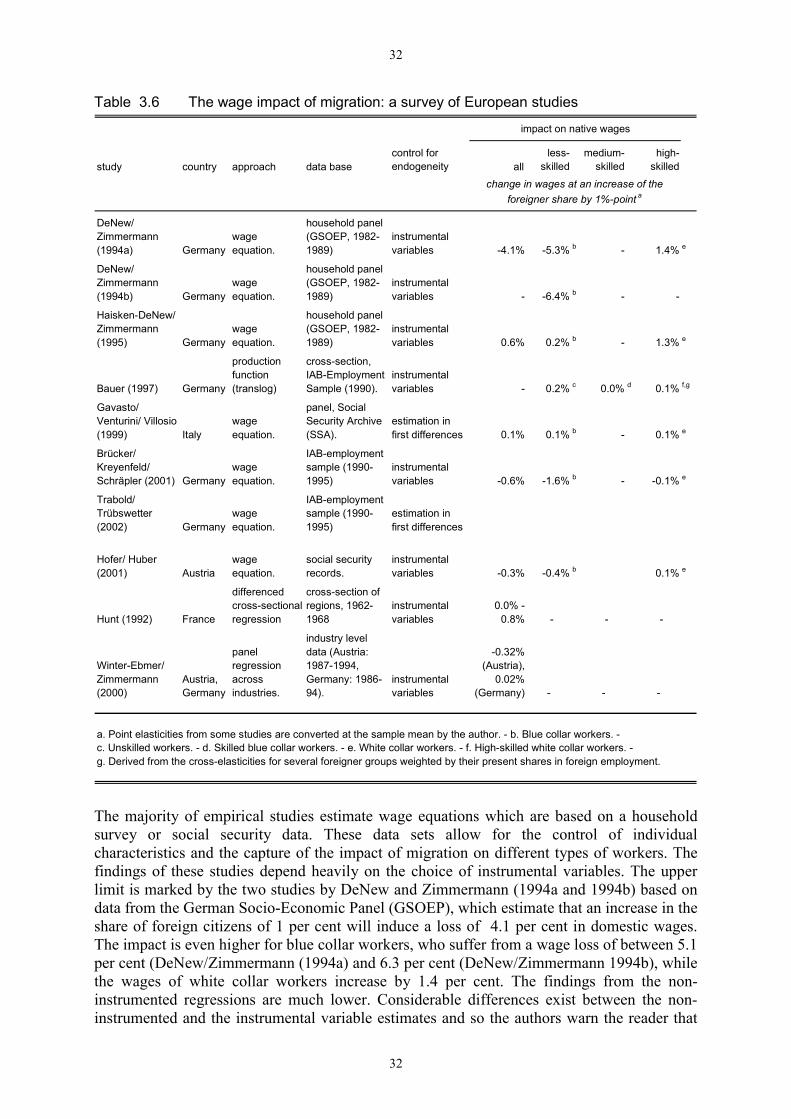
32
32
Table 3.6 The wage impact of migration: a survey of European studies
The majority of empirical studies estimate wage equations which are based on a household survey or social security data. These data sets allow for the control of individual characteristics and the capture of the impact of migration on different types of workers. The findings of these studies depend heavily on the choice of instrumental variables. The upper limit is marked by the two studies by DeNew and Zimmermann (1994a and 1994b) based on data from the German Socio-Economic Panel (GSOEP), which estimate that an increase in the share of foreign citizens of 1 per cent will induce a loss of 4.1 per cent in domestic wages. The impact is even higher for blue collar workers, who suffer from a wage loss of between 5.1 per cent (DeNew/Zimmermann (1994a) and 6.3 per cent (DeNew/Zimmermann 1994b), while the wages of white collar workers increase by 1.4 per cent. The findings from the non-instrumented regressions are much lower. Considerable differences exist between the non-instrumented and the instrumental variable estimates and so the authors warn the reader that
study country approach data basecontrol for endogeneity all
less-skilled
medium-skilled
high-skilled
DeNew/ Zimmermann (1994a) Germany
wage equation.
household panel (GSOEP, 1982-1989)
instrumental variables -4.1% -5.3% b - 1.4% e
DeNew/ Zimmermann (1994b) Germany
wage equation.
household panel (GSOEP, 1982-1989)
instrumental variables - -6.4% b - -
Haisken-DeNew/ Zimmermann (1995) Germany
wage equation.
household panel (GSOEP, 1982-1989)
instrumental variables 0.6% 0.2% b - 1.3% e
Bauer (1997) Germany
production function (translog)
cross-section, IAB-Employment Sample (1990).
instrumental variables - 0.2% c 0.0% d 0.1% f,g
Gavasto/ Venturini/ Villosio (1999) Italy
wage equation.
panel, Social Security Archive (SSA).
estimation in first differences 0.1% 0.1% b - 0.1% e
Brücker/ Kreyenfeld/ Schräpler (2001) Germany
wage equation.
IAB-employment sample (1990-1995)
instrumental variables -0.6% -1.6% b - -0.1% e
Trabold/ Trübswetter (2002) Germany
wage equation.
IAB-employment sample (1990-1995)
estimation in first differences
Hofer/ Huber (2001) Austria
wage equation.
social security records.
instrumental variables -0.3% -0.4% b 0.1% e
Hunt (1992) France
differenced cross-sectional regression
cross-section of regions, 1962-1968
instrumental variables
0.0% - 0.8% - - -
Winter-Ebmer/ Zimmermann (2000)
Austria, Germany
panel regression across industries.
industry level data (Austria: 1987-1994, Germany: 1986-94).
instrumental variables
-0.32% (Austria),
0.02% (Germany) - - -
c. Unskilled workers. - d. Skilled blue collar workers. - e. White collar workers. - f. High-skilled white collar workers. - g. Derived from the cross-elasticities for several foreigner groups weighted by their present shares in foreign employment.
impact on native wages
a. Point elasticities from some studies are converted at the sample mean by the author. - b. Blue collar workers. -
change in wages at an increase of the foreigner share by 1%-point a
33
33
their results may be affected by the choice of unsuitable instruments. Indeed, a series of follow-up studies based on the same data set find much lower wage effects ranging between +0.6 per cent and –0.5 per cent than those from the studies reported above (Haisken-DeNew/Zimmermann, 1995; see also the findings in Haisken-DeNew 1996; Bauer, 1998). Similarly, Brücker, Kreyenfeld and Schräpler (2001) find that a one per cent increase in the proportion of foreign citizens can reduce native wages in a given branch by up to 0.6 per cent on basis of individual data from social security records13. In a study on Austria, Winter-Ebmer and Zweimüller (1996) estimated that the wage response to an increase in the proportion of foreign citizens of 1 per cent lies in an interval of –0.0041 and +0.0054 per cent. This implies that the impact of a one-per-cent increase in the proportion of foreign citizens from 5 to 6 per cent in Austria will lie in an interval of –0.08 and +0.11 per cent. Bauer (1997) estimates the elasticities of substitution and complementarity for different types of labour on basis of a translog-production function. The proportion of immigrants is again instrumented. Somewhat surprisingly, his findings indicate that unskilled migrants and unskilled natives are complementary, i.e. that an increase in the share of unskilled foreign workers of one percentage point increases the wages of unskilled natives by 0.2 per cent. The only group of native workers which is negatively affected by migration are medium skilled natives, whose wages decline by 0.03 per cent if the proportion of unskilled migrants increases by one percentage point. However, an increase in foreign employment reduces the wages of migrant workers substantially (Bauer 1998). In the recent literature increasing doubts have been voiced on the use of instrumental variables. Since no instruments can be identified which pass the statistical tests for validity, wage equations have been estimated in first-differences without instrumental variables (Gavasto/Venturini/Villosio 1999; Trabold/Trübswetter 2001). Interestingly enough, these studies find small, but positive effects of migration on native wages. Another strand of the literature focuses on ‘natural experiments’, i.e. episodes of mass migration which have been induced by non-economic factors. The seminal example in the literature is the ‘Mariel Boatlift’ (Card 1990), i.e. Castro’s permission for some 125 000 persons to emigrate from the Mariel port in Cuba in 1980. More than 50 percent of these migrants settled in the Miami region thus increasing the local population by 7 per cent. Two examples which have been studied in Europe are the immigration of the ‘pieds noirs’ to France after the independence of Algeria 1962 (Hunt 1992), and the return migration to Portugal from Angola and Mozambique following the 1974 revolution (Carrington/DeLima 1996). In the first case, the repatriation from Algeria increased the French population by 1.6 %. Most of the repatriates settled in a few regions in the South of France. In the second case, the ‘retornados’ increased the Portuguese population by almost 7 per cent within three years. The advantage of a natural experiment is that it allows the impact of a migration shock on a region to be studied, that has not been caused by economic forces, and shows that a number of control regions exist, which remain largely unaffected. In his study on return migration to France, Hunt (1992) finds that an increase in the repatriation share of one per cent reduces native wages by 0.8 per cent at most (zero in other specifications). The results for France are similar to those from the Mariel boatlift (Card 1992). The findings of Carrington/DeLima (1996) in Portugal are less conclusive, since only 13 The study is based on the ‘IAB-Beschäftigtenstichprobe’, a one per cent sample of German employees subject to social security contributions.
34
34
data on construction wages were available and several problems result as the study has to control for other regional shocks that affect the results. Depending on the specifications of the model, an increase in the share of repatriates in the population reduces native wages by between 0.15 and 2.5 percent. Altogether, the empirical findings summarised in Table 3.7 indicate, with the exception of few outliers, that a one per cent increase in the labour force through migration yields a change in native wages in a range between minus and plus one per cent; the majority of the studies indicates that the change in native wages is in a range between minus and plus 0.3 per cent. It is moreover important to note that many of the non-instrumented studies find that a complementarity exists between immigrant and native labour, i.e. that the wages of natives tend to increase through labour migration. In contrast, our calibration exercise indicates that, under the assumption of flexible labour markets, the wages of manual workers fall by around 1 per cent, and the wages of skilled workers increase by around 0.3 per cent, if the labour force increases through migration by one per cent (at a share of 70 per cent manual workers in the migrant population). Under reasonable assumptions about wage rigidities, wages of manual workers are still expected to fall by between 0.5 and 0.7 per cent. Thus, the findings from the empirical studies are not completely at odds with the results from our calibration exercise, but in general the actual wage response to migration seem to be below that expected by the model of an isolated economy. However, due to the methodological problems of measuring the impact of migration, a good deal of uncertainty surrounds the empirical findings. Does one migrant replace one native worker? The finding that immigration has only small effects on native wages if any, is not per se surprising. If the European system of wage determination involves wage compression, one could expect that labour markets adjust by increasing unemployment to the influx of foreign labour on the basis of the one-good framework sketched above. However, there is also little evidence that immigration leads to higher unemployment. In one of the few macro-econometric studies on the impact of migration on the labour market, Gross (1999) found a negative impact of migration on the unemployment rate in the long-run using time-series analysis. Increasing the annual immigration rate by 0.1 percentage points from 0.1 to 0.2 per cent reduces the long-run equilibrium rate for unemployment by 0.15 percentage points, while in the short-run, the unemployment rate may increase by up to 0.05 percentage points.14 Gross argues that this counterintuitive result is consistent with a number of models, either where migrant workers complement native workers or where the demand of migrants for goods and services creates a net gain in jobs for host labour markets independently of their participation in the labour market. A number of studies based on individual data sets, which refer to regional differences in unemployment rates, yield either small displacement effects or confirm the hypothesis of a complementary relationship between migrant and native workers: Based on individual data from the German Socio-Economic Panel (GSOEP), Winckelmann and Zimmermann (1993) and Mühleisen and Zimmermann (1994) find no significant correlation between the migrant density and both the individual probability of becoming unemployed and the frequency of unemployment events using different methodologies. Another German study based on regional data finds only a weak correlation between local unemployment rates and the density
14 Gross (1999) considers an increase in the quarterly rate of migration from 0.025 percent to 0.046 per cent; this corresponds to an increase in the annual immigration rate from 0.1 per cent to 1.82 per cent.
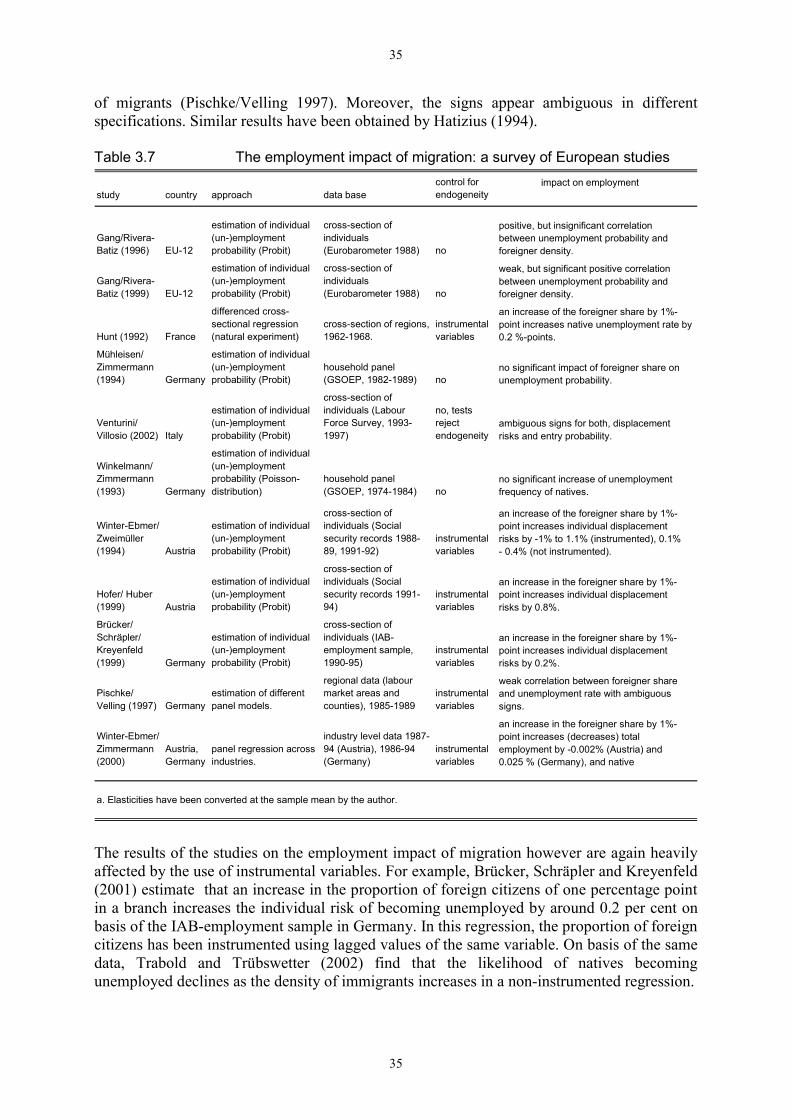
35
35
of migrants (Pischke/Velling 1997). Moreover, the signs appear ambiguous in different specifications. Similar results have been obtained by Hatizius (1994). Table 3.7 The employment impact of migration: a survey of European studies
The results of the studies on the employment impact of migration however are again heavily affected by the use of instrumental variables. For example, Brücker, Schräpler and Kreyenfeld (2001) estimate that an increase in the proportion of foreign citizens of one percentage point in a branch increases the individual risk of becoming unemployed by around 0.2 per cent on basis of the IAB-employment sample in Germany. In this regression, the proportion of foreign citizens has been instrumented using lagged values of the same variable. On basis of the same data, Trabold and Trübswetter (2002) find that the likelihood of natives becoming unemployed declines as the density of immigrants increases in a non-instrumented regression.
control forstudy country approach data base endogeneity
Gang/Rivera-Batiz (1996) EU-12
estimation of individual (un-)employment probability (Probit)
cross-section of individuals (Eurobarometer 1988) no
Gang/Rivera-Batiz (1999) EU-12
estimation of individual (un-)employment probability (Probit)
cross-section of individuals (Eurobarometer 1988) no
Hunt (1992) France
differenced cross-sectional regression (natural experiment)
cross-section of regions, 1962-1968.
instrumental variables
Mühleisen/ Zimmermann (1994) Germany
estimation of individual (un-)employment probability (Probit)
household panel (GSOEP, 1982-1989) no
Venturini/ Villosio (2002) Italy
estimation of individual (un-)employment probability (Probit)
cross-section of individuals (Labour Force Survey, 1993-1997)
no, tests reject endogeneity
Winkelmann/ Zimmermann (1993) Germany
estimation of individual (un-)employment probability (Poisson-distribution)
household panel (GSOEP, 1974-1984) no
Winter-Ebmer/ Zweimüller (1994) Austria
estimation of individual (un-)employment probability (Probit)
cross-section of individuals (Social security records 1988-89, 1991-92)
instrumental variables
Hofer/ Huber (1999) Austria
estimation of individual (un-)employment probability (Probit)
cross-section of individuals (Social security records 1991-94)
instrumental variables
Brücker/ Schräpler/ Kreyenfeld (1999) Germany
estimation of individual (un-)employment probability (Probit)
cross-section of individuals (IAB-employment sample, 1990-95)
instrumental variables
Pischke/ Velling (1997) Germany
estimation of different panel models.
regional data (labour market areas and counties), 1985-1989
instrumental variables
Winter-Ebmer/ Zimmermann (2000)
Austria, Germany
panel regression across industries.
industry level data 1987-94 (Austria), 1986-94 (Germany)
instrumental variables
a. Elasticities have been converted at the sample mean by the author.
weak correlation between foreigner share and unemployment rate with ambiguous signs.
an increase in the foreigner share by 1%-point increases individual displacement risks by 0.8%.
an increase in the foreigner share by 1%-point increases individual displacement risks by 0.2%.
an increase in the foreigner share by 1%-point increases (decreases) total employment by -0.002% (Austria) and 0.025 % (Germany), and native
positive, but insignificant correlation between unemployment probability and foreigner density.
an increase of the foreigner share by 1%-point increases individual displacement risks by -1% to 1.1% (instrumented), 0.1% - 0.4% (not instrumented).
impact on employment
weak, but significant positive correlation between unemployment probability and foreigner density.
no significant impact of foreigner share on unemployment probability.
ambiguous signs for both, displacement risks and entry probability.
no significant increase of unemployment frequency of natives.
an increase of the foreigner share by 1%-point increases native unemployment rate by 0.2 %-points.
36
36
The evidence from other countries is similar: In Austria, Winter-Ebmer and Zweimüller (1994) estimate that an increase in the proportion of immigrants of one percentage point increases the unemployment risk of the most negatively affected group by 1.1 per cent, while the unemployment risk declines for the most favourably affected group by 1 per cent. Similar results are obtained by Hofer and Huber (1999). Using industry level data, Winter-Ebmer and Zimmermann estimate that an increase in the proportion of foreign citizens of one percentage point in an industry decreases native employment by 0.04 percent in Germany, and 0.25 per cent in Austria respectively. While total employment decreases slightly in Austria, it increases in Germany by 0.025 per cent. In Italy, Villosio and Venturini (2002) find only a weak and ambiguous correlation between the proportion of foreign citizens and the individual unemployment risks of natives. In her analysis of the impact of repatriation following the independence of Algeria in 1962, Hunt (1992) estimates that an increase in the share of repatriates of one percentage point increases the unemployment rate by 0.2 per cent. In a study based on the Eurobarometer survey, Gang and Rivera-Batiz (1996, 1999) find a weak correlation in the EU-12 between the perceived density of migrants in the neighbourhood as reported by the survey participants, and the probability of unemployment. The results are however hard to interpret, since it is not known what is meant by a ‘high density’ of migrants. The findings of the empirical studies on the employment impact of migration cannot be easily compared to the results of the simulation model, since most of the findings refer to individual employment risks instead of unemployment rates. Nevertheless, we observe a similar trend as in the case of the studies on the wage impact: the calibration of models with rigid wages indicate that the total unemployment rate may increase in a range between 0.2 and 0.5 per cent, and that of manual workers by 0.4 to 1 per cent, at an increase of the workforce by one per cent through migration (and the share of manual workers in the migrant population is 70 per cent). With the exception of the instrumented regressions in Winter-Ebmer and Zweimüller (1994) and Hofer and Huber (1999), the empirical studies find that the individual displacement risks increase in a range between zero and 0.2 per cent. Thus, although results vary according to the methodologies employed, we can summarise the empirical findings by the conclusion of one the studies quoted above: “(…) there is little evidence for displacement effects due to immigration. This is true in particular for unemployment rates” (Pischke/Velling, 1997, p. 604).
4. Can Migration Alleviate the Demographic Burden?
The comparative-static analysis in the previous section indicates that migration increases the GDP of host countries substantially, but that most of these gains accrue to the migrants. The impact on the income of natives is relatively small, or, if labour markets do not clear, even negative. The picture may however change, if the fiscal implications of migration are considered. The average age of the populations and the age dependency ratios are increasing rapidly in western European countries, but elsewhere too. The traditional source countries for European migration are –to a varying extent – also affected by this ageing trend. As a consequence of the ageing process, the expenditure of public finances and social security systems tends to increase. In most western European countries, social security systems and public finances have not yet adjusted to the demographic change. The present level of government revenues and expenditure is not sustainable in the long-run under reasonable assumptions on the demographic trend.
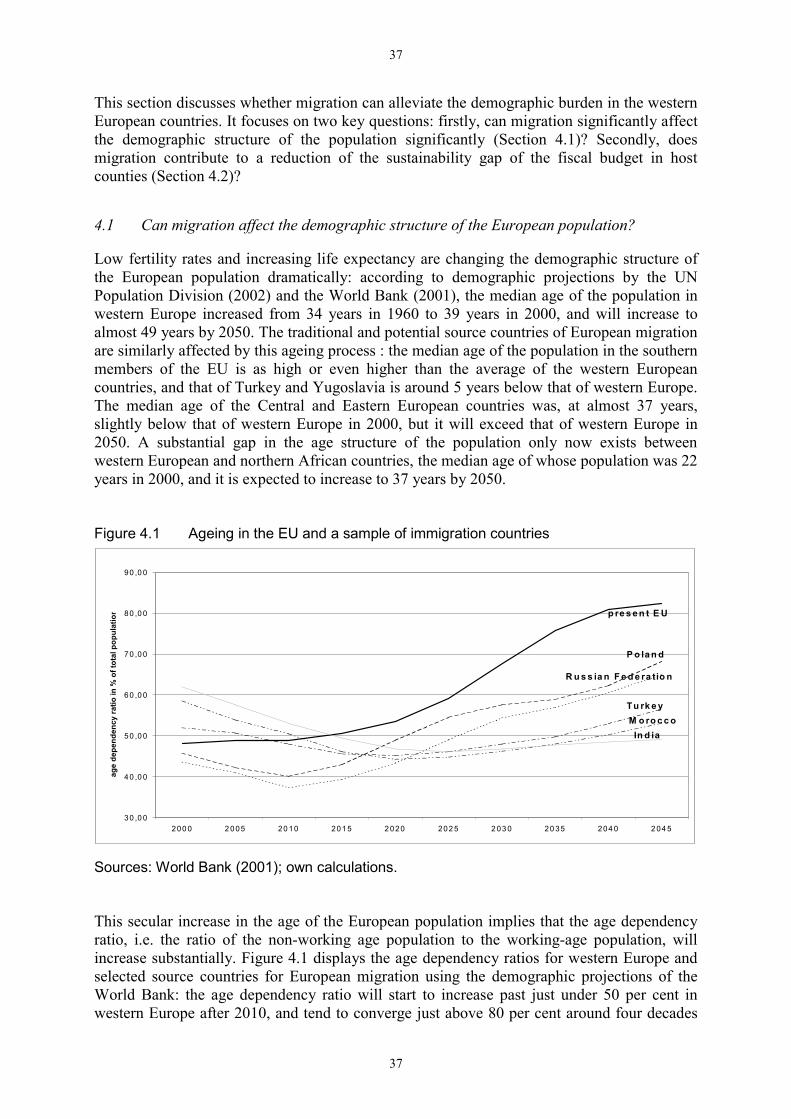
37
37
This section discusses whether migration can alleviate the demographic burden in the western European countries. It focuses on two key questions: firstly, can migration significantly affect the demographic structure of the population significantly (Section 4.1)? Secondly, does migration contribute to a reduction of the sustainability gap of the fiscal budget in host counties (Section 4.2)? 4.1 Can migration affect the demographic structure of the European population? Low fertility rates and increasing life expectancy are changing the demographic structure of the European population dramatically: according to demographic projections by the UN Population Division (2002) and the World Bank (2001), the median age of the population in western Europe increased from 34 years in 1960 to 39 years in 2000, and will increase to almost 49 years by 2050. The traditional and potential source countries of European migration are similarly affected by this ageing process : the median age of the population in the southern members of the EU is as high or even higher than the average of the western European countries, and that of Turkey and Yugoslavia is around 5 years below that of western Europe. The median age of the Central and Eastern European countries was, at almost 37 years, slightly below that of western Europe in 2000, but it will exceed that of western Europe in 2050. A substantial gap in the age structure of the population only now exists between western European and northern African countries, the median age of whose population was 22 years in 2000, and it is expected to increase to 37 years by 2050. Figure 4.1 Ageing in the EU and a sample of immigration countries
Sources: World Bank (2001); own calculations. This secular increase in the age of the European population implies that the age dependency ratio, i.e. the ratio of the non-working age population to the working-age population, will increase substantially. Figure 4.1 displays the age dependency ratios for western Europe and selected source countries for European migration using the demographic projections of the World Bank: the age dependency ratio will start to increase past just under 50 per cent in western Europe after 2010, and tend to converge just above 80 per cent around four decades
30 ,0 0
40 ,0 0
50 ,0 0
60 ,0 0
70 ,0 0
80 ,0 0
90 ,0 0
200 0 2 005 20 10 201 5 2 020 202 5 2 03 0 20 35 204 0 2 04 5
age
depe
nden
cy ra
tio in
% o
f tot
al p
opul
atio
n p re s e n t E U
P o la n d
R u s s ia n F e d e ra tio n
Tu rk e yM o ro c c o
In d ia
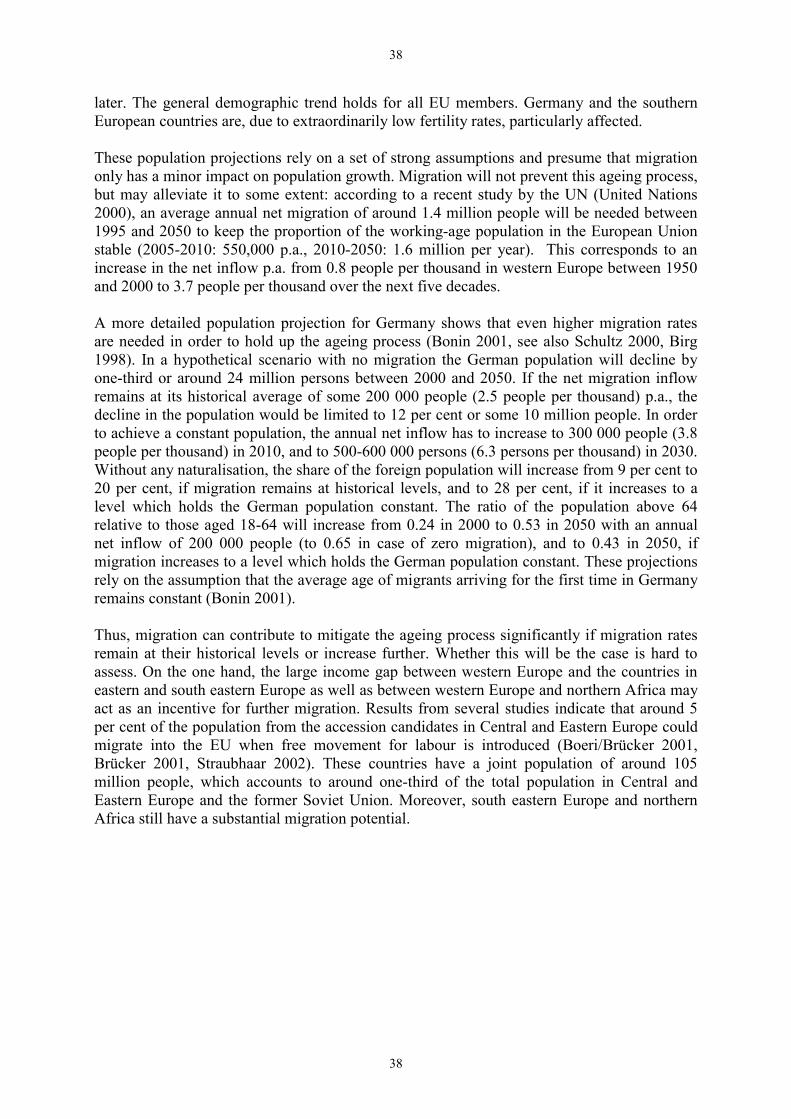
38
38
later. The general demographic trend holds for all EU members. Germany and the southern European countries are, due to extraordinarily low fertility rates, particularly affected. These population projections rely on a set of strong assumptions and presume that migration only has a minor impact on population growth. Migration will not prevent this ageing process, but may alleviate it to some extent: according to a recent study by the UN (United Nations 2000), an average annual net migration of around 1.4 million people will be needed between 1995 and 2050 to keep the proportion of the working-age population in the European Union stable (2005-2010: 550,000 p.a., 2010-2050: 1.6 million per year). This corresponds to an increase in the net inflow p.a. from 0.8 people per thousand in western Europe between 1950 and 2000 to 3.7 people per thousand over the next five decades. A more detailed population projection for Germany shows that even higher migration rates are needed in order to hold up the ageing process (Bonin 2001, see also Schultz 2000, Birg 1998). In a hypothetical scenario with no migration the German population will decline by one-third or around 24 million persons between 2000 and 2050. If the net migration inflow remains at its historical average of some 200 000 people (2.5 people per thousand) p.a., the decline in the population would be limited to 12 per cent or some 10 million people. In order to achieve a constant population, the annual net inflow has to increase to 300 000 people (3.8 people per thousand) in 2010, and to 500-600 000 persons (6.3 persons per thousand) in 2030. Without any naturalisation, the share of the foreign population will increase from 9 per cent to 20 per cent, if migration remains at historical levels, and to 28 per cent, if it increases to a level which holds the German population constant. The ratio of the population above 64 relative to those aged 18-64 will increase from 0.24 in 2000 to 0.53 in 2050 with an annual net inflow of 200 000 people (to 0.65 in case of zero migration), and to 0.43 in 2050, if migration increases to a level which holds the German population constant. These projections rely on the assumption that the average age of migrants arriving for the first time in Germany remains constant (Bonin 2001). Thus, migration can contribute to mitigate the ageing process significantly if migration rates remain at their historical levels or increase further. Whether this will be the case is hard to assess. On the one hand, the large income gap between western Europe and the countries in eastern and south eastern Europe as well as between western Europe and northern Africa may act as an incentive for further migration. Results from several studies indicate that around 5 per cent of the population from the accession candidates in Central and Eastern Europe could migrate into the EU when free movement for labour is introduced (Boeri/Brücker 2001, Brücker 2001, Straubhaar 2002). These countries have a joint population of around 105 million people, which accounts to around one-third of the total population in Central and Eastern Europe and the former Soviet Union. Moreover, south eastern Europe and northern Africa still have a substantial migration potential.
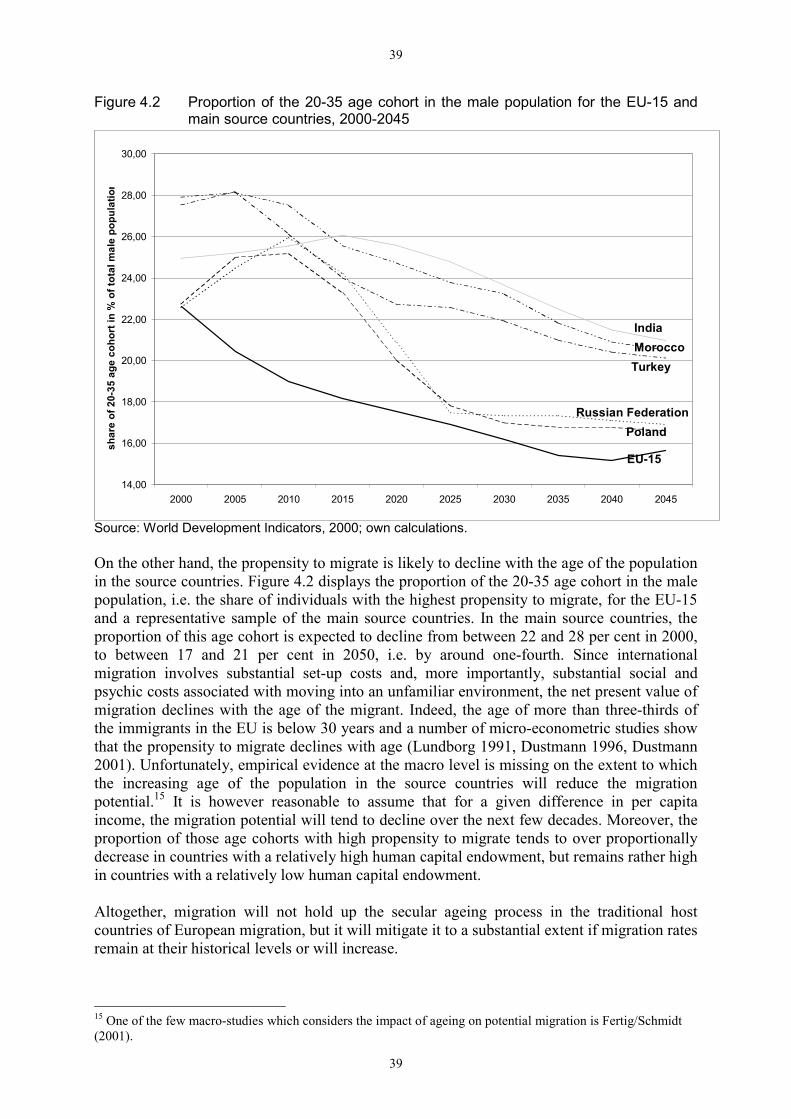
39
39
Figure 4.2 Proportion of the 20-35 age cohort in the male population for the EU-15 and main source countries, 2000-2045
Source: World Development Indicators, 2000; own calculations. On the other hand, the propensity to migrate is likely to decline with the age of the population in the source countries. Figure 4.2 displays the proportion of the 20-35 age cohort in the male population, i.e. the share of individuals with the highest propensity to migrate, for the EU-15 and a representative sample of the main source countries. In the main source countries, the proportion of this age cohort is expected to decline from between 22 and 28 per cent in 2000, to between 17 and 21 per cent in 2050, i.e. by around one-fourth. Since international migration involves substantial set-up costs and, more importantly, substantial social and psychic costs associated with moving into an unfamiliar environment, the net present value of migration declines with the age of the migrant. Indeed, the age of more than three-thirds of the immigrants in the EU is below 30 years and a number of micro-econometric studies show that the propensity to migrate declines with age (Lundborg 1991, Dustmann 1996, Dustmann 2001). Unfortunately, empirical evidence at the macro level is missing on the extent to which the increasing age of the population in the source countries will reduce the migration potential.15 It is however reasonable to assume that for a given difference in per capita income, the migration potential will tend to decline over the next few decades. Moreover, the proportion of those age cohorts with high propensity to migrate tends to over proportionally decrease in countries with a relatively high human capital endowment, but remains rather high in countries with a relatively low human capital endowment. Altogether, migration will not hold up the secular ageing process in the traditional host countries of European migration, but it will mitigate it to a substantial extent if migration rates remain at their historical levels or will increase. 15 One of the few macro-studies which considers the impact of ageing on potential migration is Fertig/Schmidt (2001).
14,00
16,00
18,00
20,00
22,00
24,00
26,00
28,00
30,00
2000 2005 2010 2015 2020 2025 2030 2035 2040 2045
shar
e of
20-
35 a
ge c
ohor
t in
% o
f tot
al m
ale
popu
latio
n
EU-15
PolandRussian Federation
TurkeyMoroccoIndia
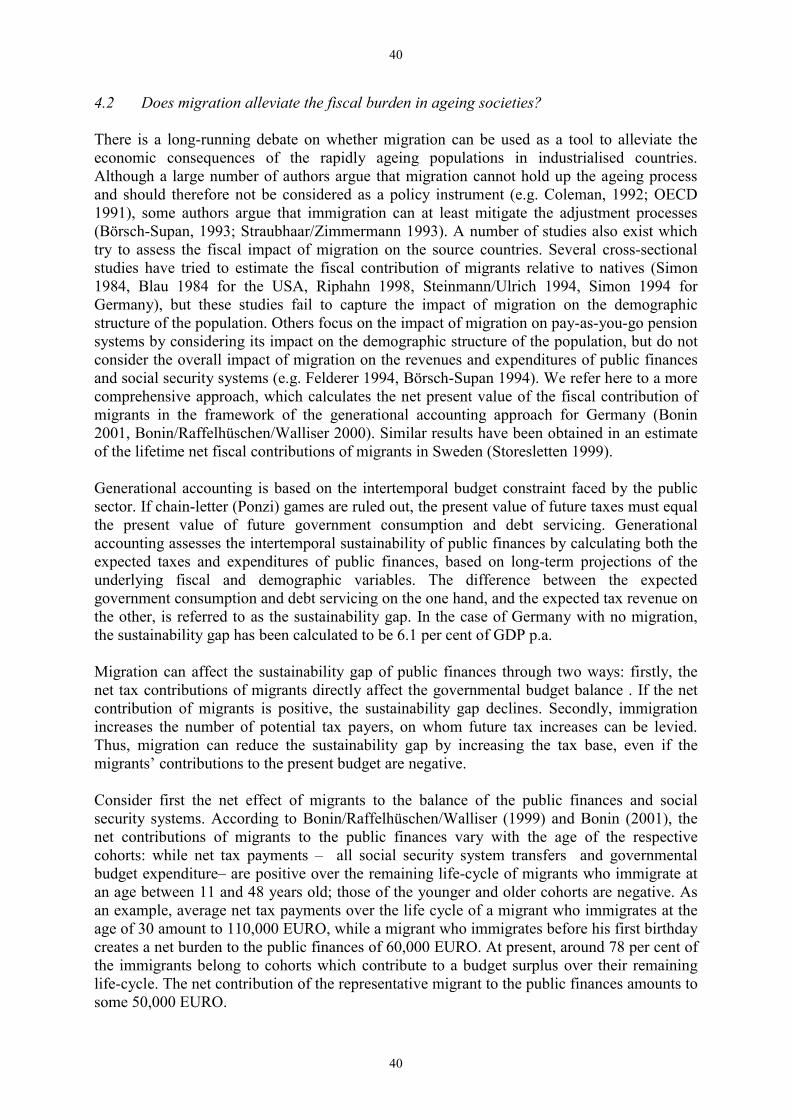
40
40
4.2 Does migration alleviate the fiscal burden in ageing societies? There is a long-running debate on whether migration can be used as a tool to alleviate the economic consequences of the rapidly ageing populations in industrialised countries. Although a large number of authors argue that migration cannot hold up the ageing process and should therefore not be considered as a policy instrument (e.g. Coleman, 1992; OECD 1991), some authors argue that immigration can at least mitigate the adjustment processes (Börsch-Supan, 1993; Straubhaar/Zimmermann 1993). A number of studies also exist which try to assess the fiscal impact of migration on the source countries. Several cross-sectional studies have tried to estimate the fiscal contribution of migrants relative to natives (Simon 1984, Blau 1984 for the USA, Riphahn 1998, Steinmann/Ulrich 1994, Simon 1994 for Germany), but these studies fail to capture the impact of migration on the demographic structure of the population. Others focus on the impact of migration on pay-as-you-go pension systems by considering its impact on the demographic structure of the population, but do not consider the overall impact of migration on the revenues and expenditures of public finances and social security systems (e.g. Felderer 1994, Börsch-Supan 1994). We refer here to a more comprehensive approach, which calculates the net present value of the fiscal contribution of migrants in the framework of the generational accounting approach for Germany (Bonin 2001, Bonin/Raffelhüschen/Walliser 2000). Similar results have been obtained in an estimate of the lifetime net fiscal contributions of migrants in Sweden (Storesletten 1999). Generational accounting is based on the intertemporal budget constraint faced by the public sector. If chain-letter (Ponzi) games are ruled out, the present value of future taxes must equal the present value of future government consumption and debt servicing. Generational accounting assesses the intertemporal sustainability of public finances by calculating both the expected taxes and expenditures of public finances, based on long-term projections of the underlying fiscal and demographic variables. The difference between the expected government consumption and debt servicing on the one hand, and the expected tax revenue on the other, is referred to as the sustainability gap. In the case of Germany with no migration, the sustainability gap has been calculated to be 6.1 per cent of GDP p.a. Migration can affect the sustainability gap of public finances through two ways: firstly, the net tax contributions of migrants directly affect the governmental budget balance . If the net contribution of migrants is positive, the sustainability gap declines. Secondly, immigration increases the number of potential tax payers, on whom future tax increases can be levied. Thus, migration can reduce the sustainability gap by increasing the tax base, even if the migrants’ contributions to the present budget are negative. Consider first the net effect of migrants to the balance of the public finances and social security systems. According to Bonin/Raffelhüschen/Walliser (1999) and Bonin (2001), the net contributions of migrants to the public finances vary with the age of the respective cohorts: while net tax payments – all social security system transfers and governmental budget expenditure– are positive over the remaining life-cycle of migrants who immigrate at an age between 11 and 48 years old; those of the younger and older cohorts are negative. As an example, average net tax payments over the life cycle of a migrant who immigrates at the age of 30 amount to 110,000 EURO, while a migrant who immigrates before his first birthday creates a net burden to the public finances of 60,000 EURO. At present, around 78 per cent of the immigrants belong to cohorts which contribute to a budget surplus over their remaining life-cycle. The net contribution of the representative migrant to the public finances amounts to some 50,000 EURO.
41
41
Consider now the overall impact of migration on the sustainability gap in the government budget in Germany. As mentioned above, the sustainability gap in public finances can be estimated at 6.1 per cent of the German GDP under the assumption of zero migration. A lump-sum tax of around 1,300 EURO p.a. is needed to close this gap. An immigration of 200,000 persons p.a. reduces this gap through the migrants’ net contribution to the budget and through the increased number of tax payers by 5 per cent of German GDP, which implies that the lump-sum tax falls to 1,060 EURO or by 18 per cent per capita. The net gain for the native population is even higher; the sustainability gap declines by 24 per cent (Bonin 2001). These estimates are rather conservative, since they are based on the present tax payments and transfer income patterns for the foreign population in Germany. As a consequence of relative low human capital endowments, the net present value of the income earned by foreign citizens is around 20 per cent below that of natives, and transfers for unemployment exceed those of natives by 65 per cent. However, higher transfers from the unemployment insurance and social insurance do not cancel out the lower transfers made to foreign citizens relative to natives by German pension schemes. If future migrant cohorts possess better human capital endowments, which is a reasonable assumption in the case of migrants from Central and Eastern Europe, the net contribution of migrants to the public budget may even exceed the 50,000 EURO mentioned in the Bonin/Raffelhüschen/Walliser (1999) and Bonin (2001) studies. Altogether, this generational accounting exercise demonstrates that, against the background of rapidly ageing populations, the fiscal gains for natives from future immigration in Germany are substantial. It is reasonable to assume that the fiscal gains from migration in the other host countries in western Europe are similar to those in Germany, since they are exposed to the same demographic trend. With reasonable assumptions for potential migration, it is rather unlikely that migration can hold-up the ageing process, but it can mitigate the fiscal consequences of ageing significantly. On the other hand, migration will aggravate the fiscal burden in the source countries of European migration, in particular in Central and Eastern European countries. The age of the population will increase even more rapidly there than in western Europe, since fertility rates have declined sharply since the start of transition. This does not imply that migration is inefficient: the economic consequences of the ageing process can be alleviated, if production factors – physical capital as well as human resources – move to those countries and regions where their productivity is highest. However, migration may lead to externalities. For example, if the education of a skilled migrant who is hired in western Europe is financed by government expenditure in Central and Eastern Europe, then migration creates a negative externality for the budget in the source country and a positive one for that in the host country. To compensate the source country for these expenditures would not only be fair, it would also help to improve the efficiency of the allocation of human resources. 5. Conclusion
A large number of economic models predict that labour migration creates an efficiency gain. This gain results from the relocation of human resources from where their productivity is relatively low to where their productivity is relatively high. This simple insight is often ignored in the public debate on the economic and social effects of migration, which focuses largely on its impact on the welfare of natives in host countries. While economic theory predicts that migrants will unambiguously gain from migration, it is less clear whether natives
42
42
in the host and the source countries will benefit or loose from labour migration. In this paper, we have tried to shed some light on this issue from different angles. The standard model showing the impact of migration in a closed economy with a fixed capital stock predicts that the income of those production factors which are complements to immigrant labour will increase in the host country, while those production factors which are substitutes to immigrant labour will loose income. The total income of natives in host countries will increase through migration, while the converse holds true for those in the source countries. A calibration of the standard model shows that the impact of migration on the total GDP of both the host and the source country can be substantial, while the impact on the aggregate income of natives in the host and the source is negligible. Most of the gains from migration thus accrue to the migrants. The more the skills of the migrants complement the skills of the native labour force, the more the aggregate gain of natives in the host country increases. However, the impact of migration on the distribution of income also increases: migration can substantially reduce the wages of natives who have skills similar to those of the immigrants. As a consequence, the income disparities in host countries tend to increase if migrants are relatively low-skilled. This does not however imply that migration tends to increase the inequality in income distribution in the region as a whole: as long as the migrants are low-skilled relative to the home population, income disparities tend to decline in Europe. These results rely on the assumption that wages respond flexibly to a change in the labour supply caused by migration. In the case of wage rigidity, the impact of migration on the welfare of natives is ambiguous: under the assumption that the wages for skilled labour are flexible and that those for unskilled labour are not, total unemployment tends to increase and the aggregate income of natives tends to fall when the migrants are unskilled; unemployment falls and the aggregate income of natives in the host countries tends to increase when the migrants are skilled. Note that in this case, the gains accrued by natives from skilled migration can significantly exceed those accrued with flexible labour markets. If the same assumptions hold for the source country, then skilled migration increases unemployment and reduces the income of natives to an even greater extent when compared to the case of flexible labour markets. This adds an additional dimension to the traditional ‘brain drain’ argument. However, it is worth noting that migration still increases the aggregate GDP of both regions, even if wages are extremely rigid as in the assumptions of our simulation model. On average, migrants are more than proportionally affected by unemployment in Europe. As a consequence, unemployment and other welfare benefits redistribute income from natives to migrants in the host country. Moreover, when unemployment benefits exist, the size of the migrant population increases, as does the ratio of migrants with high unemployment risks to those with low risks. A calibration of these effects nevertheless demonstrates that -- for the income gap between the host and source economies in Europe, and for the size of actual unemployment benefits in the host countries -- the impact of unemployment benefits on the skill distribution of migrants is negligible, and that on the scale of migration is fairly moderate as well. Moreover, since higher unemployment benefits act as an incentive to increased migration, the aggregate impact of unemployment benefits on GDP in the whole region is positive. Nevertheless, under the assumption that migrants are more than proportionally affected by unemployment than natives are, unemployment benefits redistribute income from natives to migrants. Within western Europe, regional differences in wages and unemployment rates are substantial. Labour mobility between western European regions is, at one-third of that in the US, much too small to reduce these regional differences. There is ample empirical evidence to
43
43
show that international migrants move into the prosperous regions of host countries - mainly into urban regions with relatively high wages and relatively low unemployment rates. As a consequence, the gains from migration are higher relative to the case where only a country’s average is considered. These additional gains can be substantial. The analytical framework used to examine migration in an otherwise closed economy helps to understand the mechanisms through which migration can affect the size and distribution of income in host and source countries. It ignores, however, the interaction between migration and trade and capital accumulation. As a consequence, the closed economy framework with a fixed capital stock can both overestimate and underestimates the impact of migration. An overestimation can result as the model does not reflect the fact that economies can adjust to an additional labour supply through migration not only through the labour market, but also through a change in the output mix and the structure of traded goods. Under the extreme set of assumptions of the standard model of trade theory, the trade of goods alone equalises factor prices, and an increase in the labour force through migration does not affect wages at all. However, these models assume that capital is perfectly mobile between sectors, such that they capture long-term effects instead of the short-term impact of migration on host labour markets. The closed economy framework with fixed capital stocks may result in an underestimation, because it does not take into account that migration can further increase production and income in the host country through additional incentives to accumulate capital. Once again, these effects are long term ones. The impact of migration on the wages and employment opportunities of natives in the host labour markets is the subject of a large and rapidly growing volume of empirical literature. Due to a number of methodological problems, a good deal of uncertainty surrounds the empirical findings. Nevertheless, with some notable exceptions, empirical literature indicates that the impact of migration on wages and employment opportunities of natives is significantly below that predicted by the simulation model. Moreover, some recent studies find that migrants complement native workers, i.e. that the wages and employment opportunities of natives tend to increase with the number of migrants. Unfortunately, little empirical knowledge exists on the impact of migration on source labour markets. International migration can create a substantial fiscal gain for countries in western Europe due to their rapidly ageing populations. International migration will not hold up the secular process of ageing, but it can nevertheless affect the demographic structure of the western European economies significantly – even if immigration rates remain at their historical levels. Whether this will indeed be the case is hard to assess. On the one hand, the present income gap in Europe is substantial and current immigration rates in western Europe are well below those in other regions of the world with similar per capita income levels. On the other hand, the ageing process will progress in eastern Europe at the same speed as in western Europe and, hence, mitigate the incentives to migrate. The median age of populations in northern Africa will be well below that of the western European countries during the next few decades, but the average skill level of its labour force is well below that of the labour force in western and eastern Europe. Several studies have assessed the effects of migration on German public finances. One tool used to evaluate the fiscal impact of migration in the long-run is the generational accounting approach. Generational accounting analyses whether the current structure of public finances is sustainable given the expected revenue and expenditure flows. In Germany, the sustainability gap is estimated to be around 6 per cent of GDP p.a. International migration can contribute through two channels to the reduction of this gap: firstly, through the net fiscal contribution of
44
44
migrants to the budget in the host country over their remaining life-cycle, and, secondly, through increasing the number of tax payers on which current debts are distributed. Even when taking into account that migrants pay less taxes and receive more unemployment benefits and social assistance than natives (but receive less transfers by the pension system), the net fiscal contribution of immigrants is positive at their average age. A net immigration flow of 200,000 persons p.a., which corresponds to the historical trend in Germany, would reduce the sustainability gap from 6 to 5 per cent of German GDP. Thus, at least in the German example, international migration significantly alleviates the demographic burden. However, a comprehensive reform of the welfare state is needed in order to restore the sustainability of public finances. Taken as a whole, migration will not solve the labour market problems in Europe. Our analysis however allows us to conclude that the aggregate gain from international migration can be substantial; although migration will also affect the distribution of income between different groups of the population and between the host and the source countries. When considered against the background of empirical evidence on the labour market impact of migration in host countries, the adverse impact of migration on unemployment and the wages of natives is however less severe than the simple models of a closed economy may indicate; the total fiscal gains for natives in the long-run are substantial. Thus, there is something to be gained from a reform of western European migration policies vis-à-vis non-EU and non-EEA countries. However, natives in source countries can be negatively affected by a change in migration policies. In particular, there may be an adverse impact of migration on public finances. Nevertheless, restricting migration from the source countries will reduce aggregate income. Compensating the source countries for the fiscal losses caused by international migration is a superior policy option.
45
45
Annex: Outline of the simulation model For illustrative purposes, Section 3 simulates the impact of migration on output, wages and income distribution in the host and source countries. These simulations are based on a highly stylised model of two economies, which produce one good and are – apart from migration – closed. In this annex, we describe the basic features of the model. Many aspects of the model described draw on Levine (1999), but in contrast to the Levine model, we consider the labour market to be split between an unskilled and a high-skilled segment and that the elasticity of wages with respect to the unemployment rate differs between the segments (see Bauer/Zimmermann 1997 for a similar assumption). The model naturally relies on a number of arbitrary assumptions, but it nevertheless allows us to analyse some of the mechanisms through which migration may affect the income and employment of the affected parties in the host and source countries. Outline of the basic model The output of the host and the source countries’ economies is produced with unskilled labour, skilled labour and physical capital. Production technology has constant returns to scale and is approximated by a Cobb-Douglas function, such that hfiKHLAY iiii
iiiii ,,1 == −− βαβα , (A1) where iY denotes output, iA a productivity parameter, which reflects the level of technology and institutions, iL unskilled labour, iH skilled labour, and iK physical capital. iα , iβ , and 1- iα - iβ are the shares of unskilled labour, skilled labour and capital, respectively, in total income, and i ∈{f, h} is an index for the country of destination, f, and the country of origin, h, respectively. Let iN be the initial pre-migration endowment of country i with unskilled labour, and let iS be its initial endowment with skilled labour. Thus the post-migration allocation of unskilled labour in the country of destination and the source country is given by MNNMNN hhff γγ −=+= , , (A2)
where M denotes the number of migrants, and γ the proportion of unskilled labour in the migrant population. Analogously, the post-migration allocation of skilled labour can be written as ( ) ( ) MSSMSS hhff γγ −−=−+= 1,1 , (A3) where 1-γ denotes the proportion of skilled workers in the migrant population. In all simulations, we assume that the total labour force, i.e. the number of skilled and unskilled workers in the host and the home country is equal in the pre-migration state. The model is ‘short-run’ in the sense that it is assumed that the productivity parameter and physical capital endowments are fixed.
46
46
Wages and the demand for labour are determined sequentially. In the first stage, wages are fixed by a bilateral bargaining monopoly between trade unions and employer federations16 In the second stage, profit-maximising firms hire labour until the marginal product of labour equals the wage rate; the participants in the wage negotiations are aware of this. Given this wage-setting mechanism, wages respond – albeit imperfectly – to the unemployment rate in the economy. This allows us to express the wage rates as functions of the unemployment rate, i.e. as
( ) ( ) ,0', ,,, <= iLiiLiiL ufufw (A4)
and ( ) ( ) ,0', ,,, <= iHiiHiiH ugugw (A5) where the unemployment rates for unskilled and skilled labour are defined as
( )iiiL NLu −= 1, and ( )iiiH SHu −= 1, respectively. Thus, we allow the elasticity of wages with respect to the unemployment rate to differ for unskilled and skilled labour. The impact of migration on employment is then determined by the marginal product of skilled and unskilled labour and the flexibility of wages in the respective labour markets, i.e. by
−=−−−−
i
iiiiiii N
LfKHLA iiii 11)1( βαβαα , (A6)
and
−=−−−−
i
iiiiiii S
HgKHLA iiii 11)1( βαβαβ , (A7)
where we used the definitions for the unemployment rate on the right-hand side. Equations (A1) to (A7) determine output, the size of the labour force, the wage rates, and the employment of unskilled and skilled workers in both economies. Write the semi-elasticity of the wage of unskilled labour with respect to unemployment as ( ) iLiLii wuf ,, /'−=η , and, analogously, the semi-elasticity of the wage of skilled labour with respect to unemployment as
( ) iHiHii wug ,, /'−=µ . Differentiating (A6) implicitly with respect to M yields then, after a good deal of algebra, the marginal response of employment of unskilled labour, L i, to migration:
( )[ ] ( )
( )[ ] ( )[ ] ffffffffffff
fifffffffffffff
SNHSLNSNHLNLHS
MddL
βαµβηαβµγµβηγ−+−+−
−++−=
11/1/1 2
, (A8)
and
16 The argument elaborated here is consistent with different models of wage setting, e.g. models with a monopoly union or a bilateral bargaining monopoly (e.g. Layard et al. 1992), efficiency wage theories (e.g. Salup 1979) or shirking-models (Shapiro/Stiglitz 1984) (see Levine 1999). The analysis, however, only considers the long-run response of wages to a change in labour supply, i.e. the impact of short-run fluctuations in (un-) employment rates is ignored. (Levine 1999).
47
47
( )[ ] ( )( )[ ] ( )[ ] ,
11/1/1 2
hhhhhhhhhhhh
hhhhhhhhhhhhhh
SNHSLNSNHLNLHS
MddL
βαµβηαβµγµβηγ−+−+−
−++−−= (A9)
where Ni and Si are determined by equations (2) and (3). Differentiating (7) implicitly with respect to migration analogously gives the marginal response of employment of skilled labour, Hi, to migration:
( ) ( )[ ]( )[ ] ( )[ ] ffffffffffff
ffffffffffffff
SNHSLNNSHLSHLN
MddH
βαµβηαηαγηαµγ−+−+−
++−−=
11//11 2
, (A10)
and ( ) ( )[ ]
( )[ ] ( )[ ] hhhhhhhhhhhh
hhhhhhhhhhhhhh
SNHSLNNSHLSHLN
MddH
βαµβηαηαγηαµγ−+−+−
++−−−=
11//11 2
. (A11)
Thus, the greater the flexibility of labour markets, i.e. the higher the semi-elasticity between the wage and the unemployment rate, the greater the marginal response of employment with respect to migration is. Consider two extreme cases: in the first case, the labour markets are completely flexible, i.e.
∞→iη , ∞→iµ and iiii SHNL →→ , . In this case, equations (8) and (10) converge to γ and (1-γ), respectively, and equations (9) and (11) to -γ and -(1-γ), respectively. The labour force in the host country then exactly increases by the number of immigrant workers, and the labour force in the home country is exactly reduced by the number of migrant workers. This case corresponds to the textbook example of the impact of migration in an economy with clearing labour markets and an inelastic supply of native labour (e.g. Wong 1995, pp. 628-632). This is our reference case as calibrated in Table 3.1 in Section 3.2. In the other extreme case, wages for unskilled labour are perfectly inflexible, i.e. 0→iη , while wages for skilled labour are perfectly flexible, i.e. .0→iµ In this case, immigration of unskilled workers does not change the level of employment for unskilled workers, such that it simply increases the level of unemployment for unskilled workers in the host countries. However, the immigration of skilled workers increases the level of employment for unskilled workers in the host countries, since skilled and unskilled workers are complements under the assumptions of our model. Thus, the impact of migration on (un-)employment and income depends essentially on the composition of the migrant population with respect to their skill levels. This case as well as examples with different degrees of wage flexibility are calibrated in Table 3.2 of Section 3.2. The allocation of jobs among natives and migrants For an analysis of the impact of migration on income of natives and migrants, it is necessary to make additional assumptions on the employment opportunities of natives and migrants. Following the traditional approach of Todaro (1969) and Harris/Todaro (1970), we assume that in each period all jobs are randomly allocated among the total labour force, i.e. among natives and migrants. However, we modify the selection process to allow for the possibility that the employment opportunities of migrants are below those of natives, i.e.
48
48
( ) ( )( )( )fLffNLfLfML uNMpup ,,,, 111,1 −−+=−= γλλ , (A12) and
( ) ( )( )( )( )fHffNHfLfHL uNMpup ,,,, 1111,1 −−−+=−= γλλ , (A13) where pMj and pNj denote the employment probability for migrants and natives in the host country, respectively (j = L, H), and the factor λ (0 < λ ≤ 1) accounts for the possibility that the employment opportunities of migrants are below those of natives. Note that this implies that some of the employment risks of natives are shifted to migrants. For natives in the home country we assume that the employment probabilities are simply given by
pL,h = 1-uL,h, pH,h = 1-uH,h. (A14) The role of unemployment benefits Migration does not only affect income through wages and employment, but also through welfare benefits. In order to consider its impact on welfare benefits, we assume that unemployment benefits are a fixed proportion of post-tax wages, i.e. ( ) ijii wtb −1 , where ti denotes an uniform income tax-rate, i = f, h, the respective country, and j = L, H, skilled and unskilled labour, respectively. Physical capital is not taxed. If we assume that the budget is balanced and if we ignore all other public expenditure, then taxes must equal the unemployment costs, which gives the tax rate
( )( ) ( )( ) iHiHiiiLiLii
iHiHiiLiLiii SwubNwub
SuwNuwbt
−−+−−+
=1111
, (A15)
where Ni and Si are the post-migration endowments of unskilled and skilled labour as determined by equations (2) and (3). The impacts of varying amounts of unemployment benefit and, hence, different tax rates, on the income of natives and migrants are calibrated in Table 3.3 in Section 3.4. Endogenous migration So far we have assumed that the migration rate is given. For an analysis of the impact of migration policies on welfare it is, however, necessary to also consider the determinants of the migration rate. We limit our analysis here to the simple case of permanent migration (see again Levine 1999 for a similar approach). Assume that migrants do not own any physical capital. The net present value of expected income in the foreign country for an infinitively lived household is then given by
( )[ ] HLjwpbpV fjtfjtffjtfjt ,,~10
=−+= +
∞
=∑ ττ
τδ , (A16)
and in the home country by
( )[ ] HLjwpbpV hjthjthhjthjt ,,~10
=−+= +
∞
=∑ ττ
τδ , (A17)
49
49
where δ < 1 denotes the discount factor, and ijtiijt wtw )1(~ −= the post-tax wage, and the employment probabilities are given by (A13) and (A14). For convenience, we assume that manual workers expect that following generations will remain manual workers, while for non-manual workers the converse holds. A risk-neutral individual will migrate if the difference in the net present value from living in a foreign country and at home exceeds the net present value of all the pecuniary and non-pecuniary costs of migration, i.e. if
∑∞
=+≥−
0,,,
ττ
τδ tjthjtfj CVV . (A18)
If we write the migration costs on the left hand side of (A18) as a fraction of the net present value of living at home, i.e. as cVhjt , then a factor 1/(1-δ) cancels out and we obtain
( )( ) j
jh
jf
hhh
ffjf cww
pbppbp
+≥−+−+
1~~
11
, (A19)
i.e. the ratio of expected real income in the foreign and the home country has to exceed the cost factor 1 + cj. Note that there are no transitional dynamics in the system and all variables jump immediately to steady state values such that we can drop the time subscript (Levine 1999). Following Faini/Venturini (1994), Ludema and Wooton (1999) and Brücker (2001), we assume that individuals differ with respect to their preferences and their costs for migration. In the steady state, the net present value of expected income just equals the net costs of migration for the marginal migrant. Thus, we assume that a macroeconomic function exists, which determines the share of migrants in the home population as a function of the expected difference in per capita income in the steady state. Depending on assumptions about the distribution of the costs of migration and preferences across the population, we can conceive different functional forms. For our simulations, we assume that the share of migrants in the labour force of the home population is a semi-logarithmic function of the ratio of expected income. This functional form is considered in several macro studies on the determinants of migration (e.g. Hatton 1995, Boeri/Brücker 2001, Brücker 2001). Thus, the steady state share of migrants in the force of unskilled workers of the source country is given by the probability that the ratio of expected income in the host and the home country equals the costs for migration for the kth individual, i.e. by
=
+≥=
hL
fLkL
hL
fL
h VV
cVV
NM
,
,,
,
, ln1Pr θγ , (A20)
and the steady state share of migrants in the force of skilled workers analogously by
( )
=
+≥=−
hH
fHnH
hH
fH
h VV
cVV
SM
,
,,
,
, ln1Pr1 σγ , (A21)

50
50
i.e. we allow for the propensity to migrate for skilled and unskilled workers differing. Based on these assumptions, we calibrated the impact of the income differential and different rates of unemployment benefits on the overall migration potential and the shares of unskilled and skilled workers in the migrant population in Table 3.5 in Section 3.5.
51
51
References Bauer, T. (1998), Arbeitsmarkteffekte der Migration und Einwanderungspolitik. Eine Analyse
für die Bundesrepublik Deutschland, Physika, Heidelberg/New York.
Bauer, T. (1997), Do Immigrants Reduce Native Wages? Evidence From Germany, Münchner Wirtschaftswissenschaftliche Beiträge 97, University of Munich.
Bauer, T., K.F. Zimmermann (1997), Looking South and East, Labour Markets Implications of Migration in Europe and LDCs, in: O. Memedovic, A. Kuyvenhoven, W.T.M. Molle (eds.), Globalisation and Labour Markets. Challenges, Adjustment and Policy Responses in the EU and the LDCs, Kluver, Dordrecht/Boston/London, 75-103.
Bauer, T., K.F. Zimmermann (2000), Immigration Policy in Integrated National Economies, IZA Discussion Paper 170, IZA, Bonn.
Bean, C., R. Layard, S. Nickell (1986), The Rise in Unemployment: A Multi-Country Setting, Economica, 53, pp. S1-S22.
Birg, H. (1998), Simulationsrechnungen zur Bevölkerungsentwicklung in den alten und neuen Bundesländern im 21. Jahrhundert, Materialien des Instituts für Bevölkerungs-forschung und Sozialpolitik 45, Bielefeld.
Blau, F. (1984), The Use of Transfer Payments by Immigrants, Industrial and Labour Relations Review, 37, pp. 222-239.
Boeri, T., H. Brücker et al. (2001), The Impact of Eastern Enlargement on Employment and Labour Markets in the EU Member States, European Commission, DG Employment and Social Affairs, Brussels (http://www.diw.de/english/abteilungen/wlt/publikationen).
Bonin, H. (2001), Fiskalische Effekte der Zuwanderung nach Deutschland: Eine Generationenbilanz, IZA-Discussion Paper 305, Bonn.
Bonin, H., B. Raffelhüschen, J. Walliser (2000), Can Immigration Alleviate the Demographic Burden, FinanzArchiv, 57, pp. 1-21.
Borjas, G.J. (1994), The Economics of Immigration, Journal of Economic Literature, 32, pp. 1667-717.
Borjas, G.J. (1995), The Economic Benefits from Immigration, Journal of Economic Perspectives, 9, pp. 3-22.
Börsch-Supan, A. (1994), Migration, Social Security Systems, and Public Finance, in: H. Siebert, (ed.), Migration: A Challenge for Europe, Tübingen: Mohr, pp. 111-114.
Brücker, H. (2001), Die Folgen der Freizügigkeit für die Ost-West-Migration. Schluss-folgerungen aus einer Zeitreihenanalyse der Migration nach Deutschland, 1967 bis 1998, Konjunkturpolitik (Applied Economics Quarterly), Beiheft 52, pp. 17-54.
Brücker, H., Kreyenfeld, M., and Schräpler, J. P. [1999]: Trade and Migration: Impact on Wages, Employment and Labour Mobility in Western Germany, mimeo, Berlin: German Institute for Economic Research.
Card, D. (1992), The Impact of the Mariel Boatlift on the Miami Labor Market, Industrial and Labor Relations Review, 43, pp. 245-57.
Carrington, W., P. DeLima (1996), The Impact of the 1970s Repatriates from Africa on the Portuguese Labour Market, Industrial and Labor Relations Review, 49, pp. 330-346.
52
52
Coleman, D. (1992), Does Europe need immigrants? Population and workforce projections, International Migration Review, 26, pp. 413-461.
DeNew, J., K.F. Zimmermann (1994a), Native Wage Impacts of Foreign Labor: A Random Effects Panel Analysis, Journal of Population Economics, 7, pp. 177-192.
Dustmann, C. (1996), Return Migration: The European Experience, Economic Policy, 22, pp.213-242.
Faini, R. and A. Venturini (1995): Migration and Growth: The Experience of Southern Europe, CEPR Discussion Papers No. 964.
Faini, R., J. De Melo, K.F. Zimmermann (1999), Migration. The Controversies and the Evidence, Cambridge, UK: Cambridge University Press.
Felderer, B. (1994), Can Immigration Policy Help to Stabilize the Social Security Systems?, in: H. Giersch (ed.), Economic Aspects of International Migration, Berlin, pp. 197-226.
Fertig, M., C.M. Schmidt (2001), First- and Second-Generation Migrants in Germany – What Do We Know and What Do People Think, IZA Discussion Paper 286, IZA, Bonn.
Friedberg, R.M., J. Hunt (1995), The Impact of Immigrants on Host Country Wages, Employment and Growth, Journal of Economic Perspectives, 9, pp. 23-44.
Gang, I.N., F.L. Rivera-Batiz (1994), Unemployment and Attitudes Towards Foreigners in Germany, in: G. Steinmann, R.E. Ulrich (eds.), The Economic Consequences of Immigration to Germany, Heidelberg: Springer, pp. 121-154.
Gang, I.N., F.L. Rivera-Batiz (1999), Immigrants and Unemployment in Europe, IZA Discussion Paper 70, Bonn: IZA.
Garson, J., D.Redor and G. Lemaitre [1997]: Regional Integration and the Outlook for Temporary and Permanent Migration in Central and Eastern Europe, in: Migration, Free Trade and Regional Integration in Central and Eastern Europe. Schriftenreihe des Bundeskanzleramtes, Vienna.
Gavasto, A., A. Venturini, C. Villosio (1999), Do Immigrants Compete with Natives? Labour, 13, pp. 603-622.
Gross, D. (1999), Three Million Foreigners, Three Million Unemployed? Immigration and the French Labour Market, IMF Working Paper 99/124, IMF, Washington, D.C.
Grossman, J. (1982), The Substitutionality of Natives and Immigrants in Production, Review of Economics and Statistics, 64, pp. 596-603.
Haisken-DeNew, J. (1996), Migration and Inter-Industry Wage Structure in Germany, Springer, Berlin/Heidelberg/New York.
Haisken-DeNew, J., K.F. Zimmerman (1995), Wage and Mobility Effects of Trade and Migration, CEPR Discussion Paper 1318, London.
Hanson, G.H., M.J. Slaughter (1999), The Rybczinski Theorem, Factor Price Equalization, and Immigration: Evidence from U.S. States, NBER Working Paper 7074, NBER, Cambridge, MA.
Harris, J.R., M.P. Todaro (1970), Migration, Unemployment and Development, A Two-Sector Analysis, American Economic Review, 60, pp. 126-142.
53
53
Hatizius, J. (1994), The Unemployment and Earnings Effect of German Immigration, Applied Economics Discussion Paper 165, Oxford Institute of Economics and Statistics, Oxford.
Hofer, H. and P. Huber (1999): Eastward Enlargement, Trade and Migration: Impact on the Austrian Labor Market, Mimeo, Vienna: Institute of Advanced Studies.
Hunt, J. (1992), The Impact of the 1962 Repatriates from Algeria on the French Labor Market, Industrial and Labor Relations Review, 45, pp. 556-72.
Layard, R., et al. (1992), East-West Migration. The Alternatives, MIT Press, Cambridge, MA.
Layard, R., S. Nickell, R. Jackman (1991), Unemployment. Oxford University Press, New York.
Levine, P. (1999), The welfare economics of migration control, Population Economics, 12, pp. 23-43.
Locher, L. (2001), The determination of a migration wave using ethnicity and community ties, IZA Discussion paper 346, Bonn: IZA.
Lundborg, P. (1991), Determinants of Nordic Migration to Sweden, Scandinavian Journal of Economics, pp. 363-375.
McCormick, B., H. Brücker, G.S. Epstein, G. St.Paul, A. Venturini, K.F. Zimmermann (2002), Managing Migration in the European Welfare State, Fondazione DeBenedetti, Milano, forthcoming: Oxford University Press.
Mühleisen, M., K.F. Zimmermann (1994), A Panel Analysis of Job Changes and Unemployment, European Economic Review, 38, pp. 793-801.
Newell, A., J. Symons (1985), Wages and Employment in the OECD Countries, Discussion Paper 219, Centre for Labour Economics, London School of Economics.
Pischke, J.S., J. Velling (1997), Employment effects of immigration to Germany: an analysis based on local labor markets, Review of Economics and Statistics, 79, pp. 594-604.
Razin, A., E. Sadka (1997), Resisting Migration: Wage Rigidity and Income Distribution, CEPR Discussion Paper 1091.
Riphahn, R. (1998), Immigrant Participation in the German Welfare Program, FinanzArchiv, 55, pp. 163-185.
Salop, S. (1979), A Model of the Natural Rate of Unemployment, American Economic Review, 74, pp. 117-125.
Schultz, E. (2000), Migration und Arbeitskräfteangebot in Deutschland bis 2050, DIW-Wochenbericht, 67, pp. 379-397.
Shapiro, C., J. Stiglitz (1984), Equilibrium Unemployment as a Worker Discipline Device, American Economic Review, 74, pp. 433-444.
Simon, J. (1984), In the Economic Consequences of Immigration: Lesson for Immigration Policies, in: H. Giersch (ed.), Economic Aspects of International Migration, Berlin, pp. 227-248.
Simon, J. (1994), Immigrants, Taxes and Welfare in the United States, Population and Development Review, 10, pp. 55-69.
54
54
Sinn, H.-W./G. Flaig/M. Werding/S. Munz/N. Düll/H. Hofmann (2001), EU-Erweiterung und Arbeitskräftemigration, Wege zu einer schrittweisen Annäherung der Arbeitsmärkte, ifo-Institut für Wirtschaftsforschung, Munich.
Steinmann, G., R. Ulrich (1994), The Economic Consequences of Immigration to Germany, Heidelberg.
Storesletten, K. (1999), Sustaining Fiscal Policy Through Immigration, Journal of Political Economy.
Straubhaar, T. (2002), Ost-West Migrationspotenzial: Wie groß ist es?, Jahrbücher für Nationalökonomie und Statistik, 222, pp. 20-41.
Straubhaar, T., K.F. Zimmermann (1993), Towards a European Migration Policy, Population Research and Policy Review, 12, 225-241.
Trabold, H., P. Trübswetter (2001), Schätzung der Beschäftigungs- und Lohneffekte der Zuwanderung, in: Brücker, H., H. Trabold, P. Trübswetter, C. Weise, Migration: Potential und Effekte für den deutschen Arbeitsmarkt, Final Report for the Hans-Böckler-Foundation, German Institute for Economic Research (DIW), Berlin.
UN (2000), Replacement Migration: Is it a Solution to Declining and Ageing Populations, UN Secretariat, Geneva.
United Nations (2002), World Population Prospects – Population Database, http://esa.un.org/unpp/.
Venables, A.J. (1999), Trade liberalisation and factor mobility: an overview, in: Faini, R., J. De Melo, K.F. Zimmermann (eds.), Migration. The Controversies and the Evidence, Cambridge, UK: Cambridge University Press, pp. 23-48.
Villosio, C., A. Venturini (2002), Are Immigrants Competing with Natives in the Italian Labour Market? The Employment Effect, Mimeo, University of Turin.
Winkelmann, R., K.F. Zimmermann (1993), Ageing, Migration, and Labour Mobility, in: P. Johnson, K.F. Zimmermann (eds.), Labour Markets in an Ageing Europe, Cambridge, UK: Cambridge University Press, pp. 255-283.
Winter-Ebmer, R. , J. Zweimüller (1996), Immigration and the Earnings of Young Native Workers, Oxford Economic Papers, 48, pp. 473-491.
Winter-Ebmer, R. and J. Zweimüller (1994): Do Immigrants Displace Native Workers? The Austrian Experience, CEPR Working Paper 991.
Winter-Ebmer, R., K.F. Zimmermann (1999), East-West Trade and Migration: The Austro-German Case, in: Faini, R., J. de Melo, K.F. Zimmermann (eds.), Migration: The Controversies and the Evidence, Cambridge, Cambridge University Press, pp. 296-327.
Wong, K. (1995), International Trade in Goods and Factor Mobility, Cambridge, MA: MIT-Press.
World Bank (2001), World Development Indicators, CD-ROM, Washington, D.C.
Zimmermann, K.F. (1994a), European Migration, Push and Pull, Proceedings volume of the World Bank Annual Conference on Development Economics, Supplement to the World Bank Economic Review and the World Bank Research Observer.
Zimmermann, K.F. (1994b), Immigration Policies in Europe, An Overview, in: H. Siebert (ed.), Migration, A Challenge for Europe, Tübingen, J.C.B. Mohr, pp. 227-58.

55
55
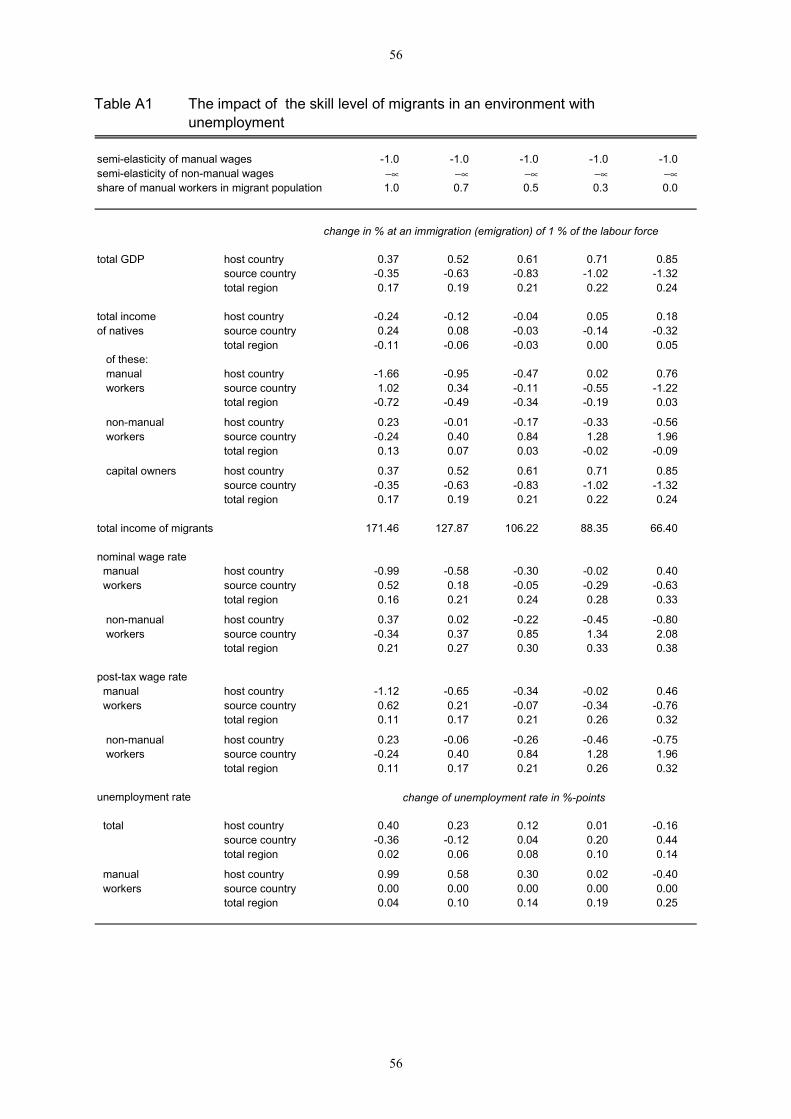
56
56
Table A1 The impact of the skill level of migrants in an environment with unemployment
semi-elasticity of manual wages -1.0 -1.0 -1.0 -1.0 -1.0semi-elasticity of non-manual wages −∝ −∝ −∝ −∝ −∝share of manual workers in migrant population 1.0 0.7 0.5 0.3 0.0
total GDP host country 0.37 0.52 0.61 0.71 0.85source country -0.35 -0.63 -0.83 -1.02 -1.32total region 0.17 0.19 0.21 0.22 0.24
total income host country -0.24 -0.12 -0.04 0.05 0.18of natives source country 0.24 0.08 -0.03 -0.14 -0.32
total region -0.11 -0.06 -0.03 0.00 0.05 of these: manual host country -1.66 -0.95 -0.47 0.02 0.76 workers source country 1.02 0.34 -0.11 -0.55 -1.22
total region -0.72 -0.49 -0.34 -0.19 0.03
non-manual host country 0.23 -0.01 -0.17 -0.33 -0.56 workers source country -0.24 0.40 0.84 1.28 1.96
total region 0.13 0.07 0.03 -0.02 -0.09
capital owners host country 0.37 0.52 0.61 0.71 0.85source country -0.35 -0.63 -0.83 -1.02 -1.32total region 0.17 0.19 0.21 0.22 0.24
total income of migrants 171.46 127.87 106.22 88.35 66.40
nominal wage rate manual host country -0.99 -0.58 -0.30 -0.02 0.40 workers source country 0.52 0.18 -0.05 -0.29 -0.63
total region 0.16 0.21 0.24 0.28 0.33
non-manual host country 0.37 0.02 -0.22 -0.45 -0.80 workers source country -0.34 0.37 0.85 1.34 2.08
total region 0.21 0.27 0.30 0.33 0.38
post-tax wage rate manual host country -1.12 -0.65 -0.34 -0.02 0.46 workers source country 0.62 0.21 -0.07 -0.34 -0.76
total region 0.11 0.17 0.21 0.26 0.32
non-manual host country 0.23 -0.06 -0.26 -0.46 -0.75 workers source country -0.24 0.40 0.84 1.28 1.96
total region 0.11 0.17 0.21 0.26 0.32
unemployment rate
total host country 0.40 0.23 0.12 0.01 -0.16source country -0.36 -0.12 0.04 0.20 0.44total region 0.02 0.06 0.08 0.10 0.14
manual host country 0.99 0.58 0.30 0.02 -0.40 workers source country 0.00 0.00 0.00 0.00 0.00
total region 0.04 0.10 0.14 0.19 0.25
change in % at an immigration (emigration) of 1 % of the labour force
change of unemployment rate in %-points