Embed Size (px)
Citation preview

1
Proceedings of The Joint Canadian Society for Mechanical Engineering and CFD Society of Canada International Congress 2019 CSME-CFDSC Congress 2019
June 2-5, 2019, London, ON, Canada
CAN WE LIMIT THE PASSENGER EXPOSURE TO AIRBORNE CONTAMINANTS IN COMMERCIAL AIRCRAFT CABINS DURING THE CLIMB LEG?
Hossam A. Elmaghraby Mechanical Engineering Program, School of Engineering
University of Guelph Guelph, Ontario N1G 2W1, Canada
Yi Wai Chiang, Amir A. Aliabadi Environmental Engineering Program, School of Engineering
University of Guelph Guelph, Ontario N1G 2W1, Canada
[email protected] *Corresponding Author: [email protected]
Abstract—The climb leg is one of the most acceleration-intensive periods in a passenger aircraft flight. It was previously found that the passenger exposure to cough-released airborne contaminants during climb may reach 2.8 to 3.0 times when compared to other legs [1]. In the current study, airflow design and source control strategies are researched numerically for their ability to reduce cough-released airborne contaminant dispersion in the cabin of a Boeing 767-300 aircraft during climb. Sulfur Hexafluoride (SF6) was used to mimic the contaminant, which mainly comprises of cough-released particles in the size range from 1.6 to 3 µm in diameter. The airflow design strategies involved altering the supply airflow direction, while the source control strategies involved moving the cougher to different locations in the cabin. Among all cases, the relocation of the cougher to the left-side, centre-row location and changing the airflow direction in two and three dimensions exhibited the highest reduction in passenger exposure to contaminant compared to the baseline climb case. The exposure reductions were 0.5-0.7 times for the first case, 0.5-0.7 times for the second case, and 0.4-0.9 times for the third case, respectively.
Keywords- Aircraft acceleration; Airborne contaminants; Air quality; Aircraft ventilation; Source control; CFD
I. INTRODUCTION Air quality and disease transport aboard passenger aircraft
has been an intensive research topic in the past few decades as inferred from a large number of studies in literature [2–13]. This is because the transmission of airborne viruses, such as influenza, tuberculosis, and SARS, is escalated in the closed cabin space through direct passenger-to-passenger exposure and/or from contaminated surfaces (European Centre for Disease Prevention and Control (ECDC) 2018; Mangili and Gendreau 2005). Examples for such transmissions are the in-flight SARS outbreak in China in 2003, and the outbreak of influenza A(H1N1) in 2009 whose introduction was caused by air travel [14]. In addition, the complex environment inside the passenger aircraft cabins due to the high occupant density and
the wide range of passenger activity provide suitable grounds for air quality deterioration and spread of airborne contaminants if no proper remedial measures are taken [15, 16].
Passenger aircraft perform several flight legs, which are ordered as: takeoff, climb, steady level flight (cruise), descent, and landing. During those legs, the aircraft move with high speeds and experience various accelerations [17]. With those accelerations occur body forces that can significantly affect the airflow patterns and airborne contaminants dispersion within aircraft cabins. To the authors’ knowledge, no previous aircraft ventilation or air quality studies have investigated the effect of such body forces on in-cabin airflow patterns and contaminant dispersion behavior. Rather, studies in the literature always considered that aircraft are stationary or in cruise mode, for which the only applicable body force results from the gravitational acceleration.
However, Elmaghraby et al. 2019 [1] found in a recent study on a Boeing 767-300 aircraft model that among the steady level flight, climb, and descent legs, the climb leg exhibited the highest levels of contaminant surrogate (SF6) exposures at two different monitoring locations in the cabin. Also, variations in airflow patterns and airflow circulation (Г) from one flight leg to the other were noticed. This indicates that acceleration-induced body forces on aircraft have a significant influence on both airflow patterns and contaminant dispersion in the cabins and require further investigation especially in the form of parametric variations and finding possible means of mitigation [1].
In the current study, different airflow design and source control strategies are investigated as mitigation or reduction means for the increased cough-released contaminant exposure in a passenger aircraft cabin during the climb leg using numerical simulations. The case for the descent leg was not studied due to the evidence that contaminant exposure is not significantly influenced for those legs [1]. Airflow design strategies such as changing airflow supply direction are employed. On the other hand, the source control strategies considered involve moving the cougher to other locations in the cabin.
*Address all correspondence to this author.
2
II. METHODS
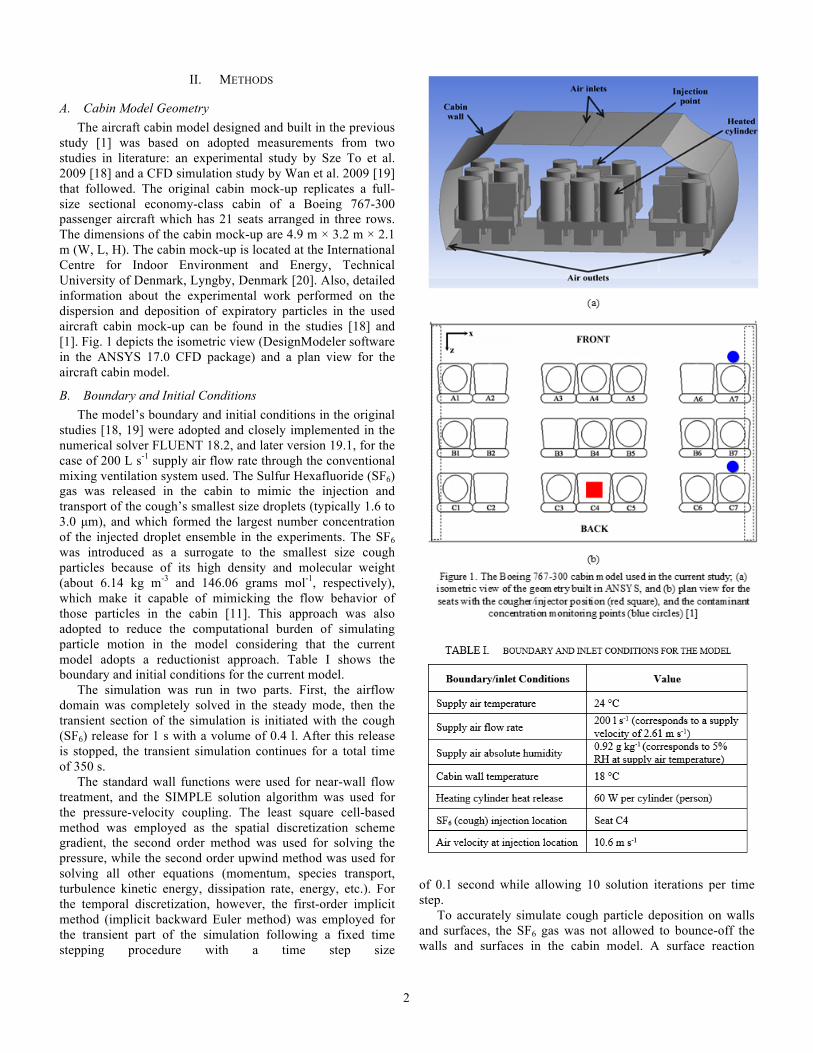
A. Cabin Model Geometry The aircraft cabin model designed and built in the previous
study [1] was based on adopted measurements from two studies in literature: an experimental study by Sze To et al. 2009 [18] and a CFD simulation study by Wan et al. 2009 [19] that followed. The original cabin mock-up replicates a full-size sectional economy-class cabin of a Boeing 767-300 passenger aircraft which has 21 seats arranged in three rows. The dimensions of the cabin mock-up are 4.9 m × 3.2 m × 2.1 m (W, L, H). The cabin mock-up is located at the International Centre for Indoor Environment and Energy, Technical University of Denmark, Lyngby, Denmark [20]. Also, detailed information about the experimental work performed on the dispersion and deposition of expiratory particles in the used aircraft cabin mock-up can be found in the studies [18] and [1]. Fig. 1 depicts the isometric view (DesignModeler software in the ANSYS 17.0 CFD package) and a plan view for the aircraft cabin model.
B. Boundary and Initial Conditions The model’s boundary and initial conditions in the original
studies [18, 19] were adopted and closely implemented in the numerical solver FLUENT 18.2, and later version 19.1, for the case of 200 L s-1 supply air flow rate through the conventional mixing ventilation system used. The Sulfur Hexafluoride (SF6) gas was released in the cabin to mimic the injection and transport of the cough’s smallest size droplets (typically 1.6 to 3.0 µm), and which formed the largest number concentration of the injected droplet ensemble in the experiments. The SF6 was introduced as a surrogate to the smallest size cough particles because of its high density and molecular weight (about 6.14 kg m-3 and 146.06 grams mol-1, respectively), which make it capable of mimicking the flow behavior of those particles in the cabin [11]. This approach was also adopted to reduce the computational burden of simulating particle motion in the model considering that the current model adopts a reductionist approach. Table I shows the boundary and initial conditions for the current model.
The simulation was run in two parts. First, the airflow domain was completely solved in the steady mode, then the transient section of the simulation is initiated with the cough (SF6) release for 1 s with a volume of 0.4 l. After this release is stopped, the transient simulation continues for a total time of 350 s.
The standard wall functions were used for near-wall flow treatment, and the SIMPLE solution algorithm was used for the pressure-velocity coupling. The least square cell-based method was employed as the spatial discretization scheme gradient, the second order method was used for solving the pressure, while the second order upwind method was used for solving all other equations (momentum, species transport, turbulence kinetic energy, dissipation rate, energy, etc.). For the temporal discretization, however, the first-order implicit method (implicit backward Euler method) was employed for the transient part of the simulation following a fixed time stepping procedure with a time step size
of 0.1 second while allowing 10 solution iterations per time step.
To accurately simulate cough particle deposition on walls and surfaces, the SF6 gas was not allowed to bounce-off the walls and surfaces in the cabin model. A surface reaction

3
boundary condition at every wall and surface was set to dissociate SF6 upon contact to its basic gaseous components: Sulfide (S2) and Fluorine (F2) gases according to the following reaction,
(1)
As the released SF6 in the cabin is already at very low concentrations, the concentrations of the Sulfide and Fluorine gases produced from its dissociation are extremely low and do not affect the air composition, fluid properties, or the monitored SF6 concentration in the cabin. This method allows a surrogate simulation of small particles that behave like gases in the aircraft cabin very computationally economically.
C. Model Validation and Error Estimation The previous study [1] presents a thorough grid
independence analysis of the current model. In addition, it presents model validation through error estimation of the calculated SF6 concentration time series at the two monitoring seat locations (seats A7 and C7) using various Reynolds-averaged Navier-Stokes (RANS) turbulence models (Standard k-epsilon, RNG k-epsilon, Realizable k-epsilon, Standard k-omega, and SST k-omega). Thus, the grid independence study will not be repeated here again. However, a model validation of the normalized SF6 concentration time series calculated using the RNG k-epsilon model, which was previously found to be the most accurate turbulence model, against experimental measurements is shown in Fig. 2.
The numerical solution was obtained on a fine grid (7,375,800 grid elements) with the RNG k-epsilon turbulence model that is capable of simulating buoyancy effects on the production and dissipation of turbulence kinetic energy (k).
In the preceding study [1], the error estimation for the model predictions were calculated as the fractional mean bias (FB) and normalized mean square error (NMSE) measures. The FB and NMSE are defined as follows,
(2)
(3)
where, Co and Cp are the observed (experimental) and predicted (numerical) concentrations, respectively. While FB is a measure of the shift between the observed and predicted quantities, NMSE is a measure of the spread between observed and predicted quantities. For a perfect model, FB and NMSE are both equal to zero.
Table II gives the FB and NMSE values calculated for the air velocity and the normalized SF6 concentration time series between the experimental measurements and the numerical predictions of the simulation using the RNG k-epsilon turbulence model.
From Table II it can be observed that the NMSE values for normalized SF6 concentration time series at seat C7 are about 50% less than at seat A7, while FB values are almost identical
at both seats. This indicates that the shift between the observed and predicted concentration values is similar, but the spread of the predicted data with respect to the observed ones is two times higher at seat A7, which indicates less accurate predictions. Physically, this decrease in prediction accuracy can be attributed to the condition of airflow, and consequently that of the surrogate SF6 gas, from the emission source (at seat C4) to each seat. From C4 to C7 the flow is mainly lateral, which is less susceptible to the bulk flow turbulence than the primarily longitudinal flow experienced from C4 to A7 (see Fig. 1).
D. Calculation of Aircraft Body Acceleration Components The aircraft vertical acceleration (av) and horizontal
acceleration (ah) components were calculated during the climb leg using a basic approach adapted from different sources in aircraft dynamics literature.
The calculation procedure relies on applying Newton’s second law ( ) on two axes passing through the center of gravity of the aircraft; one is vertical and the other is horizontal. The forces in action are the lift (L), drag (D), the aircraft’s weight (W), and the thrust of the jet engines (T). For example, the relative vertical acceleration on the aircraft cabin during climb is found to be 2.4 g, which is comprised of two parts; 1.4 g due to aircraft acceleration, and 1 g representing the gravitational component. More information on the calculation procedure followed during the climb leg can be found in [1].

4
III. RESULTS AND DISCUSSION As highlighted in the introduction section, the SF6
concentration was found to be the highest at the two monitoring locations considered during the climb leg as compared to the steady level flight and descent legs. The calculated SF6 concentration time series during the three flight legs are graphically shown in Fig. 3. Also, it can be noticed from Fig. 3 that the SF6 concentration time series during the descent leg is similar to that during the steady level flight leg with no significant difference. This can be attributed to the low speed of the passenger aircraft during descent yielding limited acceleration components. Although changing some model factors, such as the location of the cougher (contaminant injector), cough velocity, or airflow conditions may alter this resemblance between the steady level flight and the descent legs, the large relative difference in SF6 concentration between the mentioned two legs and the climb leg favors the investigation of the climb leg. Therefore, the current study will only consider the climb leg, and different airflow design and source control strategies are to be investigated as remedial techniques to the increasing SF6 concentration noticed during this leg.
In addition to the SF6 concentration, the exposure of the passengers to SF6 over time is used as another measure in this study to assess the effect of the acceleration-induced body forces on the contaminant dispersion in the cabin. The exposure is determined by calculating the area under the curve corresponding to each case using the following integral within the simulation time limits,
(4)
Using this measure, it was found that the passenger exposure is always the highest during the climb leg when compared to the steady level flight and the descent legs. The highest exposure ratio was 3.0 to 1 calculated between climb and descent at seat C7. Nevertheless, the passenger at the same seat experienced a very similar exposure to the contaminant during the descent and steady level flight legs with a ratio of 0.9 to 1 [1].
A. Airflow Design Strategies Airflow direction:
In the current study, the direction of the supply airflow was changed using two-dimensional and three-dimensional approaches. In 2-D, the airflow direction was tilted downwards from the cabin ceiling by an angle α. However, in 3-D, an angle β was added to direct the airflow either to the front or to the back of the cabin while still being tilted downwards with the angle α. Fig. 4 shows examples of using those angles in 2-D and 3-D views for the cabin model.
a) Changing angle α only:
First, only the change of the supply airflow direction angle α in 2-D is considered. Three airflow supply angles were investigated for their ability to reduce the SF6 concentration exposure in the cabin during the climb leg: 20˚, 30˚, and 60˚.
The SF6 concentration time series for the 20˚ and 30˚ airflow supply scenarios during climb versus that for the standard climb and steady level flight from Elmaghraby et al. 2019 [1] at seats A7 and C7 are shown in Fig. 5. However, for the readability of the figures, the same comparison for the 60˚ supply case is shown separately in Fig. 6.
From Figs. 5 and 6 it can be noticed that there is a considerable difference in the calculated SF6 concentration time series using each of the three airflow supply angles. The airflow supplied at 30˚ had the peak SF6 concentration, and consequently the exposure of occupants, reduced to almost 50% of the original concentration during climb at the two monitoring locations. Conversely, the airflow supplied at 20˚ was not able to provide better air quality conditions at the two monitoring locations, and the exposure of passengers to the contaminant was almost the same as that for the original climb air supply scenario.
On the other hand, from Fig. 6, it can be seen that supply-

5
ing air at 60˚ to the cabin produced the worst air quality conditions at the two locations. This is backed by the very high passenger exposure to SF6 under this air supply condition, especially at seat A7, where the exposure was around 400% of the original case.
To put this comparison in a more graphical way, SF6 concentration contours are shown at the breathing level of the occupants during the 30˚ and 60˚ airflow supply cases in Fig. 7. Due to the transient nature of the simulations, the best representative time window was chosen to show the contours, which is at 350 s in this case.
As can be seen in the two contour plots, with α = 60˚, the area covered by the supplied air is very limited at the cabin central area around the two rear seat rows. This leaves most of the seats on the two cabin sides exposed to the contaminant. Conversely, the airflow supplied at 30˚ efficiently reached the cabin sides and lead to reduced passenger exposure at most cabin seats. However, with α = 30˚, a very minor increase in the SF6 concentration is seen at the centre of the cabin due to the elevated mixing effects induced by the strong airflow eddies at this area.
b) Changing angles α and β simultaneously:
In this alternative airflow redirection approach, angle β is simultaneously changed with angle α to add a three-dimensional prospective to this investigation. As α = 30˚ provided the best cabin air quality relative to the other two airflow supply angles in 2-D, α = 30˚ will be used again here with β also chosen to be equal to 30˚ with supply airflow either directed to the front or to the back of the cabin. This was performed to provide a clear comparison between those two scenarios while limiting the number of simulations required. Fig. 8 depicts the SF6 concentration time series at the two monitoring locations using β = 30˚ to the front and to the back.
Comparing the SF6 concentration time series at the two locations from Fig. 8, the β = 30˚ airflow supply to the back of the cabin could consistently reduce the time-integrated passenger exposure from the original climb case either at seat A7 or seat C7. More specifically, at seat C7, the exposure was reduced to a level close to that for the steady level flight condition. Conversely, in case of the β = 30˚ airflow supply to the front, the passenger exposure was higher

6
at seat A7 than the original case, but the exposure was almost halved for the same scenario at seat C7. Such complex response in concentration time series can be understood when the SF6 contour plots for the mentioned two airflow supply cases at 350 s are compared as shown in Fig. 9.
As noticed from the figure, directing airflow to the front of the cabin pushes the contaminant eventually to the rear of the cabin at the end of simulation time (350 s). Before this happens, however, the air moves most of the contaminant to the frontal rows for a short period of time (70-80 s) after contaminant release in the cabin. This explains the very high contaminant concentration at seat A7 around this time. On the other hand, supplying airflow to the back of the cabin leads to steadily pushing the contaminant to the front of the cabin and providing appropriate dilution of it in the cabin air with no major dispersion patterns in the back rows. This can be attributed to the overall airflow direction being in the same direction of the cough flow in this case. The contaminant dilution provided by the back-directed airflow makes the overall passenger exposure to the contaminant consistently low at most cabin seats as previously seen in Fig. 9.
B. Source Control Strategies
Cougher location in the cabin: In this investigation, the location of the cougher was
changed twice from the back row in the centre to the central row on the left side (LC), and to the front row on the right side (RF) (looking from the back of the cabin to the front). The new cougher locations with respect to the original case are shown in Fig. 10.
Figs. 11 and 12 depict the SF6 concentration time series at the two seats A7 and C7 with the cougher positions at locations LC and RF, respectively. The series for the two cases were separated to enhance their readability.
Based on the concentration time series, the contaminant concentration at each monitoring point is significantly affected by the cougher location. For example, as the cougher moves to the LC location, the concentration at the two monitors for the full simulation time was significantly reduced to a nearly similar level. This is because the cougher at the LC location is almost equally distanced from the two monitoring points.
Conversely, as the cougher set at the RF location is very

7
close to the monitoring point at seat A7, the contaminant concentration increased substantially to about eight-fold its maximum value during the baseline climb case as shown in Fig. 12a. On the other hand, at seat C7, the contaminant time-averaged concentration was much lower in the RF cougher location scenario than the baseline case because the cougher was moved further away from it.
In addition to the effect of cougher proximity, the ventilation airflow patterns in the cabin and/or the existence of walls or surfaces close to the cougher location have significant influence on the dispersion behavior of the released contaminant in the cabin by impacting or redirecting the cough. Such influence can be inferred from the SF6 concentration contour plots for the two cougher location cases illustrated in Fig. 13.
Looking at the contour plot for the LC cougher location, the contaminant is noticed to reside at the back of the cabin at the end of simulation. This is impacted by the airflow in the cabin and the body forces during aircraft climb, which push the contaminant to the back rows from the front of the cabin on the left side where it initially dispersed after release. On the
other hand, the contaminant released from the cougher in the RF position follows along the frontal cabin separator to the left before it disperses to the back rows by the help of airflow mix-

8
ing. This leads to higher concentration regions in the
central section of the cabin and more exposure of the occupants to the contaminant. According to the results, a coughing person aboard an aircraft may not only cause higher probability of exposure to the passengers close to him/her, but also to most occupants if this person is coughing in proximity to a wall or surface.
Finally, Table III lists the passenger exposure ratio between the various cases studied in the current paper and the baseline climb case. The lowest exposure ratios are presented in bold font.
The exposure values were calculated using equation 4 (previously presented) and applying the composite Simpson’s and the composite trapezoidal rules in determining the area under the curve for each concentration time series.
From Table III, the lowest average exposure ratio between the two seats is found for the left-side, centre-row relocation of the cougher case. The case that come after is the α = 30˚ airflow direction case followed by the α = 30˚ and β = 30˚ (to the back) airflow direction case. Such airflow design and/or s-
ource control strategies could be implemented to reduce the exposure of the aircraft occupants to expiratory contaminants released in this aircraft cabin, especially during the climb leg.
Nevertheless, the highest exposure ratio is noticed for the α = 60˚ airflow direction scenario. This is followed by the occurrence in which the cougher is moved to the front row on the right side of the cabin, and later by setting α = 30˚ and β = 30˚ to the front as airflow direction condition.
IV. CONCLUSIONS In the current study, airflow design and source control
strategies were investigated for their potential for reducing cough-released airborne contaminant exposure in the cabin of a passenger aircraft (Boeing 767-300) during the climb leg. Sulfur Hexafluoride (SF6) was used to mimic the airborne contaminant in the cabin, representing cough-released particles in the size range from 1.6 to 3 µm in diameter. The SF6 dispersion behavior was analyzed by calculating the concentration time series at two monitoring locations, seats A7 and C7 in the cabin, in addition to SF6 concentration contour p-

9
lots at the breathing level of the occupants. The concentration time series were further used to infer the passenger exposure to the contaminant through determining the area under each curve.
In this paper, the airflow design strategies researched involved altering the supply airflow direction, while the source control strategies involved moving the cougher to different locations in the cabin.
Changing the airflow supply angle from the ceiling only, or α, from 20˚ to 60˚ had different effects on the SF6 dispersion behavior in the cabin. The angle α = 30˚ led to the lowest passenger exposure. However, the 20˚ and 60˚ angles, compared to passenger exposure of the baseline climb case with α = 0˚, resulted in similar and higher exposures, respectively. Further, when a three-dimensional approach was introduced to the airflow redirection scenario through the angle β, directing the airflow to the back of the cabin proved to be better than directing it to the front.
For the source control strategies, relocating the cougher to other locations in the cabin other than the original back-row-centre-seat position had a quantifiable effect on the dispersion behavior of the contaminant, and consequently, the exposure.
Moving the cougher to the left side of the cabin in the centre row (LC location) led to decreased passenger exposure both locally at the monitoring locations, and as an average in the whole cabin. On the other hand, moving the cougher to the right side of the cabin in the front row (RF location) caused a substantial increase in the exposure at seat A7, as it is very close to it, while it halved the exposure at seat C7. In addition to the proximity of the cougher to specific passengers, the airflow patterns in the cabin, the body forces on the aircraft during climb, and the existence of walls and/or surfaces near the cougher all have confounding effects on the resulted contaminant dispersion behavior from different cougher locations.
Generally, the cases that showed most promising reduction in passenger exposure as an average between the two monitoring locations at seats A7 and C7 with respect to the baseline climb case were: the left-side, centre-row relocation of the cougher, the α = 30˚ airflow direction, and the α = 30˚ and β = 30˚ (to the back) airflow direction cases. The exposure ratios are 0.7:1 at seat A7 and 0.5:1 at seat C7 for the first case, 0.7:1 at seat A7 and 0.5:1 at seat C7 for the second case, and 0.9:1 at seat A7 and 0.4:1 at seat C7 for the third case, respectively. On the other hand, the highest exposure in average between the two seats belongs to the α = 60˚ airflow direction case with 3.5:1 at seat A7 and 2.1:1 at seat C7.
For future work, and to generalize the findings of the current study, similar parametric analysis needs to be implemented on other models of passenger aircraft with different cabin configurations. Moreover, different ventilation strategies, other than the conventional mixing ventilation used

10
in this study, such as underfloor and personalized ventilation systems can be implemented. Finally, further combinations and/or additions to the proposed airflow design and source control strategies in the current work can be investigated for possible enhancements in the in-cabin air quality. This work warrants the need for multiple detailed investigations related to the influence of aircraft acceleration-induced body forces on ventilation performance of aircraft, an issue that has been neglected in the literature for a long time.
ACKNOWLEDGMENT The authors thank the Government of Ontario, Canada, for
providing the funding for this work in the form of the Ontario Trillium Scholarship (OTS) for the lead author. The authors also thank Natural Sciences and Engineering Research Council (NSERC) of Canada, specifically the Discovery Grant program (Grant Number 401231) supporting the lead author knowledge dissemination in conferences and journals. They also thank Dr. Christopher Y. H. Chao (Department of Mechanical Engineering, Hong Kong University of Science and Technology, Clear Water Bay, Hong Kong, China), and Dr. Man Pun Wan (Department of Mechanical & Aerospace Engineering, Nanyang Technological University, Singapore) for providing their full experimental research data. Additionally, the authors recognize CMC Microsystems for providing the Academic Research license of ANSYS. Finally, they thank the Centre for Advanced Computing (CAC) at Queen’s University (Kingston, ON, Canada) for allowing access to the Frontenac Compute Cluster, and SHARCNET for providing the Graham cluster to run the simulations.
REFERENCES [1] H. A. Elmaghraby, Y. W. Chiang, and A. A. Aliabadi, “Are Aircraft
Acceleration-induced Body Forces Effective on Contaminant Dispersion in Passenger Aircraft Cabins?,” Sci. Technol. Built Environ., accepted, 2019.
[2] J. W. Drake and D. E. Johnson, “Measurements of certain environmental tobacco smoke components on long-range flights,” Aviat. Space. Environ. Med., vol. 61, no. 6, pp. 531–542, 1990.
[3] M. Dechow, H. Sohn, and J. Steinhanses, “Concentrations of Selected Contaminants in Cabin Air of Airbus Aircrafts,” Chemosphere, vol. 35, pp. 21–31, 1997.
[4] F. Li, J. Liu, J. Ren, X. Cao, and Y. Zhu, “Numerical investigation of airborne contaminant transport under different vortex structures in the aircraft cabin,” Int. J. Heat Mass Transf., vol. 96, pp. 287–295, 2016.
[5] L. Yang, X. Li, Y. Yan, and J. Tu, “Effects of cough-jet on airflow and contaminant transport in an airliner cabin section,” J. Comput. Multiph. Flows, vol. 10, no. 2, pp. 72–82, 2018.
[6] F. Haghighat, F. Allard, A. C. Megri, P. Blondeau, and R. Shimotakahara, “Measurement of thermal comfort and indoor air quality aboard 43 flights on commercial airlines,” Indoor Built Environ., vol. 8, no. 1, pp. 58–66, 1999.
[7] M. B. Hocking, “Passenger aircraft cabin air quality: Trends,
effects, societal costs, proposals,” Chemosphere, vol. 41, no. 4, pp. 603–615, 2000.
[8] N. L. Nagda and M. Hodgson, “Low Relative Humidity and Aircraft Cabin Air Quality,” Indoor Air, vol. 11, no. 3, pp. 200–214, 2001.
[9] M. A. Waters, T. F. Bloom, B. Grajewski, and J. Deddens, “Measurements of Indoor Air Quality on Commercial Transport Aircraft,” in The 9th International Conference on Indoor Air Quality and Climate, 2002, pp. 782–787.
[10] C.-H.- Lin, K. H. Dunn, R. H. Horstman, J. L. Topmiller, M. F. Ahlers, J. S. Bennett, L. M. Sedgwick, and S. Wirogo, “Numerical Simulation of Airflow and Airborne Pathogen Transport in Aircraft Cabins--Part I: Numerical Simulation of the Flow Field.,” ASHRAE Trans., vol. 111, no. 1, pp. 755–764, 2005.
[11] Z. Zhang, X. Chen, S. Mazumdar, T. Zhang, and Q. Chen, “Experimental and numerical investigation of airflow and contaminant transport in an airliner cabin mockup,” Build. Environ., vol. 44, no. 1, pp. 85–94, 2009.
[12] S. B. Poussou, S. Mazumdar, M. W. Plesniak, P. E. Sojka, and Q. Chen, “Flow and contaminant transport in an airliner cabin induced by a moving body: Model experiments and CFD predictions,” Atmos. Environ., vol. 44, no. 24, pp. 2830–2839, 2010.
[13] S. S. Isukapalli, S. Mazumdar, P. George, B. Wei, B. Jones, and C. P. Weisel, “Computational fluid dynamics modeling of transport and deposition of pesticides in an aircraft cabin,” Atmos. Environ., vol. 68, pp. 198–207, 2013.
[14] A. A. Aliabadi, S. N. Rogak, K. H. Bartlett, and S. I. Green, “Preventing airborne disease transmission: review of methods for ventilation design in health care facilities.,” Adv. Prev. Med., vol. 2011, pp. 1–21, 2011.
[15] ASHRAE, “Standard 161-2013: Air Quality within Commercial Aircraft,” American Society of Heating, Refrigerating and Air-Conditioning Engineers, Atlanta, GA, USA, 2013.
[16] H. A. Elmaghraby, Y. W. Chiang, and A. A. Aliabadi, “Ventilation strategies and air quality management in passenger aircraft cabins: A review of experimental approaches and numerical simulations,” Sci. Technol. Built Environ., vol. 24, no. 2, pp. 160–175, 2018.
[17] D. G. Hull, Fundamentals of Airplane Flight Mechanics. New York: Springer Berlin Heidelberg, 2007.
[18] G. N. Sze To, M. P. Wan, C. Y. H. Chao, L. Fang, and A. Melikov, “Experimental Study of Dispersion and Deposition of Expiratory Aerosols in Aircraft Cabins and Impact on Infectious Disease Transmission,” Aerosol Sci. Technol., vol. 43, no. 5, pp. 466–485, 2009.
[19] M. P. Wan, G. N. Sze To, C. Y. H. Chao, L. Fang, and A. Melikov, “Modeling the Fate of Expiratory Aerosols and the Associated Infection Risk in an Aircraft Cabin Environment,” Aerosol Sci. Technol., vol. 43, no. 4, pp. 322–343, 2009.
[20] P. Strøm-Tejsen, D. P. Wyon, L. Lagercrantz, and L. Fang, “Passenger evaluation of the optimum balance between fresh air supply and humidity from 7-h exposures in a simulated aircraft cabin,” Indoor Air, vol. 17, no. 2, pp. 92–108, 2007.