Embed Size (px)
Citation preview
DI
SC
US
SI
ON
P
AP
ER
S
ER
IE
S
Forschungsinstitut zur Zukunft der ArbeitInstitute for the Study of Labor
Can We Measure Individual Risk Attitudes in a Survey?
IZA DP No. 4807
March 2010
Xiaohao DingJoop HartogYuze Sun
Can We Measure Individual Risk Attitudes in a Survey?
Xiaohao Ding Peking University
Joop Hartog
University of Amsterdam and IZA
Yuze Sun
Peking University
Discussion Paper No. 4807 March 2010
IZA
P.O. Box 7240 53072 Bonn
Germany
Phone: +49-228-3894-0 Fax: +49-228-3894-180
E-mail: [email protected]
Any opinions expressed here are those of the author(s) and not those of IZA. Research published in this series may include views on policy, but the institute itself takes no institutional policy positions. The Institute for the Study of Labor (IZA) in Bonn is a local and virtual international research center and a place of communication between science, politics and business. IZA is an independent nonprofit organization supported by Deutsche Post Foundation. The center is associated with the University of Bonn and offers a stimulating research environment through its international network, workshops and conferences, data service, project support, research visits and doctoral program. IZA engages in (i) original and internationally competitive research in all fields of labor economics, (ii) development of policy concepts, and (iii) dissemination of research results and concepts to the interested public. IZA Discussion Papers often represent preliminary work and are circulated to encourage discussion. Citation of such a paper should account for its provisional character. A revised version may be available directly from the author.
IZA Discussion Paper No. 4807 March 2010
ABSTRACT
Can We Measure Individual Risk Attitudes in a Survey? We combine a survey and an experiment with real pay-out among Peking University students to measure and validate individual risk attitudes. The experiment involves choosing between a cash payment and playing a lottery. The survey questions ask for the reservation price of a hypothetical lottery and self-assessment of risk attitude on a 0-10 scale. We confirm familiar findings: risk aversion dominates, women are more risk averse than men, risk aversion decreases with increasing parental income, risk attitudes are domain-specific. Correlations between survey measures and experimental measures, are in the right direction, but not very high. The survey measures are valid indicators of experimentally measured risk attitude, but with substantial noise remaining. Heterogeneity in levels and structures of risk attitude is large. JEL Classification: D12 Keywords: risk attitude, survey question, experimental validation Corresponding author: Joop Hartog Amsterdam School of Economics University of Amsterdam Plantage Muidergracht 12 1018 TV Amsterdam The Netherlands E-mail: [email protected]
1. Research Question
Many questions in economics are analysed empirically with data collected in a survey. Risk
attitude is often an important determinant of individual choice, but laboratory experiments to
measure risk attitude are usually not feasible when data are collected by survey. Hence, it would
be quite useful to have a reliable and validated method for measuring an individual’s risk attitude
in a survey. Recently, in economics two such methods have been put forward: asking for the
reservation price of a hypothetical lottery ticket (Donkers et al., 2001; Hartog et al, 2002; Guiso
and Paiella, 2008) and asking individuals to rate themselves on a scale of risk attitude, either in
general or for specific domains of life (Dohmen et al., 2005). Both methods have been used to
explain actual economic choices. Cramer et al. (2002) have used the lottery question to estimate
the relationship between self‐employment and risk attitude. Guiso and Paiella (2005) have used
a lottery type question to relate risk attitude to employment status, financial investments and
investment in human capital, Diaz‐Serrano and O’Neil linked it to the probability of
unemployment, Brunello (2002) linked it to attained level of education. Bonin et al. (2007) use
the risk attitude scale to link risk attitude to employment in occupations differing by earnings risk,
Caliendo et al. (2006) to link it to starting self‐employment. Shaw (1996) and Budria et al. (2009)
have used such scales to estimate the effect of risk attitude on wage growth (presumably
resulting from investment in human capital, a risky asset). Apart from these two approaches, risk
attitudes have also been measured by proxies like drinking and smoking behaviour (Bellante and
Link, 1981, to explain public sector employment status). In psychology, there is a longer tradition
of measuring risk attitudes in a survey (see, e.g. Weber et al., 2002).
In this paper we seek to validate these two methods by testing them on a real lottery, i.e. on a
lottery with pay‐out in real money. We set up an experiment among students of PKU in Beijing.
We solicited their risk attitudes with both methods and presented them with four opportunities
to participate in a real lottery which they could forgo by receiving a cash payment. We also asked
them for demographic background information and some types of actual lifestyle behaviour.
Our work is very similar to Dohmen et al. (2005)1. They related answers to a hypothetical investment question to choices in a real lottery. The hypothetical question asked how much of
100 000 euro that had just been won in a lottery would be invested in an investment project that
either doubles or halves the amount invested. Respondents were also offered choices between a
“safe value” (a cash payment) and a specified lottery; successively increasing the safe value
identifies the reservation price for the lottery. We essentially copied this approach and of course
we will compare our outcomes to theirs. Apart from the fact that their results are for German
adults and ours for Chinese students, there are two key differences. Dohmen et al. ask for
hypothetical choice in an investment opportunity, we ask for the hypothetical reservation price
of a lottery ticket; Dohmen et al. have 450 respondents, we only have 121. The work by Fausto
and Gillespie (2006) is also related. They focus on comparing measures of risk attitude collected
in mail surveys, with extensive references to the literature and a test of their own among 75 1 Binswanger (1980) also compares results of an actual and a hypothetical lottery, but he is more
interested in learning behavour in repeated participation in a lottery game.
cattle farmers.
In the sequel, we present our questionnaire and experimental design (Section 2), we characterise
the distributions of the key response variables (section 3), consider correlations between the risk
attitude measures (section 4), compare success in predicting some types of behaviour (section 5)
and relate measured risk attitudes to background characteristics (section 6). Section 7 concludes.
We have found that familiar findings are confirmed. As more or less commonly established in
economics and psychology, risk aversion dominates and women are more risk averse than men.
The economists’ usual presumption that risk aversion decreases with increasing parental income
is also found here. We find that risk attitudes are domain‐specific, a common finding in
psychology. But correlations between survey measures and experimental measures, while in the
right direction, are low. A striking conclusion is the large heterogeneity in levels and structure of
individual risk attitude.
2. Survey and experimental design
2.1 The survey
The computer programmed experiment took place in June 2008 at Peking University (PKU).
Students were attracted to participate by announcements at the university intranet and in
dormitories. Before the experiment, they are informed that participation would take about 40
minutes and that the basic payment is 20 Yuan. The respondents know they can earn more, but
have no idea how and how much (which may imply some selectivity towards the less risk averse).
The project consisted of two parts: a questionnaire and a set of experiments. A respondent was
first required to complete the questionnaire and then to participate in four games, each
providing choice between a cash payment and participating in a lottery. 121 students signed up,
third‐year and mostly fourth‐year students. On average they took home 135 yuan, with a
minimum of 60 and a maximum of 620 yuan. These are substantial amounts for students. A
survey among more than 50 Beijing universities in 2008 found a median monthly income of 716
yuan, making the average take‐home from the experiment close to 20% of median monthly
income2.
. The questionnaire used for the survey has six sections:
(1) Risk attitude (willingness to pay for a lottery, risk aversion scales)
(2) Personal data (demographics, major etc).
(3) Career choice (career orientation, graduate job placement)
( 4) Postgraduate education choice (pursue postgraduate study, views about financial support)
2 The survey was conducted by one of us (Xiaohao Ding).
(5) Lifestyle (smoking, drinking, etc)
(6) Expected future income, for different schooling choices
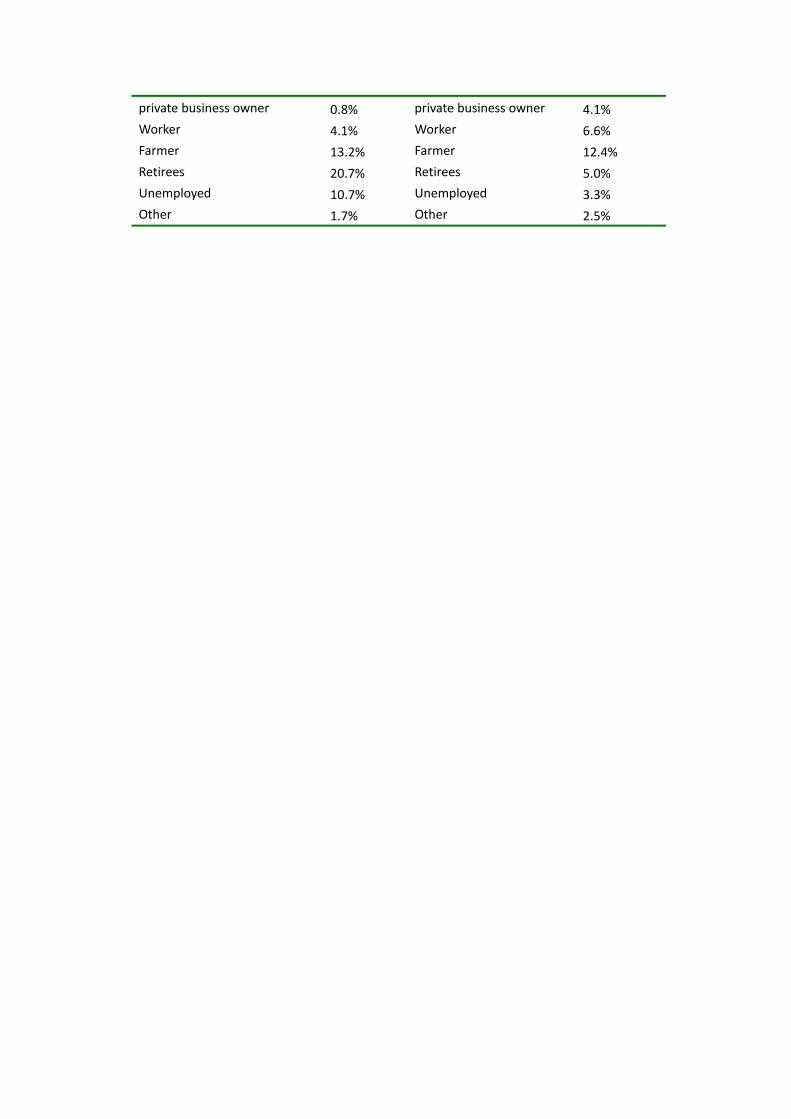
The data from section 4 and section 6 will be analysed in a separate paper. Table 1 shows basic
information about respondents. The sample is about equally divided between male and female
respondents, they are well spread across majors, most students are from more or less urban
areas; and their family background, measured by education and income, might be characterised
as mostly middle‐class. Self‐assessed rank in academic performance shows the usual
over‐estimation of quality. We will still use it, assuming that the ranking is not wholly unrelated
to true ranking.
2.2 Measuring risk attitude by survey
We measure risk attitude by survey in two ways: the reservation price for a lottery ticket and by
self‐assessment on a given scale.
A lottery question asks the respondent to specify the maximum price to be paid for participation
in a specified hypothetical lottery. As noted, this approach was applied earlier in Hartog, Ferrer‐i‐
Carbonell and Jonker (2002) and in a survey of the Bank of Italy (Guiso and Paiella, 2008). We
refer to this question as the lottery question. Specifically, in the present survey we ask:
Suppose in a lottery game, the possibility to win 1,000 yuan is 10%, then how much would you
pay at most to buy a lottery ticket?
We refer to the answer as the Lottery Reservation Price.
We have also reversed the question:
Now we change the conditions of the choice. Suppose you are offered 100 yuan in cash.
Instead, however, you may choose a lottery ticket. The lottery has a prize of 2000 yuan, but the
probability to win has not yet been determined. We want you to think about different
probabilities to win the prize of 2000 yuan. How high should this probability be at least for you
to take the lottery ticket rather than the 100 yuan in cash?
We refer to the answer as the Lottery Reservation Probability. We have given the two lotteries
different specifications, so as not to stimulate respondents to derive answers for the second
question from the specification of the first question.
For risk attitude measurement by self‐assessment we copy the questions asked in the German
SOEP survey, and analysed in Dohmen et al. (2005). Following a common practice, they ask
individuals to grade themselves, on an eleven‐point scale:
How do you see yourself: Are you in general a person who takes risk or do you try to evade
risks? Please self‐grade your choice (ranging between 0‐10)
The grades run from 0: “not at all prepared to take risk” to 10: “very much prepared to take risk”.
The same question has been asked for five domains:
A. finances;
B. leisure;
C. career;
D. health;
E. education.
2.3 Measuring risk attitude experimentally
To measure risk attitude experimentally, we present the students with choices between
receiving a cash payment or playing a lottery, with real pay‐out. There were four such games. To
make sure all games are attended, students are informed that the choices in each game will
contribute to their final payment. To restrain the cost of the experiment, actual pay‐out only
takes place randomly for one of the four games.
The choices in the games are presented on the student’s computer screen. For Game 1, this runs
as follows:
We will now offer you a choice between playing a lottery or receiving an amount of money. We
will ask you 20 times to choose between an amount of money and the lottery. Each time the
lottery is the same, but the amount of money is different. After you have made your choice in
all 20 cases, one of these alternatives will be randomly selected.
If in the selected alternative you have indicated you prefer the money, we will pay you the
amount that was stated.
If you have indicated that you prefer the lottery, we will play the lottery. If you win, the prize
will be sent to you by check right after this session.
In the lottery, with 50% probability you will win 300 yuan, with 50 % probability you will
receive nothing.
The computer screen shows the options as in Table 2, with a maximum of 20 choices. The cash
payment for each option increases from 10 yuan to 200 yuan. The value is raised as long as the
student chooses to continue the game. If in option 20 the student has not preferred a cash
payment, the lottery will be played as indicated if the random draw would pick this choice option.
The screen imposes consistency: if a student switches from preferring the lottery to the cash
pay‐out, all lower entries show that the lottery is preferred, all higher entries show that the cash
pay out is preferred. Respondents can always change all their entries as long as they have not yet
submitted their response to all four games. We will call this game the 300 Yuan Lottery Game.
We will call the cash pay‐out where the respondent switches to preferring the pay‐out to the
lottery the 300 Yuan Game Reservation Price. In the second game we only change the lottery
options: a 25% probability to win 600 yuan and 75% to win nothing; we will call this the 600 Yuan
Lottery Game and the switch point the 600 Yuan Game Reservation Price.
In Game 3 and 4 we ask for reservation probabilities. In Game 3, respondents can choose
between receiving 20 yuan or participate in a lottery with a prize of 100 yuan, where the
probability of winning varies; we call this the Win 100 yuan game and the switching probability
the Win 100 Yuan Reservation Probability. In Game 4, respondents receive 100 yuan and then
are offered the choice to pay 20 yuan or play a lottery with prize of ‐100 yuan, i.e., the obligation
to pay 100 yuan. We call this the Loose 100 Yuan Game and the switching probability the Loose
100 Yuan Reservation Probability.
3. Outcomes: frequency distributions
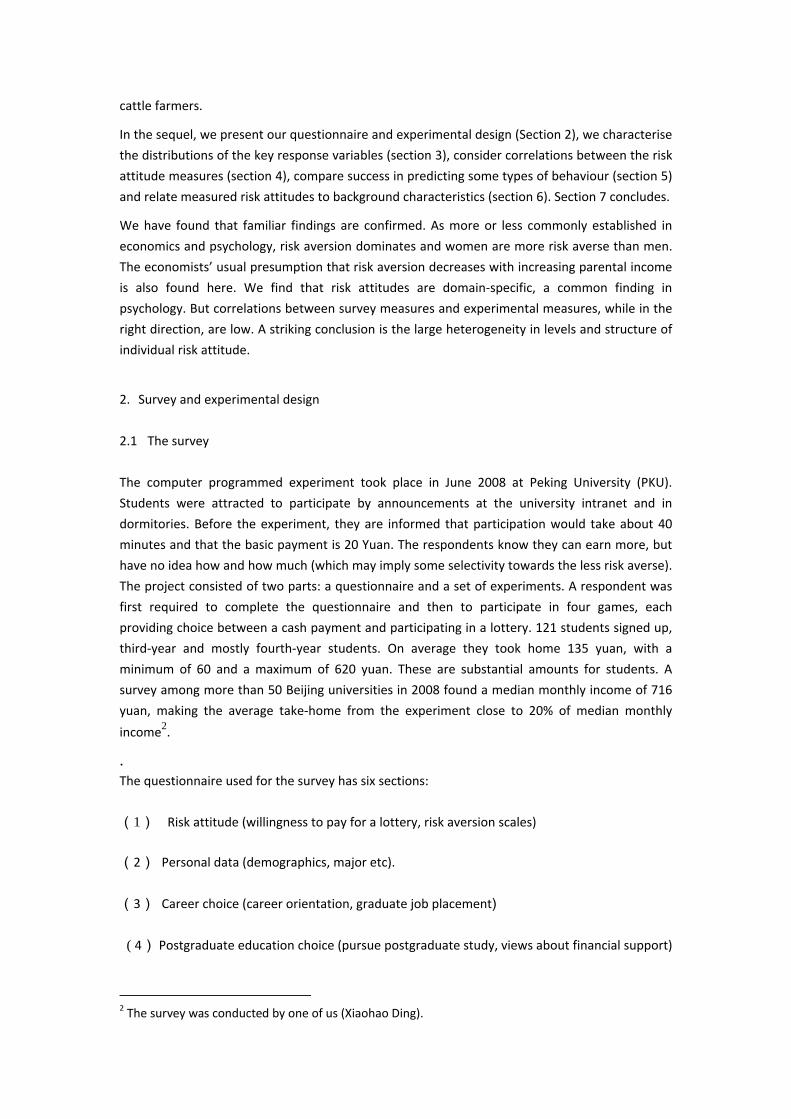
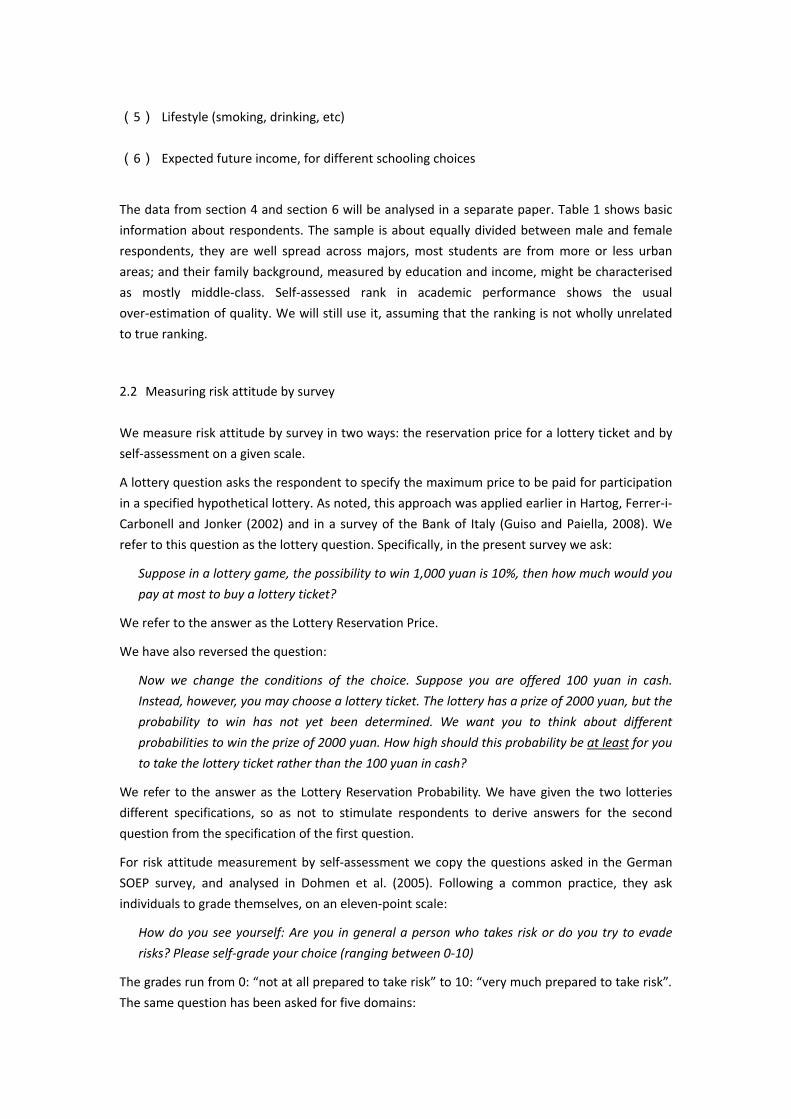
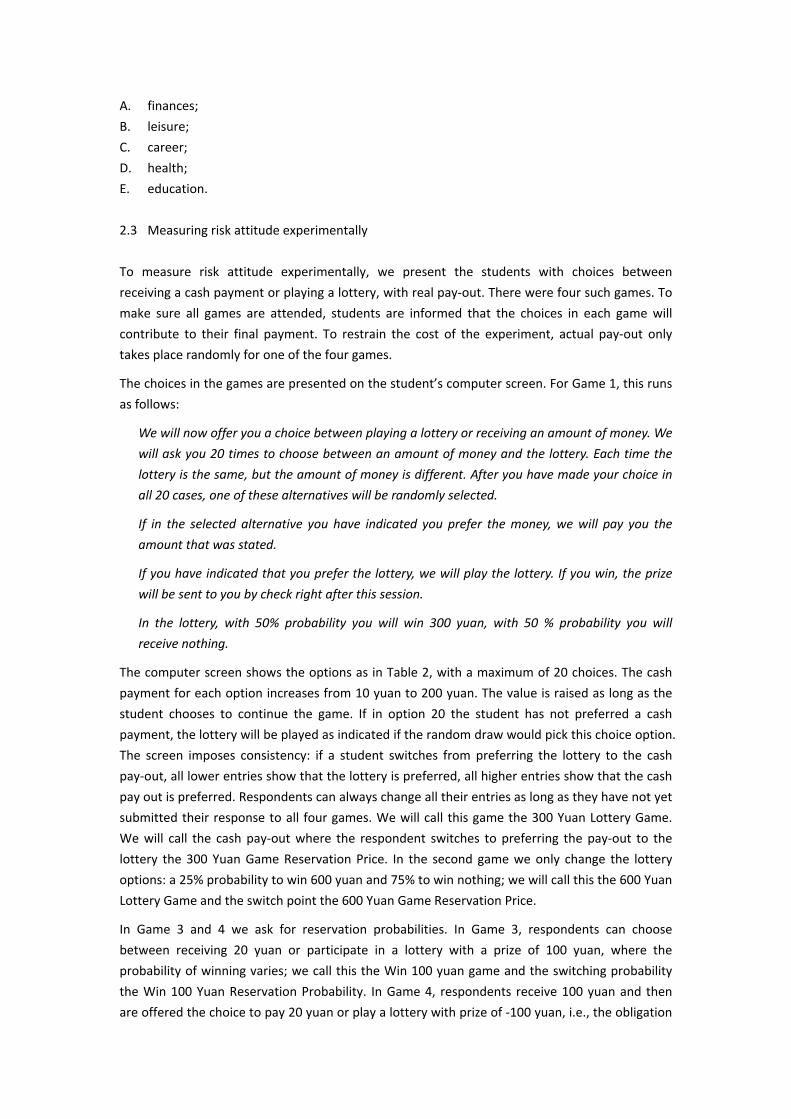
Graphs 1 to 12 depict the frequency distributions for the 12 measures of risk attitude: the 2
lottery questions, the 6 self assessed scaling measures and the 4 games. The graphs demonstrate
substantial heterogeneity in risk attitudes. With one exception, in each distribution the mode has
less than 30% of the observations. Most distributions even have a modal value below 20%. The
exception is the lottery reservation price where almost half the respondents quote the expected
value.
Self‐scaling generates more refined information than asking for reservation prices and
probabilities, in the sense that responses are more spread out over potential values. In Graph 1,
for the lottery reservation price, we see clear bumping. Almost half the respondents value the
lottery ticket at expected value, and there are two more spikes, at 5 and 50 yuan. The lottery
reservation probability has more variation. The mode is still at the probability corresponding to
expected value (5%), but there is clear concentration at some multiples of 10 points. In the
lottery reservation price, three quarters of the answers are concentrated at just three values.
There is slightly less bumping in the reservation probability question, in the sense that it now
takes four values to get up to three quarters of the respondents. The distributions of self‐scaled
risk attitude (Graphs 3 to 8) tend towards more or less regular single‐peaked distributions, but
with marked differences.
Risk attitudes are domain specific. Self‐assessed risk attitudes clearly deviate from a symmetric
single‐peaked distribution for leisure and for health. In leisure, respondents lean heavily towards
risk taking, in health they lean heavily towards risk aversion. This result deviates from Dohmen et
al. who find respondents most risk averse in financial matters and most risk taking in general risk
attitude and then in career and leisure risk, judged by the average scores on the scales (o.c. Table
4). Remarkably then, their respondents are not most averse in the domain of health, as one
might intuitively have anticipated and as our Chinese students indeed are.
In Table 3, we show the distribution of responses across three categories: risk averse, risk neutral,
risk loving. For the reservation price, risk averse is defined as having a reservation price below
the expected value, for the reservation probability as having a reservation probability above the
probability that equates the cash payment to the expected value of the lottery (or below it for
the Loose 100 Yuan Game). For the risk attitude scales, risk neutrality is not precisely defined and
hence we cannot compare with results for the other measures in a precise way. We will define a
score of 5, neatly in the middle of the scale, as risk neutrality, for illustrative purposes.
Measured by the lottery question and three of the four games, most respondents are not risk
loving. With exception of the lottery reservation price noted earlier, risk aversion is the rule, with
remarkably similar scores for three measures. In the Loose 100 Yuan Game, risk loving dominates.
This confirms risk seeking in case of losses as stressed in prospect theory.
Risk aversion does not dominate in the self‐assessment, but this statement must be conditioned
by the arbitrary definition of risk neutrality in this case3. The results for self‐assessed risk attitude
again indicate that risk attitudes are domain specific, perhaps even more succinctly than was
indicated by the full frequency distributions. At the chosen scale three quarters of the
respondents is risk loving in leisure, while in matters of health three quarters is risk averse.
General risk attitudes are quite close to those in finance and career, whereas in education
respondents are a bit more risk averse. The view that risk attitude is domain specific is widely
held among psychologists, though not universally (Slovic, 1972a; 1972b; see the discussion in
Weber et al., 2002). Fausto and Gillespie (2006) also find sensitivity to context.
The 300 and 600 Yuan Games yield fairly similar distributions of risk types, although willingness
to take risk is slightly higher when the prize is higher. The distribution for the Win 100 Yuan
reservation probability is also remarkably similar.
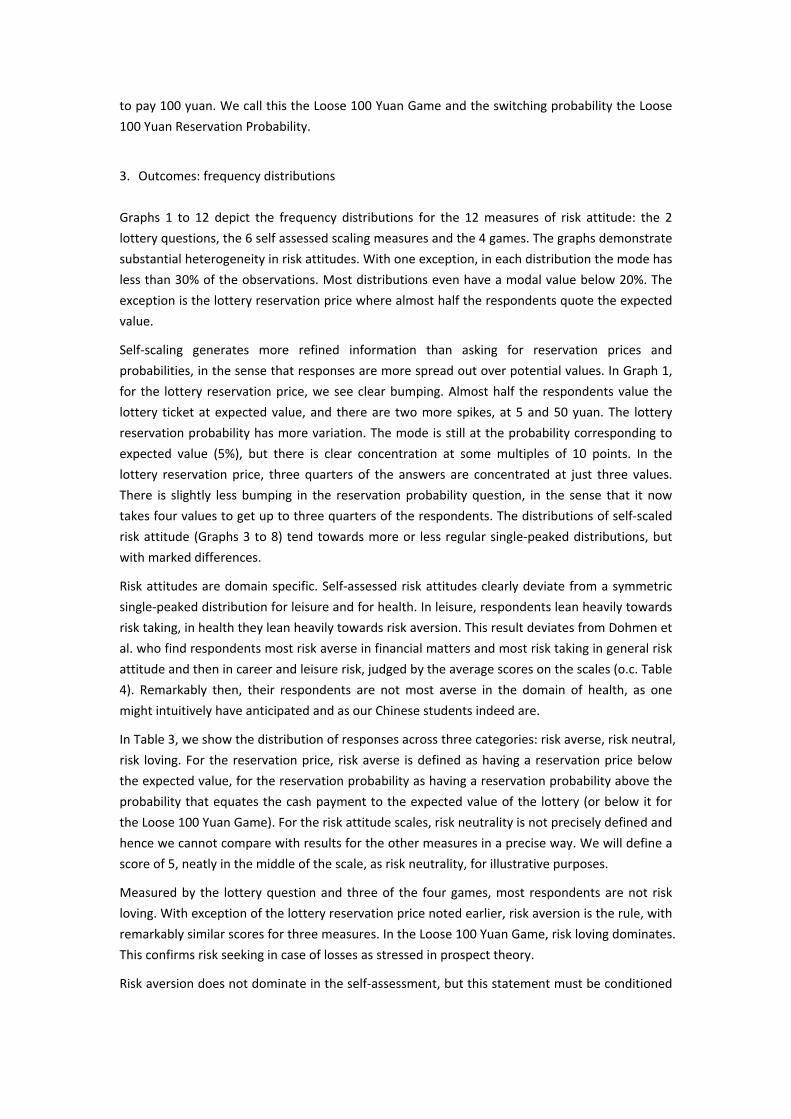
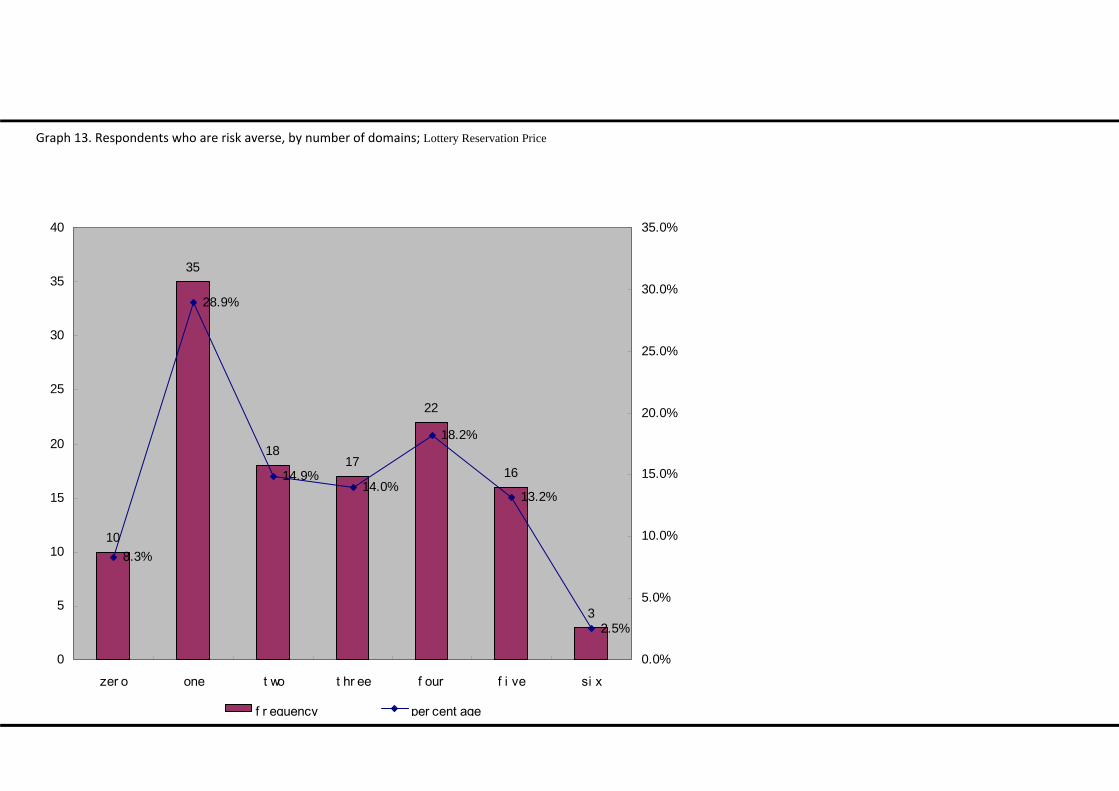
Variation of risk attitude across domains can also be studied by looking at the fraction of
respondents who are the same type across domains. Graph 13 shows that 3 students or 2.5 %
choose willingness to take risk in all 6 questions; 13.2% reply so to 5 questions; 18.2% to 4
questions; 66.1% to 3 questions or less. By that standard, the assumption of homogeneity of risk
attitude across domains does not hold water either. Dohmen et al. (p. 23) report much stronger
consistency across domains: 51 % is willing to take risk (scores above 5) in all six domains. This
score is very high compared to 78 % risk averse individuals in their experiment (and 9 % risk
lovers, o.c. p 17).
We also asked participants whether they preferred the 300 Yuan Game or the 600 Yuan Game;
both games have an expected value of 150 yuan, but probabilities differ. Most respondents are
willing to take more risk when the potential return is higher. At the same expected value but
higher probability to draw the zero, 62 % of respondents prefer the 600 Yuan Game to the 300
Yuan Game.
4. Outcomes: Correlations
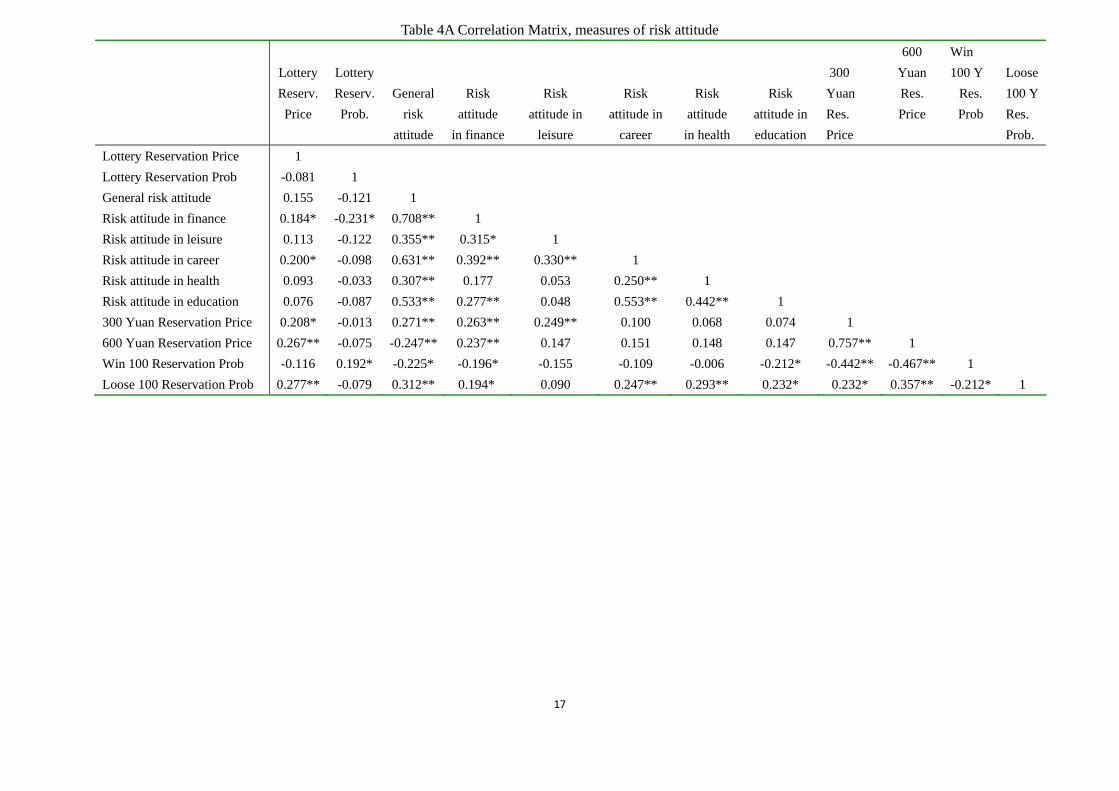
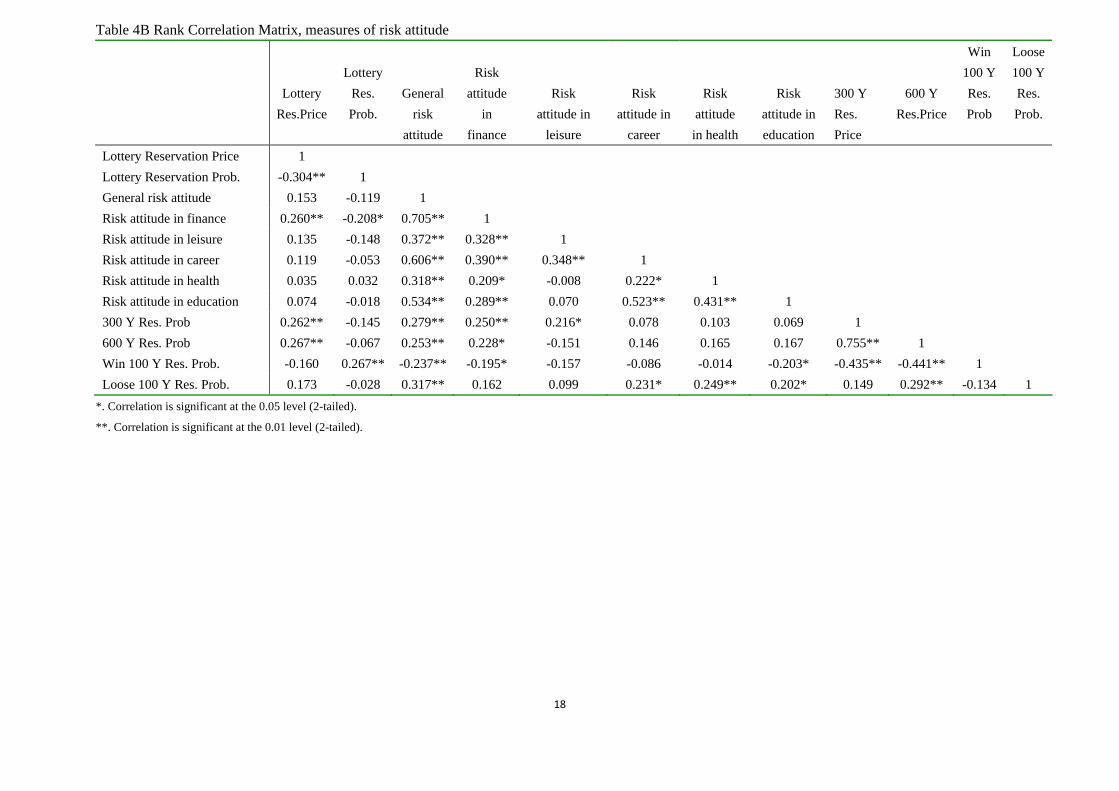
Table 4 gives the common correlation coefficients and the rank correlation coefficients among all
12 measures of risk attitude. Correlations between ranks are not uniformly larger than between
values: one scale is not clearly superior to the other. The table supports several conclusions,
The correlation between the 300 and the 600 Yuan Games is high, in fact the highest in each
table. This indicates that reservation prices for lotteries with different stakes give fairly similar
information. Asking for reservation probability rather than reservation price gives different
information, as is also indicated by the low correlation between lottery reservation price and
lottery reservation probability. When we differentiate between winning or loosing 100 yuan,
correlations are again lower, in particular for loosing. This adds to heterogeneity: asymmetry in
the evaluation of loosing and winning is also quite heterogeneous.
The correlations among the four specific domains of self‐assessed risk attitude are low. The
highest value, 0.55, is obtained for risk attitudes in career and in education. This means that no 3 Note that the absence of skew cannot be interpreted as absence of dominant risk aversion, as we
cannot rule out that the mode of the distribution lies below risk neutrality.
more than 30 percent of the variance in one domain is explained by risk attitude in another
domain. This result does not deviate much from Dohmen et al. The correlations they find among
five domains are generally higher than what we find (around 0.5), but their maximum value is 0.6,
indicating that at most 36 percent of the variance is explained. Correlations in Fausti and
Gillespie (2006) are not higher. This reinforces the conclusion from the literature we cited earlier:
risk attitudes are domain specific.
The two survey methods do not correlate very strongly. The two lottery questions correlate at
0.15 and 0.12 with general risk attitude. This is lower than in Dohmen et al.: the answer to their
hypothetical investment question correlates at 0.26 with risk attitude in general, which is not
very strong either. Extending the comparison to include domain specific attitudes, we find that
the answers to the lottery questions correlate strongest with risk attitude in finance, a conclusion
that certainly makes sense. General risk attitude correlates most with risk attitude in finance, in
career and in education, least with risk attitude in leisure and in health. (Dohmen et al. find
highest correlations with career and with leisure).
The key goal of this project is to validate survey risk attitude questions on revealed risk attitudes
in a situation where real money is at stake. Correlations between the games and the general
survey measures are in the right direction and generally statistically significant, and in that sense
the survey measures are valid predictors of risk attitude in a real‐money situation. But they are
not very precise: at best they explain 10 percent of the variance. Self‐assessed domain specific
risk attitudes generally predict much worse, except for risk attitude in finance (which correlates
fairly well with general risk attitude).
To compare the performances of the lottery question and self‐assessed risk attitude, we only
have to consider results for general risk attitude, as this always predicts better than domain
specific risk attitudes. The lottery reservation price predicts markedly better than the lottery
reservation probability, except when it comes to predicting the reservation probability in a
real‐money game. Note that the real‐money reservation probability for loosing 300 yuan is
better predicted better by the reservation lottery price than by the reservation lottery
probability, which is remarkable. Self‐assessed risk attitude generally predicts best, but not
unequivocally. Some margins are quite small. The gaps are largest when the real‐money game
explicitly specifies a lottery with either winning or loosing 100 yuan.
The general conclusion is quite similar to Dohmen et al. Survey measures predict measures found
in experimental real‐money data, but far from precisely. We find correlations of the lottery
reservation price of .21 with the reservation price for the 300 Yuan Game and .27 for the 600
Yuan Game, while rank correlations are .26 for both. Dohmen et al. (o.c. Table 2b) report a
squared correlation coefficient of .06 for a linear regression of the experimental lottery
reservation price on general risk attitude, i.e. a correlation coefficient of .24. We cannot compare
with the hypothetical investment proportion, as this correlation is not reported. Neither are
there correlations with domain specific risk attitudes and experimental valuations.
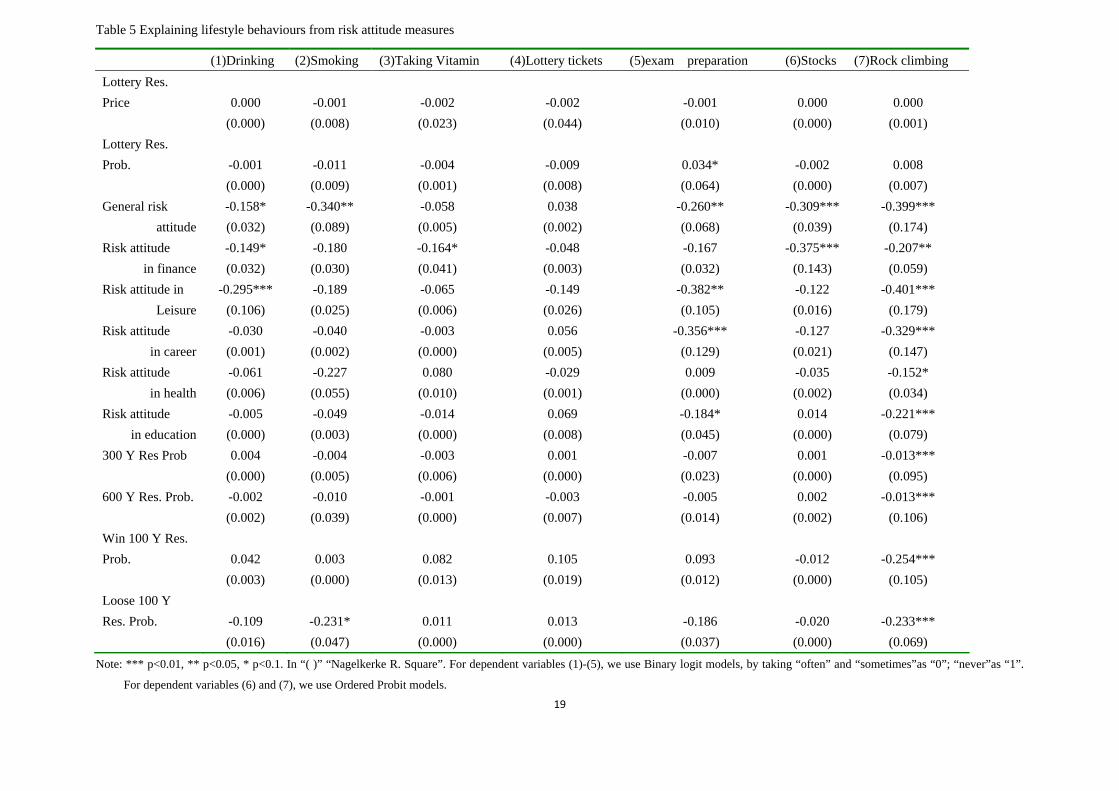
5. Predicting behaviour
In the survey, we asked for information on seven lifestyle behaviours: drinking, smoking, taking
vitamin pills, buying lottery tickets, buying stocks, practice rock climbing and exam preparation.
For students living on a campus in China, it is not easy to single out behaviours for which risk
attitude is important, and this is about the best we could come up with. Taking vitamin pills to
influence health status, drinking alcohol and buying stocks or lottery tickets are not very
common. But it is the best we could think of. We try to explain these risk related behaviours
from our 12 risk attitude measures, with a logit model when there were essentially two options
(most questions had three response categories, but in several cases the frequencies on one of
these was zero or very low; in that case we merged them) or an ordered probit. We use only risk
attitude as independent variable; we might have added other independent variables (such as
gender, family background), but most of these must be expected to have some relationship with
risk attitude as well. We would then get involved in questions of endogeneity and direction of
causation. Instead, we opted for a simple comparison of explained variance by each risk attitude
measure as a single regressor. Results are in Table 5. Note that some of these risky behaviours
have also been used in the literature as variables to measure risk attitude, rather than as
variables to be explained.
Explanatory power of our risk attitude measures, as indicated by significance levels and
proportion of variance explained, is quite low. The behaviour that is best explained is willingness
to participate in rock climbing, apparently the type of behaviour that is most differentiated by
risk attitude. The risk measure with the best prediction score is the general risk attitude measure.
Rock climbing is best predicted by risk attitude in leisure, but in fact the difference with general
risk attitude is zero. Among the real‐money measures, the Win/Loose 100 Yuan Games predict
best, but at substantially lower correlations. There is also some success in predicting the nature
of exam preparation (“do you work so hard that you will be almost sure to pass” versus “hope
they just ask what you happen to know”). The best predictor is not risk attitude in education but
in leisure, an answer that will not make many teachers happy.
The lottery questions have virtually no predictive power for the risky behaviours we selected,
and the real‐money experiments only have some power to predict rock climbing. The results
again show traces of domain specificity, considering the significant correlations of drinking and
rock climbing with risk taking in leisure, of smoking with risk taking in health, of exam
preparation with risk taking in education and of buying stocks with risk taking in finance. But
these correlations are not always the highest for a given behaviour.
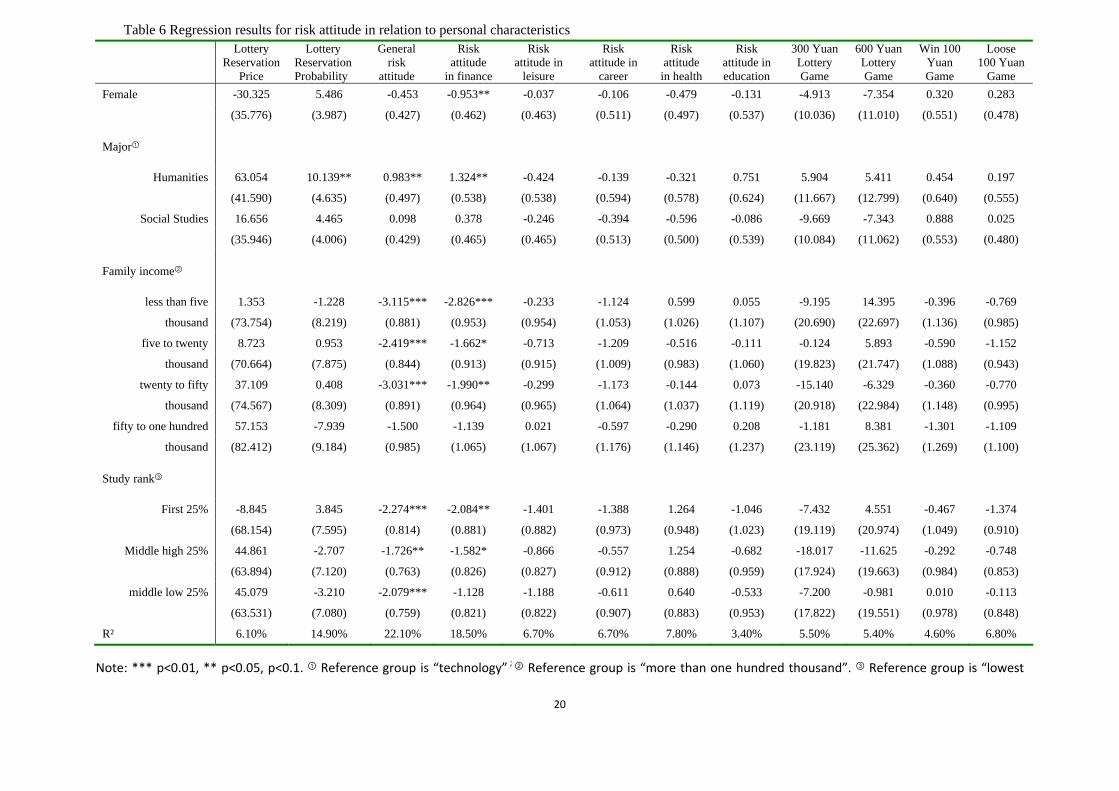
6. Relating risk attitude to personal characteristics.
In Table 6, we show regression results for all 12 measures of risk attitude in relation to personal
characteristics: gender (female), major (2 dummies), family income (4 dummies) and
self‐assessed study rank (3 dummies). We applied OLS for all regressions including the self
assessed scales; for the latter we did not choose an ordered response model, as the outcomes do
not differ much from OLS and interpretation of coefficients is less straightforward. Note that
increasing risk aversion would be indicated by negative effects on the lottery reservation price,
on the risk attitude scales, on the 300 and 600 Yuan lottery games and on the Loose 100 Yuan
reservation probability, and by positive effects on the lottery reservation probability and the Win
100 Yuan reservation probability (in case of dummies, the direction of the effect follows from
comparing dummy coefficients, i.e. increasing or decreasing across categories). Hence,
consistency of effects on all measures requires identical signs in coefficient columns 1, 3‐10 and
12, and opposite signs in columns 2 and 11.
Estimated coefficients are very imprecise, presumably at least to some extent on account of the
modest sample size. Some standard results from the literature are confirmed. Women are more
risk averse than men: all but one of the signs of the coefficients point in the same direction,
although the effect is significant only for risk attitude in finance. The exception is the positive
effect on the Loose 100 Yuan game. The effects of major are not consistently in the same
direction. Most remarkable is the significantly lower risk aversion for students in the humanities
compared to those in technical studies in general and financial risk attitude; however, the results
on the lottery reservation probability point significantly to higher risk aversion for students in
humanities. The effect of increasing family income mostly works in the anticipated direction,
with risk aversion declining as family income increases. Exceptions are the results for risk attitude
in matters of health, the 600 Yuan lottery game and the Loose 100 Yuan game. Also, the highest
income category does not always neatly fit in the sequence of coefficients. Self‐assessed study
rank significantly affects general and financial risk attitude: those assessing themselves above the
lowest quartile (some 93%!) are more risk averse. The effects are in the same direction for the
other risk attitude scales, except in matters of health. In fact, those who consider themselves to
be in the top 25% (34% of the sample) are fairly consistently more risk averse than those who
rank themselves lower; the exceptions are health risk attitude, the 600 Yuan lottery game and
the Win 100 Yuan game.
The outcomes for the 300 and the 600 Yuan lottery game are quite close in the qualitative sense
(direction of effects); magnitudes of effects show greater difference, without reflecting a simple
scaling factor. Judged by the direction of effects of personal characteristics, the lottery
reservation price does not perform worse than general risk attitude. Results of general risk
attitude are very similar to results for financial risk.
Generally we may conclude that the results are in line with intuition or results found earlier in
the literature, but that coefficients are estimated with very little precision.
7. Conclusion
Simple survey questions to assess risk attitudes, like hypothetical lottery questions or self‐scaling,
appear to generate valid indicators of choices under risk in an experimental set‐up where real
money is at stake. Correlations have the proper sign and are often statistically significant. But the
precision of the predictions is not high. This finding is not related to the modest number of
participants in our experiment. Correlations between survey measures and experimental
real‐money measures among our 121 participants are not substantially lower than among the
450 participants in the similar experiment conducted by Dohmen et al. (2005); the magnitudes
are also similar between different survey measures elicited from 75 cattle farmers in Fausti and
Gillespie (2006).
The results point to a combination of large heterogeneity and domain specificity (or context
sensitivity) of attitudes. Heterogeneity in risk attitudes manifested in choices with real
consequences is clear from the dispersion in the results for the real‐money experiments. Domain
sensitivity is clear from the low inter‐correlations for self‐assessed risk attitude in the five
different domains we distinguish. Presumably, there is heterogeneity in other dimensions as well.
Reservation prices and reservation probabilities for the same individual do not correlate strongly
and neither do reservation probabilities for winning or loosing the same amount. While simple
survey questions do generate valid indicators of risk attitudes measured experimentally, the
multi‐faceted heterogeneity renders the simplifications in the survey questions probably too
strong. Even though self‐assessed general risk attitude often predicts comparatively well, it may
be well‐advised to make these survey instruments context specific, geared to the problem at
hand.
Finally, we may note that we have found confirmation of several regularities that have been
established in the literature. Risk aversion is by far the dominant type of behaviour, but risk
lovers do exist. In the 300 and 600 Yuan Games, over 20% of participants behave as risk lovers
and value the lottery above its expected pay‐out. Respondents behave mostly as risk lovers in
case of loss avoidance. We find women to be more risk averse than men and risk aversion
declining with family income. Domain specificity of risk attitude is also well established in the
literature. Our Chinese students lean strongly towards risk aversion in the health domain and
towards risk loving in the domain of leisure, which seem very plausible results.
References [1] Barsky, R. B., T. F. Juster, M. S. Kimball, and M. D. Shapiro (1997), Preference Parameters
and Individual Heterogeneity: An Experimental Approach in the Health and Retirement
Study, Quarterly Journal of Economics, 112(2), 537–579
[2] Bellante, D. and A. Link (1981), Are public sector workers more risk averse than private
sector workers?, Industrial and Labor Relations Review, 34(3), 408‐412
[3] Binswanger, H. (1980), Attitudes toward risk: experimental measurement in rural India,
American Journal of Agricultural Economics, 62, 395‐407
[4] Bonin, H., T. Dohmen, A. Falk, D. Huffman and U. Sunde (2007), Cross-sectional Earnings Risk and Occupational Sorting: The Role of Risk Attitudes, Labour Economics, 14(6),
926‐937
[5] Brunello, G. (2002), Absolute risk aversion and the returns to education, Economics of
Education Review, 21(6), 635‐640
[6] Budria, S., L. Diaz Serrano, A. Ferrer‐i‐Carbonell and J. Hartog (2009), Risk attitude and wage
growth: replication and reconstruction, IZA Discussion Paper 4124
[7] Caliendo, M., Fossen, F.M., Kritikos, A.S. (2006): “Risk Attitudes of Nascent Entrepreneurs:
New Evidence from an Experimentally Validated Survey”, IZA Discussion Paper, No. 2168
[8] Camerer, C. (1995), Individual decision making, in: J.Kagel and A. Roth, editors, Handbook of
Experimental Economics, Princeton, NJ: Princeton University Press.
[9] Cramer, J.S., Hartog, J., Jonker, N., van Praag, C.M. (2002), Low risk aversion encourages the
choice for entrepreneurship: an empirical test of a truism, Journal of Economic Behavior and
Organization, 48 (1), 29–36.
[10] Diaz‐Serrano, L., and D. O’Neill (2004): “The Relationship Between Unemployment and
Risk‐Aversion”, IZA Discussion Paper No. 1214.
[11] Dohmen, T., A. Falk, D. Huffman, U. Sunde, J. Schupp and G. Wagner (2005), Individual Risk
Attitudes: New Evidence from a Large, Representative, Experimentally‐Validated Survey, IZA
Bonn, DP 1730.
[12] Donkers, B., B. Melenberg, and A. V. Soest (2001), Estimating Risk Attitudes Using Lotteries:
A Large Sample Approach, Journal of Risk and Uncertainty, 22(2), 165–195.
[13] Fausti, S. and J. Gillespie (2006), Measuring risk attitude of agricultural producers using a
mail survey: how consistent are the methods?, Australian Journal of Agricultural and
Resource Economics, 50(2), 171‐188,
[14] Guiso, L., and M. Paiella (2005), The Role of Risk Aversion in Predicting Individual Behavior,
Bank of Italy Economic Working Paper No. 546.
[15] Guiso, L., and M. Paiella (2008), Risk Aversion, Wealth, and Background Risk, Journal of the
European Economic Association, 6(6), 1109‐1150,
[16] Hartog, J., A. Ferrer‐i‐Carbonell and N. Jonker (2002), Linking measured risk aversion to
individual characteristics, Kyklos, 55 (1), pp. 3‐26
[17] Shaw, K.L. (1996), An empirical analysis of risk aversion and income growth, Journal of Labor
Economics, 14 (4), 626‐653.
[18] Weber, E., A. Blais and E. Betz (2002), A domain‐specific risk attitude scale: measuring risk
perceptions and risk behaviors, Journal of Behavioral Decision Making, 15,263‐290
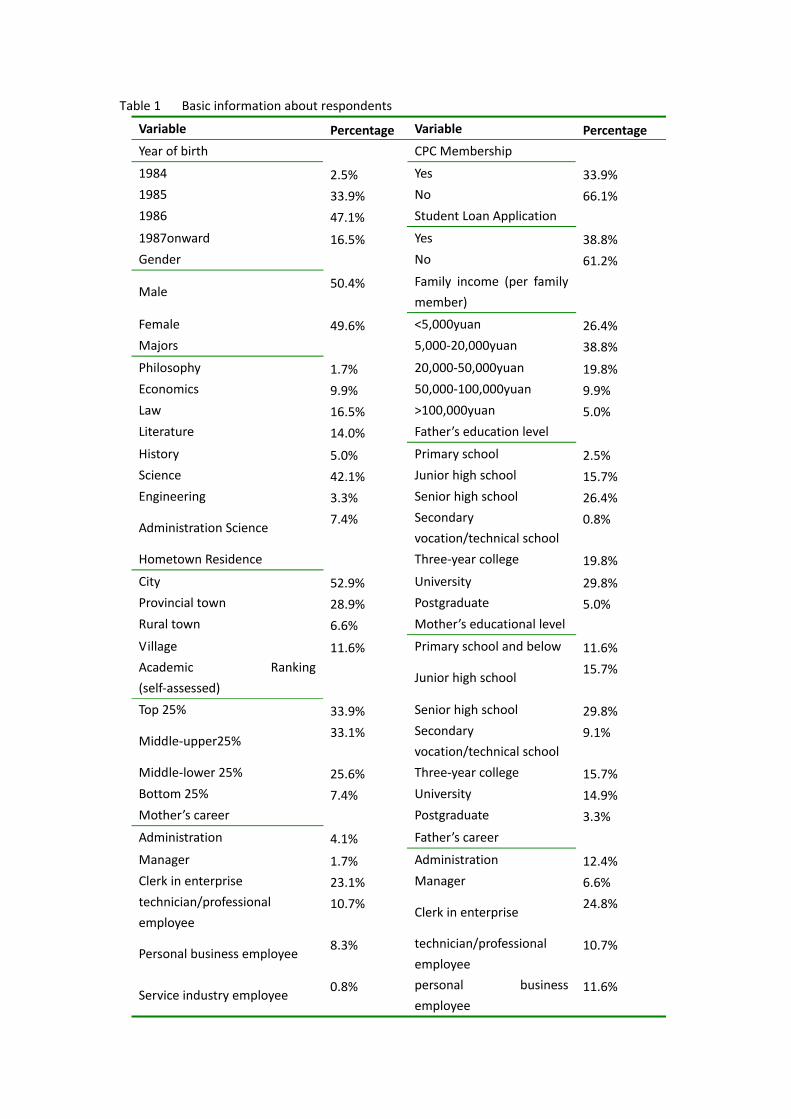
Table 1 Basic information about respondents
Variable Percentage Variable Percentage
Year of birth CPC Membership
1984 2.5% Yes 33.9% 1985 33.9% No 66.1% 1986 47.1% Student Loan Application
1987onward 16.5% Yes 38.8% Gender No 61.2%
Male 50.4% Family income (per family
member)
Female 49.6% <5,000yuan 26.4% Majors 5,000‐20,000yuan 38.8%
Philosophy 1.7% 20,000‐50,000yuan 19.8% Economics 9.9% 50,000‐100,000yuan 9.9% Law 16.5% >100,000yuan 5.0% Literature 14.0% Father’s education level
History 5.0% Primary school 2.5% Science 42.1% Junior high school 15.7% Engineering 3.3% Senior high school 26.4%
Administration Science 7.4% Secondary
vocation/technical school 0.8%
Hometown Residence Three‐year college 19.8%
City 52.9% University 29.8% Provincial town 28.9% Postgraduate 5.0% Rural town 6.6% Mother’s educational level
Village 11.6% Primary school and below 11.6% Academic Ranking
(self‐assessed)
Junior high school 15.7%
Top 25% 33.9% Senior high school 29.8%
Middle‐upper25% 33.1% Secondary
vocation/technical school 9.1%
Middle‐lower 25% 25.6% Three‐year college 15.7% Bottom 25% 7.4% University 14.9% Mother’s career Postgraduate 3.3%
Administration 4.1% Father’s career
Manager 1.7% Administration 12.4% Clerk in enterprise 23.1% Manager 6.6% technician/professional
employee 10.7%
Clerk in enterprise 24.8%
Personal business employee 8.3% technician/professional
employee 10.7%
Service industry employee 0.8% personal business
employee 11.6%
private business owner 0.8% private business owner 4.1% Worker 4.1% Worker 6.6% Farmer 13.2% Farmer 12.4% Retirees 20.7% Retirees 5.0% Unemployed 10.7% Unemployed 3.3% Other 1.7% Other 2.5%
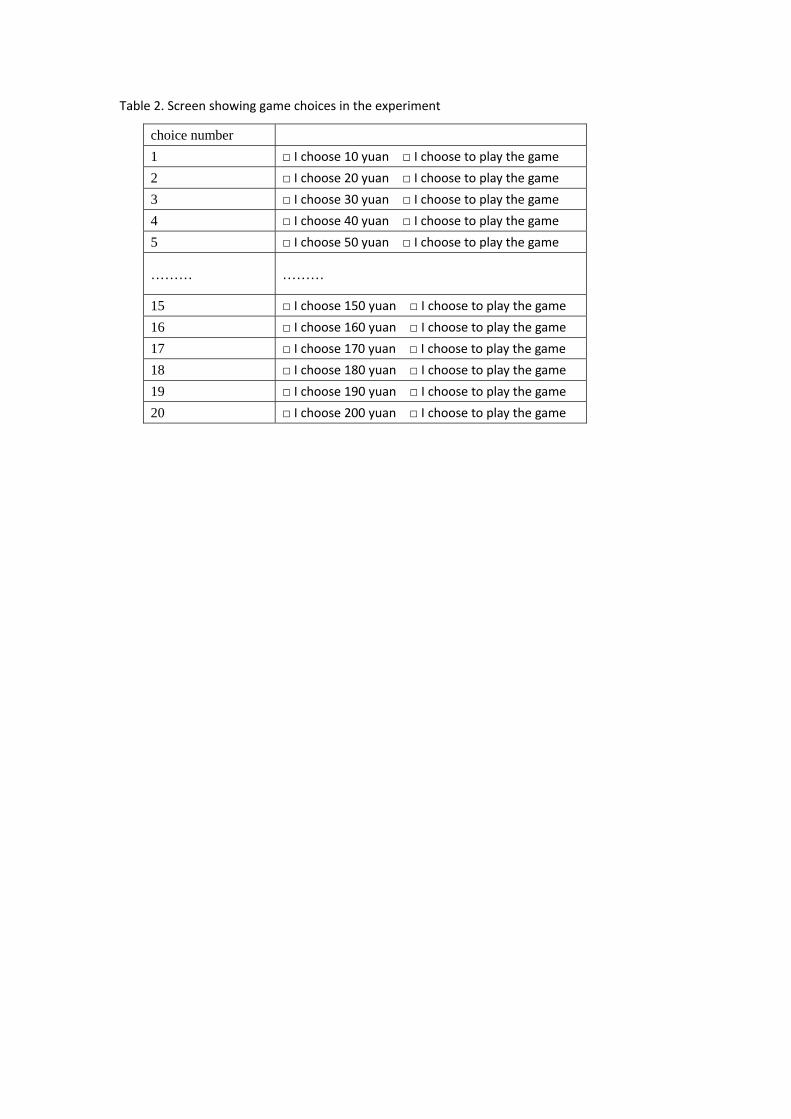
Table 2. Screen showing game choices in the experiment
choice number 1 □ I choose 10 yuan □ I choose to play the game 2 □ I choose 20 yuan □ I choose to play the game 3 □ I choose 30 yuan □ I choose to play the game 4 □ I choose 40 yuan □ I choose to play the game 5 □ I choose 50 yuan □ I choose to play the game
……… ………
15 □ I choose 150 yuan □ I choose to play the game 16 □ I choose 160 yuan □ I choose to play the game 17 □ I choose 170 yuan □ I choose to play the game 18 □ I choose 180 yuan □ I choose to play the game 19 □ I choose 190 yuan □ I choose to play the game 20 □ I choose 200 yuan □ I choose to play the game
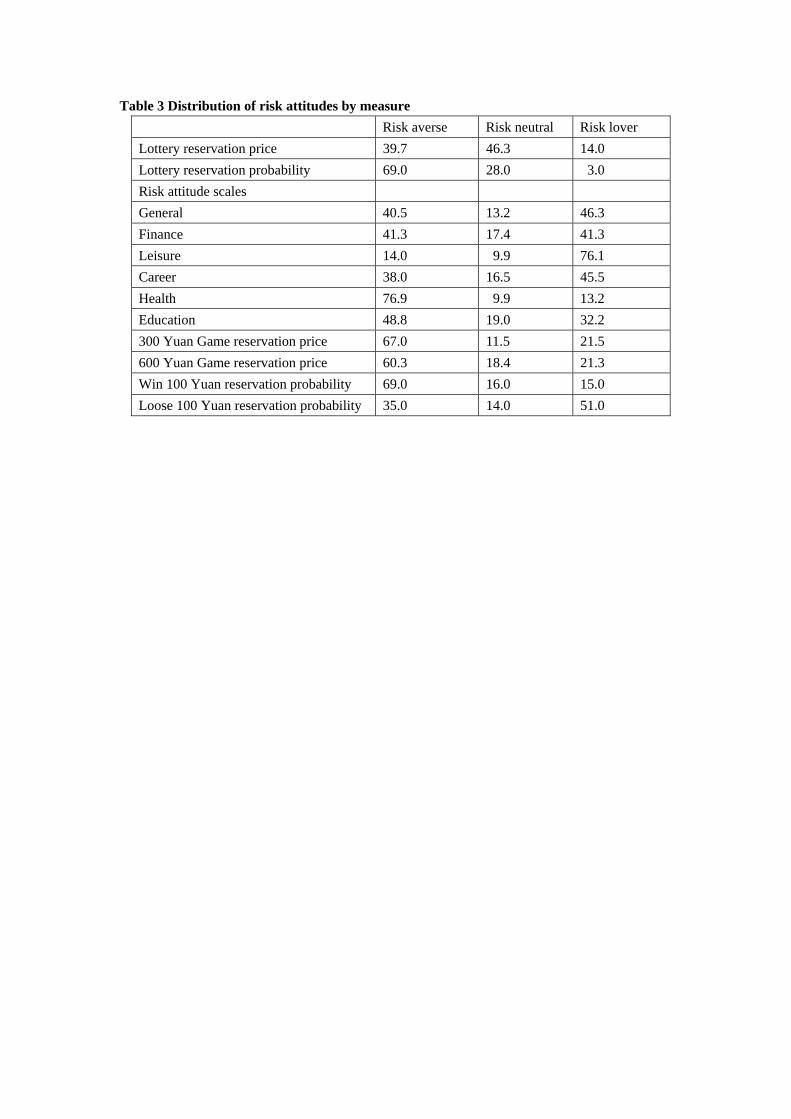
Table 3 Distribution of risk attitudes by measure Risk averse Risk neutral Risk lover Lottery reservation price 39.7 46.3 14.0 Lottery reservation probability 69.0 28.0 3.0 Risk attitude scales General 40.5 13.2 46.3 Finance 41.3 17.4 41.3 Leisure 14.0 9.9 76.1 Career 38.0 16.5 45.5 Health 76.9 9.9 13.2 Education 48.8 19.0 32.2 300 Yuan Game reservation price 67.0 11.5 21.5 600 Yuan Game reservation price 60.3 18.4 21.3 Win 100 Yuan reservation probability 69.0 16.0 15.0 Loose 100 Yuan reservation probability 35.0 14.0 51.0
17
Table 4A Correlation Matrix, measures of risk attitude
Lottery Reserv. Price
Lottery Reserv. Prob.
General risk
attitude
Risk attitude
in finance
Risk attitude in
leisure
Risk attitude in
career
Risk attitude in health
Risk attitude in education
300 Yuan Res. Price
600 Yuan Res. Price
Win 100 Y
Res. Prob
Loose 100 Y Res. Prob.
Lottery Reservation Price 1 Lottery Reservation Prob -0.081 1 General risk attitude 0.155 -0.121 1 Risk attitude in finance 0.184* -0.231* 0.708** 1 Risk attitude in leisure 0.113 -0.122 0.355** 0.315* 1 Risk attitude in career 0.200* -0.098 0.631** 0.392** 0.330** 1 Risk attitude in health 0.093 -0.033 0.307** 0.177 0.053 0.250** 1 Risk attitude in education 0.076 -0.087 0.533** 0.277** 0.048 0.553** 0.442** 1 300 Yuan Reservation Price 0.208* -0.013 0.271** 0.263** 0.249** 0.100 0.068 0.074 1 600 Yuan Reservation Price 0.267** -0.075 -0.247** 0.237** 0.147 0.151 0.148 0.147 0.757** 1 Win 100 Reservation Prob -0.116 0.192* -0.225* -0.196* -0.155 -0.109 -0.006 -0.212* -0.442** -0.467** 1Loose 100 Reservation Prob 0.277** -0.079 0.312** 0.194* 0.090 0.247** 0.293** 0.232* 0.232* 0.357** -0.212* 1
18
Table 4B Rank Correlation Matrix, measures of risk attitude
Lottery Res.Price
Lottery Res. Prob.
General risk
attitude
Risk attitude
in finance
Risk attitude in
leisure
Risk attitude in
career
Risk attitude in health
Risk attitude in education
300 Y Res. Price
600 Y Res.Price
Win 100 Y Res. Prob
Loose 100 Y Res. Prob.
Lottery Reservation Price 1 Lottery Reservation Prob. -0.304** 1 General risk attitude 0.153 -0.119 1 Risk attitude in finance 0.260** -0.208* 0.705** 1 Risk attitude in leisure 0.135 -0.148 0.372** 0.328** 1 Risk attitude in career 0.119 -0.053 0.606** 0.390** 0.348** 1 Risk attitude in health 0.035 0.032 0.318** 0.209* -0.008 0.222* 1 Risk attitude in education 0.074 -0.018 0.534** 0.289** 0.070 0.523** 0.431** 1 300 Y Res. Prob 0.262** -0.145 0.279** 0.250** 0.216* 0.078 0.103 0.069 1 600 Y Res. Prob 0.267** -0.067 0.253** 0.228* -0.151 0.146 0.165 0.167 0.755** 1 Win 100 Y Res. Prob. -0.160 0.267** -0.237** -0.195* -0.157 -0.086 -0.014 -0.203* -0.435** -0.441** 1Loose 100 Y Res. Prob. 0.173 -0.028 0.317** 0.162 0.099 0.231* 0.249** 0.202* 0.149 0.292** -0.134 1
*. Correlation is significant at the 0.05 level (2-tailed).
**. Correlation is significant at the 0.01 level (2-tailed).
19
Table 5 Explaining lifestyle behaviours from risk attitude measures
(1)Drinking (2)Smoking (3)Taking Vitamin (4)Lottery tickets (5)exam preparation (6)Stocks (7)Rock climbingLottery Res. Price 0.000 -0.001 -0.002 -0.002 -0.001 0.000 0.000
(0.000) (0.008) (0.023) (0.044) (0.010) (0.000) (0.001)Lottery Res. Prob. -0.001 -0.011 -0.004 -0.009 0.034* -0.002 0.008
(0.000) (0.009) (0.001) (0.008) (0.064) (0.000) (0.007)General risk -0.158* -0.340** -0.058 0.038 -0.260** -0.309*** -0.399***
attitude (0.032) (0.089) (0.005) (0.002) (0.068) (0.039) (0.174)Risk attitude -0.149* -0.180 -0.164* -0.048 -0.167 -0.375*** -0.207**
in finance (0.032) (0.030) (0.041) (0.003) (0.032) (0.143) (0.059) Risk attitude in -0.295*** -0.189 -0.065 -0.149 -0.382** -0.122 -0.401***
Leisure (0.106) (0.025) (0.006) (0.026) (0.105) (0.016) (0.179)Risk attitude -0.030 -0.040 -0.003 0.056 -0.356*** -0.127 -0.329***
in career (0.001) (0.002) (0.000) (0.005) (0.129) (0.021) (0.147) Risk attitude -0.061 -0.227 0.080 -0.029 0.009 -0.035 -0.152*
in health (0.006) (0.055) (0.010) (0.001) (0.000) (0.002) (0.034) Risk attitude -0.005 -0.049 -0.014 0.069 -0.184* 0.014 -0.221***
in education (0.000) (0.003) (0.000) (0.008) (0.045) (0.000) (0.079) 300 Y Res Prob 0.004 -0.004 -0.003 0.001 -0.007 0.001 -0.013***
(0.000) (0.005) (0.006) (0.000) (0.023) (0.000) (0.095)600 Y Res. Prob. -0.002 -0.010 -0.001 -0.003 -0.005 0.002 -0.013***
(0.002) (0.039) (0.000) (0.007) (0.014) (0.002) (0.106)Win 100 Y Res. Prob. 0.042 0.003 0.082 0.105 0.093 -0.012 -0.254***
(0.003) (0.000) (0.013) (0.019) (0.012) (0.000) (0.105)Loose 100 Y Res. Prob. -0.109 -0.231* 0.011 0.013 -0.186 -0.020 -0.233*** (0.016) (0.047) (0.000) (0.000) (0.037) (0.000) (0.069)
Note: *** p<0.01, ** p<0.05, * p<0.1. In “( )” “Nagelkerke R. Square”. For dependent variables (1)-(5), we use Binary logit models, by taking “often” and “sometimes”as “0”; “never”as “1”.
For dependent variables (6) and (7), we use Ordered Probit models.
20
Table 6 Regression results for risk attitude in relation to personal characteristics
Lottery Reservation
Price
Lottery Reservation Probability
General risk
attitude
Risk attitude
in finance
Risk attitude in
leisure
Risk attitude in
career
Risk attitude in health
Risk attitude in education
300 Yuan Lottery Game
600 Yuan Lottery Game
Win 100 Yuan Game
Loose 100 Yuan
Game Female -30.325 5.486 -0.453 -0.953** -0.037 -0.106 -0.479 -0.131 -4.913 -7.354 0.320 0.283
(35.776) (3.987) (0.427) (0.462) (0.463) (0.511) (0.497) (0.537) (10.036) (11.010) (0.551) (0.478)
Major①
Humanities 63.054 10.139** 0.983** 1.324** -0.424 -0.139 -0.321 0.751 5.904 5.411 0.454 0.197
(41.590) (4.635) (0.497) (0.538) (0.538) (0.594) (0.578) (0.624) (11.667) (12.799) (0.640) (0.555)
Social Studies 16.656 4.465 0.098 0.378 -0.246 -0.394 -0.596 -0.086 -9.669 -7.343 0.888 0.025
(35.946) (4.006) (0.429) (0.465) (0.465) (0.513) (0.500) (0.539) (10.084) (11.062) (0.553) (0.480)
Family income②
less than five 1.353 -1.228 -3.115*** -2.826*** -0.233 -1.124 0.599 0.055 -9.195 14.395 -0.396 -0.769
thousand (73.754) (8.219) (0.881) (0.953) (0.954) (1.053) (1.026) (1.107) (20.690) (22.697) (1.136) (0.985)
five to twenty 8.723 0.953 -2.419*** -1.662* -0.713 -1.209 -0.516 -0.111 -0.124 5.893 -0.590 -1.152
thousand (70.664) (7.875) (0.844) (0.913) (0.915) (1.009) (0.983) (1.060) (19.823) (21.747) (1.088) (0.943)
twenty to fifty 37.109 0.408 -3.031*** -1.990** -0.299 -1.173 -0.144 0.073 -15.140 -6.329 -0.360 -0.770
thousand (74.567) (8.309) (0.891) (0.964) (0.965) (1.064) (1.037) (1.119) (20.918) (22.984) (1.148) (0.995)
fifty to one hundred 57.153 -7.939 -1.500 -1.139 0.021 -0.597 -0.290 0.208 -1.181 8.381 -1.301 -1.109
thousand (82.412) (9.184) (0.985) (1.065) (1.067) (1.176) (1.146) (1.237) (23.119) (25.362) (1.269) (1.100)
Study rank③
First 25% -8.845 3.845 -2.274*** -2.084** -1.401 -1.388 1.264 -1.046 -7.432 4.551 -0.467 -1.374
(68.154) (7.595) (0.814) (0.881) (0.882) (0.973) (0.948) (1.023) (19.119) (20.974) (1.049) (0.910)
Middle high 25% 44.861 -2.707 -1.726** -1.582* -0.866 -0.557 1.254 -0.682 -18.017 -11.625 -0.292 -0.748
(63.894) (7.120) (0.763) (0.826) (0.827) (0.912) (0.888) (0.959) (17.924) (19.663) (0.984) (0.853)
middle low 25% 45.079 -3.210 -2.079*** -1.128 -1.188 -0.611 0.640 -0.533 -7.200 -0.981 0.010 -0.113
(63.531) (7.080) (0.759) (0.821) (0.822) (0.907) (0.883) (0.953) (17.822) (19.551) (0.978) (0.848)
R² 6.10% 14.90% 22.10% 18.50% 6.70% 6.70% 7.80% 3.40% 5.50% 5.40% 4.60% 6.80%
Note: *** p<0.01, ** p<0.05, p<0.1. ① Reference group is “technology” ; ② Reference group is “more than one hundred thousand”. ③ Reference group is “lowest

21
25%”
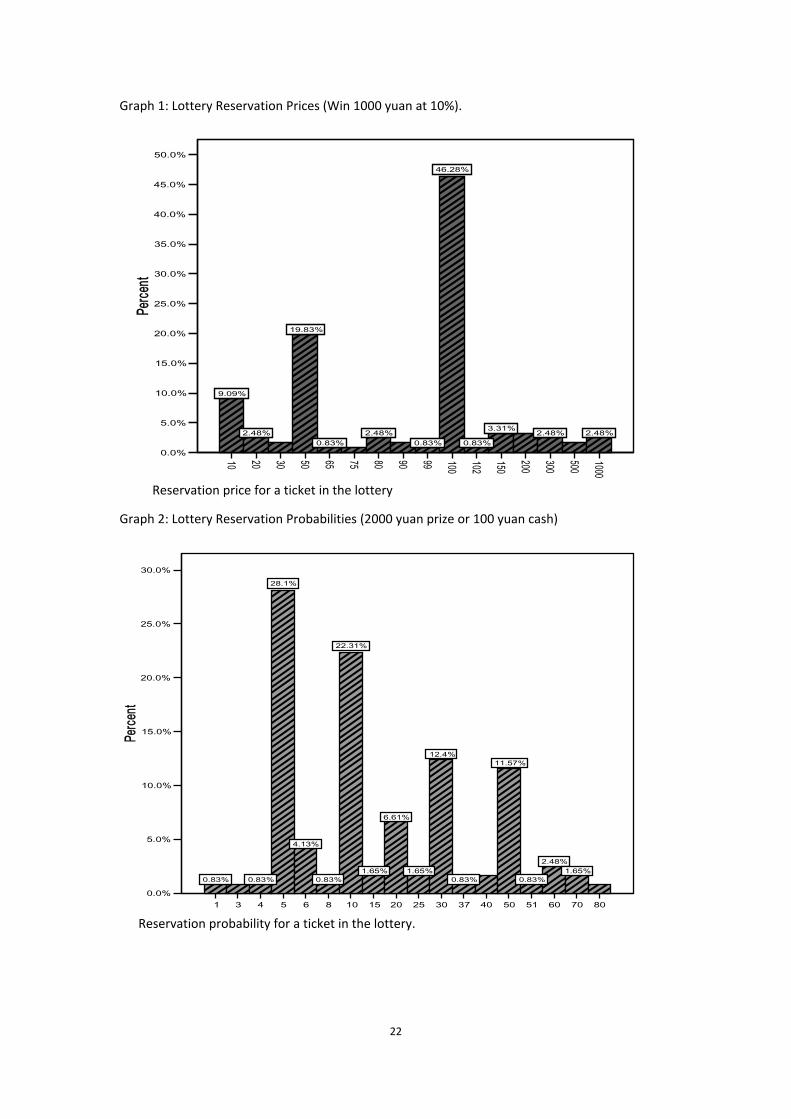
Graph 1: Lottery Reservation Prices (Win 1000 yuan at 10%).
Reservation price for a ticket in the lottery
Graph 2: Lottery Reservation Probabilities (2000 yuan prize or 100 yuan cash)
Reservation probability for a ticket in the lottery.
22
10 20 30 50 65 75 80 90 99 100
102
150
200
300
500
1000
0.0%
5.0%
10.0%
15.0%
20.0%
25.0%
30.0%
35.0%
40.0%
45.0%
50.0%Pe
rcent
9.09%
2.48%
19.83%
0.83%2.48%
0.83%
46.28%
0.83%
3.31% 2.48% 2.48%
1 3 4 5 6 8 10 15 20 25 30 37 40 50 51 60 70 800.0%
5.0%
10.0%
15.0%
20.0%
25.0%
30.0%
Perce
nt
0.83% 0.83%
28.1%
4.13%
0.83%
22.31%
1.65%
6.61%
1.65%
12.4%
0.83%
11.57%
0.83%
2.48%1.65%
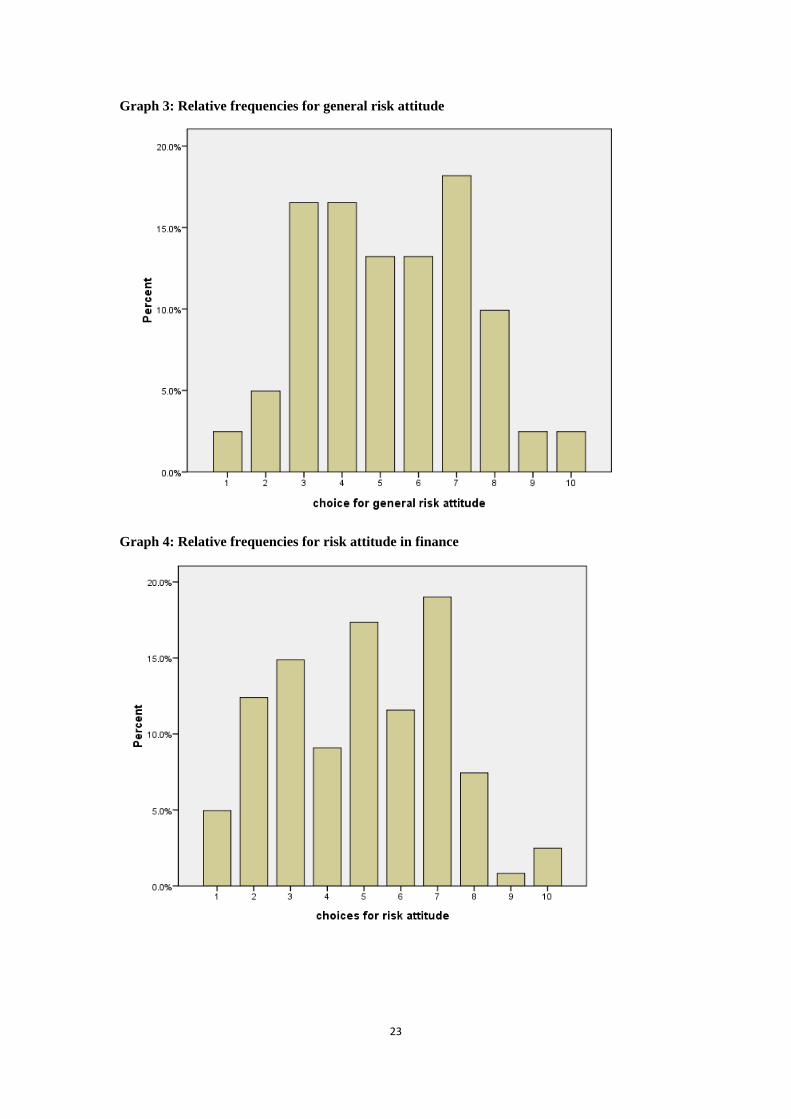
Graph 3: Relative frequencies for general risk attitude
Graph 4: Relative frequencies for risk attitude in finance
23
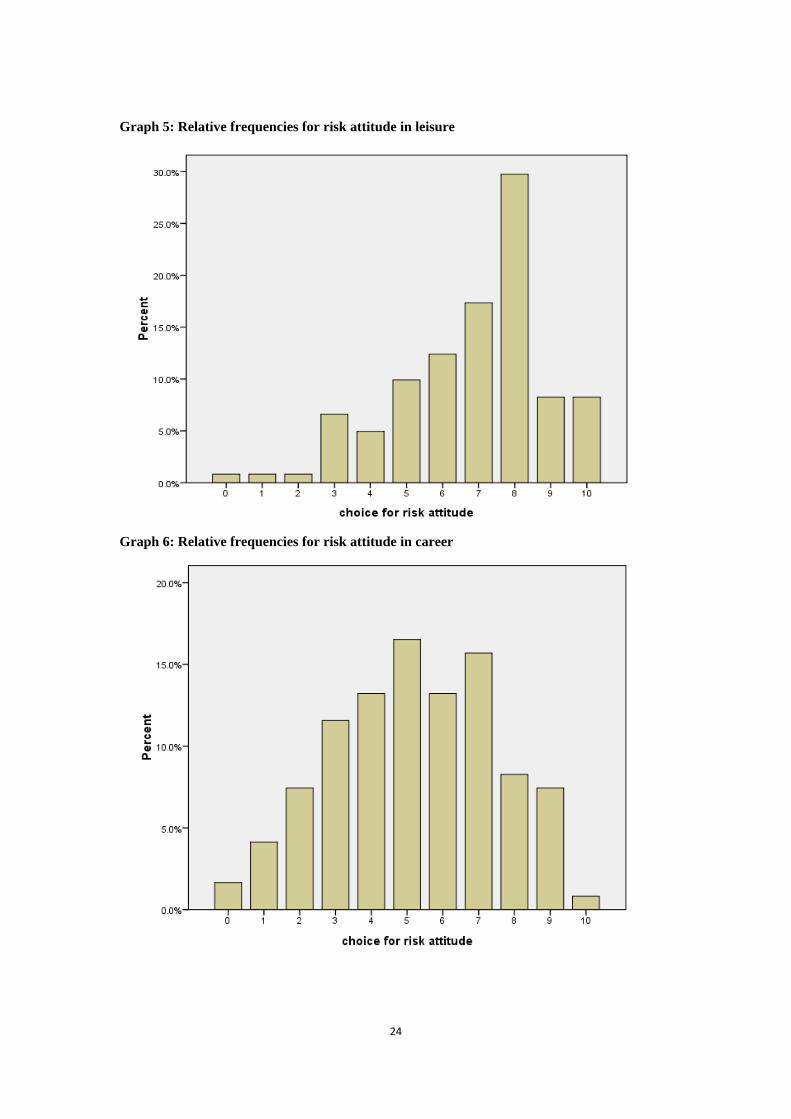
Graph 5: Relative frequencies for risk attitude in leisure
Graph 6: Relative frequencies for risk attitude in career
24
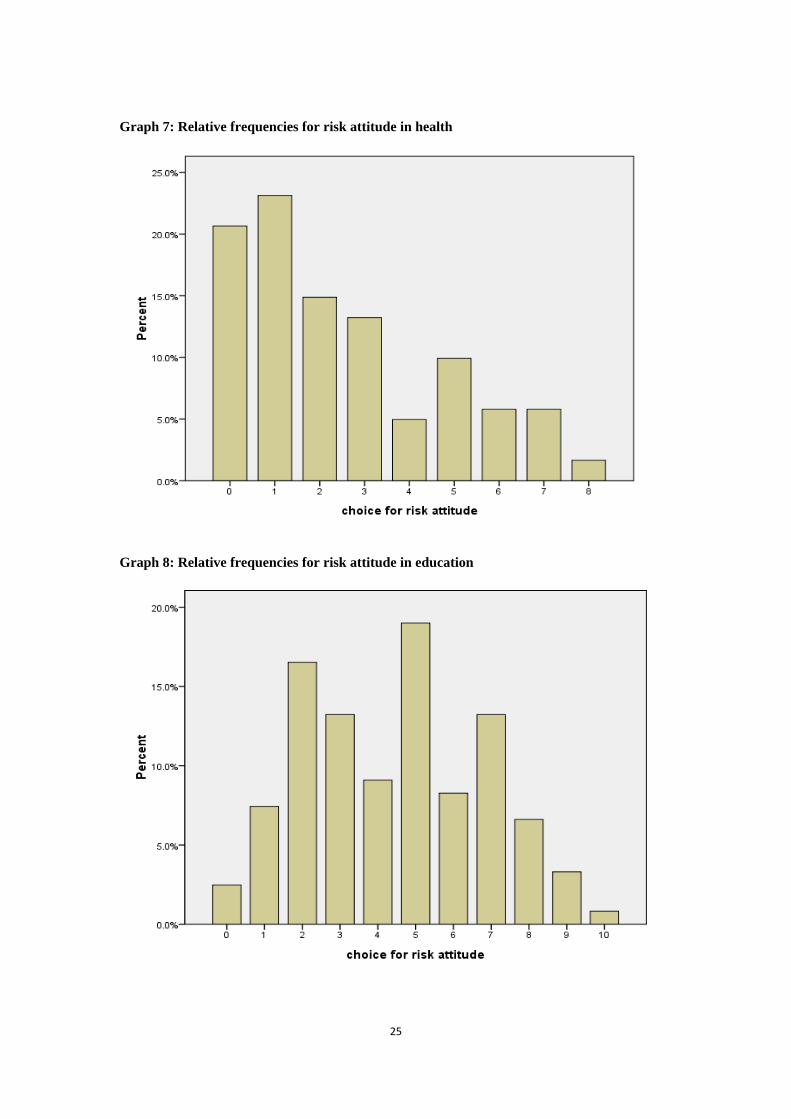
Graph 7: Relative frequencies for risk attitude in health
Graph 8: Relative frequencies for risk attitude in education
25
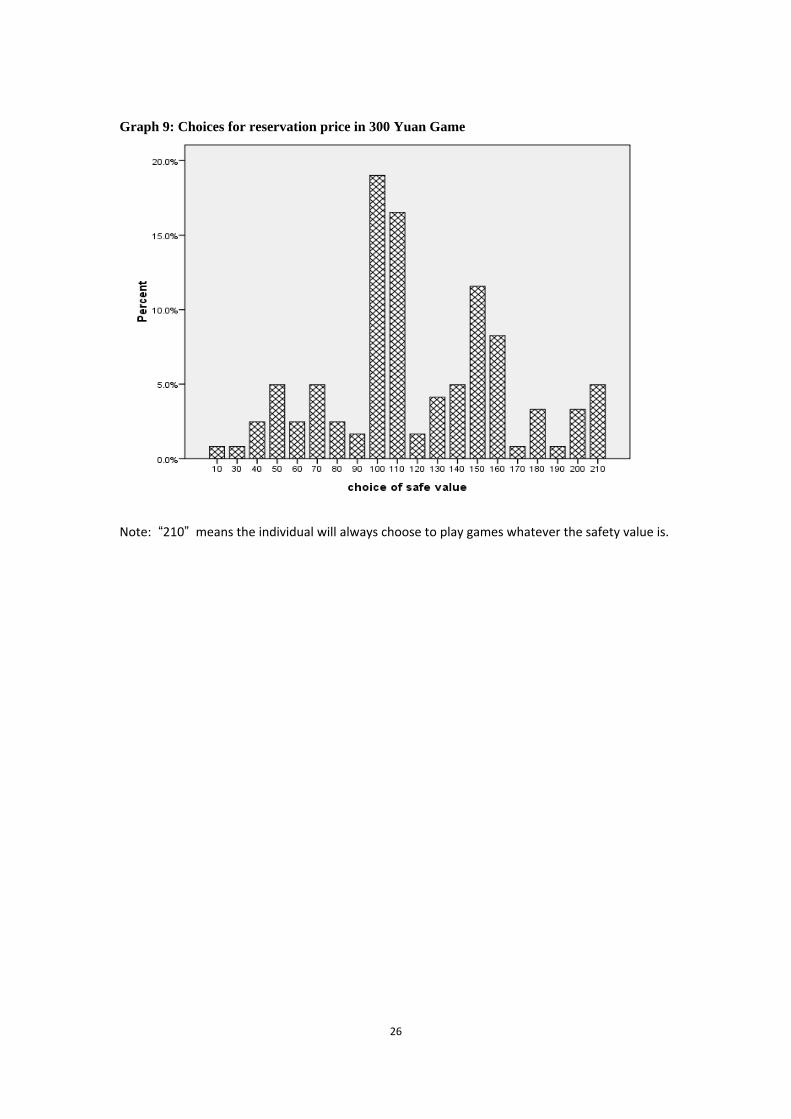
Graph 9: Choices for reservation price in 300 Yuan Game
Note: “210” means the individual will always choose to play games whatever the safety value is.
26
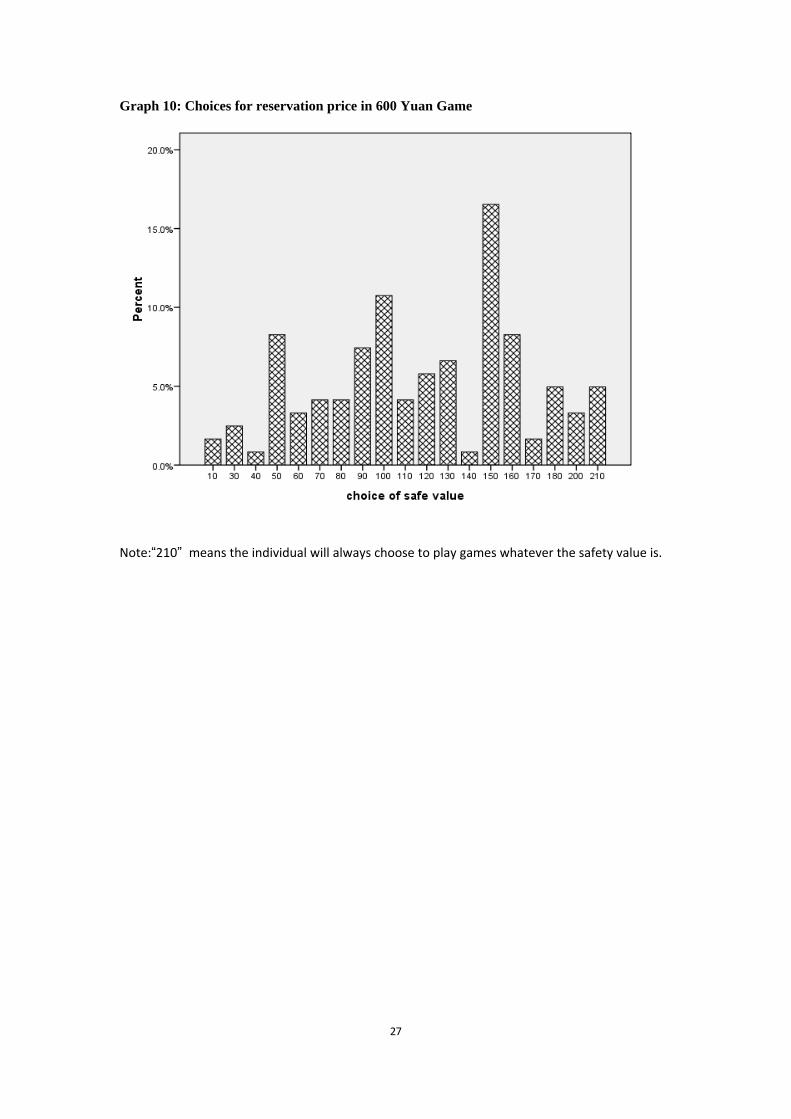
Graph 10: Choices for reservation price in 600 Yuan Game
Note:“210” means the individual will always choose to play games whatever the safety value is.
27
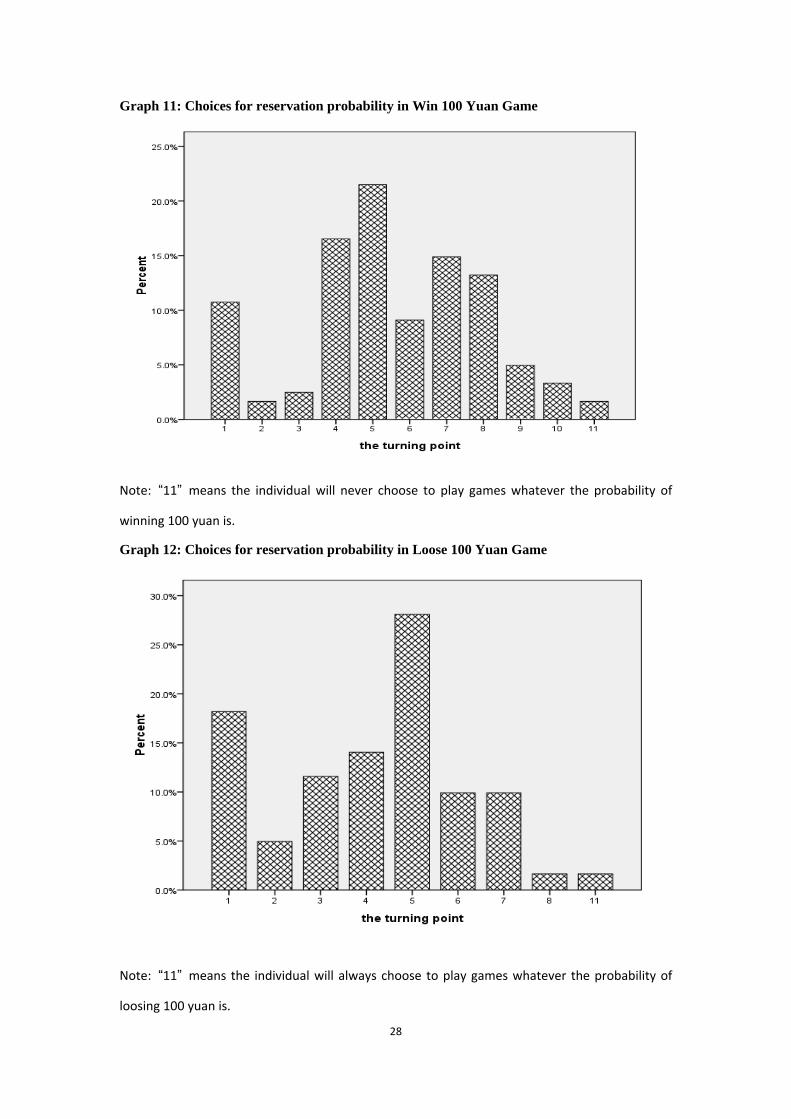
Note: “11” means the individual will always choose to play games whatever the probability of
loosing 100 yuan is.
Note: “11” means the individual will never choose to play games whatever the probability of
winning 100 yuan is.
Graph 12: Choices for reservation probability in Loose 100 Yuan Game
28
Graph 11: Choices for reservation probability in Win 100 Yuan Game
29
Graph 13. Respondents who are risk averse, by number of domains; Lottery Reservation Price
10
35
1817
22
16
3
8.3%
28.9%
14.9%14.0%
18.2%
13.2%
2.5%
0
5
10
15
20
25
30
35
40
zer o one t wo t hr ee f our f i ve si x0.0%
5.0%
10.0%
15.0%
20.0%
25.0%
30.0%
35.0%
f r equency per cent age

30