Embed Size (px)
Citation preview
Judy Lee
Enterprise Statistics Division
Statistics CanadaI
1
Developing Metadata Standards in an Integration Project at Statistics Canada
United Nations Economic Commission for EuropeWorkshop on International Collaboration for Standards-Based
Modernization (Geneva, Switzerland 5-7 May 2015)
Governing and Maintaining Statistical Standards
2
Statistics Canada’s Corporate Business Architecture
Corporate Context Corporate Business Architecture launched in 2010
Objectives: Efficiencies, Quality, Robustness
Efficient , Robust, and Responsive business architecture
Reduce operating cost, enhance quality assurance, improve responsiveness
Maximize re-use; eliminate re-work: metadata driven systems Review of Statistics Canada’s Business Statistics Program
Develop generalized model for producing business statistics
Shared and generic corporate services and systems for collecting, processing, disseminating and storing statistical information.
Global optimum supersedes local preferences
3
Integrated Business Statistics Program
IBSP Objectives and Business Outcomes Generic model with improved quality and coherence across programs Robust Infrastructure; Reduce Cost and maintenance Flexible to respond to client needs; Reduce respondent burden
IBSP Key Components Maximum Use of Tax Data; Content Harmonization; Electronic
Questionnaire as the primary mode ; Two-phase sampling; Rolling Estimates; Common Metadata Driven Tools and Generalized Systems; Top Down Analytical Approach
IBSP Scope, Partners, and Dependencies Over 90 existing business surveys covering manufacturing, services, retail,
agriculture, capital expenditure, energy and research and development; financial and ad hoc surveys
Partners: 8 subject matter divisions + 8 service provider divisions IBSP project of development and integration
4
IBSP Metadata Value Proposition
IBSP Metadata Objectives and Business Outcomes More efficient, flexible tools; reduction of manual intervention Coherence from questionnaire development to processing to
dissemination More harmonized data and metadata definitions Ensures consistently applied standards and structure Shared metadata repository(s) across systems and partners Promotes uptake / integration of large volume of surveys Facilitates training, maintenance and knowledge transfer Aids in development of common information model and the
Enterprise Architecture Integration Platform (EAIP)
5
IBSP Variable Naming Framework
Goals and Expected Outcomes: Standardization, Coherence, Usability Consistent, coherent, and logical naming framework
One variable to many question text/wording; Root variables and sub-variables
Logical generation of cell numbers from variable names
Naming Structure by Variable Type Statistical Variables: Anchored on Statistical Concepts to measure; Process Control and Design Variables: Anchored on GSBPM Identification Variables: Anchored on level of statistical activity and “What it
identifies” Derived Variable – A statistical variable with a formula Transformed Variables – Transformed Variable Code set
6
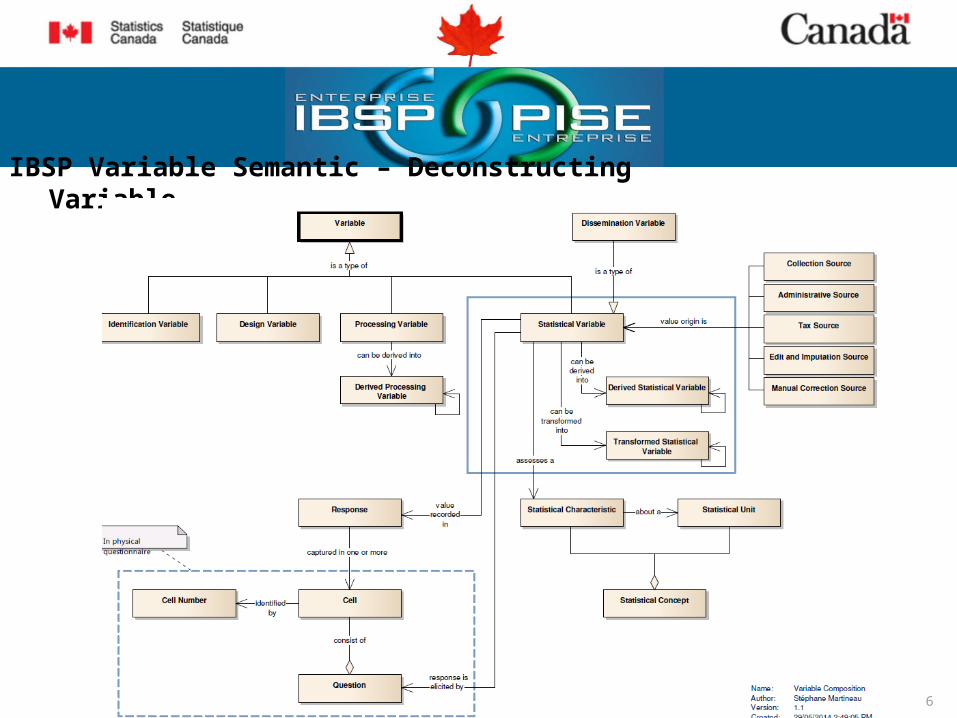
IBSP Variable Semantic – Deconstructing Variable
7
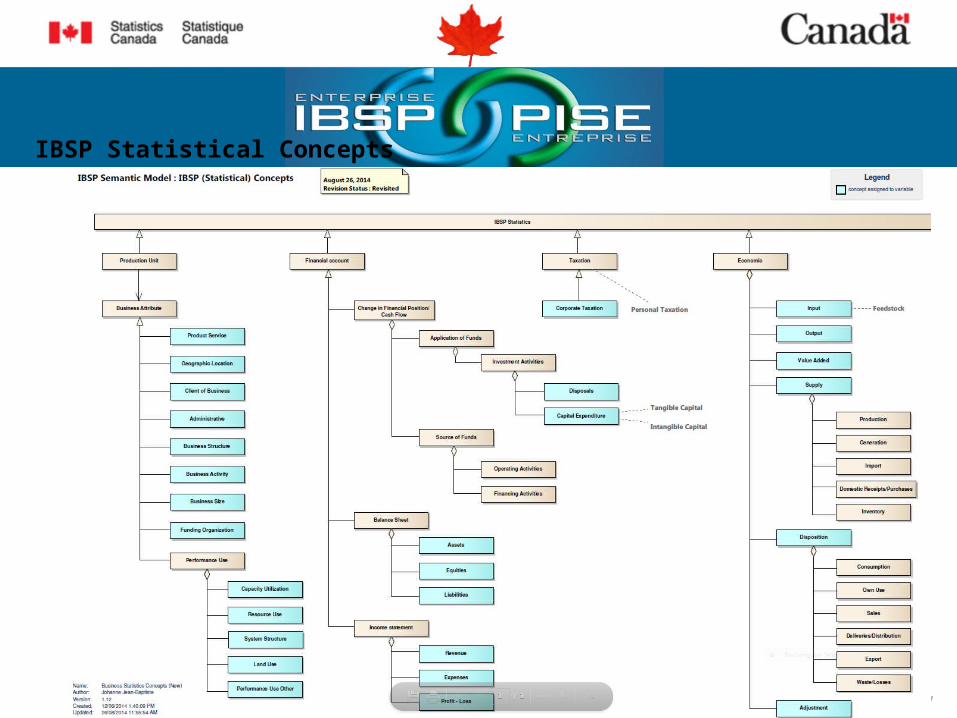
IBSP Statistical Concepts
8
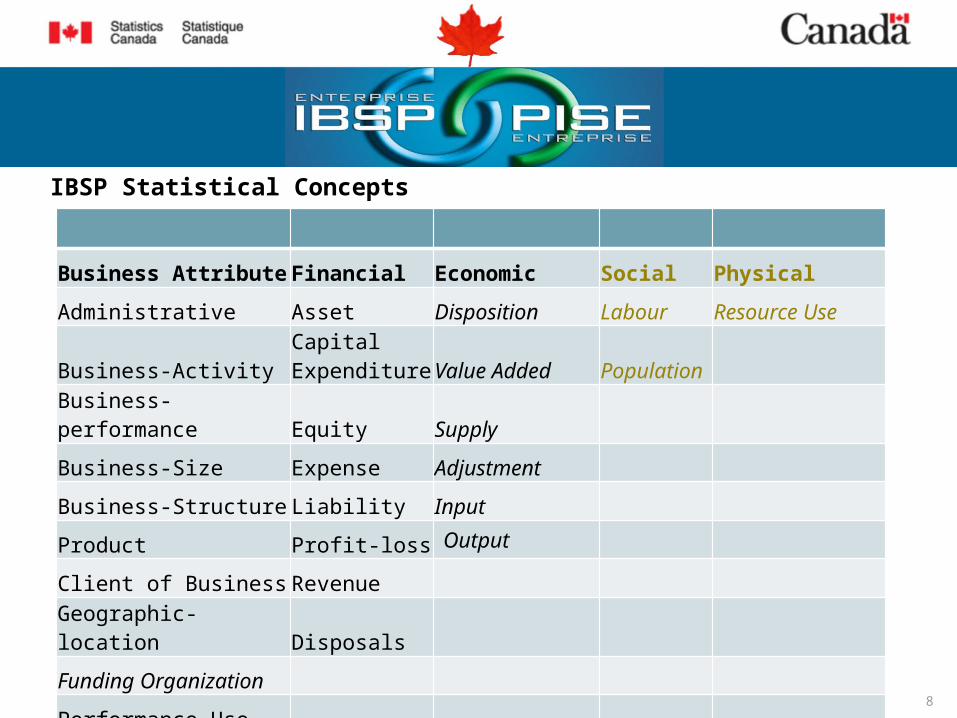
IBSP Statistical Concepts
Business Attribute Financial Economic Social Physical
Administrative Asset Disposition Labour Resource Use
Business-ActivityCapital Expenditure Value Added Population
Business-performance Equity Supply
Business-Size Expense Adjustment
Business-Structure Liability Input
Product Profit-loss Output
Client of Business Revenue
Geographic-location Disposals
Funding Organization
Performance Use
9
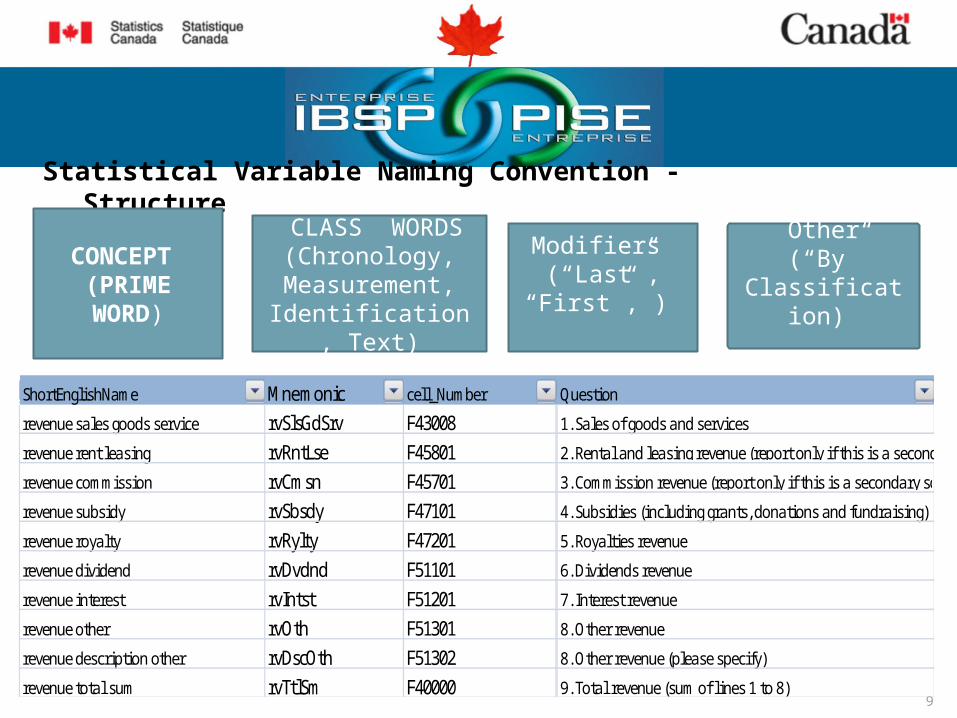
Statistical Variable Naming Convention - Structure
ShortEnglishName Mnemonic cell_Number QuestionQuestion
revenue sales goods service rvSlsGdSrv F43008 Revenue1. Sales of goods and services
revenue rent leasing rvRntLse F45801 Revenue2. Rental and leasing revenue (report only if this is a secondary source of revenue. If rental and leasing are your primary revenue source, report in question 1).
revenue commission rvCmsn F45701 Revenue3. Commission revenue (report only if this is a secondary source of revenue. If commissions are your primary revenue source, report in question 1).
revenue subsidy rvSbsdy F47101 Revenue4. Subsidies (including grants, donations and fundraising)
revenue royalty rvRylty F47201 Revenue5. Royalties revenue
revenue dividend rvDvdnd F51101 Revenue6. Dividends revenue
revenue interest rvIntst F51201 Revenue7. Interest revenue
revenue other rvOth F51301 Revenue8. Other revenue
revenue description other rvDscOth F51302 Revenue8. Other revenue (please specify)
revenue total sum rvTtlSm F40000 Revenue9. Total revenue (sum of l ines 1 to 8)
CONCEPT (PRIME WORD)
CLASS WORDS(Chronology,
Measurement, Identification, Text)
Modifiers (“Last”, “First”, )
Other(“By”
Classification)
10
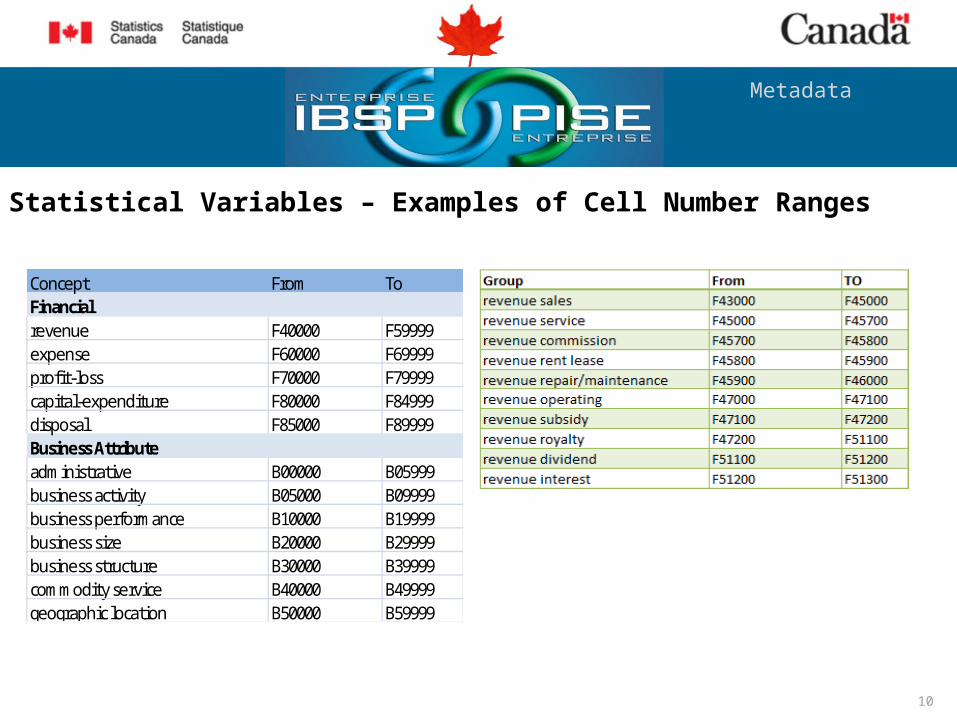
Statistical Variables – Examples of Cell Number Ranges
Metadata
Concept From ToFinancialrevenue F40000 F59999expense F60000 F69999profit-loss F70000 F79999capital-expenditure F80000 F84999disposal F85000 F89999Business Attributeadministrative B00000 B05999business activity B05000 B09999business performance B10000 B19999business size B20000 B29999business structure B30000 B39999commodity service B40000 B49999geographic location B50000 B59999
11
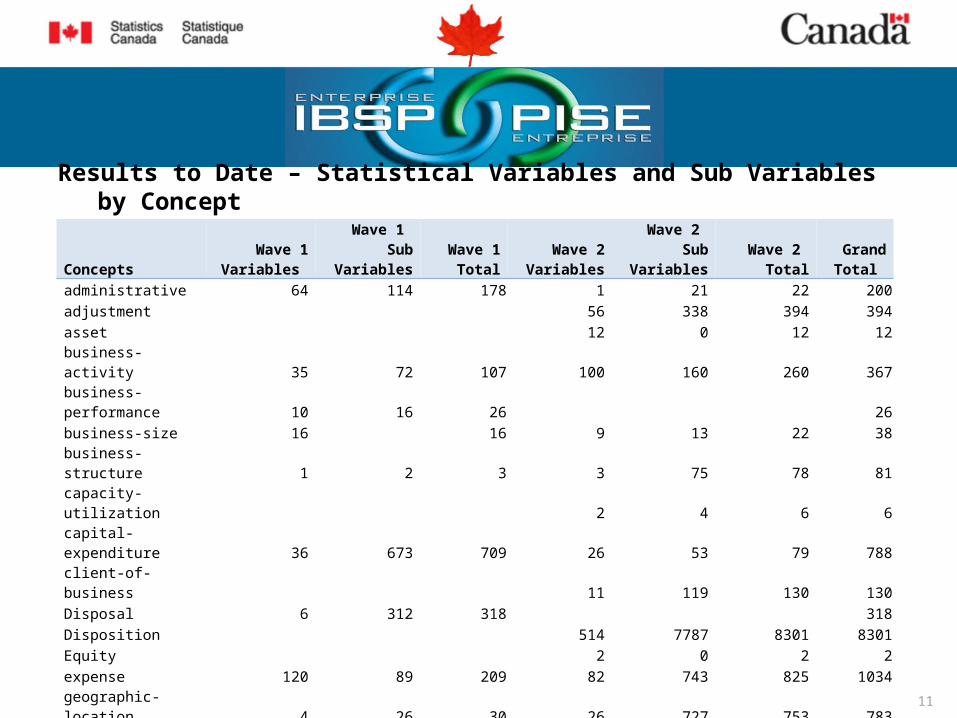
Results to Date – Statistical Variables and Sub Variables by Concept
ConceptsWave 1
Variables Wave 1
Sub VariablesWave 1
Total Wave 2
Variables Wave 2
Sub VariablesWave 2
TotalGrand Total
administrative 64 114 178 1 21 22 200adjustment 56 338 394 394asset 12 0 12 12business-activity 35 72 107 100 160 260 367business-performance 10 16 26 26business-size 16 16 9 13 22 38business-structure 1 2 3 3 75 78 81capacity-utilization 2 4 6 6capital-expenditure 36 673 709 26 53 79 788client-of-business 11 119 130 130Disposal 6 312 318 318Disposition 514 7787 8301 8301Equity 2 0 2 2expense 120 89 209 82 743 825 1034geographic-location 4 26 30 26 727 753 783input 4 418 422 422liability 7 0 7 7net-profit 1 0 1 1performance-use 6 149 155 155profit-loss 2 2 2product 105 2369 2474 86 908 994 3468resource-use 3 4 7 7revenue 451 256 707 46 290 336 1043supply 409 4289 4698 4698Grand Total 850 3929 4779 1406 16098 17504 22283
12
13
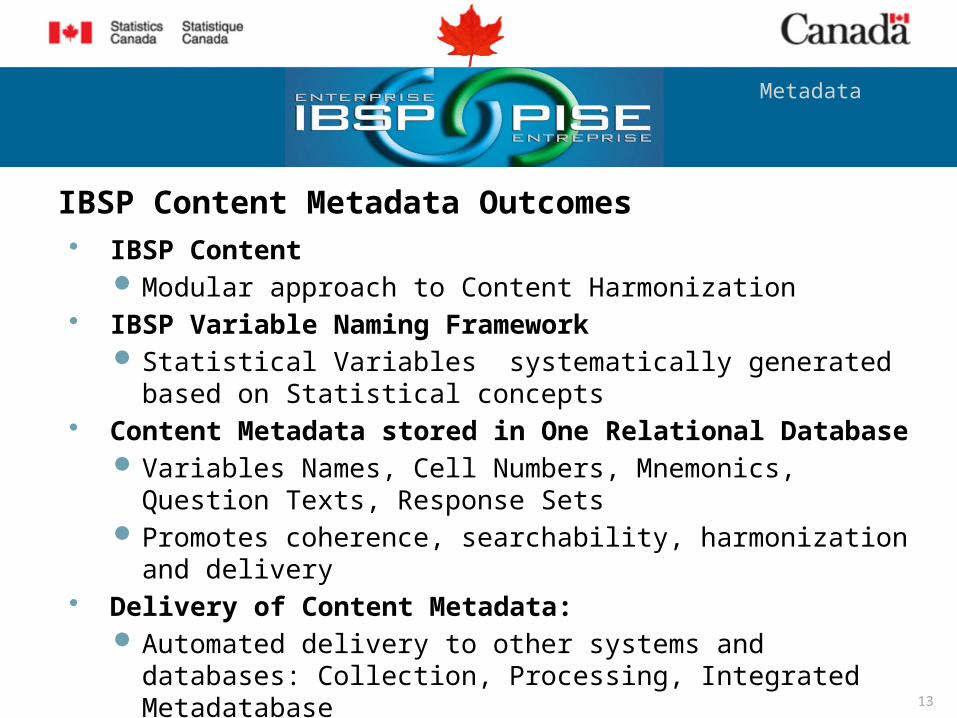
IBSP Content Metadata Outcomes IBSP Content
Modular approach to Content Harmonization IBSP Variable Naming Framework
Statistical Variables systematically generated based on Statistical concepts
Content Metadata stored in One Relational Database Variables Names, Cell Numbers, Mnemonics, Question Texts,
Response Sets Promotes coherence, searchability, harmonization and delivery
Delivery of Content Metadata: Automated delivery to other systems and databases: Collection,
Processing, Integrated Metadatabase
Metadata
14
Conclusion and Next Steps
Metadata
1. Unprecedented opportunity to name variables consistently from collection to just before dissemination.
2. Naming Framework has proven to be robust and expandable• Possible expansion of bandwidths for future waves• Will accommodate a total of almost 100 economic surveys
3. Integration of naming functionality into core IBSP system for consolidation phrase
4. Development, Implementation, and Governance centralized at project level.
5. Strong governance and Change Management control6. Significant impact on usability, searchability, and interoperability