Embed Size (px)
Citation preview
Foundation for Promotion of Cancer Research 公益財団法人 がん研究振興財団
がんの統計CANCER STATISTICS IN JAPAN ─ 2017
’17ISSN 2433-3212
わが国におけるがん対策のあゆみ ・・・・・・・・・・・・・・・・・・・・・・・・・・・・・・・・・・・・・・・・・・・・・・・・・・・・・・・・・・・・・・・・・・・・・・ 4~ 11
図 表 編1 2017年がん死亡数・罹患数予測 ・・・・・・・・・・・・・・・・・・・・・・・・・・・・・・・・・・・・・・・・・・・・・・・・・・・・・・・・・・・・・・・・・・・・・・・・・・・・ 14
2 部位別がん死亡数(2016年) ・・・・・・・・・・・・・・・・・・・・・・・・・・・・・・・・・・・・・・・・・・・・・・・・・・・・・・・・・・・・・・・・・・・・・・・・・・・・・・・ 15
3 年齢階級別がん死亡 部位内訳(2016年) ・・・・・・・・・・・・・・・・・・・・・・・・・・・・・・・・・・・・・・・・・・・・・・・・・・・・・・・・・・・・・・・・・・・ 16
4 部位別がん死亡率(2016年) ・・・・・・・・・・・・・・・・・・・・・・・・・・・・・・・・・・・・・・・・・・・・・・・・・・・・・・・・・・・・・・・・・・・・・・・・・・・・・・・ 17
5 都道府県別75歳未満がん年齢調整死亡率(2016年) ・・・・・・・・・・・・・・・・・・・・・・・・・・・・・・・・・・・・・・・・・・・・・・・・・・・・・ 18~ 22
6 部位別がん罹患数(2013年) ・・・・・・・・・・・・・・・・・・・・・・・・・・・・・・・・・・・・・・・・・・・・・・・・・・・・・・・・・・・・・・・・・・・・・・・・・・・・・・・ 23
7 年齢階級別がん罹患 部位内訳(2013年) ・・・・・・・・・・・・・・・・・・・・・・・・・・・・・・・・・・・・・・・・・・・・・・・・・・・・・・・・・・・・・・・・・・・ 24
8 部位別がん粗罹患率(2013年) ・・・・・・・・・・・・・・・・・・・・・・・・・・・・・・・・・・・・・・・・・・・・・・・・・・・・・・・・・・・・・・・・・・・・・・・・・・・・・ 25
9 地域がん登録における5年生存率(2006~ 2008年診断例) ・・・・・・・・・・・・・・・・・・・・・・・・・・・・・・・・・・・・・・・・・・・・・・ 26~ 27
10 がん診療連携拠点病院における5年生存率(2008年診断例) ・・・・・・・・・・・・・・・・・・・・・・・・・・・・・・・・・・・・・・・・・・・・・・・・・・・ 28
11 院内がん登録からみたがん診療連携拠点病院等における臨床病期の分布(2015年診断例) ・・・・・・・・・・・・・・・・・・・・・・・・・ 29
12 全国がんセンター協議会加盟施設における5年生存率(2007~ 2009年診断例) ・・・・・・・・・・・・・・・・・・・・・・・・・・・・ 30~ 31
13 全国がんセンター協議会加盟施設における10年生存率(2001~ 2004年診断例) ・・・・・・・・・・・・・・・・・・・・・・・・・・・・ 32~ 33
14 累積がん罹患・死亡リスク ・・・・・・・・・・・・・・・・・・・・・・・・・・・・・・・・・・・・・・・・・・・・・・・・・・・・・・・・・・・・・・・・・・・・・・・・・・・ 34~ 35
15 小児・AYA世代のがん ・・・・・・・・・・・・・・・・・・・・・・・・・・・・・・・・・・・・・・・・・・・・・・・・・・・・・・・・・・・・・・・・・・・・・・・・・・・・・・・ 36~ 37
16 主要死因別粗死亡率年次推移(1947年~ 2016年) ・・・・・・・・・・・・・・・・・・・・・・・・・・・・・・・・・・・・・・・・・・・・・・・・・・・・・・・・・・・・ 38
17 主要死因別年齢調整死亡率年次推移(1947年~ 2016年) ・・・・・・・・・・・・・・・・・・・・・・・・・・・・・・・・・・・・・・・・・・・・・・・・・・・・・・ 39
18 部位別がん死亡数年次推移(1965年~ 2016年) ・・・・・・・・・・・・・・・・・・・・・・・・・・・・・・・・・・・・・・・・・・・・・・・・・・・・・・・・・・・・・・ 40
19 がん年齢調整死亡率年次推移(1958年~ 2016年) ・・・・・・・・・・・・・・・・・・・・・・・・・・・・・・・・・・・・・・・・・・・・・・・・・・・・・・・ 41~ 42
20 年齢階級別がん死亡率推移(1965年、1990年、2016年) ・・・・・・・・・・・・・・・・・・・・・・・・・・・・・・・・・・・・・・・・・・・・・・・・・ 43~ 46
21 部位別がん罹患数推移(1980年~ 2013年) ・・・・・・・・・・・・・・・・・・・・・・・・・・・・・・・・・・・・・・・・・・・・・・・・・・・・・・・・・・・・・・・・・・ 47
22 がん年齢調整罹患率年次推移(1985年~ 2012年) ・・・・・・・・・・・・・・・・・・・・・・・・・・・・・・・・・・・・・・・・・・・・・・・・・・・・・・・ 48~ 49
23 年齢階級別がん罹患率推移(1980年、2013年) ・・・・・・・・・・・・・・・・・・・・・・・・・・・・・・・・・・・・・・・・・・・・・・・・・・・・・・・・・ 50~ 53
24 地域がん登録における5年生存率推移(1993-1996年、1997-1999年、2000-2002年、2003-2005年、2006-2008年診断例) ・・・・・ 54
25 がん年齢調整死亡率・罹患率年次推移 ・・・・・・・・・・・・・・・・・・・・・・・・・・・・・・・・・・・・・・・・・・・・・・・・・・・・・・・・・・・・・・・・・・・・・・ 55
26 喫煙率 ・・・・・・・・・・・・・・・・・・・・・・・・・・・・・・・・・・・・・・・・・・・・・・・・・・・・・・・・・・・・・・・・・・・・・・・・・・・・・・・・・・・・・・・・・・・・・ 56~ 57
27 がん検診受診率(2007、2010、2013、2016年) ・・・・・・・・・・・・・・・・・・・・・・・・・・・・・・・・・・・・・・・・・・・・・・・・・・・・・・・・ 58~ 60
資 料 編1 2017年がん死亡数・罹患数予測 ・・・・・・・・・・・・・・・・・・・・・・・・・・・・・・・・・・・・・・・・・・・・・・・・・・・・・・・・・・・・・・・・・・・・・・・ 62~ 63
2 ICD-10三桁分類別がん死亡(死亡数・割合)(2016年) ・・・・・・・・・・・・・・・・・・・・・・・・・・・・・・・・・・・・・・・・・・・・・・・・・・ 64~ 67
3 部位別年齢階級別がん死亡数・割合(2016年) ・・・・・・・・・・・・・・・・・・・・・・・・・・・・・・・・・・・・・・・・・・・・・・・・・・・・・・・・・・ 68~ 71
4 部位別年齢階級別がん死亡率(2016年) ・・・・・・・・・・・・・・・・・・・・・・・・・・・・・・・・・・・・・・・・・・・・・・・・・・・・・・・・・・・・・・・・ 72~ 75
5 都道府県別がん死亡率 ・・・・・・・・・・・・・・・・・・・・・・・・・・・・・・・・・・・・・・・・・・・・・・・・・・・・・・・・・・・・・・・・・・・・・・・・・・・・・・・ 76~ 81
6 部位別年齢階級別がん罹患数・割合(2013年) ・・・・・・・・・・・・・・・・・・・・・・・・・・・・・・・・・・・・・・・・・・・・・・・・・・・・・・・・・・ 82~ 85
7 部位別年齢階級別がん罹患率(2013年) ・・・・・・・・・・・・・・・・・・・・・・・・・・・・・・・・・・・・・・・・・・・・・・・・・・・・・・・・・・・・・・・・ 86~ 89
8 地域がん登録における5年生存率(2006~ 2008年診断例) ・・・・・・・・・・・・・・・・・・・・・・・・・・・・・・・・・・・・・・・・・・・・・・ 90~ 91
9 がん診療連携拠点病院における5年生存率(2008年診断例) ・・・・・・・・・・・・・・・・・・・・・・・・・・・・・・・・・・・・・・・・・・・・・・・・・・・ 92
10 全国がんセンター協議会加盟施設における5年生存率(2007~ 2009年診断例) ・・・・・・・・・・・・・・・・・・・・・・・・・・・・ 93~ 96
11 全国がんセンター協議会加盟施設における10年生存率(2001~ 2004年診断例) ・・・・・・・・・・・・・・・・・・・・・・・・・・・97~ 100
12 小児・AYA世代のがん ・・・・・・・・・・・・・・・・・・・・・・・・・・・・・・・・・・・・・・・・・・・・・・・・・・・・・・・・・・・・・・・・・・・・・・・・・・・・・・・・・・・ 101
13 主要死因別粗死亡率年次推移(1910年~ 2016年) ・・・・・・・・・・・・・・・・・・・・・・・・・・・・・・・・・・・・・・・・・・・・・・・・・・・・・102~ 103
14 主要死因別年齢調整死亡率年次推移(1947年~ 2016年) ・・・・・・・・・・・・・・・・・・・・・・・・・・・・・・・・・・・・・・・・・・・・・・・104~ 105
15 喫煙率 ・・・・・・・・・・・・・・・・・・・・・・・・・・・・・・・・・・・・・・・・・・・・・・・・・・・・・・・・・・・・・・・・・・・・・・・・・・・・・・・・・・・・・・・・・・・106~ 109
16 がん検診受診率(2007年、2010年、2013、2016年) ・・・・・・・・・・・・・・・・・・・・・・・・・・・・・・・・・・・・・・・・・・・・・・・・・・110~ 111
17 医療用麻薬消費量 ・・・・・・・・・・・・・・・・・・・・・・・・・・・・・・・・・・・・・・・・・・・・・・・・・・・・・・・・・・・・・・・・・・・・・・・・・・・・・・・・・112~ 113
18 喫煙、飲酒と栄養摂取の変化 ・・・・・・・・・・・・・・・・・・・・・・・・・・・・・・・・・・・・・・・・・・・・・・・・・・・・・・・・・・・・・・・・・・・・・・・114~ 115
19 受療率の推移(1996年~ 2014年) ・・・・・・・・・・・・・・・・・・・・・・・・・・・・・・・・・・・・・・・・・・・・・・・・・・・・・・・・・・・・・・・・・・・・・・・・・ 116
20 国民医療費の推移(2003年~ 2015年) ・・・・・・・・・・・・・・・・・・・・・・・・・・・・・・・・・・・・・・・・・・・・・・・・・・・・・・・・・・・・・・・・・・・・・ 117用語の説明 ・・・・・・・・・・・・・・・・・・・・・・・・・・・・・・・・・・・・・・・・・・・・・・・・・・・・・・・・・・・・・・・・・・・・・・・・・・・・・・・・・・・・・・118~ 121トピックス① ・・・・・・・・・・・・・・・・・・・・・・・・・・・・・・・・・・・・・・・・・・・・・・・・・・・・・・・・・・・・・・・・・・・・・・・・・・・・・・・・・・・・・・・・・・ 122トピックス② ・・・・・・・・・・・・・・・・・・・・・・・・・・・・・・・・・・・・・・・・・・・・・・・・・・・・・・・・・・・・・・・・・・・・・・・・・・・・・・・・・・・・・・・・・・ 123トピックス③ ・・・・・・・・・・・・・・・・・・・・・・・・・・・・・・・・・・・・・・・・・・・・・・・・・・・・・・・・・・・・・・・・・・・・・・・・・・・・・・・・・・・・・・・・・・ 124トピックス④ ・・・・・・・・・・・・・・・・・・・・・・・・・・・・・・・・・・・・・・・・・・・・・・・・・・・・・・・・・・・・・・・・・・・・・・・・・・・・・・・・・・・・125~ 126トピックス⑤ ・・・・・・・・・・・・・・・・・・・・・・・・・・・・・・・・・・・・・・・・・・・・・・・・・・・・・・・・・・・・・・・・・・・・・・・・・・・・・・・・・・・・127~ 130トピックス⑥ ・・・・・・・・・・・・・・・・・・・・・・・・・・・・・・・・・・・・・・・・・・・・・・・・・・・・・・・・・・・・・・・・・・・・・・・・・・・・・・・・・・・・・・・・・・ 131
目 次 頁

図 表 編Figures and Tables
14
最新がん統計 C
an
cer S
tatistic
s Up
date
1 2017 年がん死亡数・罹患数予測Projection of Cancer Mortality and Incidence in 2017
⑴ 部位別予測がん死亡数(2017) Estimated Number of Cancer Deaths by Site (2017)
⑵ 部位別予測がん罹患数(2017) Estimated Number of Cancer Incidence by Site (2017)
予測は、全国がん罹患モニタリング集計の年齢階級別罹患数(1975~2013 全国推計値)および人口動態統計がん死亡数(1975~2015実測値)を用いて、年齢、暦年およびそれらの交互作用を説明変数とした予測モデルにより行った。Expected�numbers�of�cancer�deaths�and�incidence�were�provided�by�age�period�interaction�model.�The�prediction�model�included�the�number�of�incidence�from�1975�to�2013,�mortality�from�1975�to�2015,�age�at�diagnosis,��calendar�year�and�those�interaction�as�independent�variable.�
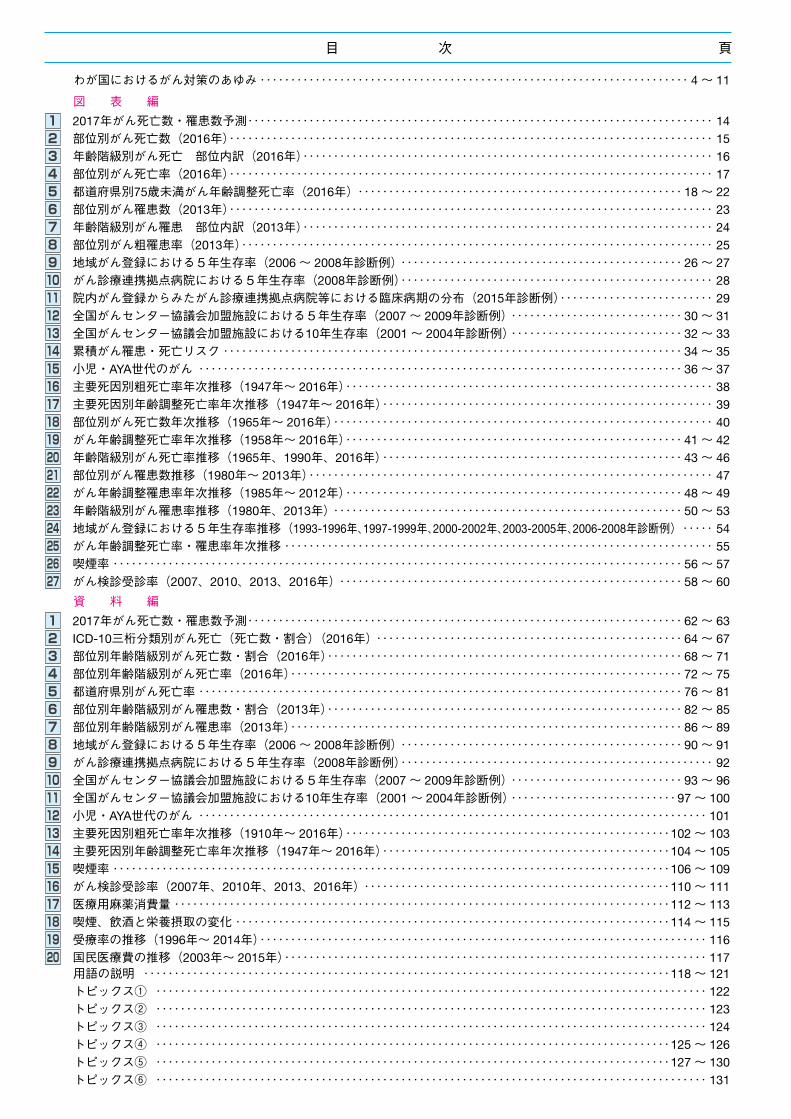
わが国のがん死亡数の 2017 年推計値は、約 37 万 8 千人である(男性 22 万 2 千人、女性 15 万 6 千人)。部位別の死亡数は、男性では肺が最も多くがん死亡全体の 25% を占め、次いで胃(14%)、大腸(13%)、肝臓(8%)、膵臓(8%)の順、女性では大腸が最も多く(16%)、次いで、肺(14%)、膵臓(11%)、胃(11%)、乳房(9%)の順となっている。わが国のがん罹患数の2017年推計値は、約101万4千例である(男性57万5千900例、女性43万8千100例)。部位別では男性で胃(16%)、肺(15%)、前立腺(15%)、大腸(15%)、肝臓(5%)の順、女性で乳房(20%)、大腸(15%)、胃(10%)、肺(10%)、子宮(6%)の順となっている。Estimated�number�of�cancer�deaths�in�Japan�in�2017�was�approximately�378,000�(222,000�males�and�156,000�females).�Lung�was�the�leading�site�(25%)�for�males,�followed�by�stomach�(14%),�colon/rectum�(13%),�liver�(8%),�and�pancreas�(8%).�The�leading�site�for�females�was�colon/rectum�(16%),�followed�by�lung�(14%),�pancreas�(11%),�stomach�(11%),�and�breast�(9%).Estimated�number�of�cancer� incidence� in�Japan�in�2017�was�approximately�1,014,000�(575,900�for�males�and�438,100�for�females).�Stomach�was�the�most�common�cancer�site�(16%)�for�males,�followed�by�lung�(15%),�prostate�(15%),�colon/rectum�(15%),�and�liver�(5%).�The�most�common�cancer�site� for� females�was�breast�(20%),�followed�by�colon/rectum�(15%),�stomach�(10%),� lung�
(10%),�and�uterus�(6%).
女性、全がんFemales, All sites
156,000
大腸 Colon/rectum肺 Lung
胃 Stomach膵臓 Pancreas
乳房 Breast肝臓 Liver
胆嚢・胆管Gallbladder and bile ducts
子宮 Uterus悪性リンパ腫
Malignant lymphoma卵巣 Ovary
白血病 Leukemia腎・尿路(膀胱除く)
Kidney and other urinary organs
膀胱 Bladder口腔・咽頭
Oral cavity and pharynx多発性骨髄腫Multiple myeloma
食道 Esophagus甲状腺 Thyroid
脳・中枢神経系Brain, nervous system
皮膚 Skin喉頭 Larynx
人 Persons
男性、全がんMales, All sites
222,000
55,600(25%)31,000(14%)
28,300(13%)17,900(8%)
17,100(8%)12,200(5%)
9,300(4%)9,500(4%)
6,800(3%)6,300(3%)6,100(3%)5,400(2%)5,000(2%)
2,100(1%)1,500(<1%)
900(<1%)800(<1%)600(<1%)
肺 Lung胃 Stomach大腸 Colon/rectum肝臓 Liver膵臓 Pancreas前立腺 Prostate
食道 Esophagus胆嚢・胆管Gallbladder and bile ducts
悪性リンパ腫Malignant lymphoma腎・尿路(膀胱除く)Kidney and other urinary organs膀胱 Bladder口腔・咽頭Oral cavity and pharynx白血病 Leukemia多発性骨髄腫Multiple myeloma脳・中枢神経系Brain, nervous system喉頭 Larynx皮膚 Skin甲状腺 Thyroid
0100002000030000 400005000060000 0 10000 20000 30000 40000 50000 6000024,700(16%)
22,400(14%)16,900(11%)16,400(11%)
14,400(9%)9,600(6%)9,400(6%)
6,700(4%)5,400(3%)4,800(3%)
3,400(2%)3,400(2%)2,700(2%)2,300(1%)2,100(1%)2,000(1%)1,200(<1%)1,100(<1%)900(<1%)
100(<1%)
人 Persons
悪性リンパ腫Malignant lymphoma
肺 Lung胃 Stomach
大腸 Colon/rectum胃 Stomach
肺 Lung
膵臓 Pancreas
乳房 Breast
肝臓 Liver
胆嚢・胆管Gallbladder and bile ducts
子宮 Uterus
卵巣 Ovary
白血病 Leukemia
腎・尿路(膀胱除く)Kidney and other urinary organs
膀胱 Bladder
口腔・咽頭Oral cavity and pharynx
多発性骨髄腫Multiple myeloma
食道 Esophagus
甲状腺 Thyroid
脳・中枢神経系Brain, nervous system
皮膚 Skin
喉頭 Larynx
大腸 Colon/rectum肝臓 Liver
膵臓 Pancreas
前立腺 Prostate
食道 Esophagus
胆嚢・胆管Gallbladder and bile ducts
悪性リンパ腫Malignant lymphoma
腎・尿路(膀胱除く)Kidney and other urinary organs
膀胱 Bladder口腔・咽頭Oral cavity and pharynx
白血病 Leukemia
多発性骨髄腫Multiple myeloma脳・中枢神経系Brain, nervous system
喉頭 Larynx
皮膚 Skin
甲状腺 Thyroid
人 Persons 人 Persons
男性、全がんMales, All sites
575,900
女性、全がんFemales, All sites
438,100
300(<1%)2,300(<1%)3,500(<1%)4,000(1%)5,400(1%)6,000(1%)7,200(2%)10,000(2%)10,400(2%)12,200(3%)14,000(3%)14,200(3%)14,300(3%)14,900(3%)
19,700(4%)28,100(6%)
42,000(10%)42,400(10%)
64,000(15%)89,100(20%)90,400(16%)
86,700(15%)86,100(15%)85,500(15%)
27,000(5%)20,900(4%)20,100(3%)19,200(3%)17,100(3%)15,600(3%)15,600(3%)14,100(2%)12,200(2%)
8,200(1%)5,000(<1%)4,500(<1%)4,200(<1%)2,600(<1%)
020000400006000080000100000 0 20000 40000 60000 80000 100000
資料:国立がん研究センターがん対策情報センター(https://ganjoho.jp/reg_stat/statistics/stat/short_pred.html)Source : Center for Cancer Control and Information Services, National Cancer Canter, Japan (https://ganjoho.jp/en/public/statistics/short_pred.html)
※ 表と出典は62~ 63ページ参照。See p.62-63 for tables and references.
15
最新がん統計 C
an
cer S
tatistic
s Up
date
2 部位別がん死亡数(2016年)Number of Deaths, by Cancer Site (2016)
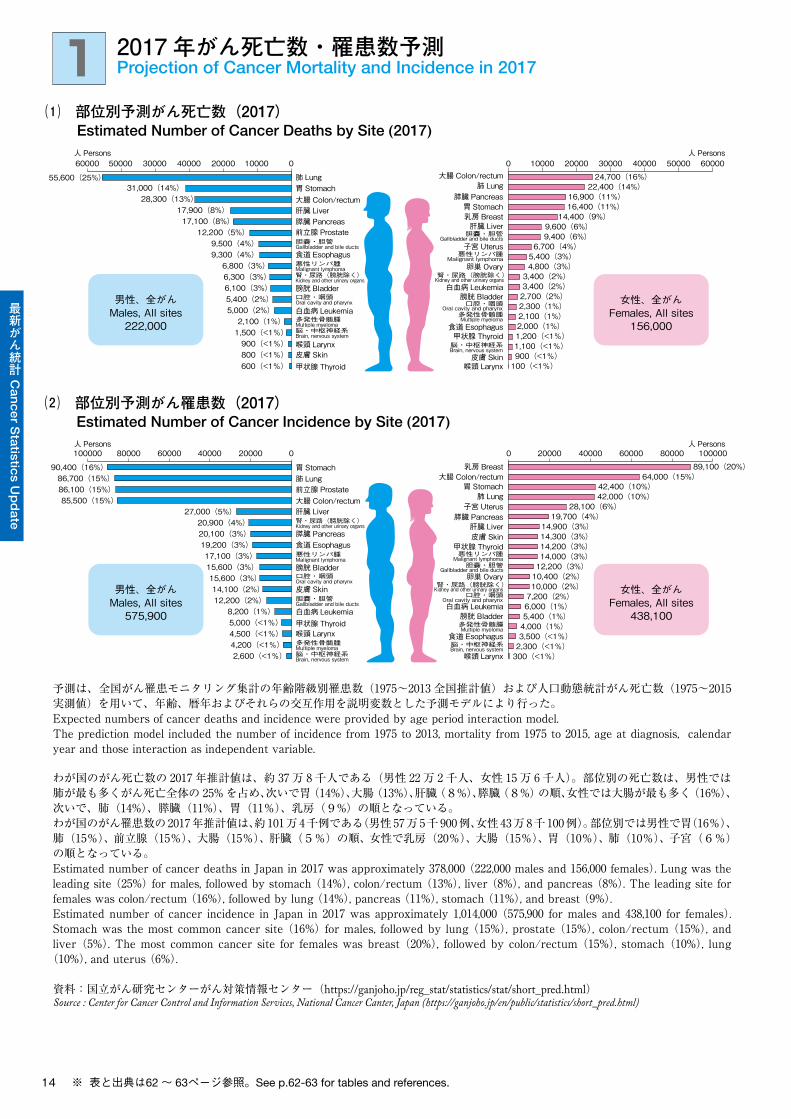
わが国のがん死亡は、全数調査である人口動態調査により把握されている。2016年にがんで死亡した人の数は約37万人であり、男性が女性の約1.5倍である。部位別の死亡数は、男性では肺が最も多くがん死亡全体の23.9%を占め、次いで胃(13.6%)、大腸(12.3%)、肝臓(8.4%)、膵臓(7.8%)の順、女性では大腸が最も多く(15.1%)、次いで、肺(14.0%)、膵臓(10.7%)、胃(10.2%)、乳房(9.1%)の順となっている。
Cancer deaths in Japan are surveyed by vital statistics, with 100% coverage. The number of cancer deaths in 2016 in Japan was approximately 370,000. �e number of male cancer deaths was 1.5 times greater than that of female cancer deaths. In terms of cancer sites, lung was the leading site (23.9%) for males, fol- lowed by stomach (13.6%), colon/rectum (12.3%), liver (8.4%), and pancreas (7.8%). The leading site for females was colon/rectum (15.1%), followed by lung (14.0%), pancreas (10.7%), stomach (10.2%), and breast (9.1%).
※ 表と出典は68~ 71ページ参照。See p.68-71 for tables and references.
2016年にがんで死亡した人は37万2,986人(男性21万9,785人、女性15万3,201人)2016年の死亡数が多い部位
372,986 persons died from cancer in 2016 (males 219,785, females 153,201)Five leading sites in 2016 mortality
1位1st
2位2nd
3位3rd
4位4th
5位5th
備 考Memo
男性Males
肺Lung
胃Stomach
大腸Colon/rectum
肝臓Liver
膵臓Pancreas
大腸を結腸と直腸に分けた場合、結腸4位、直腸7位Colon: 4th, rectum: 7th, when separated.
女性Females
大腸Colon/rectum
肺Lung
膵臓Pancreas
胃Stomach
乳房Breast
大腸を結腸と直腸に分けた場合、結腸2位、直腸9位Colon: 2nd, rectum: 9th, when separated.
男女計Both
肺Lung
大腸Colon/rectum
胃Stomach
膵臓Pancreas
肝臓Liver
大腸を結腸と直腸に分けた場合、結腸3位、直腸7位Colon: 3rd, rectum: 7th, when separated.
食道 Esophagus 胃 Stomach 結腸 Colon 直腸 Rectum 肝臓 Liver
胆のう・胆管 Gallbladder and bile ducts 膵臓 Pancreas 肺 Lung 前立腺 Prostate 乳房 Breast
子宮 Uterus 卵巣 Ovary
悪性リンパ腫 Malignant lymphoma 白血病 Leukemia
女性Females
男性Males
0 50,000 100,000 150,000 200,000 250,000人 Persons
その他 Others
甲状腺 Thyroid
219,785
9,533 9,910 8,970 11,803
587 5,398
6,918
29,854 17,116 18,510 17,060 52,430 31,696
153,20120,486
3,403
5,466
1,192
4,758
6,345
14,01521,40816,415
8,995
10,018
5,668
17,40515,677
1,950
16
最新がん統計 C
an
cer S
tatistic
s Up
date
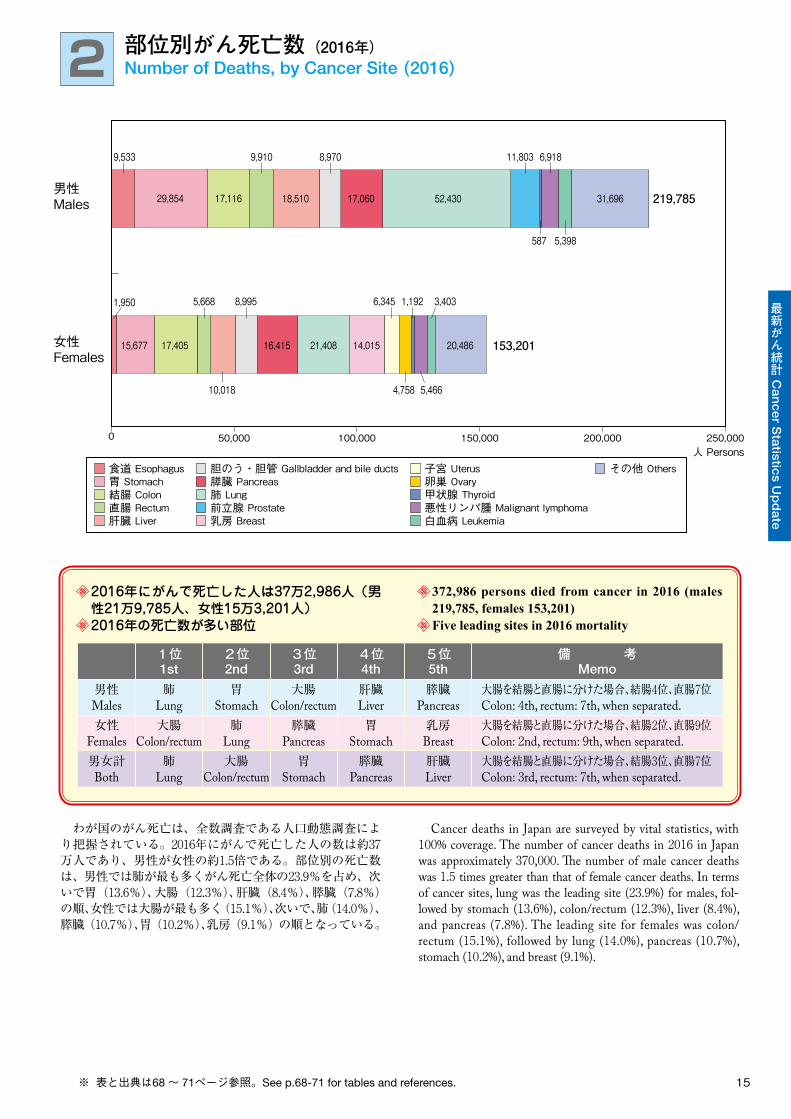
がん死亡の部位内訳を年齢階級別に見ると、男性では、40歳以上で胃、大腸、肝臓など消化器系のがんが5~6割を占め、70歳以上では肺がんと前立腺がんの割合が大きくなる。女性では、40歳代で乳がん、子宮がん、卵巣がんの死亡が約半分を占めるが、高齢になるほどその割合は小さくなり、消化器系と肺がんの割合が大きくなる。男女とも39歳以下では、他の年齢階級に比べて、消化器系および肺がんの占める割合が小さく、白血病の占める割合が大きい。
The site distribution of cancer mortality varied across age groups. For males aged 40 years or older, cancer of the intestine (stomach, colon/rectum, liver etc.) accounted for 50-60% of can-cer mortality, and the proportion of lung and prostate cancer was large among 70 years or older. For females aged 40-49 years, ap-proximately half of cancer deaths were accounted for by can-cer of the breast, uterus, and ovary, while the proportion of those sites decreased and the proportion of cancer in intestine in-creased with age. For both males and females under 40 years old, the proportion of cancer of the intestine and lung was small and the proportion of leukemia was large, as compared with older age groups.
※ 表と出典は68~ 71ページ参照。See p.68-71 for tables and references.
3 年齢階級別がん死亡 部位内訳(2016年)Cancer Deaths by Age Group, Site Distribution (2016)
食道 Esophagus 胃 Stomach 結腸 Colon
直腸 Rectum 肝臓 Liver
胆のう・胆管Gallbladder and bile ducts
膵臓 Pancreas 肺 Lung 甲状腺Thyroid
前立腺 Prostate 悪性リンパ腫 Malignant lymphoma
白血病 Leukemia その他 Others
肝臓 Liver
腎など Kidney and other urinary organs
脳・中枢神経系 Brain, nervous system
白血病 Leukemia
悪性リンパ腫 Malignant lymphoma
その他 Others
男性Males
0% 20% 40% 60% 80% 100%
歳 age
0-14
15-39
40-44
45-49
50-54
55-59
60-64
65-69
70-74
75-79
80-84
85-
脳・中枢神経系 Brain, nervous system
食道 Esophagus 胃 Stomach 結腸 Colon
直腸 Rectum 肝臓 Liver
胆のう・胆管Gallbladder and bile ducts
甲状腺 Thyroid
膵臓 Pancreas 肺 Lung 子宮 Uterus
乳房 Breast 卵巣 Ovary
悪性リンパ腫 Malignantlymphoma
白血病 Leukemia
その他 Others
女性Females
0% 20% 40% 60% 80% 100%
歳 age
0-14
15-39
40-44
45-49
50-54
55-59
60-64
65-69
70-74
75-79
80-84
85-
肝臓 Liver 白血病 Leukemia
悪性リンパ腫 Malignant lymphoma
その他 Others
肺 Lung
腎など Kidney and other urinary organs
17
最新がん統計 C
an
cer S
tatistic
s Up
date
4 部位別がん死亡率(2016年)Mortality Rate by Cancer Site (2016)
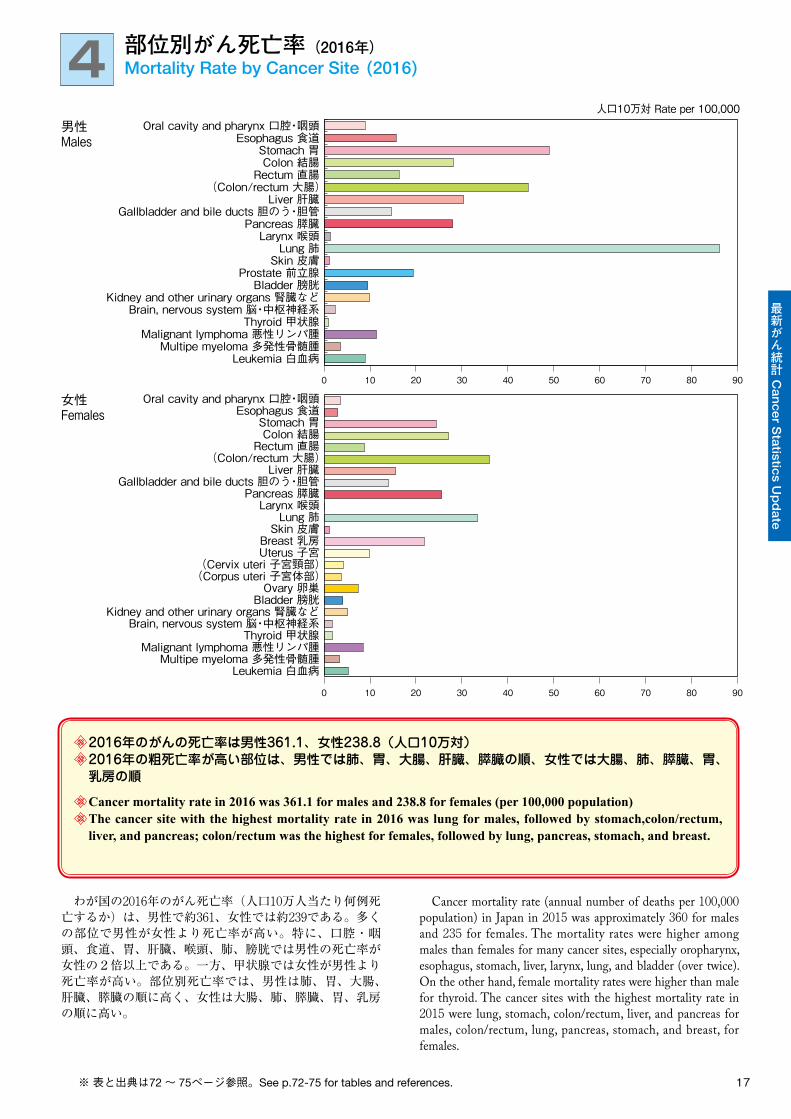
わが国の2016年のがん死亡率(人口10万人当たり何例死亡するか)は、男性で約361、女性では約239である。多くの部位で男性が女性より死亡率が高い。特に、口腔・咽頭、食道、胃、肝臓、喉頭、肺、膀胱では男性の死亡率が女性の2倍以上である。一方、甲状腺では女性が男性より死亡率が高い。部位別死亡率では、男性は肺、胃、大腸、肝臓、膵臓の順に高く、女性は大腸、肺、膵臓、胃、乳房の順に高い。
Cancer mortality rate (annual number of deaths per 100,000 population) in Japan in 2015 was approximately 360 for males and 235 for females. The mortality rates were higher among males than females for many cancer sites, especially oropharynx, esophagus, stomach, liver, larynx, lung, and bladder (over twice). On the other hand, female mortality rates were higher than male for thyroid. The cancer sites with the highest mortality rate in 2015 were lung, stomach, colon/rectum, liver, and pancreas for males, colon/rectum, lung, pancreas, stomach, and breast, for females.
※ 表と出典は72~ 75ページ参照。See p.72-75 for tables and references.
2016年のがんの死亡率は男性361.1、女性238.8(人口10万対)2016年の粗死亡率が高い部位は、男性では肺、胃、大腸、肝臓、膵臓の順、女性では大腸、肺、膵臓、胃、乳房の順
Cancer mortality rate in 2016 was 361.1 for males and 238.8 for females (per 100,000 population)The cancer site with the highest mortality rate in 2016 was lung for males, followed by stomach,colon/rectum, liver, and pancreas; colon/rectum was the highest for females, followed by lung, pancreas, stomach, and breast.
Leukemia 白血病Multipe myeloma 多発性骨髄腫
Malignant lymphoma 悪性リンパ腫Thyroid 甲状腺
Brain, nervous system 脳・中枢神経系Kidney and other urinary organs 腎臓など
Bladder 膀胱Prostate 前立腺
Skin 皮膚Lung 肺
Larynx 喉頭Pancreas 膵臓
Gallbladder and bile ducts 胆のう・胆管Liver 肝臓
Rectum 直腸Colon 結腸
Stomach 胃Esophagus 食道
Oral cavity and pharynx 口腔・咽頭
Leukemia 白血病Multipe myeloma 多発性骨髄腫
Malignant lymphoma 悪性リンパ腫Thyroid 甲状腺
Brain, nervous system 脳・中枢神経系Kidney and other urinary organs 腎臓など
Bladder 膀胱
Breast 乳房Skin 皮膚
Lung 肺Larynx 喉頭
Pancreas 膵臓Gallbladder and bile ducts 胆のう・胆管
Liver 肝臓
Rectum 直腸Colon 結腸
Stomach 胃Esophagus 食道
Oral cavity and pharynx 口腔・咽頭
Ovary 卵巣
Uterus 子宮(Cervix uteri 子宮頸部)
(Corpus uteri 子宮体部)
(Colon/rectum 大腸)
(Colon/rectum 大腸)
男性Males
女性Females
0 10 20 30 40 50 60 70 80 90
0 10 20 30 40 50 60 70 80 90
人口10万対 Rate per 100,000
18
最新がん統計 C
an
cer S
tatistic
s Up
date
5 都道府県別75歳未満がん年齢調整死亡率(2016年)Age-adjusted Cancer Mortality Rate under Age 75 by Prefectures (2016)
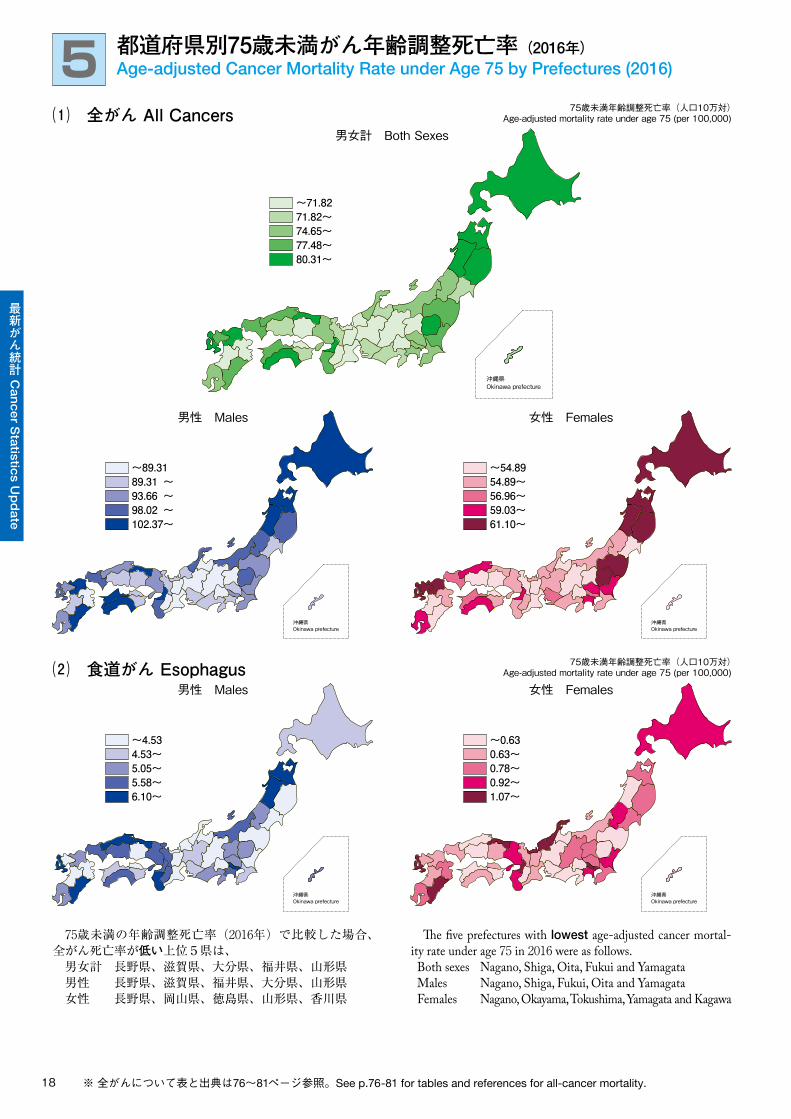
75歳未満の年齢調整死亡率(2016年)で比較した場合、全がん死亡率が低い上位5県は、 男女計 長野県、滋賀県、大分県、福井県、山形県 男性 長野県、滋賀県、福井県、大分県、山形県 女性 長野県、岡山県、徳島県、山形県、香川県
�e �ve prefectures with lowest age-adjusted cancer mortal-ity rate under age 75 in 2016 were as follows. Both sexes Nagano, Shiga, Oita, Fukui and Yamagata Males Nagano, Shiga, Fukui, Oita and Yamagata Females Nagano, Okayama, Tokushima, Yamagata and Kagawa
※ 全がんについて表と出典は76~81ページ参照。See p.76-81 for tables and references for all-cancer mortality.
沖縄県Okinawa prefecture
沖縄県Okinawa prefecture
沖縄県Okinawa prefecture
沖縄県Okinawa prefecture
沖縄県Okinawa prefecture
~89.3189.31 ~93.66 ~98.02 ~102.37~
~4.534.53~5.05~5.58~6.10~
~54.8954.89~56.96~59.03~61.10~
~0.630.63~0.78~0.92~1.07~
~71.8271.82~74.65~77.48~80.31~
⑴ 全がん All Cancers男女計 Both Sexes
女性 Females男性 Males
⑵ 食道がん Esophagus女性 Females男性 Males
75歳未満年齢調整死亡率(人口10万対)Age-adjusted mortality rate under age 75 (per 100,000)
75歳未満年齢調整死亡率(人口10万対)Age-adjusted mortality rate under age 75 (per 100,000)
19
最新がん統計 C
an
cer S
tatistic
s Up
date
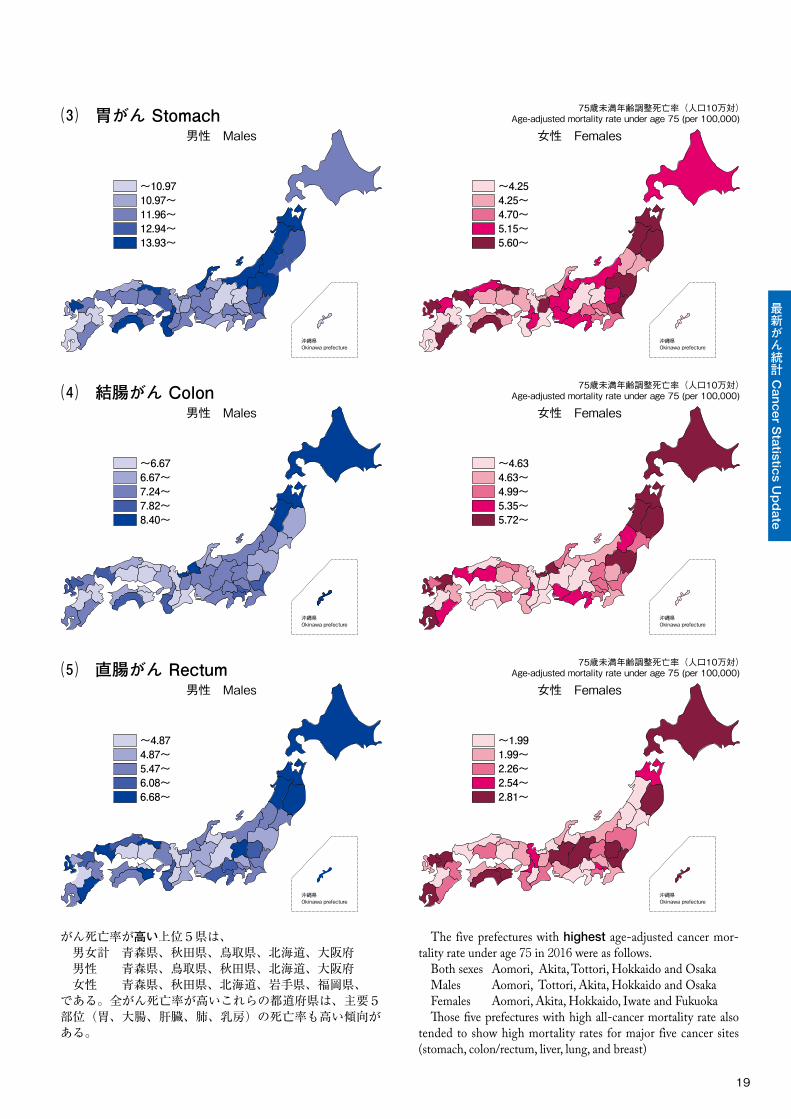
がん死亡率が高い上位5県は、 男女計 青森県、秋田県、鳥取県、北海道、大阪府 男性 青森県、鳥取県、秋田県、北海道、大阪府 女性 青森県、秋田県、北海道、岩手県、福岡県、である。全がん死亡率が高いこれらの都道府県は、主要5部位(胃、大腸、肝臓、肺、乳房)の死亡率も高い傾向がある。
The five prefectures with highest age-adjusted cancer mor-tality rate under age 75 in 2016 were as follows. Both sexes Aomori, Akita, Tottori, Hokkaido and Osaka Males Aomori, Tottori, Akita, Hokkaido and Osaka Females Aomori, Akita, Hokkaido, Iwate and Fukuoka �ose �ve prefectures with high all-cancer mortality rate also tended to show high mortality rates for major five cancer sites (stomach, colon/rectum, liver, lung, and breast)
沖縄県Okinawa prefecture
沖縄県Okinawa prefecture
沖縄県Okinawa prefecture
~10.9710.97~11.96~12.94~13.93~
~4.254.25~4.70~5.15~5.60~
~6.676.67~7.24~7.82~8.40~
⑷ 結腸がん Colon男性 Males
⑶ 胃がん Stomach女性 Females男性 Males
75歳未満年齢調整死亡率(人口10万対)Age-adjusted mortality rate under age 75 (per 100,000)
沖縄県Okinawa prefecture
沖縄県Okinawa prefecture
沖縄県Okinawa prefecture
~4.634.63~4.99~5.35~5.72~
~4.874.87~5.47~6.08~6.68~
~1.991.99~2.26~2.54~2.81~
女性 Females
⑸ 直腸がん Rectum女性 Females男性 Males
75歳未満年齢調整死亡率(人口10万対)Age-adjusted mortality rate under age 75 (per 100,000)
75歳未満年齢調整死亡率(人口10万対)Age-adjusted mortality rate under age 75 (per 100,000)

20
最新がん統計 C
an
cer S
tatistic
s Up
date
部位別で死亡率の地域差が明らかな部位は、[胃がん] 男女とも東北地方の日本海側で死亡率が高い。[肝臓がん] 男女とも西日本で死亡率が高い。これは、西日本でC型肝炎ウィルスの感染者割合が高いことに関連している。
Geographic patterns of site-speci�c cancer mortality were as follows.[Stomach]Higher mortality rate for both sexes was seen in the Western part of Tohoku district.[Liver]Higher mortality rate for both sexes was seen in West-ern Japan. �is is associated with higher prevalence of hepatitis C virus infection in Western Japan.
沖縄県Okinawa prefecture
沖縄県Okinawa prefecture
~6.786.78~7.72~8.66~9.60~
~1.761.76~2.04~2.33~2.61~
⑹ 肝臓がん Liver女性 Females男性 Males
Age-adjusted mortality rate under age 75 (per 100,000)75歳未満年齢調整死亡率(人口10万対)
沖縄県Okinawa prefecture
沖縄県Okinawa prefecture
~2.352.35~2.66~2.97~3.28~
~1.451.45~1.65~1.84~2.04~
⑺ 胆のう・胆管がん Gallbladder and Bile Ducts女性 Females男性 Males
Age-adjusted mortality rate under age 75 (per 100,000)75歳未満年齢調整死亡率(人口10万対)
沖縄県Okinawa prefecture
沖縄県Okinawa prefecture
~7.847.84~8.44~9.03~9.62~
~4.584.58~4.95~5.32~5.69~
⑻ 膵臓がん Pancreas女性 Females男性 Males
75歳未満年齢調整死亡率(人口10万対)Age-adjusted mortality rate under age 75 (per 100,000)
75歳未満年齢調整死亡率(人口10万対)Age-adjusted mortality rate under age 75 (per 100,000)
21
最新がん統計 C
an
cer S
tatistic
s Up
date
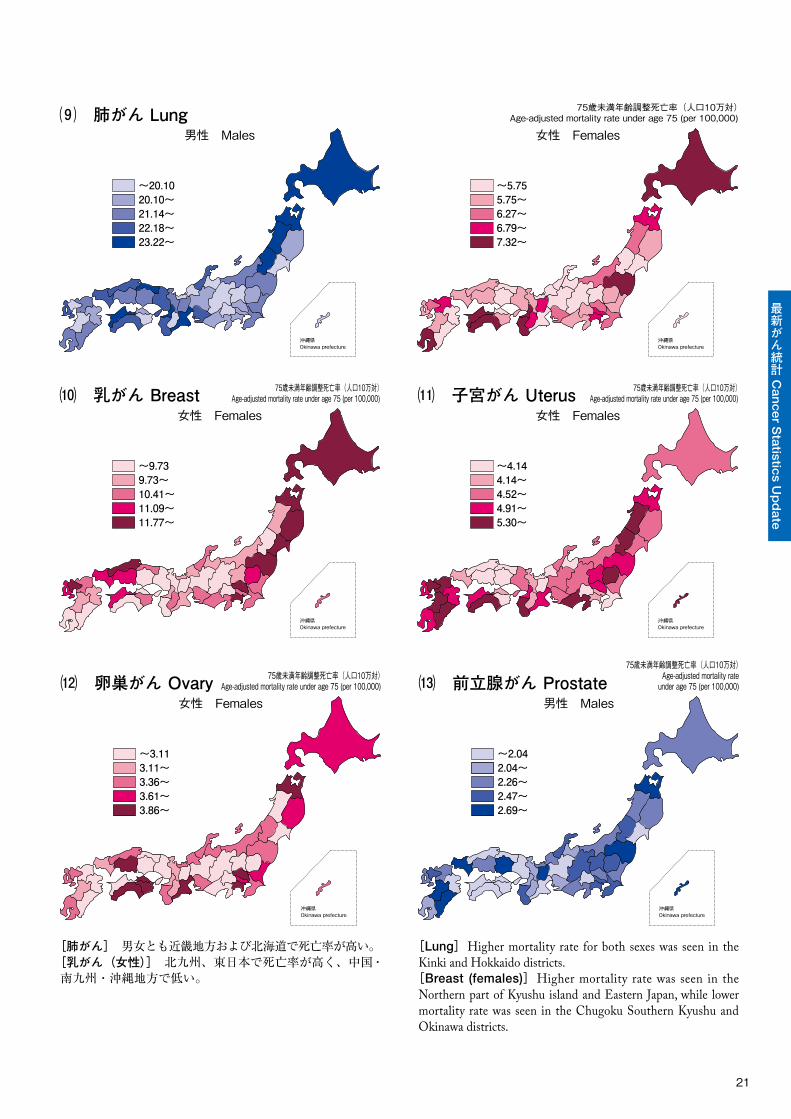
[肺がん] 男女とも近畿地方および北海道で死亡率が高い。[乳がん(女性)] 北九州、東日本で死亡率が高く、中国・南九州・沖縄地方で低い。
[Lung]Higher mortality rate for both sexes was seen in the Kinki and Hokkaido districts.[Breast (females)]Higher mortality rate was seen in the Northern part of Kyushu island and Eastern Japan, while lower mortality rate was seen in the Chugoku Southern Kyushu and Okinawa districts.
沖縄県Okinawa prefecture
沖縄県Okinawa prefecture
~20.1020.10~21.14~22.18~23.22~
~5.755.75~6.27~6.79~7.32~
⑼ 肺がん Lung女性 Females男性 Males
75歳未満年齢調整死亡率(人口10万対)Age-adjusted mortality rate under age 75 (per 100,000)
沖縄県Okinawa prefecture
沖縄県Okinawa prefecture
~4.144.14~4.52~4.91~5.30~
~9.739.73~10.41~11.09~11.77~
⑽ 乳がん Breast ⑾ 子宮がん Uterus 75歳未満年齢調整死亡率(人口10万対)Age-adjusted mortality rate under age 75 (per 100,000)
女性 Females女性 Females
75歳未満年齢調整死亡率(人口10万対)Age-adjusted mortality rate under age 75 (per 100,000)
沖縄県Okinawa prefecture
沖縄県Okinawa prefecture
~2.042.04~2.26~2.47~2.69~
~3.113.11~3.36~3.61~3.86~
男性 Males女性 Females⑿ 卵巣がん Ovary ⒀ 前立腺がん Prostate75歳未満年齢調整死亡率(人口10万対)
Age-adjusted mortality rate under age 75 (per 100,000)
75歳未満年齢調整死亡率(人口10万対)Age-adjusted mortality rate
under age 75 (per 100,000)
22
最新がん統計 C
an
cer S
tatistic
s Up
date
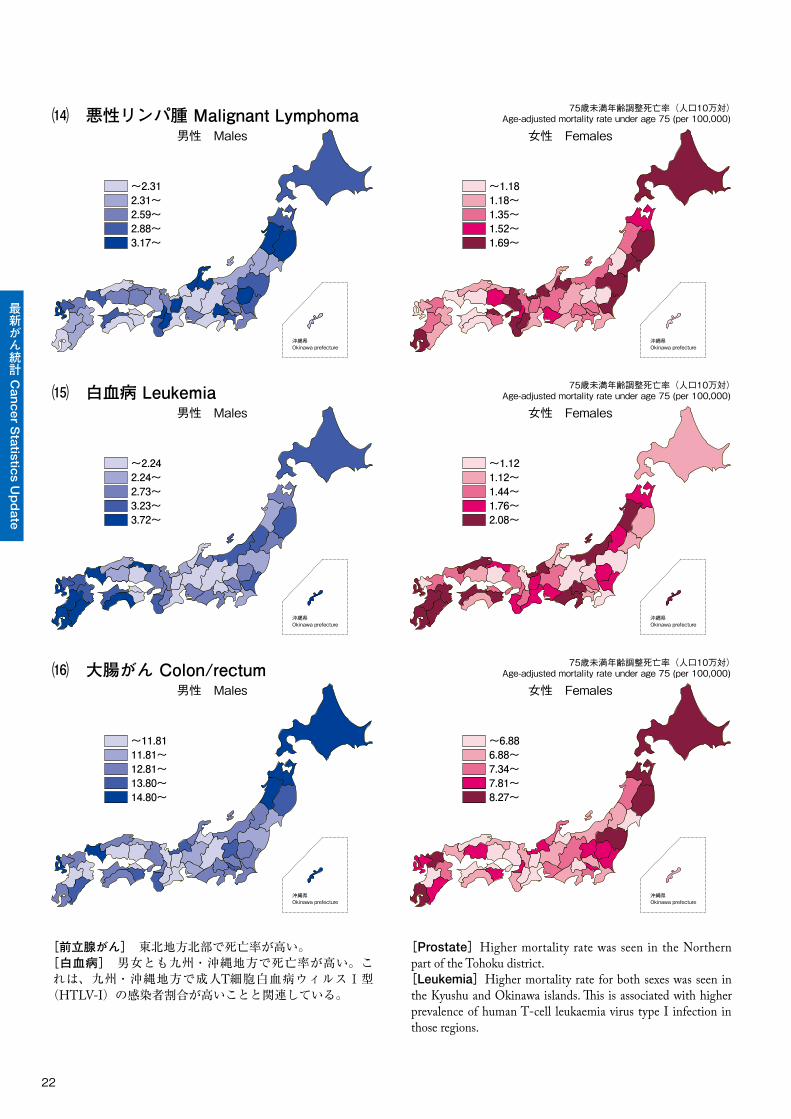
[前立腺がん] 東北地方北部で死亡率が高い。[白血病] 男女とも九州・沖縄地方で死亡率が高い。こ れは、九州・沖縄地方で成人T細胞白血病ウィルスⅠ型
(HTLV-I)の感染者割合が高いことと関連している。
[Prostate]Higher mortality rate was seen in the Northern part of the Tohoku district.[Leukemia]Higher mortality rate for both sexes was seen in the Kyushu and Okinawa islands. �is is associated with higher prevalence of human T-cell leukaemia virus type I infection in those regions.
沖縄県Okinawa prefecture
沖縄県Okinawa prefecture
沖縄県Okinawa prefecture
沖縄県Okinawa prefecture
~2.312.31~2.59~2.88~3.17~
~1.181.18~1.35~1.52~1.69~
~1.121.12~1.44~1.76~2.08~
~2.242.24~2.73~3.23~3.72~
⒁ 悪性リンパ腫 Malignant Lymphoma女性 Females男性 Males
⒂ 白血病 Leukemia女性 Females男性 Males
75歳未満年齢調整死亡率(人口10万対)Age-adjusted mortality rate under age 75 (per 100,000)
75歳未満年齢調整死亡率(人口10万対)Age-adjusted mortality rate under age 75 (per 100,000)
沖縄県Okinawa prefecture
沖縄県Okinawa prefecture
~11.8111.81~12.81~13.80~14.80~
~6.886.88~7.34~7.81~8.27~
⒃ 大腸がん Colon/rectum女性 Females男性 Males
75歳未満年齢調整死亡率(人口10万対)Age-adjusted mortality rate under age 75 (per 100,000)
23
最新がん統計 C
an
cer S
tatistic
s Up
date
6 部位別がん罹患数(2013年)Number of Incidence by Cancer Site (2013)
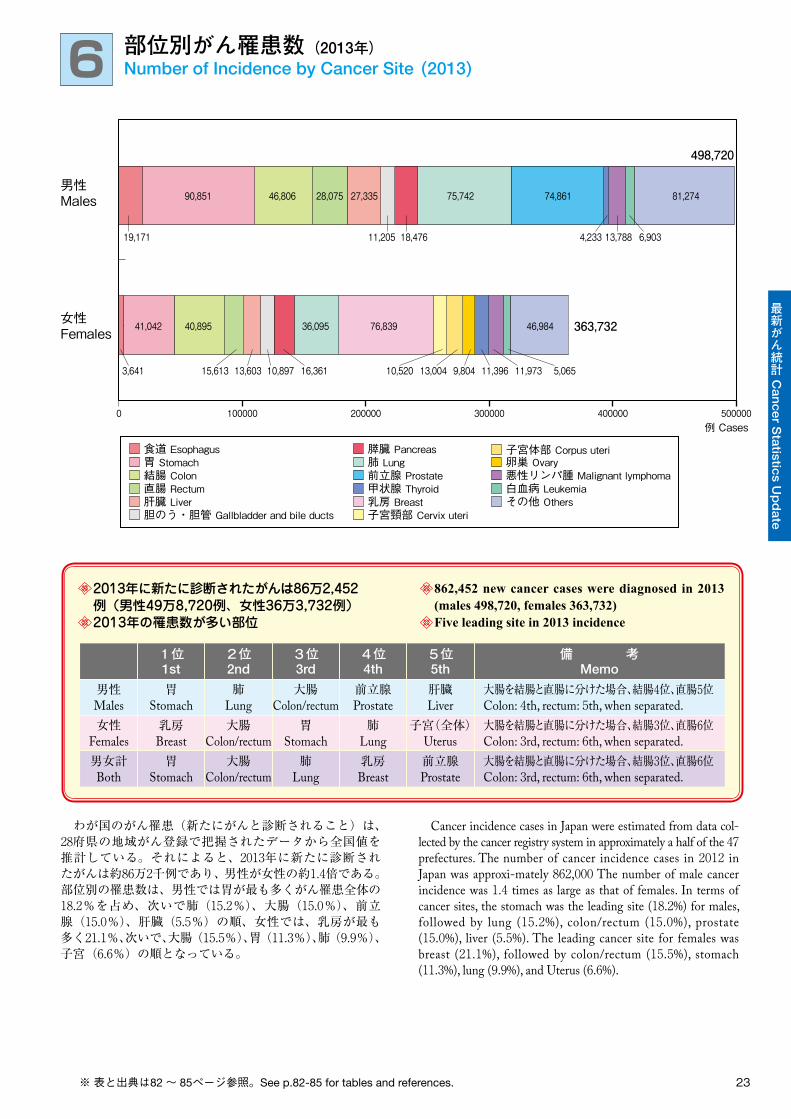
わが国のがん罹患(新たにがんと診断されること)は、28府県の地域がん登録で把握されたデータから全国値を推計している。それによると、2013年に新たに診断され たがんは約86万2千例であり、男性が女性の約1.4倍である。部位別の罹患数は、男性では胃が最も多くがん罹患全体の18.2%を占め、次いで肺(15.2%)、大腸(15.0%)、前立腺(15.0%)、肝臓(5.5%)の順、女性では、乳房が最も多く21.1%、次いで、大腸(15.5%)、胃(11.3%)、肺(9.9%)、子宮(6.6%)の順となっている。
Cancer incidence cases in Japan were estimated from data col-lected by the cancer registry system in approximately a half of the 47 prefectures. The number of cancer incidence cases in 2012 in Japan was approxi-mately 862,000 The number of male cancer incidence was 1.4 times as large as that of females. In terms of cancer sites, the stomach was the leading site (18.2%) for males, followed by lung (15.2%), colon/rectum (15.0%), prostate (15.0%), liver (5.5%). The leading cancer site for females was breast (21.1%), followed by colon/rectum (15.5%), stomach (11.3%), lung (9.9%), and Uterus (6.6%).
2013年に新たに診断されたがんは86万2,452例(男性49万8,720例、女性36万3,732例)2013年の罹患数が多い部位
862,452 new cancer cases were diagnosed in 2013 (males 498,720, females 363,732)Five leading site in 2013 incidence
1位1st
2位2nd
3位3rd
4位4th
5位5th
備 考Memo
男性Males
胃Stomach
肺Lung
大腸Colon/rectum
前立腺Prostate
肝臓Liver
大腸を結腸と直腸に分けた場合、結腸4位、直腸5位Colon: 4th, rectum: 5th, when separated.
女性Females
乳房Breast
大腸Colon/rectum
胃Stomach
肺Lung
子宮(全体)Uterus
大腸を結腸と直腸に分けた場合、結腸3位、直腸6位Colon: 3rd, rectum: 6th, when separated.
男女計Both
胃Stomach
大腸Colon/rectum
肺Lung
乳房Breast
前立腺Prostate
大腸を結腸と直腸に分けた場合、結腸3位、直腸6位Colon: 3rd, rectum: 6th, when separated.
※ 表と出典は82~ 85ページ参照。See p.82-85 for tables and references.
食道 Esophagus 胃 Stomach 結腸 Colon 直腸 Rectum 肝臓 Liver 胆のう・胆管 Gallbladder and bile ducts
膵臓 Pancreas 肺 Lung 卵巣 Ovary
悪性リンパ腫 Malignant lymphoma 白血病 Leukemia その他 Others
前立腺 Prostate 甲状腺 Thyroid 乳房 Breast 子宮頸部 Cervix uteri
子宮体部 Corpus uteri
女性Females
男性Males
例 Cases0 100000 200000 300000 400000 500000
90,851
41,042 40,895 36,095 76,839 46,984 363,732
46,806 28,075 27,335 75,742 74,861 81,274
19,171
3,641 13,603 10,897 16,36115,613 10,520 13,004 9,804 11,396 11,973 5,065
11,205 18,476 13,7884,233 6,903
498,720

24
最新がん統計 C
an
cer S
tatistic
s Up
date
7 年齢階級別がん罹患 部位内訳(2013年)Cancer Incidence by Age Group, Site Distribution (2013)
がん罹患の部位内訳を年齢階級別に見ると、男性では、40歳以上で胃、大腸、肝臓などの消化器系のがんが5~6割を占め、70歳以上では肺がんと前立腺がんの割合が大きくなる。女性では、40歳代で乳がんが約50%、子宮がんと卵巣がんが合わせて約20%を占めるが、高齢になるほどそれらの割合は小さくなり、消化器系(胃、大腸、肝臓など)と肺がんの割合が大きくなる。男性の39歳以下では、40歳以上に比べて、消化器系および肺がんの占める割合が小さく、白血病の占める割合が大きい。女性の39歳以下では、40歳以上に比べて、子宮頸部の割合が大きい。
�e site distribution of cancer incidence varied across age groups. For males aged 40 years or older, cancer of the intestine (stomach, colon/rectum, liver etc.) accounted for 50-60% of cancer incidence, and the proportion of lung and prostate cancer was large among 70 years or older. For females aged 40-49 years old, approximately half of cancer incidence cases were accounted for by cancer of the breast, and approximately 20% were accounted for by uterus and ovary. �e proportion of those three sites decreased with age and the proportion of intestine (e.g. stomach, colon/rectum, liver) and lung increased instead. For males under age 40, the propor-tion of intestine and lung was smaller and the proportion of leu-kaemia was larger, as compared with 40 years or older age groups.For females under age 40, the proportion of cervix uteri was greater than that of females aged 40 years or older.
※ 表と出典は82~ 85ページ参照。See p.82-85 for tables and references.
肝臓 Liver
白血病 Leukemia
0% 20% 40% 60% 80% 100%
85-
80-84
75-79
70-74
65-69
60-64
55-59
50-54
45-49
40-44
0-14
15-39
男性Males
脳・中枢神経系 Brain, nervous system
悪性リンパ腫 Malignant lymphoma
その他 Others
腎など Kidney and other urinary organs
大腸 Colon/rectum
結腸 Colon 直腸 Rectum
肝臓 Liver
胆のう・胆管Gallbladder and bile ducts
膵臓 Pancreas 肺 Lung 前立腺 Prostate
悪性リンパ腫Malignantlymphoma
白血病 Leukemia
その他 Others 胃 Stomach 食道 Esophagus
甲状腺 Thyroid
肺 Lung
白血病 Leukemia 0% 20% 40% 60% 80% 100%
85-
80-84
75-79
70-74
65-69
60-64
55-59
50-54
45-49
40-44
0-14
15-39
歳 age
女性Females
悪性リンパ腫 Malignant lymphoma その他 Others
甲状腺 Thyroid
腎など Kidney and other urinary organs
食道 Esophagus 胃 Stomach 結腸 Colon
直腸 Rectum 肝臓 Liver
胆のう・胆管Gallbladder and bile ducts
膵臓 Pancreas 肺 Lung
悪性リンパ腫Malignantlymphoma 白血病 Leukemia
その他 Others
卵巣 Ovary子宮uteri乳房
Breast
脳・中枢神経系 Brain, nervous system 肝臓 Liver
肺 Lung
大腸 Colon/rectum
25
最新がん統計 C
an
cer S
tatistic
s Up
date
8 部位別がん粗罹患率(2013年)Incidence Rate by Cancer Site (2013)
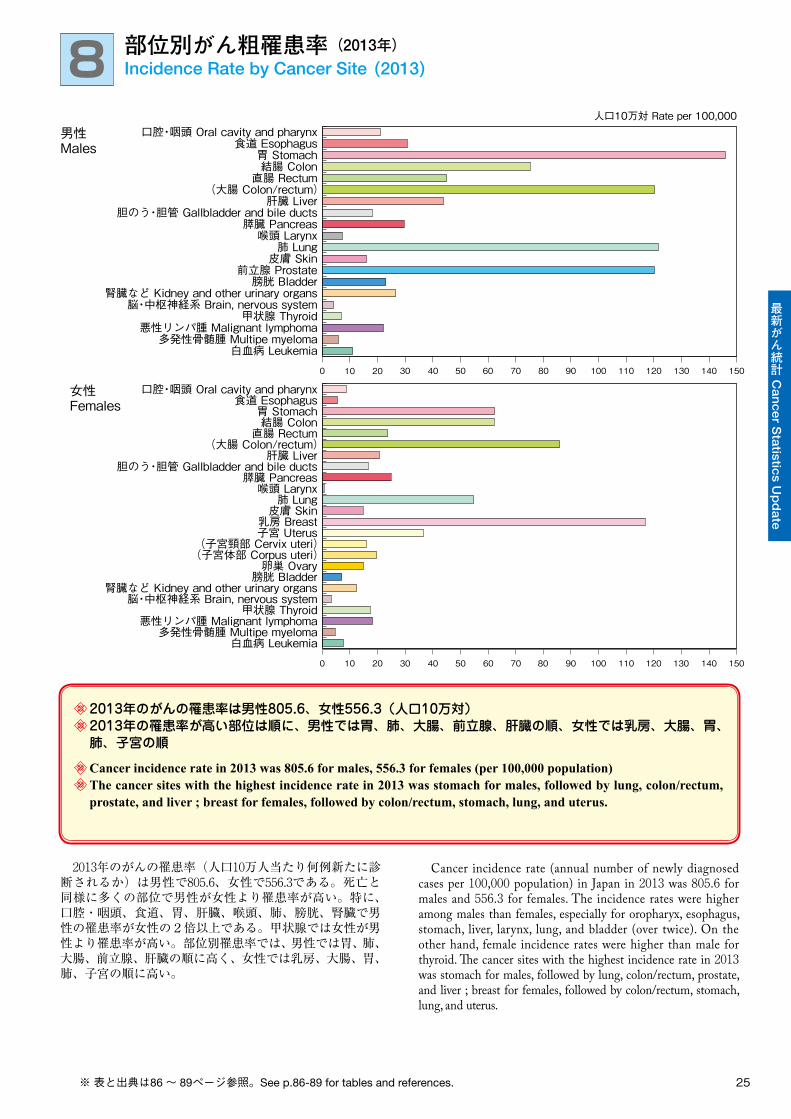
2013年のがんの罹患率(人口10万人当たり何例新たに診断されるか)は男性で805.6、女性で556.3である。死亡と同様に多くの部位で男性が女性より罹患率が高い。特に、口腔・咽頭、食道、胃、肝臓、喉頭、肺、膀胱、腎臓で男性の罹患率が女性の2倍以上である。甲状腺では女性が男性より罹患率が高い。部位別罹患率では、男性では胃、肺、大腸、前立腺、肝臓の順に高く、女性では乳房、大腸、胃、肺、子宮の順に高い。
Cancer incidence rate (annual number of newly diagnosed cases per 100,000 population) in Japan in 2013 was 805.6 for males and 556.3 for females. The incidence rates were higher among males than females, especially for oropharyx, esophagus, stomach, liver, larynx, lung, and bladder (over twice). On the other hand, female incidence rates were higher than male for thyroid. �e cancer sites with the highest incidence rate in 2013 was stomach for males, followed by lung, colon/rectum, prostate, and liver ; breast for females, followed by colon/rectum, stomach, lung, and uterus.
2013年のがんの罹患率は男性805.6、女性556.3(人口10万対)2013年の罹患率が高い部位は順に、男性では胃、肺、大腸、前立腺、肝臓の順、女性では乳房、大腸、胃、肺、子宮の順
Cancer incidence rate in 2013 was 805.6 for males, 556.3 for females (per 100,000 population)The cancer sites with the highest incidence rate in 2013 was stomach for males, followed by lung, colon/rectum, prostate, and liver ; breast for females, followed by colon/rectum, stomach, lung, and uterus.
※ 表と出典は86~ 89ページ参照。See p.86-89 for tables and references.
0 10 20 30 40 50 60 70 80 90 100 110 120 130 140 150
0 10 20 30 40 50 60 70 80 90 100 110 120 130 140 150
白血病 Leukemia多発性骨髄腫 Multipe myeloma
悪性リンパ腫 Malignant lymphoma甲状腺 Thyroid
脳・中枢神経系 Brain, nervous system腎臓など Kidney and other urinary organs
膀胱 Bladder前立腺 Prostate
皮膚 Skin肺 Lung
喉頭 Larynx膵臓 Pancreas
胆のう・胆管 Gallbladder and bile ducts肝臓 Liver
直腸 Rectum結腸 Colon
胃 Stomach食道 Esophagus
口腔・咽頭 Oral cavity and pharynx
(大腸 Colon/rectum)
白血病 Leukemia多発性骨髄腫 Multipe myeloma
悪性リンパ腫 Malignant lymphoma甲状腺 Thyroid
脳・中枢神経系 Brain, nervous system腎臓など Kidney and other urinary organs
膀胱 Bladder
乳房 Breast皮膚 Skin
肺 Lung喉頭 Larynx
膵臓 Pancreas胆のう・胆管 Gallbladder and bile ducts
肝臓 Liver
直腸 Rectum結腸 Colon
胃 Stomach食道 Esophagus
口腔・咽頭 Oral cavity and pharynx
卵巣 Ovary
子宮 Uterus(子宮頸部 Cervix uteri)
(子宮体部 Corpus uteri)
(大腸 Colon/rectum)
人口10万対 Rate per 100,000
男性Males
女性Females
26
最新がん統計 C
an
cer S
tatistic
s Up
date
9 地域がん登録における5年生存率(2006~2008年診断例)5-year Survival Rate, Data from Population-based Cancer Registries(Diagnosed in 2006-2008)
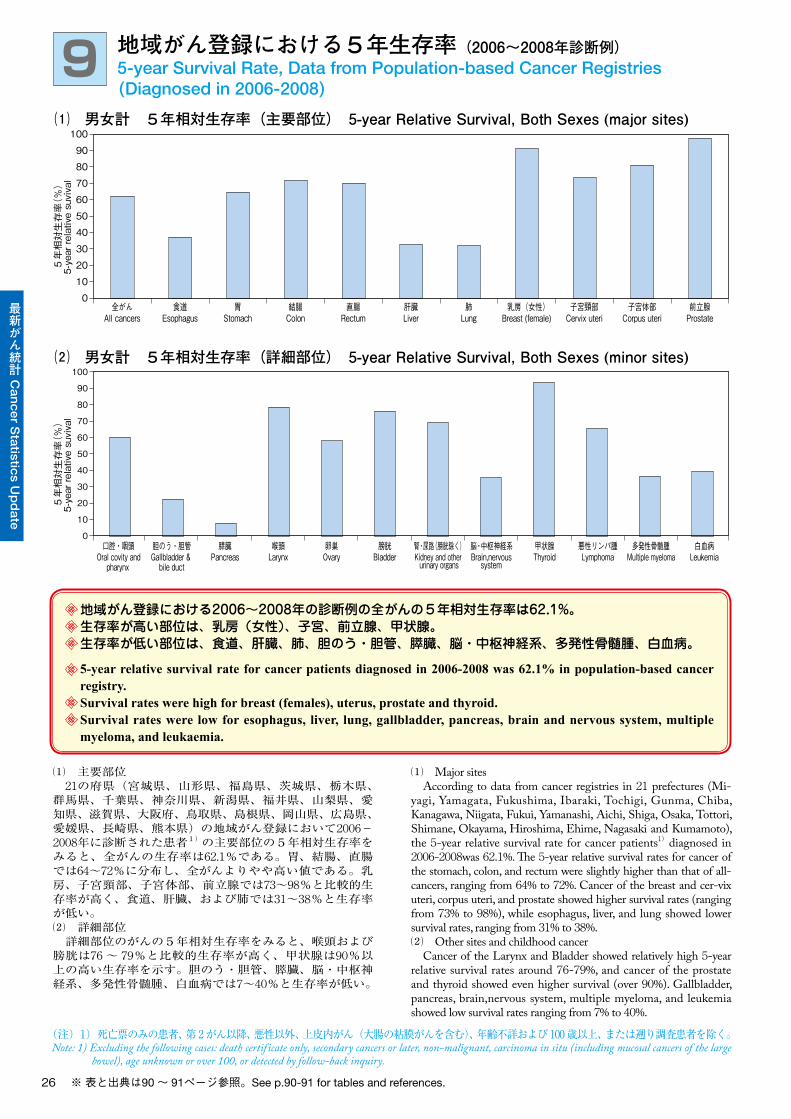
⑴ 主要部位 21の府県(宮城県、山形県、福島県、茨城県、栃木県、群馬県、千葉県、神奈川県、新潟県、福井県、山梨県、愛知県、滋賀県、大阪府、鳥取県、島根県、岡山県、広島県、愛媛県、長崎県、熊本県)の地域がん登録において2006-2008年に診断された患者1)の主要部位の5年相対生存率をみると、全がんの生存率は62.1%である。胃、結腸、直腸では64~72%に分布し、全がんよりやや高い値である。乳房、子宮頸部、子宮体部、前立腺では73~98%と比較的生存率が高く、食道、肝臓、および肺では31~38%と生存率が低い。⑵ 詳細部位 詳細部位のがんの5年相対生存率をみると、喉頭および膀胱は76~ 79%と比較的生存率が高く、甲状腺は90%以上の高い生存率を示す。胆のう・胆管、膵臓、脳・中枢神経系、多発性骨髄腫、白血病では7~40%と生存率が低い。
⑴ Major sites According to data from cancer registries in 21 prefectures (Mi-yagi, Yamagata, Fukushima, Ibaraki, Tochigi, Gunma, Chiba, Kanagawa, Niigata, Fukui, Yamanashi, Aichi, Shiga, Osaka, Tottori, Shimane, Okayama, Hiroshima, Ehime, Nagasaki and Kumamoto), the 5-year relative survival rate for cancer patients1) diagnosed in 2006-2008was 62.1%. �e 5-year relative survival rates for cancer of the stomach, colon, and rectum were slightly higher than that of all-cancers, ranging from 64% to 72%. Cancer of the breast and cer-vix uteri, corpus uteri, and prostate showed higher survival rates (ranging from 73% to 98%), while esophagus, liver, and lung showed lower survival rates, ranging from 31% to 38%.⑵ Other sites and childhood cancer Cancer of the Larynx and Bladder showed relatively high 5-year relative survival rates around 76-79%, and cancer of the prostate and thyroid showed even higher survival (over 90%). Gallbladder, pancreas, brain,nervous system, multiple myeloma, and leukemia showed low survival rates ranging from 7% to 40%.
※ 表と出典は90~ 91ページ参照。See p.90-91 for tables and references.
(注)1)死亡票のみの患者、第2がん以降、悪性以外、上皮内がん(大腸の粘膜がんを含む)、年齢不詳および100歳以上、または遡り調査患者を除く。Note: 1) Excluding the following cases: death certif icate only, secondary cancers or later, non-malignant, carcinoma in situ (including mucosal cancers of the large
bowel), age unknown or over 100, or detected by follow-back inquiry.
地域がん登録における2006~2008年の診断例の全がんの5年相対生存率は62.1%。生存率が高い部位は、乳房(女性)、子宮、前立腺、甲状腺。生存率が低い部位は、食道、肝臓、肺、胆のう・胆管、膵臓、脳・中枢神経系、多発性骨髄腫、白血病。
5-year relative survival rate for cancer patients diagnosed in 2006-2008 was 62.1% in population-based cancer registry.Survival rates were high for breast (females), uterus, prostate and thyroid.Survival rates were low for esophagus, liver, lung, gallbladder, pancreas, brain and nervous system, multiple myeloma, and leukaemia.
0
10
20
30
40
50
60
70
80
90
100
5-ye
ar re
lativ
e su
viva
l5-
year
rela
tive
suvi
val
0
10
20
30
40
50
60
70
80
90
100
⑴ 男女計 5年相対生存率(主要部位) 5-year Relative Survival, Both Sexes (major sites)
⑵ 男女計 5年相対生存率(詳細部位) 5-year Relative Survival, Both Sexes (minor sites)
All cancers Esophagus Stomach Colon Rectum Liver Lung Breast (female) Cervix uteri Corpus uteri Prostate
Oral covity andpharynx
Gallbladder & bile duct
Pancreas Larynx Ovary Bladder Kidney and other urinary organs
Brain,nervoussystem
Thyroid Lymphoma Multiple myeloma Leukemia
全がん 食道 胃 結腸 直腸 肝臓 肺 乳房(女性) 子宮頸部 子宮体部 前立腺
口腔・咽頭 胆のう・胆管 膵臓 喉頭 卵巣 膀胱 腎・尿路(膀胱除く) 脳・中枢神経系 甲状腺 悪性リンパ腫 多発性骨髄腫 白血病
5年
相対
生存
率(%
)5
年相
対生
存率(
%)
27
最新がん統計 C
an
cer S
tatistic
s Up
date
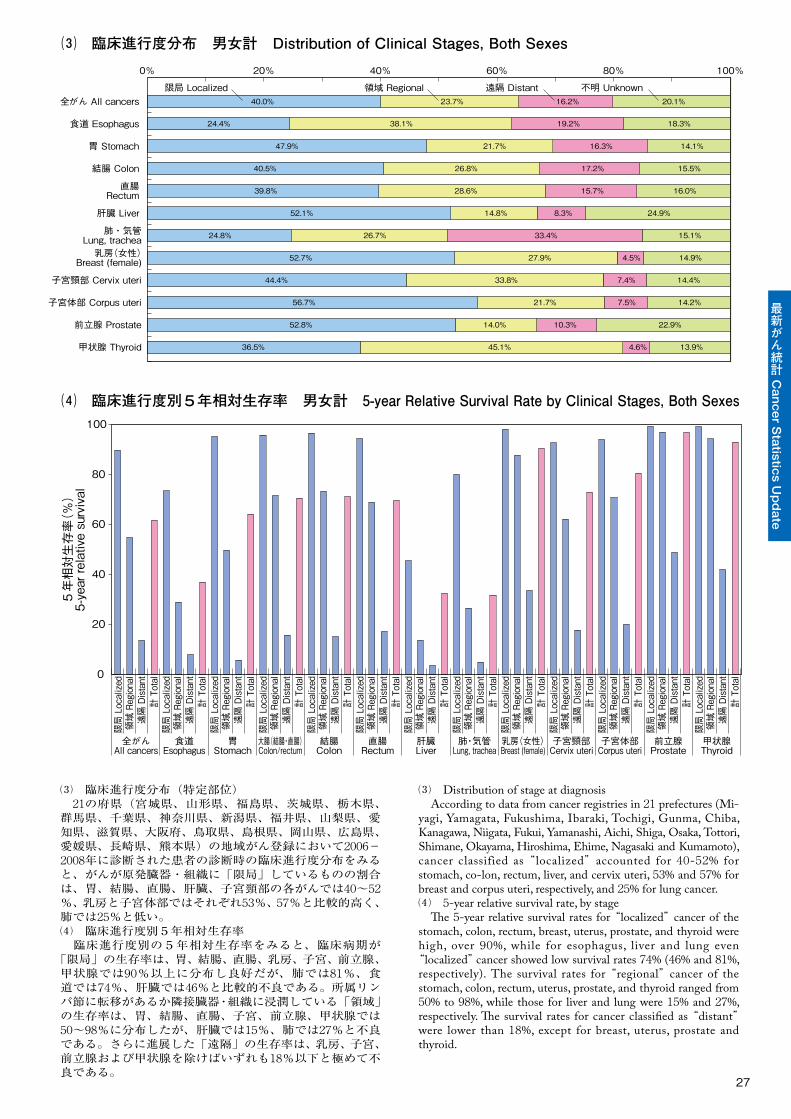
⑶ 臨床進行度分布(特定部位) 21の府県(宮城県、山形県、福島県、茨城県、栃木県、群馬県、千葉県、神奈川県、新潟県、福井県、山梨県、愛知県、滋賀県、大阪府、鳥取県、島根県、岡山県、広島県、愛媛県、長崎県、熊本県)の地域がん登録において2006-2008年に診断された患者の診断時の臨床進行度分布をみると、がんが原発臓器・組織に「限局」しているものの割合は、胃、結腸、直腸、肝臓、子宮頸部の各がんでは40~52%、乳房と子宮体部ではそれぞれ53%、57%と比較的高く、肺では25%と低い。⑷ 臨床進行度別5年相対生存率 臨床進行度別の5年相対生存率をみると、臨床病期が
「限局」の生存率は、胃、結腸、直腸、乳房、子宮、前立腺、甲状腺では90%以上に分布し良好だが、肺では81%、食道では74%、肝臓では46%と比較的不良である。所属リンパ節に転移があるか隣接臓器・組織に浸潤している「領域」の生存率は、胃、結腸、直腸、子宮、前立腺、甲状腺では50~98%に分布したが、肝臓では15%、肺では27%と不良である。さらに進展した「遠隔」の生存率は、乳房、子宮、前立腺および甲状腺を除けばいずれも18%以下と極めて不良である。
⑶ Distribution of stage at diagnosis According to data from cancer registries in 21 prefectures (Mi-yagi, Yamagata, Fukushima, Ibaraki, Tochigi, Gunma, Chiba, Kanagawa, Niigata, Fukui, Yamanashi, Aichi, Shiga, Osaka, Tottori, Shimane, Okayama, Hiroshima, Ehime, Nagasaki and Kumamoto), cancer classified as “localized” accounted for 40-52% for stomach, co-lon, rectum, liver, and cervix uteri, 53% and 57% for breast and corpus uteri, respectively, and 25% for lung cancer.⑷ 5-year relative survival rate, by stage �e 5-year relative survival rates for “localized” cancer of the stomach, colon, rectum, breast, uterus, prostate, and thyroid were high, over 90%, while for esophagus, liver and lung even
“localized” cancer showed low survival rates 74% (46% and 81%, respectively). The survival rates for “regional” cancer of the stomach, colon, rectum, uterus, prostate, and thyroid ranged from 50% to 98%, while those for liver and lung were 15% and 27%, respectively. �e survival rates for cancer classi�ed as “distant” were lower than 18%, except for breast, uterus, prostate and thyroid.
36.5%
52.8%
56.7%
44.4%
52.7%
24.8%
52.1%
39.8%
40.5%
47.9%
24.4%
40.0%
45.1%
14.0%
21.7%
33.8%
27.9%
26.7%
14.8%
28.6%
26.8%
21.7%
38.1%
23.7%
4.6%
10.3%
7.5%
7.4%
4.5%
33.4%
8.3%
15.7%
17.2%
16.3%
19.2%
16.2%
13.9%
22.9%
14.2%
14.4%
14.9%
15.1%
24.9%
16.0%
15.5%
14.1%
18.3%
20.1%
限局 Localized 領域 Regional 遠隔 Distant 不明 Unknown
0
20
40
60
80
100
5年
相対
生存
率(%
)5-
year
rela
tive
surv
ival
限局
Loc
aliz
ed領
域 R
egio
nal
遠隔
Dis
tant
計 T
otal
0% 20% 40% 60% 80% 100%
結腸 Colon
直腸 Rectum
肝臓 Liver
肺・気管 Lung, trachea
乳房(女性) Breast (female)
子宮頸部 Cervix uteri
子宮体部 Corpus uteri
前立腺 Prostate
甲状腺 Thyroid
⑶ 臨床進行度分布 男女計 Distribution of Clinical Stages, Both Sexes
⑷ 臨床進行度別5年相対生存率 男女計 5-year Relative Survival Rate by Clinical Stages, Both Sexes
全がん All cancers
胃 Stomach
食道 Esophagus
全がんAll cancers
限局
Loc
aliz
ed領
域 R
egio
nal
遠隔
Dis
tant
計 T
otal
限局
Loc
aliz
ed領
域 R
egio
nal
遠隔
Dis
tant
計 T
otal
限局
Loc
aliz
ed領
域 R
egio
nal
遠隔
Dis
tant
計 T
otal
限局
Loc
aliz
ed領
域 R
egio
nal
遠隔
Dis
tant
計 T
otal
胃Stomach
結腸Colon
限局
Loc
aliz
ed領
域 R
egio
nal
遠隔
Dis
tant
計 T
otal
直腸Rectum
限局
Loc
aliz
ed領
域 R
egio
nal
遠隔
Dis
tant
計 T
otal
肺・気管Lung, trachea
限局
Loc
aliz
ed領
域 R
egio
nal
遠隔
Dis
tant
計 T
otal
乳房(女性)Breast (female)
限局
Loc
aliz
ed領
域 R
egio
nal
遠隔
Dis
tant
計 T
otal
子宮頸部Cervix uteri
限局
Loc
aliz
ed領
域 R
egio
nal
遠隔
Dis
tant
計 T
otal
子宮体部Corpus uteri
限局
Loc
aliz
ed領
域 R
egio
nal
遠隔
Dis
tant
計 T
otal
前立腺Prostate
限局
Loc
aliz
ed領
域 R
egio
nal
遠隔
Dis
tant
計 T
otal
甲状腺Thyroid
限局
Loc
aliz
ed領
域 R
egio
nal
遠隔
Dis
tant
計 T
otal
肝臓Liver
食道Esophagus
大腸(結腸・直腸)Colon/rectum
28
最新がん統計 C
an
cer S
tatistic
s Up
date
10 がん診療連携拠点病院における5年生存率(2008年診断例)5-year Survival at the Designated Cancer Care Hospitals (Diagnosed in 2008)
※ 表と出典は92ページ参照。See p.92 for tables and references.
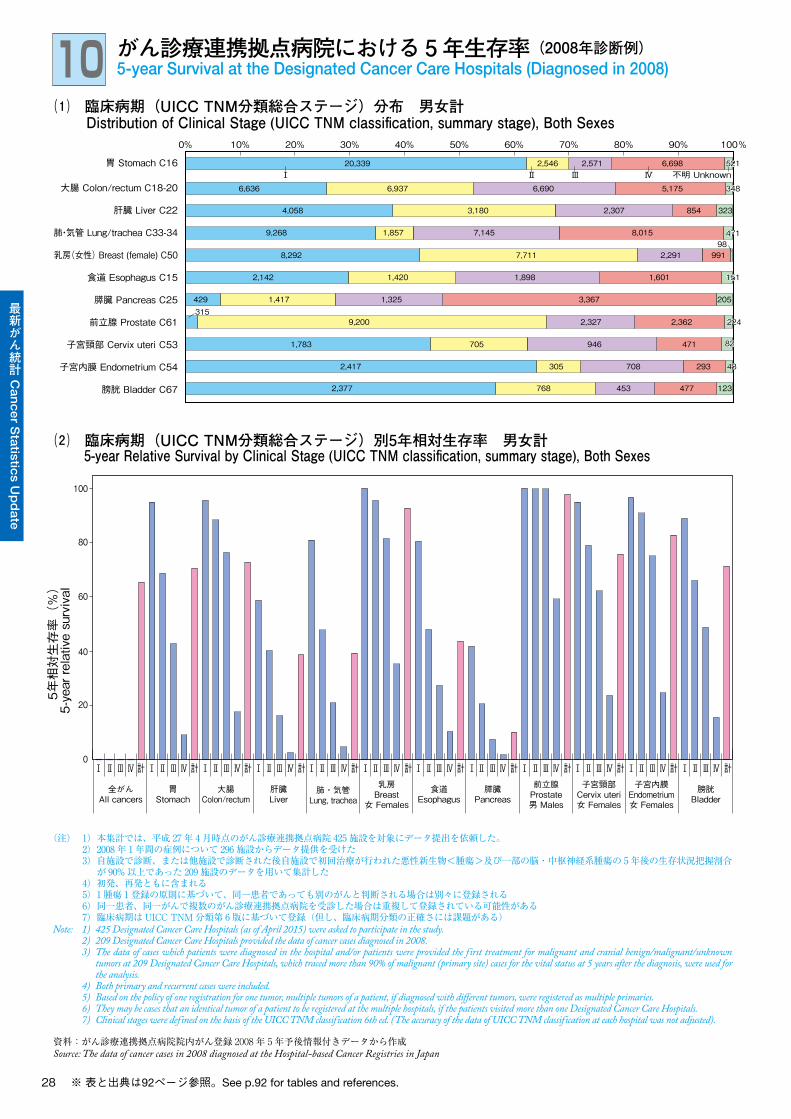
(注)� 1)� 本集計では、平成 27 年 4 月時点のがん診療連携拠点病院 425 施設を対象にデータ提出を依頼した。� 2)� 2008 年 1 年間の症例について 296 施設からデータ提供を受けた� 3)� �自施設で診断、または他施設で診断された後自施設で初回治療が行われた悪性新生物<腫瘍>及び一部の脳・中枢神経系腫瘍の 5 年後の生存状況把握割合
が 90% 以上であった 209 施設のデータを用いて集計した� 4)� 初発、再発ともに含まれる� 5)� 1 腫瘍 1 登録の原則に基づいて、同一患者であっても別のがんと判断される場合は別々に登録される� 6)� 同一患者、同一がんで複数のがん診療連携拠点病院を受診した場合は重複して登録されている可能性がある� 7)� 臨床病期は UICC�TNM 分類第 6 版に基づいて登録(但し、臨床病期分類の正確さには課題がある)Note: 1) 425 Designated Cancer Care Hospitals (as of April 2015) were asked to participate in the study. 2) 209 Designated Cancer Care Hospitals provided the data of cancer cases diagnosed in 2008. 3) The data of cases which patients were diagnosed in the hospital and/or patients were provided the first treatment for malignant and cranial benign/malignant/unknown
tumors at 209 Designated Cancer Care Hospitals, which traced more than 90% of malignant (primary site) cases for the vital status at 5 years after the diagnosis, were used for the analysis.
4) Both primary and recurrent cases were included. 5) Based on the policy of one registration for one tumor, multiple tumors of a patient, if diagnosed with different tumors, were registered as multiple primaries. 6) They may be cases that an identical tumor of a patient to be registered at the multiple hospitals, if the patients visited more than one Designated Cancer Care Hospitals. 7) Clinical stages were defined on the basis of the UICC TNM classification 6th ed. (The accuracy of the data of UICC TNM classification at each hospital was not adjusted).
資料:がん診療連携拠点病院院内がん登録 2008年 5年予後情報付きデータから作成Source: The data of cancer cases in 2008 diagnosed at the Hospital-based Cancer Registries in Japan
⑵ 臨床病期(UICC TNM分類総合ステージ)別5年相対生存率 男女計 5-year Relative Survival by Clinical Stage (UICC TNM classification, summary stage), Both Sexes
肝臓 Liver C22
胃 Stomach C16
大腸 Colon/rectum C18-20
肺・気管 Lung/trachea C33-34
乳房(女性) Breast (female) C50
食道 Esophagus C15
膵臓 Pancreas C25
前立腺 Prostate C61
子宮頸部 Cervix uteri C53
子宮内膜 Endometrium C54
膀胱 Bladder C67
0% 10% 20% 30% 40% 50% 60% 70% 80% 90% 100%
⑴ 臨床病期(UICC TNM分類総合ステージ)分布 男女計 Distribution of Clinical Stage (UICC TNM classification, summary stage), Both Sexes
5,1756,6906,9376,636
3238542,3073,1804,058
8,0157,1451,8579,26898
9912,2918,292 7,711
2,3622,3279,200315
4719467051,783
2937083052,417
477 1234537682,377
1,6011,420 1,8982,142
1,417 1,325 3,367 205429
不明 UnknownⅣⅢⅡⅠ6,6982,546 2,57120,339 521
348
471
151
224
82
48
0
20
40
60
80
100
5年相
対生
存率
(%
)5-
year
rela
tive
surv
ival
食道Esophagus
膵臓Pancreas
膀胱Bladder
胃Stomach
大腸Colon/rectum
肝臓Liver
肺・気管Lung, trachea
乳房Breast
女 Females
子宮頸部Cervix uteri女 Females
子宮内膜Endometrium女 Females
Ⅰ Ⅱ ⅣⅢ 計 Ⅰ Ⅱ ⅣⅢ 計 Ⅰ Ⅱ ⅣⅢ 計 Ⅰ Ⅱ ⅣⅢ 計 Ⅰ Ⅱ ⅣⅢ 計 Ⅰ Ⅱ ⅣⅢ 計 Ⅰ Ⅱ ⅣⅢ 計 Ⅰ Ⅱ ⅣⅢ 計 Ⅰ Ⅱ ⅣⅢ 計 Ⅰ Ⅱ ⅣⅢ 計 Ⅰ Ⅱ ⅣⅢ 計 Ⅰ Ⅱ ⅣⅢ 計
全がんAll cancers
前立腺Prostate男 Males
29
最新がん統計 C
an
cer S
tatistic
s Up
date
11 院内がん登録からみたがん診療連携拠点病院等における臨床病期の分布(2015年診断例)Distribution of Clinical Stage at Designated Cancer Care Hospitals (2015)
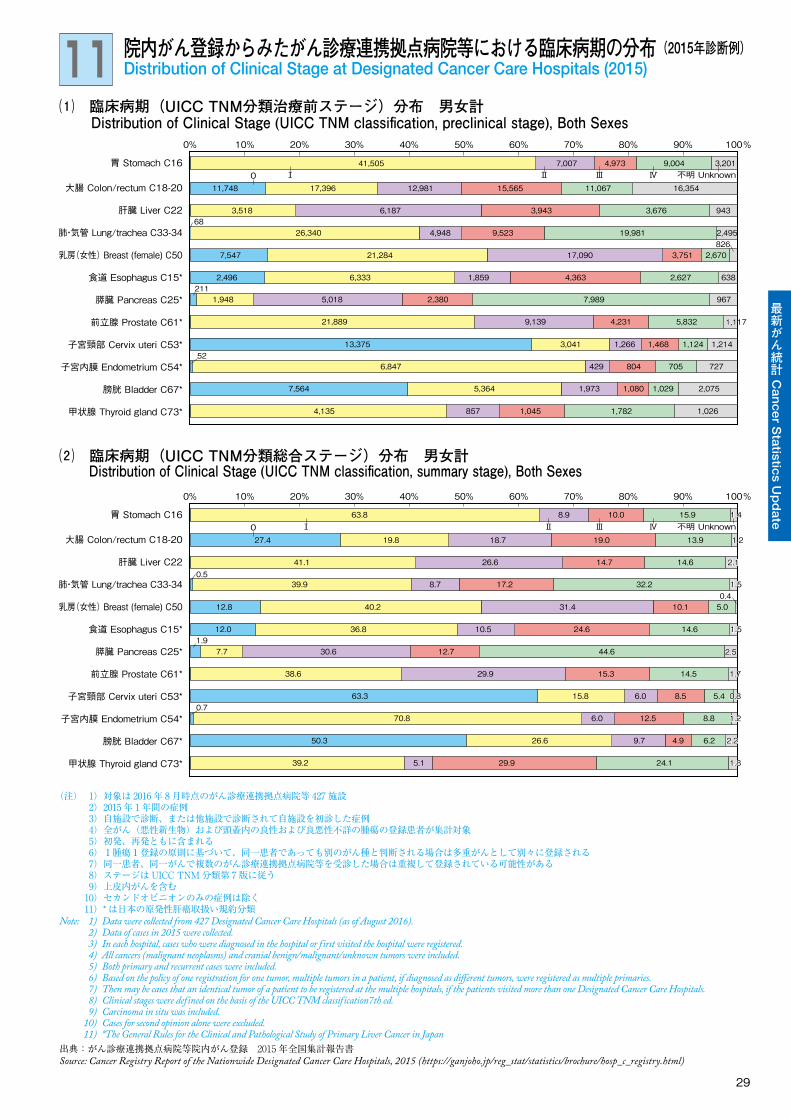
(注)� 1)� 対象は 2016 年 8 月時点のがん診療連携拠点病院等 427 施設� 2)� 2015 年 1 年間の症例� 3)� 自施設で診断、または他施設で診断されて自施設を初診した症例� 4)� 全がん(悪性新生物)および頭蓋内の良性および良悪性不詳の腫瘍の登録患者が集計対象� 5)� 初発、再発ともに含まれる� 6)� 1腫瘍1登録の原則に基づいて、同一患者であっても別のがん種と判断される場合は多重がんとして別々に登録される� 7)� 同一患者、同一がんで複数のがん診療連携拠点病院等を受診した場合は重複して登録されている可能性がある� 8)� ステージは UICC�TNM 分類第 7 版に従う� 9)� 上皮内がんを含む� 10)� セカンドオピニオンのみの症例は除く� 11)� * は日本の原発性肝癌取扱い規約分類Note: 1) Data were collected from 427 Designated Cancer Care Hospitals (as of August 2016). 2) Data of cases in 2015 were collected. 3) In each hospital, cases who were diagnosed in the hospital or first visited the hospital were registered. 4) All cancers (malignant neoplasms) and cranial benign/malignant/unknown tumors were included. 5) Both primary and recurrent cases were included. 6) Based on the policy of one registration for one tumor, multiple tumors in a patient, if diagnosed as different tumors, were registered as multiple primaries. 7) Then may be cases that an identical tumor of a patient to be registered at the multiple hospitals, if the patients visited more than one Designated Cancer Care Hospitals. 8) Clinical stages were defined on the basis of the UICC TNM classification7th ed. 9) Carcinoma in situ was included. 10) Cases for second opinion alone were excluded. 11) *The General Rules for the Clinical and Pathological Study of Primary Liver Cancer in Japan出典:がん診療連携拠点病院等院内がん登録 2015年全国集計報告書Source: Cancer Registry Report of the Nationwide Designated Cancer Care Hospitals, 2015 (https://ganjoho.jp/reg_stat/statistics/brochure/hosp_c_registry.html)
⑵ 臨床病期(UICC TNM分類総合ステージ)分布 男女計 Distribution of Clinical Stage (UICC TNM classification, summary stage), Both Sexes
肝臓 Liver C22
胃 Stomach C16
大腸 Colon/rectum C18-20
肺・気管 Lung/trachea C33-34
乳房(女性) Breast (female) C50
食道 Esophagus C15*
膵臓 Pancreas C25*
前立腺 Prostate C61*
子宮頸部 Cervix uteri C53*
子宮内膜 Endometrium C54*
膀胱 Bladder C67*
甲状腺 Thyroid gland C73*
0% 10% 20% 30% 40% 50% 60% 70% 80% 90% 100%
⑴ 臨床病期(UICC TNM分類治療前ステージ)分布 男女計 Distribution of Clinical Stage (UICC TNM classification, preclinical stage), Both Sexes
16,35415,565 11,06712,98117,39611,748
9433,6763,9436,1873,518
2,49519,9819,5234,94826,340826
2,6703,75117,0907,547 21,284
5,8324,2319,13921,889
1,124 1,2141,4681,2663,04113,375
7277058044296,847
2,0751,080 1,0291,9735,3647,564
1,0261,782857 1,0454,135
6382,6274,3636,333 1,8592,496
5,018 2,380 7,989 9671,948211
不明 UnknownⅣⅢⅡⅠ03,2019,0047,007 4,97341,505
52
肝臓 Liver C22
胃 Stomach C16
大腸 Colon/rectum C18-20
肺・気管 Lung/trachea C33-34
乳房(女性) Breast (female) C50
食道 Esophagus C15*
膵臓 Pancreas C25*
前立腺 Prostate C61*
子宮頸部 Cervix uteri C53*
子宮内膜 Endometrium C54*
膀胱 Bladder C67*
甲状腺 Thyroid gland C73*
0% 10% 20% 30% 40% 50% 60% 70% 80% 90% 100%
19.0 13.918.719.827.4
14.614.726.641.1
32.217.28.739.90.4
5.010.131.412.8 40.2
14.515.329.938.6
5.48.56.015.863.3
8.812.56.070.8
4.9 6.29.726.650.3
24.15.1 29.939.2
14.624.636.8 10.512.0
30.6 12.7 44.67.71.9
不明 UnknownⅣⅢⅡⅠ01.4
1,117
1.5
2.1
1.5
0.5
1.2
2.5
1.7
1.2
1.8
2.2
0.8
15.98.9 10.063.8
68
0.7
30
最新がん統計 C
an
cer S
tatistic
s Up
date
12 全国がんセンター協議会加盟施設における5年生存率(2007~2009年診断例)5-year Survival Rate in the Member Hospitals of the Association of Clinical Cancer Centers (Diagnosed in 2007-2009)
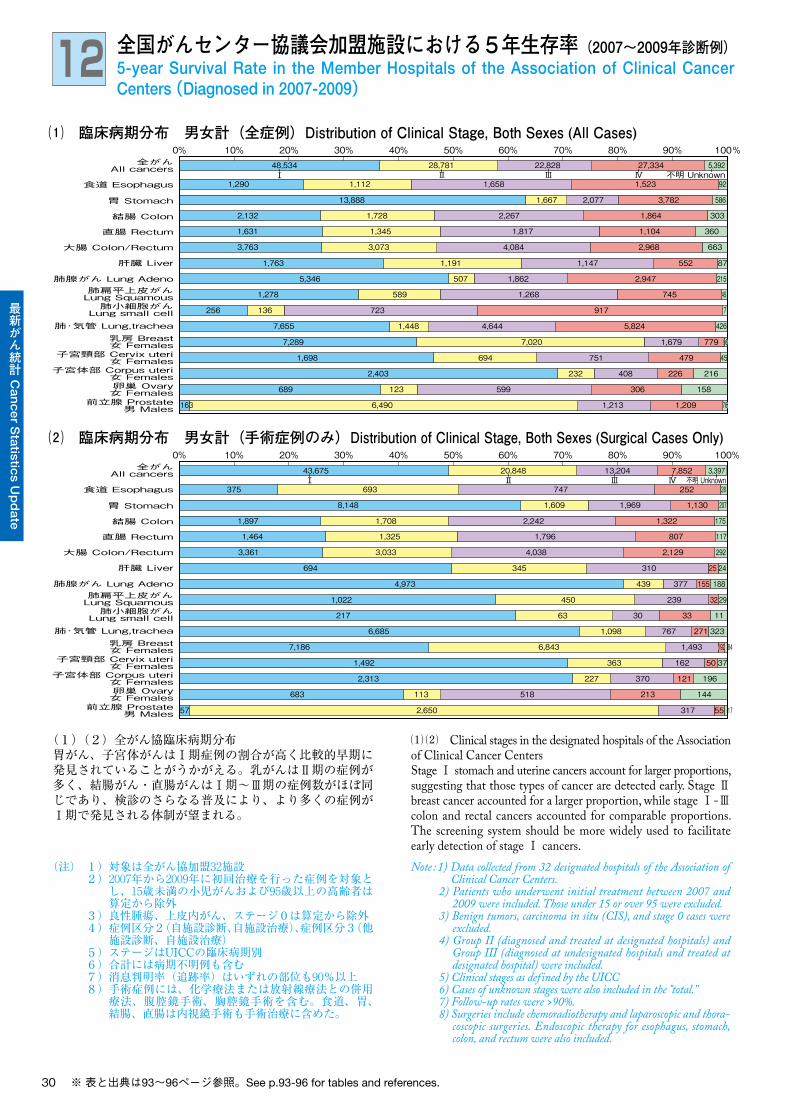
(1)(2)全がん協臨床病期分布胃がん、子宮体がんはⅠ期症例の割合が高く比較的早期に発見されていることがうかがえる。乳がんはⅡ期の症例が多く、結腸がん・直腸がんはⅠ期~Ⅲ期の症例数がほぼ同じであり、検診のさらなる普及により、より多くの症例がⅠ期で発見される体制が望まれる。
(注) 1) 対象は全がん協加盟32施設 2) 2007年から2009年に初回治療を行った症例を対象と
し、15歳未満の小児がんおよび95歳以上の高齢者は算定から除外
3) 良性腫瘍、上皮内がん、ステージ0は算定から除外 4) 症例区分2(自施設診断、自施設治療)、症例区分3(他
施設診断、自施設治療) 5) ステージはUICCの臨床病期別 6) 合計には病期不明例も含む 7) 消息判明率(追跡率)はいずれの部位も90%以上 8) 手術症例には、化学療法または放射線療法との併用
療法、腹腔鏡手術、胸腔鏡手術を含む。食道、胃、結腸、直腸は内視鏡手術も手術治療に含めた。
Note : 1) Data collected from 32 designated hospitals of the Association of Clinical Cancer Centers.
2) Patients who underwent initial treatment between 2007 and 2009 were included. Those under 15 or over 95 were excluded.
3) Benign tumors, carcinoma in situ (CIS), and stage 0 cases were excluded.
4) Group II (diagnosed and treated at designated hospitals) and Group III (diagnosed at undesignated hospitals and treated at designated hospital) were included.
5) Clinical stages as defined by the UICC6) Cases of unknown stages were also included in the "total.”7) Follow-up rates were >90%.8) Surgeries include chemoradiotherapy and laparoscopic and thora-
coscopic surgeries. Endoscopic therapy for esophagus, stomach, colon, and rectum were also included.
⑴ ⑵ Clinical stages in the designated hospitals of the Association of Clinical Cancer CentersStage Ⅰ stomach and uterine cancers account for larger proportions, suggesting that those types of cancer are detected early. Stage Ⅱ breast cancer accounted for a larger proportion, while stage Ⅰ-Ⅲ colon and rectal cancers accounted for comparable proportions. The screening system should be more widely used to facilitate early detection of stage Ⅰ cancers.
※ 表と出典は93~96ページ参照。See p.93-96 for tables and references.
⑵ 臨床病期分布 男女計(手術症例のみ)Distribution of Clinical Stage, Both Sexes (Surgical Cases Only)0% 10% 20% 30% 40% 50% 60% 70% 80% 90% 100%
全がんAll cancers
食道 Esophagus
胃 Stomach
結腸 Colon
直腸 Rectum
大腸 Colon/Rectum
肝臓 Liver
肺扁平上皮がんLung Squamous
肺小細胞がんLung small cell
肺腺がん Lung Adeno
肺・気管 Lung,trachea乳房 Breast女 Females
子宮頸部 Cervix uteri女 Females
子宮体部 Corpus uteri女 Females卵巣 Ovary女 Females
前立腺 Prostate男 Males
全がんAll cancers
食道 Esophagus
胃 Stomach
結腸 Colon
直腸 Rectum
大腸 Colon/Rectum
肝臓 Liver
肺扁平上皮がんLung Squamous
肺小細胞がんLung small cell
肺腺がん Lung Adeno
肺・気管 Lung,trachea乳房 Breast女 Females
子宮頸部 Cervix uteri女 Females
子宮体部 Corpus uteri女 Females卵巣 Ovary女 Females
前立腺 Prostate男 Males
0% 10% 20% 30% 40% 50% 60% 70% 80% 90% 100%⑴ 臨床病期分布 男女計(全症例)Distribution of Clinical Stage, Both Sexes (All Cases)
921,5231,6581,1121,290
5863,7822,0771,66713,888
3031,8642,2671,7282,132
3601,1041,8171,3451,631
3,763 3,073 4,084 2,968 663
875521,1471,1911,763
2152,9471,8625075,346
4265,8244,6441,4487,655
454797516941,698
7791,6797,0207,289
2162264082322,403
252747693375
1,1301,9691,6098,148
1751,3222,2421,7081,897
1178071,7961,3251,464
3,361 3,033 4,038 2,129 292
37501623631,492
1961213702272,313
3232717671,0986,685
841,4936,8437,186
11333063217
1881553774394,973
322394501,022
2425310345694
144213518113683
17553172,65057
158306599123689
1,2091,2136,490163
45
17
98
76
28
207
29
192
7451,2685891,278
917723136256
不明 UnknownⅣⅢⅡⅠ5,39227,33422,82828,78148,534
不明 UnknownⅣⅢⅡⅠ3,3977,85213,20420,84843,675
31
最新がん統計 C
an
cer S
tatistic
s Up
date
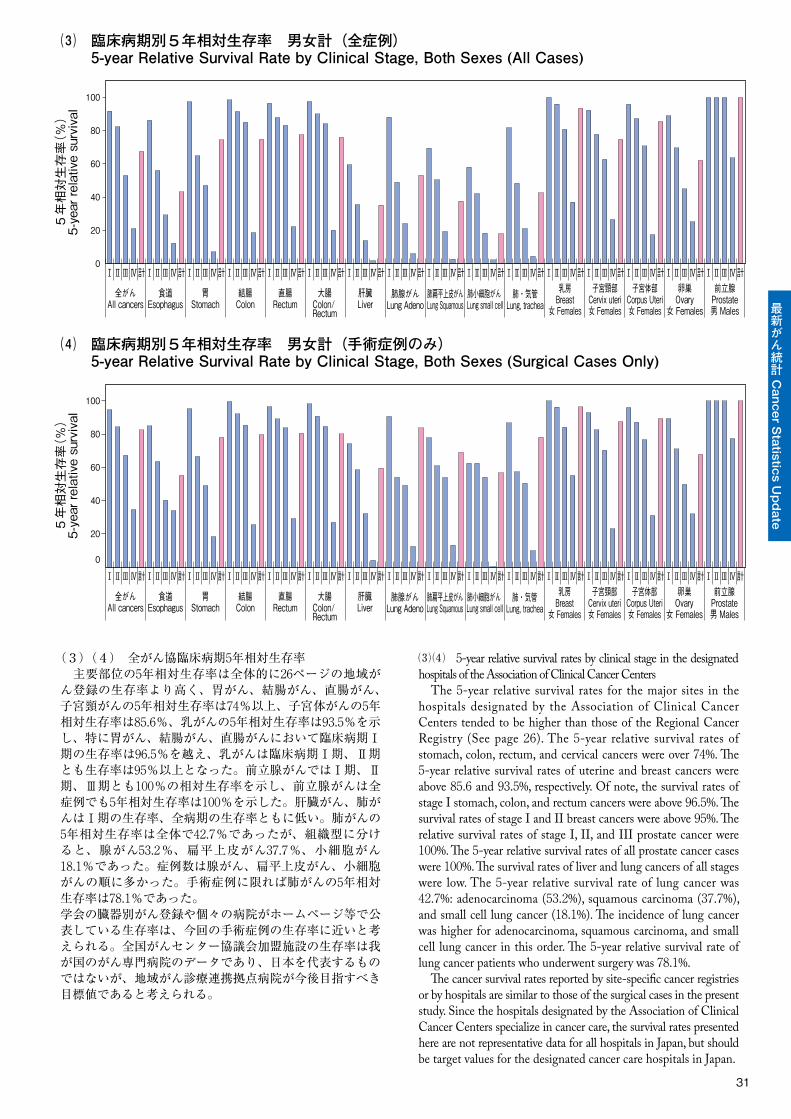
(3)(4) 全がん協臨床病期5年相対生存率 主要部位の5年相対生存率は全体的に26ページの地域がん登録の生存率より高く、胃がん、結腸がん、直腸がん、子宮頸がんの5年相対生存率は74%以上、子宮体がんの5年相対生存率は85.6%、乳がんの5年相対生存率は93.5%を示し、特に胃がん、結腸がん、直腸がんにおいて臨床病期Ⅰ期の生存率は96.5%を越え、乳がんは臨床病期Ⅰ期、Ⅱ期とも生存率は95%以上となった。前立腺がんではⅠ期、Ⅱ期、Ⅲ期とも100%の相対生存率を示し、前立腺がんは全症例でも5年相対生存率は100%を示した。肝臓がん、肺がんはⅠ期の生存率、全病期の生存率ともに低い。肺がんの5年相対生存率は全体で42.7%であったが、組織型に分けると、腺がん53.2%、扁平上皮がん37.7%、小細胞がん18.1%であった。症例数は腺がん、扁平上皮がん、小細胞がんの順に多かった。手術症例に限れば肺がんの5年相対生存率は78.1%であった。学会の臓器別がん登録や個々の病院がホームページ等で公表している生存率は、今回の手術症例の生存率に近いと考えられる。全国がんセンター協議会加盟施設の生存率は我が国のがん専門病院のデータであり、日本を代表するものではないが、地域がん診療連携拠点病院が今後目指すべき目標値であると考えられる。
⑶ ⑷ 5-year relative survival rates by clinical stage in the designated hospitals of the Association of Clinical Cancer Centers The 5-year relative survival rates for the major sites in the hospitals designated by the Association of Clinical Cancer Centers tended to be higher than those of the Regional Cancer Registry (See page 26). The 5-year relative survival rates of stomach, colon, rectum, and cervical cancers were over 74%. �e 5-year relative survival rates of uterine and breast cancers were above 85.6 and 93.5%, respectively. Of note, the survival rates of stage I stomach, colon, and rectum cancers were above 96.5%. �e survival rates of stage I and II breast cancers were above 95%. �e relative survival rates of stage I, II, and III prostate cancer were 100%. �e 5-year relative survival rates of all prostate cancer cases were 100%. �e survival rates of liver and lung cancers of all stages were low. The 5-year relative survival rate of lung cancer was 42.7%: adenocarcinoma (53.2%), squamous carcinoma (37.7%), and small cell lung cancer (18.1%). �e incidence of lung cancer was higher for adenocarcinoma, squamous carcinoma, and small cell lung cancer in this order. �e 5-year relative survival rate of lung cancer patients who underwent surgery was 78.1%. �e cancer survival rates reported by site-speci�c cancer registries or by hospitals are similar to those of the surgical cases in the present study. Since the hospitals designated by the Association of Clinical Cancer Centers specialize in cancer care, the survival rates presented here are not representative data for all hospitals in Japan, but should be target values for the designated cancer care hospitals in Japan.
0
20
40
60
80
100
5年
相対
生存
率(%
)5-
year
rela
tive
surv
ival
⑶ 臨床病期別5年相対生存率 男女計(全症例) 5-year Relative Survival Rate by Clinical Stage, Both Sexes (All Cases)
0
20
40
60
80
100
5年
相対
生存
率(%
)5-
year
rela
tive
surv
ival
食道Esophagus
胃Stomach
結腸Colon
直腸Rectum
大腸Colon/Rectum
肝臓Liver
肺・気管Lung, trachea
乳房Breast
女 Femalesi
子宮頸部Cervix uter女 Females
子宮体部Corpus Uteri女 Females
ⅠⅡ ⅣⅢ 計ⅠⅡ ⅣⅢ 計ⅠⅡ ⅣⅢ 計ⅠⅡ ⅣⅢ 計ⅠⅡ ⅣⅢ 計ⅠⅡ ⅣⅢ 計ⅠⅡ ⅣⅢ 計ⅠⅡ ⅣⅢ 計ⅠⅡ ⅣⅢ 計ⅠⅡ ⅣⅢ 計ⅠⅡ ⅣⅢ 計ⅠⅡ ⅣⅢ 計ⅠⅡ ⅣⅢ 計ⅠⅡ ⅣⅢ 計ⅠⅡ ⅣⅢ 計
全がんAll cancers
⑷ 臨床病期別5年相対生存率 男女計(手術症例のみ) 5-year Relative Survival Rate by Clinical Stage, Both Sexes (Surgical Cases Only)
e前立腺
Prostat男 Males
ⅠⅡ ⅣⅢ 計
女 FemalesOvary卵巣
食道Esophagus
胃Stomach
結腸Colon
直腸Rectum
大腸Colon/Rectum
肝臓Liver
肺腺がんLung Adeno
肺扁平上皮がんLung Squamous
肺小細胞がん Lung small cell
肺・気管Lung, trachea
乳房Breast
女 Femalesi
子宮頸部Cervix uter女 Females
子宮体部Corpus Uteri女 Females
ⅠⅡ ⅣⅢ 計ⅠⅡ ⅣⅢ 計ⅠⅡ ⅣⅢ 計ⅠⅡ ⅣⅢ 計ⅠⅡ ⅣⅢ 計ⅠⅡ ⅣⅢ 計ⅠⅡ ⅣⅢ 計ⅠⅡ ⅣⅢ 計ⅠⅡ ⅣⅢ 計ⅠⅡ ⅣⅢ 計ⅠⅡ ⅣⅢ 計ⅠⅡ ⅣⅢ 計ⅠⅡ ⅣⅢ 計ⅠⅡ ⅣⅢ 計ⅠⅡ ⅣⅢ 計
全がんAll cancers e
前立腺Prostat男 Males
ⅠⅡ ⅣⅢ 計
女 FemalesOvary卵巣
肺腺がんLung Adeno
肺扁平上皮がんLung Squamous
肺小細胞がん Lung small cell
32
最新がん統計 C
an
cer S
tatistic
s Up
date
13 全国がんセンター協議会加盟施設における 10年生存率(2001~2004年診断例)10-year Survival Rate in the Member Hospitals of the Association of Clinical Cancer Centers (Diagnosed in 2001-2004)
⑵ 臨床病期分布 男女計(手術症例のみ)Distribution of Clinical Stage, Both Sexes (Surgical Cases Only)0% 10% 20% 30% 40% 50% 60% 70% 80% 90% 100%
全がんAll cancers
食道 Esophagus
胃 Stomach
結腸 Colon
直腸 Rectum
肝臓 Liver
肺・気管 Lung,trachea乳房 Breast女 Females
子宮頸部 Cervix uteri女 Females
子宮体部 Corpus uteri女 Females卵巣 Ovary女 Females
前立腺 Prostate男 Males
全がんAll cancers
食道 Esophagus
胃 Stomach
結腸 Colon
直腸 Rectum
肝臓 Liver
肺・気管 Lung,trachea乳房 Breast女 Females
子宮頸部 Cervix uteri女 Females
子宮体部 Corpus uteri女 Females卵巣 Ovary女 Females
前立腺 Prostate男 Males
0% 10% 20% 30% 40% 50% 60% 70% 80% 90% 100%⑴ 臨床病期分布 男女計(全症例)Distribution of Clinical Stage, Both Sexes (All Cases)
151584754603585
4781,5511,0047875,463
185596777770803
143366600519590
125296641760722
130
96
3848353,9612,905
867617185920
55156350341912
43105352348212
2386809567473,768
119480773761632
724316183911
1757633,9212,886
4222111206836
741244985623,136
1937173215228
93314592507517
398524275264
373418386862
4812228678267
1205225931,726139
2282,4822,4708983,407
不明 UnknownⅣⅢⅡⅠ3,60710,64410,20513,00919,682
不明 UnknownⅣⅢⅡⅠ2,0473,5915,91610,02217,770
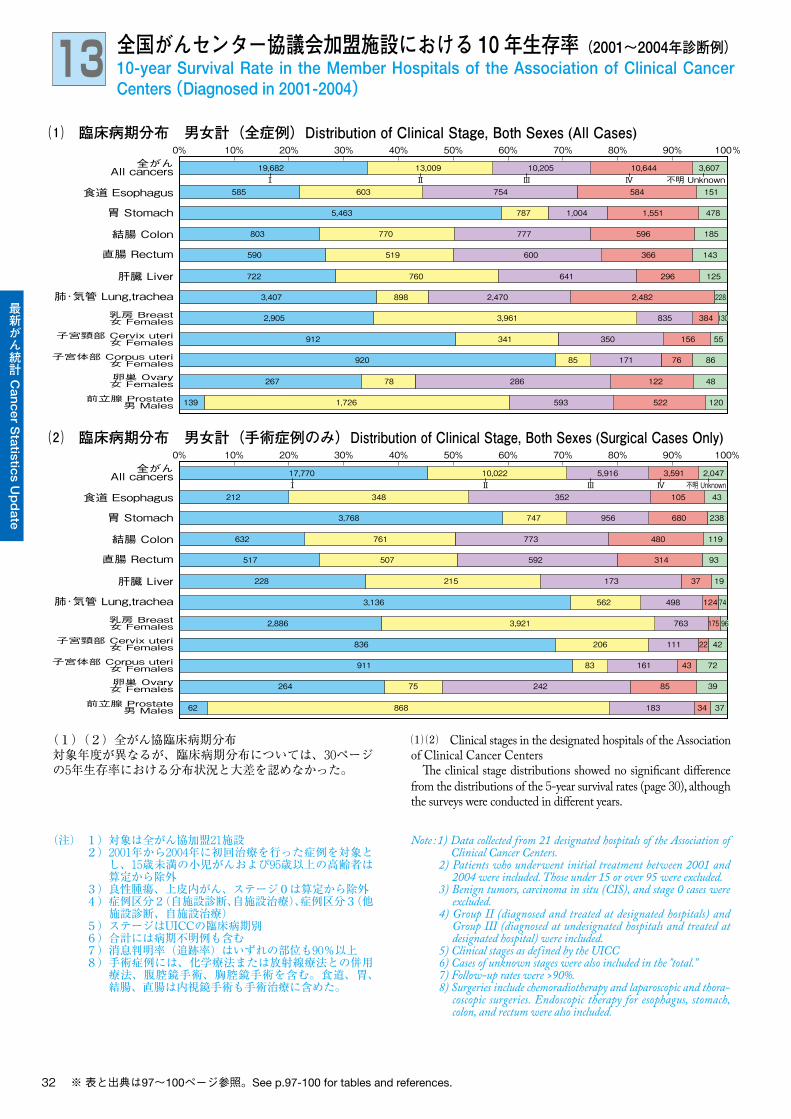
(1)(2)全がん協臨床病期分布対象年度が異なるが、臨床病期分布については、30ページの5年生存率における分布状況と大差を認めなかった。
(注) 1) 対象は全がん協加盟21施設 2) 2001年から2004年に初回治療を行った症例を対象と
し、15歳未満の小児がんおよび95歳以上の高齢者は算定から除外
3) 良性腫瘍、上皮内がん、ステージ0は算定から除外 4) 症例区分2(自施設診断、自施設治療)、症例区分3(他
施設診断、自施設治療) 5) ステージはUICCの臨床病期別 6) 合計には病期不明例も含む 7) 消息判明率(追跡率)はいずれの部位も90%以上 8) 手術症例には、化学療法または放射線療法との併用
療法、腹腔鏡手術、胸腔鏡手術を含む。食道、胃、結腸、直腸は内視鏡手術も手術治療に含めた。
Note : 1) Data collected from 21 designated hospitals of the Association of Clinical Cancer Centers.
2) Patients who underwent initial treatment between 2001 and 2004 were included. Those under 15 or over 95 were excluded.
3) Benign tumors, carcinoma in situ (CIS), and stage 0 cases were excluded.
4) Group II (diagnosed and treated at designated hospitals) and Group III (diagnosed at undesignated hospitals and treated at designated hospital) were included.
5) Clinical stages as defined by the UICC6) Cases of unknown stages were also included in the "total.”7) Follow-up rates were >90%.8) Surgeries include chemoradiotherapy and laparoscopic and thora-
coscopic surgeries. Endoscopic therapy for esophagus, stomach, colon, and rectum were also included.
⑴ ⑵ Clinical stages in the designated hospitals of the Association of Clinical Cancer Centers �e clinical stage distributions showed no signi�cant di�erence from the distributions of the 5-year survival rates (page 30), although the surveys were conducted in di�erent years.
※ 表と出典は97~100ページ参照。See p.97-100 for tables and references.
33
最新がん統計 C
an
cer S
tatistic
s Up
date
0
20
40
60
80
100
10年
相対
生存
率(%
)10
-yea
r rel
ativ
e su
rviv
al
⑶ 臨床病期別10年相対生存率 男女計(全症例) 10-year Relative Survival Rate by Clinical Stage, Both Sexes (All Cases)
10年
相対
生存
率(%
)10
-yea
r rel
ativ
e su
rviv
al
⑷ 臨床病期別10年相対生存率 男女計(手術症例のみ) 10-year Relative Survival Rate by Clinical Stage, Both Sexes (Surgical Cases Only)
食道Esophagus
胃Stomach
結腸Colon
直腸Rectum
肝臓Liver
肺・気管Lung, trachea
乳房Breast
女 Females
子宮頸部Cervix uteri女 Females
子宮体部Corpus Uteri女 Females
Ⅰ Ⅱ ⅣⅢ 計 Ⅰ Ⅱ ⅣⅢ 計 Ⅰ Ⅱ ⅣⅢ 計 Ⅰ Ⅱ ⅣⅢ 計 Ⅰ Ⅱ ⅣⅢ 計 Ⅰ Ⅱ ⅣⅢ 計 Ⅰ Ⅱ ⅣⅢ 計 Ⅰ Ⅱ ⅣⅢ 計 Ⅰ Ⅱ ⅣⅢ 計 Ⅰ Ⅱ ⅣⅢ 計 Ⅰ Ⅱ ⅣⅢ 計 Ⅰ Ⅱ ⅣⅢ 計
全がんAll cancers e
前立腺Prostat男 Males女 Females
Ovary卵巣
0
20
40
60
80
100
食道Esophagus
胃Stomach
結腸Colon
直腸Rectum
肝臓Liver
肺・気管Lung, trachea
乳房Breast
女 Females
子宮頸部Cervix uteri女 Females
子宮体部Corpus Uteri女 Females
Ⅰ Ⅱ ⅣⅢ 計 Ⅰ Ⅱ ⅣⅢ 計 Ⅰ Ⅱ ⅣⅢ 計 Ⅰ Ⅱ ⅣⅢ 計 Ⅰ Ⅱ ⅣⅢ 計 Ⅰ Ⅱ ⅣⅢ 計 Ⅰ Ⅱ ⅣⅢ 計 Ⅰ Ⅱ ⅣⅢ 計 Ⅰ Ⅱ ⅣⅢ 計 Ⅰ Ⅱ ⅣⅢ 計 Ⅰ Ⅱ ⅣⅢ 計 Ⅰ Ⅱ ⅣⅢ 計
全がんAll cancers e
前立腺Prostat男 Males女 Females
Ovary卵巣
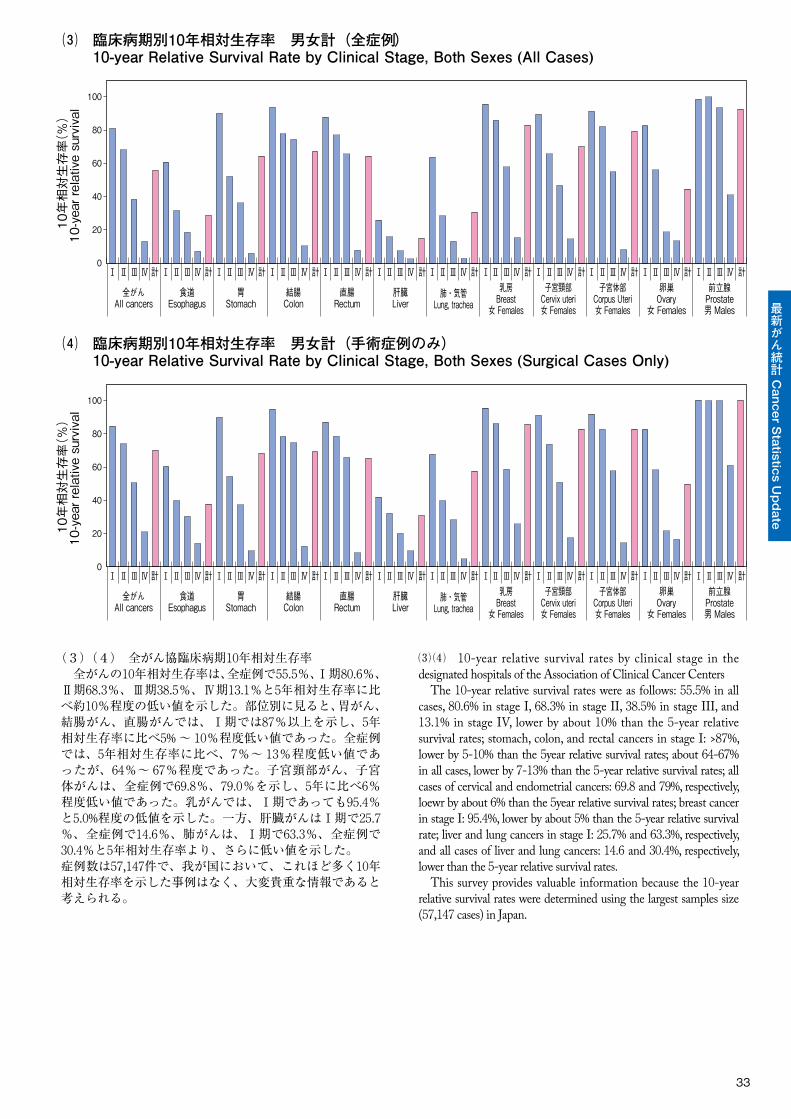
(3)(4) 全がん協臨床病期10年相対生存率 全がんの10年相対生存率は、全症例で55.5%、Ⅰ期80.6%、Ⅱ期68.3%、Ⅲ期38.5%、Ⅳ期13.1%と5年相対生存率に比べ約10%程度の低い値を示した。部位別に見ると、胃がん、結腸がん、直腸がんでは、Ⅰ期では87%以上を示し、5年相対生存率に比べ5% ~ 10%程度低い値であった。全症例では、5年相対生存率に比べ、7%~ 13%程度低い値であったが、64%~ 67%程度であった。子宮頸部がん、子宮体がんは、全症例で69.8%、79.0%を示し、5年に比べ6%程度低い値であった。乳がんでは、Ⅰ期であっても95.4%と5.0%程度の低値を示した。一方、肝臓がんはⅠ期で25.7%、全症例で14.6%、肺がんは、Ⅰ期で63.3%、全症例で30.4%と5年相対生存率より、さらに低い値を示した。症例数は57,147件で、我が国において、これほど多く10年相対生存率を示した事例はなく、大変貴重な情報であると考えられる。
⑶ ⑷ 10-year relative survival rates by clinical stage in the designated hospitals of the Association of Clinical Cancer Centers The 10-year relative survival rates were as follows: 55.5% in all cases, 80.6% in stage I, 68.3% in stage II, 38.5% in stage III, and 13.1% in stage IV, lower by about 10% than the 5-year relative survival rates; stomach, colon, and rectal cancers in stage I: >87%, lower by 5-10% than the 5year relative survival rates; about 64-67% in all cases, lower by 7-13% than the 5-year relative survival rates; all cases of cervical and endometrial cancers: 69.8 and 79%, respectively, loewr by about 6% than the 5year relative survival rates; breast cancer in stage I: 95.4%, lower by about 5% than the 5-year relative survival rate; liver and lung cancers in stage I: 25.7% and 63.3%, respectively, and all cases of liver and lung cancers: 14.6 and 30.4%, respectively, lower than the 5-year relative survival rates. This survey provides valuable information because the 10-year relative survival rates were determined using the largest samples size (57,147 cases) in Japan.
34
最新がん統計 C
an
cer S
tatistic
s Up
date
14 累積がん罹患・死亡リスクCumulative Cancer Incidence/Mortality Risk
⑴ 年齢階級別罹患リスク(2013年罹患・死亡データに基づく) Age-specific Incidence Risk (Based on Incidence and Mortality Data in 2013)
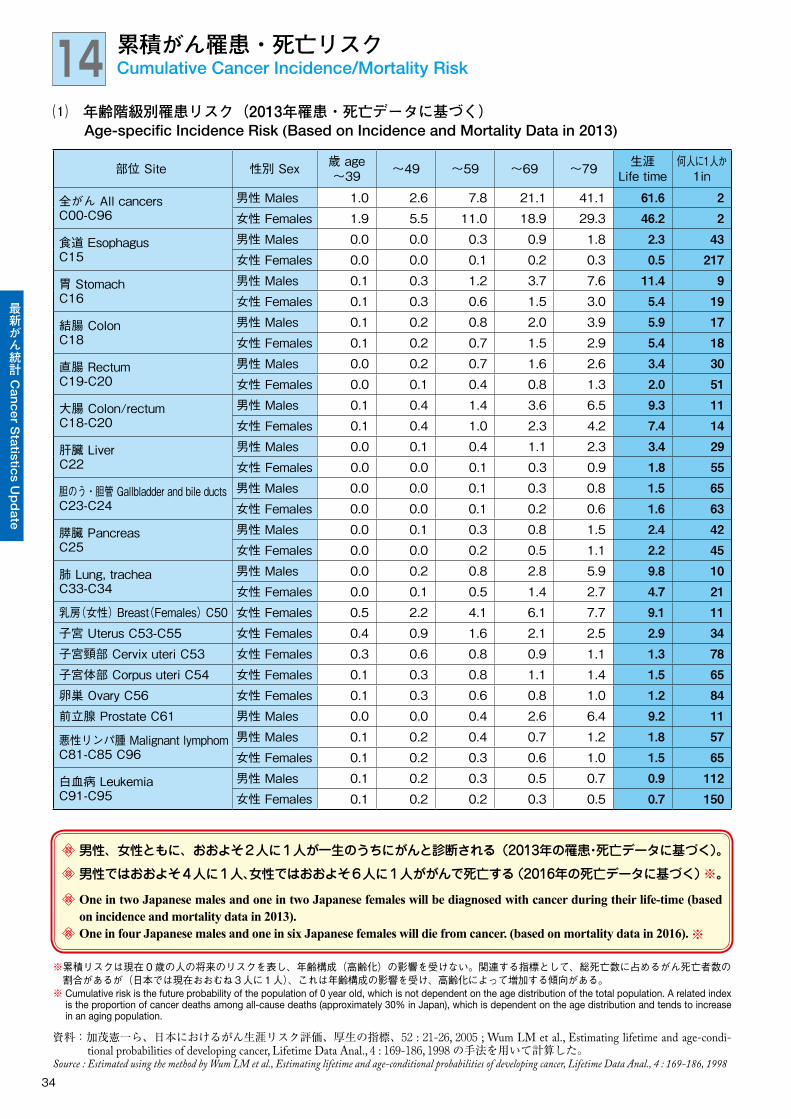
男性、女性ともに、おおよそ2人に1人が一生のうちにがんと診断される(2013年の罹患・死亡データに基づく)。
男性ではおおよそ4人に1人、女性ではおおよそ6人に1人ががんで死亡する(2016年の死亡データに基づく)※。
One in two Japanese males and one in two Japanese females will be diagnosed with cancer during their life-time (based on incidence and mortality data in 2013).One in four Japanese males and one in six Japanese females will die from cancer. (based on mortality data in 2016). ※
資料:加茂憲一ら、日本におけるがん生涯リスク評価、厚生の指標、52 : 21-26, 2005 ; Wum LM et al., Estimating lifetime and age-condi-tional probabilities of developing cancer, Lifetime Data Anal., 4 : 169-186, 1998の手法を用いて計算した。
Source : Estimated using the method by Wum LM et al., Estimating lifetime and age-conditional probabilities of developing cancer, Lifetime Data Anal., 4 : 169-186, 1998
※�累積リスクは現在 0歳の人の将来のリスクを表し、年齢構成(高齢化)の影響を受けない。関連する指標として、総死亡数に占めるがん死亡者数の割合があるが(日本では現在おおむね3人に1人)、これは年齢構成の影響を受け、高齢化によって増加する傾向がある。※ �Cumulative risk is the future probability of the population of 0 year old, which is not dependent on the age distribution of the total population. A related index
is the proportion of cancer deaths among all-cause deaths (approximately 30% in Japan), which is dependent on the age distribution and tends to increase in an aging population.
部位Site 性別Sex 歳age~39 ~49 ~59 ~69 ~79 生涯
Life�time何人に1人か1in
全がんAllcancersC00-C96
男性Males 1.0 2.6 7.8 21.1 41.1 61.6 2女性Females 1.9 5.5 11.0 18.9 29.3 46.2 2
食道EsophagusC15
男性Males 0.0 0.0 0.3 0.9 1.8 2.3 43女性Females 0.0 0.0 0.1 0.2 0.3 0.5 217
胃StomachC16
男性Males 0.1 0.3 1.2 3.7 7.6 11.4 9女性Females 0.1 0.3 0.6 1.5 3.0 5.4 19
結腸ColonC18
男性Males 0.1 0.2 0.8 2.0 3.9 5.9 17女性Females 0.1 0.2 0.7 1.5 2.9 5.4 18
直腸RectumC19-C20
男性Males 0.0 0.2 0.7 1.6 2.6 3.4 30女性Females 0.0 0.1 0.4 0.8 1.3 2.0 51
大腸Colon/rectumC18-C20
男性Males 0.1 0.4 1.4 3.6 6.5 9.3 11女性Females 0.1 0.4 1.0 2.3 4.2 7.4 14
肝臓LiverC22
男性Males 0.0 0.1 0.4 1.1 2.3 3.4 29女性Females 0.0 0.0 0.1 0.3 0.9 1.8 55
胆のう・胆管GallbladderandbileductsC23-C24
男性Males 0.0 0.0 0.1 0.3 0.8 1.5 65女性Females 0.0 0.0 0.1 0.2 0.6 1.6 63
膵臓PancreasC25
男性Males 0.0 0.1 0.3 0.8 1.5 2.4 42女性Females 0.0 0.0 0.2 0.5 1.1 2.2 45
肺Lung,tracheaC33-C34
男性Males 0.0 0.2 0.8 2.8 5.9 9.8 10女性Females 0.0 0.1 0.5 1.4 2.7 4.7 21
乳房(女性)Breast(Females)C50 女性Females 0.5 2.2 4.1 6.1 7.7 9.1 11子宮UterusC53-C55 女性Females 0.4 0.9 1.6 2.1 2.5 2.9 34子宮頸部CervixuteriC53 女性Females 0.3 0.6 0.8 0.9 1.1 1.3 78子宮体部CorpusuteriC54 女性Females 0.1 0.3 0.8 1.1 1.4 1.5 65卵巣OvaryC56 女性Females 0.1 0.3 0.6 0.8 1.0 1.2 84前立腺ProstateC61 男性Males 0.0 0.0 0.4 2.6 6.4 9.2 11
悪性リンパ腫MalignantlymphomC81-C85C96
男性Males 0.1 0.2 0.4 0.7 1.2 1.8 57女性Females 0.1 0.2 0.3 0.6 1.0 1.5 65
白血病LeukemiaC91-C95
男性Males 0.1 0.2 0.3 0.5 0.7 0.9 112女性Females 0.1 0.2 0.2 0.3 0.5 0.7 150
35
最新がん統計 C
an
cer S
tatistic
s Up
date
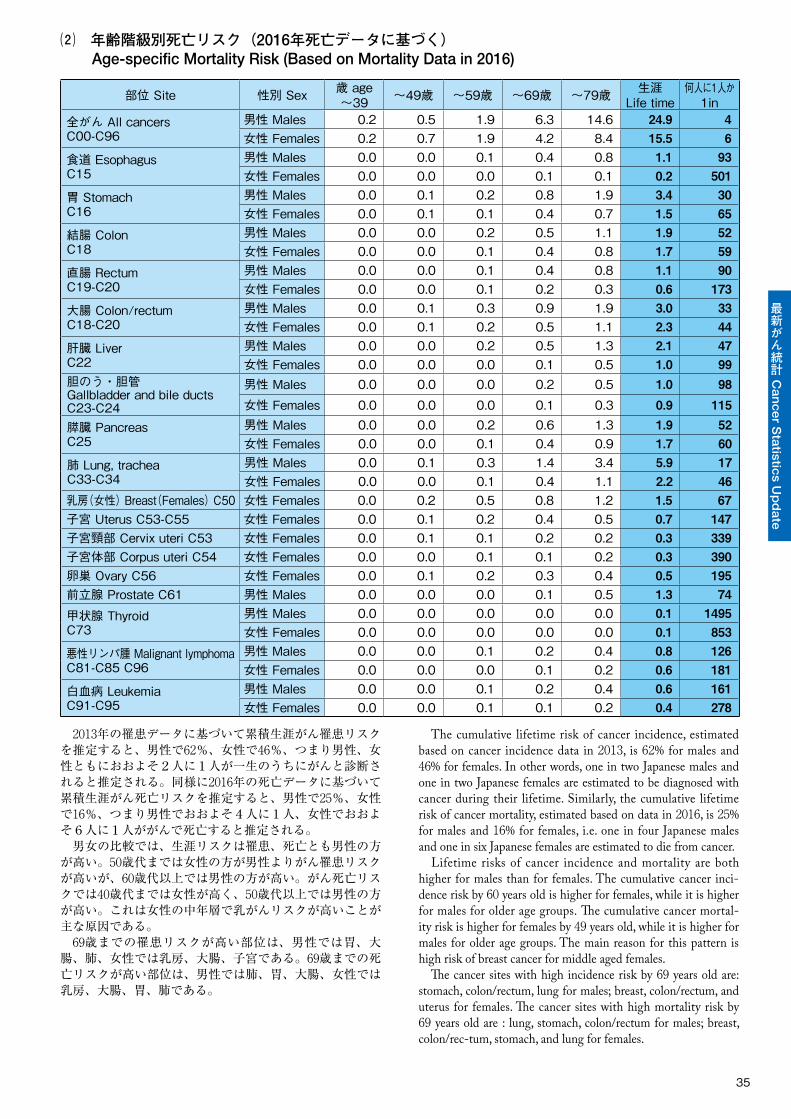
⑵ 年齢階級別死亡リスク(2016年死亡データに基づく) Age-specific Mortality Risk (Based on Mortality Data in 2016)
2013年の罹患データに基づいて累積生涯がん罹患リスクを推定すると、男性で62%、女性で46%、つまり男性、女性ともにおおよそ2人に1人が一生のうちにがんと診断されると推定される。同様に2016年の死亡データに基づいて累積生涯がん死亡リスクを推定すると、男性で25%、女性で16%、つまり男性でおおよそ4人に1人、女性でおおよそ6人に1人ががんで死亡すると推定される。 男女の比較では、生涯リスクは罹患、死亡とも男性の方が高い。50歳代までは女性の方が男性よりがん罹患リスクが高いが、60歳代以上では男性の方が高い。がん死亡リスクでは40歳代までは女性が高く、50歳代以上では男性の方が高い。これは女性の中年層で乳がんリスクが高いことが主な原因である。 69歳までの罹患リスクが高い部位は、男性では胃、大 腸、肺、女性では乳房、大腸、子宮である。69歳までの死亡リスクが高い部位は、男性では肺、胃、大腸、女性では乳房、大腸、胃、肺である。
The cumulative lifetime risk of cancer incidence, estimated based on cancer incidence data in 2013, is 62% for males and 46% for females. In other words, one in two Japanese males and one in two Japanese females are estimated to be diagnosed with cancer during their lifetime. Similarly, the cumulative lifetime risk of cancer mortality, estimated based on data in 2016, is 25% for males and 16% for females, i.e. one in four Japanese males and one in six Japanese females are estimated to die from cancer. Lifetime risks of cancer incidence and mortality are both higher for males than for females. The cumulative cancer inci-dence risk by 60 years old is higher for females, while it is higher for males for older age groups. �e cumulative cancer mortal-ity risk is higher for females by 49 years old, while it is higher for males for older age groups. The main reason for this pattern is high risk of breast cancer for middle aged females. �e cancer sites with high incidence risk by 69 years old are: stomach, colon/rectum, lung for males; breast, colon/rectum, and uterus for females. �e cancer sites with high mortality risk by 69 years old are : lung, stomach, colon/rectum for males; breast, colon/rec-tum, stomach, and lung for females.
部位Site 性別Sex 歳age~39 ~49歳 ~59歳 ~69歳 ~79歳 生涯
Life�time何人に1人か1in
全がんAllcancersC00-C96
男性Males 0.2 0.5 1.9 6.3 14.6 24.9 4女性Females 0.2 0.7 1.9 4.2 8.4 15.5 6
食道EsophagusC15
男性Males 0.0 0.0 0.1 0.4 0.8 1.1 93女性Females 0.0 0.0 0.0 0.1 0.1 0.2 501
胃StomachC16
男性Males 0.0 0.1 0.2 0.8 1.9 3.4 30女性Females 0.0 0.1 0.1 0.4 0.7 1.5 65
結腸ColonC18
男性Males 0.0 0.0 0.2 0.5 1.1 1.9 52女性Females 0.0 0.0 0.1 0.4 0.8 1.7 59
直腸RectumC19-C20
男性Males 0.0 0.0 0.1 0.4 0.8 1.1 90女性Females 0.0 0.0 0.1 0.2 0.3 0.6 173
大腸Colon/rectumC18-C20
男性Males 0.0 0.1 0.3 0.9 1.9 3.0 33女性Females 0.0 0.1 0.2 0.5 1.1 2.3 44
肝臓LiverC22
男性Males 0.0 0.0 0.2 0.5 1.3 2.1 47女性Females 0.0 0.0 0.0 0.1 0.5 1.0 99
胆のう・胆管GallbladderandbileductsC23-C24
男性Males 0.0 0.0 0.0 0.2 0.5 1.0 98女性Females 0.0 0.0 0.0 0.1 0.3 0.9 115
膵臓PancreasC25
男性Males 0.0 0.0 0.2 0.6 1.3 1.9 52女性Females 0.0 0.0 0.1 0.4 0.9 1.7 60
肺Lung,tracheaC33-C34
男性Males 0.0 0.1 0.3 1.4 3.4 5.9 17女性Females 0.0 0.0 0.1 0.4 1.1 2.2 46
乳房(女性)Breast(Females)C50 女性Females 0.0 0.2 0.5 0.8 1.2 1.5 67子宮UterusC53-C55 女性Females 0.0 0.1 0.2 0.4 0.5 0.7 147子宮頸部CervixuteriC53 女性Females 0.0 0.1 0.1 0.2 0.2 0.3 339子宮体部CorpusuteriC54 女性Females 0.0 0.0 0.1 0.1 0.2 0.3 390卵巣OvaryC56 女性Females 0.0 0.1 0.2 0.3 0.4 0.5 195前立腺ProstateC61 男性Males 0.0 0.0 0.0 0.1 0.5 1.3 74甲状腺ThyroidC73
男性Males 0.0 0.0 0.0 0.0 0.0 0.1 1495女性Females 0.0 0.0 0.0 0.0 0.0 0.1 853
悪性リンパ腫MalignantlymphomaC81-C85C96
男性Males 0.0 0.0 0.1 0.2 0.4 0.8 126女性Females 0.0 0.0 0.0 0.1 0.2 0.6 181
白血病LeukemiaC91-C95
男性Males 0.0 0.0 0.1 0.2 0.4 0.6 161女性Females 0.0 0.0 0.1 0.1 0.2 0.4 278
36
最新がん統計 C
an
cer S
tatistic
s Up
date
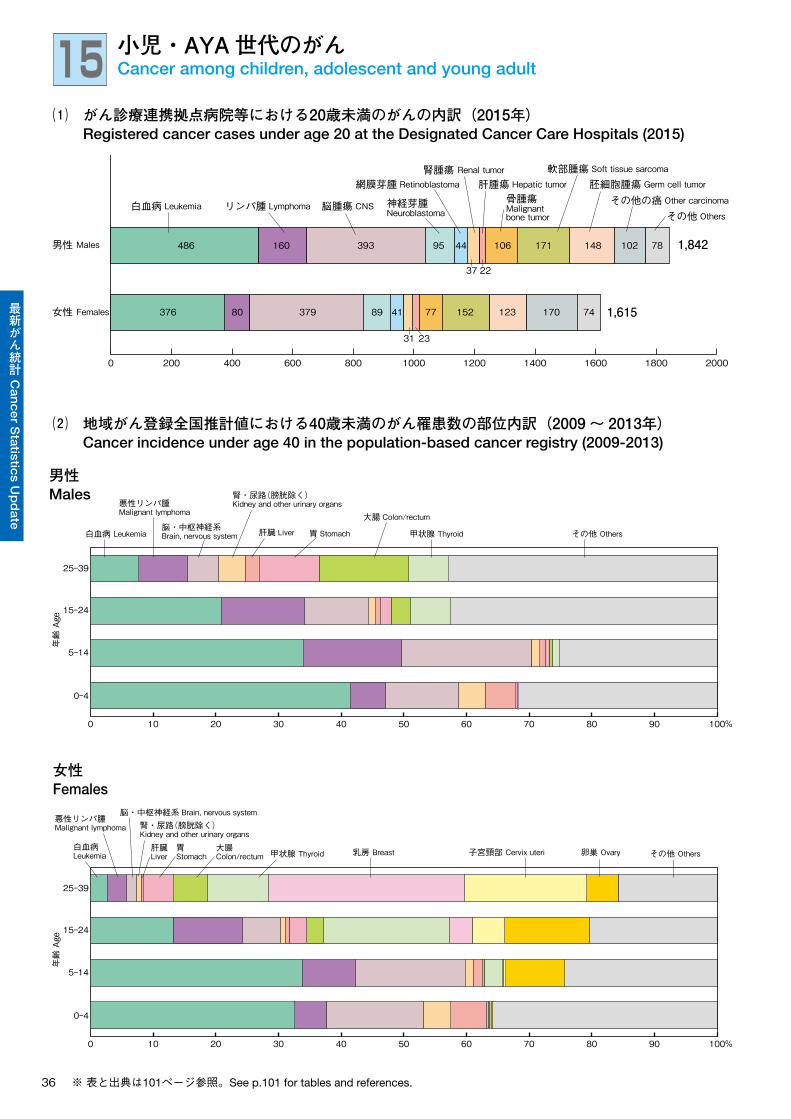
15 小児・AYA世代のがんCancer among children, adolescent and young adult
⑴ がん診療連携拠点病院等における20歳未満のがんの内訳(2015年) Registered cancer cases under age 20 at the Designated Cancer Care Hospitals (2015)
⑵ 地域がん登録全国推計値における40歳未満のがん罹患数の部位内訳(2009~ 2013年) Cancer incidence under age 40 in the population-based cancer registry (2009-2013)
0 200 400 600 800 1000 1200 1400 1600 1800 2000
男性 Males
白血病 Leukemia
486
376 80 379 89 41 77 152 123 170 74
31 23
160 393 95 44 106 171 102 1,842
1,615
148
37
リンパ腫 Lymphoma 脳腫瘍 CNS 神経芽腫Neuroblastoma
網膜芽腫 Retinoblastoma腎腫瘍 Renal tumor
肝腫瘍 Hepatic tumor骨腫瘍Malignantbone tumor
軟部腫瘍 Soft tissue sarcoma
胚細胞腫瘍 Germ cell tumor
その他の癌 Other carcinoma
その他 Others
女性 Females
78
22
男性Males
女性Females
年齢
Age
胃 Stomach
大腸 Colon/rectum
腎・尿路(膀胱除く)Kidney and other urinary organs
脳・中枢神経系Brain, nervous system 甲状腺 Thyroid
悪性リンパ腫Malignant lymphoma
白血病 Leukemia その他 Others肝臓 Liver
25-39
15-24
5-14
0-4
0 10 20 30 40 50 60 70 80 90 100%
年齢
Age
胃Stomach
大腸Colon/rectum
腎・尿路(膀胱除く)Kidney and other urinary organs
脳・中枢神経系 Brain, nervous system
甲状腺 Thyroid
悪性リンパ腫Malignant lymphoma
白血病Leukemia その他 Others
肝臓Liver 乳房 Breast 子宮頸部 Cervix uteri 卵巣 Ovary
25-39
15-24
5-14
0-4
0 10 20 30 40 50 60 70 80 90 100%
※ 表と出典は101ページ参照。See p.101 for tables and references.
37
最新がん統計 C
an
cer S
tatistic
s Up
date
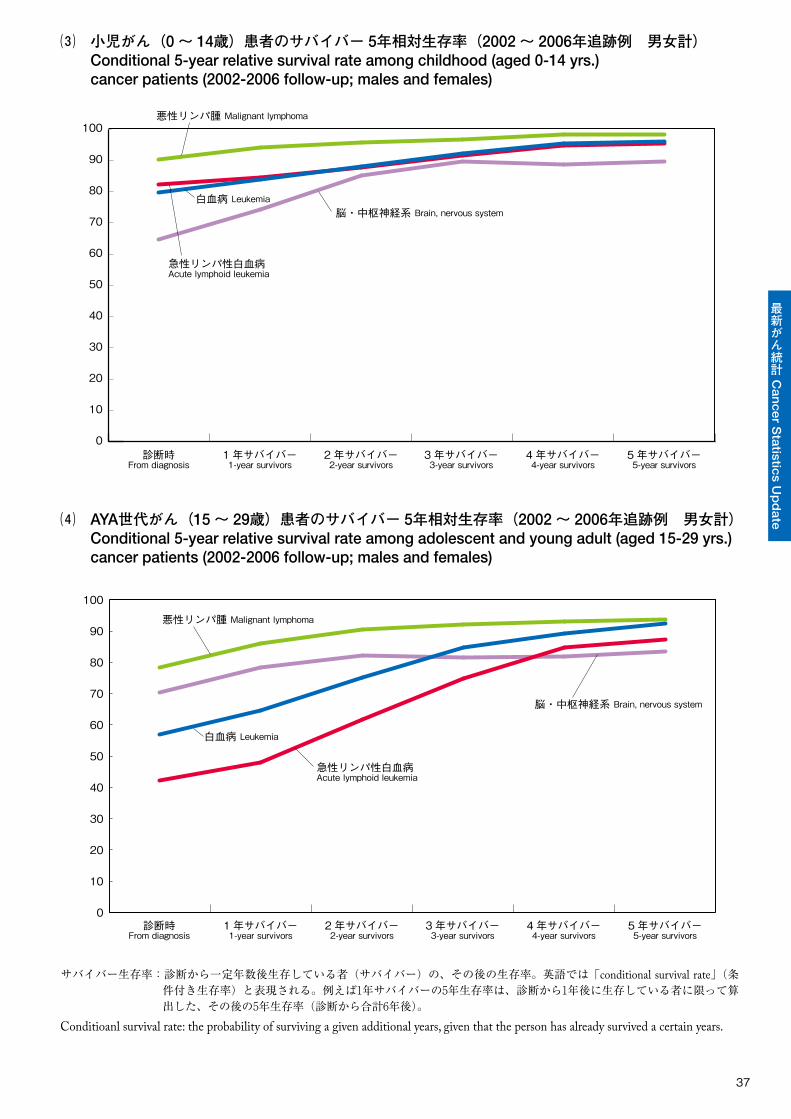
⑶ 小児がん(0~ 14歳)患者のサバイバー 5年相対生存率(2002~ 2006年追跡例 男女計) Conditional 5-year relative survival rate among childhood (aged 0-14 yrs.) cancer patients (2002-2006 follow-up; males and females)
⑷ AYA世代がん(15~ 29歳)患者のサバイバー 5年相対生存率(2002~ 2006年追跡例 男女計) Conditional 5-year relative survival rate among adolescent and young adult (aged 15-29 yrs.) cancer patients (2002-2006 follow-up; males and females)
0
10
20
30
40
50
60
70
80
90
100
白血病 Leukemia
急性リンパ性白血病Acute lymphoid leukemia
診断時From diagnosis
1 年サバイバー1-year survivors
2 年サバイバー2-year survivors
3 年サバイバー3-year survivors
4 年サバイバー4-year survivors
5 年サバイバー5-year survivors
脳・中枢神経系 Brain, nervous system
悪性リンパ腫 Malignant lymphoma
0
10
20
30
40
50
60
70
80
90
100
白血病 Leukemia
急性リンパ性白血病Acute lymphoid leukemia
診断時From diagnosis
1 年サバイバー1-year survivors
2 年サバイバー2-year survivors
3 年サバイバー3-year survivors
4 年サバイバー4-year survivors
5 年サバイバー5-year survivors
脳・中枢神経系 Brain, nervous system
悪性リンパ腫 Malignant lymphoma
サバイバー生存率:診断から一定年数後生存している者(サバイバー)の、その後の生存率。英語では「conditional survival rate」(条件付き生存率)と表現される。例えば1年サバイバーの5年生存率は、診断から1年後に生存している者に限って算出した、その後の5年生存率(診断から合計6年後)。
Conditioanl survival rate: the probability of surviving a given additional years, given that the person has already survived a certain years.
38
年次推移 Tre
nd
in C
an
cer S
tatistic
s
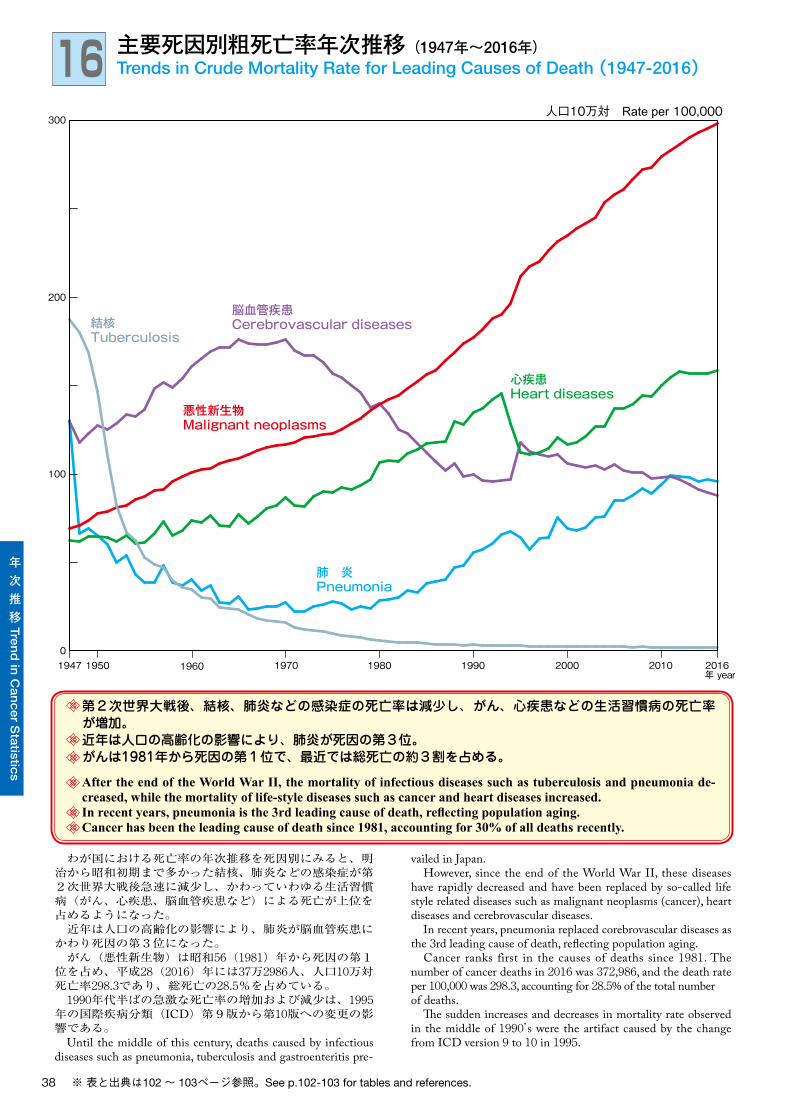
16 主要死因別粗死亡率年次推移(1947年~2016年)Trends in Crude Mortality Rate for Leading Causes of Death (1947-2016)
第2次世界大戦後、結核、肺炎などの感染症の死亡率は減少し、がん、心疾患などの生活習慣病の死亡率 が増加。近年は人口の高齢化の影響により、肺炎が死因の第3位。がんは1981年から死因の第1位で、最近では総死亡の約3割を占める。
After the end of the World War II, the mortality of infectious diseases such as tuberculosis and pneumonia de-creased, while the mortality of life-style diseases such as cancer and heart diseases increased.In recent years, pneumonia is the 3rd leading cause of death, reflecting population aging.Cancer has been the leading cause of death since 1981, accounting for 30% of all deaths recently.
わが国における死亡率の年次推移を死因別にみると、明治から昭和初期まで多かった結核、肺炎などの感染症が第2次世界大戦後急速に減少し、かわっていわゆる生活習慣病(がん、心疾患、脳血管疾患など)による死亡が上位を占めるようになった。 近年は人口の高齢化の影響により、肺炎が脳血管疾患にかわり死因の第3位になった。 がん(悪性新生物)は昭和56(1981)年から死因の第1位を占め、平成28(2016)年には37万2986人、人口10万対死亡率298.3であり、総死亡の28.5%を占めている。 1990年代半ばの急激な死亡率の増加および減少は、1995年の国際疾病分類(ICD)第9版から第10版への変更の影響である。 Until the middle of this century, deaths caused by infectious diseases such as pneumonia, tuberculosis and gastroenteritis pre-
vailed in Japan. However, since the end of the World War II, these diseases have rapidly decreased and have been replaced by so-called life style related diseases such as malignant neoplasms (cancer), heart diseases and cerebrovascular diseases. In recent years, pneumonia replaced corebrovascular diseases as the 3rd leading cause of death, re�ecting population aging. Cancer ranks first in the causes of deaths since 1981. The number of cancer deaths in 2016 was 372,986, and the death rate per 100,000 was 298.3, accounting for 28.5% of the total numberof deaths. �e sudden increases and decreases in mortality rate observed in the middle of 1990’s were the artifact caused by the change from ICD version 9 to 10 in 1995.
※ 表と出典は102~ 103ページ参照。See p.102-103 for tables and references.
2016
100
0
200
300
1947 1950 1960 1970 1980 1990 2000 2010年 year
悪性新生物Malignant neoplasms
心疾患Heart diseases
肺 炎Pneumonia
脳血管疾患Cerebrovascular diseases結核
Tuberculosis
人口10万対 Rate per 100,000
39
年次推移 Tre
nd
in C
an
cer S
tatistic
s
17 主要死因別年齢調整死亡率年次推移(1947年~2016年)Trends in Age-adjusted Mortality Rate for Leading Causes of Death (1947-2016)
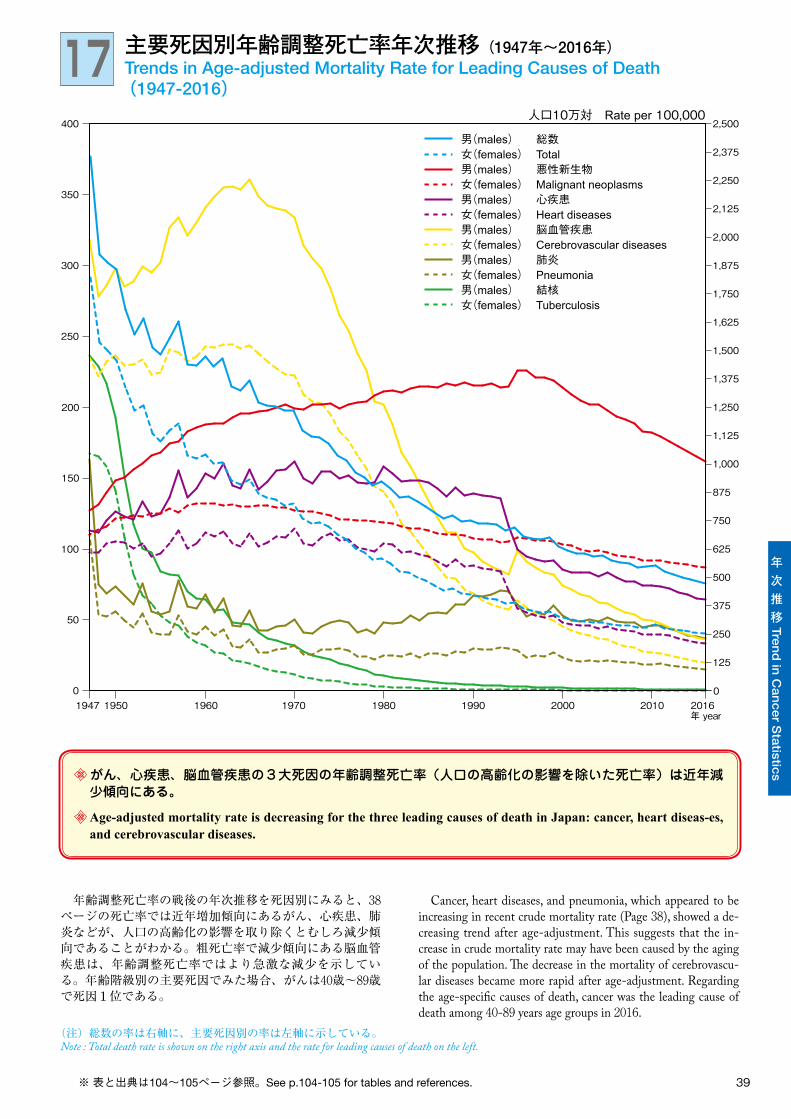
年齢調整死亡率の戦後の年次推移を死因別にみると、38ページの死亡率では近年増加傾向にあるがん、心疾患、肺炎などが、人口の高齢化の影響を取り除くとむしろ減少傾向であることがわかる。粗死亡率で減少傾向にある脳血管疾患は、年齢調整死亡率ではより急激な減少を示してい る。年齢階級別の主要死因でみた場合、がんは40歳~89歳で死因1位である。
がん、心疾患、脳血管疾患の3大死因の年齢調整死亡率(人口の高齢化の影響を除いた死亡率)は近年減 少傾向にある。
Age-adjusted mortality rate is decreasing for the three leading causes of death in Japan: cancer, heart diseas-es, and cerebrovascular diseases.
(注)総数の率は右軸に、主要死因別の率は左軸に示している。Note : Total death rate is shown on the right axis and the rate for leading causes of death on the left.
Cancer, heart diseases, and pneumonia, which appeared to be increasing in recent crude mortality rate (Page 38), showed a de-creasing trend after age-adjustment. This suggests that the in-crease in crude mortality rate may have been caused by the aging of the population. �e decrease in the mortality of cerebrovascu-lar diseases became more rapid after age-adjustment. Regarding the age-speci�c causes of death, cancer was the leading cause of death among 40-89 years age groups in 2016.
※ 表と出典は104~105ページ参照。See p.104-105 for tables and references.
男(males) 総数女(females) Total男(males) 悪性新生物女(females) Malignant neoplasms男(males) 心疾患女(females) Heart diseases男(males) 脳血管疾患女(females) Cerebrovascular diseases男(males) 肺炎女(females) Pneumonia男(males) 結核女(females) Tuberculosis
50
100
150
200
250
300
400
350
01947 1950 1960 1970 1980 1990 2000 2010 2016
年 year
2,250
2,125
2,000
1,875
1,750
1,625
1,500
1,375
1,250
1,125
1,000
875
750
625
500
375
250
125
0
2,375
2,500人口10万対 Rate per 100,000
40
年次推移 Tre
nd
in C
an
cer S
tatistic
s
18 部位別がん死亡数年次推移(1965年~2016年)Trends in Number of Deaths, by Cancer Site(1965-2016)
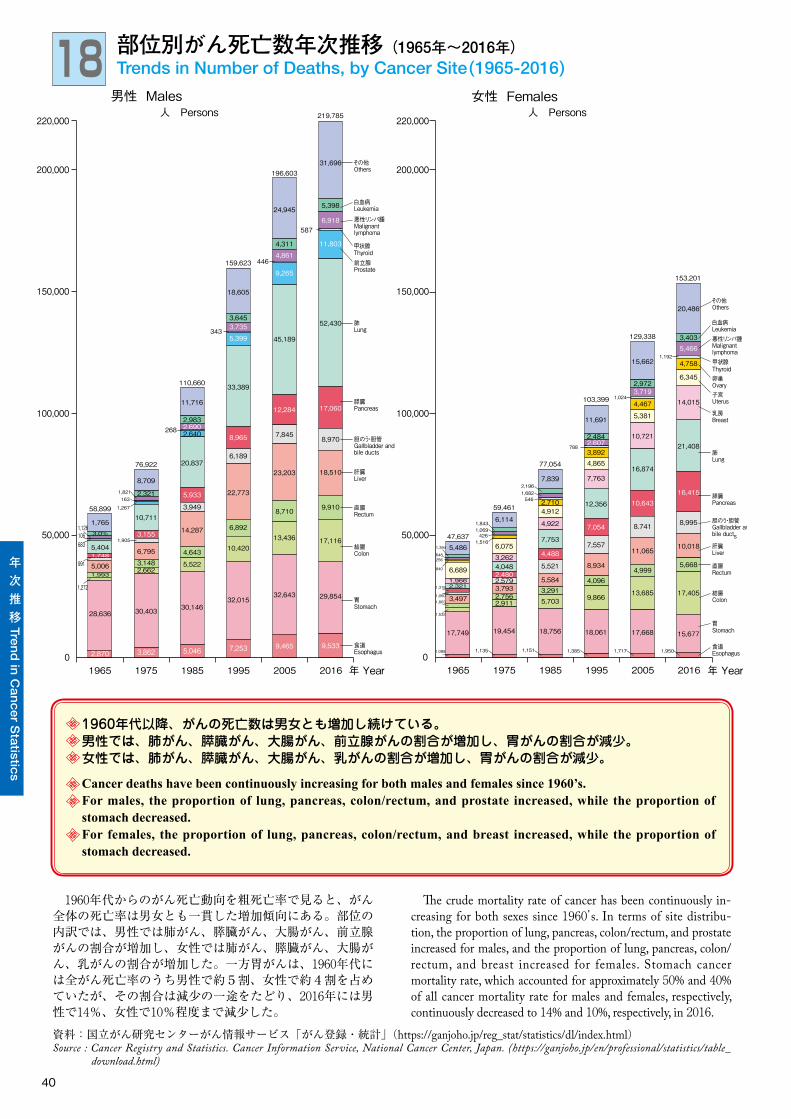
1960年代以降、がんの死亡数は男女とも増加し続けている。男性では、肺がん、膵臓がん、大腸がん、前立腺がんの割合が増加し、胃がんの割合が減少。女性では、肺がん、膵臓がん、大腸がん、乳がんの割合が増加し、胃がんの割合が減少。
Cancer deaths have been continuously increasing for both males and females since 1960’s.For males, the proportion of lung, pancreas, colon/rectum, and prostate increased, while the proportion of stomach decreased.For females, the proportion of lung, pancreas, colon/rectum, and breast increased, while the proportion of stomach decreased.
1960年代からのがん死亡動向を粗死亡率で見ると、がん全体の死亡率は男女とも一貫した増加傾向にある。部位の内訳では、男性では肺がん、膵臓がん、大腸がん、前立腺がんの割合が増加し、女性では肺がん、膵臓がん、大腸がん、乳がんの割合が増加した。一方胃がんは、1960年代には全がん死亡率のうち男性で約5割、女性で約4割を占めていたが、その割合は減少の一途をたどり、2016年には男性で14%、女性で10%程度まで減少した。
�e crude mortality rate of cancer has been continuously in-creasing for both sexes since 1960’s. In terms of site distribu-tion, the proportion of lung, pancreas, colon/rectum, and prostate increased for males, and the proportion of lung, pancreas, colon/rectum, and breast increased for females. Stomach cancer mortality rate, which accounted for approximately 50% and 40% of all cancer mortality rate for males and females, respectively, continuously decreased to 14% and 10%, respectively, in 2016.
資料:国立がん研究センターがん情報サービス「がん登録・統計」(https://ganjoho.jp/reg_stat/statistics/dl/index.html)Source : Cancer Registry and Statistics. Cancer Information Service, National Cancer Center, Japan. (https://ganjoho.jp/en/professional/statistics/table_
download.html)
0
200,000
150,000
100,000
50,000
220,000
1,7653.0%
1,748
683106
5,404
991 5,0061,993
1,272
28,636
2,870
1,126
58,899
8,709
2,321
10,711
3,155
6,795
3,1482,662
30,403
3,862
1,821
1,267
163
1,905
76,922
11,716
2,983
20,837
5,933
3,949
14,287
4,643
5,522
30,146
5,046
2,6402,690
110,660
268
18,605
3,6453,735
5,399
33,389
8,965
6,189
22,773
6,892
10,420
32,015
7,253
159,623
343
24,945
4,311
4,861
9,265
45,189
12,284
7,845
23,203
8,710
13,436
32,643
9,465
196,603
446
219,785
5,398
31,696
6,918587
11,803
52,430
17,060
8,970
18,510
9,910
17,116
29,854
9,533
前立腺Prostate
その他Others
白血病
甲状腺Thyroid
Leukemia
悪性リンパ腫Malignant
lymphoma
肺Lung
膵臓Pancreas
胆のう・胆管Gallbladder andbile ducts
肝臓Liver
食道Esophagus
胃Stomach
結腸Colon
直腸Rectum
男性 Males人 Persons
1965 1975 1985 1995 年 Year2005 20161965 1975 1985 1995 年 Year2005 20160
その他Others
白血病Leukemia悪性リンパ腫Malignant lymphoma
卵巣Ovary子宮Uterus
乳房Breast
肺Lung
膵臓Pancreas
胆のう・胆管Gallbladder andbile ducts肝臓Liver
食道Esophagus
胃Stomach
結腸Colon
直腸Rectum
甲状腺Thyroid
5,486
6,6891,9662,321
3,497
17,749
1,394
648256
840
1,318
1,0501,803
1,532
1,088
47,637
6,114
6,075
3,2624,0482,4802,5793,7932,7562,911
19,454
1,8431,069
4261,516
1,135
59,461
7,839
4,9122,710
4,922
7,753
4,488
5,521
5,5843,2915,703
18,756
1,682546
1,151
2,196
77,054
11,691
2,4842,6073,8924,865
7,763
12,356
7,054
7,557
8,934
4,096
9,866
18,061
1,385
103,399
788
1,024
15,662
129,338
2,9723,719
4,467
5,381
10,721
16,874
10,643
8.741
11,065
4,999
13,685
17,668
1,717
1,192
20,486
3,4035,466
4,758
6,345
14,015
21,408
16,415
8,995
10,018
5,668
17,405
15,677
1,950
153,201
女性 Females人 Persons
200,000
150,000
100,000
50,000
220,000
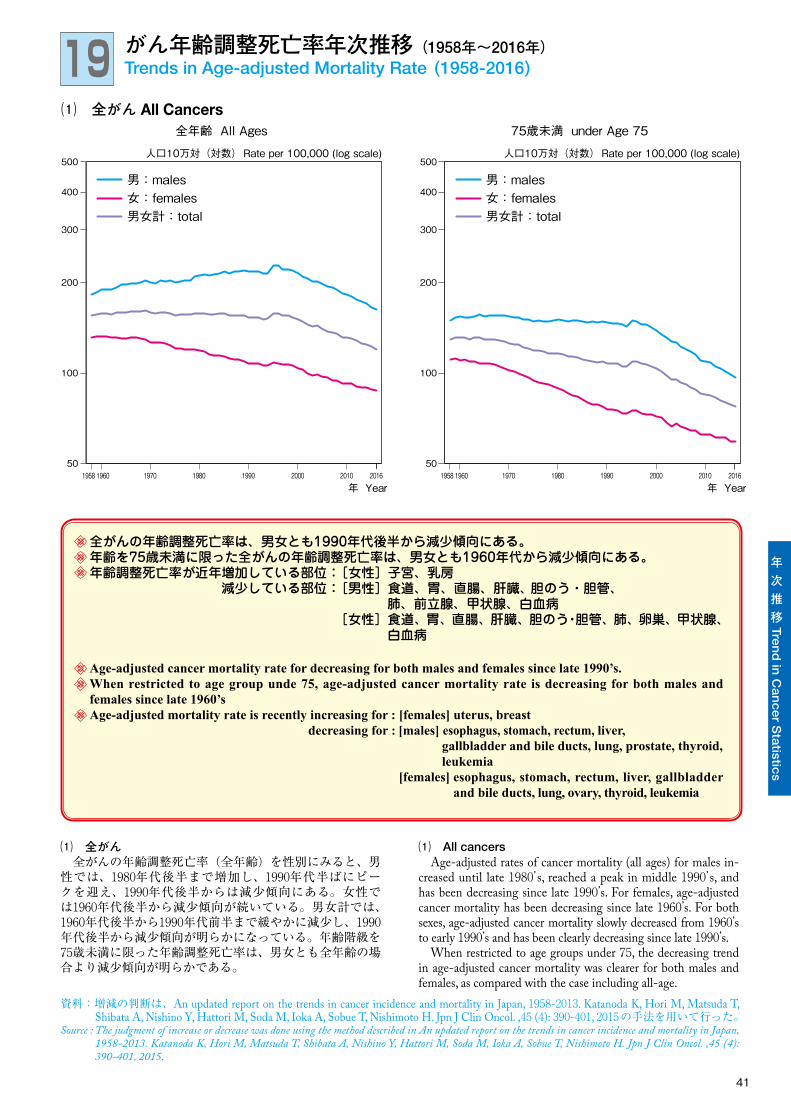
41
年次推移 Tre
nd
in C
an
cer S
tatistic
s
19 がん年齢調整死亡率年次推移(1958年~2016年)Trends in Age-adjusted Mortality Rate (1958-2016)
⑴ 全がん 全がんの年齢調整死亡率(全年齢)を性別にみると、男性では、1980年代後半まで増加し、1990年代半ばにピー クを迎え、1990年代後半からは減少傾向にある。女性で は1960年代後半から減少傾向が続いている。男女計では、1960年代後半から1990年代前半まで緩やかに減少し、1990年代後半から減少傾向が明らかになっている。年齢階級を75歳未満に限った年齢調整死亡率は、男女とも全年齢の場合より減少傾向が明らかである。
全がんの年齢調整死亡率は、男女とも1990年代後半から減少傾向にある。年齢を75歳未満に限った全がんの年齢調整死亡率は、男女とも1960年代から減少傾向にある。年齢調整死亡率が近年増加している部位:[女性]子宮、乳房
減少している部位:[男性]食道、胃、直腸、肝臓、 胆のう・胆管、肺、前立腺、甲状腺、白血病
[女性]食道、胃、直腸、肝臓、胆のう・胆管、肺、卵巣、甲状腺、白血病
Age-adjusted cancer mortality rate for decreasing for both males and females since late 1990’s.When restricted to age group unde 75, age-adjusted cancer mortality rate is decreasing for both males and females since late 1960’sAge-adjusted mortality rate is recently increasing for : [females] uterus, breast
decreasing for : [males] esophagus, stomach, rectum, liver, gallbladder and bile ducts, lung, prostate, thyroid,
leukemia[females] esophagus, stomach, rectum, liver, gallbladder
and bile ducts, lung, ovary, thyroid, leukemia
⑴ All cancers Age-adjusted rates of cancer mortality (all ages) for males in-creased until late 1980’s, reached a peak in middle 1990’s, and has been decreasing since late 1990’s. For females, age-adjusted cancer mortality has been decreasing since late 1960’s. For both sexes, age-adjusted cancer mortality slowly decreased from 1960’s to early 1990’s and has been clearly decreasing since late 1990’s. When restricted to age groups under 75, the decreasing trend in age-adjusted cancer mortality was clearer for both males and females, as compared with the case including all-age.
資料:増減の判断は、An updated report on the trends in cancer incidence and mortality in Japan, 1958-2013. Katanoda K, Hori M, Matsuda T, Shibata A, Nishino Y, Hattori M, Soda M, Ioka A, Sobue T, Nishimoto H. Jpn J Clin Oncol. ,45 (4): 390-401, 2015の手法を用いて行った。
Source : The judgment of increase or decrease was done using the method described in An updated report on the trends in cancer incidence and mortality in Japan, 1958-2013. Katanoda K, Hori M, Matsuda T, Shibata A, Nishino Y, Hattori M, Soda M, Ioka A, Sobue T, Nishimoto H. Jpn J Clin Oncol. ,45 (4): 390-401, 2015.
男:males女:females男女計:total
50
500
400
300
200
100
全年齢 All Ages 75歳未満 under Age 75
人口10万対(対数) Rate per 100,000 (log scale)
年 Year
人口10万対(対数) Rate per 100,000 (log scale)
⑴ 全がん All Cancers
男:males女:females男女計:total
50
500
400
300
200
100
年 Year1958 1960 1970 1980 1990 2000 2010 2016 1958 1960 1970 1980 1990 2000 2010 2016
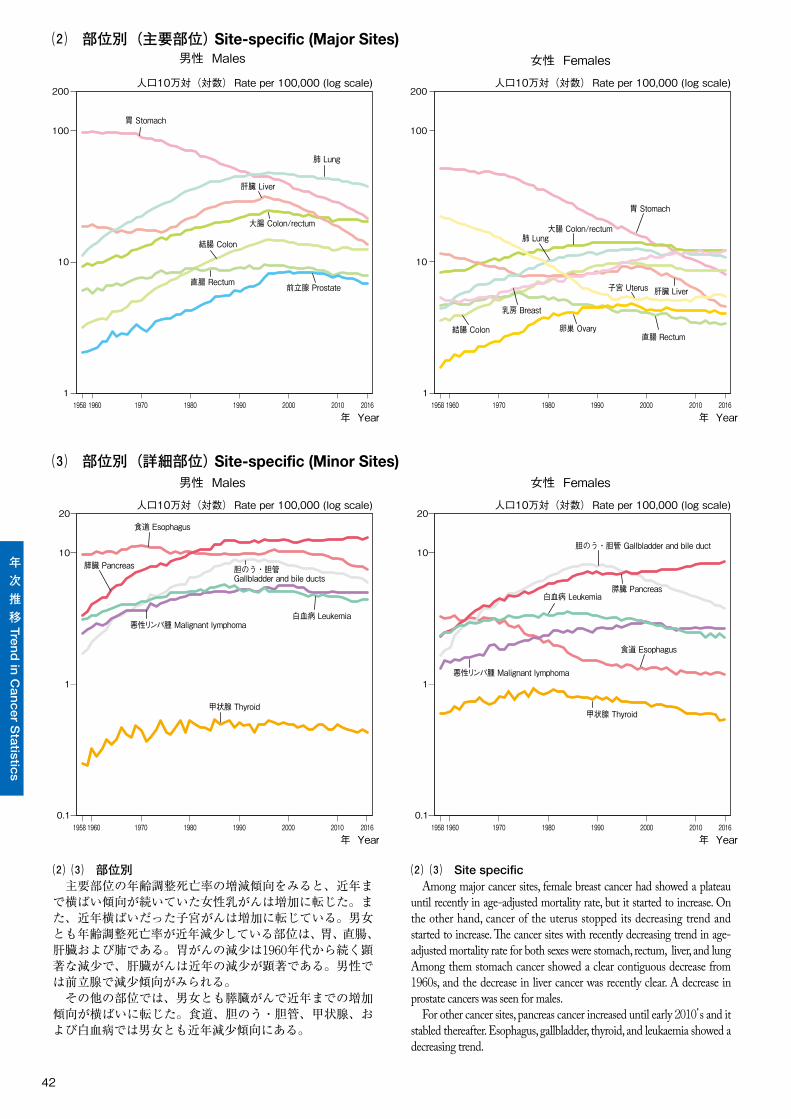
42
年次推移 Tre
nd
in C
an
cer S
tatistic
s
⑵�⑶ 部位別 主要部位の年齢調整死亡率の増減傾向をみると、近年まで横ばい傾向が続いていた女性乳がんは増加に転じた。また、近年横ばいだった子宮がんは増加に転じている。男女とも年齢調整死亡率が近年減少している部位は、胃、直腸、肝臓および肺である。胃がんの減少は1960年代から続く顕著な減少で、肝臓がんは近年の減少が顕著である。男性では前立腺で減少傾向がみられる。 その他の部位では、男女とも膵臓がんで近年までの増加傾向が横ばいに転じた。食道、胆のう・胆管、甲状腺、および白血病では男女とも近年減少傾向にある。
⑵�⑶ Site specific Among major cancer sites, female breast cancer had showed a plateau until recently in age-adjusted mortality rate, but it started to increase. On the other hand, cancer of the uterus stopped its decreasing trend and started to increase. �e cancer sites with recently decreasing trend in age-adjusted mortality rate for both sexes were stomach, rectum, liver, and lung Among them stomach cancer showed a clear contiguous decrease from 1960s, and the decrease in liver cancer was recently clear. A decrease in prostate cancers was seen for males. For other cancer sites, pancreas cancer increased until early 2010’s and it stabled thereafter. Esophagus, gallbladder, thyroid, and leukaemia showed a decreasing trend.
200
男性 Males 女性 Females
1 1
10
100
200
10
100
人口10万対(対数) Rate per 100,000 (log scale)
年 Year
人口10万対(対数) Rate per 100,000 (log scale)
年 Year
20
男性 Males 女性 Females
10
人口10万対(対数) Rate per 100,000 (log scale) 人口10万対(対数) Rate per 100,000 (log scale)
0.1 0.1
年 Year 年 Year
20
10
⑵ 部位別(主要部位) Site-specific (Major Sites)
⑶ 部位別(詳細部位) Site-specific (Minor Sites)
1 1
1958 1960 1970 1980 1990 2000 2010 2016 1958 1960 1970 1980 1990 2000 2010 2016
1958 1960 1970 1980 1990 2000 2010 2016 1958 1960 1970 1980 1990 2000 2010 2016
胃 Stomach
大腸 Colon/rectum
乳房 Breast
結腸 Colon
肝臓 Liver子宮 Uterus
卵巣 Ovary直腸 Rectum
肺 Lung
肺 Lung
胃 Stomach
肝臓 Liver
大腸 Colon/rectum
結腸 Colon
直腸 Rectum 前立腺 Prostate
膵臓 Pancreas
食道 Esophagus
白血病 Leukemia
甲状腺 Thyroid
胆のう・胆管 Gallbladder and bile ducts
悪性リンパ腫 Malignant lymphoma
胆のう・胆管 Gallbladder and bile duct
悪性リンパ腫 Malignant lymphoma
食道 Esophagus
膵臓 Pancreas白血病 Leukemia
甲状腺 Thyroid
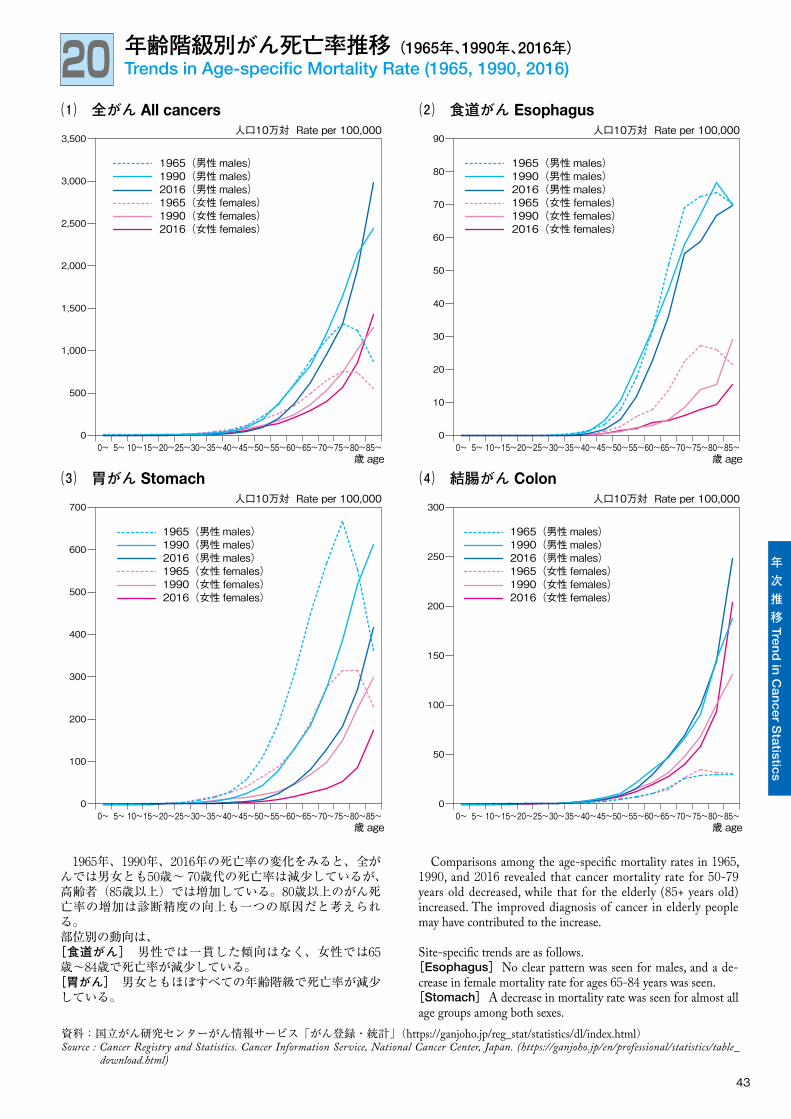
43
年次推移 Tre
nd
in C
an
cer S
tatistic
s
20 年齢階級別がん死亡率推移(1965年、1990年、2016年)Trends in Age-specific Mortality Rate (1965, 1990, 2016)
1965年、1990年、2016年の死亡率の変化をみると、全がんでは男女とも50歳~ 70歳代の死亡率は減少しているが、高齢者(85歳以上)では増加している。80歳以上のがん死亡率の増加は診断精度の向上も一つの原因だと考えられる。部位別の動向は、[食道がん] 男性では一貫した傾向はなく、女性では65 歳~84歳で死亡率が減少している。[胃がん] 男女ともほぼすべての年齢階級で死亡率が減少している。
Comparisons among the age-speci�c mortality rates in 1965, 1990, and 2016 revealed that cancer mortality rate for 50-79 years old decreased, while that for the elderly (85+ years old) increased. The improved diagnosis of cancer in elderly people may have contributed to the increase.
Site-speci�c trends are as follows.[Esophagus]No clear pattern was seen for males, and a de-crease in female mortality rate for ages 65-84 years was seen.[Stomach]A decrease in mortality rate was seen for almost all age groups among both sexes.
資料:国立がん研究センターがん情報サービス「がん登録・統計」(https://ganjoho.jp/reg_stat/statistics/dl/index.html)Source : Cancer Registry and Statistics. Cancer Information Service, National Cancer Center, Japan. (https://ganjoho.jp/en/professional/statistics/table_
download.html)
00
500
1,000
1,500
2,000
2,500
3,000
3,500
0
100
200
300
400
500
600
700
0~ 5~ 10~15~20~25~30~35~40~45~50~55~60~65~70~75~80~85~歳 age 歳 age
歳 age 歳 age
0~ 5~ 10~15~20~25~30~35~40~45~50~55~60~65~70~75~80~85~
0~ 5~ 10~15~20~25~30~35~40~45~50~55~60~65~70~75~80~85~ 0~ 5~ 10~15~20~25~30~35~40~45~50~55~60~65~70~75~80~85~
人口10万対 Rate per 100,000
人口10万対 Rate per 100,000 人口10万対 Rate per 100,000
人口10万対 Rate per 100,000
⑴ 全がん All cancers
⑶ 胃がん Stomach
⑵ 食道がん Esophagus
⑷ 結腸がん Colon
1965(男性 males)1990(男性 males)2016(男性 males)1965(女性 females)1990(女性 females)2016(女性 females)
0
10
20
30
40
50
60
70
80
90
1965(男性 males)1990(男性 males)2016(男性 males)1965(女性 females)1990(女性 females)2016(女性 females)
1965(男性 males)1990(男性 males)2016(男性 males)1965(女性 females)1990(女性 females)2016(女性 females)
0
50
100
150
200
250
300
1965(男性 males)1990(男性 males)2016(男性 males)1965(女性 females)1990(女性 females)2016(女性 females)
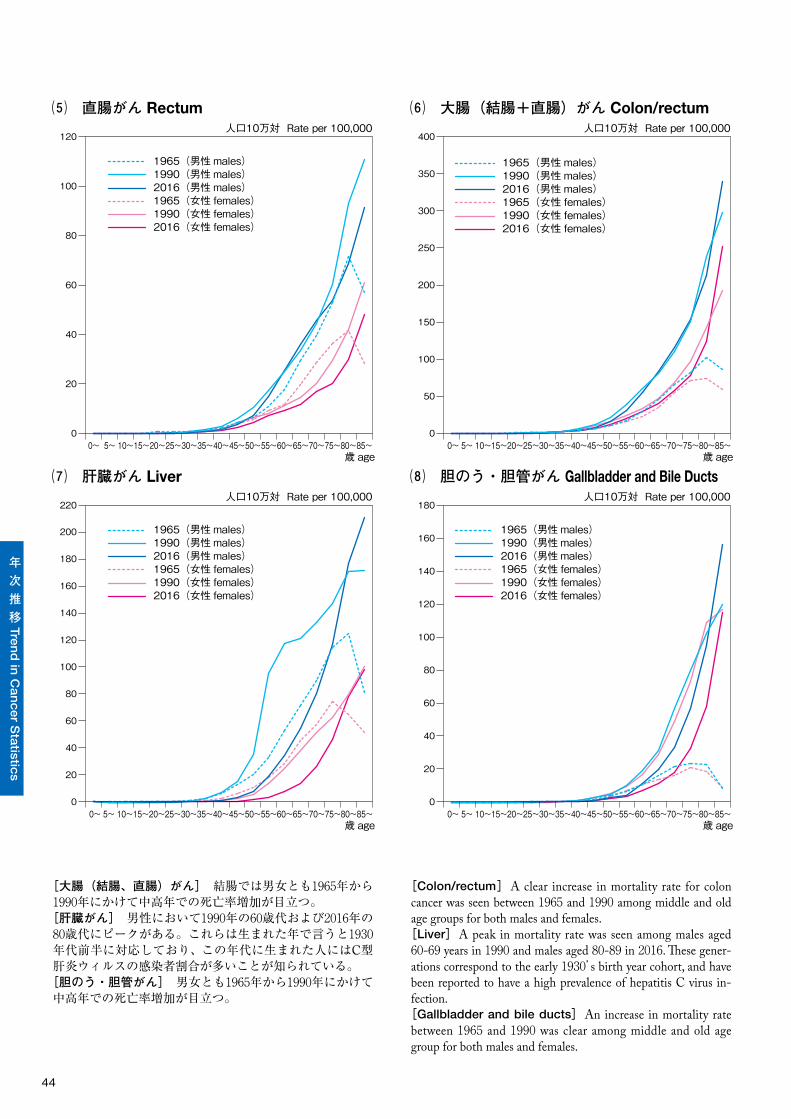
44
年次推移 Tre
nd
in C
an
cer S
tatistic
s
[大腸(結腸、直腸)がん] 結腸では男女とも1965年から1990年にかけて中高年での死亡率増加が目立つ。[肝臓がん] 男性において1990年の60歳代および2016年の80歳代にピークがある。これらは生まれた年で言うと1930年代前半に対応しており、この年代に生まれた人にはC型肝炎ウィルスの感染者割合が多いことが知られている。[胆のう・胆管がん] 男女とも1965年から1990年にかけて中高年での死亡率増加が目立つ。
[Colon/rectum]A clear increase in mortality rate for colon cancer was seen between 1965 and 1990 among middle and old age groups for both males and females.[Liver]A peak in mortality rate was seen among males aged 60-69 years in 1990 and males aged 80-89 in 2016. �ese gener-ations correspond to the early 1930’s birth year cohort, and have been reported to have a high prevalence of hepatitis C virus in-fection.[Gallbladder and bile ducts]An increase in mortality rate between 1965 and 1990 was clear among middle and old age group for both males and females.
0
20
40
60
80
100
120
50
100
150
200
250
300
350
400
0
20
40
60
80
100
120
140
160
180
200
0
20
40
60
80
100
120
140
160
歳 age0~ 5~ 10~15~20~25~30~35~40~45~50~55~60~65~70~75~80~85~
歳 age
0~ 5~ 10~15~20~25~30~35~40~45~50~55~60~65~70~75~80~85~歳 age
0~ 5~ 10~15~20~25~30~35~40~45~50~55~60~65~70~75~80~85~
1965(男性 males)1990(男性 males)2016(男性 males)1965(女性 females)1990(女性 females)2016(女性 females)
1965(男性 males)1990(男性 males)2016(男性 males)1965(女性 females)1990(女性 females)2016(女性 females)
1965(男性 males)1990(男性 males)2016(男性 males)1965(女性 females)1990(女性 females)2016(女性 females)
1965(男性 males)1990(男性 males)2016(男性 males)1965(女性 females)1990(女性 females)2016(女性 females)
人口10万対 Rate per 100,000
人口10万対 Rate per 100,000 人口10万対 Rate per 100,000
人口10万対 Rate per 100,000
⑸ 直腸がん Rectum
⑺ 肝臓がん Liver
⑹ 大腸(結腸+直腸)がん Colon/rectum
⑻ 胆のう・胆管がん Gallbladder and Bile Ducts
220
0~ 5~ 10~15~20~25~30~35~40~45~50~55~60~65~70~75~80~85~歳 age
0
180
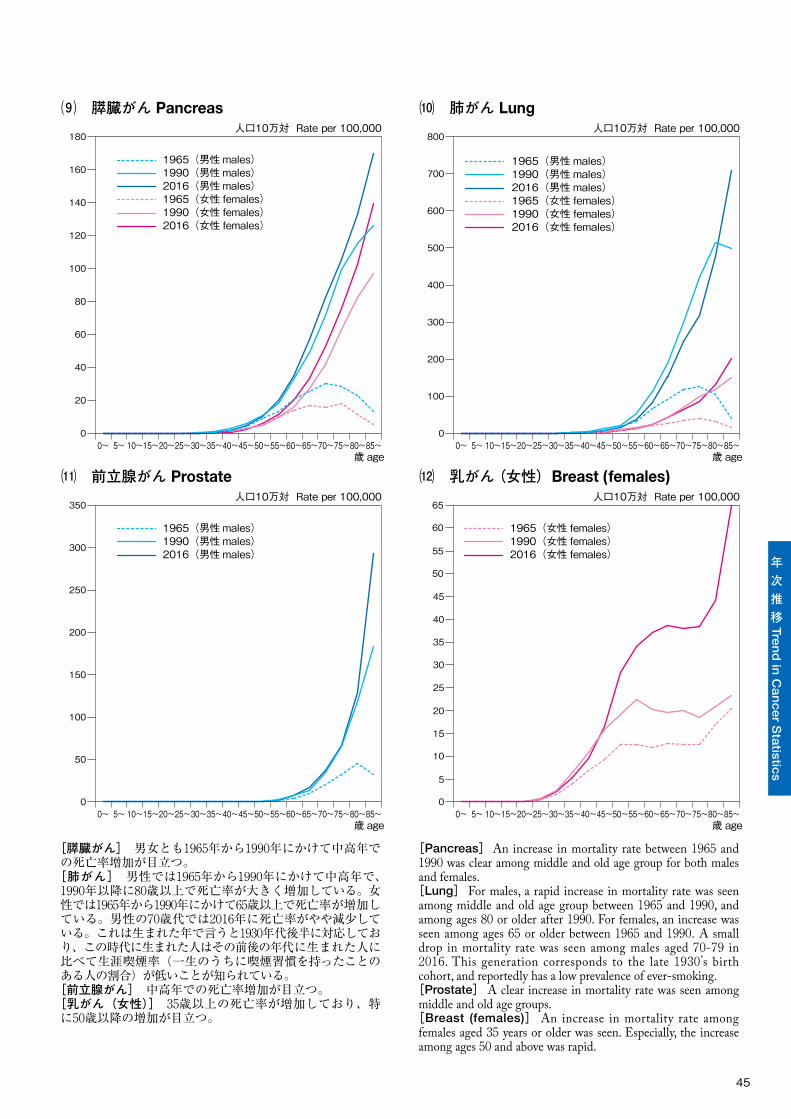
45
年次推移 Tre
nd
in C
an
cer S
tatistic
s
[膵臓がん] 男女とも1965年から1990年にかけて中高年での死亡率増加が目立つ。[肺がん] 男性では1965年から1990年にかけて中高年で、1990年以降に80歳以上で死亡率が大きく増加している。女性では1965年から1990年にかけて65歳以上で死亡率が増加している。男性の70歳代では2016年に死亡率がやや減少している。これは生まれた年で言うと1930年代後半に対応しており、この時代に生まれた人はその前後の年代に生まれた人に比べて生涯喫煙率(一生のうちに喫煙習慣を持ったことのある人の割合)が低いことが知られている。[前立腺がん] 中高年での死亡率増加が目立つ。[乳がん(女性)] 35歳以上の死亡率が増加しており、特に50歳以降の増加が目立つ。
[Pancreas] An increase in mortality rate between 1965 and 1990 was clear among middle and old age group for both males and females.[Lung] For males, a rapid increase in mortality rate was seen among middle and old age group between 1965 and 1990, and among ages 80 or older after 1990. For females, an increase was seen among ages 65 or older between 1965 and 1990. A small drop in mortality rate was seen among males aged 70-79 in 2016. This generation corresponds to the late 1930’s birth cohort, and reportedly has a low prevalence of ever-smoking.[Prostate]�A clear increase in mortality rate was seen among middle and old age groups.[Breast (females)]�An increase in mortality rate among females aged 35 years or older was seen. Especially, the increase among ages 50 and above was rapid.
0~ 5~ 10~15~20~25~30~35~40~45~50~55~60~65~70~75~80~85~ 0~ 5~ 10~15~20~25~30~35~40~45~50~55~60~65~70~75~80~85~
0~ 5~ 10~15~20~25~30~35~40~45~50~55~60~65~70~75~80~85~ 0~ 5~ 10~15~20~25~30~35~40~45~50~55~60~65~70~75~80~85~
0
20
40
60
80
100
120
140
160
180
0
100
200
300
400
500
600
700
800
0
50
100
150
200
250
300
350
0
5
10
15
20
25
30
35
40
45
50
55
歳 age 歳 age
歳 age 歳 age
65
60
1965(男性 males)1990(男性 males)2016(男性 males)1965(女性 females)1990(女性 females)2016(女性 females)
1965(男性 males)1990(男性 males)2016(男性 males)1965(女性 females)1990(女性 females)2016(女性 females)
1965(女性 females)1990(女性 females)2016(女性 females)
1965(男性 males)1990(男性 males)2016(男性 males)
人口10万対 Rate per 100,000
人口10万対 Rate per 100,000 人口10万対 Rate per 100,000
人口10万対 Rate per 100,000
⑼ 膵臓がん Pancreas
⑾ 前立腺がん Prostate
⑽ 肺がん Lung
⑿ 乳がん(女性) Breast (females)
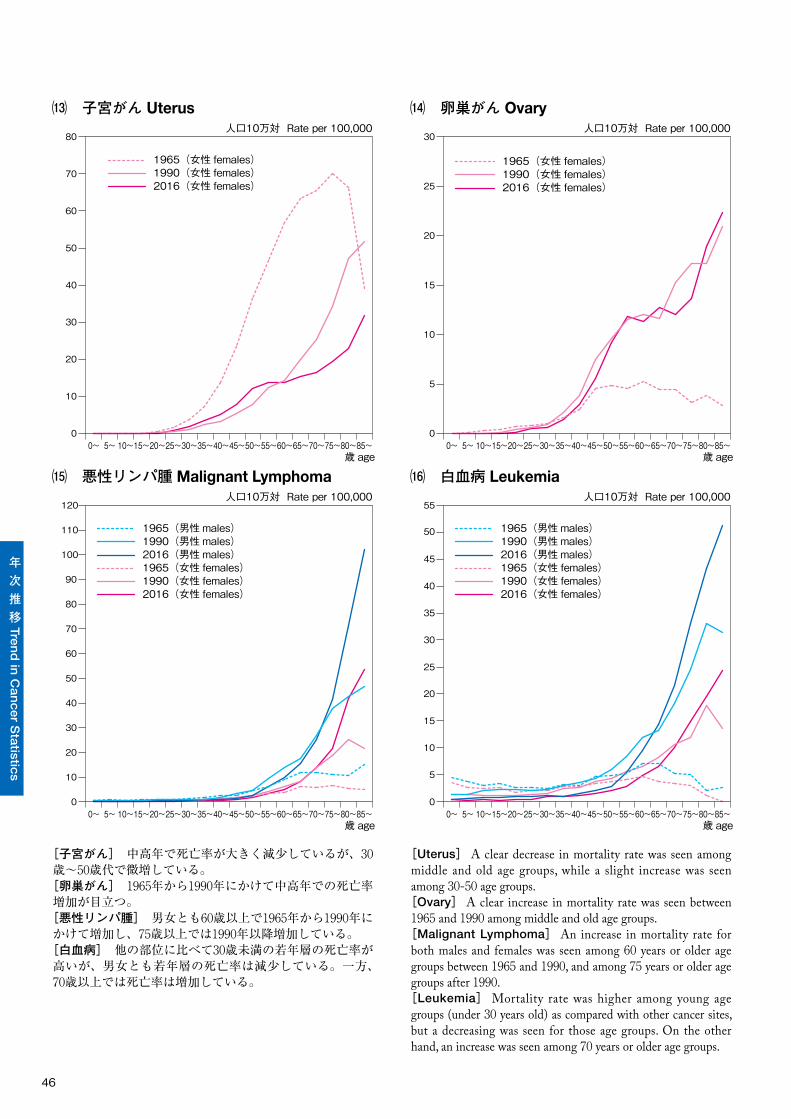
46
年次推移 Tre
nd
in C
an
cer S
tatistic
s
[子宮がん] 中高年で死亡率が大きく減少しているが、30歳~50歳代で微増している。[卵巣がん] 1965年から1990年にかけて中高年での死亡率増加が目立つ。[悪性リンパ腫] 男女とも60歳以上で1965年から1990年にかけて増加し、75歳以上では1990年以降増加している。[白血病] 他の部位に比べて30歳未満の若年層の死亡率が高いが、男女とも若年層の死亡率は減少している。一方、70歳以上では死亡率は増加している。
[Uterus]� A clear decrease in mortality rate was seen among middle and old age groups, while a slight increase was seen among 30-50 age groups.[Ovary]� A clear increase in mortality rate was seen between 1965 and 1990 among middle and old age groups.[Malignant Lymphoma]� An increase in mortality rate for both males and females was seen among 60 years or older age groups between 1965 and 1990, and among 75 years or older age groups after 1990.[Leukemia]� Mortality rate was higher among young age groups (under 30 years old) as compared with other cancer sites, but a decreasing was seen for those age groups. On the other hand, an increase was seen among 70 years or older age groups.
歳 age
0
10
20
30
40
50
60
70
80
歳 age
0
5
10
15
20
25
30
歳 age
0
5
10
15
20
25
30
35
40
45
55
50
0~ 5~ 10~15~20~25~30~35~40~45~50~55~60~65~70~75~80~85~ 0~ 5~ 10~15~20~25~30~35~40~45~50~55~60~65~70~75~80~85~
0~ 5~ 10~15~20~25~30~35~40~45~50~55~60~65~70~75~80~85~
1965(女性 females)1990(女性 females)2016(女性 females)
1965(女性 females)1990(女性 females)2016(女性 females)
1965(男性 males)1990(男性 males)2016(男性 males)1965(女性 females)1990(女性 females)2016(女性 females)
人口10万対 Rate per 100,000
人口10万対 Rate per 100,000 人口10万対 Rate per 100,000
⒀ 子宮がん Uterus
⒂ 悪性リンパ腫 Malignant Lymphoma
⒁ 卵巣がん Ovary
⒃ 白血病 Leukemia
歳 age
0
20
30
40
50
60
70
80
90
120
100
110
0~ 5~ 10~15~20~25~30~35~40~45~50~55~60~65~70~75~80~85~
1965(男性 males)1990(男性 males)2016(男性 males)1965(女性 females)1990(女性 females)2016(女性 females)
人口10万対 Rate per 100,000
10
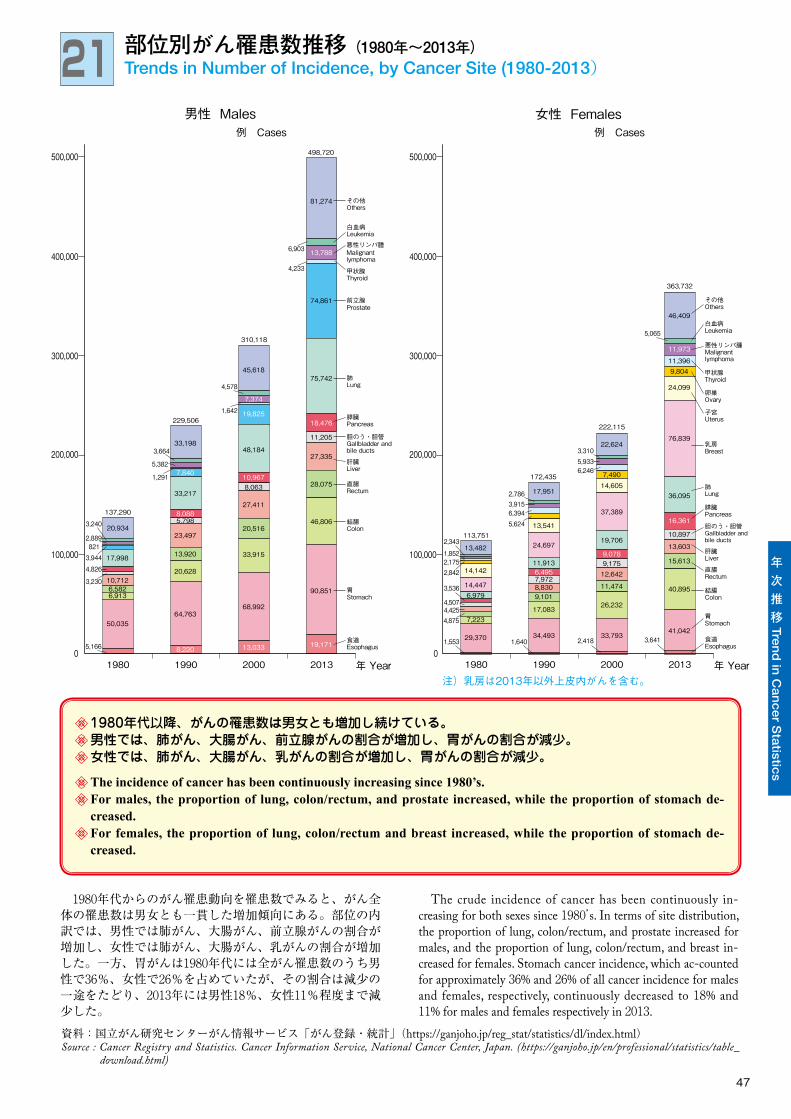
47
年次推移 Tre
nd
in C
an
cer S
tatistic
s
21 部位別がん罹患数推移(1980年~2013年)Trends in Number of Incidence, by Cancer Site (1980-2013)
1980年代からのがん罹患動向を罹患数でみると、がん全体の罹患数は男女とも一貫した増加傾向にある。部位の内訳では、男性では肺がん、大腸がん、前立腺がんの割合が増加し、女性では肺がん、大腸がん、乳がんの割合が増加した。一方、胃がんは1980年代には全がん罹患数のうち男性で36%、女性で26%を占めていたが、その割合は減少の一途をたどり、2013年には男性18%、女性11%程度まで減少した。
The crude incidence of cancer has been continuously in-creasing for both sexes since 1980’s. In terms of site distribution, the proportion of lung, colon/rectum, and prostate increased for males, and the proportion of lung, colon/rectum, and breast in-creased for females. Stomach cancer incidence, which ac-counted for approximately 36% and 26% of all cancer incidence for males and females, respectively, continuously decreased to 18% and 11% for males and females respectively in 2013.
資料:国立がん研究センターがん情報サービス「がん登録・統計」(https://ganjoho.jp/reg_stat/statistics/dl/index.html)Source : Cancer Registry and Statistics. Cancer Information Service, National Cancer Center, Japan. (https://ganjoho.jp/en/professional/statistics/table_
download.html)
1980年代以降、がんの罹患数は男女とも増加し続けている。男性では、肺がん、大腸がん、前立腺がんの割合が増加し、胃がんの割合が減少。女性では、肺がん、大腸がん、乳がんの割合が増加し、胃がんの割合が減少。
The incidence of cancer has been continuously increasing since 1980’s.For males, the proportion of lung, colon/rectum, and prostate increased, while the proportion of stomach de-creased.For females, the proportion of lung, colon/rectum and breast increased, while the proportion of stomach de-creased.
1980 1990 2000 2013 年 Year
500,000
400,000
300,000
200,000
100,000
0 0
前立腺Prostate
その他Others
白血病Leukemia悪性リンパ腫Malignant
甲状腺Thyroid
lymphoma
肺Lung
膵臓Pancreas
胆のう・胆管Gallbladder and bile ducts
肝臓Liver
食道Esophagus
結腸Colon
直腸Rectum
胃Stomach
50,03564,763
68,9926,913
20,628
33,915
6,582
13,920
20,516
10,712
23,497
27,411
3,230
4,826
5,166
3,944
3,240
2,889821
5,798
8,063
17,998
33,217
48,184
4,578
20,934
33,198
45,618
90,851
46,806
28,075
27,335
11,205
75,742
74,861
81,274
3,664
5,382
137,290
498,720
310,118
229,506
4,233
6,903
1,642
1,291
8,220 13,033
8,088
10,9677,840
19,825
7,374
19,171
18,476
13,788
男性 Males例 Cases
500,000
400,000
300,000
200,000
100,000
1980 1990 2000 2013 年 Year
甲状腺Thyroid
その他Others
白血病Leukemia
悪性リンパ腫Malignant lymphoma
卵巣Ovary
子宮Uterus
乳房Breast
肺Lung
膵臓Pancreas
胆のう・胆管Gallbladder andbile ducts
肝臓Liver
食道Esophagus
胃Stomach
結腸Colon
直腸Rectum
1,553 1,640 2,41829,370 34,493 33,793
7,22317,083 26,232
4,875
9,10111,474
4,425
8,830
12,642
4,507
7,972
9,175
3,5366,979
11,913
19,706
14,447
24,697
37,389
14,142
13,541
14,605
3,64141,042
40,895
15,613
13,603
10,897
76,839
36,095
24,099
9,80411,396
5,065
46,409
2,8422,175
5,6246,394
7,4906,2465,933
1,852
2,343
3,310
13,482
17,951
22,624
113,751
172,435
222,115
363,732
3,9152,786
6,495
9,078
16,361
11,973
女性 Females例 Cases
注)乳房は2013年以外上皮内がんを含む。
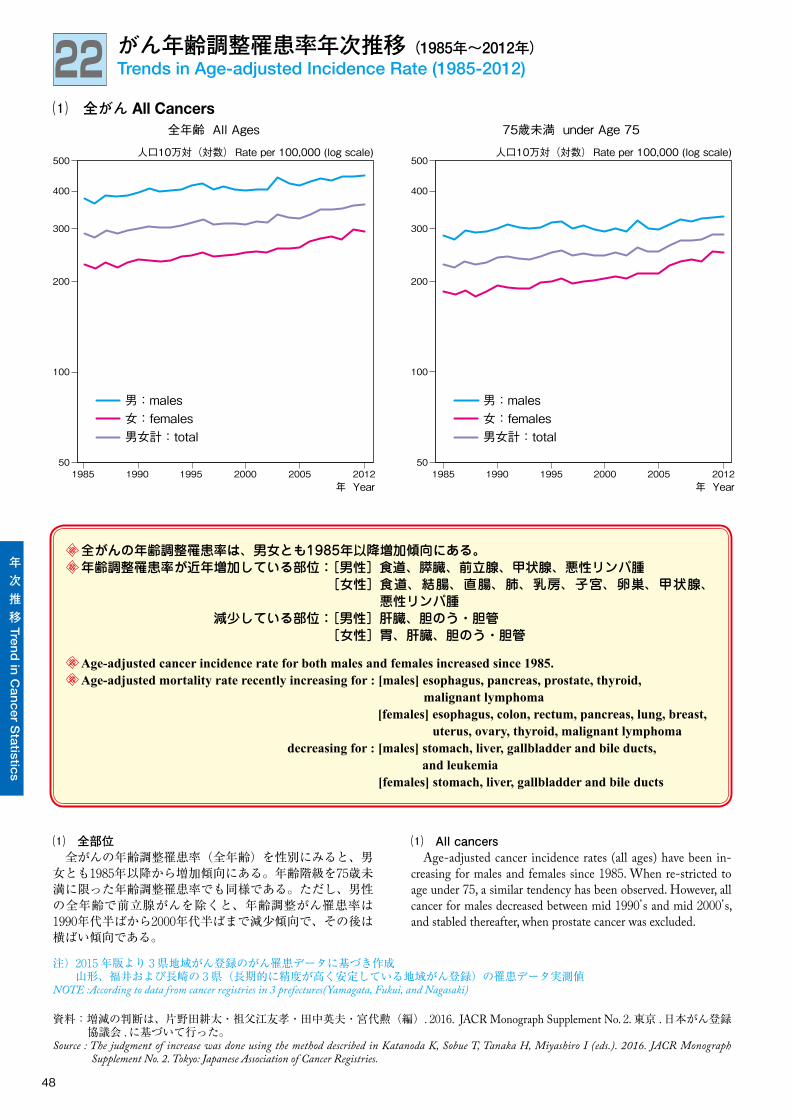
48
年次推移 Tre
nd
in C
an
cer S
tatistic
s
22 がん年齢調整罹患率年次推移(1985年~2012年)Trends in Age-adjusted Incidence Rate (1985-2012)
⑴ 全部位 全がんの年齢調整罹患率(全年齢)を性別にみると、男女とも1985年以降から増加傾向にある。年齢階級を75歳未満に限った年齢調整罹患率でも同様である。ただし、男性の全年齢で前立腺がんを除くと、年齢調整がん罹患率は1990年代半ばから2000年代半ばまで減少傾向で、その後は横ばい傾向である。
⑴ All�cancers Age-adjusted cancer incidence rates (all ages) have been in-creasing for males and females since 1985. When re-stricted to age under 75, a similar tendency has been observed. However, all cancer for males decreased between mid 1990’s and mid 2000’s, and stabled thereafter, when prostate cancer was excluded.
資料 : 増減の判断は、片野田耕太・祖父江友孝・田中英夫・宮代勲(編). 2016. JACR Monograph Supplement No. 2. 東京 . 日本がん登録協議会 . に基づいて行った。
Source : The judgment of increase was done using the method described in Katanoda K, Sobue T, Tanaka H, Miyashiro I (eds.). 2016. JACR Monograph Supplement No. 2. Tokyo: Japanese Association of Cancer Registries.
全がんの年齢調整罹患率は、男女とも1985年以降増加傾向にある。年齢調整罹患率が近年増加している部位:[男性]食道、膵臓、前立腺、甲状腺、悪性リンパ腫
[女性] 食道、結腸、直腸、肺、乳房、子宮、卵巣、甲状腺、悪性リンパ腫
減少している部位:[男性]肝臓、胆のう・胆管[女性]胃、肝臓、胆のう・胆管
Age-adjusted cancer incidence rate for both males and females increased since 1985.Age-adjusted mortality rate recently increasing for : [males] esophagus, pancreas, prostate, thyroid,
malignant lymphoma[females] esophagus, colon, rectum, pancreas, lung, breast, uterus, ovary, thyroid, malignant lymphoma
decreasing for : [males] stomach, liver, gallbladder and bile ducts, and leukemia
[females] stomach, liver, gallbladder and bile ducts
50
500
100
全年齢 All Ages 75歳未満 under Age 75
50
500
100
400
300
200
400
300
200
男:males女:females男女計:total
男:males女:females男女計:total
人口10万対(対数) Rate per 100,000 (log scale) 人口10万対(対数) Rate per 100,000 (log scale)
1985 1990 1995 2000 2005年 Year 年 Year
2012 1985 1990 1995 2000 2005 2012
⑴ 全がん All Cancers
注)2015年版より 3県地域がん登録のがん罹患データに基づき作成 山形、福井および長崎の 3県(長期的に精度が高く安定している地域がん登録)の罹患データ実測値NOTE :According to data from cancer registries in 3 prefectures(Yamagata, Fukui, and Nagasaki)
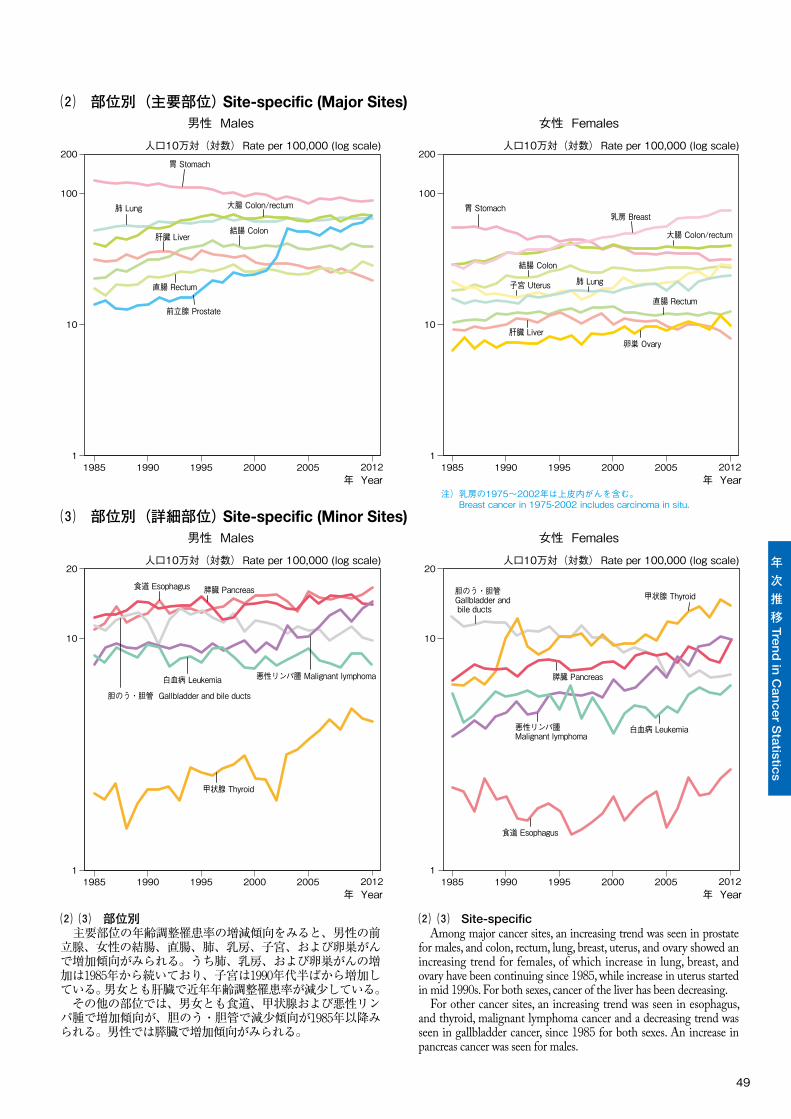
49
年次推移 Tre
nd
in C
an
cer S
tatistic
s
⑵�⑶ 部位別 主要部位の年齢調整罹患率の増減傾向をみると、男性の前立腺、女性の結腸、直腸、肺、乳房、子宮、および卵巣がんで増加傾向がみられる。うち肺、乳房、および卵巣がんの増加は1985年から続いており、子宮は1990年代半ばから増加している。男女とも肝臓で近年年齢調整罹患率が減少している。 その他の部位では、男女とも食道、甲状腺および悪性リンパ腫で増加傾向が、胆のう・胆管で減少傾向が1985年以降みられる。男性では膵臓で増加傾向がみられる。
⑵�⑶ Site-specific Among major cancer sites, an increasing trend was seen in prostate for males, and colon, rectum, lung, breast, uterus, and ovary showed an increasing trend for females, of which increase in lung, breast, and ovary have been continuing since 1985, while increase in uterus started in mid 1990s. For both sexes, cancer of the liver has been decreasing. For other cancer sites, an increasing trend was seen in esophagus, and thyroid, malignant lymphoma cancer and a decreasing trend was seen in gallbladder cancer, since 1985 for both sexes. An increase in pancreas cancer was seen for males.
肝臓 Liver
直腸 Rectum
大腸 Colon/rectum
結腸 Colon
前立腺 Prostate
胃 Stomach
肺 Lung
男性 Males
人口10万対(対数) Rate per 100,000 (log scale)
1985 1990 1995 2000年 Year 年 Year
2012
⑵ 部位別(主要部位) Site-specific (Major Sites)
200
1
10
100
20
10
20
10
人口10万対(対数) Rate per 100,000 (log scale) 人口10万対(対数) Rate per 100,000 (log scale)
男性 Males 女性 Females⑶ 部位別(詳細部位) Site-specific (Minor Sites)
1
食道 Esophagus 膵臓 Pancreas
胆のう・胆管 Gallbladder and bile ducts
悪性リンパ腫 Malignant lymphoma白血病 Leukemia
甲状腺 Thyroid
悪性リンパ腫Malignant lymphoma
胆のう・胆管Gallbladder and bile ducts
膵臓 Pancreas
甲状腺 Thyroid
白血病 Leukemia
食道 Esophagus
女性 Females
人口10万対(対数) Rate per 100,000 (log scale)
注)乳房の1975~2002年は上皮内がんを含む。 Breast cancer in 1975-2002 includes carcinoma in situ.
2005 1985 1990 1995 2000 20122005
200
1
1985 1990 1995 2000年 Year 年 Year
20122005 1985 1990 1995 2000 201220051
10
100
卵巣 Ovary肝臓 Liver
直腸 Rectum
大腸 Colon/rectum
肺 Lung
結腸 Colon
子宮 Uterus
乳房 Breast胃 Stomach

50
年次推移 Tre
nd
in C
an
cer S
tatistic
s
23 年齢階級別がん罹患率推移(1980年、2013年)Trends in Age-specific Incidence Rate (1980, 2013)
1980年と2013年の全がん罹患率の変化をみると、男性では60歳以上での罹患率増加、女性では80歳以上で増加しているのを除いて罹患率の大きな変化はない。80歳以上のがん罹患率の増加は診断精度の向上も一つの原因だと考えられる。 部位別の動向は、[食道がん] 男性では50~84歳で罹患率が増加、女性では70-79歳で減少しているのを除いて大きな変化はない。[胃がん] 男女とも85歳以上を除いて中高年で罹患率が減少している。 Comparisons between the age-speci�c incidence rates in 1980 and 2013 revealed that there was no clear change except an in-
crease in cancer incidence rate for males aged 60 years or older and for females aged 80 year or older. �e improved diagnosis of cancer may have contributed to the increase among the elderly.
Site-speci�c trends are as follows. [Esophagus] For males, the incidence rate increased among 50-84 age groups. For females, no clear change was seen except for decrease among 70-79 age groups.[Stomach]A clear decrease in incidence rate was seen among middle and old age groups for both males and females, except for 85+ years age group.
資料:国立がん研究センターがん情報サービス「がん登録・統計」(https://ganjoho.jp/reg_stat/statistics/dl/index.html)Source : Cancer Registry and Statistics. Cancer Information Service, National Cancer Center, Japan. (https://ganjoho.jp/en/professional/statistics/table_
download.html)
0~ 5~ 10~15~20~25~30~35~40~45~50~55~60~65~70~75~80~85~ 0~ 5~ 10~15~20~25~30~35~40~45~50~55~60~65~70~75~80~85~
0~ 5~ 10~15~20~25~30~35~40~45~50~55~60~65~70~75~80~85~ 0~ 5~ 10~15~20~25~30~35~40~45~50~55~60~65~70~75~80~85~
0
500
1,000
1,500
2,000
2,500
3,000
3,500
4,500
4,000
0
50
100
150
200
250
300
350
400
0
100
200
300
400
500
600
700
800
0
20
40
60
80
100
120
歳 age
歳 age歳 age
歳 age
1980(男性 males)2013(男性 males)1980(女性 females)2013(女性 females)
1980(男性 males)2013(男性 males)1980(女性 females)2013(女性 females)
1980(男性 males)2013(男性 males)1980(女性 females)2013(女性 females)
1980(男性 males)2013(男性 males)1980(女性 females)2013(女性 females)
人口10万対 Rate per 100,000 人口10万対 Rate per 100,000
人口10万対 Rate per 100,000 人口10万対 Rate per 100,000
⑴ 全がん All cancers
⑶ 胃がん Stomach
⑵ 食道がん Esophagus
⑷ 結腸がん Colon
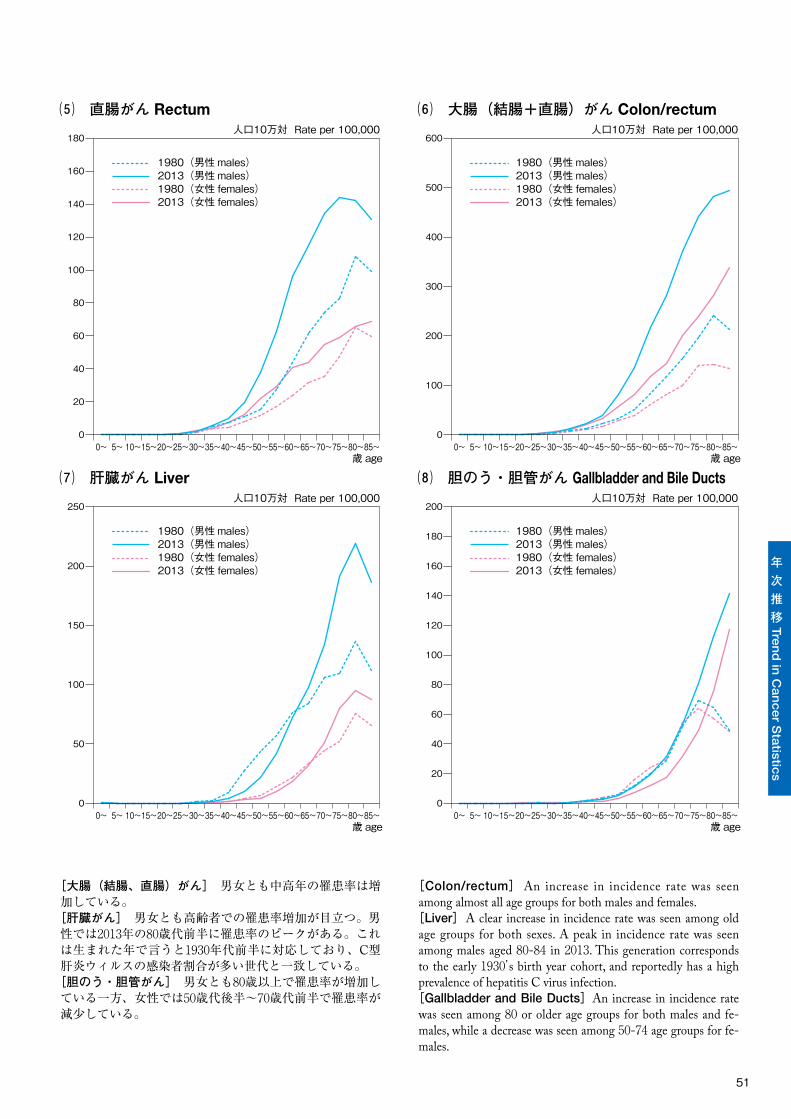
51
年次推移 Tre
nd
in C
an
cer S
tatistic
s
[大腸(結腸、直腸)がん] 男女とも中高年の罹患率は増加している。[肝臓がん] 男女とも高齢者での罹患率増加が目立つ。男性では2013年の80歳代前半に罹患率のピークがある。これは生まれた年で言うと1930年代前半に対応しており、C型肝炎ウィルスの感染者割合が多い世代と一致している。[胆のう・胆管がん] 男女とも80歳以上で罹患率が増加している一方、女性では50歳代後半~70歳代前半で罹患率が減少している。
[Colon/rectum] An increase in incidence rate was seen among almost all age groups for both males and females.[Liver]A clear increase in incidence rate was seen among old age groups for both sexes. A peak in incidence rate was seen among males aged 80-84 in 2013. This generation corresponds to the early 1930’s birth year cohort, and reportedly has a high prevalence of hepatitis C virus infection.[Gallbladder and Bile Ducts]An increase in incidence rate was seen among 80 or older age groups for both males and fe-males, while a decrease was seen among 50-74 age groups for fe-males.
0
20
40
60
80
100
120
140
160
180
歳 age
0
100
200
300
400
500
600
歳 age
0
50
100
150
200
250
歳 age
0
20
40
60
80
100
120
140
160
180
200
歳 age
0~ 5~ 10~15~20~25~30~35~40~45~50~55~60~65~70~75~80~85~ 0~ 5~ 10~15~20~25~30~35~40~45~50~55~60~65~70~75~80~85~
0~ 5~ 10~15~20~25~30~35~40~45~50~55~60~65~70~75~80~85~ 0~ 5~ 10~15~20~25~30~35~40~45~50~55~60~65~70~75~80~85~
1980(男性 males)2013(男性 males)1980(女性 females)2013(女性 females)
1980(男性 males)2013(男性 males)1980(女性 females)2013(女性 females)
1980(男性 males)2013(男性 males)1980(女性 females)2013(女性 females)
1980(男性 males)2013(男性 males)1980(女性 females)2013(女性 females)
人口10万対 Rate per 100,000 人口10万対 Rate per 100,000
人口10万対 Rate per 100,000 人口10万対 Rate per 100,000
⑸ 直腸がん Rectum
⑺ 肝臓がん Liver
⑹ 大腸(結腸+直腸)がん Colon/rectum
⑻ 胆のう・胆管がん Gallbladder and Bile Ducts
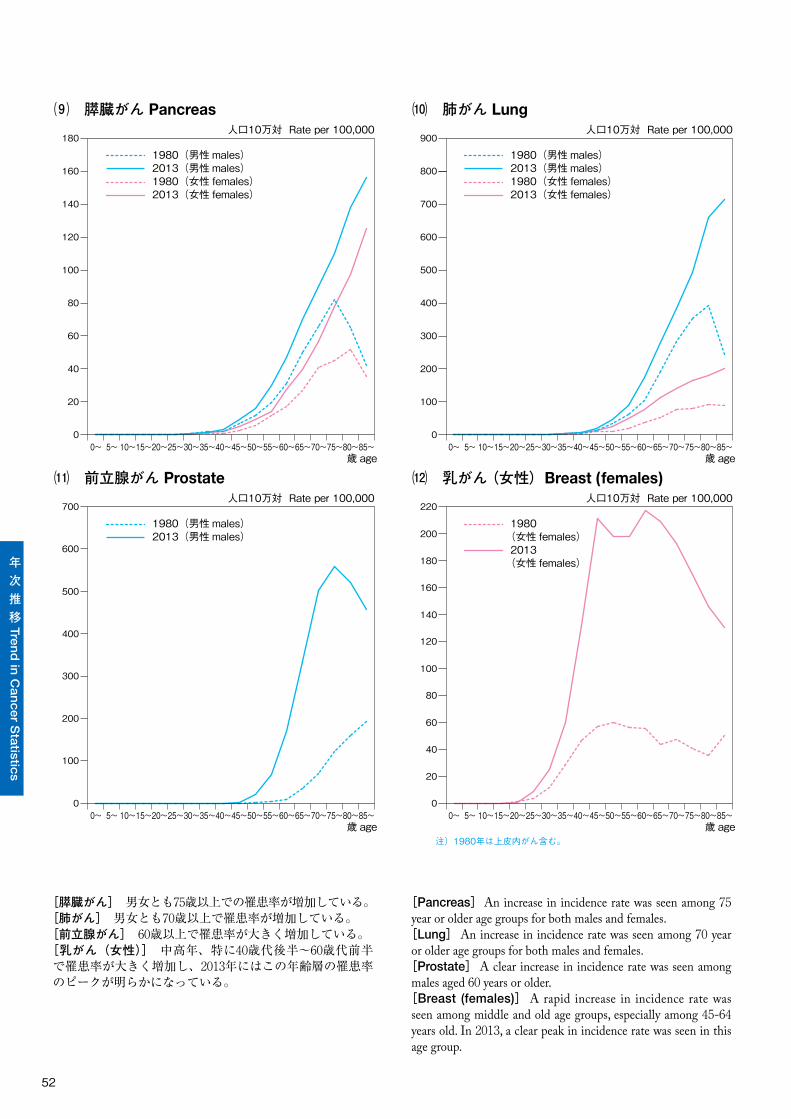
52
年次推移 Tre
nd
in C
an
cer S
tatistic
s
[膵臓がん] 男女とも75歳以上での罹患率が増加している。[肺がん] 男女とも70歳以上で罹患率が増加している。[前立腺がん] 60歳以上で罹患率が大きく増加している。[乳がん(女性)] 中高年、特に40歳代後半~60歳代前半で罹患率が大きく増加し、2013年にはこの年齢層の罹患率のピークが明らかになっている。
[Pancreas]An increase in incidence rate was seen among 75 year or older age groups for both males and females.[Lung]An increase in incidence rate was seen among 70 year or older age groups for both males and females.[Prostate]A clear increase in incidence rate was seen among males aged 60 years or older.[Breast (females)] A rapid increase in incidence rate was seen among middle and old age groups, especially among 45-64 years old. In 2013, a clear peak in incidence rate was seen in this age group.
0~ 5~ 10~15~20~25~30~35~40~45~50~55~60~65~70~75~80~85~0
20
40
60
80
100
120
160
140
180
歳 age
0
100
200
300
400
500
600
700
900
800
歳 age
0
100
200
300
400
700
500
歳 age
0
20
40
60
80
100
120
140
160
歳 age
0~ 5~ 10~15~20~25~30~35~40~45~50~55~60~65~70~75~80~85~
0~ 5~ 10~15~20~25~30~35~40~45~50~55~60~65~70~75~80~85~ 0~ 5~ 10~15~20~25~30~35~40~45~50~55~60~65~70~75~80~85~
600
220
200
180
1980(男性 males)2013(男性 males)1980(女性 females)2013(女性 females)
1980(男性 males)2013(男性 males)1980(女性 females)2013(女性 females)
1980(男性 males)2013(男性 males)
1980(女性 females)2013
(女性 females)
人口10万対 Rate per 100,000 人口10万対 Rate per 100,000
人口10万対 Rate per 100,000 人口10万対 Rate per 100,000
⑼ 膵臓がん Pancreas
⑾ 前立腺がん Prostate
⑽ 肺がん Lung
⑿
注)1980年は上皮内がん含む。
乳がん(女性) Breast (females)
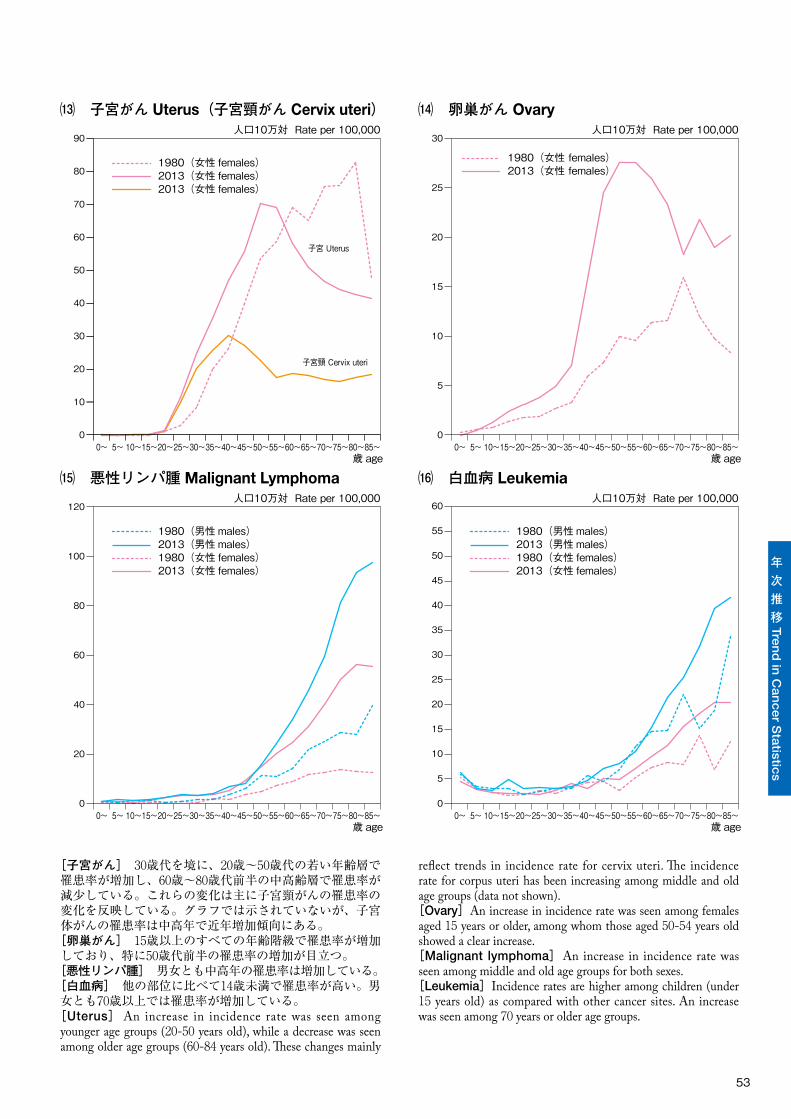
53
年次推移 Tre
nd
in C
an
cer S
tatistic
s
[子宮がん] 30歳代を境に、20歳~50歳代の若い年齢層で罹患率が増加し、60歳~80歳代前半の中高齢層で罹患率が減少している。これらの変化は主に子宮頸がんの罹患率の変化を反映している。グラフでは示されていないが、子宮体がんの罹患率は中高年で近年増加傾向にある。[卵巣がん] 15歳以上のすべての年齢階級で罹患率が増加しており、特に50歳代前半の罹患率の増加が目立つ。[悪性リンパ腫] 男女とも中高年の罹患率は増加している。[白血病] 他の部位に比べて14歳未満で罹患率が高い。男女とも70歳以上では罹患率が増加している。[Uterus] An increase in incidence rate was seen among younger age groups (20-50 years old), while a decrease was seen among older age groups (60-84 years old). �ese changes mainly
re�ect trends in incidence rate for cervix uteri. �e incidence rate for corpus uteri has been increasing among middle and old age groups (data not shown).[Ovary]An increase in incidence rate was seen among females aged 15 years or older, among whom those aged 50-54 years old showed a clear increase.[Malignant lymphoma]An increase in incidence rate was seen among middle and old age groups for both sexes. [Leukemia]Incidence rates are higher among children (under 15 years old) as compared with other cancer sites. An increase was seen among 70 years or older age groups.
0~ 5~ 10~15~20~25~30~35~40~45~50~55~60~65~70~75~80~85~ 0~ 5~ 10~15~20~25~30~35~40~45~50~55~60~65~70~75~80~85~
0~ 5~ 10~15~20~25~30~35~40~45~50~55~60~65~70~75~80~85~
0
10
20
30
40
50
60
70
80
90
歳 age
0
5
10
15
20
25
30
歳 age
0
20
40
60
80
120
100
歳 age
0
5
10
15
20
25
30
35
40
45
50
55
60
1980(女性 females)2013(女性 females)2013(女性 females)
1980(女性 females)2013(女性 females)
1980(男性 males)2013(男性 males)1980(女性 females)2013(女性 females)
人口10万対 Rate per 100,000 人口10万対 Rate per 100,000
人口10万対 Rate per 100,000
⒀ 子宮がん Uterus(子宮頸がん Cervix uteri)
⒂ 悪性リンパ腫 Malignant Lymphoma
⒁ 卵巣がん Ovary
⒃ 白血病 Leukemia
子宮 Uterus
子宮頸 Cervix uteri
0~ 5~ 10~15~20~25~30~35~40~45~50~55~60~65~70~75~80~85~歳 age
1980(男性 males)2013(男性 males)1980(女性 females)2013(女性 females)
人口10万対 Rate per 100,000
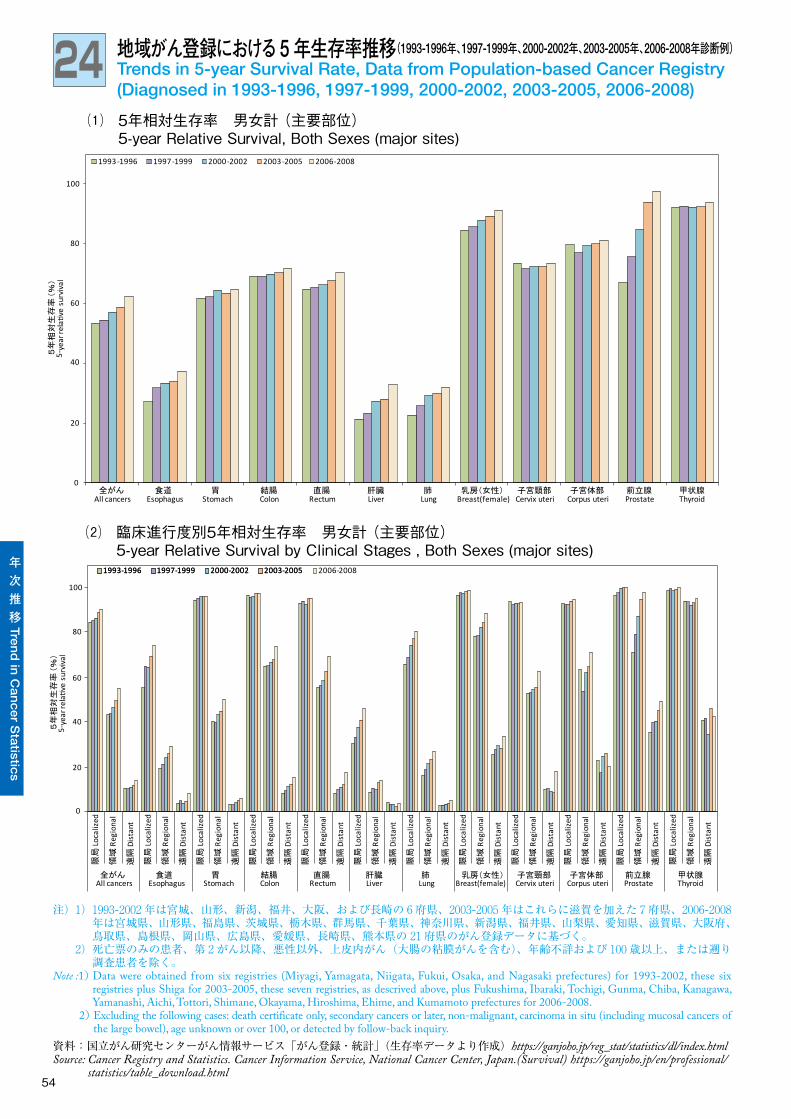
54
年次推移 Tre
nd
in C
an
cer S
tatistic
s
24 地域がん登録における5年生存率推移(1993-1996年、1997-1999年、2000-2002年、2003-2005年、2006-2008年診断例)Trends in 5-year Survival Rate, Data from Population-based Cancer Registry(Diagnosed in 1993-1996, 1997-1999, 2000-2002, 2003-2005, 2006-2008)
注)1) 1993-2002年は宮城、山形、新潟、福井、大阪、および長崎の 6府県、2003-2005年はこれらに滋賀を加えた 7府県、2006-2008年は宮城県、山形県、福島県、茨城県、栃木県、群馬県、千葉県、神奈川県、新潟県、福井県、山梨県、愛知県、滋賀県、大阪府、鳥取県、島根県、岡山県、広島県、愛媛県、長崎県、熊本県の 21府県のがん登録データに基づく。
2) 死亡票のみの患者、第 2がん以降、悪性以外、上皮内がん(大腸の粘膜がんを含む)、年齢不詳および 100歳以上、または遡り調査患者を除く。
Note :1) Data were obtained from six registries (Miyagi, Yamagata, Niigata, Fukui, Osaka, and Nagasaki prefectures) for 1993-2002, these six registries plus Shiga for 2003-2005, these seven registries, as descrived above, plus Fukushima, Ibaraki, Tochigi, Gunma, Chiba, Kanagawa, Yamanashi, Aichi, Tottori, Shimane, Okayama, Hiroshima, Ehime, and Kumamoto prefectures for 2006-2008.
2) Excluding the following cases: death certificate only, secondary cancers or later, non-malignant, carcinoma in situ (including mucosal cancers of the large bowel), age unknown or over 100, or detected by follow-back inquiry.
5-ye
ar re
lativ
e su
rviv
al
5年相対生存率
(%)
全がん 食道 胃 結腸 直腸 肝臓 肺 乳房(女性) 子宮頸部 子宮体部 前立腺 甲状腺
1993-1996 1997-1999 2000-2002 2003-2005 2006-2008
⑵ 臨床進行度別5年相対生存率 男女計 (主要部位) 5-year Relative Survival by Clinical Stages , Both Sexes (major sites)
0
20
40
60
80
100
限局
Loca
lized
領域
Regi
onal
遠隔
Dist
ant
限局
Loca
lized
領域
Regi
onal
遠隔
Dist
ant
限局
Loca
lized
領域
Regi
onal
遠隔
Dist
ant
限局
Loca
lized
領域
Regi
onal
遠隔
Dist
ant
限局
Loca
lized
領域
Regi
onal
遠隔
Dist
ant
限局
Loca
lized
領域
Regi
onal
遠隔
Dist
ant
限局
Loca
lized
領域
Regi
onal
遠隔
Dist
ant
限局
Loca
lized
領域
Regi
onal
遠隔
Dist
ant
限局
Loca
lized
領域
Regi
onal
遠隔
Dist
ant
限局
Loca
lized
領域
Regi
onal
遠隔
Dist
ant
限局
Loca
lized
領域
Regi
onal
遠隔
Dist
ant
限局
Loca
lized
領域
Regi
onal
遠隔
Dist
ant
All cancers Esophagus Stomach Colon Rectum Liver Lung Breast(female) Cervix uteri Corpus uteri Prostate Thyroid
1993-1996 1997-1999 2000-2002 2003-2005
⑴ 5年相対生存率 男女計 (主要部位) 5-year Relative Survival, Both Sexes (major sites)
0
20
40
60
80
100
All cancers Esophagus Stomach Colon Rectum Liver Lung Breast(female) Cervix uteri Corpus uteri Prostate Thyroid
5-ye
ar re
lativ
e su
rviv
al
1993-1996 1997-1999 2000-2002 2003-2005 2006-2008
全がん
5年相対生存率
(%)
食道 胃 結腸 直腸 肝臓 肺 乳房(女性) 子宮頸部 子宮体部 前立腺 甲状腺
資料:�国立がん研究センターがん情報サービス「がん登録・統計」(生存率データより作成)https://ganjoho.jp/reg_stat/statistics/dl/index.htmlSource: Cancer Registry and Statistics. Cancer Information Service, National Cancer Center, Japan.(Survival) https://ganjoho.jp/en/professional/
statistics/table_download.html
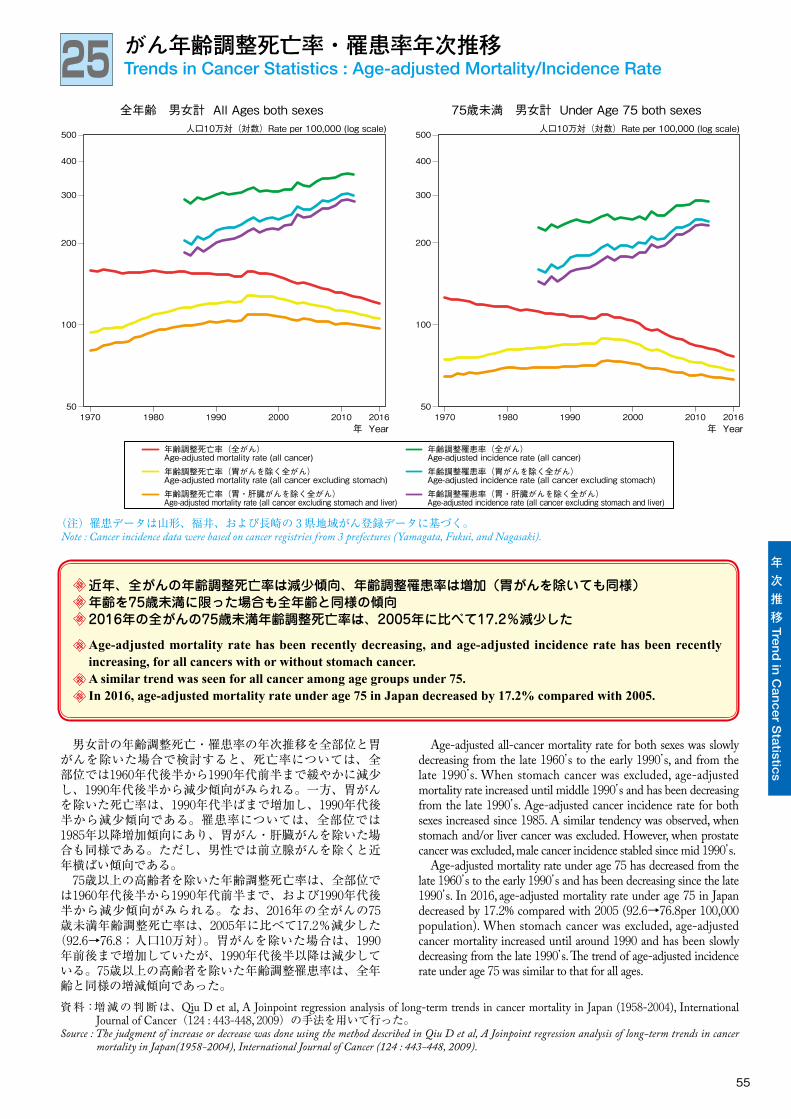
55
年次推移 Tre
nd
in C
an
cer S
tatistic
s
25 がん年齢調整死亡率・罹患率年次推移Trends in Cancer Statistics : Age-adjusted Mortality/Incidence Rate
男女計の年齢調整死亡・罹患率の年次推移を全部位と胃がんを除いた場合で検討すると、死亡率については、全 部位では1960年代後半から1990年代前半まで緩やかに減少し、1990年代後半から減少傾向がみられる。一方、胃がんを除いた死亡率は、1990年代半ばまで増加し、1990年代後半から減少傾向である。罹患率については、全部位では1985年以降増加傾向にあり、胃がん・肝臓がんを除いた場合も同様である。ただし、男性では前立腺がんを除くと近年横ばい傾向である。 75歳以上の高齢者を除いた年齢調整死亡率は、全部位では1960年代後半から1990年代前半まで、および1990年代後半から減少傾向がみられる。なお、2016年の全がんの75 歳未満年齢調整死亡率は、2005年に比べて17.2%減少した
(92.6→76.8;人口10万対)。胃がんを除いた場合は、1990年前後まで増加していたが、1990年代後半以降は減少している。75歳以上の高齢者を除いた年齢調整罹患率は、全年齢と同様の増減傾向であった。
Age-adjusted all-cancer mortality rate for both sexes was slowly decreasing from the late 1960’s to the early 1990’s, and from the late 1990’s. When stomach cancer was excluded, age-adjusted mortality rate increased until middle 1990’s and has been decreasing from the late 1990’s. Age-adjusted cancer incidence rate for both sexes increased since 1985. A similar tendency was observed, when stomach and/or liver cancer was excluded. However, when prostate cancer was excluded, male cancer incidence stabled since mid 1990’s. Age-adjusted mortality rate under age 75 has decreased from the late 1960’s to the early 1990’s and has been decreasing since the late 1990’s. In 2016, age-adjusted mortality rate under age 75 in Japan decreased by 17.2% compared with 2005 (92.6→76.8per 100,000 population). When stomach cancer was excluded, age-adjusted cancer mortality increased until around 1990 and has been slowly decreasing from the late 1990’s. �e trend of age-adjusted incidence rate under age 75 was similar to that for all ages.
資料:増減の判断は、Qiu D et al, A Joinpoint regression analysis of long-term trends in cancer mortality in Japan (1958-2004), International Journal of Cancer(124 : 443-448, 2009)の手法を用いて行った。
Source : The judgment of increase or decrease was done using the method described in Qiu D et al, A Joinpoint regression analysis of long-term trends in cancer mortality in Japan(1958-2004), International Journal of Cancer (124 : 443-448, 2009).
近年、全がんの年齢調整死亡率は減少傾向、年齢調整罹患率は増加(胃がんを除いても同様)年齢を75歳未満に限った場合も全年齢と同様の傾向2016年の全がんの75歳未満年齢調整死亡率は、2005年に比べて17.2%減少した
Age-adjusted mortality rate has been recently decreasing, and age-adjusted incidence rate has been recently increasing, for all cancers with or without stomach cancer.A similar trend was seen for all cancer among age groups under 75.In 2016, age-adjusted mortality rate under age 75 in Japan decreased by 17.2% compared with 2005.
人口10万対(対数)Rate per 100,000 (log scale) 人口10万対(対数)Rate per 100,000 (log scale)
1970 1980 1990 2000 20162010年 Year
400
300
200
100
50
500
1970 1980 1990 2000 20162010年 Year
400
300
200
100
50
500
全年齢 男女計 All Ages both sexes 75歳未満 男女計 Under Age 75 both sexes
年齢調整死亡率(全がん)Age-adjusted mortality rate (all cancer)年齢調整死亡率(胃がんを除く全がん)Age-adjusted mortality rate (all cancer excluding stomach)
年齢調整罹患率(全がん)Age-adjusted incidence rate (all cancer)年齢調整罹患率(胃がんを除く全がん)Age-adjusted incidence rate (all cancer excluding stomach)
年齢調整死亡率(胃・肝臓がんを除く全がん)Age-adjusted mortality rate (all cancer excluding stomach and liver)
年齢調整罹患率(胃・肝臓がんを除く全がん)Age-adjusted incidence rate (all cancer excluding stomach and liver)
(注)罹患データは山形、福井、および長崎の 3 県地域がん登録データに基づく。Note : Cancer incidence data were based on cancer registries from 3 prefectures (Yamagata, Fukui, and Nagasaki).
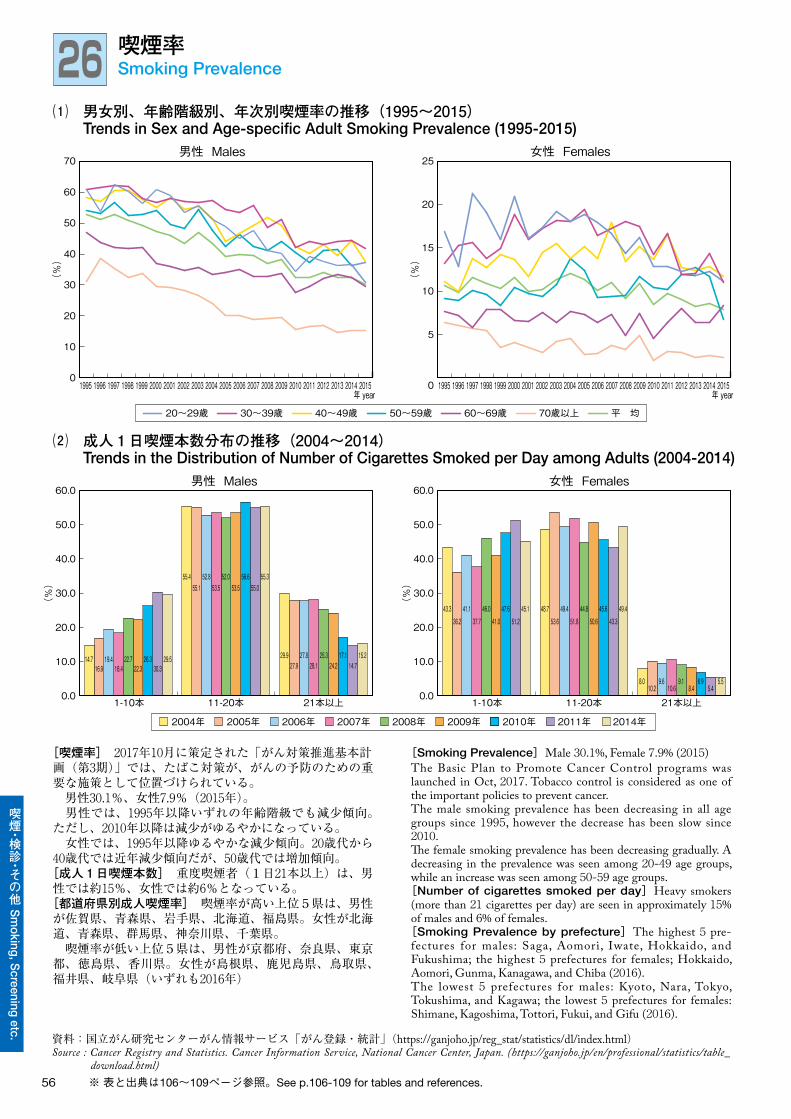
56
喫煙・検診・その他 S
moking, S
creening etc.
0
10
20
30
40
50
60
70
1995 1996 1997 1998 1999 2000 2001 2002 2003 2004 2005 2006 2007 2008 2009 2010 2011 2015201420132012年 year
(%
)
0
5
10
15
20
25
(%
)20~29歳 30~39歳 40~49歳 50~59歳 60~69歳 70歳以上 平 均
年 year
1-10本 11-20本 21本以上
男性 Males 女性 Females
男性 Males
55.4
14.716.9
19.418.4
22.722.3
26.330.3
29.5
55.152.8
53.552.0
53.556.6
55.055.3
29.927.9
27.828.1
25.324.2
17.114.7
15.2
43.336.2
41.137.7
46.041.0
47.651.2
45.1 48.7
8.010.2
9.610.6
9.18.4
6.95.4
5.5
53.649.4
51.844.8
50.645.6
43.349.4
1995 1996 1997 1998 1999 2000 2001 2002 2003 2004 2005 2006 2007 2008 2009 2010 2011 2015201420132012
0.0
10.0
20.0
30.0
40.0
50.0
60.0
(%
)
1-10本 11-20本 21本以上
女性 Females
0.0
10.0
20.0
30.0
40.0
50.0
60.0
(%
)
2004年 2005年 2006年 2007年 2008年 2009年 2010年 2011年 2014年
[喫煙率] 2017年10月に策定された「がん対策推進基本計画(第3期)」では、たばこ対策が、がんの予防のための重要な施策として位置づけられている。 男性30.1%、女性7.9%(2015年)。 男性では、1995年以降いずれの年齢階級でも減少傾向。ただし、2010年以降は減少がゆるやかになっている。 女性では、1995年以降ゆるやかな減少傾向。20歳代から40歳代では近年減少傾向だが、50歳代では増加傾向。[成人1日喫煙本数] 重度喫煙者(1日21本以上)は、男性では約15%、女性では約6%となっている。[都道府県別成人喫煙率] 喫煙率が高い上位5県は、男性が佐賀県、青森県、岩手県、北海道、福島県。女性が北海道、青森県、群馬県、神奈川県、千葉県。 喫煙率が低い上位5県は、男性が京都府、奈良県、東京都、徳島県、香川県。女性が島根県、鹿児島県、鳥取県、福井県、岐阜県(いずれも2016年)
[Smoking Prevalence]Male 30.1%, Female 7.9% (2015)The Basic Plan to Promote Cancer Control programs was launched in Oct, 2017. Tobacco control is considered as one of the important policies to prevent cancer.The male smoking prevalence has been decreasing in all age groups since 1995, however the decrease has been slow since 2010.�e female smoking prevalence has been decreasing gradually. A decreasing in the prevalence was seen among 20-49 age groups, while an increase was seen among 50-59 age groups.[Number of cigarettes smoked per day]Heavy smokers (more than 21 cigarettes per day) are seen in approximately 15% of males and 6% of females.[Smoking Prevalence by prefecture]The highest 5 pre-fectures for males: Saga, Aomori, Iwate, Hokkaido, and Fukushima; the highest 5 prefectures for females; Hokkaido, Aomori, Gunma, Kanagawa, and Chiba (2016).The lowest 5 prefectures for males: Kyoto, Nara, Tokyo, Tokushima, and Kagawa; the lowest 5 prefectures for females: Shimane, Kagoshima, Tottori, Fukui, and Gifu (2016).
※ 表と出典は106~109ページ参照。See p.106-109 for tables and references.
26 喫煙率Smoking Prevalence
資料:国立がん研究センターがん情報サービス「がん登録・統計」(https://ganjoho.jp/reg_stat/statistics/dl/index.html)Source : Cancer Registry and Statistics. Cancer Information Service, National Cancer Center, Japan. (https://ganjoho.jp/en/professional/statistics/table_
download.html)
⑴ 男女別、年齢階級別、年次別喫煙率の推移(1995~2015) Trends in Sex and Age-specific Adult Smoking Prevalence (1995-2015)
⑵ 成人1日喫煙本数分布の推移(2004~2014) Trends in the Distribution of Number of Cigarettes Smoked per Day among Adults (2004-2014)
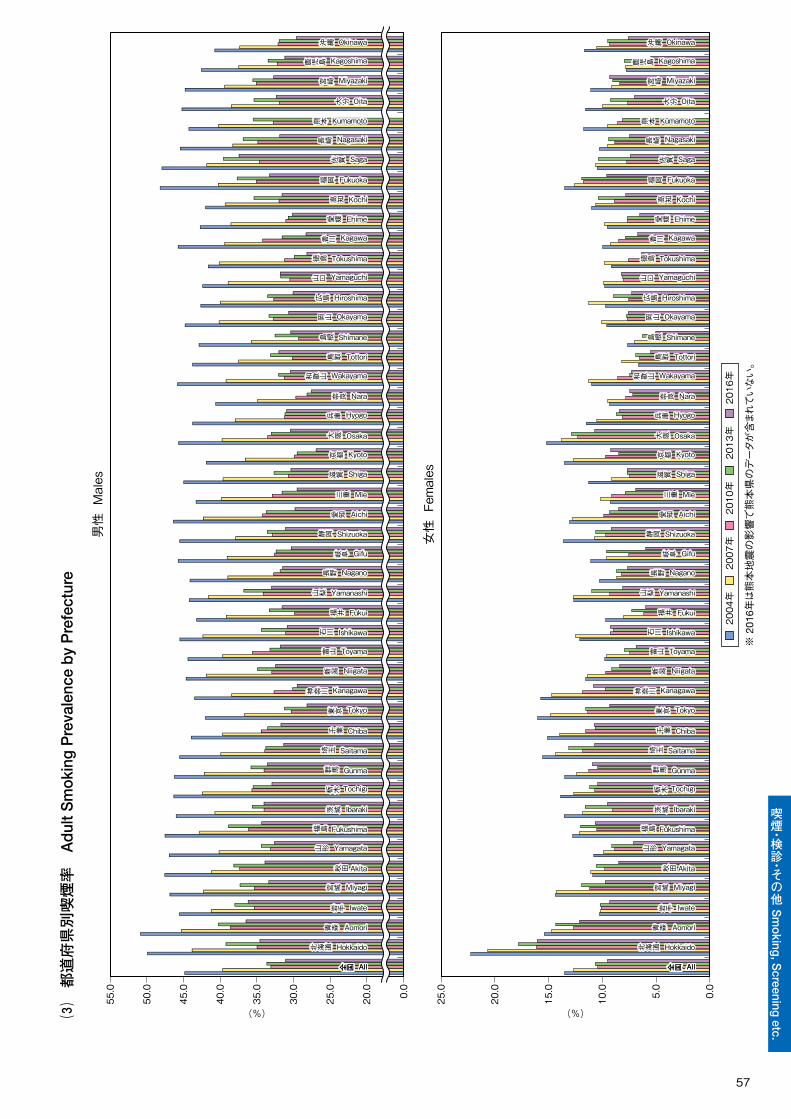
57
喫煙・検診・その他 S
moking, S
creening etc.
⑶ 都道府県別喫煙率
Adu
lt S
mok
ing
Pre
vale
nce
by P
refe
ctur
e
2
004年
200
7年
2
010年
201
3年
2
016年
男性
Mal
es
女性
Fem
ales
20.0
30.0
25.0
45.0
40.0
35.0
50.0
55.0
(%)
0.0
20.0
15.0
10.0 5.0
25.0 0.0
(%)
Hokkaido北 海 道
Aomori青 森
Iwate岩 手
Miyagi宮 城
Akita秋 田
Yamagata山 形
Fukushima福 島
Ibaraki茨 城
Tochigi栃 木
Gunma群 馬
Saitama埼 玉
Chiba千 葉
Tokyo東 京
Kanagawa神 奈 川
Niigata新 潟
Toyama富 山
Ishikawa石 川
Fukui福 井
Yamanashi山 梨
Nagano長 野
Gifu岐 阜
Shizuoka静 岡
Aichi愛 知
Mie三 重
Shiga滋 賀
Kyoto京 都
Osaka大 阪
Hyogo兵 庫
Nara奈 良
Wakayama和 歌 山
Tottori鳥 取Shimane島 根Okayama岡 山
Hiroshima広 島
Yamaguchi山 口
Tokushima徳 島
Kagawa香 川
Ehime愛 媛
Kochi高 知
Fukuoka福 岡
Saga佐 賀
Nagasaki長 崎
Kumamoto熊 本
Oita大 分
Miyazaki宮 崎
Kagoshima鹿 児 島
Okinawa沖 縄
All全 国 All全 国
Hokkaido北 海 道
Aomori青 森
Iwate岩 手
Miyagi宮 城
Akita秋 田
Yamagata山 形
Fukushima福 島
Ibaraki茨 城
Tochigi栃 木
Gunma群 馬
Saitama埼 玉
Chiba千 葉
Tokyo東 京
Kanagawa神 奈 川
Niigata新 潟Toyama富 山
Ishikawa石 川
Fukui福 井
Yamanashi山 梨
Nagano長 野
Gifu岐 阜
Shizuoka静 岡
Aichi愛 知
Mie三 重
Shiga滋 賀
Kyoto京 都
Osaka大 阪
Hyogo兵 庫
Nara奈 良
Wakayama和 歌 山
Tottori鳥 取
Shimane島 根
Okayama岡 山
Hiroshima広 島
Yamaguchi山 口
Tokushima徳 島
Kagawa香 川
Ehime愛 媛
Kochi高 知
Fukuoka福 岡
Saga佐 賀
Nagasaki長 崎
Kumamoto熊 本
Oita大 分
Miyazaki宮 崎
Kagoshima児 島
Okinawa沖 縄
All全 国 All全 国
鹿
※ 2
016年は熊本地震の影響で熊本県のデータが含まれていない。
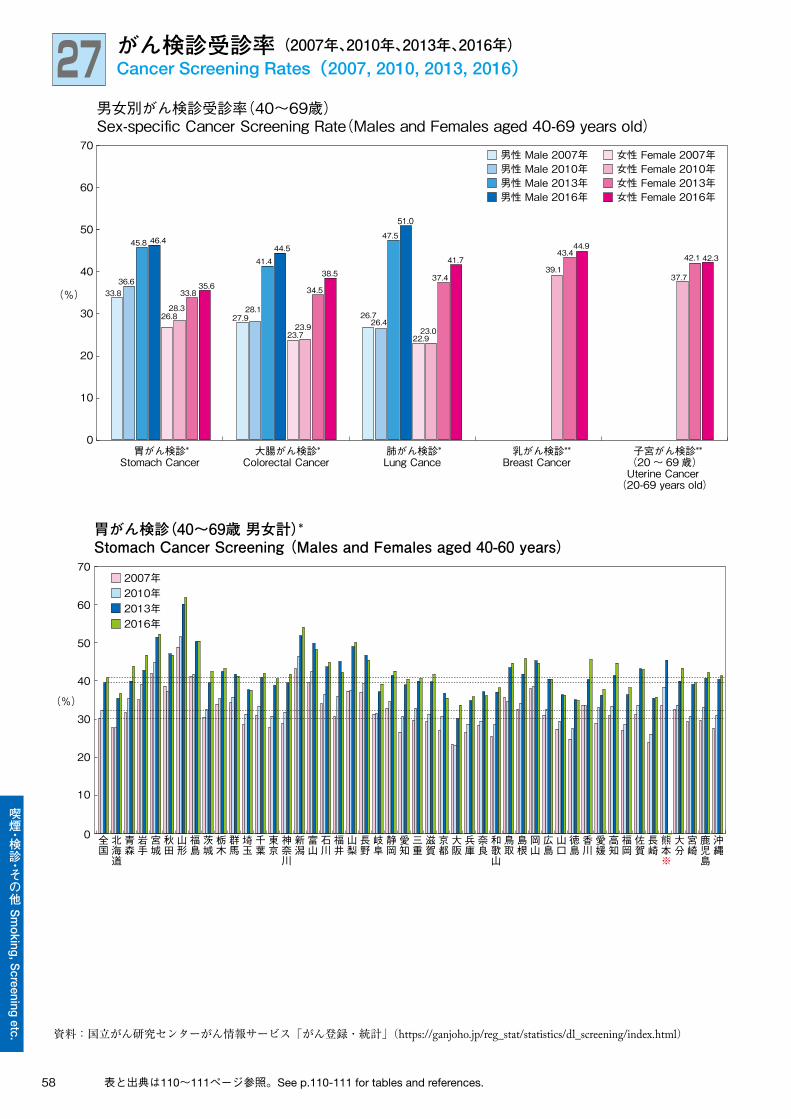
58
喫煙・検診・その他 S
moking, S
creening etc.
27 がん検診受診率(2007年、2010年、2013年、2016年)Cancer Screening Rates(2007, 2010, 2013, 2016)
資料:国立がん研究センターがん情報サービス「がん登録・統計」(https://ganjoho.jp/reg_stat/statistics/dl_screening/index.html)
表と出典は110~111ページ参照。See p.110-111 for tables and references.
■ 男性 Male 2007年
男女別がん検診受診率(40~69歳)Sex-specific Cancer Screening Rate(Males and Females aged 40-69 years old)
■ 男性 Male 2010年■ 男性 Male 2013年■ 男性 Male 2016年
胃がん検診*Stomach Cancer
大腸がん検診*Colorectal Cancer
肺がん検診*Lung Cance
乳がん検診**Breast Cancer
子宮がん検診**(20 ~ 69 歳)Uterine Cancer
(20-69 years old)
■ 女性 Female 2010年 ■ 女性 Female 2013年 ■ 女性 Female 2016年
■ 女性 Female 2007年
(%)
0
10
20
30
40
60
70
50
36.6
45.8 46.4
33.8
28.3
33.835.6
26.8 27.928.1
41.444.5
23.723.9
34.5
38.5
26.726.4
47.5
51.0
22.923.0
37.4
41.743.4
44.9
39.137.7
42.1 42.3
沖縄
鹿児島
宮崎
大分
熊本※
長崎
佐賀
福岡
高知
愛媛
香川
徳島
山口
広島
岡山
島根
鳥取
和歌山
奈良
兵庫
大阪
京都
滋賀
三重
愛知
静岡
岐阜
長野
山梨
福井
石川
富山
新潟
神奈川
東京
千葉
埼玉
群馬
栃木
茨城
福島
山形
秋田
宮城
岩手
青森
北海道
全国
0
10
20
30(%)
40
50
70
60
■ 2007年
胃がん検診(40~69歳 男女計)*Stomach Cancer Screening (Males and Females aged 40-60 years)
■ 2010年■ 2013年■ 2016年
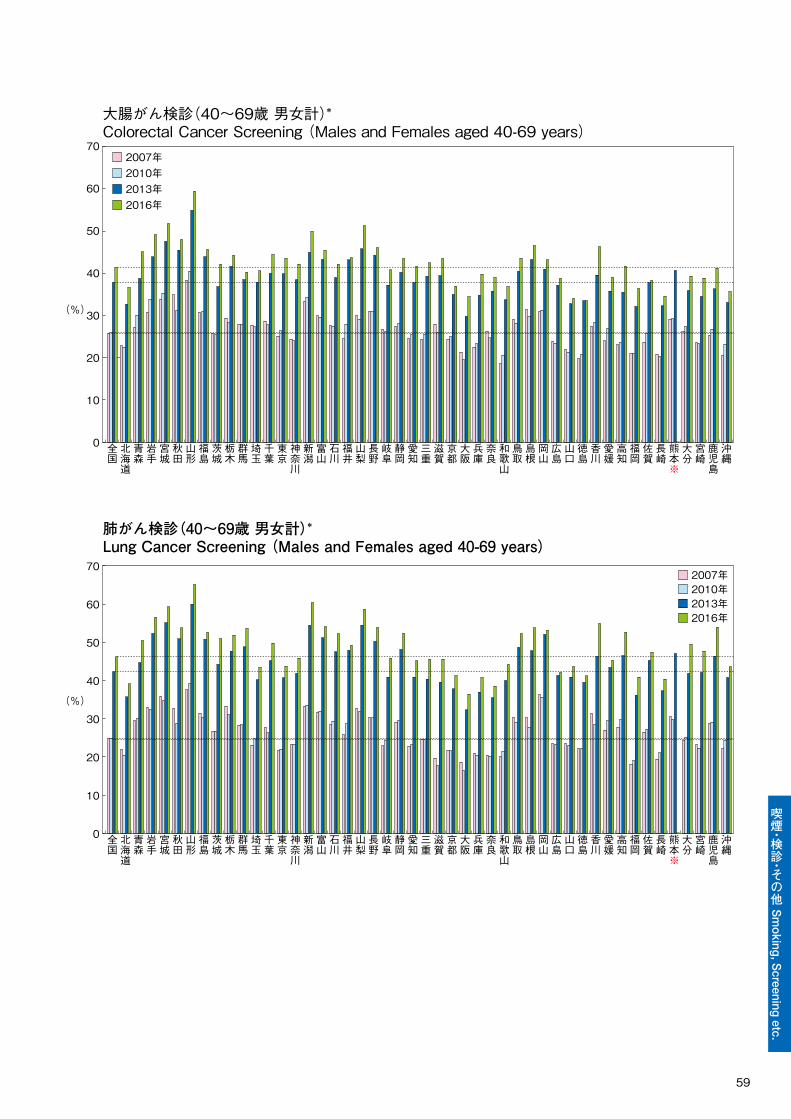
59
喫煙・検診・その他 S
moking, S
creening etc.
(%)
0
10
20
30
40
70
60
50
肺がん検診(40~69歳 男女計)*Lung Cancer Screening (Males and Females aged 40-69 years)
沖縄
鹿児島
宮崎
大分
熊本※
長崎
佐賀
福岡
高知
愛媛
香川
徳島
山口
広島
岡山
島根
鳥取
和歌山
奈良
兵庫
大阪
京都
滋賀
三重
愛知
静岡
岐阜
長野
山梨
福井
石川
富山
新潟
神奈川
東京
千葉
埼玉
群馬
栃木
茨城
福島
山形
秋田
宮城
岩手
青森
北海道
全国
■ 2007年■ 2010年■ 2013年■ 2016年
大腸がん検診(40~69歳 男女計)*Colorectal Cancer Screening (Males and Females aged 40-69 years)
沖縄
鹿児島
宮崎
大分
熊本※
長崎
佐賀
福岡
高知
愛媛
香川
徳島
山口
広島
岡山
島根
鳥取
和歌山
奈良
兵庫
大阪
京都
滋賀
三重
愛知
静岡
岐阜
長野
山梨
福井
石川
富山
新潟
神奈川
東京
千葉
埼玉
群馬
栃木
茨城
福島
山形
秋田
宮城
岩手
青森
北海道
全国
(%)
0
10
20
30
40
50
70
60
■ 2007年■ 2010年■ 2013年■ 2016年
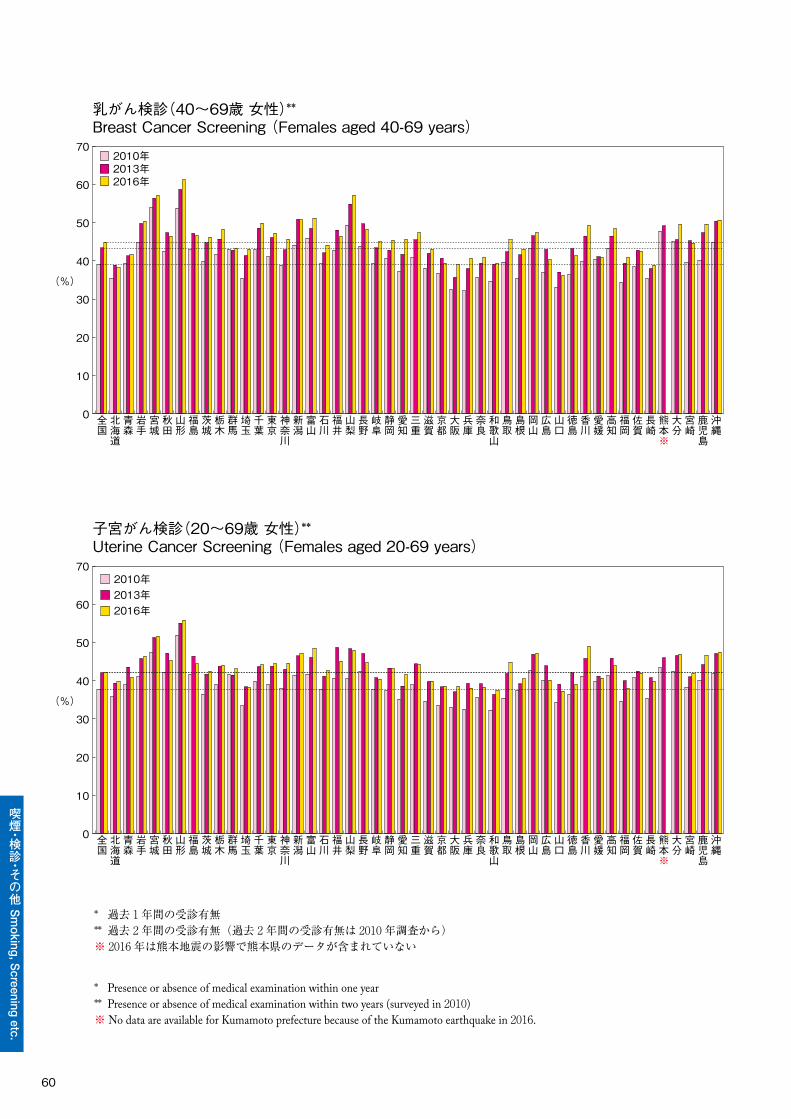
60
喫煙・検診・その他 S
moking, S
creening etc.
(%)
乳がん検診(40~69歳 女性)**Breast Cancer Screening (Females aged 40-69 years)
沖縄
鹿児島
宮崎
大分
熊本※
長崎
佐賀
福岡
高知
愛媛
香川
徳島
山口
広島
岡山
島根
鳥取
和歌山
奈良
兵庫
大阪
京都
滋賀
三重
愛知
静岡
岐阜
長野
山梨
福井
石川
富山
新潟
神奈川
東京
千葉
埼玉
群馬
栃木
茨城
福島
山形
秋田
宮城
岩手
青森
北海道
全国
0
10
20
30
40
70
60
50
■ 2010年■ 2013年■ 2016年
子宮がん検診(20~69歳 女性)**Uterine Cancer Screening (Females aged 20-69 years)
(%)
0
10
20
30
40
70
60
50
■ 2010年■ 2013年■ 2016年
沖縄
鹿児島
宮崎
大分
熊本※
長崎
佐賀
福岡
高知
愛媛
香川
徳島
山口
広島
岡山
島根
鳥取
和歌山
奈良
兵庫
大阪
京都
滋賀
三重
愛知
静岡
岐阜
長野
山梨
福井
石川
富山
新潟
神奈川
東京
千葉
埼玉
群馬
栃木
茨城
福島
山形
秋田
宮城
岩手
青森
北海道
全国
* 過去 1年間の受診有無** 過去 2年間の受診有無(過去 2年間の受診有無は 2010年調査から)※ 2016年は熊本地震の影響で熊本県のデータが含まれていない
* Presence or absence of medical examination within one year** Presence or absence of medical examination within two years (surveyed in 2010)※ No data are available for Kumamoto prefecture because of the Kumamoto earthquake in 2016.