Embed Size (px)
Citation preview
CAPITAL MARKET ASSUMPTIONS
FIVE-YEAR OUTLOOK: 2017 EDITION
Capital Market Assumptions 2
FIVE-YEAR OUTLOOK: 2017 EDITION
Every year, Northern Trust’s Capital Market Assumptions Working Group develops forward-looking, historically aware forecasts for global economic activity and financial market returns — which drive our five-year asset class return expectations and inform our asset allocation decisions.
All of this comes together in the form of our long-term strategic asset class allocation suggestions, which are used by institutional and individual investors worldwide.
Contributors
DAVID BLAKE Asset Management Director, International Fixed Income
WAYNE BOWERS Asset Management CEO & CIO, EMEA & APAC
BOB BROWNE, CFA Northern Trust Chief Investment Officer
BRAD CAMDEN, CFA Asset Management Director, Fixed Income Strategy
MICHAEL DEJUAN, CIM®, CAIA Asset Management Director, Portfolio Strategy
PETER FLOOD Asset Management Director, ETF Investment Strategy
JIM MCDONALD Northern Trust Chief Investment Strategist
PETER MLADINA Wealth Management Director, Portfolio Research
KATIE NIXON Wealth Management Chief Investment Officer
MATT PERON Asset Management Managing Director, Global Equities
DAN PERSONETTE, CFA Asset Management Director, Interest Rate Strategy
BRAD PETERSON Wealth Management Senior Portfolio Manager
DAN PHILLIPS, CFA Northern Trust Director, Asset Allocation Strategy
COLIN ROBERTSON Asset Management Managing Director, Fixed Income
CARL TANNENBAUM Northern Trust Chief Economist
Capital Market Assumptions 1
FIVE-YEAR OUTLOOK: 2017 EDITION
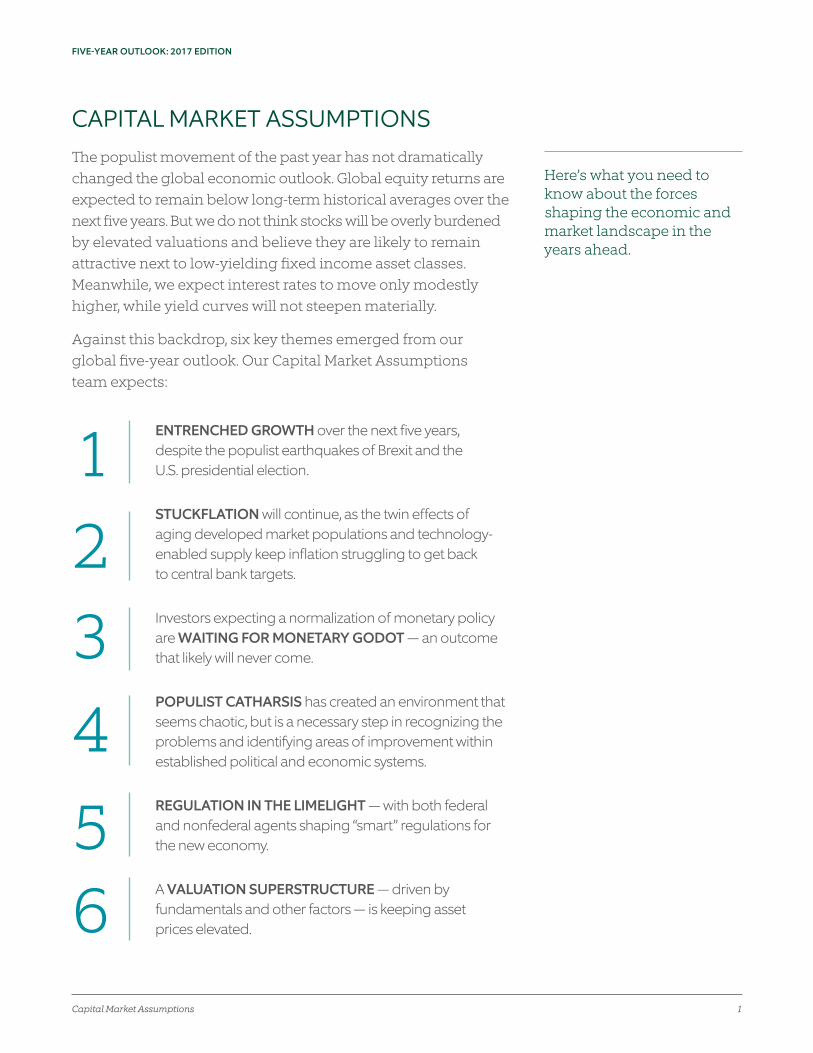
CAPITAL MARKET ASSUMPTIONSThe populist movement of the past year has not dramatically changed the global economic outlook. Global equity returns are expected to remain below long-term historical averages over the next five years. But we do not think stocks will be overly burdened by elevated valuations and believe they are likely to remain attractive next to low-yielding fixed income asset classes. Meanwhile, we expect interest rates to move only modestly higher, while yield curves will not steepen materially.
Against this backdrop, six key themes emerged from our global five-year outlook. Our Capital Market Assumptions team expects:
ENTRENCHED GROWTH over the next five years, despite the populist earthquakes of Brexit and the U.S. presidential election.
STUCKFLATION will continue, as the twin effects of aging developed market populations and technology-enabled supply keep inflation struggling to get back to central bank targets.
Investors expecting a normalization of monetary policy are WAITING FOR MONETARY GODOT — an outcome that likely will never come.
POPULIST CATHARSIS has created an environment that seems chaotic, but is a necessary step in recognizing the problems and identifying areas of improvement within established political and economic systems.
REGULATION IN THE LIMELIGHT — with both federal and nonfederal agents shaping “smart” regulations for the new economy.
A VALUATION SUPERSTRUCTURE — driven by fundamentals and other factors — is keeping asset prices elevated.
Here’s what you need to know about the forces shaping the economic and market landscape in the years ahead.
123456
Capital Market Assumptions 2
FIVE-YEAR OUTLOOK: 2017 EDITION
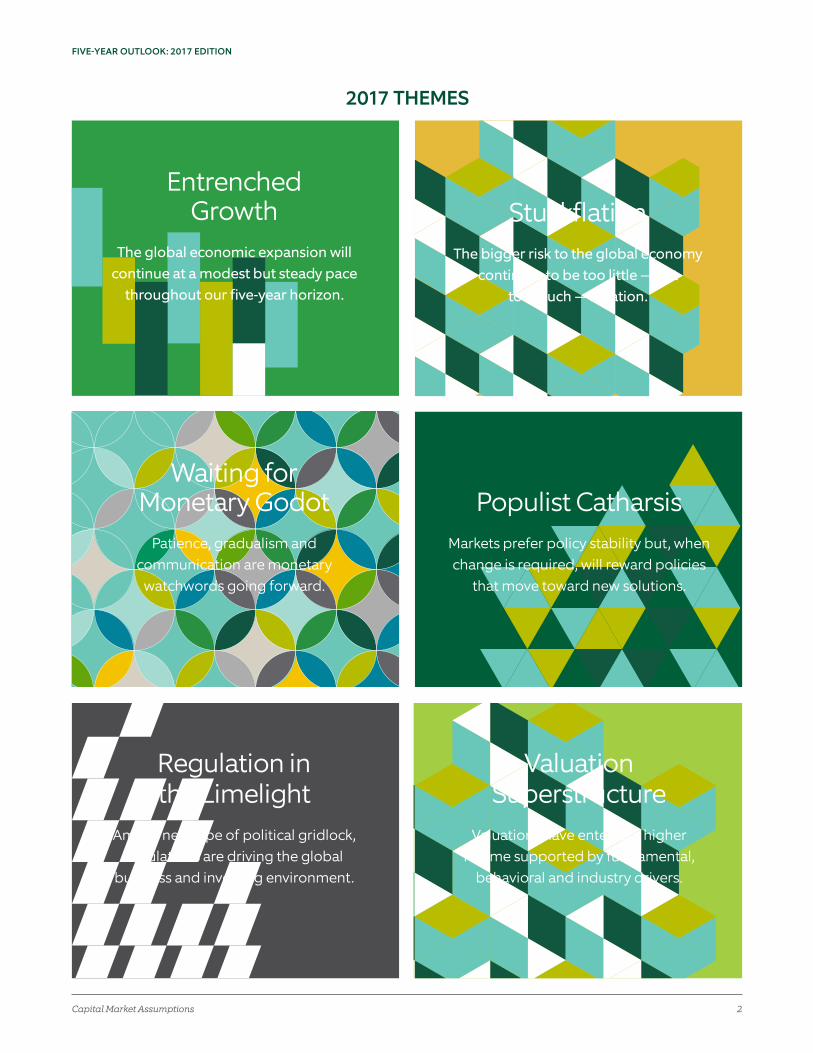
2017 THEMES
Valuation Superstructure
Valuations have entered a higher regime supported by fundamental,
behavioral and industry drivers.
Waiting for Monetary Godot
Patience, gradualism and communication are monetary
watchwords going forward.
Stuckflation
The bigger risk to the global economy continues to be too little — not
too much — inflation.
Regulation in the Limelight
Amid a new type of political gridlock, regulations are driving the global
business and investing environment.
Populist CatharsisMarkets prefer policy stability but, when change is required, will reward policies
that move toward new solutions.
Entrenched Growth
The global economic expansion will continue at a modest but steady pace
throughout our five-year horizon.
Capital Market Assumptions 3
FIVE-YEAR OUTLOOK: 2017 EDITION
-3
0
3
6
9
Retu
rns
(%)
U.S.
4.3
0.9-1.2
1.9
5.9
Europe
4.1
0.5-0.6
3.0
7.2
Japan
2.7
1.2
2.0
6.0
U.K.
4.2
-1.5
3.8
6.6
Emerging Markets
6.7
-2.0
1.3
2.3
8.4
6.4%DEVELOPED MARKET EQUITIES TOTAL RETURN FORECAST
1 Data going back to 1987.
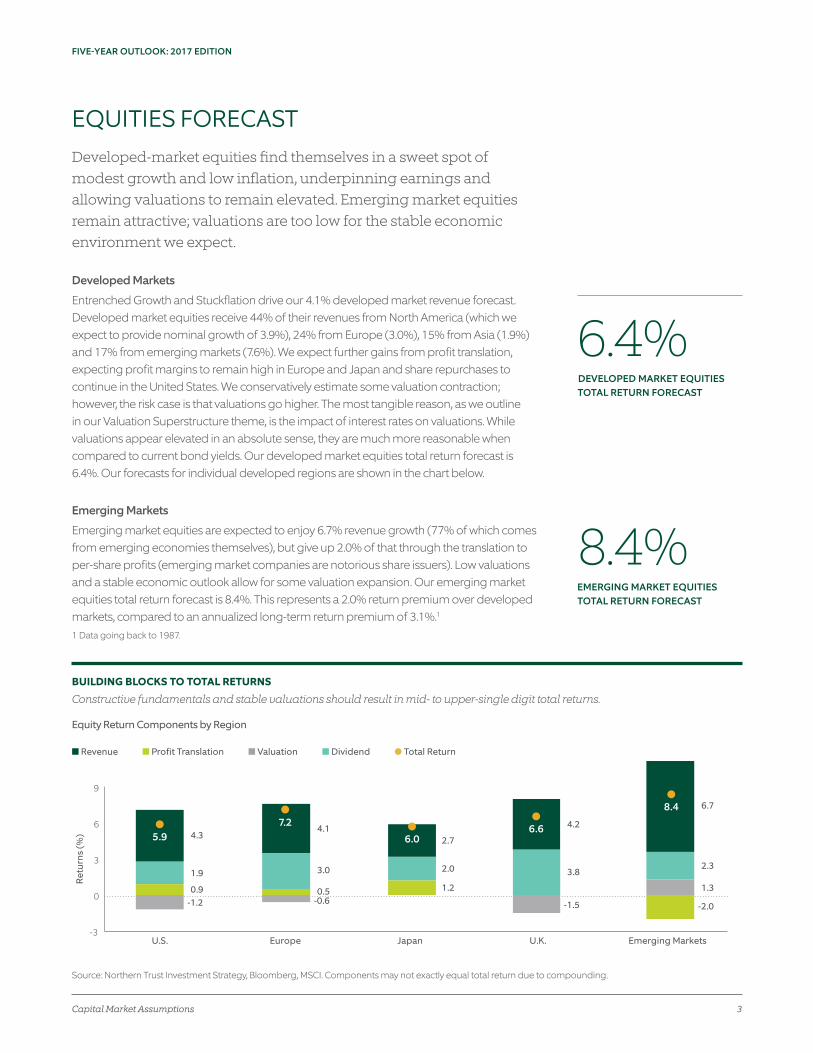
BUILDING BLOCKS TO TOTAL RETURNS
Constructive fundamentals and stable valuations should result in mid- to upper-single digit total returns.
Equity Return Components by Region
■ Revenue ■ Profit Translation ■ Valuation ■ Dividend ● Total Return
EQUITIES FORECASTDeveloped-market equities find themselves in a sweet spot of modest growth and low inflation, underpinning earnings and allowing valuations to remain elevated. Emerging market equities remain attractive; valuations are too low for the stable economic environment we expect.
Developed Markets
Entrenched Growth and Stuckflation drive our 4.1% developed market revenue forecast. Developed market equities receive 44% of their revenues from North America (which we expect to provide nominal growth of 3.9%), 24% from Europe (3.0%), 15% from Asia (1.9%) and 17% from emerging markets (7.6%). We expect further gains from profit translation, expecting profit margins to remain high in Europe and Japan and share repurchases to continue in the United States. We conservatively estimate some valuation contraction; however, the risk case is that valuations go higher. The most tangible reason, as we outline in our Valuation Superstructure theme, is the impact of interest rates on valuations. While valuations appear elevated in an absolute sense, they are much more reasonable when compared to current bond yields. Our developed market equities total return forecast is 6.4%. Our forecasts for individual developed regions are shown in the chart below.
Emerging Markets
Emerging market equities are expected to enjoy 6.7% revenue growth (77% of which comes from emerging economies themselves), but give up 2.0% of that through the translation to per-share profits (emerging market companies are notorious share issuers). Low valuations and a stable economic outlook allow for some valuation expansion. Our emerging market equities total return forecast is 8.4%. This represents a 2.0% return premium over developed markets, compared to an annualized long-term return premium of 3.1%.1
8.4%EMERGING MARKET EQUITIESTOTAL RETURN FORECAST
Source: Northern Trust Investment Strategy, Bloomberg, MSCI. Components may not exactly equal total return due to compounding.
Capital Market Assumptions 4
FIVE-YEAR OUTLOOK: 2017 EDITION
FIXED INCOME FORECAST
3.0%EXPECTED INTEREST RATE FORECAST FOR U.S. 10-YEAR NOTE
Investment-grade forecasts are benefiting from a higher yield starting point and a controlled shift to higher interest rates. Cash returns are still likely to underperform inflation over the next five years. Normalized high yield credit spreads (from last year’s oil price weakness) mean lower returns.
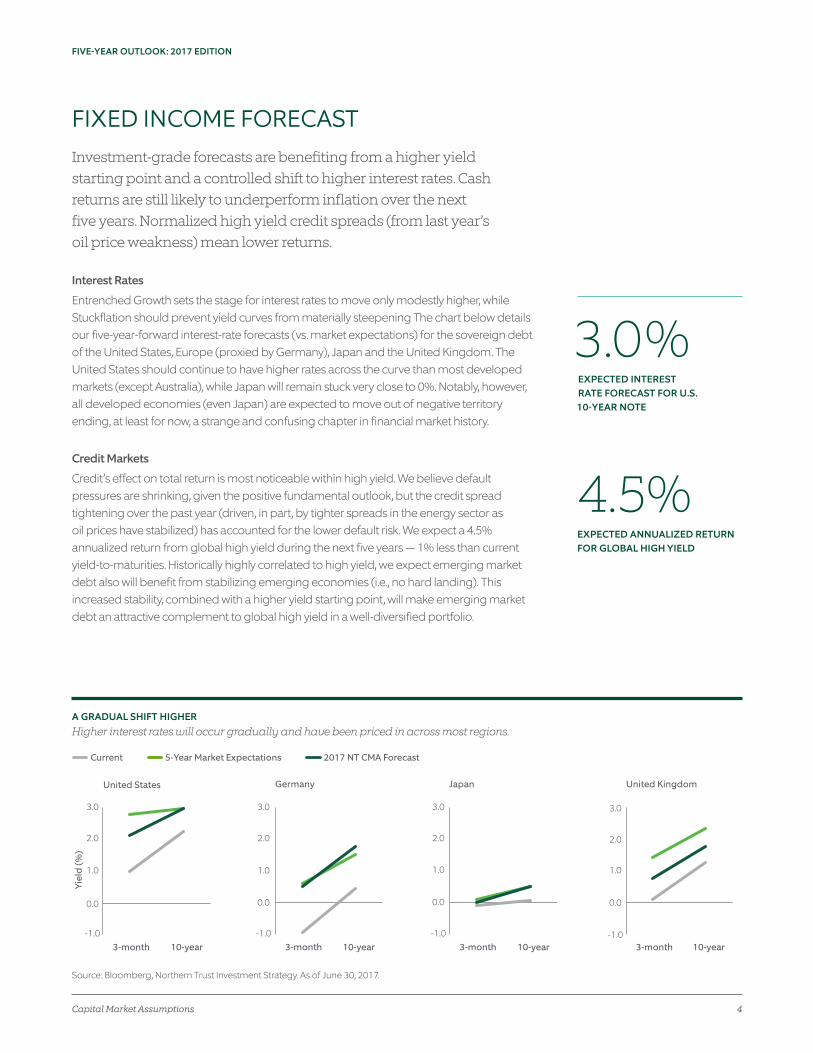
Interest Rates
Entrenched Growth sets the stage for interest rates to move only modestly higher, while Stuckflation should prevent yield curves from materially steepening The chart below details our five-year-forward interest-rate forecasts (vs. market expectations) for the sovereign debt of the United States, Europe (proxied by Germany), Japan and the United Kingdom. The United States should continue to have higher rates across the curve than most developed markets (except Australia), while Japan will remain stuck very close to 0%. Notably, however, all developed economies (even Japan) are expected to move out of negative territory ending, at least for now, a strange and confusing chapter in financial market history.
Credit Markets
Credit’s effect on total return is most noticeable within high yield. We believe default pressures are shrinking, given the positive fundamental outlook, but the credit spread tightening over the past year (driven, in part, by tighter spreads in the energy sector as oil prices have stabilized) has accounted for the lower default risk. We expect a 4.5% annualized return from global high yield during the next five years — 1% less than current yield-to-maturities. Historically highly correlated to high yield, we expect emerging market debt also will benefit from stabilizing emerging economies (i.e., no hard landing). This increased stability, combined with a higher yield starting point, will make emerging market debt an attractive complement to global high yield in a well-diversified portfolio.
4.5%EXPECTED ANNUALIZED RETURN FOR GLOBAL HIGH YIELD
A GRADUAL SHIFT HIGHERHigher interest rates will occur gradually and have been priced in across most regions.
Current 5-Year Market Expectations 2017 NT CMA Forecast
-1.0
0.0
1.0
2.0
3.0
3-month 10-year
Japan
-1.0
0.0
1.0
2.0
3.0
3-month 10-year
GermanyUnited States
3-month 10-year-1.0
0.0
1.0
2.0
3.0
Yiel
d (%
)
United Kingdom
3-month 10-year-1.0
0.0
1.0
2.0
3.0
Source: Bloomberg, Northern Trust Investment Strategy. As of June 30, 2017.
Capital Market Assumptions 5
FIVE-YEAR OUTLOOK: 2017 EDITION
0
100
200
300
400
500
600
Dec-01 Dec-04 Dec-07 Dec-10 Dec-13 Dec-16
Ind
ex (1
2/31
/200
1 =
100
) Return Correlation Diverges
7.4%NATURAL RESOURCES TOTAL RETURN FORECAST
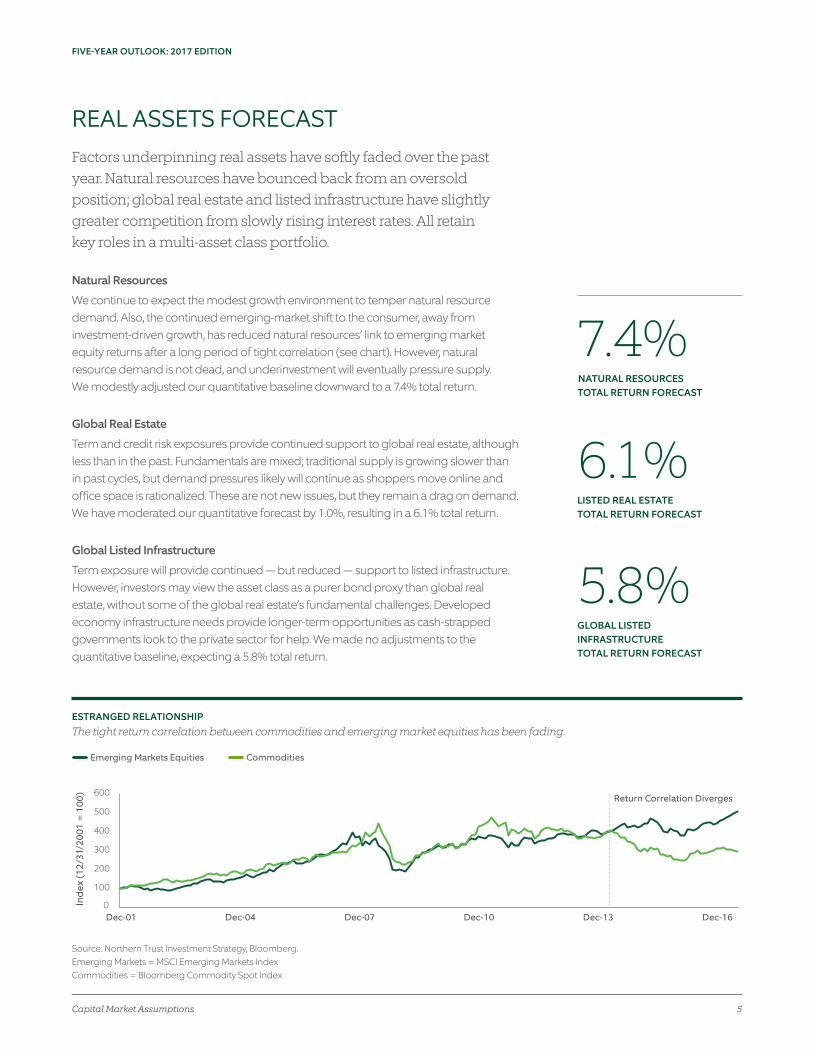
REAL ASSETS FORECASTFactors underpinning real assets have softly faded over the past year. Natural resources have bounced back from an oversold position; global real estate and listed infrastructure have slightly greater competition from slowly rising interest rates. All retain key roles in a multi-asset class portfolio.
Natural Resources
We continue to expect the modest growth environment to temper natural resource demand. Also, the continued emerging-market shift to the consumer, away from investment-driven growth, has reduced natural resources’ link to emerging market equity returns after a long period of tight correlation (see chart). However, natural resource demand is not dead, and underinvestment will eventually pressure supply. We modestly adjusted our quantitative baseline downward to a 7.4% total return.
Global Real Estate
Term and credit risk exposures provide continued support to global real estate, although less than in the past. Fundamentals are mixed; traditional supply is growing slower than in past cycles, but demand pressures likely will continue as shoppers move online and office space is rationalized. These are not new issues, but they remain a drag on demand. We have moderated our quantitative forecast by 1.0%, resulting in a 6.1% total return.
Global Listed Infrastructure
Term exposure will provide continued — but reduced — support to listed infrastructure. However, investors may view the asset class as a purer bond proxy than global real estate, without some of the global real estate’s fundamental challenges. Developed economy infrastructure needs provide longer-term opportunities as cash-strapped governments look to the private sector for help. We made no adjustments to the quantitative baseline, expecting a 5.8% total return.
ESTRANGED RELATIONSHIPThe tight return correlation between commodities and emerging market equities has been fading.
Emerging Markets Equities Commodities
6.1%LISTED REAL ESTATE TOTAL RETURN FORECAST
5.8%GLOBAL LISTED INFRASTRUCTURE TOTAL RETURN FORECAST
Source: Northern Trust Investment Strategy, Bloomberg. Emerging Markets = MSCI Emerging Markets Index Commodities = Bloomberg Commodity Spot Index
Capital Market Assumptions 6
FIVE-YEAR OUTLOOK: 2017 EDITION
0
4
8
12
16
20
2001 2003 2005 2007 2009 2011 2013 2015 2017
Retu
rn (%
)
Hedge Fund Risk Contribution
Hedge Fund Alpha Contribution
4.4%HEDGE FUND RETURN FORECAST
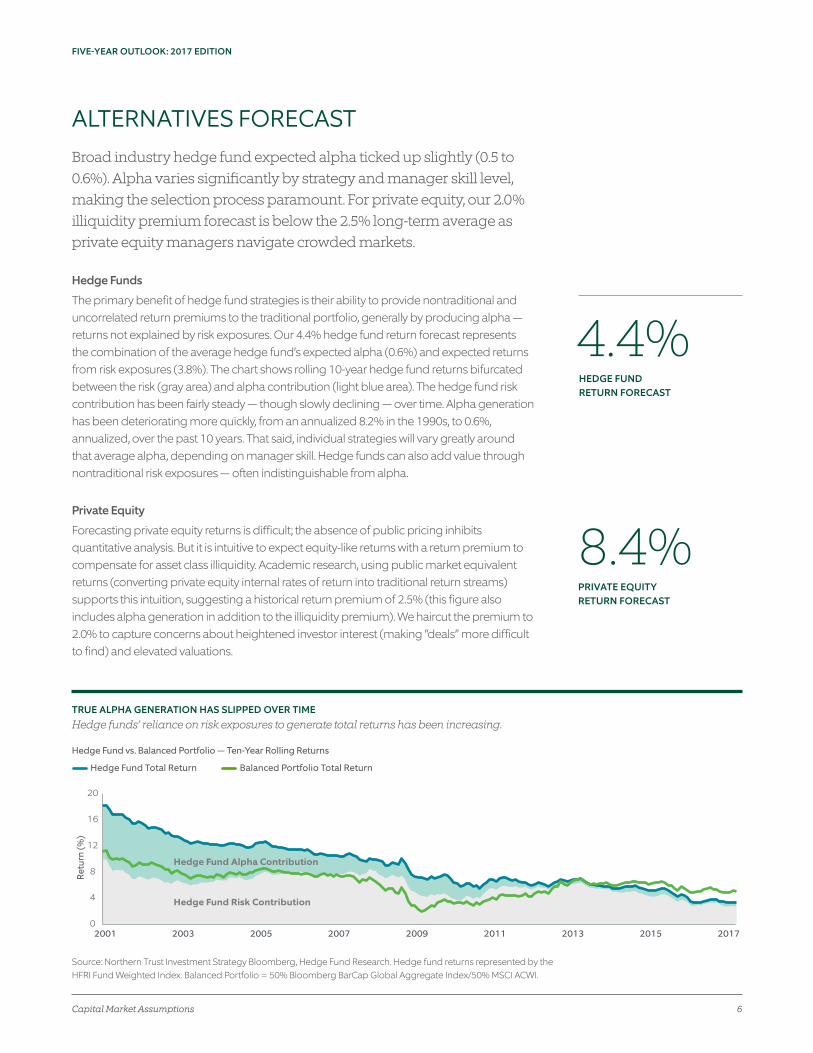
ALTERNATIVES FORECASTBroad industry hedge fund expected alpha ticked up slightly (0.5 to 0.6%). Alpha varies significantly by strategy and manager skill level, making the selection process paramount. For private equity, our 2.0% illiquidity premium forecast is below the 2.5% long-term average as private equity managers navigate crowded markets.
Hedge Funds
The primary benefit of hedge fund strategies is their ability to provide nontraditional and uncorrelated return premiums to the traditional portfolio, generally by producing alpha — returns not explained by risk exposures. Our 4.4% hedge fund return forecast represents the combination of the average hedge fund’s expected alpha (0.6%) and expected returns from risk exposures (3.8%). The chart shows rolling 10-year hedge fund returns bifurcated between the risk (gray area) and alpha contribution (light blue area). The hedge fund risk contribution has been fairly steady — though slowly declining — over time. Alpha generation has been deteriorating more quickly, from an annualized 8.2% in the 1990s, to 0.6%, annualized, over the past 10 years. That said, individual strategies will vary greatly around that average alpha, depending on manager skill. Hedge funds can also add value through nontraditional risk exposures — often indistinguishable from alpha.
Private Equity
Forecasting private equity returns is difficult; the absence of public pricing inhibits quantitative analysis. But it is intuitive to expect equity-like returns with a return premium to compensate for asset class illiquidity. Academic research, using public market equivalent returns (converting private equity internal rates of return into traditional return streams) supports this intuition, suggesting a historical return premium of 2.5% (this figure also includes alpha generation in addition to the illiquidity premium). We haircut the premium to 2.0% to capture concerns about heightened investor interest (making “deals” more difficult to find) and elevated valuations.
8.4%PRIVATE EQUITY RETURN FORECAST
TRUE ALPHA GENERATION HAS SLIPPED OVER TIMEHedge funds’ reliance on risk exposures to generate total returns has been increasing.
Hedge Fund vs. Balanced Portfolio — Ten-Year Rolling Returns
Hedge Fund Total Return Balanced Portfolio Total Return
Source: Northern Trust Investment Strategy Bloomberg, Hedge Fund Research. Hedge fund returns represented by the HFRI Fund Weighted Index. Balanced Portfolio = 50% Bloomberg BarCap Global Aggregate Index/50% MSCI ACWI.
Capital Market Assumptions 7
FIVE-YEAR OUTLOOK: 2017 EDITION
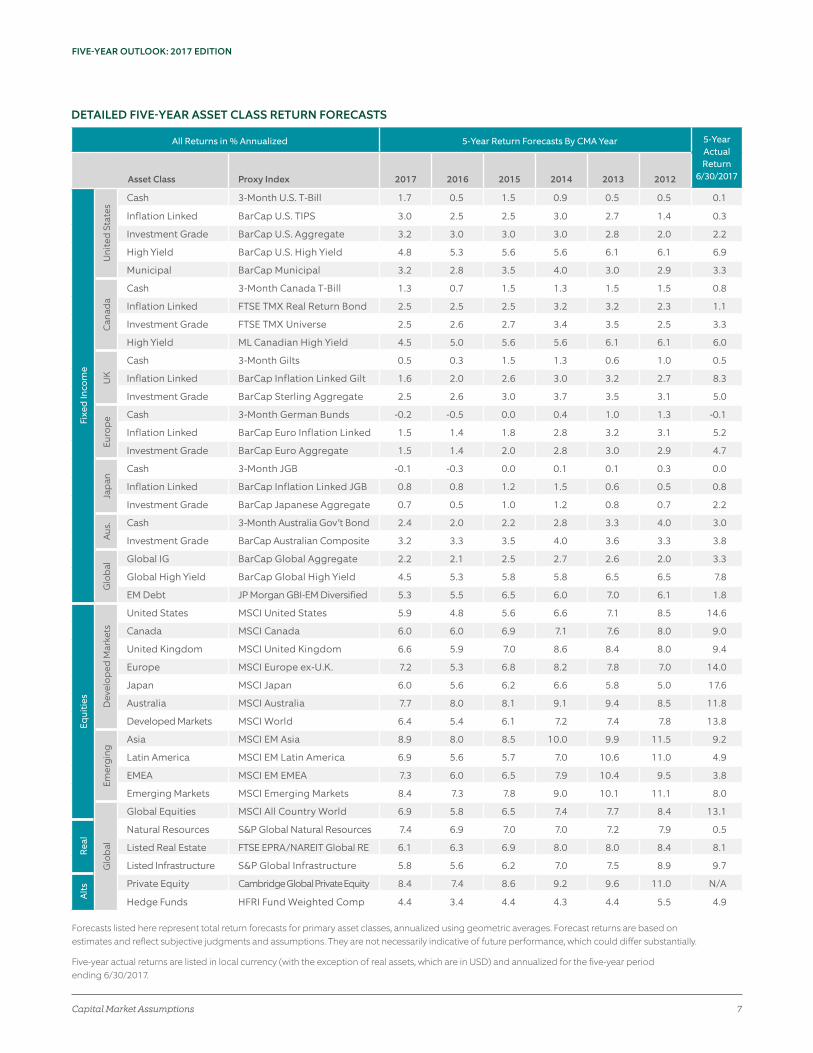
DETAILED FIVE-YEAR ASSET CLASS RETURN FORECASTS
All Returns in % Annualized 5-Year Return Forecasts By CMA Year 5-Year Actual Return
6/30/2017Asset Class Proxy Index 2017 2016 2015 2014 2013 2012
Fixe
d In
com
e
Uni
ted
Sta
tes
Cash 3-Month U.S. T-Bill 1.7 0.5 1.5 0.9 0.5 0.5 0.1
Inflation Linked BarCap U.S. TIPS 3.0 2.5 2.5 3.0 2.7 1.4 0.3
Investment Grade BarCap U.S. Aggregate 3.2 3.0 3.0 3.0 2.8 2.0 2.2
High Yield BarCap U.S. High Yield 4.8 5.3 5.6 5.6 6.1 6.1 6.9
Municipal BarCap Municipal 3.2 2.8 3.5 4.0 3.0 2.9 3.3
Can
ada
Cash 3-Month Canada T-Bill 1.3 0.7 1.5 1.3 1.5 1.5 0.8
Inflation Linked FTSE TMX Real Return Bond 2.5 2.5 2.5 3.2 3.2 2.3 1.1
Investment Grade FTSE TMX Universe 2.5 2.6 2.7 3.4 3.5 2.5 3.3
High Yield ML Canadian High Yield 4.5 5.0 5.6 5.6 6.1 6.1 6.0
UK
Cash 3-Month Gilts 0.5 0.3 1.5 1.3 0.6 1.0 0.5
Inflation Linked BarCap Inflation Linked Gilt 1.6 2.0 2.6 3.0 3.2 2.7 8.3
Investment Grade BarCap Sterling Aggregate 2.5 2.6 3.0 3.7 3.5 3.1 5.0
Euro
pe Cash 3-Month German Bunds -0.2 -0.5 0.0 0.4 1.0 1.3 -0.1
Inflation Linked BarCap Euro Inflation Linked 1.5 1.4 1.8 2.8 3.2 3.1 5.2
Investment Grade BarCap Euro Aggregate 1.5 1.4 2.0 2.8 3.0 2.9 4.7
Jap
an
Cash 3-Month JGB -0.1 -0.3 0.0 0.1 0.1 0.3 0.0
Inflation Linked BarCap Inflation Linked JGB 0.8 0.8 1.2 1.5 0.6 0.5 0.8
Investment Grade BarCap Japanese Aggregate 0.7 0.5 1.0 1.2 0.8 0.7 2.2
Aus. Cash 3-Month Australia Gov’t Bond 2.4 2.0 2.2 2.8 3.3 4.0 3.0
Investment Grade BarCap Australian Composite 3.2 3.3 3.5 4.0 3.6 3.3 3.8
Glo
bal
Global IG BarCap Global Aggregate 2.2 2.1 2.5 2.7 2.6 2.0 3.3
Global High Yield BarCap Global High Yield 4.5 5.3 5.8 5.8 6.5 6.5 7.8
EM Debt JP Morgan GBI-EM Diversified 5.3 5.5 6.5 6.0 7.0 6.1 1.8
Equi
ties
Dev
elop
ed M
arke
ts
United States MSCI United States 5.9 4.8 5.6 6.6 7.1 8.5 14.6
Canada MSCI Canada 6.0 6.0 6.9 7.1 7.6 8.0 9.0
United Kingdom MSCI United Kingdom 6.6 5.9 7.0 8.6 8.4 8.0 9.4
Europe MSCI Europe ex-U.K. 7.2 5.3 6.8 8.2 7.8 7.0 14.0
Japan MSCI Japan 6.0 5.6 6.2 6.6 5.8 5.0 17.6
Australia MSCI Australia 7.7 8.0 8.1 9.1 9.4 8.5 11.8
Developed Markets MSCI World 6.4 5.4 6.1 7.2 7.4 7.8 13.8
Emer
ging
Asia MSCI EM Asia 8.9 8.0 8.5 10.0 9.9 11.5 9.2
Latin America MSCI EM Latin America 6.9 5.6 5.7 7.0 10.6 11.0 4.9
EMEA MSCI EM EMEA 7.3 6.0 6.5 7.9 10.4 9.5 3.8
Emerging Markets MSCI Emerging Markets 8.4 7.3 7.8 9.0 10.1 11.1 8.0
Glo
bal
Global Equities MSCI All Country World 6.9 5.8 6.5 7.4 7.7 8.4 13.1
Rea
l
Natural Resources S&P Global Natural Resources 7.4 6.9 7.0 7.0 7.2 7.9 0.5
Listed Real Estate FTSE EPRA/NAREIT Global RE 6.1 6.3 6.9 8.0 8.0 8.4 8.1
Listed Infrastructure S&P Global Infrastructure 5.8 5.6 6.2 7.0 7.5 8.9 9.7
Alts
Private Equity Cambridge Global Private Equity 8.4 7.4 8.6 9.2 9.6 11.0 N/A
Hedge Funds HFRI Fund Weighted Comp 4.4 3.4 4.4 4.3 4.4 5.5 4.9
Forecasts listed here represent total return forecasts for primary asset classes, annualized using geometric averages. Forecast returns are based on estimates and reflect subjective judgments and assumptions. They are not necessarily indicative of future performance, which could differ substantially.
Five-year actual returns are listed in local currency (with the exception of real assets, which are in USD) and annualized for the five-year period ending 6/30/2017.

Capital Market Assumptions 8
FIVE-YEAR OUTLOOK: 2017 EDITION
GET MORE INSIGHTSTo access our full research paper and subscribe to our market commentary emails, visit northerntrust.com/outlook.
ABOUT NORTHERN TRUSTWhatever Your Greater, We Can Help You Achieve It
For more than a century, Northern Trust has worked hard building our legacy of outstanding service, expertise and integrity. From a Chicago-based bank founded in 1889, we now have more than 20 international locations and 16,500 employees globally. We serve the world’s most-sophisticated clients — from sovereign wealth funds and the wealthiest individuals and families, to the most-successful hedge funds and corporate brands.
Our guiding principles not only survived but thrived during the Great Depression, two world wars and the 2008 financial crisis. We burnished our reputation as a global leader delivering innovative investment management, asset and fund administration, and fiduciary and banking solutions enabled by sophisticated, leading technology. And through it all, we continually laid a solid, forward-looking foundation on which future generations can continue growing and achieving greater.
As of June 30, 2017, Northern Trust Corporation had:
• $126 billion in banking assets
• $7.4 trillion in assets under custody
• $9.3 trillion in assets under custody/administration
• $1.0 trillion in assets under management

Capital Market Assumptions 9
FIVE-YEAR OUTLOOK: 2017 EDITION
northerntrust.com
© 2018 Northern Trust Corporation. Head Office: 50 South La Salle Street, Chicago, Illinois 60603 U.S.A. Incorporated with limited liability in the U.S. Products and services provided by subsidiaries of Northern Trust Corporation may vary in different markets and are offered in accordance with local regulation. This material is directed to professional clients only and is not intended for retail clients. For Asia-Pacific markets, it is directed to expert, institutional, professional and wholesale investors only and should not be relied upon by retail clients or investors. For legal and regulatory information about our offices and legal entities, visit northerntrust.com/disclosures. The following information is provided to comply with local disclosure requirements: The Northern Trust Company, London Branch; Northern Trust Global Services PLC; Northern Trust Global Investments Limited; Northern Trust Securities LLP. Northern Trust Global Services PLC, Abu Dhabi Branch, registration Number 000000519 licenced by ADGM under FSRA # 160018. The Northern Trust Company of Saudi Arabia - a Saudi closed joint stock company - Capital SAR 52 million. Licensed by the Capital Market Authority - License No. 12163-26 - C.R: 1010366439. Northern Trust Global Services PLC Luxembourg Branch, 6 rue Lou Hemmer, L-1748 Senningerberg, Grand-Duché de Luxembourg, Succursale d’une société de droit étranger RCS B129936. Northern Trust Luxembourg Management Company S.A., 6 rue Lou Hemmer, L-1748 Senningerberg, Grand-Duché de Luxembourg, Société anonyme RCS B99167. Northern Trust (Guernsey) Limited (2651)/Northern Trust Fiduciary Services (Guernsey) Limited (29806)/Northern Trust International Fund Administration Services (Guernsey) Limited (15532) Registered Office: Trafalgar Court Les Banques, St Peter Port, Guernsey GY1 3DA.
IMPORTANT INFORMATION. The information is not intended for distribution or use by any person in any jurisdiction where such distribution would be contrary to local law or regulation. Northern Trust and its affiliates may have positions in and may effect transactions in the markets, contracts and related investments different than described in this information. This information is obtained from sources believed to be reliable, and its accuracy and completeness are not guaranteed. Information does not constitute a recommendation of any investment strategy, is not intended as investment advice and does not take into account all the circumstances of each investor.
This report is provided for informational purposes only and is not intended to be, and should not be construed as, an offer, solicitation or recommendation with respect to any transaction and should not be treated as legal advice, investment advice or tax advice. Recipients should not rely upon this information as a substitute for obtaining specific legal or tax advice from their own professional legal or tax advisors. Indices and trademarks are the property of their respective owners. Information is subject to change based on market or other conditions.
Forward-looking statements and assumptions are Northern Trust’s current estimates or expectations of future events or future results based upon proprietary research and should not be construed as an estimate or promise of results that a portfolio may achieve. Actual results could differ materially from the results indicated by this information.
Capital Market Assumption (CMA) model expected returns do not show actual performance and are for illustrative purposes only. They do not reflect actual trading, liquidity constraints, fees, expenses, taxes and other factors that could impact the future returns. Stated return expectations may differ from an investor’s actual result. The assumptions, views, techniques and forecasts noted are subject to change without notice.
Q60383 (3/18)