Embed Size (px)
Citation preview
Earth Syst. Sci. Data, 6, 175–183, 2014www.earth-syst-sci-data.net/6/175/2014/doi:10.5194/essd-6-175-2014© Author(s) 2014. CC Attribution 3.0 License. O
pen A
cces
s Earth System
Science
Data
Measurements of total alkalinity and inorganic dissolvedcarbon in the Atlantic Ocean and adjacent Southern
Ocean between 2008 and 2010
U. Schuster1,*, A. J. Watson1,*, D. C. E. Bakker2, A. M. de Boer3,*, E. M. Jones4,*, G. A. Lee2, O. Legge2,A. Louwerse1,*, J. Riley5, and S. Scally*
1College of Life and Environmental Sciences, University of Exeter, Exeter, EX4 4PS, UK2Centre for Ocean and Atmospheric Science, School of Environmental Sciences, University of East Anglia,
Norwich Research Park, Norwich, NR4 7TJ, UK3Department of Geological Sciences and Bolin Centre for Climate Research, Stockholm University, Stockholm,
Sweden4Alfred Wegener Institute for Polar and Marine Research, Climate Sciences, Postfach 120161, 27515
Bremerhaven, Germany5International CLIVAR Project Office, National Oceanography Centre, Southampton, Waterfront Campus,
European Way, Southampton, SO14 3ZH, UK* formerly at: School of Environmental Sciences, University of East Anglia, Norwich Research Park, Norwich,
NR4 7TJ, UK
Correspondence to:U. Schuster ([email protected])
Received: 9 October 2013 – Published in Earth Syst. Sci. Data Discuss.: 8 November 2013Revised: 13 March 2014 – Accepted: 16 March 2014 – Published: 6 May 2014
Abstract. Water column dissolved inorganic carbon and total alkalinity were measured during five hydro-graphic sections in the Atlantic Ocean and Drake Passage. The work was funded through the Strategic Fund-ing Initiative of the UK’s Oceans2025 programme, which ran from 2007 to 2012. The aims of this programmewere to establish the regional budgets of natural and anthropogenic carbon in the North Atlantic, the South At-lantic, and the Atlantic sector of the Southern Ocean, as well as the rates of change of these budgets. This paperdescribes in detail the dissolved inorganic carbon and total alkalinity data collected along east–west sectionsat 47◦ N to 60◦ N, 24.5◦ N, and 24◦ S in the Atlantic and across two Drake Passage sections. Other hydro-graphic and biogeochemical parameters were measured during these sections, and relevant standard operatingprocedures are mentioned here.
Over 95 % of dissolved inorganic carbon and total alkalinity samples taken during the 24.5◦ N, 24◦ S, andthe Drake Passage sections were analysed onboard and subjected to a first-level quality control addressingtechnical and analytical issues. Samples taken along 47◦ N to 60◦ N were analysed and subjected to qualitycontrol back in the laboratory. Complete post-cruise second-level quality control was performed using cross-over analysis with historical data in the vicinity of measurements, and data were submitted to the CLIVAR andCarbon Hydrographic Data Office (CCHDO), the Carbon Dioxide Information Analysis Center (CDIAC) andand will be included in the Global Ocean Data Analyses Project, version 2 (GLODAP 2), the upcoming updateof Key et al. (2004).
Published by Copernicus Publications.
176 U. Schuster et al.: Measurements of total alkalinity and inorganic dissolved carbon
Table 1. Data coverage and parameter measured.
Geographical region, Repository reference Coverage DatesEXPO code
47 to 60◦ N, doi:10.3334/CDIAC/OTG.CLIVAR_AR07W_74DI20080820 47.51◦ N to 60.6◦ N/55.5◦W to 11.1◦W 20 August to74DI20080820 25 September 2008
24.5◦ N, doi:10.3334/CDIAC/OTG.CLIVAR_A05_2010 23.3◦ N to 27.9◦ N/79.9◦W to 13.4◦W 5 January to74DI20100106 19 February 2010
24◦ S, doi:10.3334/CDIAC/OTG.CLIVAR_A9.5_2009 37.4◦ S to 22.2◦ S/53.5◦W to 13.7◦ E 7 March and740H20090307 21 April 2009
Drake Passage, doi:10.3334/CDIAC/OTG.CLIVAR_A21_JC031_2009 A21: 57.1◦ S to 64.1◦ S/68.3◦W to 63.1◦W, 3 February and740H20090203 SR01b: 61.1◦ S to 54.7◦ S/54.6 to 58.0◦W, 3 March 2009
with an extension to 53.14◦ S 58.00◦W
1 Introduction
The world oceans had taken up approximately half of the an-thropogenic carbon dioxide (CO2) released by the burning offossil fuel and producing cement between the Industrial Rev-olution and 1994 (Sabine et al., 2004). Without this sink ofCO2, the atmospheric content of CO2 would be much higherthan it is today, by approx. 80 ppm, depending on the vari-ability of the source/sink balance since the industrial revo-lution. Moreover, the oceanic uptake of atmospheric CO2 isnot uniform in either time or space, so that the future con-centration of atmospheric CO2 is highly dependent on thebehaviour and variability of this sink.
The control of the spatial and temporal variability ofoceanic CO2 uptake is not well understood. One of the majorinfluences is the Meridional Overturning Circulation (MOC)and in particular the Atlantic MOC, which have significantimpact on climate and their influence on the carbon cycle(Peréz et al., 2013; Broecker and Peng, 1992; Watson et al.,1995).
In order to predict the future behaviour of the ocean sink,it is crucial to first get a better understanding of its presentbehaviour. To that end, sustained observations are needed ofinterior ocean biogeochemical and hydrographic parameters.
Between 2007 and 2012, a strategic research pro-gramme of the UK’s National Environmental ResearchCouncil (NERC) Marine Centres, Oceans2025 (http://www.oceans2025.org/) was funded. Theme 1 – Ocean circulation,sea level and climate change – aimed to establish regionalbudgets of heat, freshwater, and carbon via the measurementsof physical, chemical and biological parameters on a set ofhydrographic sections in the Atlantic and the Atlantic sectorof the Southern Ocean. To ensure high-quality measurementsof carbon and transient tracers on these sections, a StrategicFunding Initiative (SOFI) was funded entitled “A carbon andtransient tracer measurement programme in the Atlantic andSouthern Ocean under Oceans2025”. In this paper we de-scribe the measurements of dissolved inorganic carbon (DIC)and total alkalinity (TA) performed on these sections.
These measurements were a UK-funded contribution tothe international repeat hydrography effort (CLIVAR/GO-SHIP programmes,http://www.go-ship.org/).
2 Common sampling and analyses
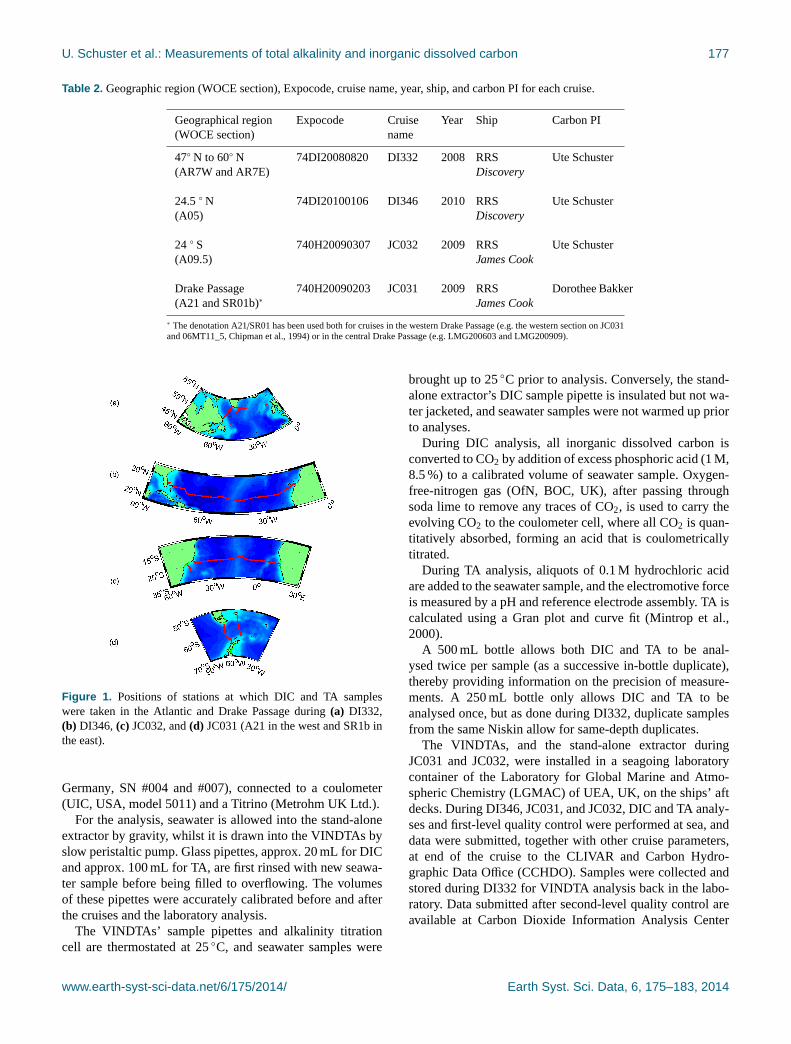
As part of SOFI, DIC and TA were analysed in seawater sam-ples on five hydrographic sections in the Atlantic Ocean andthe Atlantic sector of the Southern Ocean; Table 2 lists innorth to south direction, geographical region (WOCE sec-tion), Expocode, cruise name, year, ship, and carbon PI along47◦ N to 60◦ N in 2008, 24.5◦ N in 2010, 24◦ S in 2009, andDrake Passages in 2009. The sections and positions of sta-tions at which DIC and TA samples were taken are indicatedin Fig. 1. Hereafter, the cruises are referred to by cruise name(i.e. DI332, DI346, JC032, and JC031).
All seawater samples for DIC and TA were drawn from theNiskin bottles of the conductivity/temperature/depth (CTD)rosette into either 500 mL or 250 mL borosilicate groundglass bottles according to the Standard Operating Procedure(SOP) #1 (Dickson et al., 2007). In short, sample bottles arerinsed and then overfilled from the bottom. Subsequentlyduring DI332, DI346, and JC032, samples were routinelypoisoned by removing 1 % of sample volume and adding0.02 % saturated mercuric chloride solution. Finally, the sam-ples were stoppered and stored in a cool, dark place, untilanalysed either onboard or back in the laboratory. DuringJC031, samples were only poisoned upon collection if theanalysis did not take place within 8 h for surface samples andwithin 20 h for deep samples. Approximately 30 % of JC031samples were poisoned.
DIC was analysed by coulometry (Johnson et al., 1985,1987, 1993) following SOP #2 (Dickson et al., 2007) and TAby open cell potentiometric titration (Mintrop et al., 2000)following SOP #3b (Dickson et al., 2007). Two types ofinstruments were used: (i) for DIC only, a stand-alone ex-traction unit (Robinson and Williams, 1991) connected toa coulometer (UIC, USA, model 5011), and (ii) for bothDIC and TA, two Versatile INstrument for the Determina-tion of Titration Alkalinity (VINDTA version 3C, Marianda,
Earth Syst. Sci. Data, 6, 175–183, 2014 www.earth-syst-sci-data.net/6/175/2014/
U. Schuster et al.: Measurements of total alkalinity and inorganic dissolved carbon 177
Table 2. Geographic region (WOCE section), Expocode, cruise name, year, ship, and carbon PI for each cruise.
Geographical region(WOCE section)
Expocode Cruisename
Year Ship Carbon PI
47◦ N to 60◦ N(AR7W and AR7E)
74DI20080820 DI332 2008 RRSDiscovery
Ute Schuster
24.5◦ N(A05)
74DI20100106 DI346 2010 RRSDiscovery
Ute Schuster
24 ◦ S(A09.5)
740H20090307 JC032 2009 RRSJames Cook
Ute Schuster
Drake Passage(A21 and SR01b)∗
740H20090203 JC031 2009 RRSJames Cook
Dorothee Bakker
∗ The denotation A21/SR01 has been used both for cruises in the western Drake Passage (e.g. the western section on JC031and 06MT11_5, Chipman et al., 1994) or in the central Drake Passage (e.g. LMG200603 and LMG200909).
Figure 1. Positions of stations at which DIC and TA sampleswere taken in the Atlantic and Drake Passage during(a) DI332,(b) DI346, (c) JC032, and(d) JC031 (A21 in the west and SR1b inthe east).
Germany, SN #004 and #007), connected to a coulometer(UIC, USA, model 5011) and a Titrino (Metrohm UK Ltd.).
For the analysis, seawater is allowed into the stand-aloneextractor by gravity, whilst it is drawn into the VINDTAs byslow peristaltic pump. Glass pipettes, approx. 20 mL for DICand approx. 100 mL for TA, are first rinsed with new seawa-ter sample before being filled to overflowing. The volumesof these pipettes were accurately calibrated before and afterthe cruises and the laboratory analysis.
The VINDTAs’ sample pipettes and alkalinity titrationcell are thermostated at 25◦C, and seawater samples were
brought up to 25◦C prior to analysis. Conversely, the stand-alone extractor’s DIC sample pipette is insulated but not wa-ter jacketed, and seawater samples were not warmed up priorto analyses.
During DIC analysis, all inorganic dissolved carbon isconverted to CO2 by addition of excess phosphoric acid (1 M,8.5 %) to a calibrated volume of seawater sample. Oxygen-free-nitrogen gas (OfN, BOC, UK), after passing throughsoda lime to remove any traces of CO2, is used to carry theevolving CO2 to the coulometer cell, where all CO2 is quan-titatively absorbed, forming an acid that is coulometricallytitrated.
During TA analysis, aliquots of 0.1 M hydrochloric acidare added to the seawater sample, and the electromotive forceis measured by a pH and reference electrode assembly. TA iscalculated using a Gran plot and curve fit (Mintrop et al.,2000).
A 500 mL bottle allows both DIC and TA to be anal-ysed twice per sample (as a successive in-bottle duplicate),thereby providing information on the precision of measure-ments. A 250 mL bottle only allows DIC and TA to beanalysed once, but as done during DI332, duplicate samplesfrom the same Niskin allow for same-depth duplicates.
The VINDTAs, and the stand-alone extractor duringJC031 and JC032, were installed in a seagoing laboratorycontainer of the Laboratory for Global Marine and Atmo-spheric Chemistry (LGMAC) of UEA, UK, on the ships’ aftdecks. During DI346, JC031, and JC032, DIC and TA analy-ses and first-level quality control were performed at sea, anddata were submitted, together with other cruise parameters,at end of the cruise to the CLIVAR and Carbon Hydro-graphic Data Office (CCHDO). Samples were collected andstored during DI332 for VINDTA analysis back in the labo-ratory. Data submitted after second-level quality control areavailable at Carbon Dioxide Information Analysis Center
www.earth-syst-sci-data.net/6/175/2014/ Earth Syst. Sci. Data, 6, 175–183, 2014
178 U. Schuster et al.: Measurements of total alkalinity and inorganic dissolved carbon
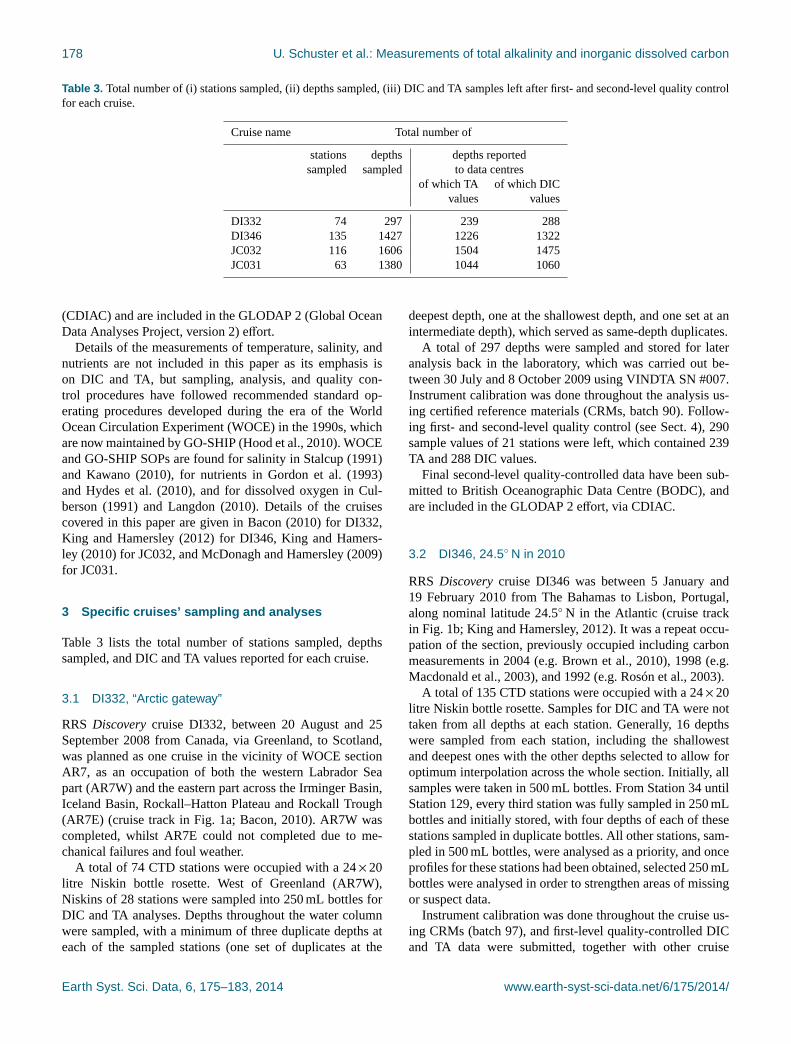
Table 3. Total number of (i) stations sampled, (ii) depths sampled, (iii) DIC and TA samples left after first- and second-level quality controlfor each cruise.
Cruise name Total number of
stations depths depths reportedsampled sampled to data centres
of which TA of which DICvalues values
DI332 74 297 239 288DI346 135 1427 1226 1322JC032 116 1606 1504 1475JC031 63 1380 1044 1060
(CDIAC) and are included in the GLODAP 2 (Global OceanData Analyses Project, version 2) effort.
Details of the measurements of temperature, salinity, andnutrients are not included in this paper as its emphasis ison DIC and TA, but sampling, analysis, and quality con-trol procedures have followed recommended standard op-erating procedures developed during the era of the WorldOcean Circulation Experiment (WOCE) in the 1990s, whichare now maintained by GO-SHIP (Hood et al., 2010). WOCEand GO-SHIP SOPs are found for salinity in Stalcup (1991)and Kawano (2010), for nutrients in Gordon et al. (1993)and Hydes et al. (2010), and for dissolved oxygen in Cul-berson (1991) and Langdon (2010). Details of the cruisescovered in this paper are given in Bacon (2010) for DI332,King and Hamersley (2012) for DI346, King and Hamers-ley (2010) for JC032, and McDonagh and Hamersley (2009)for JC031.
3 Specific cruises’ sampling and analyses
Table 3 lists the total number of stations sampled, depthssampled, and DIC and TA values reported for each cruise.
3.1 DI332, “Arctic gateway”
RRS Discoverycruise DI332, between 20 August and 25September 2008 from Canada, via Greenland, to Scotland,was planned as one cruise in the vicinity of WOCE sectionAR7, as an occupation of both the western Labrador Seapart (AR7W) and the eastern part across the Irminger Basin,Iceland Basin, Rockall–Hatton Plateau and Rockall Trough(AR7E) (cruise track in Fig. 1a; Bacon, 2010). AR7W wascompleted, whilst AR7E could not completed due to me-chanical failures and foul weather.
A total of 74 CTD stations were occupied with a 24×20litre Niskin bottle rosette. West of Greenland (AR7W),Niskins of 28 stations were sampled into 250 mL bottles forDIC and TA analyses. Depths throughout the water columnwere sampled, with a minimum of three duplicate depths ateach of the sampled stations (one set of duplicates at the
deepest depth, one at the shallowest depth, and one set at anintermediate depth), which served as same-depth duplicates.
A total of 297 depths were sampled and stored for lateranalysis back in the laboratory, which was carried out be-tween 30 July and 8 October 2009 using VINDTA SN #007.Instrument calibration was done throughout the analysis us-ing certified reference materials (CRMs, batch 90). Follow-ing first- and second-level quality control (see Sect.4), 290sample values of 21 stations were left, which contained 239TA and 288 DIC values.
Final second-level quality-controlled data have been sub-mitted to British Oceanographic Data Centre (BODC), andare included in the GLODAP 2 effort, via CDIAC.
3.2 DI346, 24.5◦ N in 2010
RRS Discoverycruise DI346 was between 5 January and19 February 2010 from The Bahamas to Lisbon, Portugal,along nominal latitude 24.5◦ N in the Atlantic (cruise trackin Fig. 1b; King and Hamersley, 2012). It was a repeat occu-pation of the section, previously occupied including carbonmeasurements in 2004 (e.g. Brown et al., 2010), 1998 (e.g.Macdonald et al., 2003), and 1992 (e.g. Rosón et al., 2003).
A total of 135 CTD stations were occupied with a 24×20litre Niskin bottle rosette. Samples for DIC and TA were nottaken from all depths at each station. Generally, 16 depthswere sampled from each station, including the shallowestand deepest ones with the other depths selected to allow foroptimum interpolation across the whole section. Initially, allsamples were taken in 500 mL bottles. From Station 34 untilStation 129, every third station was fully sampled in 250 mLbottles and initially stored, with four depths of each of thesestations sampled in duplicate bottles. All other stations, sam-pled in 500 mL bottles, were analysed as a priority, and onceprofiles for these stations had been obtained, selected 250 mLbottles were analysed in order to strengthen areas of missingor suspect data.
Instrument calibration was done throughout the cruise us-ing CRMs (batch 97), and first-level quality-controlled DICand TA data were submitted, together with other cruise
Earth Syst. Sci. Data, 6, 175–183, 2014 www.earth-syst-sci-data.net/6/175/2014/
U. Schuster et al.: Measurements of total alkalinity and inorganic dissolved carbon 179
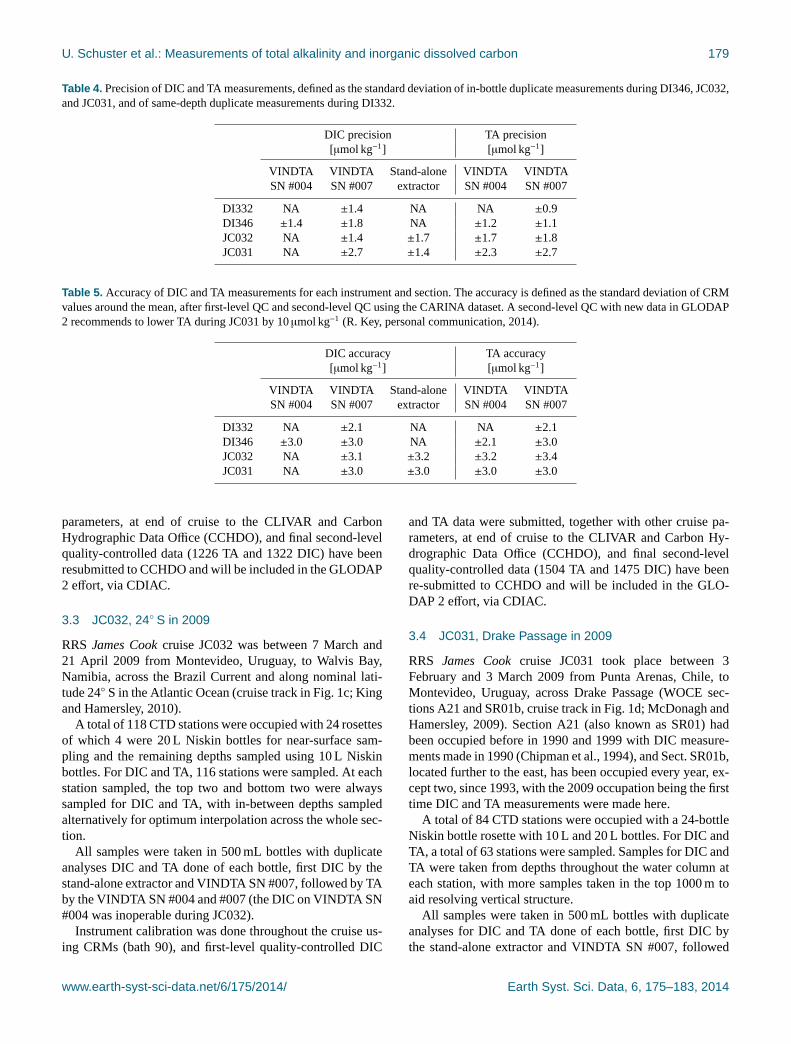
Table 4. Precision of DIC and TA measurements, defined as the standard deviation of in-bottle duplicate measurements during DI346, JC032,and JC031, and of same-depth duplicate measurements during DI332.
DIC precision TA precision[µmol kg−1] [µmol kg−1]
VINDTA VINDTA Stand-alone VINDTA VINDTASN #004 SN #007 extractor SN #004 SN #007
DI332 NA ±1.4 NA NA ±0.9DI346 ±1.4 ±1.8 NA ±1.2 ±1.1JC032 NA ±1.4 ±1.7 ±1.7 ±1.8JC031 NA ±2.7 ±1.4 ±2.3 ±2.7
Table 5. Accuracy of DIC and TA measurements for each instrument and section. The accuracy is defined as the standard deviation of CRMvalues around the mean, after first-level QC and second-level QC using the CARINA dataset. A second-level QC with new data in GLODAP2 recommends to lower TA during JC031 by 10µmol kg−1 (R. Key, personal communication, 2014).
DIC accuracy TA accuracy[µmol kg−1] [µmol kg−1]
VINDTA VINDTA Stand-alone VINDTA VINDTASN #004 SN #007 extractor SN #004 SN #007
DI332 NA ±2.1 NA NA ±2.1DI346 ±3.0 ±3.0 NA ±2.1 ±3.0JC032 NA ±3.1 ±3.2 ±3.2 ±3.4JC031 NA ±3.0 ±3.0 ±3.0 ±3.0
parameters, at end of cruise to the CLIVAR and CarbonHydrographic Data Office (CCHDO), and final second-levelquality-controlled data (1226 TA and 1322 DIC) have beenresubmitted to CCHDO and will be included in the GLODAP2 effort, via CDIAC.
3.3 JC032, 24◦ S in 2009
RRS James Cookcruise JC032 was between 7 March and21 April 2009 from Montevideo, Uruguay, to Walvis Bay,Namibia, across the Brazil Current and along nominal lati-tude 24◦ S in the Atlantic Ocean (cruise track in Fig. 1c; Kingand Hamersley, 2010).
A total of 118 CTD stations were occupied with 24 rosettesof which 4 were 20 L Niskin bottles for near-surface sam-pling and the remaining depths sampled using 10 L Niskinbottles. For DIC and TA, 116 stations were sampled. At eachstation sampled, the top two and bottom two were alwayssampled for DIC and TA, with in-between depths sampledalternatively for optimum interpolation across the whole sec-tion.
All samples were taken in 500 mL bottles with duplicateanalyses DIC and TA done of each bottle, first DIC by thestand-alone extractor and VINDTA SN #007, followed by TAby the VINDTA SN #004 and #007 (the DIC on VINDTA SN#004 was inoperable during JC032).
Instrument calibration was done throughout the cruise us-ing CRMs (bath 90), and first-level quality-controlled DIC
and TA data were submitted, together with other cruise pa-rameters, at end of cruise to the CLIVAR and Carbon Hy-drographic Data Office (CCHDO), and final second-levelquality-controlled data (1504 TA and 1475 DIC) have beenre-submitted to CCHDO and will be included in the GLO-DAP 2 effort, via CDIAC.
3.4 JC031, Drake Passage in 2009
RRS James Cookcruise JC031 took place between 3February and 3 March 2009 from Punta Arenas, Chile, toMontevideo, Uruguay, across Drake Passage (WOCE sec-tions A21 and SR01b, cruise track in Fig. 1d; McDonagh andHamersley, 2009). Section A21 (also known as SR01) hadbeen occupied before in 1990 and 1999 with DIC measure-ments made in 1990 (Chipman et al., 1994), and Sect. SR01b,located further to the east, has been occupied every year, ex-cept two, since 1993, with the 2009 occupation being the firsttime DIC and TA measurements were made here.
A total of 84 CTD stations were occupied with a 24-bottleNiskin bottle rosette with 10 L and 20 L bottles. For DIC andTA, a total of 63 stations were sampled. Samples for DIC andTA were taken from depths throughout the water column ateach station, with more samples taken in the top 1000 m toaid resolving vertical structure.
All samples were taken in 500 mL bottles with duplicateanalyses for DIC and TA done of each bottle, first DIC bythe stand-alone extractor and VINDTA SN #007, followed
www.earth-syst-sci-data.net/6/175/2014/ Earth Syst. Sci. Data, 6, 175–183, 2014
180 U. Schuster et al.: Measurements of total alkalinity and inorganic dissolved carbon
by TA by the VINDTA SN #004 and #007 (the DIC part ofVINDTA SN #004 was inoperable during JC031).
Instrument calibration was done throughout the cruise us-ing CRMs (batch 90 and 92); data quality assurance and ini-tial first-level data quality control was done throughout thecruise, with full first-level and second-level quality controldone post cruise. The final data (1044 TA and 1060 DIC)will be included in the GLODAP 2 effort, via CDIAC.
4 Quality control
Quality control (QC) of DIC and TA measurements was donein two distinct steps: during first-level QC, data are checkedfor obvious outliers, and technical or analytical problemsduring measurements; during second-level QC, cross-overanalysis is performed with other sections and correctionsidentified where necessary. Essentially, first-level QC ad-dresses precision whilst second-level QC addresses accuracy.
4.1 First-level QC
Throughout DIC and TA analyses, regular 500 mL certifiedreference materials (CRMs) were analysed as in-bottle du-plicates. Generally during one day’s analyses, one CRM wasrun after the coulometer cell had stabilised, one mid-cell, andone at the end. This resulted in generally three, occasionallytwo CRMs being run per CTD cast. CRM batches used were#90 during DI332, #97 during DI346, #90 during JC032, and#90 and #92 during JC031.
Initial DIC and TA calibrations were done onboard(DI346, JC032, and JC031) or in the laboratory (DI332) bycorrecting all DIC and TA values by the difference betweenthe mean of all CRM measurements and the CRM values ofthe respective batches used.
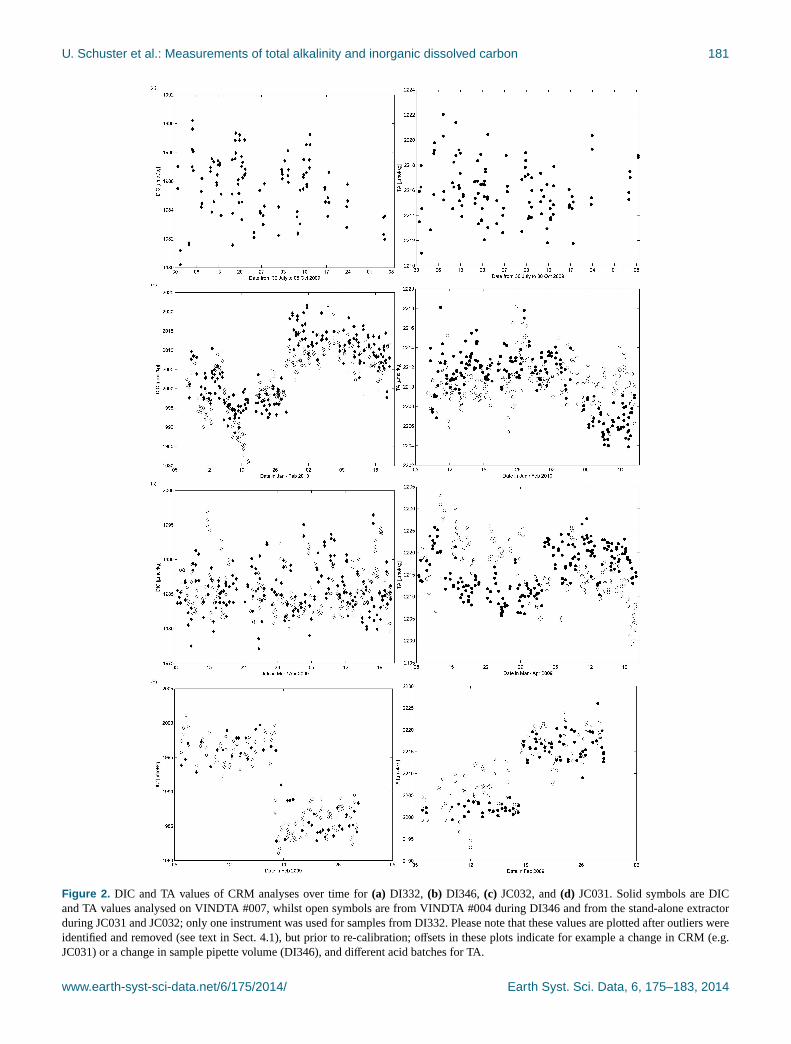
WOCE quality flags (Joyce and Corry, 1994) were then as-signed to each sample, initially flag 2 for all measurements.All DIC and TA were then checked for obvious outliers, iden-tified by unusually high differences between duplicates, un-usually high differences to neighbouring Niskins after opti-mum interpolation, unusually long TA or DIC titration times,non-smooth titration curves, unusually high residuals in cal-culated TA. All such outliers were then flagged as 4 whenidentified as a bad measurement, and flagged as 3 when un-certain. Figure 2 shows the CRM values for DIC and TA dur-ing the analyses of samples from the four cruises. Includedare samples with WOCE flag 2 or 3 only, but prior to finalrecalibration; hence the plots indicate the variability of theinstruments’ response over time. Calibrations were checkedand subsequently re-done for different TA acid batches, fordifferent CRMs (e.g. JC031), and different sample pipettevolumes (e.g. DI346). Finally, when duplicates’ flags were2 or 3, the mean DIC or TA of the two was reported withthe highest WOCE flag of the duplicates for DI346, JC032,and JC031. The precision of DIC and TA measurements isgiven in Table 4, defined for DI346, JC032, and JC031 as the
standard deviation of in-bottle duplicate measurements, andfor DI332 as same-depth duplicate measurements (Dicksonet al., 2007; SOP #23).
4.2 Second-level QC
Second-level QC was carried out using the Matlab crossoveranalysis toolbox (Tanhua, 2010). This method evaluates theconsistency of deep-water measurements by comparing themwith data from a reference data set. The reference data usedwere the CARINA Atlantic data set (updated August 2012) athttp://cdiac.ornl.gov/ftp/oceans/2nd_QC_Tool/refdata/. Sta-tion profiles from the cruises in question were compared toprofiles from cruises in the reference data set which werewithin a certain horizontal distance (in this case 2◦ latitude).The result of each comparison between two cruises is an off-set, which for TA and DIC is additive. For DI346 and JC032,data from below 1500 m depth were compared and the pro-files were based on density, whereas for DI332 the minimumdepth was 1900 m and the profiles were based on depth (fol-lowing Tanhua, 2010; Olsen et al., 2009). DI332 was com-pared with 14 cruises, DI346 with 9 cruises, JC032 with 2cruises and JC031 with 2 cruises. This comparison with theCARINA data set, showed no offsets larger than 4µmol kg−1
for DIC and 6µmol kg−1 for TA (Wanninkhof et al., 2003).Therefore, the data that we submitted to BODC, CCHDO,and CDIAC contained no corrections, and contain the accu-racies given in Table 5, defined for TA measurements as thestandard deviation of CRMs per acid batch, and for DIC mea-surements as the standard deviation of all CRMs per cruise(Dickson et al., 2007; SOP #23).
The GLODAP initiative (Key et al., 2004), now in its ver-sion 2, compares newly added measurements since the CA-RINA initiative in the Atlantic, and contains the most com-prehensive global data set available. This GLODAP 2 ini-tiative has currently (April 2014) identified no recommen-dations for DIC and TA during DI332, DI346, and JC032,whilst it recommends to lower TA for JC031 by 10µmol kg−1
(R. Key, personal communication, 2014).
Earth Syst. Sci. Data, 6, 175–183, 2014 www.earth-syst-sci-data.net/6/175/2014/
U. Schuster et al.: Measurements of total alkalinity and inorganic dissolved carbon 181
Figure 2. DIC and TA values of CRM analyses over time for(a) DI332, (b) DI346, (c) JC032, and(d) JC031. Solid symbols are DICand TA values analysed on VINDTA #007, whilst open symbols are from VINDTA #004 during DI346 and from the stand-alone extractorduring JC031 and JC032; only one instrument was used for samples from DI332. Please note that these values are plotted after outliers wereidentified and removed (see text in Sect. 4.1), but prior to re-calibration; offsets in these plots indicate for example a change in CRM (e.g.JC031) or a change in sample pipette volume (DI346), and different acid batches for TA.
www.earth-syst-sci-data.net/6/175/2014/ Earth Syst. Sci. Data, 6, 175–183, 2014
182 U. Schuster et al.: Measurements of total alkalinity and inorganic dissolved carbon
Acknowledgements. We are very grateful to captains, officers,and crew of RRSDiscoveryand RRSJames Cookfor their sup-port during the fieldwork and principal scientific officers S. Ba-con (DI332), E. McDonagh (JC031), and B. King (JC032 andDI346) for support of the carbon research. We acknowledge fund-ing by UK’s NERC Strategic Ocean Funding Initiative (SOFI)NE/F01242X/1, supporting the UK Oceans 2025 programme (2007to 2012), the EU CARBOCHANGE project (264879) and the UKOcean Acidification Programme (NE/H017046/1) for supportingstaff time for this work. We thank E. Madsen, E. Rathbone, I. Salter,J. Allen, R. Pidcock, J. Frommolet, K. Cox and S. Seeyave for tak-ing samples for DIC and TA during D332. We also thank the edi-tor, one anonymous reviewer and Are Olsen for careful comments,which have improved the manuscript.
U. Schuster was PI of carbon sampling and analyses for DI332,JC032, and DI346. A. J. Watson was PI of the SOFI grant.D. C. E. Bakker was PI of carbon sampling and analyses for JC031.A. M.de Boer was watch keeper during JC032. E. M. Jones waswatch keeper during JC031. G. A. Lee was watch keeper duringDI346. O. Legge was watch keeper during DI346 and aided qualitycontrol of data. A. Louwerse was watch keeper during DI346.J. Riley was watch keeper during JC031. S. Scally was watchkeeper during JC032.
Edited by: D. Carlson
References
Bacon, S.:RRS Discoverycruise 332, 21 August to 25 September2008. Arctic Gateway (WOCE AR7), National OceanographyCentre Southampton, Southampton, UK, National OceanographyCentre Southampton Cruise Report 53, 129 pp., 2010.
Broecker, W. S. and Peng, T. H.: Interhemispheric Transport ofCarbon-Dioxide by Ocean Circulation, Nature, 356, 587–589,1992.
Brown, P. J., Bakker, D. C. E., Schuster, U., and Wat-son, A. J.: Anthropogenic carbon accumulation in the sub-tropical North Atlantic, J. Geophys. Res., 115, C04016,doi:10.1029/2008JC005043, 2010.
Chipman, D. W., Takahashi, T., Breger, D., and Sutherland, S.: Car-bon dioxide, hydrographic, and chemical data obtained duringthe R/V Meteor cruise 11/5 in the South Atlantic and north-ern Weddell Sea areas (WOCE sections A-12 and A-21), OakRidge National Laboratory (ORNL)/ Carbon Dioxide Informa-tion Analysis Center (CDIAC), Oak Ridge, Tennessee, USA,NDP 045, 61 pp., 1994.
Culberson, C. H.: Dissolved oxygen, in: WOCE operatingmanual, WHP Office Report WHPO 91-1, WOCE ReportNo. 68/91, available at:http://whpo.ucsd/edu/manuals/pdf/91-1/stal.pdf(last access: 10 March 2014), 15 pp., 1991.
Dickson, A. G. and Sabine, C. L.: Guide to best practice for oceanCO2 measurments, PICES Special Publication, 3, 191 pp., 2007.
Gordon, L. I., Jennings, J. C. J., Ross, A. A., and Krest, J. M.: Asuggested protocol for continuous flow automated analysis ofseawater nutrients (phosphate, nitrate, nitrite and silicite acid) inthe WOCE Hydrographic Program and the Joint Global OceanFluxes Study, in: WOCE operating manual, WHP Office Re-port WHPO 91-1, WOCE Report No. 68/91, available at:http://
whpo.ucsd/edu/manuals/pdf/91-1/stal.pdf(last access: 10 March2014), 55 pp., 1993.
Hood, E. M., Sabine, C. L., and Sloyan, B. M.: The GO-SHIPRepeat Hydrography Manual: a Collection of Expert Reportsand Guidelines, IOCCP Report Number 14, OCPO Publica-tion Series Number 134; available at:http://www.go-ship.org/HydroMan.html.(last access: 10 March 2014), 2010.
Hydes, D. J., Aoyama, M., Aminot, A., Bakker, K., Becker, S., Cov-erly, S., Daniel, A., Dickson, A. G., Grosso, O., Kerouel, R., vanOoijen, J., Sato, K., Tanhua, T., Woodward, E. M. S., and Zhang,J. Z.: Determination of dissolved nutrients (N, P, Si) in seawaterwith high precision and inter-comparability using gas-segmentedcontinuous flow analysers, in: The GO-SHIP Repeat Hydrog-raphy Manual: a Collection of Expert Reports and Guidelines,edited by: Hood, E. M., Sabine, C. L., and Sloyan, B. M., 87 pp.,2010.
Johnson, K. M., King, A. E., and Sieburth, J. M.: Coulometric TCO2
analyses for marine studies; an introduction, Mar. Chem., 16, 61–82, 1985.
Johnson, K. M., Sieburth, J. M., Williams, P. J. l., and Braend-stroem, L.: Coulometric total carbon dioxide analysis for marinestudies: automation and calibration, Mar. Chem., 21, 117–133,1987.
Johnson, K. M., Wills, K. D., Butler, D. B., Johnson, W. K., andWong, C. S.: Coulometric Total Carbon-Dioxide Analysis forMarine Studies – Maximizing the Performance of an AutomatedGas Extraction System and Coulometric Detector, Mar. Chem.,44, 167–187, 1993.
Joyce, T. and Corry, C.: Requirements for WOCE hydrographic pro-gram data reporting, WOCE Hydrographic Program Office, LaJolla, California, USA, WHPO Publication 90-1, review 2, 145pp., 1994.
Kawano, T.: Method for Salinity (Conductivity Ratio) Measureme,in: The GO-SHIP Repeat Hydrography Manual: a Collection ofExpert Reports and Guidelines, edited by: Hood, E. M., Sabine,C. L., and Sloyan, B. M., 2010.
Key, R. M., Kozyr, A., Sabine, C. L., Lee, K., Wanninkhof, R.,Bullister, J. L., Feely, R. A., Millero, F. J., Mordy, C., and Peng,T. H.: A global ocean carbon climatology: Results from GlobalData Analysis Project (GLODAP), Global Biogeochem. Cy., 18,GB4031, doi:10.1029/2004GB002247, 2004.
King, B. A. and Hamersley, D. R. C.: RRS James Cook cruiseJC032, 07 March to 21 April 2009. Hydrographic sections ac-cross the Brazil Current and at 24◦ S in the Atlantic, NationalOceanogrpahic Centre Southampton, Southampton, UK, 173 pp.,2010.
King, B. A. and Hamersley, D. R. C.: RRS Discovery Cruise 346; 05January to 19 February 2010; the 2010 transatlantic hydrographysection at 24.5◦ N, National Oceanography Centre, Southampton,Southampton, UK, 2012.
Langdon, C.: Determination of dissolved oxygen in seawater byWinkler titration using the amperometric technique, in: The GO-SHIP Repeat Hydrography Manual: a Collection of Expert Re-ports and Guidelines, edited by: Hood, E. M., Sabine, C. L., andSloyan, B. M., 18 pp., 2010.
Macdonald, A. M., M.O., B., Wanninkhof, R., Lee, K., and Wallace,D. W. R.: A 1998–1992 comparison of inorganic carbon and itstransport across 24.5◦ N in the Atlantic, Deep-Sea Res. Pt. II, 50,3041–3064, 2003.
Earth Syst. Sci. Data, 6, 175–183, 2014 www.earth-syst-sci-data.net/6/175/2014/
U. Schuster et al.: Measurements of total alkalinity and inorganic dissolved carbon 183
McDonagh, E. L. and Hamersley, D. R. C.:RRS James CookCruise JC031, 03 Feb to 03 Mar 2009. Hydrographic sectionsof Drake Passage, National Oceanography Centre, Southampton,Southampton, UKNOCS cruise report 39, 170 pp., 2009.
Mintrop, L., Perez, F. F., González-Dávila, M., Santana-Casiano, M.J., and Körtzinger, A.: Alkalinity determination by potentiome-try: Intercalibration using three different methods, Ceinc. Mar.,26, 23–37, 2000.
Olsen, A., Key, R. M., Jeansson, E., Falck, E., Olafsson, J., vanHeuven, S., Skjelvan, I., Omar, A. M., Olsson, K. A., Anderson,L. G., Jutterström, S., Rey, F., Johannessen, T., Bellerby, R. G.J., Blindheim, J., Bullister, J. L., Pfeil, B., Lin, X., Kozyr, A.,Schirnick, C., Tanhua, T., and Wallace, D. W. R.: Overview ofthe Nordic Seas CARINA data and salinity measurements, EarthSyst. Sci. Data, 1, 25–34, doi:10.5194/essd-1-25-2009, 2009.
Peréz, F. F., Mercier, H., Vázquez-Rodriguez, M., Lherminier, P.,Velo, A., Pardo, P. C., Rosón, G., and Ríos, A. F.: Atlantic OceanCO2 uptake reduced by weakening of the meridional overturningcirculation, Nat. Geosci., 6, 146–152, doi:10.1038/NGEO1680,2013.
Robinson, C. and Williams, P. J. L.: Development and assessment ofan analytical system for the accurate and continual measurementof total dissolved inorganic carbon, Mar. Chem., 34, 157–175,1991.
Rosón, G., Ríos, A. F., Pérez, F. F., Lavin, A., and Bryden, H.L.: Carbon distribution, fluxes, and budgets in the subtropicalNorth Atlantic Ocean (24.5◦ N). J. Geophys. Res., 108, 3144,doi:10.1029/1999JC000047, 2003.
Sabine, C. L., Feely, R. A., Gruber, N., Key, R. M., Lee, K., Bullis-ter, J. L., Wanninkhof, R., Wong, C. S., Wallace, D. W. R.,Tilbrook, B., Millero, F. J., Peng, T. H., Kozyr, A., Ono, T., andRios, A. F.: The oceanic sink for anthropogenic CO2, Science,305, 367–371, 2004.
Stalcup, M. C.: Salinity measurements, in: WOCE operating man-ual, WHP Office Report WHPO 91-1, WOCE Report No.68/91, available at:http://whpo.ucsd/edu/manuals/pdf/91-1/stal.pdf (last access: 10 March 2014), 9 pp., 1991.
Tanhua, T.: Matlab Toolbox to Perform Secondary Quality Control(2nd QC) on Hydrographic Data, CDIAC, Oak Ridge, Tennessee,2010.
Wanninkhof, R., Peng, T.-H., Huss, B., Sabine, C. L., and Lee, K.:Comparison of inorganic carbon system parameters measured inthe Atlantic Ocean from 1990 to 1998 and recommended adjust-ments, Oak Ridge National Laboratory, Oak Ridge, TennesseeCDIC-140, 59 pp., 2003.
Watson, A. J., Nightingale, P. D., and Cooper, D. J.: Modellingatmosphere-ocean CO2 transfer, Philos. T. R. Soc. Lon. B, 348,125–132, 1995.
www.earth-syst-sci-data.net/6/175/2014/ Earth Syst. Sci. Data, 6, 175–183, 2014