Embed Size (px)
Citation preview
Dynamic Article LinksC<Journal ofMaterials Chemistry
Cite this: DOI: 10.1039/c2jm34690g
www.rsc.org/materials FEATURE ARTICLE
Dow
nloa
ded
by S
ooch
ow U
nive
rsity
Chi
na o
n 28
Sep
tem
ber
2012
Publ
ishe
d on
29
Aug
ust 2
012
on h
ttp://
pubs
.rsc
.org
| do
i:10.
1039
/C2J
M34
690G
View Online / Journal Homepage
Carbon nanodots: synthesis, propertie
s and applicationsHaitao Li, Zhenhui Kang,* Yang Liu* and Shuit-Tong Lee*
Received 17th July 2012, Accepted 28th August 2012
DOI: 10.1039/c2jm34690g
Carbon nanodots (C-dots) have generated enormous excitement because of their superiority in water
solubility, chemical inertness, low toxicity, ease of functionalization and resistance to photobleaching.
In this review, by introducing the synthesis and photo- and electron-properties of C-dots, we hope to
provide further insight into their controversial emission origin (particularly the upconverted
photoluminescence) and to stimulate further research into their potential applications, especially in
photocatalysis, energy conversion, optoelectronics, and sensing.
1. Introduction
Carbon nanodots (C-dots) are a new class of carbon nano-
materials with sizes below 10 nm, first obtained during purifi-
cation of single-walled carbon nanotubes through preparative
electrophoresis in 2004.1 C-dots have gradually become a rising
star in the nanocarbon family, due to their benign, abundant and
inexpensive nature.2 Carbon is commonly a black material, and
until recently was generally considered to have low solubility in
water and weak fluorescence.3 The main reason why such tiny
C-dots have recently attracted wide attention is because of their
strong fluorescence, for which they are referred to as fluorescent
carbon.
Haitao Li
Haitao Li is currently a PhD
student in Institute of Functional
Nano & Soft Materials (FUN-
SOM), Soochow University.
Since 2010, he has been con-
ducting his PhD work in FUN-
SOM under the supervision of
Prof. Yang Liu, Zhenhui Kang
and Shuit-Tong Lee. His main
research interest is focused on
the study of synthesis and pho-
toluminescence of carbon dots,
as well as their catalysis and
energy conversion applications.
Institute of Functional Nano & Soft Materials (FUNSOM) and JiangsuKey Laboratory for Carbon-Based Functional Materials & Devices,Soochow University, 199 Ren’ai Road, Suzhou, 215123, China. E-mail:[email protected]; [email protected]; [email protected]; Tel:+86-512-65880957. Fax: +86-512-65882846
This journal is ª The Royal Society of Chemistry 2012
During the past few years, much progress has been achieved in
the synthesis, properties and applications of C-dots, as recently
reviewed by Baker et al. and Zhu et al.2,4 Nuclear magnetic
resonance (NMR) measurements showed that carbon atoms of
C-dots derived from candle soot were sp2 hybridized with no
saturated sp3 carbon atoms, indicating that C-dots are conju-
gated systems.5,6 For their strong and tunable photoluminescence
(PL) C-dots have found important and wide applications in
energy and catalysis.2,4 In particular, besides normal or down-
converted PL, C-dots were shown to possess excellent up-con-
verted PL (UCPL), which enables the design of high-perfor-
mance, complex catalyst systems based on C-dots for efficient
utilization of the full spectrum of sunlight.2,4,7–13
Compared to traditional semiconductor quantum dots (QDs)
and organic dyes, photoluminescent C-dots are superior in terms
of high aqueous solubility, robust chemical inertness, easy
functionalization, high resistance to photobleaching, low toxicity
and good biocompatibility.2,4,14–16As a result, much attention has
also been paid to their potential applications in biological
Zhenhui Kang
Zhenhui Kang is currently a
Professor in Institute of Func-
tional Nano & Soft Materials
and the Jiangsu Key Laboratory
for Carbon-Based Functional
Materials & Devices in Soochow
University, P. R. China. His
main research interests are in
the fields of synthetic and cata-
lytic chemistry of nano-
materials, polyoxometalates,
and quantum sized functional
materials, as well as the
exploring of their applications in
nanocatalysis, new energy, and
bio-imaging.
J. Mater. Chem.
Dow
nloa
ded
by S
ooch
ow U
nive
rsity
Chi
na o
n 28
Sep
tem
ber
2012
Publ
ishe
d on
29
Aug
ust 2
012
on h
ttp://
pubs
.rsc
.org
| do
i:10.
1039
/C2J
M34
690G
View Online
labeling, bioimaging and drug delivery.3,7,17–20 Of particular
interest and significance is the recent finding that C-dots can
exhibit PL emission in the near-infrared (NIR) spectral region
under NIR light excitation. It should be noted that NIR PL
emission of C-dots excited by NIR excitation is particularly
significant and useful for in vivo bionanotechnology because of
the transparency of body tissues in the NIR ‘‘water window’’.15,21
Interestingly, the PL from C-dots can be quenched efficiently
by either electron acceptor or electron donor molecules in solu-
tion, indicating that photoexcited C-dots are excellent electron
donors and electron acceptors. The interesting photoinduced
electron transfer properties of C-dots should offer exciting
opportunities for light energy conversion, photovoltaic devices
and related applications.22,23a C-dots can also be used as
nanoprobes for sensitive ion detection.24,25
By introducing the synthesis, structure and PL properties of
C-dots in this review, we hope to provide further insight into the
as-yet controversial mechanism of their strong emission (partic-
ularly for UCPL), as well as to stimulate further research on the
potential applications of C-dots, such as in photocatalysis, bio-
imaging, optoelectronics, sensors and surface-enhanced Raman
scattering (SERS, Scheme 1).
Scheme 1 C-dots with unique properties have great potential applica-
tions in bioimaging, optoelectronics, sensor, SERS, and photocatalysis.
Yang Liu
Yang Liu is currently an Asso-
ciate Professor in Institute of
Functional Nano & Soft Mate-
rials and the Jiangsu Key
Laboratory for Carbon-Based
Functional Materials & Devices
in Soochow University, P. R.
China. Her main research field is
dedicated to the synthesis and
assembly of morphologically
unique nanostructures and
nanocomposites, and the appli-
cations in catalysis and energy
conversion.
J. Mater. Chem.
2. Synthesis, structure, and size control
2.1. Synthetic methods
Synthetic methods for C-dots (including carbon quantum dots
(CQDs), graphene quantum dots (GQDs)) with tunable size can
generally be classified into two main groups: chemical and
physical methods. Chemical methods include electrochemical
synthesis,8,26–29 combustion/thermal/hydrothermal/acidic oxida-
tion,5,14,16,30–39 supported synthesis,30,40,41 microwave/ultra-
sonic,15,42–45 solution chemistry methods,46–53 cage-opening of
fullerene,54 and so on. Physical methods include arc discharge,1
laser ablation/passivation,7,17,18,22,55–61 and plasma treatment.62
2.1.1. Chemical methods
2.1.1.1. Electrochemical synthesis. Zhou et al. achieved
electrochemical synthesis of C-dots when they grew multiwalled
carbon nanotubes (MWCNTs) from scrolled graphene layers on
carbon paper by chemical vapour deposition (CVD).29 Zhao
et al. produced C-dots electrochemically by oxidizing a graphitic
column electrode against a saturated calomel electrode with a Pt
wire counter electrode in NaH2PO4 aqueous solution.27 Chi et al.
produced C-dots electrochemically from a graphite rod working
electrode, a Pt mesh counter electrode, and a Ag/AgCl reference
electrode assembly immersed in pH 7.0 phosphate buffer solu-
tion.28 A variety of carbon-based nanoparticles, including
C-dots, were generated by ionic liquid (IL)-assisted electro-
oxidation of graphite using the water-soluble IL 1-butyl-3-
methylimi-dazolium tetrafluoroborate [bmim][BF4] containing
up to 90 wt% water as the electrolyte.26
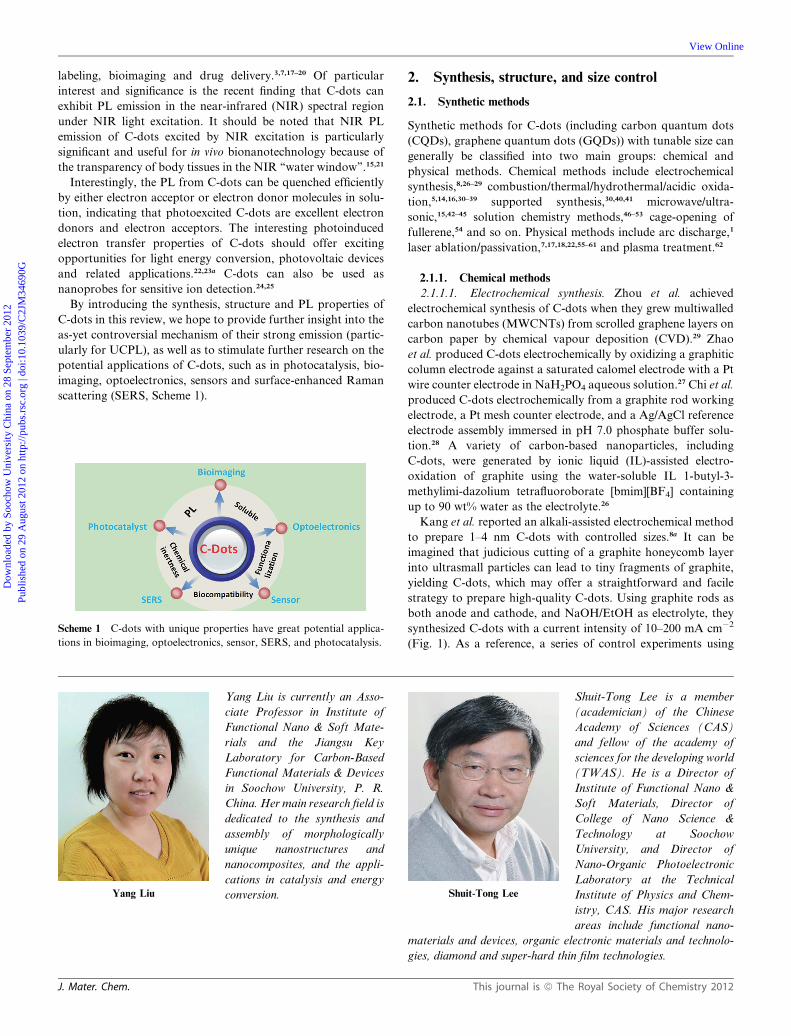
Kang et al. reported an alkali-assisted electrochemical method
to prepare 1–4 nm C-dots with controlled sizes.8a It can be
imagined that judicious cutting of a graphite honeycomb layer
into ultrasmall particles can lead to tiny fragments of graphite,
yielding C-dots, which may offer a straightforward and facile
strategy to prepare high-quality C-dots. Using graphite rods as
both anode and cathode, and NaOH/EtOH as electrolyte, they
synthesized C-dots with a current intensity of 10–200 mA cm�2
(Fig. 1). As a reference, a series of control experiments using
Shuit-Tong Lee
Shuit-Tong Lee is a member
(academician) of the Chinese
Academy of Sciences (CAS)
and fellow of the academy of
sciences for the developing world
(TWAS). He is a Director of
Institute of Functional Nano &
Soft Materials, Director of
College of Nano Science &
Technology at Soochow
University, and Director of
Nano-Organic Photoelectronic
Laboratory at the Technical
Institute of Physics and Chem-
istry, CAS. His major research
areas include functional nano-
materials and devices, organic electronic materials and technolo-
gies, diamond and super-hard thin film technologies.
This journal is ª The Royal Society of Chemistry 2012
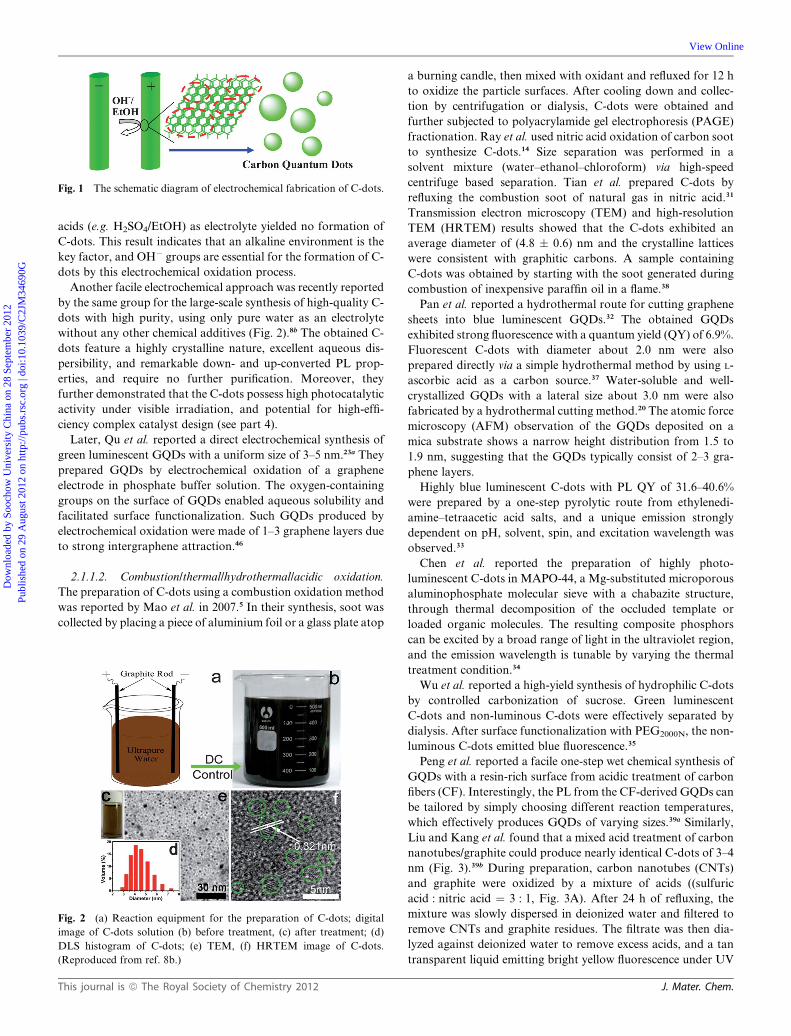
Fig. 1 The schematic diagram of electrochemical fabrication of C-dots.
Dow
nloa
ded
by S
ooch
ow U
nive
rsity
Chi
na o
n 28
Sep
tem
ber
2012
Publ
ishe
d on
29
Aug
ust 2
012
on h
ttp://
pubs
.rsc
.org
| do
i:10.
1039
/C2J
M34
690G
View Online
acids (e.g. H2SO4/EtOH) as electrolyte yielded no formation of
C-dots. This result indicates that an alkaline environment is the
key factor, and OH� groups are essential for the formation of C-
dots by this electrochemical oxidation process.
Another facile electrochemical approach was recently reported
by the same group for the large-scale synthesis of high-quality C-
dots with high purity, using only pure water as an electrolyte
without any other chemical additives (Fig. 2).8b The obtained C-
dots feature a highly crystalline nature, excellent aqueous dis-
persibility, and remarkable down- and up-converted PL prop-
erties, and require no further purification. Moreover, they
further demonstrated that the C-dots possess high photocatalytic
activity under visible irradiation, and potential for high-effi-
ciency complex catalyst design (see part 4).
Later, Qu et al. reported a direct electrochemical synthesis of
green luminescent GQDs with a uniform size of 3–5 nm.23a They
prepared GQDs by electrochemical oxidation of a graphene
electrode in phosphate buffer solution. The oxygen-containing
groups on the surface of GQDs enabled aqueous solubility and
facilitated surface functionalization. Such GQDs produced by
electrochemical oxidation were made of 1–3 graphene layers due
to strong intergraphene attraction.46
2.1.1.2. Combustion/thermal/hydrothermal/acidic oxidation.
The preparation of C-dots using a combustion oxidation method
was reported by Mao et al. in 2007.5 In their synthesis, soot was
collected by placing a piece of aluminium foil or a glass plate atop
Fig. 2 (a) Reaction equipment for the preparation of C-dots; digital
image of C-dots solution (b) before treatment, (c) after treatment; (d)
DLS histogram of C-dots; (e) TEM, (f) HRTEM image of C-dots.
(Reproduced from ref. 8b.)
This journal is ª The Royal Society of Chemistry 2012
a burning candle, then mixed with oxidant and refluxed for 12 h
to oxidize the particle surfaces. After cooling down and collec-
tion by centrifugation or dialysis, C-dots were obtained and
further subjected to polyacrylamide gel electrophoresis (PAGE)
fractionation. Ray et al. used nitric acid oxidation of carbon soot
to synthesize C-dots.14 Size separation was performed in a
solvent mixture (water–ethanol–chloroform) via high-speed
centrifuge based separation. Tian et al. prepared C-dots by
refluxing the combustion soot of natural gas in nitric acid.31
Transmission electron microscopy (TEM) and high-resolution
TEM (HRTEM) results showed that the C-dots exhibited an
average diameter of (4.8 � 0.6) nm and the crystalline lattices
were consistent with graphitic carbons. A sample containing
C-dots was obtained by starting with the soot generated during
combustion of inexpensive paraffin oil in a flame.38
Pan et al. reported a hydrothermal route for cutting graphene
sheets into blue luminescent GQDs.32 The obtained GQDs
exhibited strong fluorescence with a quantum yield (QY) of 6.9%.
Fluorescent C-dots with diameter about 2.0 nm were also
prepared directly via a simple hydrothermal method by using L-
ascorbic acid as a carbon source.37 Water-soluble and well-
crystallized GQDs with a lateral size about 3.0 nm were also
fabricated by a hydrothermal cutting method.20 The atomic force
microscopy (AFM) observation of the GQDs deposited on a
mica substrate shows a narrow height distribution from 1.5 to
1.9 nm, suggesting that the GQDs typically consist of 2–3 gra-
phene layers.
Highly blue luminescent C-dots with PL QY of 31.6–40.6%
were prepared by a one-step pyrolytic route from ethylenedi-
amine–tetraacetic acid salts, and a unique emission strongly
dependent on pH, solvent, spin, and excitation wavelength was
observed.33
Chen et al. reported the preparation of highly photo-
luminescent C-dots in MAPO-44, a Mg-substituted microporous
aluminophosphate molecular sieve with a chabazite structure,
through thermal decomposition of the occluded template or
loaded organic molecules. The resulting composite phosphors
can be excited by a broad range of light in the ultraviolet region,
and the emission wavelength is tunable by varying the thermal
treatment condition.34
Wu et al. reported a high-yield synthesis of hydrophilic C-dots
by controlled carbonization of sucrose. Green luminescent
C-dots and non-luminous C-dots were effectively separated by
dialysis. After surface functionalization with PEG2000N, the non-
luminous C-dots emitted blue fluorescence.35
Peng et al. reported a facile one-step wet chemical synthesis of
GQDs with a resin-rich surface from acidic treatment of carbon
fibers (CF). Interestingly, the PL from the CF-derived GQDs can
be tailored by simply choosing different reaction temperatures,
which effectively produces GQDs of varying sizes.39a Similarly,
Liu and Kang et al. found that a mixed acid treatment of carbon
nanotubes/graphite could produce nearly identical C-dots of 3–4
nm (Fig. 3).39b During preparation, carbon nanotubes (CNTs)
and graphite were oxidized by a mixture of acids ((sulfuric
acid : nitric acid ¼ 3 : 1, Fig. 3A). After 24 h of refluxing, the
mixture was slowly dispersed in deionized water and filtered to
remove CNTs and graphite residues. The filtrate was then dia-
lyzed against deionized water to remove excess acids, and a tan
transparent liquid emitting bright yellow fluorescence under UV
J. Mater. Chem.
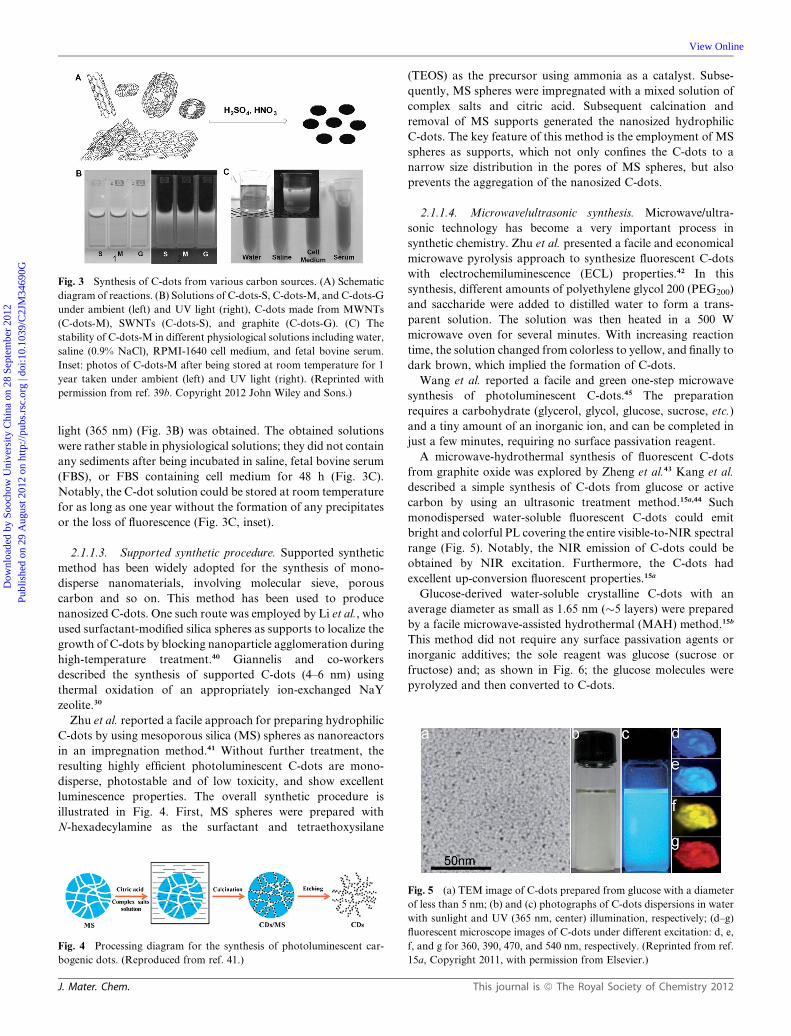
Fig. 3 Synthesis of C-dots from various carbon sources. (A) Schematic
diagram of reactions. (B) Solutions of C-dots-S, C-dots-M, and C-dots-G
under ambient (left) and UV light (right), C-dots made from MWNTs
(C-dots-M), SWNTs (C-dots-S), and graphite (C-dots-G). (C) The
stability of C-dots-M in different physiological solutions including water,
saline (0.9% NaCl), RPMI-1640 cell medium, and fetal bovine serum.
Inset: photos of C-dots-M after being stored at room temperature for 1
year taken under ambient (left) and UV light (right). (Reprinted with
permission from ref. 39b. Copyright 2012 John Wiley and Sons.)
Dow
nloa
ded
by S
ooch
ow U
nive
rsity
Chi
na o
n 28
Sep
tem
ber
2012
Publ
ishe
d on
29
Aug
ust 2
012
on h
ttp://
pubs
.rsc
.org
| do
i:10.
1039
/C2J
M34
690G
View Online
light (365 nm) (Fig. 3B) was obtained. The obtained solutions
were rather stable in physiological solutions; they did not contain
any sediments after being incubated in saline, fetal bovine serum
(FBS), or FBS containing cell medium for 48 h (Fig. 3C).
Notably, the C-dot solution could be stored at room temperature
for as long as one year without the formation of any precipitates
or the loss of fluorescence (Fig. 3C, inset).
2.1.1.3. Supported synthetic procedure. Supported synthetic
method has been widely adopted for the synthesis of mono-
disperse nanomaterials, involving molecular sieve, porous
carbon and so on. This method has been used to produce
nanosized C-dots. One such route was employed by Li et al., who
used surfactant-modified silica spheres as supports to localize the
growth of C-dots by blocking nanoparticle agglomeration during
high-temperature treatment.40 Giannelis and co-workers
described the synthesis of supported C-dots (4–6 nm) using
thermal oxidation of an appropriately ion-exchanged NaY
zeolite.30
Zhu et al. reported a facile approach for preparing hydrophilic
C-dots by using mesoporous silica (MS) spheres as nanoreactors
in an impregnation method.41 Without further treatment, the
resulting highly efficient photoluminescent C-dots are mono-
disperse, photostable and of low toxicity, and show excellent
luminescence properties. The overall synthetic procedure is
illustrated in Fig. 4. First, MS spheres were prepared with
N-hexadecylamine as the surfactant and tetraethoxysilane
Fig. 4 Processing diagram for the synthesis of photoluminescent car-
bogenic dots. (Reproduced from ref. 41.)
J. Mater. Chem.
(TEOS) as the precursor using ammonia as a catalyst. Subse-
quently, MS spheres were impregnated with a mixed solution of
complex salts and citric acid. Subsequent calcination and
removal of MS supports generated the nanosized hydrophilic
C-dots. The key feature of this method is the employment of MS
spheres as supports, which not only confines the C-dots to a
narrow size distribution in the pores of MS spheres, but also
prevents the aggregation of the nanosized C-dots.
2.1.1.4. Microwave/ultrasonic synthesis. Microwave/ultra-
sonic technology has become a very important process in
synthetic chemistry. Zhu et al. presented a facile and economical
microwave pyrolysis approach to synthesize fluorescent C-dots
with electrochemiluminescence (ECL) properties.42 In this
synthesis, different amounts of polyethylene glycol 200 (PEG200)
and saccharide were added to distilled water to form a trans-
parent solution. The solution was then heated in a 500 W
microwave oven for several minutes. With increasing reaction
time, the solution changed from colorless to yellow, and finally to
dark brown, which implied the formation of C-dots.
Wang et al. reported a facile and green one-step microwave
synthesis of photoluminescent C-dots.45 The preparation
requires a carbohydrate (glycerol, glycol, glucose, sucrose, etc.)
and a tiny amount of an inorganic ion, and can be completed in
just a few minutes, requiring no surface passivation reagent.
A microwave-hydrothermal synthesis of fluorescent C-dots
from graphite oxide was explored by Zheng et al.43 Kang et al.
described a simple synthesis of C-dots from glucose or active
carbon by using an ultrasonic treatment method.15a,44 Such
monodispersed water-soluble fluorescent C-dots could emit
bright and colorful PL covering the entire visible-to-NIR spectral
range (Fig. 5). Notably, the NIR emission of C-dots could be
obtained by NIR excitation. Furthermore, the C-dots had
excellent up-conversion fluorescent properties.15a
Glucose-derived water-soluble crystalline C-dots with an
average diameter as small as 1.65 nm (�5 layers) were prepared
by a facile microwave-assisted hydrothermal (MAH) method.15b
This method did not require any surface passivation agents or
inorganic additives; the sole reagent was glucose (sucrose or
fructose) and; as shown in Fig. 6; the glucose molecules were
pyrolyzed and then converted to C-dots.
Fig. 5 (a) TEM image of C-dots prepared from glucose with a diameter
of less than 5 nm; (b) and (c) photographs of C-dots dispersions in water
with sunlight and UV (365 nm, center) illumination, respectively; (d–g)
fluorescent microscope images of C-dots under different excitation: d, e,
f, and g for 360, 390, 470, and 540 nm, respectively. (Reprinted from ref.
15a, Copyright 2011, with permission from Elsevier.)
This journal is ª The Royal Society of Chemistry 2012
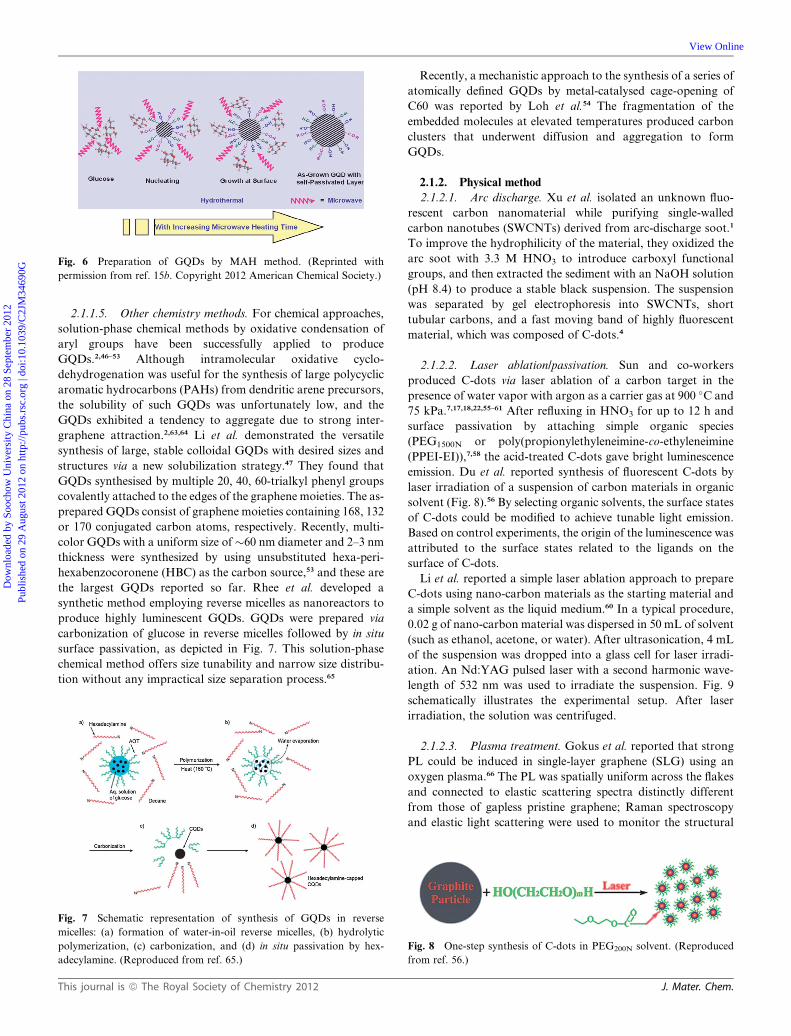
Fig. 6 Preparation of GQDs by MAH method. (Reprinted with
permission from ref. 15b. Copyright 2012 American Chemical Society.)
Dow
nloa
ded
by S
ooch
ow U
nive
rsity
Chi
na o
n 28
Sep
tem
ber
2012
Publ
ishe
d on
29
Aug
ust 2
012
on h
ttp://
pubs
.rsc
.org
| do
i:10.
1039
/C2J
M34
690G
View Online
2.1.1.5. Other chemistry methods. For chemical approaches,
solution-phase chemical methods by oxidative condensation of
aryl groups have been successfully applied to produce
GQDs.2,46–53 Although intramolecular oxidative cyclo-
dehydrogenation was useful for the synthesis of large polycyclic
aromatic hydrocarbons (PAHs) from dendritic arene precursors,
the solubility of such GQDs was unfortunately low, and the
GQDs exhibited a tendency to aggregate due to strong inter-
graphene attraction.2,63,64 Li et al. demonstrated the versatile
synthesis of large, stable colloidal GQDs with desired sizes and
structures via a new solubilization strategy.47 They found that
GQDs synthesised by multiple 20, 40, 60-trialkyl phenyl groups
covalently attached to the edges of the graphene moieties. The as-
prepared GQDs consist of graphene moieties containing 168, 132
or 170 conjugated carbon atoms, respectively. Recently, multi-
color GQDs with a uniform size of�60 nm diameter and 2–3 nm
thickness were synthesized by using unsubstituted hexa-peri-
hexabenzocoronene (HBC) as the carbon source,53 and these are
the largest GQDs reported so far. Rhee et al. developed a
synthetic method employing reverse micelles as nanoreactors to
produce highly luminescent GQDs. GQDs were prepared via
carbonization of glucose in reverse micelles followed by in situ
surface passivation, as depicted in Fig. 7. This solution-phase
chemical method offers size tunability and narrow size distribu-
tion without any impractical size separation process.65
Fig. 7 Schematic representation of synthesis of GQDs in reverse
micelles: (a) formation of water-in-oil reverse micelles, (b) hydrolytic
polymerization, (c) carbonization, and (d) in situ passivation by hex-
adecylamine. (Reproduced from ref. 65.)
This journal is ª The Royal Society of Chemistry 2012
Recently, a mechanistic approach to the synthesis of a series of
atomically defined GQDs by metal-catalysed cage-opening of
C60 was reported by Loh et al.54 The fragmentation of the
embedded molecules at elevated temperatures produced carbon
clusters that underwent diffusion and aggregation to form
GQDs.
2.1.2. Physical method
2.1.2.1. Arc discharge. Xu et al. isolated an unknown fluo-
rescent carbon nanomaterial while purifying single-walled
carbon nanotubes (SWCNTs) derived from arc-discharge soot.1
To improve the hydrophilicity of the material, they oxidized the
arc soot with 3.3 M HNO3 to introduce carboxyl functional
groups, and then extracted the sediment with an NaOH solution
(pH 8.4) to produce a stable black suspension. The suspension
was separated by gel electrophoresis into SWCNTs, short
tubular carbons, and a fast moving band of highly fluorescent
material, which was composed of C-dots.4
2.1.2.2. Laser ablation/passivation. Sun and co-workers
produced C-dots via laser ablation of a carbon target in the
presence of water vapor with argon as a carrier gas at 900 �C and
75 kPa.7,17,18,22,55–61 After refluxing in HNO3 for up to 12 h and
surface passivation by attaching simple organic species
(PEG1500N or poly(propionylethyleneimine-co-ethyleneimine
(PPEI-EI)),7,58 the acid-treated C-dots gave bright luminescence
emission. Du et al. reported synthesis of fluorescent C-dots by
laser irradiation of a suspension of carbon materials in organic
solvent (Fig. 8).56 By selecting organic solvents, the surface states
of C-dots could be modified to achieve tunable light emission.
Based on control experiments, the origin of the luminescence was
attributed to the surface states related to the ligands on the
surface of C-dots.
Li et al. reported a simple laser ablation approach to prepare
C-dots using nano-carbon materials as the starting material and
a simple solvent as the liquid medium.60 In a typical procedure,
0.02 g of nano-carbon material was dispersed in 50 mL of solvent
(such as ethanol, acetone, or water). After ultrasonication, 4 mL
of the suspension was dropped into a glass cell for laser irradi-
ation. An Nd:YAG pulsed laser with a second harmonic wave-
length of 532 nm was used to irradiate the suspension. Fig. 9
schematically illustrates the experimental setup. After laser
irradiation, the solution was centrifuged.
2.1.2.3. Plasma treatment. Gokus et al. reported that strong
PL could be induced in single-layer graphene (SLG) using an
oxygen plasma.66 The PL was spatially uniform across the flakes
and connected to elastic scattering spectra distinctly different
from those of gapless pristine graphene; Raman spectroscopy
and elastic light scattering were used to monitor the structural
Fig. 8 One-step synthesis of C-dots in PEG200N solvent. (Reproduced
from ref. 56.)
J. Mater. Chem.
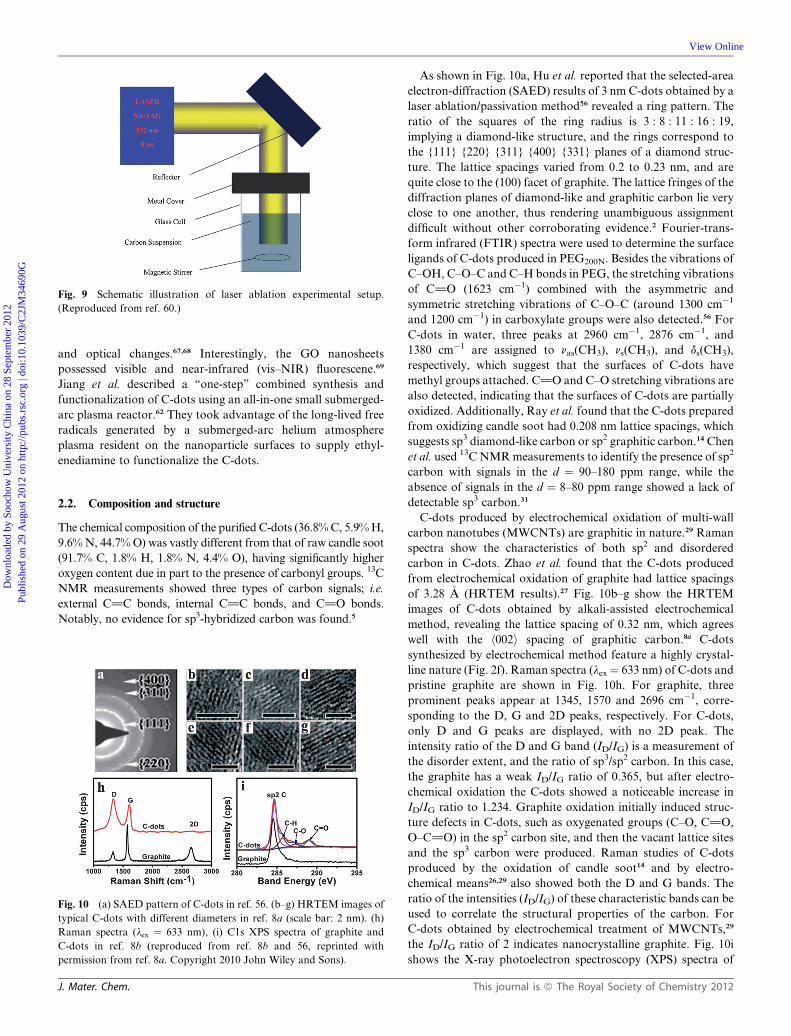
Fig. 9 Schematic illustration of laser ablation experimental setup.
(Reproduced from ref. 60.)
Dow
nloa
ded
by S
ooch
ow U
nive
rsity
Chi
na o
n 28
Sep
tem
ber
2012
Publ
ishe
d on
29
Aug
ust 2
012
on h
ttp://
pubs
.rsc
.org
| do
i:10.
1039
/C2J
M34
690G
View Online
and optical changes.67,68 Interestingly, the GO nanosheets
possessed visible and near-infrared (vis–NIR) fluorescene.69
Jiang et al. described a ‘‘one-step’’ combined synthesis and
functionalization of C-dots using an all-in-one small submerged-
arc plasma reactor.62 They took advantage of the long-lived free
radicals generated by a submerged-arc helium atmosphere
plasma resident on the nanoparticle surfaces to supply ethyl-
enediamine to functionalize the C-dots.
2.2. Composition and structure
The chemical composition of the purified C-dots (36.8%C, 5.9%H,
9.6%N, 44.7%O) was vastly different from that of raw candle soot
(91.7% C, 1.8% H, 1.8% N, 4.4% O), having significantly higher
oxygen content due in part to the presence of carbonyl groups. 13C
NMR measurements showed three types of carbon signals; i.e.
external C]C bonds, internal C]C bonds, and C]O bonds.
Notably, no evidence for sp3-hybridized carbon was found.5
Fig. 10 (a) SAED pattern of C-dots in ref. 56. (b–g) HRTEM images of
typical C-dots with different diameters in ref. 8a (scale bar: 2 nm). (h)
Raman spectra (lex ¼ 633 nm), (i) C1s XPS spectra of graphite and
C-dots in ref. 8b (reproduced from ref. 8b and 56, reprinted with
permission from ref. 8a. Copyright 2010 John Wiley and Sons).
J. Mater. Chem.
As shown in Fig. 10a, Hu et al. reported that the selected-area
electron-diffraction (SAED) results of 3 nm C-dots obtained by a
laser ablation/passivation method56 revealed a ring pattern. The
ratio of the squares of the ring radius is 3 : 8 : 11 : 16 : 19,
implying a diamond-like structure, and the rings correspond to
the {111} {220} {311} {400} {331} planes of a diamond struc-
ture. The lattice spacings varied from 0.2 to 0.23 nm, and are
quite close to the (100) facet of graphite. The lattice fringes of the
diffraction planes of diamond-like and graphitic carbon lie very
close to one another, thus rendering unambiguous assignment
difficult without other corroborating evidence.2 Fourier-trans-
form infrared (FTIR) spectra were used to determine the surface
ligands of C-dots produced in PEG200N. Besides the vibrations of
C–OH, C–O–C and C–H bonds in PEG, the stretching vibrations
of C]O (1623 cm�1) combined with the asymmetric and
symmetric stretching vibrations of C–O–C (around 1300 cm�1
and 1200 cm�1) in carboxylate groups were also detected.56 For
C-dots in water, three peaks at 2960 cm�1, 2876 cm�1, and
1380 cm�1 are assigned to nas(CH3), ns(CH3), and ds(CH3),
respectively, which suggest that the surfaces of C-dots have
methyl groups attached. C]O and C–O stretching vibrations are
also detected, indicating that the surfaces of C-dots are partially
oxidized. Additionally, Ray et al. found that the C-dots prepared
from oxidizing candle soot had 0.208 nm lattice spacings, which
suggests sp3 diamond-like carbon or sp2 graphitic carbon.14 Chen
et al. used 13CNMRmeasurements to identify the presence of sp2
carbon with signals in the d ¼ 90–180 ppm range, while the
absence of signals in the d ¼ 8–80 ppm range showed a lack of
detectable sp3 carbon.31
C-dots produced by electrochemical oxidation of multi-wall
carbon nanotubes (MWCNTs) are graphitic in nature.29 Raman
spectra show the characteristics of both sp2 and disordered
carbon in C-dots. Zhao et al. found that the C-dots produced
from electrochemical oxidation of graphite had lattice spacings
of 3.28 �A (HRTEM results).27 Fig. 10b–g show the HRTEM
images of C-dots obtained by alkali-assisted electrochemical
method, revealing the lattice spacing of 0.32 nm, which agrees
well with the h002i spacing of graphitic carbon.8a C-dots
synthesized by electrochemical method feature a highly crystal-
line nature (Fig. 2f). Raman spectra (lex¼ 633 nm) of C-dots and
pristine graphite are shown in Fig. 10h. For graphite, three
prominent peaks appear at 1345, 1570 and 2696 cm�1, corre-
sponding to the D, G and 2D peaks, respectively. For C-dots,
only D and G peaks are displayed, with no 2D peak. The
intensity ratio of the D and G band (ID/IG) is a measurement of
the disorder extent, and the ratio of sp3/sp2 carbon. In this case,
the graphite has a weak ID/IG ratio of 0.365, but after electro-
chemical oxidation the C-dots showed a noticeable increase in
ID/IG ratio to 1.234. Graphite oxidation initially induced struc-
ture defects in C-dots, such as oxygenated groups (C–O, C]O,
O–C]O) in the sp2 carbon site, and then the vacant lattice sites
and the sp3 carbon were produced. Raman studies of C-dots
produced by the oxidation of candle soot14 and by electro-
chemical means26,29 also showed both the D and G bands. The
ratio of the intensities (ID/IG) of these characteristic bands can be
used to correlate the structural properties of the carbon. For
C-dots obtained by electrochemical treatment of MWCNTs,29
the ID/IG ratio of 2 indicates nanocrystalline graphite. Fig. 10i
shows the X-ray photoelectron spectroscopy (XPS) spectra of
This journal is ª The Royal Society of Chemistry 2012
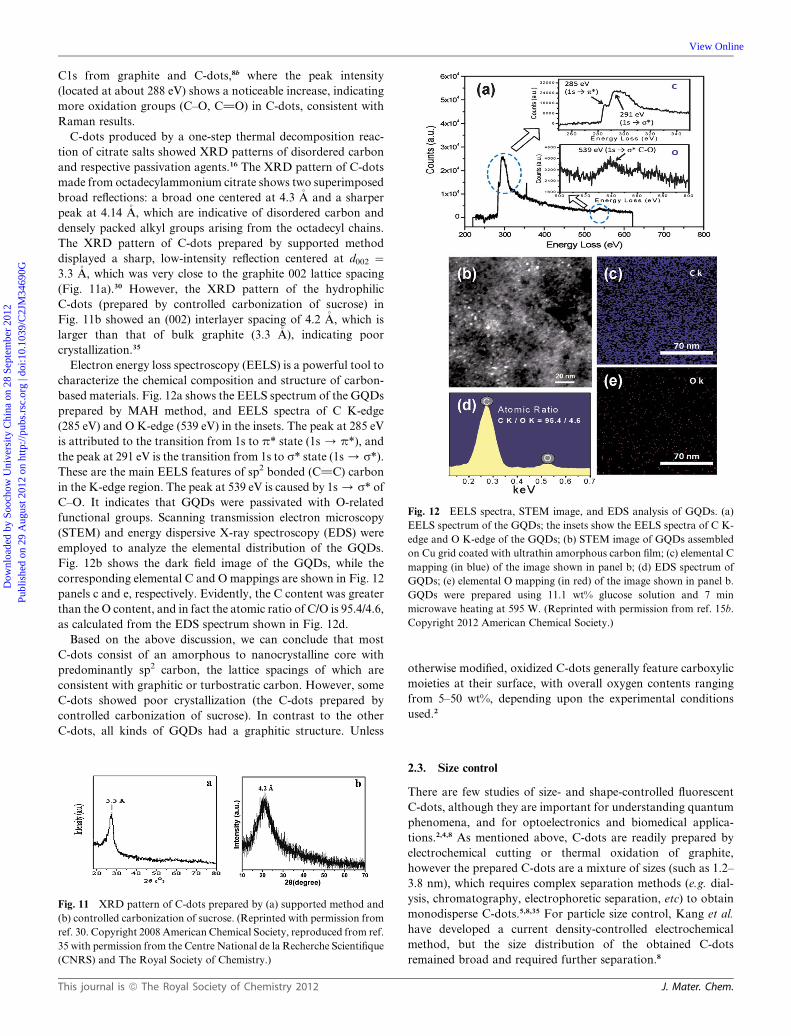
Fig. 12 EELS spectra, STEM image, and EDS analysis of GQDs. (a)
EELS spectrum of the GQDs; the insets show the EELS spectra of C K-
edge and O K-edge of the GQDs; (b) STEM image of GQDs assembled
on Cu grid coated with ultrathin amorphous carbon film; (c) elemental C
mapping (in blue) of the image shown in panel b; (d) EDS spectrum of
GQDs; (e) elemental O mapping (in red) of the image shown in panel b.
GQDs were prepared using 11.1 wt% glucose solution and 7 min
microwave heating at 595 W. (Reprinted with permission from ref. 15b.
Copyright 2012 American Chemical Society.)
Dow
nloa
ded
by S
ooch
ow U
nive
rsity
Chi
na o
n 28
Sep
tem
ber
2012
Publ
ishe
d on
29
Aug
ust 2
012
on h
ttp://
pubs
.rsc
.org
| do
i:10.
1039
/C2J
M34
690G
View Online
C1s from graphite and C-dots,8b where the peak intensity
(located at about 288 eV) shows a noticeable increase, indicating
more oxidation groups (C–O, C]O) in C-dots, consistent with
Raman results.
C-dots produced by a one-step thermal decomposition reac-
tion of citrate salts showed XRD patterns of disordered carbon
and respective passivation agents.16 The XRD pattern of C-dots
made from octadecylammonium citrate shows two superimposed
broad reflections: a broad one centered at 4.3 �A and a sharper
peak at 4.14 �A, which are indicative of disordered carbon and
densely packed alkyl groups arising from the octadecyl chains.
The XRD pattern of C-dots prepared by supported method
displayed a sharp, low-intensity reflection centered at d002 ¼3.3 �A, which was very close to the graphite 002 lattice spacing
(Fig. 11a).30 However, the XRD pattern of the hydrophilic
C-dots (prepared by controlled carbonization of sucrose) in
Fig. 11b showed an (002) interlayer spacing of 4.2 �A, which is
larger than that of bulk graphite (3.3 �A), indicating poor
crystallization.35
Electron energy loss spectroscopy (EELS) is a powerful tool to
characterize the chemical composition and structure of carbon-
based materials. Fig. 12a shows the EELS spectrum of the GQDs
prepared by MAH method, and EELS spectra of C K-edge
(285 eV) and O K-edge (539 eV) in the insets. The peak at 285 eV
is attributed to the transition from 1s to p* state (1s/ p*), and
the peak at 291 eV is the transition from 1s to s* state (1s/ s*).
These are the main EELS features of sp2 bonded (C]C) carbon
in the K-edge region. The peak at 539 eV is caused by 1s/ s* of
C–O. It indicates that GQDs were passivated with O-related
functional groups. Scanning transmission electron microscopy
(STEM) and energy dispersive X-ray spectroscopy (EDS) were
employed to analyze the elemental distribution of the GQDs.
Fig. 12b shows the dark field image of the GQDs, while the
corresponding elemental C and O mappings are shown in Fig. 12
panels c and e, respectively. Evidently, the C content was greater
than the O content, and in fact the atomic ratio of C/O is 95.4/4.6,
as calculated from the EDS spectrum shown in Fig. 12d.
Based on the above discussion, we can conclude that most
C-dots consist of an amorphous to nanocrystalline core with
predominantly sp2 carbon, the lattice spacings of which are
consistent with graphitic or turbostratic carbon. However, some
C-dots showed poor crystallization (the C-dots prepared by
controlled carbonization of sucrose). In contrast to the other
C-dots, all kinds of GQDs had a graphitic structure. Unless
Fig. 11 XRD pattern of C-dots prepared by (a) supported method and
(b) controlled carbonization of sucrose. (Reprinted with permission from
ref. 30. Copyright 2008 American Chemical Society, reproduced from ref.
35 with permission from the Centre National de la Recherche Scientifique
(CNRS) and The Royal Society of Chemistry.)
This journal is ª The Royal Society of Chemistry 2012
otherwise modified, oxidized C-dots generally feature carboxylic
moieties at their surface, with overall oxygen contents ranging
from 5–50 wt%, depending upon the experimental conditions
used.2
2.3. Size control
There are few studies of size- and shape-controlled fluorescent
C-dots, although they are important for understanding quantum
phenomena, and for optoelectronics and biomedical applica-
tions.2,4,8 As mentioned above, C-dots are readily prepared by
electrochemical cutting or thermal oxidation of graphite,
however the prepared C-dots are a mixture of sizes (such as 1.2–
3.8 nm), which requires complex separation methods (e.g. dial-
ysis, chromatography, electrophoretic separation, etc) to obtain
monodisperse C-dots.5,8,35 For particle size control, Kang et al.
have developed a current density-controlled electrochemical
method, but the size distribution of the obtained C-dots
remained broad and required further separation.8
J. Mater. Chem.
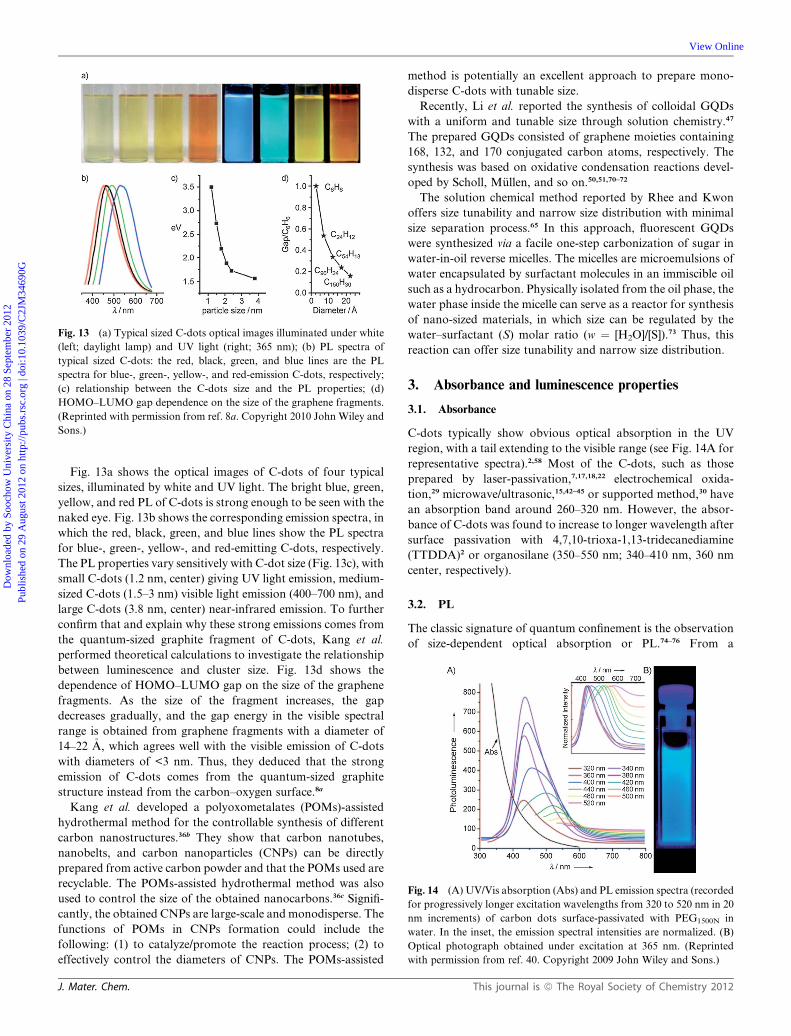
Fig. 13 (a) Typical sized C-dots optical images illuminated under white
(left; daylight lamp) and UV light (right; 365 nm); (b) PL spectra of
typical sized C-dots: the red, black, green, and blue lines are the PL
spectra for blue-, green-, yellow-, and red-emission C-dots, respectively;
(c) relationship between the C-dots size and the PL properties; (d)
HOMO–LUMO gap dependence on the size of the graphene fragments.
(Reprinted with permission from ref. 8a. Copyright 2010 John Wiley and
Sons.)
Fig. 14 (A) UV/Vis absorption (Abs) and PL emission spectra (recorded
for progressively longer excitation wavelengths from 320 to 520 nm in 20
nm increments) of carbon dots surface-passivated with PEG1500N in
water. In the inset, the emission spectral intensities are normalized. (B)
Optical photograph obtained under excitation at 365 nm. (Reprinted
with permission from ref. 40. Copyright 2009 John Wiley and Sons.)
Dow
nloa
ded
by S
ooch
ow U
nive
rsity
Chi
na o
n 28
Sep
tem
ber
2012
Publ
ishe
d on
29
Aug
ust 2
012
on h
ttp://
pubs
.rsc
.org
| do
i:10.
1039
/C2J
M34
690G
View Online
Fig. 13a shows the optical images of C-dots of four typical
sizes, illuminated by white and UV light. The bright blue, green,
yellow, and red PL of C-dots is strong enough to be seen with the
naked eye. Fig. 13b shows the corresponding emission spectra, in
which the red, black, green, and blue lines show the PL spectra
for blue-, green-, yellow-, and red-emitting C-dots, respectively.
The PL properties vary sensitively with C-dot size (Fig. 13c), with
small C-dots (1.2 nm, center) giving UV light emission, medium-
sized C-dots (1.5–3 nm) visible light emission (400–700 nm), and
large C-dots (3.8 nm, center) near-infrared emission. To further
confirm that and explain why these strong emissions comes from
the quantum-sized graphite fragment of C-dots, Kang et al.
performed theoretical calculations to investigate the relationship
between luminescence and cluster size. Fig. 13d shows the
dependence of HOMO–LUMO gap on the size of the graphene
fragments. As the size of the fragment increases, the gap
decreases gradually, and the gap energy in the visible spectral
range is obtained from graphene fragments with a diameter of
14–22 �A, which agrees well with the visible emission of C-dots
with diameters of <3 nm. Thus, they deduced that the strong
emission of C-dots comes from the quantum-sized graphite
structure instead from the carbon–oxygen surface.8a
Kang et al. developed a polyoxometalates (POMs)-assisted
hydrothermal method for the controllable synthesis of different
carbon nanostructures.36b They show that carbon nanotubes,
nanobelts, and carbon nanoparticles (CNPs) can be directly
prepared from active carbon powder and that the POMs used are
recyclable. The POMs-assisted hydrothermal method was also
used to control the size of the obtained nanocarbons.36c Signifi-
cantly, the obtained CNPs are large-scale and monodisperse. The
functions of POMs in CNPs formation could include the
following: (1) to catalyze/promote the reaction process; (2) to
effectively control the diameters of CNPs. The POMs-assisted
J. Mater. Chem.
method is potentially an excellent approach to prepare mono-
disperse C-dots with tunable size.
Recently, Li et al. reported the synthesis of colloidal GQDs
with a uniform and tunable size through solution chemistry.47
The prepared GQDs consisted of graphene moieties containing
168, 132, and 170 conjugated carbon atoms, respectively. The
synthesis was based on oxidative condensation reactions devel-
oped by Scholl, M€ullen, and so on.50,51,70–72
The solution chemical method reported by Rhee and Kwon
offers size tunability and narrow size distribution with minimal
size separation process.65 In this approach, fluorescent GQDs
were synthesized via a facile one-step carbonization of sugar in
water-in-oil reverse micelles. The micelles are microemulsions of
water encapsulated by surfactant molecules in an immiscible oil
such as a hydrocarbon. Physically isolated from the oil phase, the
water phase inside the micelle can serve as a reactor for synthesis
of nano-sized materials, in which size can be regulated by the
water–surfactant (S) molar ratio (w ¼ [H2O]/[S]).73 Thus, this
reaction can offer size tunability and narrow size distribution.
3. Absorbance and luminescence properties
3.1. Absorbance
C-dots typically show obvious optical absorption in the UV
region, with a tail extending to the visible range (see Fig. 14A for
representative spectra).2,58 Most of the C-dots, such as those
prepared by laser-passivation,7,17,18,22 electrochemical oxida-
tion,29 microwave/ultrasonic,15,42–45 or supported method,30 have
an absorption band around 260–320 nm. However, the absor-
bance of C-dots was found to increase to longer wavelength after
surface passivation with 4,7,10-trioxa-1,13-tridecanediamine
(TTDDA)2 or organosilane (350–550 nm; 340–410 nm, 360 nm
center, respectively).
3.2. PL
The classic signature of quantum confinement is the observation
of size-dependent optical absorption or PL.74–76 From a
This journal is ª The Royal Society of Chemistry 2012
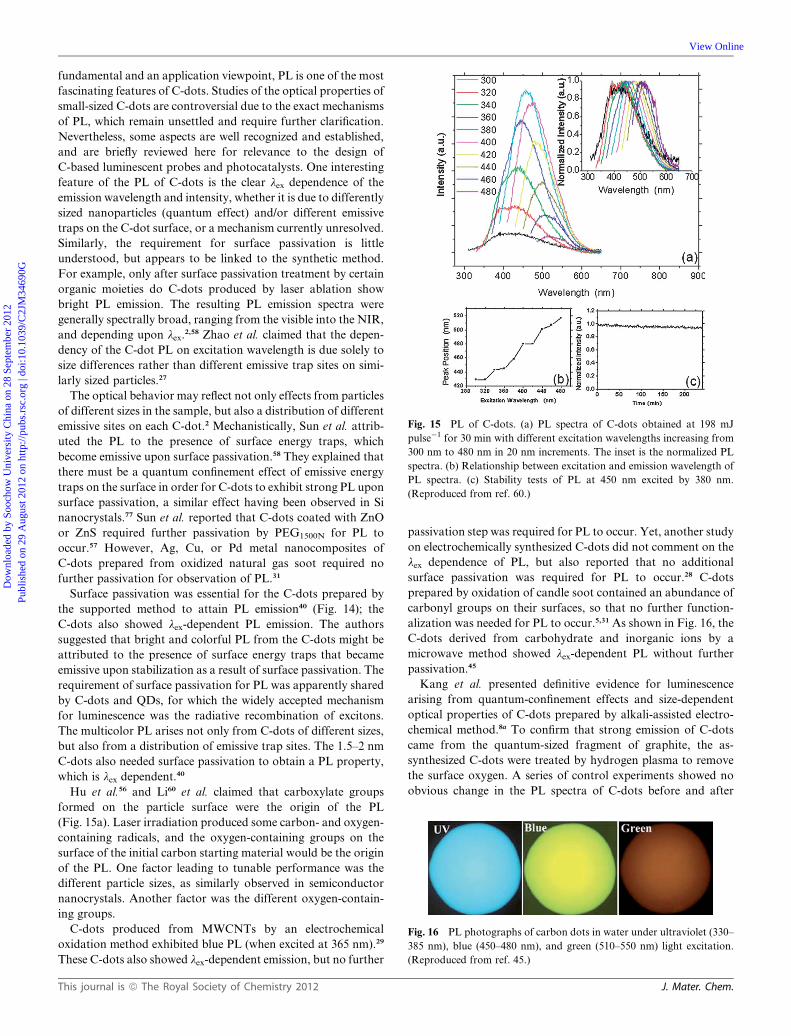
Fig. 15 PL of C-dots. (a) PL spectra of C-dots obtained at 198 mJ
pulse�1 for 30 min with different excitation wavelengths increasing from
300 nm to 480 nm in 20 nm increments. The inset is the normalized PL
spectra. (b) Relationship between excitation and emission wavelength of
PL spectra. (c) Stability tests of PL at 450 nm excited by 380 nm.
(Reproduced from ref. 60.)
Fig. 16 PL photographs of carbon dots in water under ultraviolet (330–
385 nm), blue (450–480 nm), and green (510–550 nm) light excitation.
(Reproduced from ref. 45.)
Dow
nloa
ded
by S
ooch
ow U
nive
rsity
Chi
na o
n 28
Sep
tem
ber
2012
Publ
ishe
d on
29
Aug
ust 2
012
on h
ttp://
pubs
.rsc
.org
| do
i:10.
1039
/C2J
M34
690G
View Online
fundamental and an application viewpoint, PL is one of the most
fascinating features of C-dots. Studies of the optical properties of
small-sized C-dots are controversial due to the exact mechanisms
of PL, which remain unsettled and require further clarification.
Nevertheless, some aspects are well recognized and established,
and are briefly reviewed here for relevance to the design of
C-based luminescent probes and photocatalysts. One interesting
feature of the PL of C-dots is the clear lex dependence of the
emission wavelength and intensity, whether it is due to differently
sized nanoparticles (quantum effect) and/or different emissive
traps on the C-dot surface, or a mechanism currently unresolved.
Similarly, the requirement for surface passivation is little
understood, but appears to be linked to the synthetic method.
For example, only after surface passivation treatment by certain
organic moieties do C-dots produced by laser ablation show
bright PL emission. The resulting PL emission spectra were
generally spectrally broad, ranging from the visible into the NIR,
and depending upon lex.2,58 Zhao et al. claimed that the depen-
dency of the C-dot PL on excitation wavelength is due solely to
size differences rather than different emissive trap sites on simi-
larly sized particles.27
The optical behavior may reflect not only effects from particles
of different sizes in the sample, but also a distribution of different
emissive sites on each C-dot.2 Mechanistically, Sun et al. attrib-
uted the PL to the presence of surface energy traps, which
become emissive upon surface passivation.58 They explained that
there must be a quantum confinement effect of emissive energy
traps on the surface in order for C-dots to exhibit strong PL upon
surface passivation, a similar effect having been observed in Si
nanocrystals.77 Sun et al. reported that C-dots coated with ZnO
or ZnS required further passivation by PEG1500N for PL to
occur.57 However, Ag, Cu, or Pd metal nanocomposites of
C-dots prepared from oxidized natural gas soot required no
further passivation for observation of PL.31
Surface passivation was essential for the C-dots prepared by
the supported method to attain PL emission40 (Fig. 14); the
C-dots also showed lex-dependent PL emission. The authors
suggested that bright and colorful PL from the C-dots might be
attributed to the presence of surface energy traps that became
emissive upon stabilization as a result of surface passivation. The
requirement of surface passivation for PL was apparently shared
by C-dots and QDs, for which the widely accepted mechanism
for luminescence was the radiative recombination of excitons.
The multicolor PL arises not only from C-dots of different sizes,
but also from a distribution of emissive trap sites. The 1.5–2 nm
C-dots also needed surface passivation to obtain a PL property,
which is lex dependent.40
Hu et al.56 and Li60 et al. claimed that carboxylate groups
formed on the particle surface were the origin of the PL
(Fig. 15a). Laser irradiation produced some carbon- and oxygen-
containing radicals, and the oxygen-containing groups on the
surface of the initial carbon starting material would be the origin
of the PL. One factor leading to tunable performance was the
different particle sizes, as similarly observed in semiconductor
nanocrystals. Another factor was the different oxygen-contain-
ing groups.
C-dots produced from MWCNTs by an electrochemical
oxidation method exhibited blue PL (when excited at 365 nm).29
These C-dots also showed lex-dependent emission, but no further
This journal is ª The Royal Society of Chemistry 2012
passivation step was required for PL to occur. Yet, another study
on electrochemically synthesized C-dots did not comment on the
lex dependence of PL, but also reported that no additional
surface passivation was required for PL to occur.28 C-dots
prepared by oxidation of candle soot contained an abundance of
carbonyl groups on their surfaces, so that no further function-
alization was needed for PL to occur.5,31 As shown in Fig. 16, the
C-dots derived from carbohydrate and inorganic ions by a
microwave method showed lex-dependent PL without further
passivation.45
Kang et al. presented definitive evidence for luminescence
arising from quantum-confinement effects and size-dependent
optical properties of C-dots prepared by alkali-assisted electro-
chemical method.8a To confirm that strong emission of C-dots
came from the quantum-sized fragment of graphite, the as-
synthesized C-dots were treated by hydrogen plasma to remove
the surface oxygen. A series of control experiments showed no
obvious change in the PL spectra of C-dots before and after
J. Mater. Chem.
Dow
nloa
ded
by S
ooch
ow U
nive
rsity
Chi
na o
n 28
Sep
tem
ber
2012
Publ
ishe
d on
29
Aug
ust 2
012
on h
ttp://
pubs
.rsc
.org
| do
i:10.
1039
/C2J
M34
690G
View Online
hydrogen plasma. To further confirm that and explain why the
strong emission comes from the quantum-sized graphite frag-
ment of C-dots, they performed theoretical calculations to
investigate the relationship between luminescence and cluster size
(Fig. 13d).
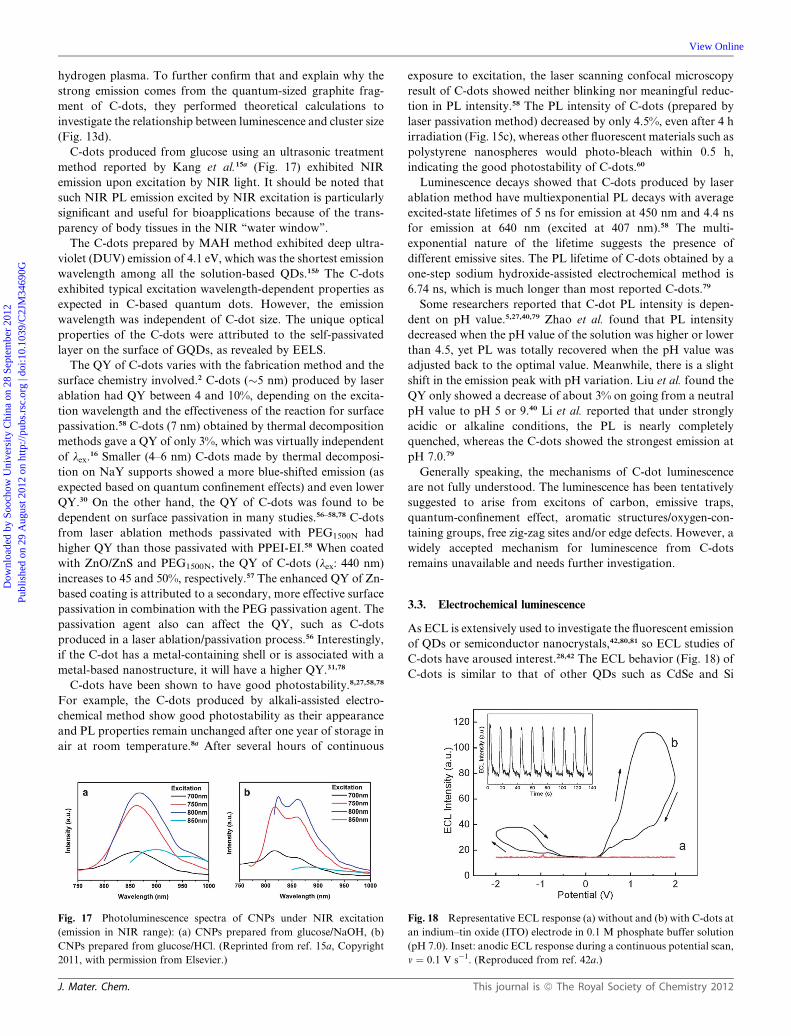
C-dots produced from glucose using an ultrasonic treatment
method reported by Kang et al.15a (Fig. 17) exhibited NIR
emission upon excitation by NIR light. It should be noted that
such NIR PL emission excited by NIR excitation is particularly
significant and useful for bioapplications because of the trans-
parency of body tissues in the NIR ‘‘water window’’.
The C-dots prepared by MAH method exhibited deep ultra-
violet (DUV) emission of 4.1 eV, which was the shortest emission
wavelength among all the solution-based QDs.15b The C-dots
exhibited typical excitation wavelength-dependent properties as
expected in C-based quantum dots. However, the emission
wavelength was independent of C-dot size. The unique optical
properties of the C-dots were attributed to the self-passivated
layer on the surface of GQDs, as revealed by EELS.
The QY of C-dots varies with the fabrication method and the
surface chemistry involved.2 C-dots (�5 nm) produced by laser
ablation had QY between 4 and 10%, depending on the excita-
tion wavelength and the effectiveness of the reaction for surface
passivation.58 C-dots (7 nm) obtained by thermal decomposition
methods gave a QY of only 3%, which was virtually independent
of lex.16 Smaller (4–6 nm) C-dots made by thermal decomposi-
tion on NaY supports showed a more blue-shifted emission (as
expected based on quantum confinement effects) and even lower
QY.30 On the other hand, the QY of C-dots was found to be
dependent on surface passivation in many studies.56–58,78 C-dots
from laser ablation methods passivated with PEG1500N had
higher QY than those passivated with PPEI-EI.58 When coated
with ZnO/ZnS and PEG1500N, the QY of C-dots (lex: 440 nm)
increases to 45 and 50%, respectively.57 The enhanced QY of Zn-
based coating is attributed to a secondary, more effective surface
passivation in combination with the PEG passivation agent. The
passivation agent also can affect the QY, such as C-dots
produced in a laser ablation/passivation process.56 Interestingly,
if the C-dot has a metal-containing shell or is associated with a
metal-based nanostructure, it will have a higher QY.31,78
C-dots have been shown to have good photostability.8,27,58,78
For example, the C-dots produced by alkali-assisted electro-
chemical method show good photostability as their appearance
and PL properties remain unchanged after one year of storage in
air at room temperature.8a After several hours of continuous
Fig. 17 Photoluminescence spectra of CNPs under NIR excitation
(emission in NIR range): (a) CNPs prepared from glucose/NaOH, (b)
CNPs prepared from glucose/HCl. (Reprinted from ref. 15a, Copyright
2011, with permission from Elsevier.)
J. Mater. Chem.
exposure to excitation, the laser scanning confocal microscopy
result of C-dots showed neither blinking nor meaningful reduc-
tion in PL intensity.58 The PL intensity of C-dots (prepared by
laser passivation method) decreased by only 4.5%, even after 4 h
irradiation (Fig. 15c), whereas other fluorescent materials such as
polystyrene nanospheres would photo-bleach within 0.5 h,
indicating the good photostability of C-dots.60
Luminescence decays showed that C-dots produced by laser
ablation method have multiexponential PL decays with average
excited-state lifetimes of 5 ns for emission at 450 nm and 4.4 ns
for emission at 640 nm (excited at 407 nm).58 The multi-
exponential nature of the lifetime suggests the presence of
different emissive sites. The PL lifetime of C-dots obtained by a
one-step sodium hydroxide-assisted electrochemical method is
6.74 ns, which is much longer than most reported C-dots.79
Some researchers reported that C-dot PL intensity is depen-
dent on pH value.5,27,40,79 Zhao et al. found that PL intensity
decreased when the pH value of the solution was higher or lower
than 4.5, yet PL was totally recovered when the pH value was
adjusted back to the optimal value. Meanwhile, there is a slight
shift in the emission peak with pH variation. Liu et al. found the
QY only showed a decrease of about 3% on going from a neutral
pH value to pH 5 or 9.40 Li et al. reported that under strongly
acidic or alkaline conditions, the PL is nearly completely
quenched, whereas the C-dots showed the strongest emission at
pH 7.0.79
Generally speaking, the mechanisms of C-dot luminescence
are not fully understood. The luminescence has been tentatively
suggested to arise from excitons of carbon, emissive traps,
quantum-confinement effect, aromatic structures/oxygen-con-
taining groups, free zig-zag sites and/or edge defects. However, a
widely accepted mechanism for luminescence from C-dots
remains unavailable and needs further investigation.
3.3. Electrochemical luminescence
As ECL is extensively used to investigate the fluorescent emission
of QDs or semiconductor nanocrystals,42,80,81 so ECL studies of
C-dots have aroused interest.28,42 The ECL behavior (Fig. 18) of
C-dots is similar to that of other QDs such as CdSe and Si
Fig. 18 Representative ECL response (a) without and (b) with C-dots at
an indium–tin oxide (ITO) electrode in 0.1 M phosphate buffer solution
(pH 7.0). Inset: anodic ECL response during a continuous potential scan,
v ¼ 0.1 V s�1. (Reproduced from ref. 42a.)
This journal is ª The Royal Society of Chemistry 2012
Dow
nloa
ded
by S
ooch
ow U
nive
rsity
Chi
na o
n 28
Sep
tem
ber
2012
Publ
ishe
d on
29
Aug
ust 2
012
on h
ttp://
pubs
.rsc
.org
| do
i:10.
1039
/C2J
M34
690G
View Online
nanocrystals.42Consequently, the ECLmechanism of C-dots was
explained as follows: firstly, the oxidized state (R_+) and the
reduced state (R_�) of C-dots was formed with the potential cycle;
then the electron-transfer annihilation of the two oppositely
charged carriers (R_+ and R_�) took place to form the excited state
(R*). Finally, the excited C-dots (R*) returned to the ground
state via a radiative pathway by emitting a photon. It is inter-
esting to note that the anodic ECL intensity was larger than the
cathodic value, indicating that R� was more stable than R+.
Additionally, ECL response over time was relatively stable (inset
of Fig. 18), which implied attractive applications in ECL sensing.
Zheng et al. found C-dots prepared from the electrochemical
oxidation of graphite exhibited ECL emission as the potential
was cycled between +1.8 and �1.5 V.28 The ECL spectrum of C-
dots obtained from SWCNTs82 has also been observed. Most
ECL from semiconductor nanomaterials has been observed to
originate from surface states and is often significantly red shifted
from the PL peaks by as much as hundreds of nanometers, due to
defect states in the band gap.75,83
As ECL is mainly associated with surface-state transitions in
nanoparticles2 (whereas PL is more reminiscent of the core state
in nanoparticle), comparison between the ECL and PL of
nanoparticles is an excellent way to investigate the presence of
surface traps.2,75,84,85 Based on the ECL evidence for the presence
of surface trap states and the pervasive size- and lex-dependency
of C-dot PL, Baker et al. postulated that C-dots feature core
band gaps which are size-dependent, with the most intense PL
attributable to direct recombination of electron–holes, whereas
the less intense bands may be assigned to surface-state traps and
phonon-assisted recombination.2,75 It would also be interesting
to determine if the ECL of C-dots is size-independent.
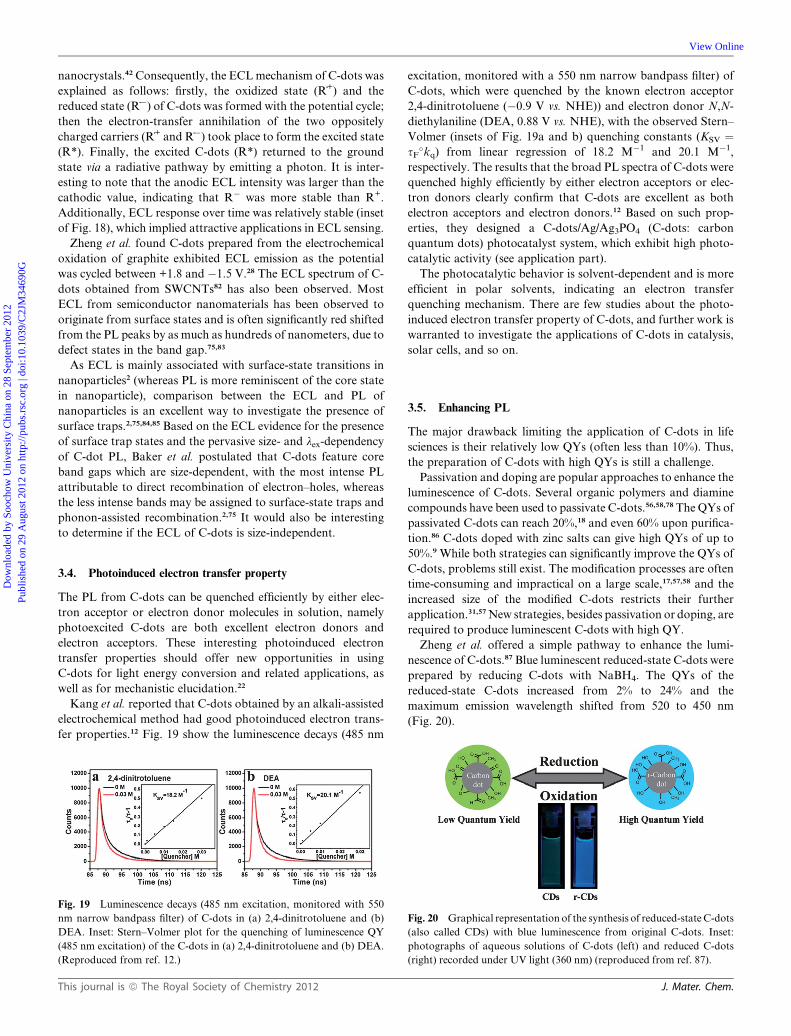
3.4. Photoinduced electron transfer property
The PL from C-dots can be quenched efficiently by either elec-
tron acceptor or electron donor molecules in solution, namely
photoexcited C-dots are both excellent electron donors and
electron acceptors. These interesting photoinduced electron
transfer properties should offer new opportunities in using
C-dots for light energy conversion and related applications, as
well as for mechanistic elucidation.22
Kang et al. reported that C-dots obtained by an alkali-assisted
electrochemical method had good photoinduced electron trans-
fer properties.12 Fig. 19 show the luminescence decays (485 nm
Fig. 19 Luminescence decays (485 nm excitation, monitored with 550
nm narrow bandpass filter) of C-dots in (a) 2,4-dinitrotoluene and (b)
DEA. Inset: Stern–Volmer plot for the quenching of luminescence QY
(485 nm excitation) of the C-dots in (a) 2,4-dinitrotoluene and (b) DEA.
(Reproduced from ref. 12.)
This journal is ª The Royal Society of Chemistry 2012
excitation, monitored with a 550 nm narrow bandpass filter) of
C-dots, which were quenched by the known electron acceptor
2,4-dinitrotoluene (�0.9 V vs. NHE)) and electron donor N,N-
diethylaniline (DEA, 0.88 V vs. NHE), with the observed Stern–
Volmer (insets of Fig. 19a and b) quenching constants (KSV ¼sF�kq) from linear regression of 18.2 M�1 and 20.1 M�1,
respectively. The results that the broad PL spectra of C-dots were
quenched highly efficiently by either electron acceptors or elec-
tron donors clearly confirm that C-dots are excellent as both
electron acceptors and electron donors.12 Based on such prop-
erties, they designed a C-dots/Ag/Ag3PO4 (C-dots: carbon
quantum dots) photocatalyst system, which exhibit high photo-
catalytic activity (see application part).
The photocatalytic behavior is solvent-dependent and is more
efficient in polar solvents, indicating an electron transfer
quenching mechanism. There are few studies about the photo-
induced electron transfer property of C-dots, and further work is
warranted to investigate the applications of C-dots in catalysis,
solar cells, and so on.
3.5. Enhancing PL
The major drawback limiting the application of C-dots in life
sciences is their relatively low QYs (often less than 10%). Thus,
the preparation of C-dots with high QYs is still a challenge.
Passivation and doping are popular approaches to enhance the
luminescence of C-dots. Several organic polymers and diamine
compounds have been used to passivate C-dots.56,58,78The QYs of
passivated C-dots can reach 20%,18 and even 60% upon purifica-
tion.86 C-dots doped with zinc salts can give high QYs of up to
50%.9 While both strategies can significantly improve the QYs of
C-dots, problems still exist. The modification processes are often
time-consuming and impractical on a large scale,17,57,58 and the
increased size of the modified C-dots restricts their further
application.31,57New strategies, besides passivation or doping, are
required to produce luminescent C-dots with high QY.
Zheng et al. offered a simple pathway to enhance the lumi-
nescence of C-dots.87 Blue luminescent reduced-state C-dots were
prepared by reducing C-dots with NaBH4. The QYs of the
reduced-state C-dots increased from 2% to 24% and the
maximum emission wavelength shifted from 520 to 450 nm
(Fig. 20).
Fig. 20 Graphical representation of the synthesis of reduced-stateC-dots
(also called CDs) with blue luminescence from original C-dots. Inset:
photographs of aqueous solutions of C-dots (left) and reduced C-dots
(right) recorded under UV light (360 nm) (reproduced from ref. 87).
J. Mater. Chem.
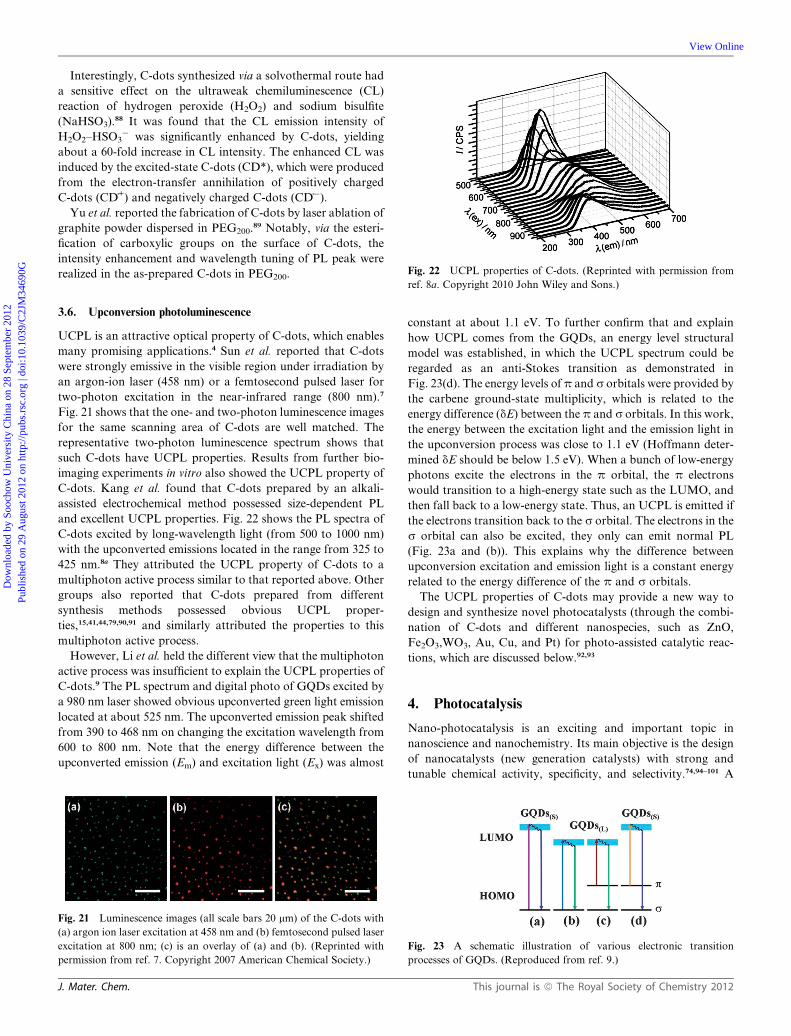
Fig. 22 UCPL properties of C-dots. (Reprinted with permission from
Dow
nloa
ded
by S
ooch
ow U
nive
rsity
Chi
na o
n 28
Sep
tem
ber
2012
Publ
ishe
d on
29
Aug
ust 2
012
on h
ttp://
pubs
.rsc
.org
| do
i:10.
1039
/C2J
M34
690G
View Online
Interestingly, C-dots synthesized via a solvothermal route had
a sensitive effect on the ultraweak chemiluminescence (CL)
reaction of hydrogen peroxide (H2O2) and sodium bisulfite
(NaHSO3).88 It was found that the CL emission intensity of
H2O2–HSO3� was significantly enhanced by C-dots, yielding
about a 60-fold increase in CL intensity. The enhanced CL was
induced by the excited-state C-dots (CD*), which were produced
from the electron-transfer annihilation of positively charged
C-dots (CD_+) and negatively charged C-dots (CD_�).Yu et al. reported the fabrication of C-dots by laser ablation of
graphite powder dispersed in PEG200.89 Notably, via the esteri-
fication of carboxylic groups on the surface of C-dots, the
intensity enhancement and wavelength tuning of PL peak were
realized in the as-prepared C-dots in PEG200.
ref. 8a. Copyright 2010 John Wiley and Sons.)3.6. Upconversion photoluminescence
UCPL is an attractive optical property of C-dots, which enables
many promising applications.4 Sun et al. reported that C-dots
were strongly emissive in the visible region under irradiation by
an argon-ion laser (458 nm) or a femtosecond pulsed laser for
two-photon excitation in the near-infrared range (800 nm).7
Fig. 21 shows that the one- and two-photon luminescence images
for the same scanning area of C-dots are well matched. The
representative two-photon luminescence spectrum shows that
such C-dots have UCPL properties. Results from further bio-
imaging experiments in vitro also showed the UCPL property of
C-dots. Kang et al. found that C-dots prepared by an alkali-
assisted electrochemical method possessed size-dependent PL
and excellent UCPL properties. Fig. 22 shows the PL spectra of
C-dots excited by long-wavelength light (from 500 to 1000 nm)
with the upconverted emissions located in the range from 325 to
425 nm.8a They attributed the UCPL property of C-dots to a
multiphoton active process similar to that reported above. Other
groups also reported that C-dots prepared from different
synthesis methods possessed obvious UCPL proper-
ties,15,41,44,79,90,91 and similarly attributed the properties to this
multiphoton active process.
However, Li et al. held the different view that the multiphoton
active process was insufficient to explain the UCPL properties of
C-dots.9 The PL spectrum and digital photo of GQDs excited by
a 980 nm laser showed obvious upconverted green light emission
located at about 525 nm. The upconverted emission peak shifted
from 390 to 468 nm on changing the excitation wavelength from
600 to 800 nm. Note that the energy difference between the
upconverted emission (Em) and excitation light (Ex) was almost
Fig. 21 Luminescence images (all scale bars 20 mm) of the C-dots with
(a) argon ion laser excitation at 458 nm and (b) femtosecond pulsed laser
excitation at 800 nm; (c) is an overlay of (a) and (b). (Reprinted with
permission from ref. 7. Copyright 2007 American Chemical Society.)
J. Mater. Chem.
constant at about 1.1 eV. To further confirm that and explain
how UCPL comes from the GQDs, an energy level structural
model was established, in which the UCPL spectrum could be
regarded as an anti-Stokes transition as demonstrated in
Fig. 23(d). The energy levels ofp and s orbitals were provided by
the carbene ground-state multiplicity, which is related to the
energy difference (dE) between the p and s orbitals. In this work,
the energy between the excitation light and the emission light in
the upconversion process was close to 1.1 eV (Hoffmann deter-
mined dE should be below 1.5 eV). When a bunch of low-energy
photons excite the electrons in the p orbital, the p electrons
would transition to a high-energy state such as the LUMO, and
then fall back to a low-energy state. Thus, an UCPL is emitted if
the electrons transition back to the s orbital. The electrons in the
s orbital can also be excited, they only can emit normal PL
(Fig. 23a and (b)). This explains why the difference between
upconversion excitation and emission light is a constant energy
related to the energy difference of the p and s orbitals.
The UCPL properties of C-dots may provide a new way to
design and synthesize novel photocatalysts (through the combi-
nation of C-dots and different nanospecies, such as ZnO,
Fe2O3,WO3, Au, Cu, and Pt) for photo-assisted catalytic reac-
tions, which are discussed below.92,93
4. Photocatalysis
Nano-photocatalysis is an exciting and important topic in
nanoscience and nanochemistry. Its main objective is the design
of nanocatalysts (new generation catalysts) with strong and
tunable chemical activity, specificity, and selectivity.74,94–101 A
Fig. 23 A schematic illustration of various electronic transition
processes of GQDs. (Reproduced from ref. 9.)
This journal is ª The Royal Society of Chemistry 2012
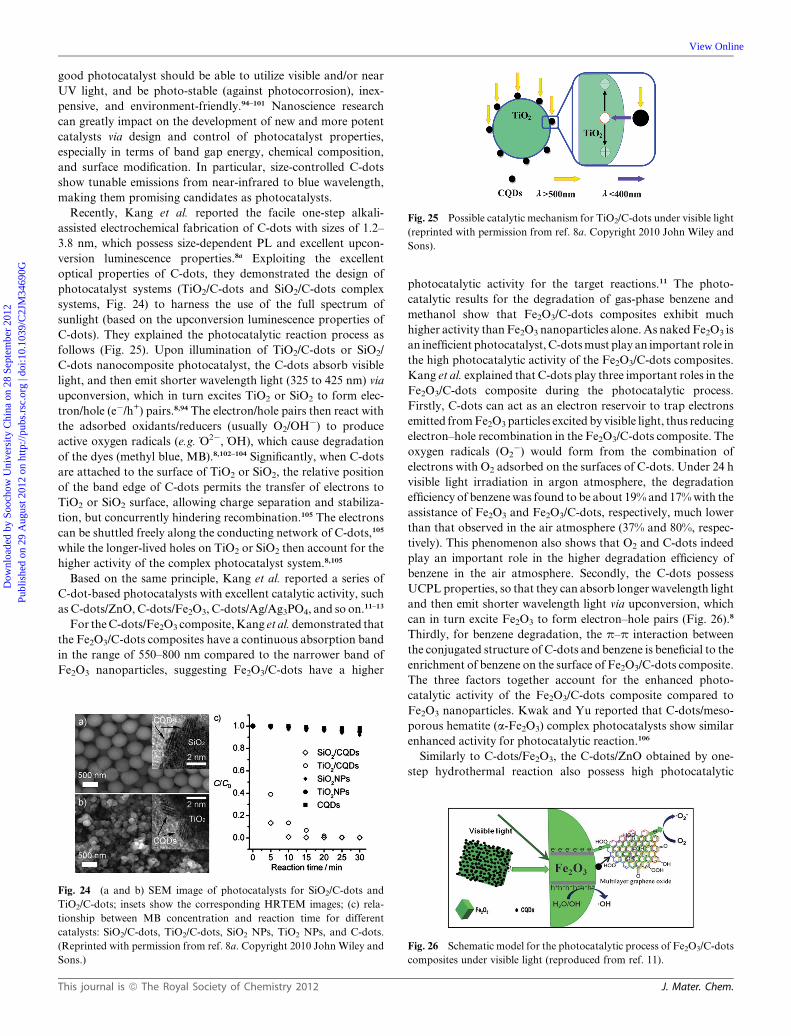
Fig. 25 Possible catalytic mechanism for TiO2/C-dots under visible light
(reprinted with permission from ref. 8a. Copyright 2010 John Wiley and
Sons).
Dow
nloa
ded
by S
ooch
ow U
nive
rsity
Chi
na o
n 28
Sep
tem
ber
2012
Publ
ishe
d on
29
Aug
ust 2
012
on h
ttp://
pubs
.rsc
.org
| do
i:10.
1039
/C2J
M34
690G
View Online
good photocatalyst should be able to utilize visible and/or near
UV light, and be photo-stable (against photocorrosion), inex-
pensive, and environment-friendly.94–101 Nanoscience research
can greatly impact on the development of new and more potent
catalysts via design and control of photocatalyst properties,
especially in terms of band gap energy, chemical composition,
and surface modification. In particular, size-controlled C-dots
show tunable emissions from near-infrared to blue wavelength,
making them promising candidates as photocatalysts.
Recently, Kang et al. reported the facile one-step alkali-
assisted electrochemical fabrication of C-dots with sizes of 1.2–
3.8 nm, which possess size-dependent PL and excellent upcon-
version luminescence properties.8a Exploiting the excellent
optical properties of C-dots, they demonstrated the design of
photocatalyst systems (TiO2/C-dots and SiO2/C-dots complex
systems, Fig. 24) to harness the use of the full spectrum of
sunlight (based on the upconversion luminescence properties of
C-dots). They explained the photocatalytic reaction process as
follows (Fig. 25). Upon illumination of TiO2/C-dots or SiO2/
C-dots nanocomposite photocatalyst, the C-dots absorb visible
light, and then emit shorter wavelength light (325 to 425 nm) via
upconversion, which in turn excites TiO2 or SiO2 to form elec-
tron/hole (e�/h+) pairs.8,94 The electron/hole pairs then react with
the adsorbed oxidants/reducers (usually O2/OH�) to produce
active oxygen radicals (e.g. _O2�, _OH), which cause degradation
of the dyes (methyl blue, MB).8,102–104 Significantly, when C-dots
are attached to the surface of TiO2 or SiO2, the relative position
of the band edge of C-dots permits the transfer of electrons to
TiO2 or SiO2 surface, allowing charge separation and stabiliza-
tion, but concurrently hindering recombination.105 The electrons
can be shuttled freely along the conducting network of C-dots,105
while the longer-lived holes on TiO2 or SiO2 then account for the
higher activity of the complex photocatalyst system.8,105
Based on the same principle, Kang et al. reported a series of
C-dot-based photocatalysts with excellent catalytic activity, such
as C-dots/ZnO, C-dots/Fe2O3, C-dots/Ag/Ag3PO4, and so on.11–13
For theC-dots/Fe2O3 composite,Kang et al.demonstrated that
the Fe2O3/C-dots composites have a continuous absorption band
in the range of 550–800 nm compared to the narrower band of
Fe2O3 nanoparticles, suggesting Fe2O3/C-dots have a higher
Fig. 24 (a and b) SEM image of photocatalysts for SiO2/C-dots and
TiO2/C-dots; insets show the corresponding HRTEM images; (c) rela-
tionship between MB concentration and reaction time for different
catalysts: SiO2/C-dots, TiO2/C-dots, SiO2 NPs, TiO2 NPs, and C-dots.
(Reprinted with permission from ref. 8a. Copyright 2010 John Wiley and
Sons.)
This journal is ª The Royal Society of Chemistry 2012
photocatalytic activity for the target reactions.11 The photo-
catalytic results for the degradation of gas-phase benzene and
methanol show that Fe2O3/C-dots composites exhibit much
higher activity thanFe2O3 nanoparticles alone. As nakedFe2O3 is
an inefficient photocatalyst, C-dotsmust play an important role in
the high photocatalytic activity of the Fe2O3/C-dots composites.
Kang et al. explained that C-dots play three important roles in the
Fe2O3/C-dots composite during the photocatalytic process.
Firstly, C-dots can act as an electron reservoir to trap electrons
emitted fromFe2O3particles excited by visible light, thus reducing
electron–hole recombination in the Fe2O3/C-dots composite. The
oxygen radicals (O2�) would form from the combination of
electrons with O2 adsorbed on the surfaces of C-dots. Under 24 h
visible light irradiation in argon atmosphere, the degradation
efficiency of benzene was found to be about 19% and 17%with the
assistance of Fe2O3 and Fe2O3/C-dots, respectively, much lower
than that observed in the air atmosphere (37% and 80%, respec-
tively). This phenomenon also shows that O2 and C-dots indeed
play an important role in the higher degradation efficiency of
benzene in the air atmosphere. Secondly, the C-dots possess
UCPL properties, so that they can absorb longer wavelength light
and then emit shorter wavelength light via upconversion, which
can in turn excite Fe2O3 to form electron–hole pairs (Fig. 26).8
Thirdly, for benzene degradation, the p–p interaction between
the conjugated structure of C-dots and benzene is beneficial to the
enrichment of benzene on the surface of Fe2O3/C-dots composite.
The three factors together account for the enhanced photo-
catalytic activity of the Fe2O3/C-dots composite compared to
Fe2O3 nanoparticles. Kwak and Yu reported that C-dots/meso-
porous hematite (a-Fe2O3) complex photocatalysts show similar
enhanced activity for photocatalytic reaction.106
Similarly to C-dots/Fe2O3, the C-dots/ZnO obtained by one-
step hydrothermal reaction also possess high photocatalytic
Fig. 26 Schematic model for the photocatalytic process of Fe2O3/C-dots
composites under visible light (reproduced from ref. 11).
J. Mater. Chem.
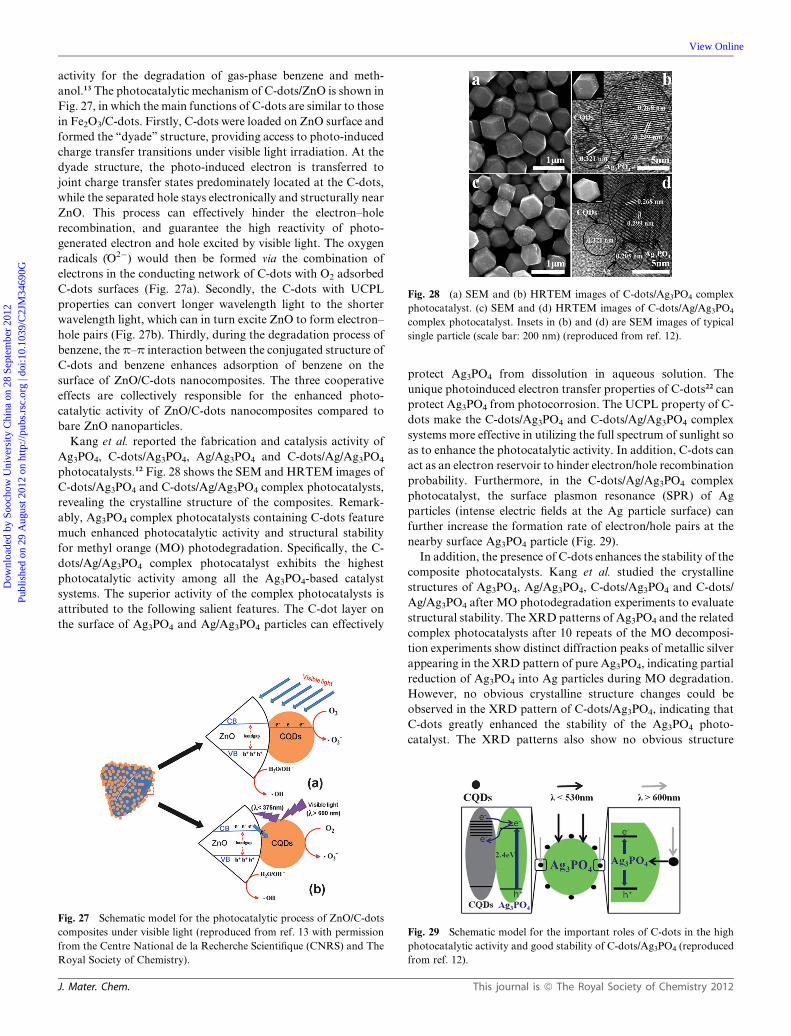
Fig. 28 (a) SEM and (b) HRTEM images of C-dots/Ag3PO4 complex
photocatalyst. (c) SEM and (d) HRTEM images of C-dots/Ag/Ag3PO4
complex photocatalyst. Insets in (b) and (d) are SEM images of typical
single particle (scale bar: 200 nm) (reproduced from ref. 12).
Dow
nloa
ded
by S
ooch
ow U
nive
rsity
Chi
na o
n 28
Sep
tem
ber
2012
Publ
ishe
d on
29
Aug
ust 2
012
on h
ttp://
pubs
.rsc
.org
| do
i:10.
1039
/C2J
M34
690G
View Online
activity for the degradation of gas-phase benzene and meth-
anol.13 The photocatalytic mechanism of C-dots/ZnO is shown in
Fig. 27, in which the main functions of C-dots are similar to those
in Fe2O3/C-dots. Firstly, C-dots were loaded on ZnO surface and
formed the ‘‘dyade’’ structure, providing access to photo-induced
charge transfer transitions under visible light irradiation. At the
dyade structure, the photo-induced electron is transferred to
joint charge transfer states predominately located at the C-dots,
while the separated hole stays electronically and structurally near
ZnO. This process can effectively hinder the electron–hole
recombination, and guarantee the high reactivity of photo-
generated electron and hole excited by visible light. The oxygen
radicals (_O2�) would then be formed via the combination of
electrons in the conducting network of C-dots with O2 adsorbed
C-dots surfaces (Fig. 27a). Secondly, the C-dots with UCPL
properties can convert longer wavelength light to the shorter
wavelength light, which can in turn excite ZnO to form electron–
hole pairs (Fig. 27b). Thirdly, during the degradation process of
benzene, the p–p interaction between the conjugated structure of
C-dots and benzene enhances adsorption of benzene on the
surface of ZnO/C-dots nanocomposites. The three cooperative
effects are collectively responsible for the enhanced photo-
catalytic activity of ZnO/C-dots nanocomposites compared to
bare ZnO nanoparticles.
Kang et al. reported the fabrication and catalysis activity of
Ag3PO4, C-dots/Ag3PO4, Ag/Ag3PO4 and C-dots/Ag/Ag3PO4
photocatalysts.12 Fig. 28 shows the SEM and HRTEM images of
C-dots/Ag3PO4 and C-dots/Ag/Ag3PO4 complex photocatalysts,
revealing the crystalline structure of the composites. Remark-
ably, Ag3PO4 complex photocatalysts containing C-dots feature
much enhanced photocatalytic activity and structural stability
for methyl orange (MO) photodegradation. Specifically, the C-
dots/Ag/Ag3PO4 complex photocatalyst exhibits the highest
photocatalytic activity among all the Ag3PO4-based catalyst
systems. The superior activity of the complex photocatalysts is
attributed to the following salient features. The C-dot layer on
the surface of Ag3PO4 and Ag/Ag3PO4 particles can effectively
Fig. 27 Schematic model for the photocatalytic process of ZnO/C-dots
composites under visible light (reproduced from ref. 13 with permission
from the Centre National de la Recherche Scientifique (CNRS) and The
Royal Society of Chemistry).
J. Mater. Chem.
protect Ag3PO4 from dissolution in aqueous solution. The
unique photoinduced electron transfer properties of C-dots22 can
protect Ag3PO4 from photocorrosion. The UCPL property of C-
dots make the C-dots/Ag3PO4 and C-dots/Ag/Ag3PO4 complex
systems more effective in utilizing the full spectrum of sunlight so
as to enhance the photocatalytic activity. In addition, C-dots can
act as an electron reservoir to hinder electron/hole recombination
probability. Furthermore, in the C-dots/Ag/Ag3PO4 complex
photocatalyst, the surface plasmon resonance (SPR) of Ag
particles (intense electric fields at the Ag particle surface) can
further increase the formation rate of electron/hole pairs at the
nearby surface Ag3PO4 particle (Fig. 29).
In addition, the presence of C-dots enhances the stability of the
composite photocatalysts. Kang et al. studied the crystalline
structures of Ag3PO4, Ag/Ag3PO4, C-dots/Ag3PO4 and C-dots/
Ag/Ag3PO4 after MO photodegradation experiments to evaluate
structural stability. The XRD patterns of Ag3PO4 and the related
complex photocatalysts after 10 repeats of the MO decomposi-
tion experiments show distinct diffraction peaks of metallic silver
appearing in the XRD pattern of pure Ag3PO4, indicating partial
reduction of Ag3PO4 into Ag particles during MO degradation.
However, no obvious crystalline structure changes could be
observed in the XRD pattern of C-dots/Ag3PO4, indicating that
C-dots greatly enhanced the stability of the Ag3PO4 photo-
catalyst. The XRD patterns also show no obvious structure
Fig. 29 Schematic model for the important roles of C-dots in the high
photocatalytic activity and good stability of C-dots/Ag3PO4 (reproduced
from ref. 12).
This journal is ª The Royal Society of Chemistry 2012
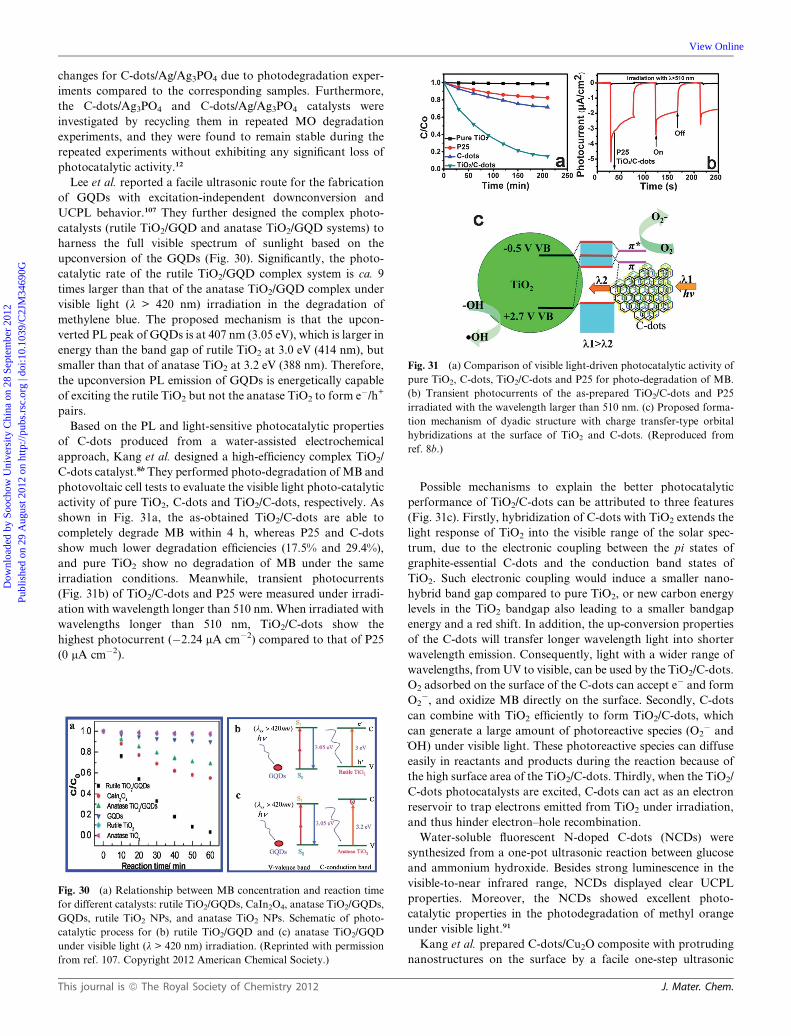
Fig. 31 (a) Comparison of visible light-driven photocatalytic activity of
pure TiO2, C-dots, TiO2/C-dots and P25 for photo-degradation of MB.
(b) Transient photocurrents of the as-prepared TiO2/C-dots and P25
irradiated with the wavelength larger than 510 nm. (c) Proposed forma-
tion mechanism of dyadic structure with charge transfer-type orbital
hybridizations at the surface of TiO2 and C-dots. (Reproduced from
ref. 8b.)
Dow
nloa
ded
by S
ooch
ow U
nive
rsity
Chi
na o
n 28
Sep
tem
ber
2012
Publ
ishe
d on
29
Aug
ust 2
012
on h
ttp://
pubs
.rsc
.org
| do
i:10.
1039
/C2J
M34
690G
View Online
changes for C-dots/Ag/Ag3PO4 due to photodegradation exper-
iments compared to the corresponding samples. Furthermore,
the C-dots/Ag3PO4 and C-dots/Ag/Ag3PO4 catalysts were
investigated by recycling them in repeated MO degradation
experiments, and they were found to remain stable during the
repeated experiments without exhibiting any significant loss of
photocatalytic activity.12
Lee et al. reported a facile ultrasonic route for the fabrication
of GQDs with excitation-independent downconversion and
UCPL behavior.107 They further designed the complex photo-
catalysts (rutile TiO2/GQD and anatase TiO2/GQD systems) to
harness the full visible spectrum of sunlight based on the
upconversion of the GQDs (Fig. 30). Significantly, the photo-
catalytic rate of the rutile TiO2/GQD complex system is ca. 9
times larger than that of the anatase TiO2/GQD complex under
visible light (l > 420 nm) irradiation in the degradation of
methylene blue. The proposed mechanism is that the upcon-
verted PL peak of GQDs is at 407 nm (3.05 eV), which is larger in
energy than the band gap of rutile TiO2 at 3.0 eV (414 nm), but
smaller than that of anatase TiO2 at 3.2 eV (388 nm). Therefore,
the upconversion PL emission of GQDs is energetically capable
of exciting the rutile TiO2 but not the anatase TiO2 to form e�/h+
pairs.
Based on the PL and light-sensitive photocatalytic properties
of C-dots produced from a water-assisted electrochemical
approach, Kang et al. designed a high-efficiency complex TiO2/
C-dots catalyst.8b They performed photo-degradation of MB and
photovoltaic cell tests to evaluate the visible light photo-catalytic
activity of pure TiO2, C-dots and TiO2/C-dots, respectively. As
shown in Fig. 31a, the as-obtained TiO2/C-dots are able to
completely degrade MB within 4 h, whereas P25 and C-dots
show much lower degradation efficiencies (17.5% and 29.4%),
and pure TiO2 show no degradation of MB under the same
irradiation conditions. Meanwhile, transient photocurrents
(Fig. 31b) of TiO2/C-dots and P25 were measured under irradi-
ation with wavelength longer than 510 nm. When irradiated with
wavelengths longer than 510 nm, TiO2/C-dots show the
highest photocurrent (�2.24 mA cm�2) compared to that of P25
(0 mA cm�2).
Fig. 30 (a) Relationship between MB concentration and reaction time
for different catalysts: rutile TiO2/GQDs, CaIn2O4, anatase TiO2/GQDs,
GQDs, rutile TiO2 NPs, and anatase TiO2 NPs. Schematic of photo-
catalytic process for (b) rutile TiO2/GQD and (c) anatase TiO2/GQD
under visible light (l > 420 nm) irradiation. (Reprinted with permission
from ref. 107. Copyright 2012 American Chemical Society.)
This journal is ª The Royal Society of Chemistry 2012
Possible mechanisms to explain the better photocatalytic
performance of TiO2/C-dots can be attributed to three features
(Fig. 31c). Firstly, hybridization of C-dots with TiO2 extends the
light response of TiO2 into the visible range of the solar spec-
trum, due to the electronic coupling between the pi states of
graphite-essential C-dots and the conduction band states of
TiO2. Such electronic coupling would induce a smaller nano-
hybrid band gap compared to pure TiO2, or new carbon energy
levels in the TiO2 bandgap also leading to a smaller bandgap
energy and a red shift. In addition, the up-conversion properties
of the C-dots will transfer longer wavelength light into shorter
wavelength emission. Consequently, light with a wider range of
wavelengths, fromUV to visible, can be used by the TiO2/C-dots.
O2 adsorbed on the surface of the C-dots can accept e� and form
O2�, and oxidize MB directly on the surface. Secondly, C-dots
can combine with TiO2 efficiently to form TiO2/C-dots, which
can generate a large amount of photoreactive species (O2� and
_OH) under visible light. These photoreactive species can diffuse
easily in reactants and products during the reaction because of
the high surface area of the TiO2/C-dots. Thirdly, when the TiO2/
C-dots photocatalysts are excited, C-dots can act as an electron
reservoir to trap electrons emitted from TiO2 under irradiation,
and thus hinder electron–hole recombination.
Water-soluble fluorescent N-doped C-dots (NCDs) were
synthesized from a one-pot ultrasonic reaction between glucose
and ammonium hydroxide. Besides strong luminescence in the
visible-to-near infrared range, NCDs displayed clear UCPL
properties. Moreover, the NCDs showed excellent photo-
catalytic properties in the photodegradation of methyl orange
under visible light.91
Kang et al. prepared C-dots/Cu2O composite with protruding
nanostructures on the surface by a facile one-step ultrasonic
J. Mater. Chem.
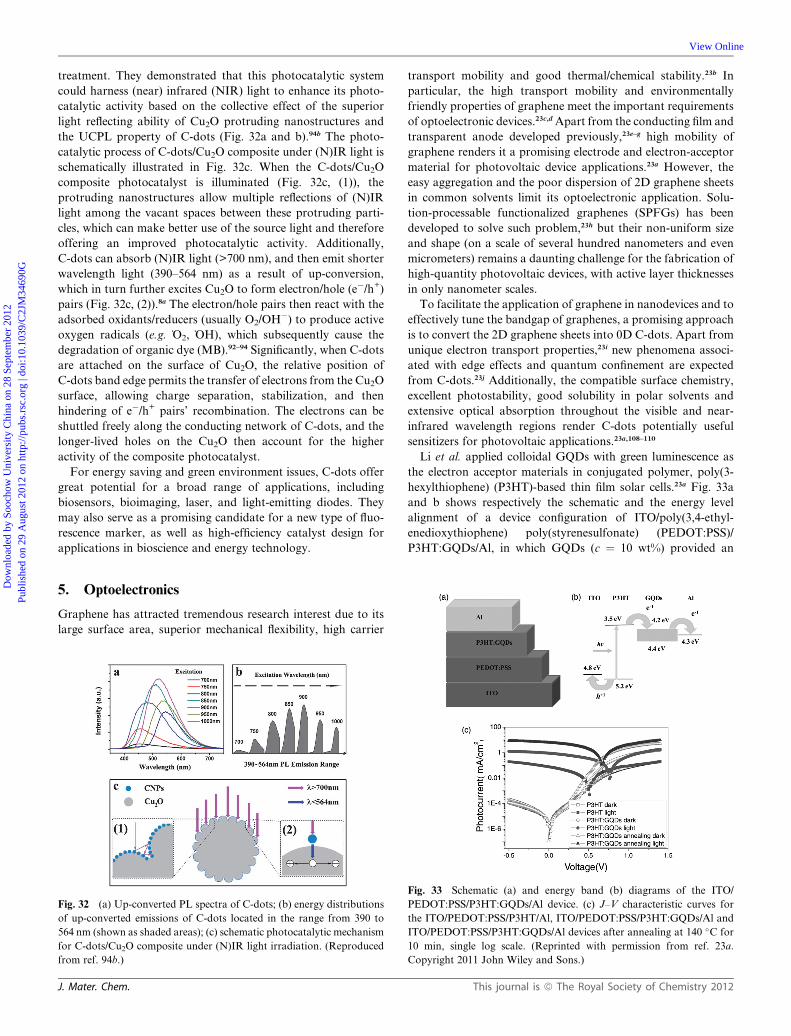
Dow
nloa
ded
by S
ooch
ow U
nive
rsity
Chi
na o
n 28
Sep
tem
ber
2012
Publ
ishe
d on
29
Aug
ust 2
012
on h
ttp://
pubs
.rsc
.org
| do
i:10.
1039
/C2J
M34
690G
View Online
treatment. They demonstrated that this photocatalytic system
could harness (near) infrared (NIR) light to enhance its photo-
catalytic activity based on the collective effect of the superior
light reflecting ability of Cu2O protruding nanostructures and
the UCPL property of C-dots (Fig. 32a and b).94b The photo-
catalytic process of C-dots/Cu2O composite under (N)IR light is
schematically illustrated in Fig. 32c. When the C-dots/Cu2O
composite photocatalyst is illuminated (Fig. 32c, (1)), the
protruding nanostructures allow multiple reflections of (N)IR
light among the vacant spaces between these protruding parti-
cles, which can make better use of the source light and therefore
offering an improved photocatalytic activity. Additionally,
C-dots can absorb (N)IR light (>700 nm), and then emit shorter
wavelength light (390–564 nm) as a result of up-conversion,
which in turn further excites Cu2O to form electron/hole (e�/h+)pairs (Fig. 32c, (2)).8a The electron/hole pairs then react with the
adsorbed oxidants/reducers (usually O2/OH�) to produce active
oxygen radicals (e.g. _O2, _OH), which subsequently cause the
degradation of organic dye (MB).92–94 Significantly, when C-dots
are attached on the surface of Cu2O, the relative position of
C-dots band edge permits the transfer of electrons from the Cu2O
surface, allowing charge separation, stabilization, and then
hindering of e�/h+ pairs’ recombination. The electrons can be
shuttled freely along the conducting network of C-dots, and the
longer-lived holes on the Cu2O then account for the higher
activity of the composite photocatalyst.
For energy saving and green environment issues, C-dots offer
great potential for a broad range of applications, including
biosensors, bioimaging, laser, and light-emitting diodes. They
may also serve as a promising candidate for a new type of fluo-
rescence marker, as well as high-efficiency catalyst design for
applications in bioscience and energy technology.
5. Optoelectronics
Graphene has attracted tremendous research interest due to its
large surface area, superior mechanical flexibility, high carrier
Fig. 32 (a) Up-converted PL spectra of C-dots; (b) energy distributions
of up-converted emissions of C-dots located in the range from 390 to
564 nm (shown as shaded areas); (c) schematic photocatalytic mechanism
for C-dots/Cu2O composite under (N)IR light irradiation. (Reproduced
from ref. 94b.)
J. Mater. Chem.
transport mobility and good thermal/chemical stability.23b In
particular, the high transport mobility and environmentally
friendly properties of graphene meet the important requirements
of optoelectronic devices.23c,d Apart from the conducting film and
transparent anode developed previously,23e–g high mobility of
graphene renders it a promising electrode and electron-acceptor
material for photovoltaic device applications.23a However, the
easy aggregation and the poor dispersion of 2D graphene sheets
in common solvents limit its optoelectronic application. Solu-
tion-processable functionalized graphenes (SPFGs) has been
developed to solve such problem,23h but their non-uniform size
and shape (on a scale of several hundred nanometers and even
micrometers) remains a daunting challenge for the fabrication of
high-quantity photovoltaic devices, with active layer thicknesses
in only nanometer scales.
To facilitate the application of graphene in nanodevices and to
effectively tune the bandgap of graphenes, a promising approach
is to convert the 2D graphene sheets into 0D C-dots. Apart from
unique electron transport properties,23i new phenomena associ-
ated with edge effects and quantum confinement are expected
from C-dots.23j Additionally, the compatible surface chemistry,
excellent photostability, good solubility in polar solvents and
extensive optical absorption throughout the visible and near-
infrared wavelength regions render C-dots potentially useful
sensitizers for photovoltaic applications.23a,108–110
Li et al. applied colloidal GQDs with green luminescence as
the electron acceptor materials in conjugated polymer, poly(3-
hexylthiophene) (P3HT)-based thin film solar cells.23a Fig. 33a
and b shows respectively the schematic and the energy level
alignment of a device configuration of ITO/poly(3,4-ethyl-
enedioxythiophene) poly(styrenesulfonate) (PEDOT:PSS)/
P3HT:GQDs/Al, in which GQDs (c ¼ 10 wt%) provided an
Fig. 33 Schematic (a) and energy band (b) diagrams of the ITO/
PEDOT:PSS/P3HT:GQDs/Al device. (c) J–V characteristic curves for
the ITO/PEDOT:PSS/P3HT/Al, ITO/PEDOT:PSS/P3HT:GQDs/Al and
ITO/PEDOT:PSS/P3HT:GQDs/Al devices after annealing at 140 �C for
10 min, single log scale. (Reprinted with permission from ref. 23a.
Copyright 2011 John Wiley and Sons.)
This journal is ª The Royal Society of Chemistry 2012
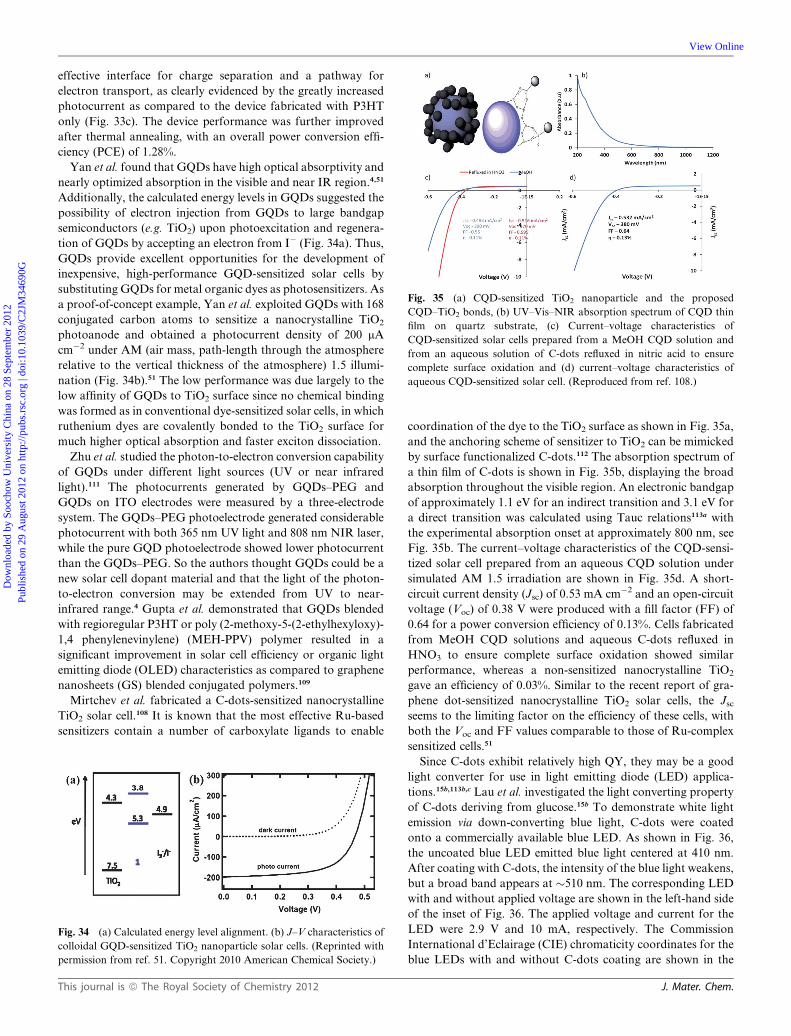
Fig. 35 (a) CQD-sensitized TiO2 nanoparticle and the proposed
CQD–TiO2 bonds, (b) UV–Vis–NIR absorption spectrum of CQD thin
film on quartz substrate, (c) Current–voltage characteristics of
CQD-sensitized solar cells prepared from a MeOH CQD solution and
from an aqueous solution of C-dots refluxed in nitric acid to ensure
complete surface oxidation and (d) current–voltage characteristics of
aqueous CQD-sensitized solar cell. (Reproduced from ref. 108.)
Dow
nloa
ded
by S
ooch
ow U
nive
rsity
Chi
na o
n 28
Sep
tem
ber
2012
Publ
ishe
d on
29
Aug
ust 2
012
on h
ttp://
pubs
.rsc
.org
| do
i:10.
1039
/C2J
M34
690G
View Online
effective interface for charge separation and a pathway for
electron transport, as clearly evidenced by the greatly increased
photocurrent as compared to the device fabricated with P3HT
only (Fig. 33c). The device performance was further improved
after thermal annealing, with an overall power conversion effi-
ciency (PCE) of 1.28%.
Yan et al. found that GQDs have high optical absorptivity and
nearly optimized absorption in the visible and near IR region.4,51
Additionally, the calculated energy levels in GQDs suggested the
possibility of electron injection from GQDs to large bandgap
semiconductors (e.g. TiO2) upon photoexcitation and regenera-
tion of GQDs by accepting an electron from I� (Fig. 34a). Thus,
GQDs provide excellent opportunities for the development of
inexpensive, high-performance GQD-sensitized solar cells by
substituting GQDs for metal organic dyes as photosensitizers. As
a proof-of-concept example, Yan et al. exploited GQDs with 168
conjugated carbon atoms to sensitize a nanocrystalline TiO2
photoanode and obtained a photocurrent density of 200 mA
cm�2 under AM (air mass, path-length through the atmosphere
relative to the vertical thickness of the atmosphere) 1.5 illumi-
nation (Fig. 34b).51 The low performance was due largely to the
low affinity of GQDs to TiO2 surface since no chemical binding
was formed as in conventional dye-sensitized solar cells, in which
ruthenium dyes are covalently bonded to the TiO2 surface for
much higher optical absorption and faster exciton dissociation.
Zhu et al. studied the photon-to-electron conversion capability
of GQDs under different light sources (UV or near infrared
light).111 The photocurrents generated by GQDs–PEG and
GQDs on ITO electrodes were measured by a three-electrode
system. The GQDs–PEG photoelectrode generated considerable
photocurrent with both 365 nm UV light and 808 nm NIR laser,
while the pure GQD photoelectrode showed lower photocurrent
than the GQDs–PEG. So the authors thought GQDs could be a
new solar cell dopant material and that the light of the photon-
to-electron conversion may be extended from UV to near-
infrared range.4 Gupta et al. demonstrated that GQDs blended
with regioregular P3HT or poly (2-methoxy-5-(2-ethylhexyloxy)-
1,4 phenylenevinylene) (MEH-PPV) polymer resulted in a
significant improvement in solar cell efficiency or organic light
emitting diode (OLED) characteristics as compared to graphene
nanosheets (GS) blended conjugated polymers.109
Mirtchev et al. fabricated a C-dots-sensitized nanocrystalline
TiO2 solar cell.108 It is known that the most effective Ru-based
sensitizers contain a number of carboxylate ligands to enable
Fig. 34 (a) Calculated energy level alignment. (b) J–V characteristics of
colloidal GQD-sensitized TiO2 nanoparticle solar cells. (Reprinted with
permission from ref. 51. Copyright 2010 American Chemical Society.)
This journal is ª The Royal Society of Chemistry 2012
coordination of the dye to the TiO2 surface as shown in Fig. 35a,
and the anchoring scheme of sensitizer to TiO2 can be mimicked
by surface functionalized C-dots.112 The absorption spectrum of
a thin film of C-dots is shown in Fig. 35b, displaying the broad
absorption throughout the visible region. An electronic bandgap
of approximately 1.1 eV for an indirect transition and 3.1 eV for
a direct transition was calculated using Tauc relations113a with
the experimental absorption onset at approximately 800 nm, see
Fig. 35b. The current–voltage characteristics of the CQD-sensi-
tized solar cell prepared from an aqueous CQD solution under
simulated AM 1.5 irradiation are shown in Fig. 35d. A short-
circuit current density (Jsc) of 0.53 mA cm�2 and an open-circuit
voltage (Voc) of 0.38 V were produced with a fill factor (FF) of
0.64 for a power conversion efficiency of 0.13%. Cells fabricated
from MeOH CQD solutions and aqueous C-dots refluxed in
HNO3 to ensure complete surface oxidation showed similar
performance, whereas a non-sensitized nanocrystalline TiO2
gave an efficiency of 0.03%. Similar to the recent report of gra-
phene dot-sensitized nanocrystalline TiO2 solar cells, the Jscseems to the limiting factor on the efficiency of these cells, with
both the Voc and FF values comparable to those of Ru-complex
sensitized cells.51
Since C-dots exhibit relatively high QY, they may be a good
light converter for use in light emitting diode (LED) applica-
tions.15b,113b,c Lau et al. investigated the light converting property
of C-dots deriving from glucose.15b To demonstrate white light
emission via down-converting blue light, C-dots were coated
onto a commercially available blue LED. As shown in Fig. 36,
the uncoated blue LED emitted blue light centered at 410 nm.
After coating with C-dots, the intensity of the blue light weakens,
but a broad band appears at �510 nm. The corresponding LED
with and without applied voltage are shown in the left-hand side
of the inset of Fig. 36. The applied voltage and current for the
LED were 2.9 V and 10 mA, respectively. The Commission
International d’Eclairage (CIE) chromaticity coordinates for the
blue LEDs with and without C-dots coating are shown in the
J. Mater. Chem.
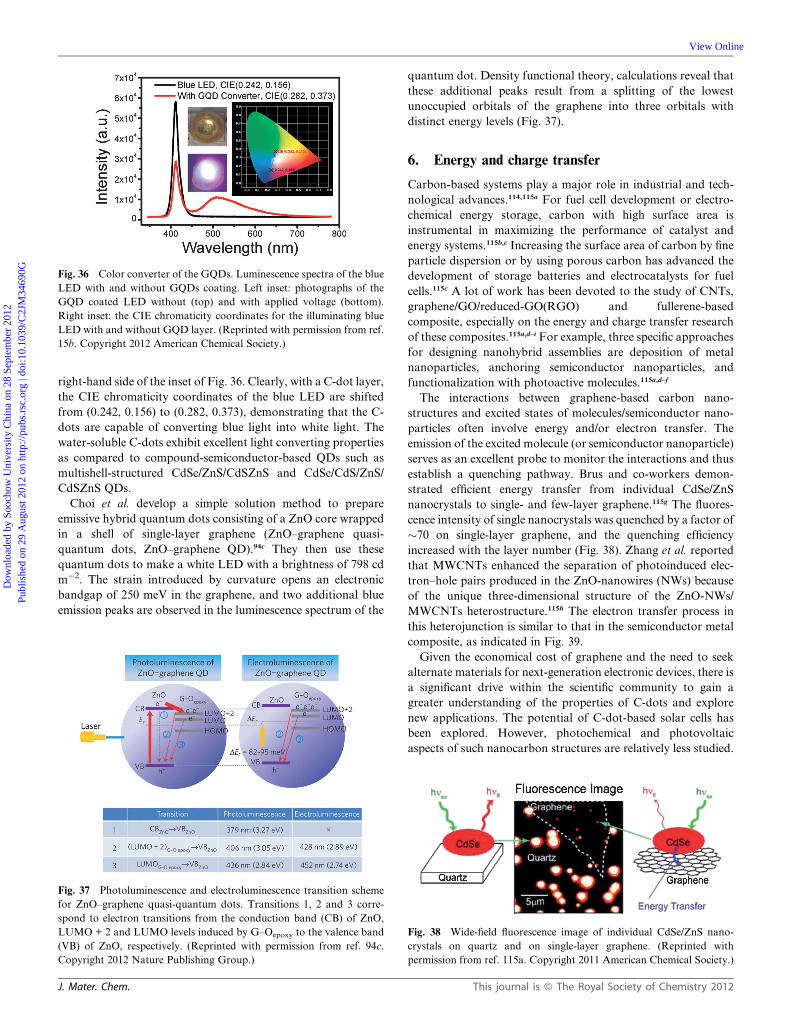
Fig. 36 Color converter of the GQDs. Luminescence spectra of the blue
LED with and without GQDs coating. Left inset: photographs of the
GQD coated LED without (top) and with applied voltage (bottom).
Right inset: the CIE chromaticity coordinates for the illuminating blue
LED with and without GQD layer. (Reprinted with permission from ref.
15b. Copyright 2012 American Chemical Society.)
Dow
nloa
ded
by S
ooch
ow U
nive
rsity
Chi
na o
n 28
Sep
tem
ber
2012
Publ
ishe
d on
29
Aug
ust 2
012
on h
ttp://
pubs
.rsc
.org
| do
i:10.
1039
/C2J
M34
690G
View Online
right-hand side of the inset of Fig. 36. Clearly, with a C-dot layer,
the CIE chromaticity coordinates of the blue LED are shifted
from (0.242, 0.156) to (0.282, 0.373), demonstrating that the C-
dots are capable of converting blue light into white light. The
water-soluble C-dots exhibit excellent light converting properties
as compared to compound-semiconductor-based QDs such as
multishell-structured CdSe/ZnS/CdSZnS and CdSe/CdS/ZnS/
CdSZnS QDs.
Choi et al. develop a simple solution method to prepare
emissive hybrid quantum dots consisting of a ZnO core wrapped
in a shell of single-layer graphene (ZnO–graphene quasi-
quantum dots, ZnO–graphene QD).94c They then use these
quantum dots to make a white LED with a brightness of 798 cd
m�2. The strain introduced by curvature opens an electronic
bandgap of 250 meV in the graphene, and two additional blue
emission peaks are observed in the luminescence spectrum of the
Fig. 37 Photoluminescence and electroluminescence transition scheme
for ZnO–graphene quasi-quantum dots. Transitions 1, 2 and 3 corre-
spond to electron transitions from the conduction band (CB) of ZnO,
LUMO + 2 and LUMO levels induced by G–Oepoxy to the valence band
(VB) of ZnO, respectively. (Reprinted with permission from ref. 94c.
Copyright 2012 Nature Publishing Group.)
J. Mater. Chem.
quantum dot. Density functional theory, calculations reveal that
these additional peaks result from a splitting of the lowest
unoccupied orbitals of the graphene into three orbitals with
distinct energy levels (Fig. 37).
6. Energy and charge transfer
Carbon-based systems play a major role in industrial and tech-
nological advances.114,115a For fuel cell development or electro-
chemical energy storage, carbon with high surface area is
instrumental in maximizing the performance of catalyst and
energy systems.115b,c Increasing the surface area of carbon by fine
particle dispersion or by using porous carbon has advanced the
development of storage batteries and electrocatalysts for fuel
cells.115c A lot of work has been devoted to the study of CNTs,
graphene/GO/reduced-GO(RGO) and fullerene-based
composite, especially on the energy and charge transfer research
of these composites.115a,d–i For example, three specific approaches
for designing nanohybrid assemblies are deposition of metal
nanoparticles, anchoring semiconductor nanoparticles, and
functionalization with photoactive molecules.115a,d–f
The interactions between graphene-based carbon nano-
structures and excited states of molecules/semiconductor nano-
particles often involve energy and/or electron transfer. The
emission of the excited molecule (or semiconductor nanoparticle)
serves as an excellent probe to monitor the interactions and thus
establish a quenching pathway. Brus and co-workers demon-
strated efficient energy transfer from individual CdSe/ZnS
nanocrystals to single- and few-layer graphene.115g The fluores-
cence intensity of single nanocrystals was quenched by a factor of
�70 on single-layer graphene, and the quenching efficiency
increased with the layer number (Fig. 38). Zhang et al. reported
that MWCNTs enhanced the separation of photoinduced elec-
tron–hole pairs produced in the ZnO-nanowires (NWs) because
of the unique three-dimensional structure of the ZnO-NWs/
MWCNTs heterostructure.115h The electron transfer process in
this heterojunction is similar to that in the semiconductor metal
composite, as indicated in Fig. 39.
Given the economical cost of graphene and the need to seek
alternate materials for next-generation electronic devices, there is
a significant drive within the scientific community to gain a
greater understanding of the properties of C-dots and explore
new applications. The potential of C-dot-based solar cells has
been explored. However, photochemical and photovoltaic
aspects of such nanocarbon structures are relatively less studied.
Fig. 38 Wide-field fluorescence image of individual CdSe/ZnS nano-
crystals on quartz and on single-layer graphene. (Reprinted with
permission from ref. 115a. Copyright 2011 American Chemical Society.)
This journal is ª The Royal Society of Chemistry 2012
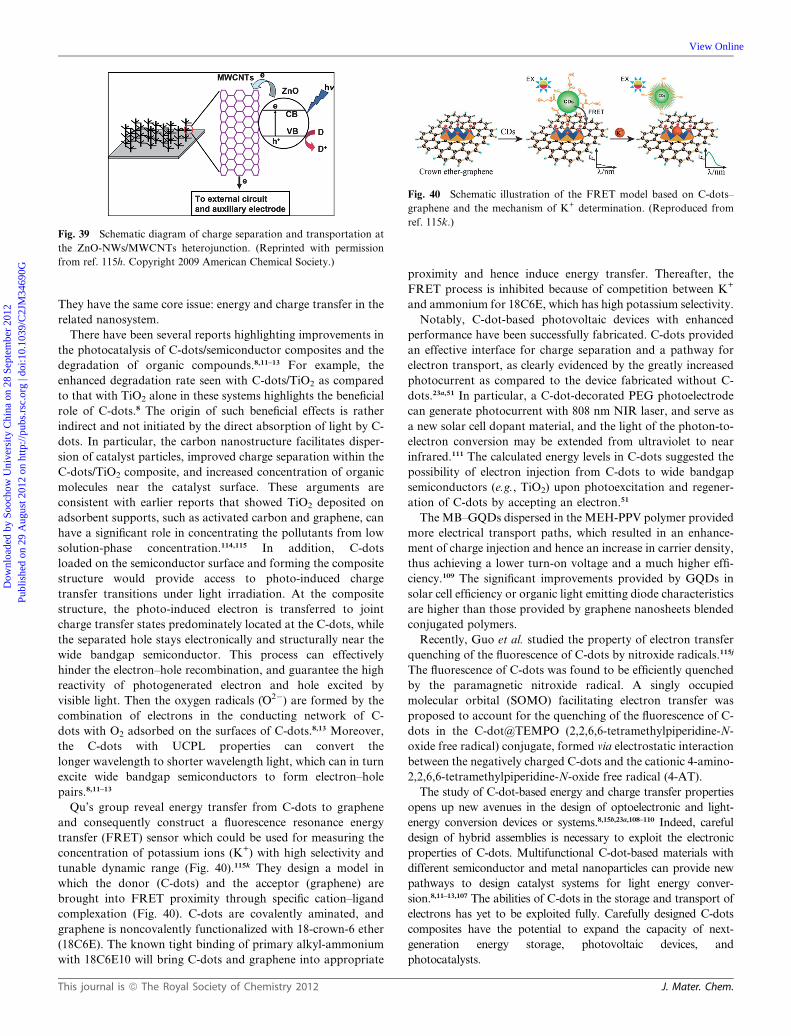
Fig. 39 Schematic diagram of charge separation and transportation at
the ZnO-NWs/MWCNTs heterojunction. (Reprinted with permission
from ref. 115h. Copyright 2009 American Chemical Society.)
Fig. 40 Schematic illustration of the FRET model based on C-dots–
graphene and the mechanism of K+ determination. (Reproduced from
ref. 115k.)
Dow
nloa
ded
by S
ooch
ow U
nive
rsity
Chi
na o
n 28
Sep
tem
ber
2012
Publ
ishe
d on
29
Aug
ust 2
012
on h
ttp://
pubs
.rsc
.org
| do
i:10.
1039
/C2J
M34
690G
View Online
They have the same core issue: energy and charge transfer in the
related nanosystem.
There have been several reports highlighting improvements in
the photocatalysis of C-dots/semiconductor composites and the
degradation of organic compounds.8,11–13 For example, the
enhanced degradation rate seen with C-dots/TiO2 as compared
to that with TiO2 alone in these systems highlights the beneficial
role of C-dots.8 The origin of such beneficial effects is rather
indirect and not initiated by the direct absorption of light by C-
dots. In particular, the carbon nanostructure facilitates disper-
sion of catalyst particles, improved charge separation within the
C-dots/TiO2 composite, and increased concentration of organic
molecules near the catalyst surface. These arguments are
consistent with earlier reports that showed TiO2 deposited on
adsorbent supports, such as activated carbon and graphene, can
have a significant role in concentrating the pollutants from low
solution-phase concentration.114,115 In addition, C-dots
loaded on the semiconductor surface and forming the composite
structure would provide access to photo-induced charge
transfer transitions under light irradiation. At the composite
structure, the photo-induced electron is transferred to joint
charge transfer states predominately located at the C-dots, while
the separated hole stays electronically and structurally near the
wide bandgap semiconductor. This process can effectively
hinder the electron–hole recombination, and guarantee the high
reactivity of photogenerated electron and hole excited by
visible light. Then the oxygen radicals (_O2�) are formed by the
combination of electrons in the conducting network of C-
dots with O2 adsorbed on the surfaces of C-dots.8,13 Moreover,
the C-dots with UCPL properties can convert the
longer wavelength to shorter wavelength light, which can in turn
excite wide bandgap semiconductors to form electron–hole
pairs.8,11–13
Qu’s group reveal energy transfer from C-dots to graphene
and consequently construct a fluorescence resonance energy
transfer (FRET) sensor which could be used for measuring the
concentration of potassium ions (K+) with high selectivity and
tunable dynamic range (Fig. 40).115k They design a model in
which the donor (C-dots) and the acceptor (graphene) are
brought into FRET proximity through specific cation–ligand
complexation (Fig. 40). C-dots are covalently aminated, and
graphene is noncovalently functionalized with 18-crown-6 ether
(18C6E). The known tight binding of primary alkyl-ammonium
with 18C6E10 will bring C-dots and graphene into appropriate
This journal is ª The Royal Society of Chemistry 2012
proximity and hence induce energy transfer. Thereafter, the
FRET process is inhibited because of competition between K+
and ammonium for 18C6E, which has high potassium selectivity.
Notably, C-dot-based photovoltaic devices with enhanced
performance have been successfully fabricated. C-dots provided
an effective interface for charge separation and a pathway for
electron transport, as clearly evidenced by the greatly increased
photocurrent as compared to the device fabricated without C-
dots.23a,51 In particular, a C-dot-decorated PEG photoelectrode
can generate photocurrent with 808 nm NIR laser, and serve as
a new solar cell dopant material, and the light of the photon-to-
electron conversion may be extended from ultraviolet to near
infrared.111 The calculated energy levels in C-dots suggested the
possibility of electron injection from C-dots to wide bandgap
semiconductors (e.g., TiO2) upon photoexcitation and regener-
ation of C-dots by accepting an electron.51
TheMB–GQDs dispersed in the MEH-PPV polymer provided
more electrical transport paths, which resulted in an enhance-
ment of charge injection and hence an increase in carrier density,
thus achieving a lower turn-on voltage and a much higher effi-
ciency.109 The significant improvements provided by GQDs in
solar cell efficiency or organic light emitting diode characteristics
are higher than those provided by graphene nanosheets blended
conjugated polymers.
Recently, Guo et al. studied the property of electron transfer
quenching of the fluorescence of C-dots by nitroxide radicals.115j
The fluorescence of C-dots was found to be efficiently quenched
by the paramagnetic nitroxide radical. A singly occupied
molecular orbital (SOMO) facilitating electron transfer was
proposed to account for the quenching of the fluorescence of C-
dots in the C-dot@TEMPO (2,2,6,6-tetramethylpiperidine-N-
oxide free radical) conjugate, formed via electrostatic interaction
between the negatively charged C-dots and the cationic 4-amino-
2,2,6,6-tetramethylpiperidine-N-oxide free radical (4-AT).
The study of C-dot-based energy and charge transfer properties
opens up new avenues in the design of optoelectronic and light-
energy conversion devices or systems.8,15b,23a,108–110 Indeed, careful
design of hybrid assemblies is necessary to exploit the electronic
properties of C-dots. Multifunctional C-dot-based materials with
different semiconductor and metal nanoparticles can provide new
pathways to design catalyst systems for light energy conver-
sion.8,11–13,107 The abilities of C-dots in the storage and transport of
electrons has yet to be exploited fully. Carefully designed C-dots
composites have the potential to expand the capacity of next-
generation energy storage, photovoltaic devices, and
photocatalysts.
J. Mater. Chem.
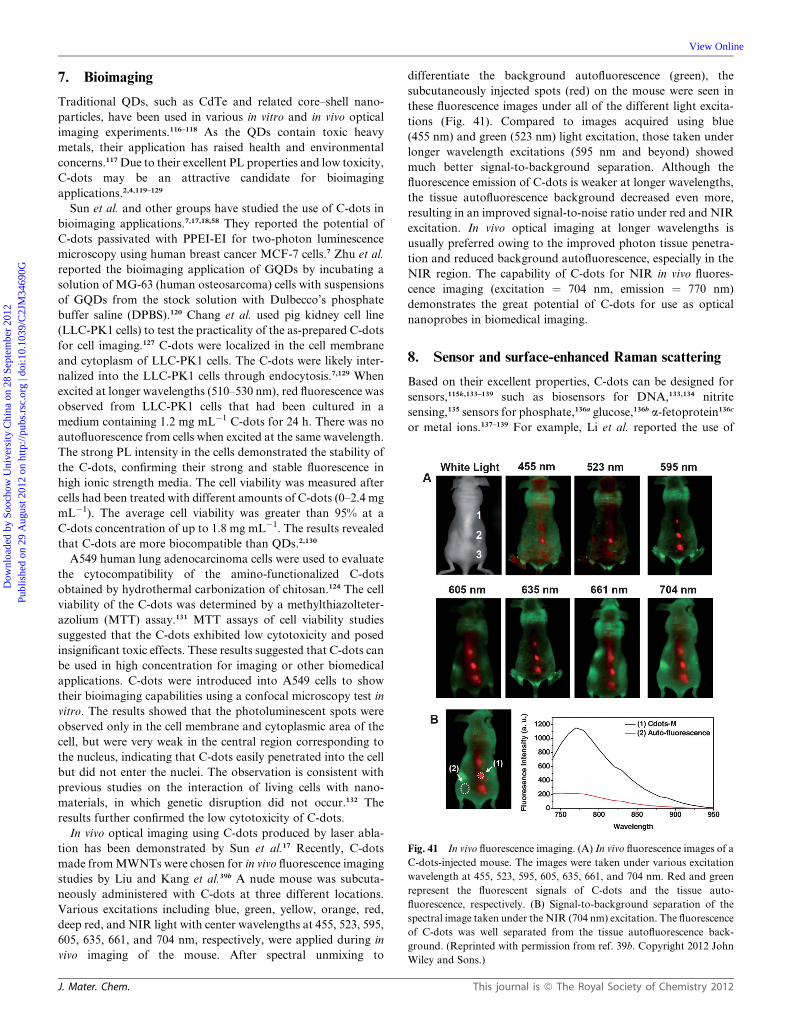
Fig. 41 In vivo fluorescence imaging. (A) In vivo fluorescence images of a
C-dots-injected mouse. The images were taken under various excitation
wavelength at 455, 523, 595, 605, 635, 661, and 704 nm. Red and green
represent the fluorescent signals of C-dots and the tissue auto-
fluorescence, respectively. (B) Signal-to-background separation of the
spectral image taken under the NIR (704 nm) excitation. The fluorescence
of C-dots was well separated from the tissue autofluorescence back-
ground. (Reprinted with permission from ref. 39b. Copyright 2012 John
Wiley and Sons.)
Dow
nloa
ded
by S
ooch
ow U
nive
rsity
Chi
na o
n 28
Sep
tem
ber
2012
Publ
ishe
d on
29
Aug
ust 2
012
on h
ttp://
pubs
.rsc
.org
| do
i:10.
1039
/C2J
M34
690G
View Online
7. Bioimaging
Traditional QDs, such as CdTe and related core–shell nano-
particles, have been used in various in vitro and in vivo optical
imaging experiments.116–118 As the QDs contain toxic heavy
metals, their application has raised health and environmental
concerns.117Due to their excellent PL properties and low toxicity,
C-dots may be an attractive candidate for bioimaging
applications.2,4,119–129
Sun et al. and other groups have studied the use of C-dots in
bioimaging applications.7,17,18,58 They reported the potential of
C-dots passivated with PPEI-EI for two-photon luminescence
microscopy using human breast cancer MCF-7 cells.7 Zhu et al.
reported the bioimaging application of GQDs by incubating a
solution of MG-63 (human osteosarcoma) cells with suspensions
of GQDs from the stock solution with Dulbecco’s phosphate
buffer saline (DPBS).120 Chang et al. used pig kidney cell line
(LLC-PK1 cells) to test the practicality of the as-prepared C-dots
for cell imaging.127 C-dots were localized in the cell membrane
and cytoplasm of LLC-PK1 cells. The C-dots were likely inter-
nalized into the LLC-PK1 cells through endocytosis.7,129 When
excited at longer wavelengths (510–530 nm), red fluorescence was
observed from LLC-PK1 cells that had been cultured in a
medium containing 1.2 mg mL�1 C-dots for 24 h. There was no
autofluorescence from cells when excited at the same wavelength.
The strong PL intensity in the cells demonstrated the stability of
the C-dots, confirming their strong and stable fluorescence in
high ionic strength media. The cell viability was measured after
cells had been treated with different amounts of C-dots (0–2.4 mg
mL�1). The average cell viability was greater than 95% at a
C-dots concentration of up to 1.8 mg mL�1. The results revealed
that C-dots are more biocompatible than QDs.2,130
A549 human lung adenocarcinoma cells were used to evaluate
the cytocompatibility of the amino-functionalized C-dots
obtained by hydrothermal carbonization of chitosan.124 The cell
viability of the C-dots was determined by a methylthiazolteter-
azolium (MTT) assay.131 MTT assays of cell viability studies
suggested that the C-dots exhibited low cytotoxicity and posed
insignificant toxic effects. These results suggested that C-dots can
be used in high concentration for imaging or other biomedical
applications. C-dots were introduced into A549 cells to show
their bioimaging capabilities using a confocal microscopy test in
vitro. The results showed that the photoluminescent spots were
observed only in the cell membrane and cytoplasmic area of the
cell, but were very weak in the central region corresponding to
the nucleus, indicating that C-dots easily penetrated into the cell
but did not enter the nuclei. The observation is consistent with
previous studies on the interaction of living cells with nano-
materials, in which genetic disruption did not occur.132 The
results further confirmed the low cytotoxicity of C-dots.
In vivo optical imaging using C-dots produced by laser abla-
tion has been demonstrated by Sun et al.17 Recently, C-dots
made fromMWNTs were chosen for in vivo fluorescence imaging
studies by Liu and Kang et al.39b A nude mouse was subcuta-
neously administered with C-dots at three different locations.
Various excitations including blue, green, yellow, orange, red,
deep red, and NIR light with center wavelengths at 455, 523, 595,
605, 635, 661, and 704 nm, respectively, were applied during in
vivo imaging of the mouse. After spectral unmixing to
J. Mater. Chem.
differentiate the background autofluorescence (green), the
subcutaneously injected spots (red) on the mouse were seen in
these fluorescence images under all of the different light excita-
tions (Fig. 41). Compared to images acquired using blue
(455 nm) and green (523 nm) light excitation, those taken under
longer wavelength excitations (595 nm and beyond) showed
much better signal-to-background separation. Although the
fluorescence emission of C-dots is weaker at longer wavelengths,
the tissue autofluorescence background decreased even more,
resulting in an improved signal-to-noise ratio under red and NIR
excitation. In vivo optical imaging at longer wavelengths is
usually preferred owing to the improved photon tissue penetra-
tion and reduced background autofluorescence, especially in the
NIR region. The capability of C-dots for NIR in vivo fluores-
cence imaging (excitation ¼ 704 nm, emission ¼ 770 nm)
demonstrates the great potential of C-dots for use as optical
nanoprobes in biomedical imaging.
8. Sensor and surface-enhanced Raman scattering
Based on their excellent properties, C-dots can be designed for
sensors,115k,133–139 such as biosensors for DNA,133,134 nitrite
sensing,135 sensors for phosphate,136a glucose,136b a-fetoprotein136c
or metal ions.137–139 For example, Li et al. reported the use of
This journal is ª The Royal Society of Chemistry 2012
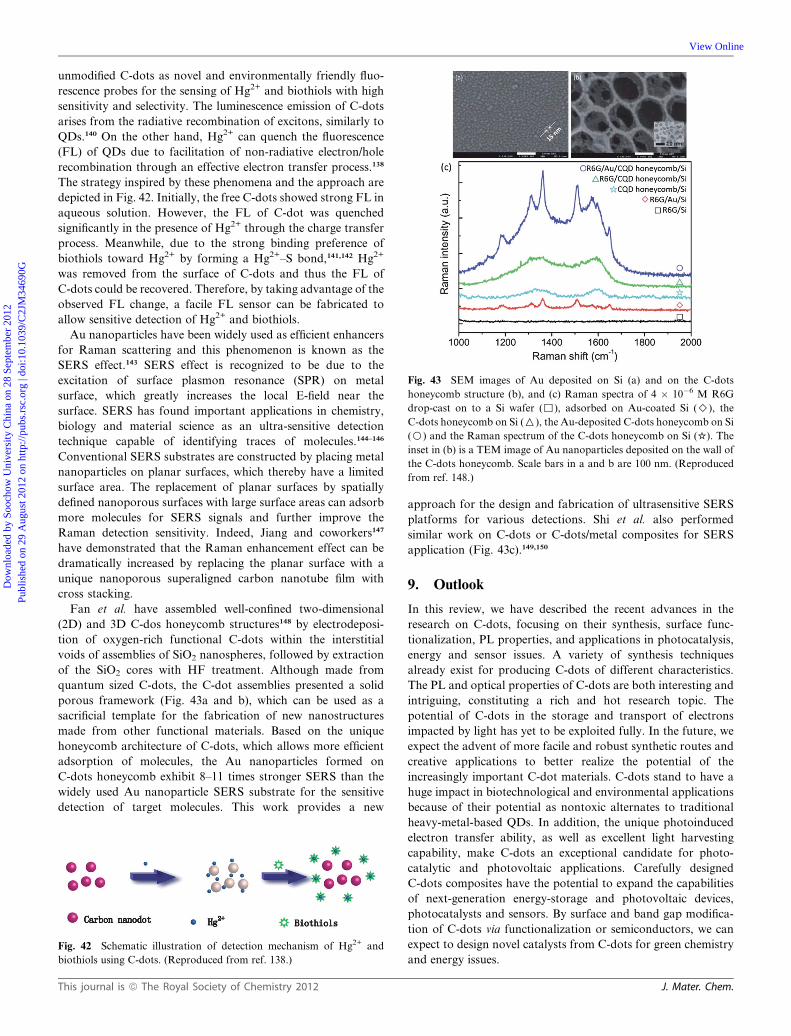
Fig. 43 SEM images of Au deposited on Si (a) and on the C-dots
honeycomb structure (b), and (c) Raman spectra of 4 � 10�6 M R6G
drop-cast on to a Si wafer (,), adsorbed on Au-coated Si (>), the
C-dots honeycomb on Si (O), the Au-deposited C-dots honeycomb on Si
(B) and the Raman spectrum of the C-dots honeycomb on Si (*). The
inset in (b) is a TEM image of Au nanoparticles deposited on the wall of
the C-dots honeycomb. Scale bars in a and b are 100 nm. (Reproduced
from ref. 148.)
Dow
nloa
ded
by S
ooch
ow U
nive
rsity
Chi
na o
n 28
Sep
tem
ber
2012
Publ
ishe
d on
29
Aug
ust 2
012
on h
ttp://
pubs
.rsc
.org
| do
i:10.
1039
/C2J
M34
690G
View Online
unmodified C-dots as novel and environmentally friendly fluo-
rescence probes for the sensing of Hg2+ and biothiols with high
sensitivity and selectivity. The luminescence emission of C-dots
arises from the radiative recombination of excitons, similarly to
QDs.140 On the other hand, Hg2+ can quench the fluorescence
(FL) of QDs due to facilitation of non-radiative electron/hole
recombination through an effective electron transfer process.138
The strategy inspired by these phenomena and the approach are
depicted in Fig. 42. Initially, the free C-dots showed strong FL in
aqueous solution. However, the FL of C-dot was quenched
significantly in the presence of Hg2+ through the charge transfer
process. Meanwhile, due to the strong binding preference of
biothiols toward Hg2+ by forming a Hg2+–S bond,141,142 Hg2+
was removed from the surface of C-dots and thus the FL of
C-dots could be recovered. Therefore, by taking advantage of the
observed FL change, a facile FL sensor can be fabricated to
allow sensitive detection of Hg2+ and biothiols.
Au nanoparticles have been widely used as efficient enhancers
for Raman scattering and this phenomenon is known as the
SERS effect.143 SERS effect is recognized to be due to the
excitation of surface plasmon resonance (SPR) on metal
surface, which greatly increases the local E-field near the
surface. SERS has found important applications in chemistry,
biology and material science as an ultra-sensitive detection
technique capable of identifying traces of molecules.144–146
Conventional SERS substrates are constructed by placing metal
nanoparticles on planar surfaces, which thereby have a limited
surface area. The replacement of planar surfaces by spatially
defined nanoporous surfaces with large surface areas can adsorb
more molecules for SERS signals and further improve the
Raman detection sensitivity. Indeed, Jiang and coworkers147
have demonstrated that the Raman enhancement effect can be
dramatically increased by replacing the planar surface with a
unique nanoporous superaligned carbon nanotube film with
cross stacking.
Fan et al. have assembled well-confined two-dimensional
(2D) and 3D C-dos honeycomb structures148 by electrodeposi-
tion of oxygen-rich functional C-dots within the interstitial
voids of assemblies of SiO2 nanospheres, followed by extraction
of the SiO2 cores with HF treatment. Although made from
quantum sized C-dots, the C-dot assemblies presented a solid
porous framework (Fig. 43a and b), which can be used as a
sacrificial template for the fabrication of new nanostructures
made from other functional materials. Based on the unique
honeycomb architecture of C-dots, which allows more efficient
adsorption of molecules, the Au nanoparticles formed on
C-dots honeycomb exhibit 8–11 times stronger SERS than the
widely used Au nanoparticle SERS substrate for the sensitive
detection of target molecules. This work provides a new
Fig. 42 Schematic illustration of detection mechanism of Hg2+ and
biothiols using C-dots. (Reproduced from ref. 138.)
This journal is ª The Royal Society of Chemistry 2012
approach for the design and fabrication of ultrasensitive SERS
platforms for various detections. Shi et al. also performed
similar work on C-dots or C-dots/metal composites for SERS
application (Fig. 43c).149,150
9. Outlook
In this review, we have described the recent advances in the
research on C-dots, focusing on their synthesis, surface func-
tionalization, PL properties, and applications in photocatalysis,
energy and sensor issues. A variety of synthesis techniques
already exist for producing C-dots of different characteristics.
The PL and optical properties of C-dots are both interesting and
intriguing, constituting a rich and hot research topic. The
potential of C-dots in the storage and transport of electrons
impacted by light has yet to be exploited fully. In the future, we
expect the advent of more facile and robust synthetic routes and
creative applications to better realize the potential of the
increasingly important C-dot materials. C-dots stand to have a
huge impact in biotechnological and environmental applications
because of their potential as nontoxic alternates to traditional
heavy-metal-based QDs. In addition, the unique photoinduced
electron transfer ability, as well as excellent light harvesting
capability, make C-dots an exceptional candidate for photo-
catalytic and photovoltaic applications. Carefully designed
C-dots composites have the potential to expand the capabilities
of next-generation energy-storage and photovoltaic devices,
photocatalysts and sensors. By surface and band gap modifica-
tion of C-dots via functionalization or semiconductors, we can
expect to design novel catalysts from C-dots for green chemistry
and energy issues.
J. Mater. Chem.
Dow
nloa
ded
by S
ooch
ow U
nive
rsity
Chi
na o
n 28
Sep
tem
ber
2012
Publ
ishe
d on
29
Aug
ust 2
012
on h
ttp://
pubs
.rsc
.org
| do
i:10.
1039
/C2J
M34
690G
View Online
Acknowledgements
This work is supported by the National Basic Research Program
of China (973 Program) (no. 2012CB825800), National Natural
Science Foundation of China (NSFC) (no. 51132006, 51072126,
21073127, 21071104, 91027041), a Foundation for the Author of
National Excellent Doctoral Dissertation of P R China
(FANEDD) (no. 200929), a grant from the Research Grants
Council of the Hong Kong Special Administrative Region,
China (Project no. CityU102010), a project funded by the
Priority Academic Program Development of Jiangsu Higher
Education Institutions (PAPD), a Suzhou Planning Project of
Science and Technology (ZXG2012028) and a project supported
by the Natural Science Foundation of the Jiangsu Higher
Education Institutions of China (Grant no. 11KJB150015). We
also thank the Innovation Program of Graduate Students in
Jiangsu Province (no: CXZZ11_0097).
Notes and references
1 X. Y. Xu, R. Ray, Y. L. Gu, H. J. Ploehn, L. Gearheart, K. Rakerand W. A. Scrivens, J. Am. Chem. Soc., 2004, 126, 12736.
2 S. N. Baker and G. A. Baker,Angew. Chem., Int. Ed., 2010, 49, 6726.3 J. C. G. Esteves da Silva and H. M. R. Goncalves, TrAC, TrendsAnal. Chem., 2011, 30, 1327.
4 J. H. Shen, Y. H. Zhu, X. L. Yang and C. Z. Li, Chem. Commun.,2012, 48, 3686.
5 H. P. Liu, T. Ye and C. D. Mao, Angew. Chem., Int. Ed., 2007, 46,6473.
6 X. H. Wang, K. G. Qu, B. L. Xu, J. S. Ren and X. G. Qu,Nano Res.,2011, 4, 908.
7 L. Cao, X.Wang, M. J. Meziani, F. Lu, H. Wang, P. G. Luo, Y. Lin,B. A. Harruff, L. M. Veca, D. Murray, S. Y. Xie and Y. P. Sun, J.Am. Chem. Soc., 2007, 129, 11318.
8 (a) H. T. Li, X. D. He, Z. H. Kang, H. Huang, Y. Liu, J. L. Liu,S. Y. Lian, C. H. A. Tsang, X. B. Yang and S. T. Lee, Angew.Chem., Int. Ed., 2010, 49, 4430; (b) H. Ming, Z. Ma, Y. Liu,K. M. Pan, H. Yu, F. Wang and Z. H. Kang, Dalton Trans., 2012,41, 9526.
9 J. Shen, Y. Zhu, C. Chen, X. Yang and C. Li, Chem. Commun., 2011,47, 2580.
10 A. Mehta, E. J. Nelson, S. M. Webb and J. K. Holt, Adv. Mater.,2009, 21, 102.
11 H. C. Zhang, H. Ming, S. Lian, H. Huang, H. Li, L. Zhang, Y. Liu,Z. Kang and S. T. Lee, Dalton Trans., 2011, 40, 10822.
12 H. C. Zhang, H. Huang, H. Ming, H. T. Li, L. L. Zhang, Y. Liu andZ. H. Kang, J. Mater. Chem., 2012, 22, 10501.
13 H. Yu, H. C. Zhang, H. T. Li, H. Huang, Y. Liu, H. Ming andZ. H. Kang, New J. Chem., 2012, 36, 1031.
14 S. C. Ray, A. Saha, N. R. Jana and R. Sarkar, J. Phys. Chem. C,2009, 113, 18546–18551.
15 (a) H. T. Li, X. D. He, Y. Liu, H. Huang, S. Y. Lian, S. T. Lee andZ. H. Kang, Carbon, 2011, 49, 605; (b) L. B. Tang, R. B. Ji,X. K. Cao, J. Y. Lin, H. X. Jiang, X. M. Li, K. S. Teng,C. M. Luk, S. J. Zeng, J. H. Hao and S. P. Lau, ACS Nano, 2012,6, 5102.
16 A. B. Bourlinos, A. Stassinopoulos, D. Anglos, R. Zboril,M. Karakassides and E. P. Giannelis, Small, 2008, 4, 455.
17 S. T. Yang, L. Cao, P. G. Luo, F. S. Lu, X. Wang, H. F. Wang,M. J. Meziani, Y. F. Liu, G. Qi and Y. P. Sun, J. Am. Chem. Soc.,2009, 131, 11308.
18 S. T. Yang, X. Wang, H. F. Wang, F. S. Lu, P. J. G. Luo, L. Cao,M. J. Meziani, J. H. Liu, Y. F. Liu, M. Chen, Y. P. Huang andY. P. Sun, J. Phys. Chem. C, 2009, 113, 18110.
19 Q. Li, T. Y. Ohulchanskyy, R. L. Liu, K. Koynov, D. Q. Wu,A. Best, R. Kumar, A. Bonoiu and P. N. Prasad, J. Phys. Chem.C, 2010, 114, 12062.
20 D. Y. Pan, L. Guo, J. C. Zhang, C. Xi, Q. Xue, H. Huang, J. H. Li,Z. W. Zhang, W. J. Yu, Z. W. Chen, Z. Li and M. H. Wu, J. Mater.Chem., 2012, 22, 3314.
J. Mater. Chem.
21 S. F. Lim, R. Riehn, W. S. Ryu, N. Khanarian, C. K. Tung, D. Tankand R. H. Austin, Nano Lett., 2006, 6, 169.
22 X. Wang, L. Cao, F. S. Lu, M. J. Meziani, H. Li, G. Qi, B. Zhou,B. A. Harruff, F. Kermarrec and Y. P. Sun, Chem. Commun.,2009, 3774.
23 (a) Y. Li, Y. Hu, Y. Zhao, G. Shi, L. Deng, Y. Hou and L. Qu, Adv.Mater., 2011, 23, 776; (b) A. K. Geim, Science, 2009, 324, 1530; (c)K. S. Novoselov, A. K. Geim, S. V. Morozov, D. Jiang, Y. Zhang,S. V. Dubonos, I. V. Grigorieva and A. A. Firsov, Science, 2004,306, 666; (d) C. X. Guo, H. B. Yang, Z. M. Sheng, Z. S. Lu,Q. L. Song and C. M. Li, Angew. Chem., Int. Ed., 2010, 122, 3078;(e) S. Gilje, S. Han, M. Wang, K. L. Wang and R. B. Kaner,Nano Lett., 2007, 7, 3394; (f) S. Watcharotone, D. A. Dikin,S. Stankovich, R. Piner, I. Jung, G. H. B. Dommett,G. Evmenenko, S. E. Wu, S. F. Chen, C. P. Liu, S. T. Nguyen andR. S. Ruoff, Nano Lett., 2007, 7, 1888; (g) X. Wang, L. Zhi andK. Mullen, Nano Lett., 2008, 8, 323; (h) Q. Liu, Z. F. Liu,X. Y. Zhang, L. Y. Yang, N. Zhang, G. P. Pan, S. G. Yin,Y. S. Chen and J. Wei, Adv. Funct. Mater., 2009, 19, 894; (i)L. A. Ponomarenko, F. Schedin, M. I. Katsnelson, R. Yang,E. W. Hill, K. S. Novoselov and A. K. Geim, Science, 2008, 320,356; (j) C. O. Girit, J. C. Meyer, R. Erni, M. D. Rossell,C. Kisielowski, L. Yang, C. H. Park, M. F. Crommie,M. L. Cohen, S. G. Louie and A. Zettl, Science, 2009, 323, 1705.
24 L. Zhou, Y. H. Lin, Z. Z. Huang, J. S. Ren and X. G. Qu, Chem.Commun., 2012, 48, 1147.
25 L. Q. Liu, Y. F. Li, L. Zhan, Y. Liu and C. Z. Huang, Sci. China:Chem., 2011, 54, 1342.
26 J. Lu, J. X. Yang, J. Wang, A. Lim, S. Wang and K. P. Loh, ACSNano, 2009, 3, 2367.
27 Q. L. Zhao, Z. L. Zhang, B. H. Huang, J. Peng, M. Zhang andD. W. Pang, Chem. Commun., 2008, 5116.
28 L. Y. Zheng, Y. W. Chi, Y. Q. Dong, J. P. Lin and B. B. Wang, J.Am. Chem. Soc., 2009, 131, 4564.
29 J. G. Zhou, C. Booker, R. Y. Li, X. T. Zhou, T. K. Sham, X. L. Sunand Z. F. Ding, J. Am. Chem. Soc., 2007, 129, 744.
30 A. B. Bourlinos, A. Stassinopoulos, D. Anglos, R. Zboril,V. Georgakilas and E. P. Giannelis, Chem. Mater., 2008, 20, 4539.
31 L. Tian, D. Ghosh, W. Chen, S. Pradhan, X. Chang and S. Chen,Chem. Mater., 2009, 21, 2803.
32 D. Pan, J. Zhang, Z. Li and M. Wu, Adv. Mater., 2010, 22,734.
33 D. Y. Pan, J. C. Zhang, Z. Li, C. Wu, X. M. Yan and M. H. Wu,Chem. Commun., 2010, 46, 3681.
34 C. Y. Xiu, Q. Gao, G. D. Li, K. X. Wang and J. S. Chen, Inorg.Chem., 2010, 13, 5859.
35 J. C. Zhang, W. Q. Shen, D. Y. Pan, Z. W. Zhang, Y. G. Fang andM. H. Wu, New J. Chem., 2010, 34, 591.
36 (a) L. Tian, Y. Song, X. J. Chang and S. W. Chen, Scr. Mater., 2010,62, 883; (b) Z. H. Kang, E. B. Wang, B. D. Mao, Z. M. Su, L. Gao,S. Y. Lian and L. Xu, J. Am. Chem. Soc., 2005, 127, 6534; (c)K. M. Pan, H. Ming, Y. Liu and Z. H. Kang, New J. Chem., 2012,36, 113.
37 B. Zhang, C. Y. Liu and Y. Liu, Eur. J. Inorg. Chem., 2010,4411.
38 J. C. Vinci and L. A. Colon, Anal. Chem., 2012, 84, 1178.39 (a) J. Peng, W. Gao, B. K. Gupta, Z. Liu, R. A. Rebeca, L. H. Ge,
L. Song, L. B. Alemany, X. B. Zhan, G. H. Gao, S. A. Vithayathil,B. A. Kaipparettu, A. A. Marti, T. Hayashi, J. J. Zhu andP. M. Ajayan, Nano Lett., 2012, 12, 844; (b) H. Q. Tao, K. Yang,Z. Ma, J. M. Wan, Y. J. Zhang, Z. H. Kang and Z. Liu, Small,2012, 8, 281.
40 R. L. Liu, D. Q. Wu, S. H. Liu, K. Koynov, W. Knoll and Q. Li,Angew. Chem., Int. Ed., 2009, 48, 4598.
41 J. Zong, Y. H. Zhu, X. L. Yang, J. H. Shen and C. Z. Li, Chem.Commun., 2011, 47, 764.
42 (a) H. Zhu, X. L. Wang, Y. L. Li, Z. J. Wang, F. Yang andX. R. Yang, Chem. Commun., 2009, 5118; (b) Y. Bae, N. Myungand A. J. Bard, Nano Lett., 2004, 4, 1153; (c) Z. F. Ding,B. M. Quinn, S. K. Haram, L. E. Pell, B. A. Korgel andA. J. Bard, Science, 2002, 296, 1293; (d) H. Jiang and H. X. Ju,Anal. Chem., 2007, 79, 6690; (e) N. Myung, Z. F. Ding andA. J. Bard, Nano Lett., 2002, 2, 1315.
43 Q. L. Wang, H. Z. Zheng, Y. J. Long, L. Y. Zhang, M. Gao andW. J. Bai, Carbon, 2011, 49, 3134.
This journal is ª The Royal Society of Chemistry 2012
Dow
nloa
ded
by S
ooch
ow U
nive
rsity
Chi
na o
n 28
Sep
tem
ber
2012
Publ
ishe
d on
29
Aug
ust 2
012
on h
ttp://
pubs
.rsc
.org
| do
i:10.
1039
/C2J
M34
690G
View Online
44 H. T. Li, X. D. He, Y. Liu, H. Yu, Z. H. Kang and S. T. Lee,Mater.Res. Bull., 2011, 46, 147.
45 X. H. Wang, K. G. Qu, B. L. Xu, J. S. Ren and X. G. Qu, J. Mater.Chem., 2011, 21, 2445.
46 J. Wang, X. Xin and Z. Lin, Nanoscale, 2011, 3, 3040.47 X. Yan, X. Cui and L. S. Li, J. Am. Chem. Soc., 2010, 132, 5944.48 I. P. Hamilton, B. Li, X. Yan and L. S. Li, Nano Lett., 2011, 11,
1524.49 L. S. Li and X. Yan, J. Phys. Chem. Lett., 2010, 1, 2572.50 M. L.Mueller, X. Yan, J. A.McGuire and L. S. Li,Nano Lett., 2010,
10, 2679.51 X. Yan, X. Cui, B. S. Li and L. S. Li, Nano Lett., 2010, 10, 1869.52 M. L. M€ueller, X. Yan, B. Dragnea and L. S. Li, Nano Lett., 2011,
11, 56.53 R. Liu, D. Wu, X. Feng and K. M€ullen, J. Am. Chem. Soc., 2011,
133, 15221.54 J. Lu, P. S. E. Yeo, C. K. Gan, P. Wu and K. P. Loh, Nat.
Nanotechnol., 2011, 6, 247.55 S. L. Hu, P. K. Bai, S. R. Cao and J. Sun,Chem. J. Chin. Univ., 2009,
30, 1497.56 S. L. Hu, K. Y. Niu, J. Sun, J. Yang, N. Q. Zhao and X. W. Du, J.
Mater. Chem., 2009, 19, 484.57 Y. P. Sun, X. Wang, F. S. Lu, L. Cao, M. J. Meziani, P. J. G. Luo,
L. R. Gu and L. M. Veca, J. Phys. Chem. C, 2008, 112,18295.
58 Y. P. Sun, B. Zhou, Y. Lin, W.Wang, K. A. S. Fernando, P. Pathak,M. J. Meziani, B. A. Harruff, X. Wang, H. F. Wang, P. J. G. Luo,H. Yang, M. E. Kose, B. L. Chen, L. M. Veca and S. Y. Xie, J.Am. Chem. Soc., 2006, 128, 7756.
59 H. Goncalves, C. G. Joaquim and E. Silva, J. Fluoresc., 2010, 20,1023.
60 X. Y. Li, H. Q. Wang, Y. Shimizu, A. Pyatenko, K. Kawaguchi andN. Koshizaki, Chem. Commun., 2011, 47, 932.
61 S. L. Hu, J. Liu, J. L. Yang, Y. Z. Wang and S. R. Cao, J. Nanopart.Res., 2011, 13, 7247.
62 H. Q. Jiang, F. Chen, M. G. Lagally and F. S. Denes, Langmuir,2010, 26, 1991.
63 J. Wu, W. Pisula and K. Mullen, Chem. Rev., 2007, 107, 718.64 J. Wu, Z. Tomovic, V. Enkelmann and K. Mullen, J. Org. Chem.,
2004, 69, 5179.65 W. Kwon and S.-W. Rhee, Chem. Commun., 2012, 48, 5256.66 T. Gokus, R. R. Nalr, A. Bonettl, M. Bohmler, A. Lombardo,
K. S. Novoselov, A. K. Gelm, A. C. Ferrarl and A. Hartschuh,ACS Nano, 2009, 3, 3963.
67 C. Casiraghi, A. Hartschuh, E. Lidorikis, H. Qian, H. Harutyunyan,T. Gokus, K. S. Novoselov and A. C. Ferrari, Nano Lett., 2007, 7,2711.
68 A. C. Ferrari, J. C. Meyer, V. Scardaci, C. Casiraghi, F. Mauri,S. Piscanec, S. Piscanec, D. Jiang, K. S. Novoselov, S. Roth andA. K. Geim, Phys. Rev. Lett., 2006, 97, 187401.
69 J. L. Chen and X. P. Yan, Chem. Commun., 2011, 47, 3135.70 J. Wu, W. Pisula and K. M€ullen, Chem. Rev., 2007, 107, 718.71 R. Scholl and J. Mansfeld, Ber. Dtsch. Chem. Ges., 1910, 43,
1734.72 R. Rempala, J. Kroulik and B. T. King, J. Am. Chem. Soc., 2004,
126, 15002.73 M. P. Pileni, Langmuir, 1997, 13, 3266.74 Z. H. Kang, Y. Liu and S. T. Lee, Nanoscale, 2011, 3, 777.75 Z. F. Ding, B. M. Quinn, S. K. Haram, L. E. Pell, B. A. Korgel and
A. J. Bard, Science, 2002, 296, 1293.76 G. Ledoux, J. Gong, F. Huisken, O. Guillois and C. Reynaud, Appl.
Phys. Lett., 2002, 80, 4834.77 W. L. Wilson, P. F. Szajowski and L. E. Brus, Science, 1993, 262,
1242.78 H. Peng and J. Travas-Sejdic, Chem. Mater., 2009, 21, 5563.79 H. T. Li, H. Ming, Y. Liu, H. Yu, X. D. He, H. Huang, K. M. Pan,
Z. H. Kang and S. T. Lee, New J. Chem., 2011, 35, 2666.80 H. L. Qi, Y. Peng, Q. Gao and C. X. Zhang, Sensors, 2009, 9, 674.81 L. H. Zhang, X. Q. Zou, E. Ying and S. J. Dong, J. Phys. Chem. C,
2008, 112, 4451.82 J. G. Zhou, C. Booker, R. Y. Li, X. L. Sun, T. K. Sham and
Z. F. Ding, Chem. Phys. Lett., 2010, 493, 296.83 N. Myung, Z. Ding and A. J. Bard, Nano Lett., 2002, 2, 1315.84 Y. Bae, N. Myung and A. J. Bard, Nano Lett., 2004, 4, 1153.85 N. Myung, Y. Bae and A. J. Bard, Nano Lett., 2003, 3, 1053.
This journal is ª The Royal Society of Chemistry 2012
86 X. Wang, L. Cao, S. T. Yang, F. S. Lu, M. J. Meziani, L. L. Tian,K. W. Sun, M. A. Bloodgood and Y. P. Sun, Angew. Chem., Int.Ed., 2010, 49, 5310.
87 H. Z. Zheng, Q. L. Wang, Y. J. Long, H. J. Zhang, X. X. Huang andR. Zhu, Chem. Commun., 2011, 47, 10650.
88 W. Xue, Z. Lin, H. Chen, C. Lu and J. M. Lin, J. Phys. Chem. C,2011, 115, 21707.
89 W. F. Zhang, H. Zhu, S. F. Yu and H. Y. Yang, Adv. Mater., 2012,24, 2263.
90 S. J. Zhu, J. H. Zhang, X. Liu, B. Li, X. F. Wang, S. J. Tang,Q. N. Meng, Y. F. Li, C. Shi, R. Hu and B. Yang, RSC Adv.,2012, 2, 2717.
91 Z. Ma, H. Ming, H. Huang, Y. Liu and Z. H. Kang, New J. Chem.,2012, 36, 861.
92 Z. H. Kang, C. H. A. Tsang, N. B.Wong, Z. D. Zhang and S. T. Lee,J. Am. Chem. Soc., 2007, 129, 12090.
93 Z. H. Kang, Y. Liu, C. H. A. Tsang, D. D. D. Ma, X. Fan,N. B. Wong and S. T. Lee, Adv. Mater., 2009, 21, 661.
94 (a) Z. H. Kang, C. H. A. Tsang, Z. D. Zhang, M. L. Zhang,N. B. Wong, J. A. Zapien, Y. Y. Shan and S. T. Lee, J. Am.Chem. Soc., 2007, 129, 5326; (b) H. T. Li, R. H. Liu, Y. Liu,H. Huang, H. Yu, H. Ming, S. Y. Lian, S.-T. Lee and Z. H. Kang,J. Mater. Chem., 2012, 22, 17470; (c) D. I. Son, B. W. Kwon,D. H. Park, W.-S. Seo, Y. Yi, B. Angadi, C.-L. Lee andW. K. Choi, Nat. Nanotechnol., 2012, 7, 465.
95 C. H. A. Tsang, Y. Liu, Z. H. Kang, D. D. D. Ma, N. B. Wong andS. T. Lee, Chem. Commun., 2009, 5829.
96 A. T. Bell, Science, 2003, 299, 1688.97 R. Schlogl and S. B. A. Hamid, Angew. Chem., Int. Ed., 2004, 43,
1628.98 M. D. Hughes, Y. J. Xu, P. Jenkins, P. McMorn, P. Landon,
D. I. Enache, A. F. Carley, G. A. Attard, G. J. Hutchings,F. King, E. H. Stitt, P. Johnston, K. Griffin and C. J. Kiely,Nature, 2005, 437, 1132.
99 A. Corma and P. Serna, Science, 2006, 313, 332.100 M. Turner, V. B. Golovko, O. P. H. Vaughan, P. Abdulkin,
A. Berenguer-Murcia, M. S. Tikhov, B. F. G. Johnson andR. M. Lambert, Nature, 2008, 454, 981.
101 D. Kovalev and M. Fujii, Adv. Mater., 2005, 17, 2531.102 X. B. Chen and S. S. Mao, Chem. Rev., 2007, 107, 2891.103 J. Y. Li, W. H. Ma, C. C. Chen, J. C. Zhao, H. Y. Zhu and
X. P. Gao, J. Mol. Catal. A: Chem., 2007, 261, 131.104 W. Wang, B. H. Gu, L. Y. Liang and W. Hamilton, J. Phys. Chem.
B, 2003, 107, 3400.105 Y. Yao, G. H. Li, S. Ciston, R. M. Lueptow and K. A. Gray,
Environ. Sci. Technol., 2008, 42, 4952.106 B. Y. Yu and S.-Y. Kwak, J. Mater. Chem., 2012, 22, 8345.107 S. J. Zhuo, M. W. Shao and S. T. Lee, ACS Nano, 2012, 6, 1059–
1064.108 P. Mirtchev, E. J. Henderson, N. Soheilnia, C. M. Yipc and
G. A. Ozin, J. Mater. Chem., 2012, 22, 1265.109 V. Gupta, N. Chaudhary, R. Srivastava, G. D. Sharma,
R. Bhardwaj and S. Chand, J. Am. Chem. Soc., 2011, 133,9960.
110 L. Cao, S. Sahu, P. Anilkumar, C. E. Bunker, J. Xu,K. A. S. Fernando, P. Wang, E. A. Guliants, K. N. Tackett andY. P. Sun, J. Am. Chem. Soc., 2011, 133, 4754.
111 J. Shen, Y. Zhu, X. Yang, J. Zong, J. Zhang and C. Li, New J.Chem., 2012, 36, 97.
112 M. K. Nazeeruddin, A. Kay, I. Rodicio, R. Humphry-Baker,E. Muller, P. Liska, N. Vlachopoulos and M. Gratzel, J. Am.Chem. Soc., 1993, 115, 6382.
113 (a) J. Tauc, R. Grigorovici and A. Vancu, Phys. Status Solidi B,1966, 15, 627; (b) X. Guo, C.-F. Wang, Z.-Y. Yu, L. Chen andS. Chen, Chem. Commun., 2012, 48, 2692; (c) F. Wang,Y.-H. Chen, C.-Y. Liu and D.-G. Ma, Chem. Commun., 2011, 47,3502.
114 T. Torimoto, S. Ito, S. Kuwabata and H. Yoneyama, Environ. Sci.Technol., 1996, 30, 1275.
115 (a) P. V. Kamat, J. Phys. Chem. Lett., 2011, 2, 242; (b) W. Z. Li,C. H. Liang, J. H. Qiu, W. J. Zhou, H. M. Han, Z. B. Wei,G. Q. Sun and Q. Xin, Carbon, 2002, 40, 787; (c) D.-W. Wang,F. Li, M. Liu, G. Q. Lu and H.-M. Cheng, Angew. Chem., Int.Ed., 2008, 120, 379; (d) G. Williams, B. Seger and P. V. Kamat,ACS Nano, 2008, 2, 1487; (e) B. Seger and P. V. Kamat, J. Phys.
J. Mater. Chem.
Dow
nloa
ded
by S
ooch
ow U
nive
rsity
Chi
na o
n 28
Sep
tem
ber
2012
Publ
ishe
d on
29
Aug
ust 2
012
on h
ttp://
pubs
.rsc
.org
| do
i:10.
1039
/C2J
M34
690G
View Online
Chem. C, 2009, 113, 7990; (f) A. Wojcik and P. V. Kamat, ACSNano, 2010, 4, 6697; (g) Z. Chen, S. P. Berciaud, C. Nuckolls,T. F. Heinz and L. E. Brus, ACS Nano, 2010, 4, 2964; (h)W.-D. Zhang, L.-C. Jiang and J.-S. Ye, J. Phys. Chem. C, 2009,113, 16247; (i) J. H. Bang and P. V. Kamat, ACS Nano, 2011, 5,9421; (j) F. Lin, D. J. Pei, W. N. He, Z. X. Huang, Y. J. Huangand X. Q. Guo, J. Mater. Chem., 2012, 22, 11801; (k) W. L. Wei,C. Xu, J. S. Ren, B. L. Xu and X. G. Qu, Chem. Commun., 2012,48, 1284.
116 X. H. Gao, L. L. Yang, J. A. Petros, F. F. Marshal, J. W. Simonsand S. M. Nie, Curr. Opin. Biotechnol., 2005, 16, 63.
117 R. Hardman, Environ. Health Perspect., 2006, 114, 165.118 J. K. Jaiswal and S. M. Simon, Trends Cell Biol., 2004, 14,
497.119 Y. Song, W. Shi, W. Chen, X. Li and H. Ma, J. Mater. Chem.,
2012, 22, 12568.120 S. Zhu, J. Zhang, C. Qiao, S. Tang, Y. Li, W. Yuan, B. Li, L. Tian,
F. Liu, R. Hu, H. Gao, H. Wei, H. Zhang, H. Sun and B. Yang,Chem. Commun., 2011, 47, 6858.
121 F. Wang, Z. Xie, H. Zhang, C.-Y. Liu and Y.-G. Zhang, Adv. Funct.Mater., 2011, 21, 1027.
122 S. Chandra, P. Das, S. Bag, D. Laha and P. Pramanik, Nanoscale,2011, 3, 1533.
123 Y. X. Fang, S. J. Guo, D. Li, C. Z. Zhu, W. Ren, S. J. Dong andE. K. Wang, ACS Nano, 2012, 6, 400.
124 Y. H. Yang, J. H. Cui, M. T. Zheng, C. F. Hu, S. Z. Tan,Y. X. Q. Yang and Y. L. Liu, Chem. Commun., 2012, 48,380.
125 P.-C. Hsu and H.-T. Chang, Chem. Commun., 2012, 48, 3984.126 Q. Qu, A. W. Zhu, X. L. Shao, G. Y. Shi and Y. Tian, Chem.
Commun., 2012, 48, 5473.127 P.-C. Hsu, Z.-Y. Shih, C.-H. Lee and H.-T. Chang, Green Chem.,
2012, 14, 917.128 M. Zhang, L. L. Bai, W. H. Shang, W. J. Xie, H. Ma, Y. Y. Fu,
D. C. Fang, H. Sun, L. Z. Fan, M. Han, C. M. Liu andS. H. Yang, J. Mater. Chem., 2012, 22, 7461.
129 C. Liu, P. Zhang, F. Tian, W. Li, F. Li andW. Liu, J. Mater. Chem.,2011, 21, 13163.
130 S. J. Rosenthal, J. C. Chang, O. Kovtun, J. R. McBride andI. D. Tomlinson, Chem. Biol., 2011, 18, 10.
J. Mater. Chem.
131 H. W. Li, Y. Li, Y. Q. Dang, L. J. Ma, Y. Q. Wu, G. F. Hou andL. X. Wu, Chem. Commun., 2009, 4453.
132 J. Jeong, M. Cho, Y. T. Lim, N. W. Song and B. H. Chung, Angew.Chem., Int. Ed., 2009, 48, 5296.
133 J. Zhao, G. Chen, L. Zhu and G. Li, Electrochem. Commun., 2011,13, 31.
134 W. J. Bai, H. Z. Zheng, Y. J. Long, X. J. Mao, M. Gao andL. Y. Zhang, Anal. Sci., 2011, 27, 243.
135 Z. Lin, W. Xue, H. Chen and J. M. Lin, Anal. Chem., 2011, 83, 8245.136 (a) H. X. Zhao, L. Q. Liu, Z. D. Liu, Y. Wang, X. J. Zhao and
C. Z. Huang, Chem. Commun., 2011, 47, 2604; (b) W. B. Shi,Q. L. Wang, Y. J. Long, Z. L. Cheng, S. H. Chen, H. Z. Zhengand Y. M. Huang, Chem. Commun., 2011, 47, 6695; (c) H. Dai,C. P. Yang, Y. J. Tong, G. F. Xu, X. L. Ma, Y. Y. Lin andG. N. Chen, Chem. Commun., 2012, 48, 3055.
137 L. Q. Liu, Y. F. Li, L. Zhan, Y. Liu and C. Z. Huang, Sci. China:Chem., 2011, 54, 1342.
138 L. Zhou, Y. H. Lin, Z. Z. Huang, J. S. Ren and X. G. Qu, Chem.Commun., 2012, 48, 1147.
139 Y. Q. Dong, R. X. Wang, H. Li, J. W. Shao, Y. W. Chi, X. M. Linand G. N. Chen, Carbon, 2012, 50, 2810.
140 Y. Xia and C. Zhu, Talanta, 2008, 75, 215.141 B. Han, J. Yuan and E. Wang, Anal. Chem., 2009, 81, 5569.142 F. Pu, Z. Huang, J. Ren and X. Qu, Anal. Chem., 2010, 82, 8211.143 P. L. Stiles, J. A. Dieringer, N. C. Shah and R. R. Van Duyne, Annu.
Rev. Anal. Chem., 2008, 1, 601.144 L. Gunnarsson, E. J. Bjerneld, H. Xu, S. Petronis, B. Kasemo and
M. K€all, Appl. Phys. Lett., 2001, 78, 802.145 G. L. Liu and L. P. Lee, Appl. Phys. Lett., 2005, 87, 074101.146 H. H. Wang, C. Y. Liu, S. B. Wu, N. W. Liu, C. Y. Peng,
T. H. Chan, C. F. Hsu, J. K. Wang and Y. L. Wang, Adv. Mater.,2005, 17, 222.
147 Y. Sun, K. Liu, J. Miao, Z. Wang, B. Tian, L. Zhang, Q. Li, S. Fanand K. Jiang, Nano Lett., 2010, 10, 1747.
148 Y. Q. Fan, H. H. Cheng, C. Zhou, X. J. Xie, Y. Liu, L. M. Dai,J. Zhang and L. T. Qu, Nanoscale, 2012, 4, 1776.
149 P. H. Luo, C. Li and G. Q. Shi, Phys. Chem. Chem. Phys., 2012, 14,7360.
150 H. H. Cheng, Y. Zhao, Y. Q. Fan, X. J. Xie, L. T. Qu and G. Q. Shi,ACS Nano, 2012, 6, 2237.
This journal is ª The Royal Society of Chemistry 2012