Embed Size (px)
Citation preview

Cardiac Arrhythmia ManagementA Practical Guide for Nurses and Allied Professionals

Section 1 Basics of Cardiac Anatomy
and Electrophysiology

5
1.1 Cardiac Anatomy, Physiology, Electrophysiology, and Pharmacology
Linda K. Ottoboni , Aimee Lee , and Paul Zei
Electrical stimulation is the key in initiating the sequence of events that result in cardiac con-traction, the ultimate measure of cardiac perfor-mance. The inherent pacing properties that are required to generate an electrical impulse, the intrinsic conduction pathways that move depo-larization from the initial impulse throughout the entire cardiac muscle, and fi nally, the pat-terns of depolarization that create an optimal squeeze of the cardiac muscle are the result of the electrical conduction system and mechani-cal system functioning synchronously. Impulse generation and dispersion to all areas of the heart muscle via cell - to - cell activation and via electrical pathways must be well understood to comprehend the complexity of electrical con-duction and the strategies for treating conduc-tion abnormalities. This chapter will provide an overview of cellular physiology, electrical physiology, the anatomy of the conduction system, and the medications that can be used to treat conduction abnormalities. A thorough
understanding of the normal anatomy and physiology of the conduction system will enable the allied professional to understand the rationale for utilizing specifi c arrhythmia treat-ment modalities, whether it be medications, ablations, or devices.
ANATOMY OF THE CARDIAC CONDUCTION SYSTEM The anatomy of the conduction system is com-posed of electrical tracts within the myocar-dium. This electrical network is strategically arranged in the nodes, bundles, bundle branches, and branching networks of fascicles. The cells that form these structures lack con-tractile capability but can generate spontaneous electrical impulses and alter the speed of elec-trical conduction throughout the heart. The sinoatrial (SA) node, internodal tracts, atrio-ventricular (AV) node, bundle of His, right
Cardiac Arrhythmia Management: A Practical Guide for Nurses and Allied Professionals Edited by Angela Tsiperfal, Linda K. Ottoboni, Salwa Beheiry, Amin Al-Ahmad, Andrea Natale and Paul J. Wang© 2011 by Blackwell Publishing, Ltd.
6 Cardiac Arrhythmia Management
within the heart and is composed of cells capable of impulse formation or “ pacing. ” Pacing cells within the SA node independently move to a threshold potential, thereby initiat-ing depolarization. The SA node establishes the intrinsic heart rhythm between 60 – 100 pulses per minute but is infl uenced by the autonomic nervous system to meet the changing require-ments of the body (Fig. 1.1.2 ). The region of the sinus node has numerous nerve endings and is predominantly regulated by the parasympa-thetic system or acetylcholine at rest and the sympathetic tone is mediated with the release of norephinephrine to meet increased energy requirements.
The sinus node lies near the central artery whereby it obtains its blood supply from the right coronary artery 55 – 65% of the time, while in 35 – 45% the left circumfl ex provides blood
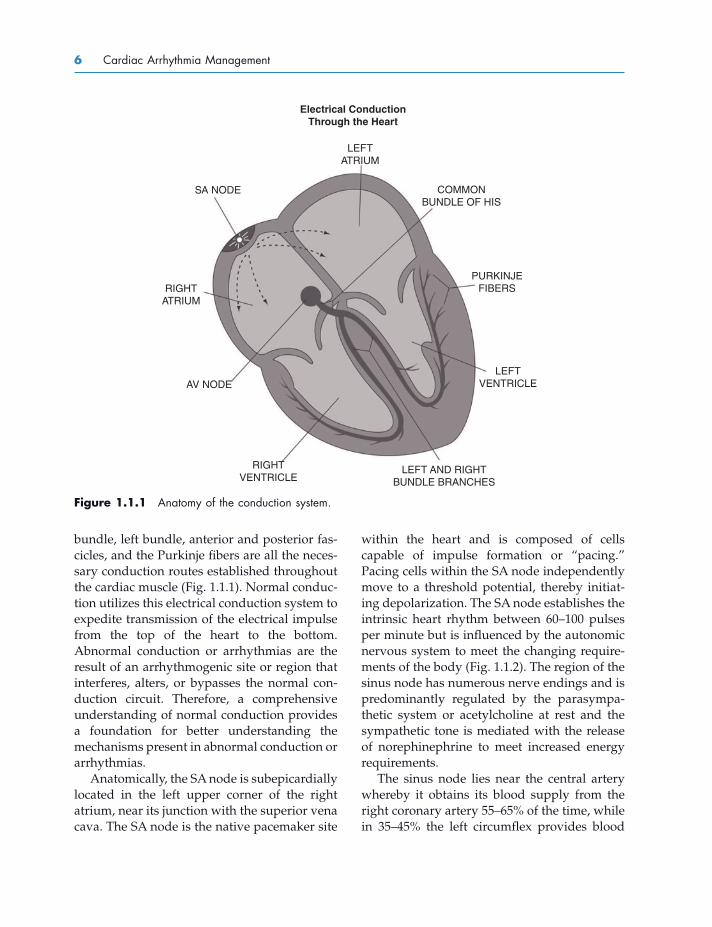
bundle, left bundle, anterior and posterior fas-cicles, and the Purkinje fi bers are all the neces-sary conduction routes established throughout the cardiac muscle (Fig. 1.1.1 ). Normal conduc-tion utilizes this electrical conduction system to expedite transmission of the electrical impulse from the top of the heart to the bottom. Abnormal conduction or arrhythmias are the result of an arrhythmogenic site or region that interferes, alters, or bypasses the normal con-duction circuit. Therefore, a comprehensive understanding of normal conduction provides a foundation for better understanding the mechanisms present in abnormal conduction or arrhythmias.
Anatomically, the SA node is subepicardially located in the left upper corner of the right atrium, near its junction with the superior vena cava. The SA node is the native pacemaker site
Figure 1.1.1 Anatomy of the conduction system.
SA NODE
LEFTATRIUM
Electrical ConductionThrough the Heart
COMMONBUNDLE OF HIS
PURKINJEFIBERS
LEFTVENTRICLE
LEFT AND RIGHTBUNDLE BRANCHES
RIGHTVENTRICLE
AV NODE
RIGHTATRIUM

Chapter 1.1 Cardiac Anatomy and Electrophysiology 7
vena cava, and travels through the atrial septum to the AV node, while the third pathway (Thorel ’ s) is responsible for moving the impulse inferiorly and posteriorly along the coronary sinus, arriving into the posterior portion of the AV node (slow pathway).
Once atrial depolarization is completed, depolarization moves into the AV node via the internodal tracts previously described or via cell - to - cell conduction. Normally, the structure of the AV node is the only conduction route from the atrium to the ventricle because the chambers are separated by fi brous and fatty tissue that is nonconductive. The primary function of the AV node is to slow electrical conduction adequately to synchronize atrial contribution to ventricular systole. The AV node is also capable of rescue pacing when the SA node fails and will provide a heart rate of 40 – 60 bpm (Fig. 1.1.2 ). By contrast, an ectopic
fl ow (Anderson et al. 1979 ). The function of the sinus node may be jeopardized if the blood supply is reduced due to coronary artery disease or an increase in fi brous tissue with maturity, resulting in fewer SA cells available for impulse formation within the sinus node (Davies and Pomerance 1972 ).
Once the impulse is initiated within the SA node, it not only travels cell to cell through the atrium but also utilizes more specialized, expedient pathways known as internodal tracts (Fig. 1.1.1 ). The Bachmann ’ s bundle moves away from the SA node anteriorly around the superior vena cava and then bifurcates with one branch leading from the right to the left atrium, while the other branch descends along the interatrial septum into the anterior portion of the AV node (fast pathway). The Wenckebach ’ s tract transfers the stimulus from the superior region of the SA node, posterior to the superior
Figure 1.1.2 Pacing rates associated with pacing sites within conduction system.
LEFTATRIUM
Cardiac Pacing Cells
SA NODE
(60−100 bpm)
AV NODE
(40−60 bpm)
PURKINJE
FIBERS
(20−40 bpm)
COMMONBUNDLE OF HIS
LEFTVENTRICLE
LEFT AND RIGHTBUNDLE BRANCHES
RIGHTVENTRICLE
RIGHTATRIUM

8 Cardiac Arrhythmia Management
signal, often early, being blocked and forced to move in the opposite direction. When the elec-trical signal conducts back toward the area of block, the structure has had time to recover and is now able to transmit the signal in the opposing direction. Hence, the critical timing sequence of the signal being transmitted creates an independent reentrant circuit.
Once the activation through the AV node occurs, depolarization travels to the common bundle of His (also called His bundle or common bundle). The region where the AV node (node of Tawara) and the His bundle join can be termed the triangle of Koch. Anatomically, the triangle of Koch includes the coronary ostium, the tendon of Todaro, and the tricuspid valve annulus along the septal leafl et. The AV node is approximately 5 – 6 mm long and 2 – 3 mm wide, and 0.5 – 1.0 mm thick, although there is some discrepancy in what is included in the AV node (Hecht et al. 1973 ; Becker and Anderson 1976 ). The blood supply of the AV node is the AV nodal artery and is usually dual supplied by the right coronary artery in 90% of the patients and the remaining 10% receive blood from the left circumfl ex coronary artery. Similar
site within the AV node is capable of pacing competitively against the SA node to produce arrhythmias or junctional tachycardias greater than 100 bpm.
The fast and slow pathways of the AV node are anatomical as well as functional structures. Slow pathway physiology is not seen in every individual. The fast pathway conducts more quickly but has a longer refractory period or recovery period. By contrast, the slow pathway conducts more slowly but has a shorter refrac-tory or recovery period. Conducted impulses commonly travel along the fast pathway through the AV node, but with increased heart rates or the presence of a premature stimulus, the fast pathway may be unable to transmit because it is unable to recover fast enough to transmit the stimulus or be “ refractory. ” Because the slow pathway has a shorter effec-tive recovery time or is able to recover more quickly, it is able to transmit a signal down the slow pathway while the fast pathway is still recovering. The timing of recovery and the ability or inability to transmit a signal can result in a reentrant tachycardia (Fig. 1.1.3 ). Reentry is the result of a circuit that is initiated by a
Figure 1.1.3 Reentry of the fast and slow pathways.

Chapter 1.1 Cardiac Anatomy and Electrophysiology 9
The specialized cells with automaticity reside within the SA node, AV node, and the Purkinje fi bers. All the rest of the cardiac cells, myocytes, are “ nonpacing cells ” or conducting cells, which means they can be stimulated by an elec-trical impulse arriving at the cell and then conduct or transmit the impulse from one cell to another cell once the cell is stimulated. Therefore, cardiac cells are unable to initiate an impulse contrary to pacing cells.
Cells have the property of pacing or con-ductivity due to the electrical charge or voltage on the inside of the cell compared with the voltage on the outside of the cell. If the electri-cal charge inside the cell is less than the charge on the outside, the transmembrane potential is “ negative. ” By contrast, if the electrical charge is greater inside the cell than outside the cell, the transmembrane potential is “ positive. ” Depolarization occurs when the transmem-brane potential is positive, while repolarization restores the cell to its negative state, making it available to accept an electrical stimulus in its negative or resting state. Pacing cells are able to depolarize independently, in contrast to a non-pacing cell, which is dependent on an outside stimulus to initiate depolarization.
The transmembrane potential is altered by ions moving in and out of the cell across the cellular membrane. Ion movement is the result of the selective permeability of ion channels distributed along the cell membrane. The movement of the Na + , K + , and Ca 2 + ions are the most predominant throughout the cardiac action potential. These ions move in or out of the cell as a result of a change in concentration gradient, electrical gradient, ion pumps, and altered membrane permeabilities (Table 1.1.1 ). Alterations in permeability to specifi c ions are most often regulated by voltage - gated channels that will open or close depending on the current measured between the inside and the outside of the cell, but there are additional properties that are responsible for moving ions in and out of the cell (Table 1.1.2 ). Some of these ion shifts occur passively, while other transport
to the SA node, there is evidence of a generous autonomic innervation of the AV node, and therefore, the autonomic nervous system infl u-ences the rate of conduction through the AV node. AV nodal conduction abnormalities arise from altered blood supply, change in autonomic tone, increased fi brous tissue replacing AV nodal tissue, and an alteration in the normal conduction route.
Once depolarization moves through the bundle of His, it branches out to the right and left bundle branches. The right bundle branch remains compact until it reaches the right distal septal surface, where it branches into the inter-ventricular septum and proceeds toward the free wall of the right ventricle. Because the left ventricle is larger in size, the left bundle branch moves conduction down the left septum and then bifurcates into a posterior and anterior descending fascicle. The left fascicles extend to the base of the papillary muscles and the adja-cent myocardium, while the right bundle stays along the interventricular septum superfi cially within the endocardium (see Fig. 1.1.1 ).
The fi nal destination is the arrival into the complex network of the specialized Purkinje fi bers, capable of independently pacing at a rate of 20 – 40 bpm if needed along with rapid con-duction (Fig. 1.1.2 ). Once the impulses arrive at the Purkinje fi bers, they proceed slowly from the endocardium to epicardium throughout the left and right ventricles. This assures earlier activation at the apex of the heart, the sequence necessary to achieve the most effi cient cardiac pumping, which is the intended outcome of cardiac depolarization .
CARDIAC ACTION POTENTIAL The conduction system is composed of two dis-tinctly different cells, pacing cells and nonpac-ing cells. “ Pacing ” cells are specialized cells with automaticity, meaning that they can move to a threshold potential independently and propagate or spontaneously initiate an impulse.

Table 1.1.1 Fundamentals of ion transport.
I. Passive ion movement — no energy requirement A. Concentration gradient
Ions shifting from an area of greater concentration to an area of lesser concentration in an effort to equalize the two sides
B. Electrical gradient Ions shifting from an area of greater electrical charge to an area
of lesser electrical charge in an effort to equalize the two sides
II. Active ion pumps or transporters (require energy!) A. Sodium/potassium pump (sodium ATPase)
Na + and K + transported against their concentration gradients and sodium moves out of the negatively charged interior → Three Na + ions OUT of the cell ← Two K + move INTO the cell
B. Calcium pump Ca 2 + removal from inside cell during repolarization
→ Ca 2 + to OUTSIDE of the cell C. Sodium/calcium exchange (NCX)
A small ionic gradient current is generated resulting in the transport of three Na + ions in exchange for one Ca 2 + ion; the direction of the ion transfer is dependent on the electrical charge of the cell 1. Repolarization
← Three Na + move INTO the cell → One Ca 2 + moves OUT of the cell
2. Depolarization phase → Three Na + move OUT of the cell ← One Ca 2 + moves INTO the cell
III. Ion channel properties A. Ion permeability
The selective permeability that allow ions to move through the open channel at specifi c times
B. Gating — opening/closing of ion channels 1. Voltage gated
Ion permeability enhanced or decreased based on the measured voltage of the membrane potential
2. Ligand - dependent gating The opening of the channel is dependent on activation of a
protein along the binding site (i.e., I KAch → acetycholine binds to M - 2 receptor → activates G protein - signaling pathway → activates inward rectifying K + channel)
3. Mechanosensitive gating A physical input transfers into an electrical signal, that is,
stretch → electrical signal Least studied but responsible for arrhythmias associated with
dilatation
10
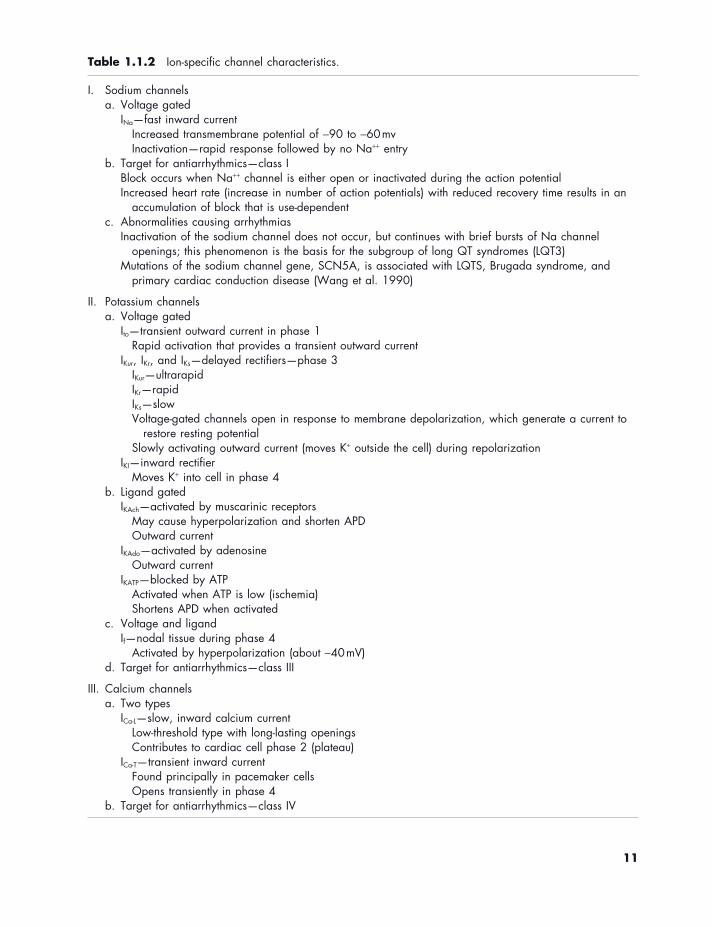
Table 1.1.2 Ion - specifi c channel characteristics.
I. Sodium channels a. Voltage gated
I Na — fast inward current Increased transmembrane potential of − 90 to − 60 mv Inactivation — rapid response followed by no Na + + entry
b. Target for antiarrhythmics — class I Block occurs when Na + + channel is either open or inactivated during the action potential Increased heart rate (increase in number of action potentials) with reduced recovery time results in an
accumulation of block that is use - dependent c. Abnormalities causing arrhythmias
Inactivation of the sodium channel does not occur, but continues with brief bursts of Na channel openings; this phenomenon is the basis for the subgroup of long QT syndromes (LQT3)
Mutations of the sodium channel gene, SCN5A, is associated with LQTS , Brugada syndrome, and primary cardiac conduction disease (Wang et al. 1990 )
II. Potassium channels a. Voltage gated
I to — transient outward current in phase 1 Rapid activation that provides a transient outward current
I Kur , I Kr , and I Ks — delayed rectifi ers — phase 3 I Kur — ultrarapid I Kr — rapid I Ks — slow Voltage - gated channels open in response to membrane depolarization, which generate a current to
restore resting potential Slowly activating outward current (moves K + outside the cell) during repolarization
I KI — inward rectifi er Moves K + into cell in phase 4
b. Ligand gated I KAch — activated by muscarinic receptors
May cause hyperpolarization and shorten APD Outward current
I KAdo — activated by adenosine Outward current
I KATP — blocked by ATP Activated when ATP is low (ischemia) Shortens APD when activated
c. Voltage and ligand I f — nodal tissue during phase 4
Activated by hyperpolarization (about − 40 mV) d. Target for antiarrhythmics — class III
III. Calcium channels a. Two types
I Ca - L — slow, inward calcium current Low - threshold type with long - lasting openings Contributes to cardiac cell phase 2 (plateau)
I Ca - T — transient inward current Found principally in pacemaker cells Opens transiently in phase 4
b. Target for antiarrhythmics — class IV
11

12 Cardiac Arrhythmia Management
potential is able to return back to home (repolarization — phases 1 – 4) and prepare to depart from home or baseline (resting — phase 4) once again. What actually occurs at each phase is described below.
Phase 0 — Rapid Depolarization When an electrical impulse arrives at the cell, the membrane potential shifts from approxi-mately − 90 to − 60 v and reaches “ threshold ” potential. The shift in voltage triggers the “ voltage - gated ” sodium channels to open and the permeability of the plasma membrane to sodium ions (P Na + ) increases, thereby resulting in rapid movement of sodium ions from extra-cellular to intracellular along their electro-mechanical gradient. Positively charged Na + ions shift from the outside of the cell to the inside of the cell, causing the membrane poten-tial to become more positive, now to approxi-mately 0 mV (Fig. 1.1.4 ). The “ fast ” sodium channels inactivate within a few milliseconds, decreasing permeability of the cellular mem-brane to Na + and preventing any further voltage increase.
mechanisms require energy at the cellular level. The ion “ pumps ” or ion transfers that require energy will be at risk in the event that the cell does not have an energy source or is oxygen deprived, for example, ischemia provides an opportunity for arrhythmias to occur.
Phases of the Cardiac Action Potential The cardiac action potential of the “ nonpacing ” cell consists of fi ve phases:
• Phase 0 — rapid depolarization • Phase 1 — early rapid repolarization • Phase 2 — plateau phase • Phase 3 — repolarization • Phase 4 — resting phase
The cell moves from one phase to another very quickly with the entire process occurring within milliseconds. Although we describe each spe-cifi c phase, the transition from one phase to another is dynamic and seamless. The action potential takes a round - trip journey in that the signal is able arrives at baseline (phase 4) and is able to travel to the destination (depolarization — phase 0). Then, the action
Figure 1.1.4 Phase 0 — rapid depolarization. Sodium moving into the cell quickly increases the intracellular charge, creating a positive transmembrane potential.
Chapter 1.1 Cardiac Anatomy and Electrophysiology 13
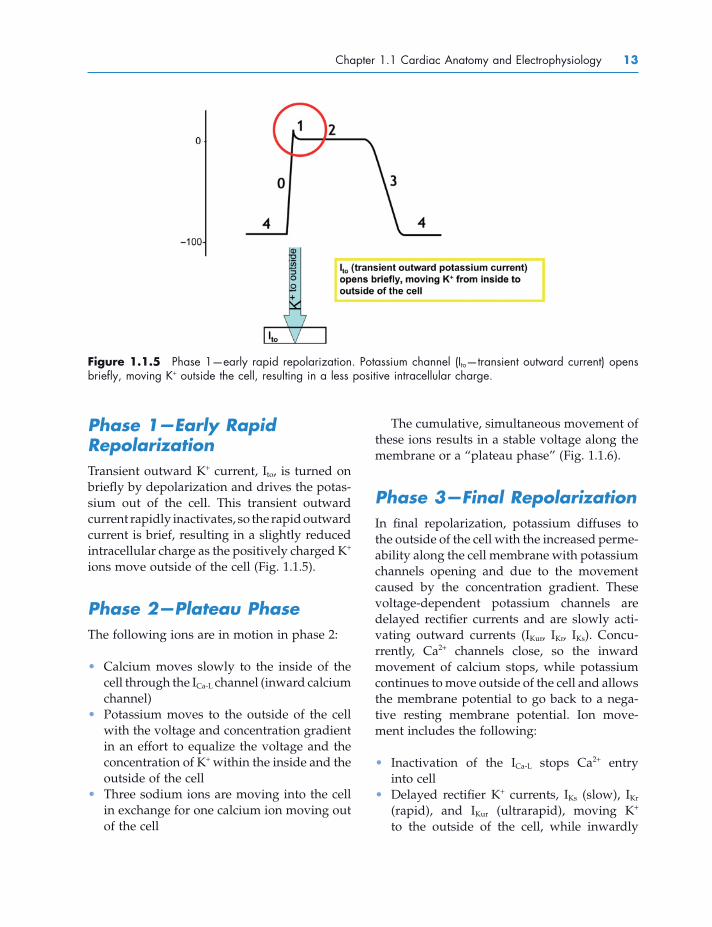
Figure 1.1.5 Phase 1 — early rapid repolarization. Potassium channel (I to — transient outward current) opens briefl y, moving K + outside the cell, resulting in a less positive intracellular charge.
Phase 1 — Early Rapid Repolarization Transient outward K + current, I to , is turned on briefl y by depolarization and drives the potas-sium out of the cell. This transient outward current rapidly inactivates, so the rapid outward current is brief, resulting in a slightly reduced intracellular charge as the positively charged K + ions move outside of the cell (Fig. 1.1.5 ).
Phase 2 — Plateau Phase The following ions are in motion in phase 2:
• Calcium moves slowly to the inside of the cell through the I Ca - L channel (inward calcium channel)
• Potassium moves to the outside of the cell with the voltage and concentration gradient in an effort to equalize the voltage and the concentration of K + within the inside and the outside of the cell
• Three sodium ions are moving into the cell in exchange for one calcium ion moving out of the cell
The cumulative, simultaneous movement of these ions results in a stable voltage along the membrane or a “ plateau phase ” (Fig. 1.1.6 ).
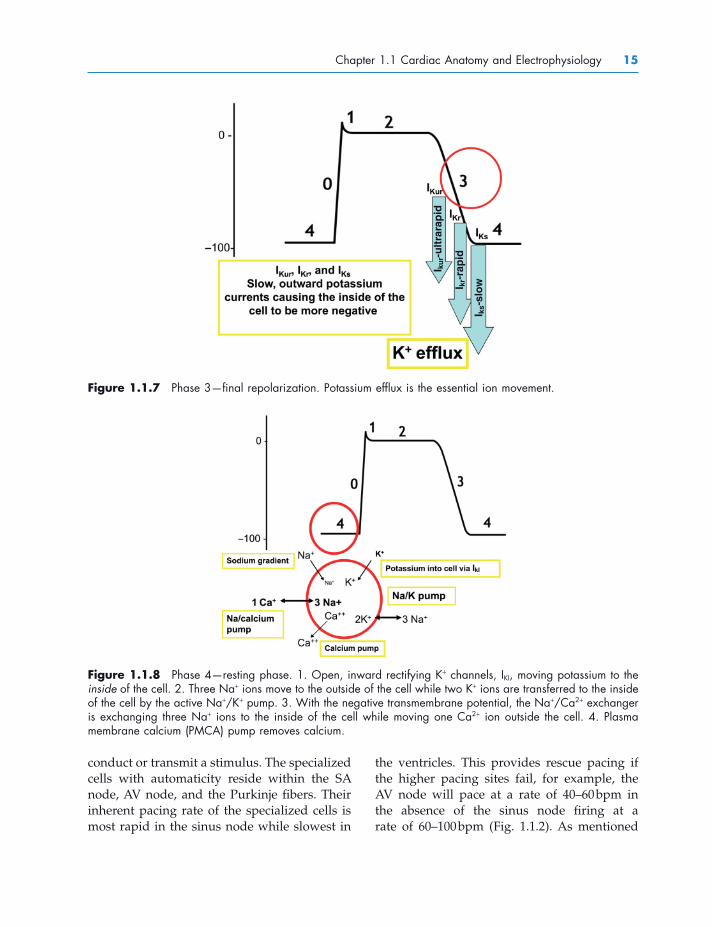
Phase 3 — Final Repolarization In fi nal repolarization, potassium diffuses to the outside of the cell with the increased perme-ability along the cell membrane with potassium channels opening and due to the movement caused by the concentration gradient. These voltage - dependent potassium channels are delayed rectifi er currents and are slowly acti-vating outward currents (I Kur , I Kr , I Ks ). Concu-rrently, Ca 2 + channels close, so the inward movement of calcium stops, while potassium continues to move outside of the cell and allows the membrane potential to go back to a nega-tive resting membrane potential. Ion move-ment includes the following:
• Inactivation of the I Ca - L stops Ca 2 + entry into cell
• Delayed rectifi er K + currents, I Ks (slow), I Kr (rapid), and I Kur (ultrarapid), moving K + to the outside of the cell, while inwardly

14 Cardiac Arrhythmia Management
rectifying currents, I KI and I KAch , result in the movement of positive charges out of the cell.
• Potassium conductance falls to plateau levels as a result of the inward rectifi cation, membrane conductance changes with voltage (K + channels are open at negative potentials but closed at less negative or posi-tive voltages) (Fig. 1.1.7 )
Phase 4 — Resting Membrane Potential The cardiac action potential relies on the cell to adequately prepare for depolarization in the resting phase. It is during the cardiac cell resting phase that the intracellular potential is − 50 to − 95 v relative to the measured voltage out-side of the cell, making it negative. During resting phase, there are more potassium ions within the cellular membrane (intracellular), while the majority of sodium and calcium ions are kept on the outside of the cell membrane (extracellular).
Figure 1.1.6 Phase 2 — plateau phase. Stable charge created by equivalent ion movement to the inside and to the outside of the cell.
Although phase 4 is referred to as “ resting ” phase, the negative intracellular voltage is the result of ion movement related to a combina-tion of complex systems that include the opening of selective ion channels, altering membrane permeability, concentration gradi-ents, electrogenic gradients, and active ion pumps (Fig. 1.1.8 ). This phase includes the sodium - potassium pump, which requires energy, thus it relies on oxygenation to the area to maintain resting phase. Maintaining the resting membrane potential of − 90 to − 100 mV allows the cell to be ready to accept an outside stimulus or to be depolarized.
Action Potential of Pacemaker Cells (Slow Response) The unique quality of the pacing cells is that they have the capability of reaching depolariza-tion independently. Therefore, they can initiate a stimulus as opposed to being able to only
Chapter 1.1 Cardiac Anatomy and Electrophysiology 15
Figure 1.1.7 Phase 3 — fi nal repolarization. Potassium effl ux is the essential ion movement.
I ku
r-u
ltra
rap
id
I kr-
rap
id
I ks-s
low
Figure 1.1.8 Phase 4 — resting phase. 1. Open, inward rectifying K + channels, I KI , moving potassium to the inside of the cell. 2. Three Na + ions move to the outside of the cell while two K + ions are transferred to the inside of the cell by the active Na + /K + pump. 3. With the negative transmembrane potential, the Na + /Ca 2 + exchanger is exchanging three Na + ions to the inside of the cell while moving one Ca 2 + ion outside the cell. 4. Plasma membrane calcium (PMCA) pump removes calcium.
conduct or transmit a stimulus. The specialized cells with automaticity reside within the SA node, AV node, and the Purkinje fi bers. Their inherent pacing rate of the specialized cells is most rapid in the sinus node while slowest in
the ventricles. This provides rescue pacing if the higher pacing sites fail, for example, the AV node will pace at a rate of 40 – 60 bpm in the absence of the sinus node fi ring at a rate of 60 – 100 bpm (Fig. 1.1.2 ). As mentioned

16 Cardiac Arrhythmia Management
tial as the cardiac cell in resting phase. Instead, the voltage of the cell at the onset of phase 4 is − 40 to − 70. This is the result of the presence of the I f channel, pacemaker or “ funny ” current, which is a current activated by hyperpolariza-tion and causes Na + and K + to enter the cell, thus allowing the cell to independently move to depolarization. Automaticity is dependent on a combination of the I f channel, the deactiva-tion of I KI current, and the transient inward calcium current, I Ca - T . The I f channel moves Na + and K + into the cell to offset the deactivation of I KI current, which causes an inward K + current. The I Ca - T current is limited to pacing cells exclu-sively and the opening of this calcium current allows calcium to move slowly into the cell, moving the charge inside of the cell to − 30 and − 40, resulting in “ threshold ” potential, and fi nally, opening of the fast Na + channels for depolarization to occur.
Phase 0 — Depolarization of the Pacing Cell The signifi cant contrast of the pacemaker cell and the cardiac cell during phase 0 is the absence of a stimulus to alter the transmem-brane potential in the pacing cell. The cell itself
previously, the intrinsic pacing rate is greatly infl uenced by the balance between the sympa-thetic and parasympathetic autonomic nervous system.
The ability to “ pace, ” propagate, or initiate a signal is the result of independent ion shifting within the cell through specialized ion channels that are only available within the pacing cell structure. Phase 4 and phase 0 in the pacing cells are the most distinctly different phases when compared with cardiac cells (Fig. 1.1.9 ). The unique characteristics of the pacing cell are described in detail below.
Phase 4 — Diastolic Depolarization of the Pacing Cell Automaticity of the pacing cell is the result of ions shifting to achieve a net gain in intracel-lular positive charges during diastole. This ion movement allows the cell to independently reach a “ threshold ” potential. There are a number of differences between the action potential of the pacing cell and the cardiac cell that allow this to be achieved. First, the trans-membrane potential of the pacing cell does not return to the same negative membrane poten-
Figure 1.1.9 Action potential of pacing cell.

Chapter 1.1 Cardiac Anatomy and Electrophysiology 17
with chemical structures or physical properties, but describes four ways in which abnormal cardiac rhythms can be corrected or prevented (Vaughan Williams 1984 ). Based on the Vaughan Williams classifi cation, there are four main classes of antiarrhythmic medications (Tables 1.1.3 and 1.1.4 ). Although much maligned, the Vaughan Williams classifi cation system is still the most commonly used by those in the medical fi eld worldwide. Because the antiar-rhythmic drugs usually target a specifi c ion and either block or enhance its movement in or out of the cell, there are electrocardiogram (ECG ) changes that may be evident as a result of that (see Table 1.1.5 ).
The classes are further simplifi ed and subdi-vided based on the primary electrophysiologi-cal effect of either their ability to convert the rhythm or control the rate (Table 1.1.6 ). Class I and class III drugs are more effectively utilized to prevent arrhythmias and maintain sinus rhythm. Class IV drugs provide rate control with the primary goal of reducing conduction through the AV node, while class II drugs are used to reduce heart rate and maintain sinus rhythms in those patients who have arrhyth-mias that are triggered by catecholamines. The discussion below describes each group in more detail.
Class I Drugs: Sodium Channel Blockade The class I drugs act by modulating or blocking the sodium channels, thereby inhibiting or altering phase 0 depolarization (Fig. 1.1.4 ). Their dominant electrophysiological property has been related to their ability to reduce the maximal rate of depolarization in cardiac muscle. A reduction in the rate of depolariza-tion by therapeutic concentrations of these drugs has been found to be associated with an increase in the threshold of excitability, a depression in conduction velocity, and a pro-longation in the effective refractory period (Singh 1978 ). Three different subgroups, class IA, IB, and IC, have been identifi ed because
moves from a transmembrane potential of − 60 to “ threshold potential ” by a slow, inward current rather than a fast inward Na current, as described above. The discharge rate of the sinus node normally exceeds the discharge rate of the other potentially automatic pacemaker sites, and therefore, maintains the dominant rate. It is also more sensitive to the effects of norephi-nephrine (sympathetic) and acetycholine (para-sympathetic) so it provides the best physiological heart rate. The lower, alternative pacing sites in the AV node and Purkinje fi bers provide an electrical stimulus in the absence of an intact sinus node. The complex intrinsic pacing capa-bility of the heart is essential in providing optimal blood fl ow and meeting the oxygen demands of the body during times of increased physical activity and/or increased stress.
DRUGS FOR CARDIAC ARRHYTHMIAS Cardiac arrhythmias generally result from an abnormality in the rate, rhythm, or conduction of an electrical impulse in the heart (Perry and Illsley 1986 ). These abnormalities are distur-bances in normal impulse initiation (automatic-ity), impulse conduction, or both. Various antiarrhythmic agents affect intracellular and extracellular concentrations of sodium, potas-sium, calcium, and magnesium. The balance of all these molecular components have varying effects on the electrophysiology of the heart and are critical to controlling arrhythmias with antiarrhythmic medications. In general, antiar-rhythmic medications are available to treat tachyarrhythmias. There are no currently avail-able medications to treat bradyarrhythmias effectively, particularly in oral form.
The classifi cation of antiarrhythmic agents is discussed below, with emphasis on the particu-lar electrophysiological action of each drug classifi cation. Several of the drugs studied had more than one of the four actions, so that it deserves emphasis that the classifi cation is not so much categorization of drugs in accordance

18 Cardiac Arrhythmia Management
Table 1.1.3 Drug effects on ECG .
Drug Effects on ECG
Amiodarone Bradycardia, prolongs PR, QRS, and QT
Acebutol, esmolol, metoprolol, propanolol Bradycardia, prolongs PR
Diltiazem, verapamil No change in QRS
Adenosine Prolongs PR, heart block (transient)
Sotalol Bradycardia, prolongs PR and QT
Dofetilide, ibutilide Prolongs QT
Flecainide, propafenone Prolongs PR and QRS
Digoxin Prolongs PR, depresses ST segment, fl attens T wave
Lidocaine, mexilitine No signifi cant change
Dronedarone Bradycardia, prolongs QT
Class Effect on repolarization/depolarization
Phase of cardiac action potential
Effect on action potential duration
Effect on ECG
IA: sodium channel blockade
Prolongs repolarization
Phase 0 Depression Prolongs
IB Shortens depolarization
Phase 0 Weak phase 0 depression
Decrease
IC No effect Strong phase 0 Depression No effect or mildly prolongs
II: beta adrenergic blockade
Enhanced depolarization
Enhanced phase 4
III: potassium channel blockers
Prolongs repolarization
Phase 3 Prolongs QT interval is longer at slower heart rates, decreases as heart rate increases
IV: calcium channel blockers
Slows depolarization
Phase 4 Prolongs Slows the sinus rate and increases PR
their mechanism or duration of action is some-what different due to variable rates of drug binding to and dissociation from the channel receptor (Snyders et al. 1991 ).
The major drugs with class IA classifi cation are quinidine , procainamide , and disopyramide . These drugs depress phase 0 (sodium -
dependent) depolarization, thereby slowing conduction. They also have moderate potas-sium channel blocking activity (which tends to slow the rate of repolarization and prolong action potential duration [APD]), anticholiner-gic activity, and depress myocardial contractil-ity. At slower heart rates, when use - dependent

Chapter 1.1 Cardiac Anatomy and Electrophysiology 19
Table 1.1.4 Specifi cs of each drug classifi cation.
Class I: sodium channel blockers
Class IA, IB, IC Slow down the depolarization
Class II: beta adrenergic blockers Slow depolarization by blocking the beta
receptors in the parasympathetic nervous system
Class III: potassium ion channel blockers Prolong phase 3 (action potential duration) Prolong the effective refractory period and
lengthen the QT interval
Class IV: calcium channel blockers Affect primarily SA and AV nodes Block the infl ux of calcium into the cell Shorten depolarization, prolong repolarization,
slow down the conduction down the AV node
Class V: miscellaneous (none of the above) Adenosine: slows sinus node automaticity and AV
conduction Digoxin: increases phase 4 slope and decreases
resting membrane potential, decreases conduction velocity, increases vagal tone
Table 1.1.5 Antiarrhythmic drug effects on the ECG .
Antiarrhythmic medication
Conduction effects
PR QRS QT ST T wave
Amiodarone Bradycardia Prolonged Prolonged Prolonged
Acebutolol, esmolol, metoprolol, propanolol
Bradycardia Prolonged
Diltiazem, verapamil, No change
Adenosine Transient heart block
Prolonged
Sotalol Bradycardia Prolonged Prolonged
Dofetilide, ibutilide Prolonged
Flecainide, propafenone
Prolonged Prolonged
Digoxin Prolonged Depressed Flattens
Lidocaine, mexiletine No signifi cant change
blockade of the sodium current is not signifi -cant, potassium channel blockade may become predominant (reverse use dependence), leading to prolongation of the APD and QT interval and increased automaticity.
The class IB drugs include lidocaine , mexi-letine , and tocainide . They have less prominent sodium channel blocking activity at rest but effectively block the sodium channel in depo-larized tissues. This group tends to bind in the Na + channel inactivated state (which follows the fast channel opening in phase 0 depolariza-tion) and dissociate from the sodium channel more rapidly than other class I drugs. As a result, they are more effective with tachyar-rhythmias than with slow arrhythmias.
The class IC drugs, fl ecainide and propafenone , block both the open and inactivated sodium channels and thus, slow conduction. They dis-sociate slowly from the sodium channels during diastole, resulting in increased effect at more rapid rate (use dependence). This characteristic is the basis for their antiarrhythmic effi cacy,

20 Cardiac Arrhythmia Management
Table 1.1.6 Common drugs for atrial fi brillation and supraventricular arrhythmias.
Arrhythmia Drug of choice Alternative
Atrial fl utter/fi brillation
Acute management Rate control: verapamil, diltiazem, beta blocker, or digoxin given intravenously
Chronic treatment Rhythm conversion: DC cardioversion Rate control: oral verapamil, diltiazem, beta blocker, or digoxin
Catheter ablation to eliminate arrhythmia
Other supraventricular tachycardias
Maintain sinus rhythm: amiodarone, sotalol, fl ecainide, propafenone, or dofetilide
IV verapamil, adenosine, or diltiazem Quinidine, procainamide, disopyramide, amiodarone (may require drug loading)
Acute management IV esmolol, another beta blocker, or digoxin for termination
Long - term suppression Beta blockers, verapamil, diltiazem, fl ecainide, propafenone, amiodarone, sotalol, or digoxin
Vagotonic maneuvers (such as carotid sinus massage, gagging, or the Valsalva maneuver) that impair AV nodal conduction may be tried fi rst Catheter ablation can cure most patients
DC, direct current; IV, intravenous.
especially against supraventricular arrhyth-mia. Use dependence may also contribute to the proarrhythmic activity of these drugs, espe-cially in the diseased myocardium, resulting in incessant ventricular tachycardia.
• Flecainide was fi rst introduced in 1985 for treatment of ventricular arrhythmias then subsequently for oral use to prevent supra-ventricular arrhythmias. The indications for using fl ecainide to treat ventricular arrhyth-mias were limited after a controlled trial found that postmyocardial infarction patients with asymptomatic ventricular arrhythmias who took the drug had twice as high a mor-tality rate as patients who took placebo (Echt et al. 1991 ). Flecainide decreases the rate of cardiac conduction in all parts of the heart. In animals, at normal resting heart rates, the drug causes only a small increase in the refractory period, but at the rapid rates typical of atrial fi brillation, fl ecainide mark-
edly increases atrial APD and refractoriness (Wang et al. 1990 ). The drug is metabolized in the liver and excreted in the urine. Rarely, patients may be defi cient in the enzyme system required for metabolism of the drug. Flecainide is effective for prevention of paroxysmal supraventricular tachycardia, moderately effective for suppression of par-oxysmal atrial fi brillation, and is generally well tolerated. Because of its proarrhythmic effects, however, use of the drug should be restricted to patients without clinically signif-icant structural heart disease who have dis-abling symptoms refractory to other drugs.
• Propafenone, much like fl ecainide, mark-edly decreases cardiac conduction velocity. And like fl ecainide, it can also aggravate existing arrhythmias or precipitate new ones, especially in patients with underlying heart disease and sustained ventricular tachycardia. Propafenone has a low degree of beta blocking activity in some patients.

Chapter 1.1 Cardiac Anatomy and Electrophysiology 21
changes are manifested on the surface ECG by prolongation of the QT interval, providing the substrate for torsade de pointes, a polymorphic ventricular tachycardia. Amiodarone is an exception, with very little proarrhythmic activ-ity. Amiodarone has since been found to be a potent antiarrhythmic drug in the clinic, but although it does prolong the QTc (corrected QT) interval on the ECG in patients, ventricular arrhythmias have not been encountered during prolonged periods of treatment in large num-bers of patients (Singh 1978 ; see Table 1.1.5 ).
• Amiodarone — Among available antiarrhyth-mics, amiodarone ( Cordarone and others) is the most effective for prevention of atrial fi brillation and of ventricular tachycardia or fi brillation. The antiarrhythmic actions of amiodarone can be attributed to its property of inhibiting adrenergic stimulation (alpha and beta blocking properties), its effects on sodium, potassium, and calcium channels, its ability to prolong the action potential with consequent lengthening of the effective refractory period in myocardial tissue and decreasing AV nodal conduction and sinus node function. Multiple clinical trials have indicated that amiodarone is the most potent antiarrhythmic agent for the control of refractory ventricular tachyarrhythmias and for the prophylaxis of recurrent supraven-tricular tachyarrhythmias, including atrial fi brillation or fl utter complicating the Wolff – Parkinson – White syndrome. Amiodarone is well tolerated by most patients, but there are several potential side effects that need to be monitored for closely.
• Dronedarone — This is one of the newer class III antiarrhythmic drugs and is a “ cousin ” to amiodarone; it is indicated for the treatment of atrial arrhythmias. The primary differ-ences compared with amiodarone are attrib-utable to the lack of iodine in the molecular structure, along with a reduced half - life due to its less hydrophobic nature. As a result, it may be associated with fewer long - term
Class II Drugs: Beta Blockade (Antagonists) Hyperactivity of the sympathetic nervous system has been recognized for many years as a factor in the genesis of cardiac arrhythmias. The class II drugs, such as atenolol , metoprolol , carvedilol , act by inhibiting sympathetic activity, primarily by causing beta blockade. Their prin-cipal electrophysiological effect on heart muscle in clinically relevant concentrations is the depression of phase 4 depolarization (see Fig. 1.1.8 ), resulting in a reduced heart rate. Only in very high concentrations do these drugs exert effects on other parameters, such as the upstroke velocity of the phase 0 of the action potential (Singh 1978 ). Beta agonists or catecholamines (i.e., epinephrine and norepinephrine) are endogenous, neurohormonal substances that mediate diverse physiological and metabolic responses in man by interaction with adrener-gic receptors (beta receptors) in various tissues. As a result of this, beta agonists potentiate positive chronotropic (increased heart rate) and inotropic (increased contractility) actions. By contrast, beta adrenergic antagonists ’ main therapeutic effect is to slow the heart rate and decrease myocardial contractility. They reduce sinus rate, especially when sympathetic control of the heart is dominant, as during exercise. They have less effect on heart rate in an indi-vidual at rest. They also decrease the rate of spontaneous depolarization of ectopic pace-makers, slow conduction in the atria and AV node, and increase the refractory period of AV node.
Class III Drugs: Potassium Channel Blockade Class III drugs, amiodarone , ibutilide , dofetilide , sotalol , azimilide, and dronedarone , block the potassium channels, thereby prolonging repo-larization, the APD, and the refractory period (Arnsdorf et al. 2009 ; see Fig. 1.1.7 ). These
22 Cardiac Arrhythmia Management
in patients with preexisting heart block and or sick sinus syndrome. Dofetilide is gener-ally well tolerated but like other antiarrhyth-mic agents in its class, torsades de pointes may be induced as a consequence of therapy. Therefore, it should be initiated and doses titrated while in a hospital with facilities for cardiac rhythm monitoring and assessment.
Class IV Drugs: Calcium Channel Blockade (Antagonists) As a class, calcium channel antagonists do not increase the effective refractory period of the atria, ventricle, His - Purkinje fi bers, or the acces-sory pathways in the heart. The dominant effect of calcium channel antagonists is slowing of conduction in the AV node with the prolonga-tion of the AV nodal refractory period (Singh et al. 1983 ). Selective calcium channel antago-nists, such as verapamil and diltiazem, have been found to have some antiarrhythmic activ-ity. They preferentially affect slow - response myocardial tissue rather than fast - response tissue. Slow - response tissues (the SA and AV nodes) depend on calcium currents to generate slowly propagating action potentials. By con-trast, fast - response myocardial tissues (the atria, specialized infranodal conducting system, the ventricles, and accessory pathways) depend on sodium channel currents. Verapamil is the prototype calcium antagonist and has the most clearly defi ned antiarrhythmic properties (Singh et al. 1983 ). Verapamil, as well as diltia-zem, terminate paroxysmal supraventricular tachycardia and slow the ventricular response in atrial fl utter and fi brillation. They also have prophylactic value in preventing recurrences of paroxysmal supraventricular tachycardia and controlling the ventricular response in atrial fl utter and fi brillation during long - term oral therapy. They play a much more limited role in the treatment of ventricular arrhythmias (Singh et al. 1983 ).
complications compared with amiodarone. Its effi cacy can be evaluated more quickly, as achieving therapeutic levels is not reliant on a “ loading ” regimen; rather it is given twice daily, with steady state achieved usually within 3 – 7 days.
• Sotalol — Sotalol is a racemic mixture of d - sotalol and l - sotalol; both isomers have similar class III antiarrhythmic effects, while the l - isomer is responsible for virtually all of the beta blocking activity. Sotalol contains both beta adrenoreceptor blocking (class II) and cardiac APD prolongation (class III) properties. The noncardioselective beta - blocking effect of sotalol (increased sinus cycle length, slowed heart rate, decreased AV nodal conduction, and increased AV nodal refractoriness) occurs at oral doses as low as 25 mg/day. The class III effects (pro-longation of the atrial and ventricular mono-phasic action potentials, and effective refractory prolongation of atrial muscle, ventricular muscle, and AV accessory path-ways in both the antegrade and retrograde directions) are seen only at oral doses ≥ 160 mg/day. Sotalol should be initiated and doses increased in a hospital with facilities for cardiac rhythm monitoring and assess-ment, as proarrhythmic events can occur after initiation of therapy and with each upward dosage adjustment.
• Dofetilide — Dofetilide has no effect on sodium channels, adrenergic alpha recep-tors, or adrenergic beta receptors. It increases the monophasic APD and effective refrac-tory period of the myocyte, thereby termi-nating reentrant tachyarrhythmias and preventing their reinduction (Roukoz et al. 2007 ). The increase in the QT interval is a function of prolongation of both effective and functional refractory periods in the His - Purkinje system and the ventricles. Changes in cardiac conduction velocity and sinus node function have not been observed in patients with or without structural heart disease. PR and QRS width remain the same

Chapter 1.1 Cardiac Anatomy and Electrophysiology 23
Singh BN . 1978 . Rational basis of antiarrhyth-mic therapy: clinical pharmacology of com-monly used antiarrhythmic drugs . Angiology 29 : 206 – 242 .
Singh BN , et al. 1983 . Antiarrhythmic effects of verapamil . Angiology 34 : 572 – 590 .
Snyders DJ , et al. 1991 . Mechanisms of drug - channel interaction . In: The Heart and Cardiovascular System , p. 2165 ( HA Fozzard , et al., eds.). New York : Raven Press .
Vaughan Williams EM . 1984 . A classifi cation of antiarrhythmic actions reassessed after a decade of new drugs . J Clin Pharmacol 24 : 129 – 147 .
Wang ZG , et al. 1990 . Effects of fl ecainide and quinidine on human atrial action potentials. Role of rate - dependence and comparison with guinea pig, rabbit, and dog tissues . Circulation 82 ( 1 ): 274 – 283 .
RESOURCES Bennett PB , et al. 1995 . Molecular mechanism
for an inherited cardiac arrhythmia . Nature 376 : 683 – 685 .
Bharati S . 2001 . Anatomy of the atrioventricu-lar conduction system - response . Circulation 103 : e30 – e31 .
Clusin WT . 2007 . Mechanisms of calcium tran-sient and action potential alternans in cardiac cells and tissues . Am J Physiol Heart Circ Physiol 294 : H1 – H10 .
Grant AO . 2009 . Cardiac ion channels . Circ Arrhythm Electrophysiol 2 : 185 – 194 .
Laske TG , Iaizzo PA . 2005 . The cardiac conduc-tion system . In: The Handbook of Caridac Anatomy, Physiology, and Devices , pp. 123 – 136 ( PA Iaizzo , ed.). Totowa, NJ : Humana Press .
Libby P . 2007 . Basic electrophysiological prin-ciples . In: Braunwald ’ s Heart Disease: A Textbook of Cardiology Medicine ( P Libby , ed.). Philadelphia : Saunders/Elsevier .
Ly HQ , Nattel S . 2009 . Is stem cell therapy pro-arrhythmic? Circulation 119 : 1824 – 1831 .
Antiarrhythmic drugs are available as one treatment option for controlling arrhythmias. As you can see, there are a variety of medica-tions available to treat the full spectrum of tachyarrhythmias. Each clinician may prefer one agent over the other, and a particular patient ’ s arrhythmia control and tolerance of medications may vary considerably. Therefore, the use of antiarrhythmics in patient man-agement may not be straightforward and may require increased patient surveillance. Additional methods of treatment, that is, abla-tion, may be utilized as an adjunct to medica-tion and provides the patient with additional options for controlling arrhythmias.
REFERENCES Anderson KR , et al. 1979 . Location and vascular
supply of sinus node in human heart . Br Heart J 41 : 38 – 42 .
Arnsdorf MF , et al. 2009 . Antiarrhythmic drugs to maintain sinus rhythm in patients with atrial fi brillation: clinical trials . Available at http://Uptodate.com (accessed July 15, 2009).
Becker AE , Anderson RH . 1976 . Morphology of the human atrioventricular junctional area . In: The Conduction System of the Heart: Structure, Function, and Clinical Implications , pp. 263 – 286 ( HJJ Wellens , KI Lie , MJ Janse , eds.). Philadelphia : Leas & Febiger .
Davies MJ , Pomerance A . 1972 . Quantitative study of ageing changes in the human sino-atrial node and internodal tracts . Br Heart J 34 : 150 – 152 .
Echt DS , et al. 1991 . Mortality and morbidity in patients receiving encainide, fl ecainide, or placebo. The Cardiac Arrhythmia Suppression Trial . N Engl J Med 324 ( 12 ): 781 – 788 .
Hecht HH , et al. 1973 . Atrioventricular and intraventricular conduction: revised nomen-clature and concepts . Am J Cardiol 31 : 232 – 244 .
Perry RS , Illsley SS . 1986 . Basic cardiac electro-physiology and mechanisms of antiarrhyth-mic agents . Am J Hosp Pharm 43 ( 4 ): 957 – 974 .

24 Cardiac Arrhythmia Management
Mohrman DE , Heller LJ . 2006 . Chapter 2. Characteristics of cardiac muscle cells . In: Cardiovascular Physiology , 6th ed . ( DE Mohrman , LJ Heller , eds.). Available at www.accessmedicine.com.laneproxy.stanford.edu/content.aspx?aID=2372734 .
Shen W , et al. 1996 . Cardiac arrhythmias — anatomic and pathophysiologic concepts .
In: Mayo Clinic Practice of Cardiology , 3rd ed. , pp. 727 – 747 ( ER Giuliani , et al., eds.). St. Louis, MO : Mosby .
Woodcock E , et al. 2009 . Phosphoinositide sig-naling and cardiac arrhythmias . Cardiovasc Res 82 ( 2 ): 286 – 286 .