Embed Size (px)
Citation preview
Care infections in Belgium: a overview
OCTOBRE 2017
Dr. Boudewijn Catry
Rue Juliette Wytsmanstraat 14 | 1050 Brussels | Belgium
T +32 2 642 57 62 | email: [email protected]
Mission NSIH.be
For the containment of healthcare-associated infections in hospitals
and nursing homes we provide :
- standardized definitions and tools,
- national reference data on incidence of nosocomial infections and
antimicrobial resistance,
- outbreak support in collaboration with competent authorities.
Point prevalence survey: PPS (photo)
Surveillance (film)
&
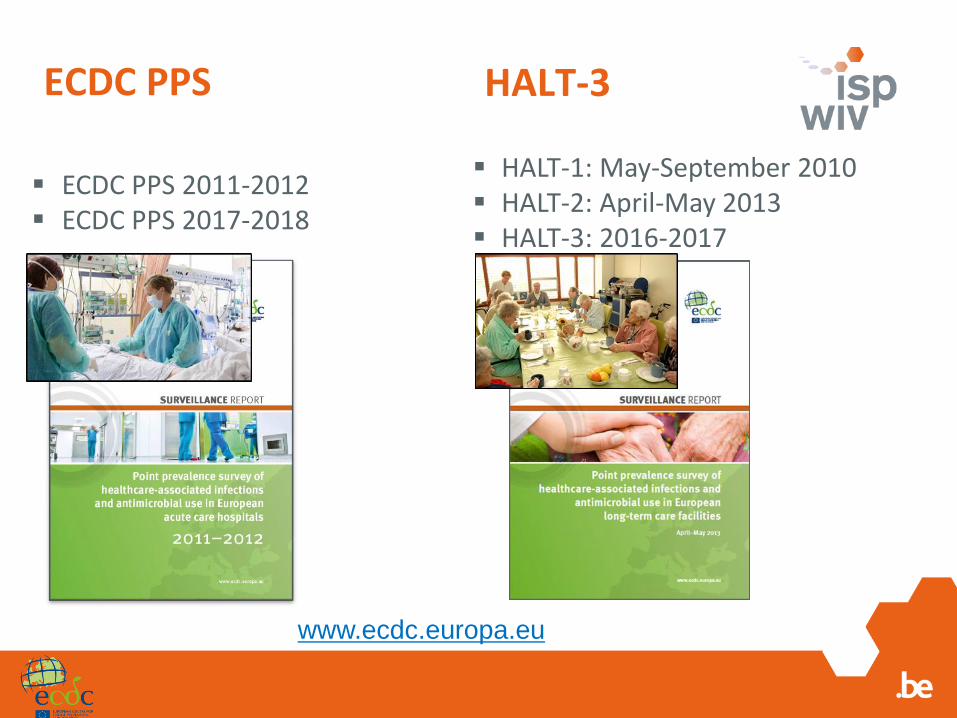
ECDC PPS
▪ ECDC PPS 2011-2012▪ ECDC PPS 2017-2018
HALT-3
www.ecdc.europa.eu
▪ HALT-1: May-September 2010▪ HALT-2: April-May 2013▪ HALT-3: 2016-2017
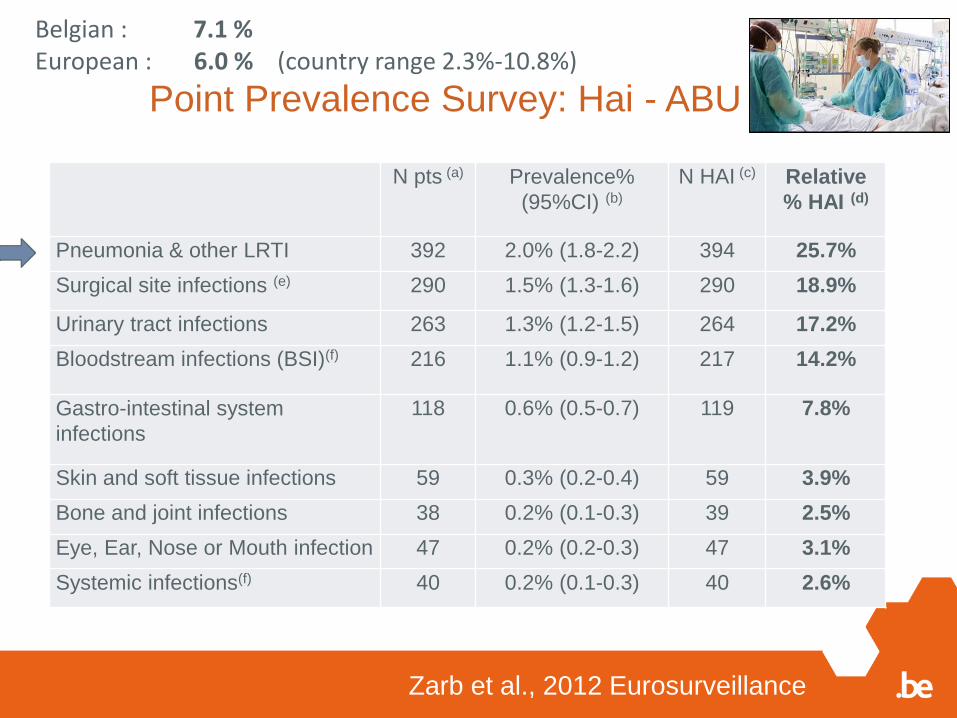
Point Prevalence Survey: Hai - ABU
Zarb et al., 2012 Eurosurveillance
N pts (a) Prevalence%
(95%CI) (b)
N HAI (c) Relative
% HAI (d)
Pneumonia & other LRTI 392 2.0% (1.8-2.2) 394 25.7%
Surgical site infections (e) 290 1.5% (1.3-1.6) 290 18.9%
Urinary tract infections 263 1.3% (1.2-1.5) 264 17.2%
Bloodstream infections (BSI)(f) 216 1.1% (0.9-1.2) 217 14.2%
Gastro-intestinal system
infections
118 0.6% (0.5-0.7) 119 7.8%
Skin and soft tissue infections 59 0.3% (0.2-0.4) 59 3.9%
Bone and joint infections 38 0.2% (0.1-0.3) 39 2.5%
Eye, Ear, Nose or Mouth infection 47 0.2% (0.2-0.3) 47 3.1%
Systemic infections(f) 40 0.2% (0.1-0.3) 40 2.6%
Belgian : 7.1 % European : 6.0 % (country range 2.3%-10.8%)
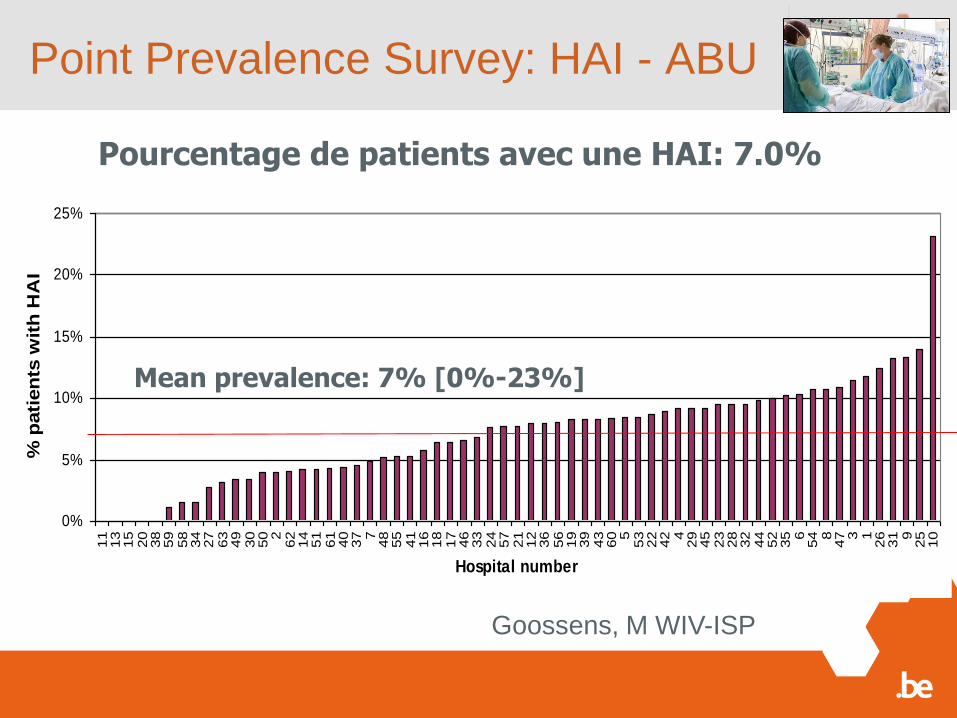
Point Prevalence Survey: HAI - ABU
Pourcentage de patients avec une HAI: 7.0%
0%
5%
10%
15%
20%
25%
11
13
15
20
38
59
58
34
27
63
49
30
50 2
62
14
51
61
40
37 7
48
55
41
16
18
17
46
33
24
57
21
12
36
56
19
39
43
60 5
53
22
42 4
29
45
23
28
32
44
52
35 6
54 8
47 3 1
26
31 9
25
10
Hospital number
% p
ati
en
ts w
ith
HA
I
Mean prevalence: 7% [0%-23%]
Goossens, M WIV-ISP
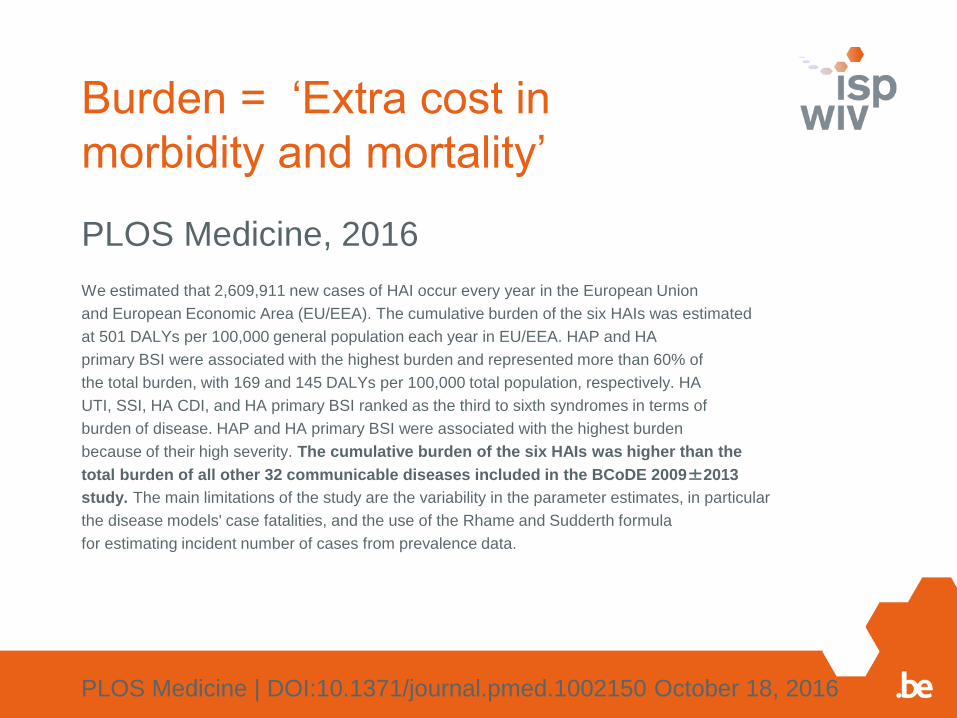
Burden = ‘Extra cost in
morbidity and mortality’
PLOS Medicine, 2016
We estimated that 2,609,911 new cases of HAI occur every year in the European Union
and European Economic Area (EU/EEA). The cumulative burden of the six HAIs was estimated
at 501 DALYs per 100,000 general population each year in EU/EEA. HAP and HA
primary BSI were associated with the highest burden and represented more than 60% of
the total burden, with 169 and 145 DALYs per 100,000 total population, respectively. HA
UTI, SSI, HA CDI, and HA primary BSI ranked as the third to sixth syndromes in terms of
burden of disease. HAP and HA primary BSI were associated with the highest burden
because of their high severity. The cumulative burden of the six HAIs was higher than the
total burden of all other 32 communicable diseases included in the BCoDE 2009±2013
study. The main limitations of the study are the variability in the parameter estimates, in particular
the disease models' case fatalities, and the use of the Rhame and Sudderth formula
for estimating incident number of cases from prevalence data.
PLOS Medicine | DOI:10.1371/journal.pmed.1002150 October 18, 2016
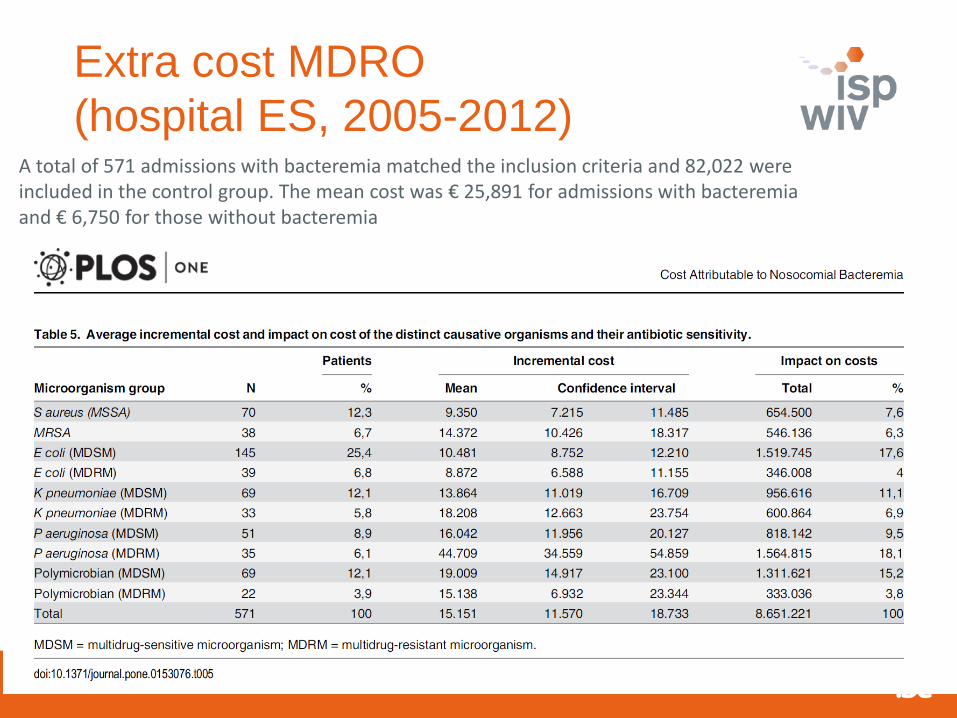
Extra cost MDRO
(hospital ES, 2005-2012)A total of 571 admissions with bacteremia matched the inclusion criteria and 82,022 wereincluded in the control group. The mean cost was € 25,891 for admissions with bacteremiaand € 6,750 for those without bacteremia
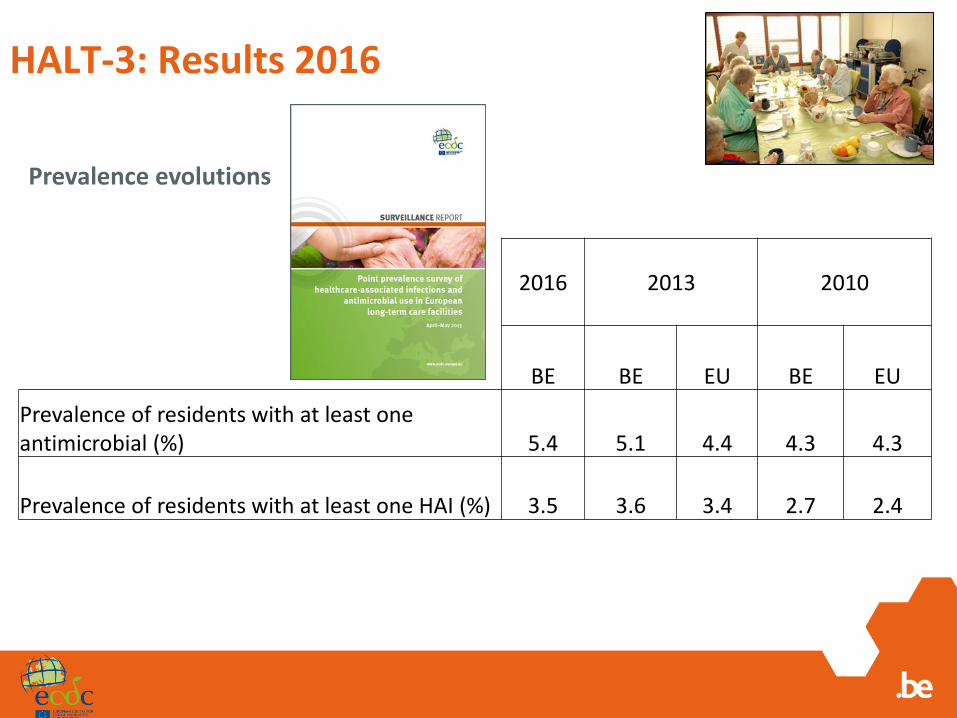
HALT-3: Results 2016
Prevalence evolutions
2016 2013 2010
BE BE EU BE EU
Prevalence of residents with at least one antimicrobial (%) 5.4 5.1 4.4 4.3 4.3
Prevalence of residents with at least one HAI (%) 3.5 3.6 3.4 2.7 2.4
Conclusion on ‘Pictures’
▪ HAI prevalence (%) in Belgium• Hospitals: 7.1• LTCFs: 3.5
▪ Estimated number of patients per year with an HAI in Belgium• Hospital: 111 276• LTCFs: 170 090
▪ No decline of HAI occurrence in healthcare facilities▪ Challenge for LTCFs
• Limited resources for infection prevention and control• Home-like facilities

Point prevalence survey: PPS (photo)
Surveillance (film)
&
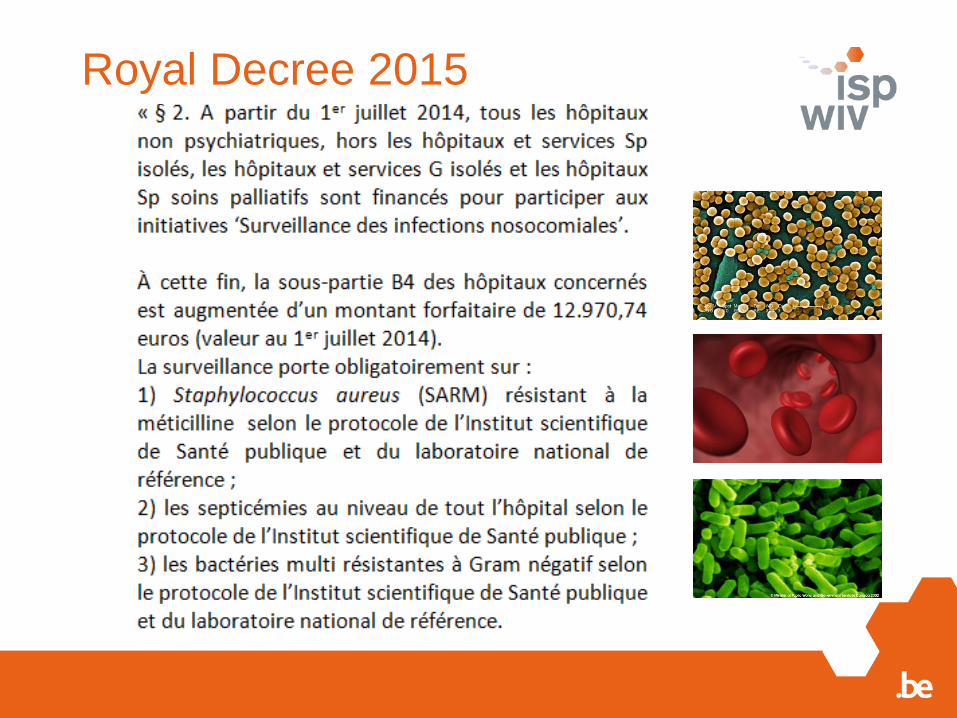
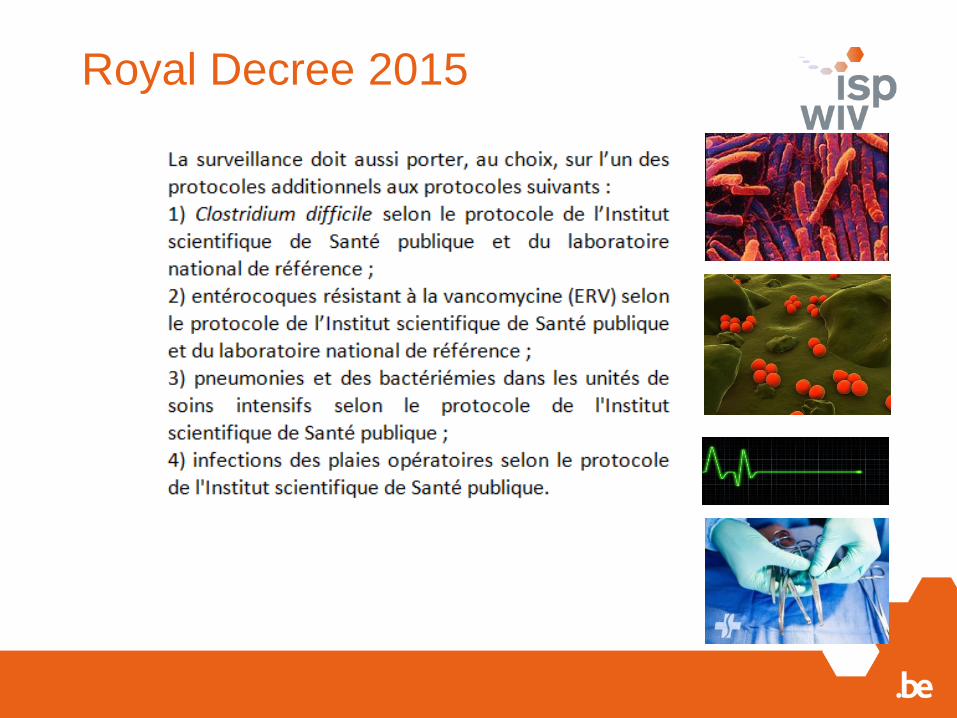
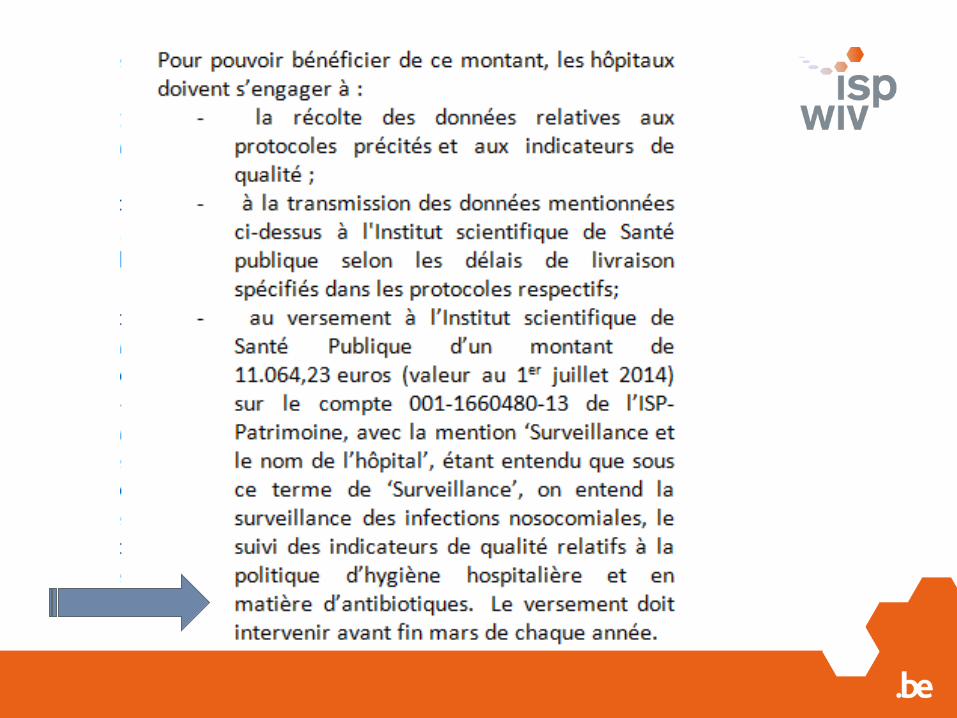
Royal Decree 2015
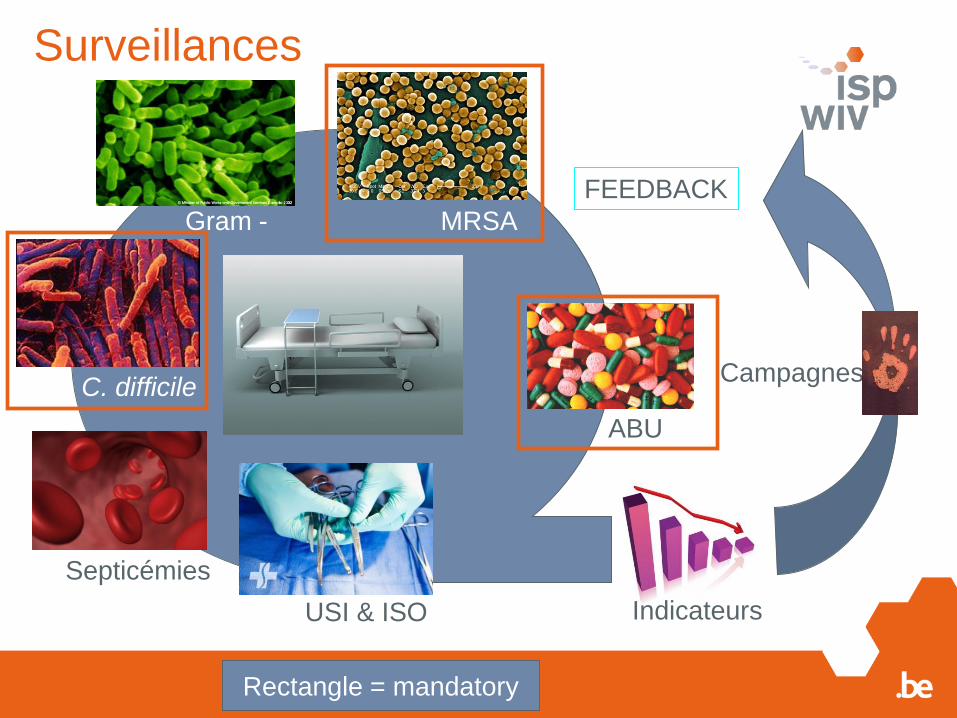
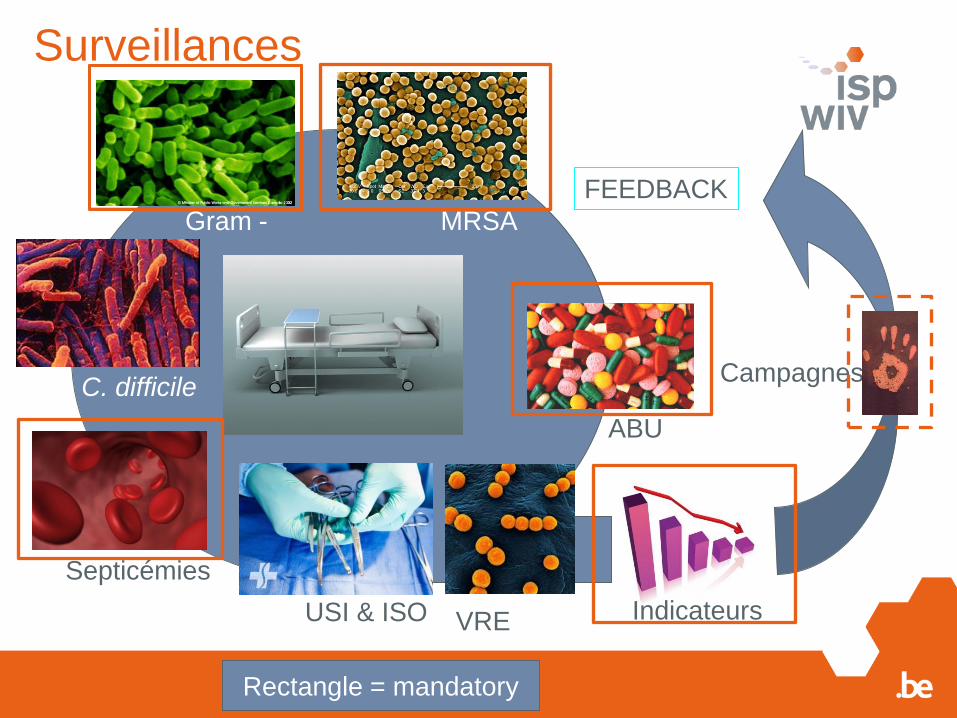
Surveillances
&
FEEDBACK
MRSA
Campagnes
IndicateursUSI & ISO
Septicémies
C. difficile
Gram -
ABU
Rectangle = mandatory
Surveillances
&
FEEDBACK
MRSA
Campagnes
IndicateursUSI & ISO
Septicémies
C. difficile
Gram -
ABU
Rectangle = mandatory
VRE
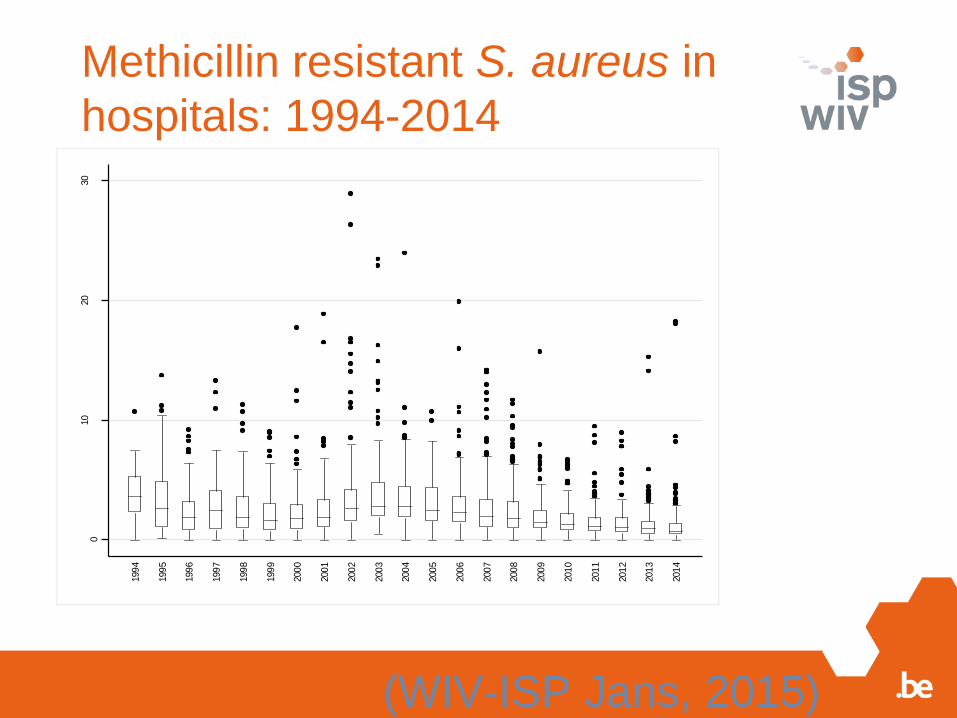
Methicillin resistant S. aureus in
hospitals: 1994-20140
10
20
30
n-M
RS
A/1
000
am
iss
ions
199
4
199
5
199
6
199
7
199
8
199
9
200
0
200
1
200
2
200
3
200
4
200
5
200
6
200
7
200
8
200
9
201
0
201
1
201
2
201
3
201
4
(WIV-ISP Jans, 2015)

Mobile version NSIHweb
Internet connection
Connect via WiFi
Designed for Internet explorer 11
browser (Safari ok)
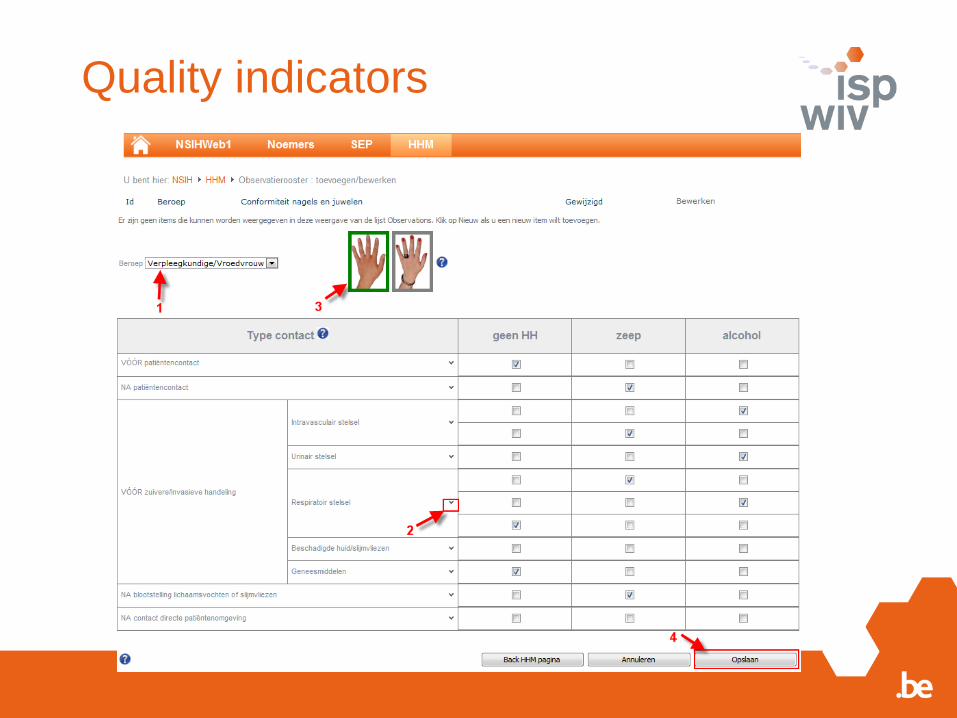
Quality indicators
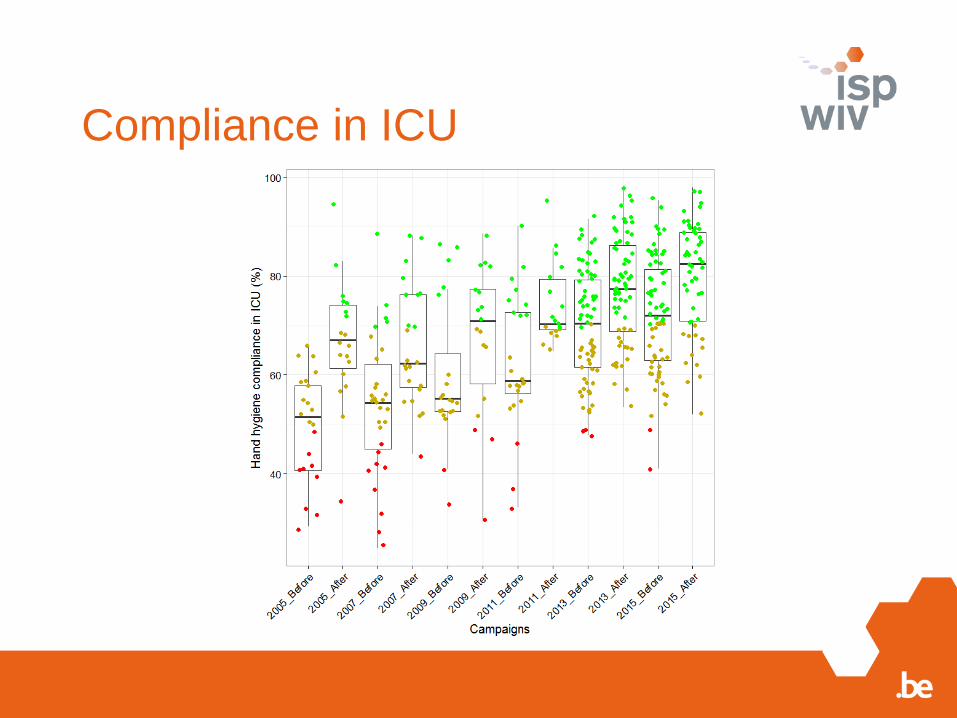
Compliance in ICU
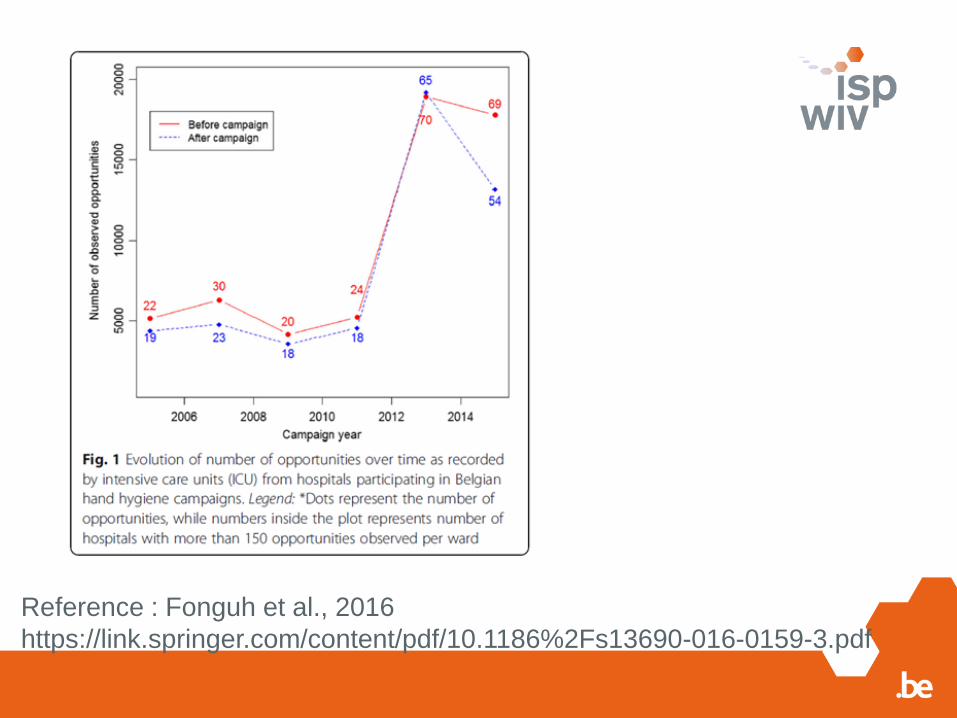
Reference : Fonguh et al., 2016
https://link.springer.com/content/pdf/10.1186%2Fs13690-016-0159-3.pdf
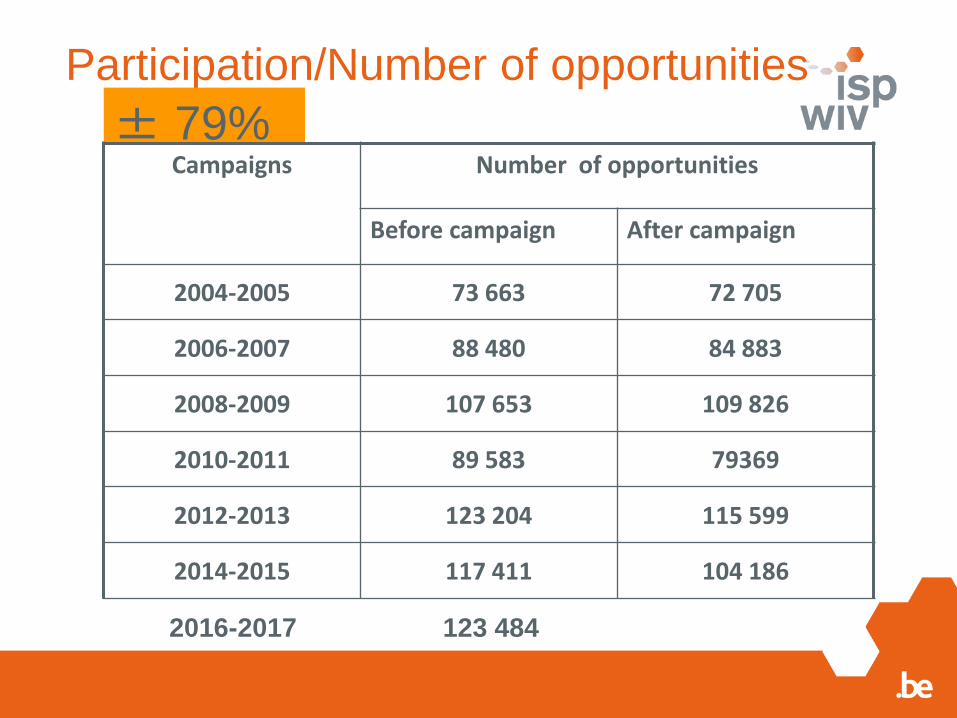
Participation/Number of opportunities
± 79%Campaigns Number of opportunities
Before campaign After campaign
2004-2005 73 663 72 705
2006-2007 88 480 84 883
2008-2009 107 653 109 826
2010-2011 89 583 79369
2012-2013 123 204 115 599
2014-2015 117 411 104 186
2016-2017 123 484
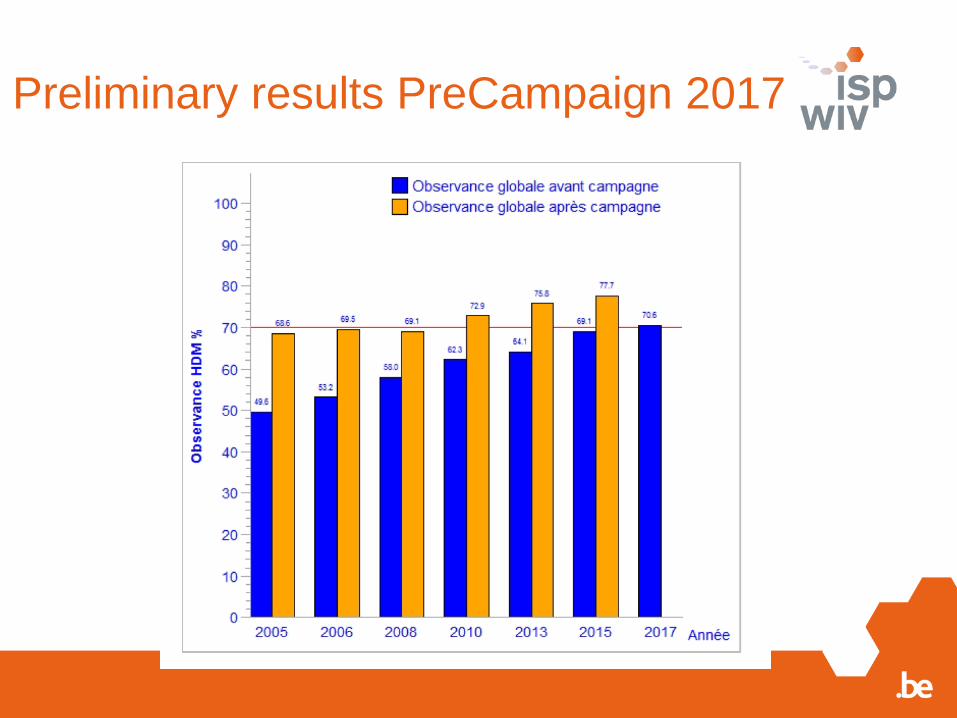
Preliminary results PreCampaign 2017
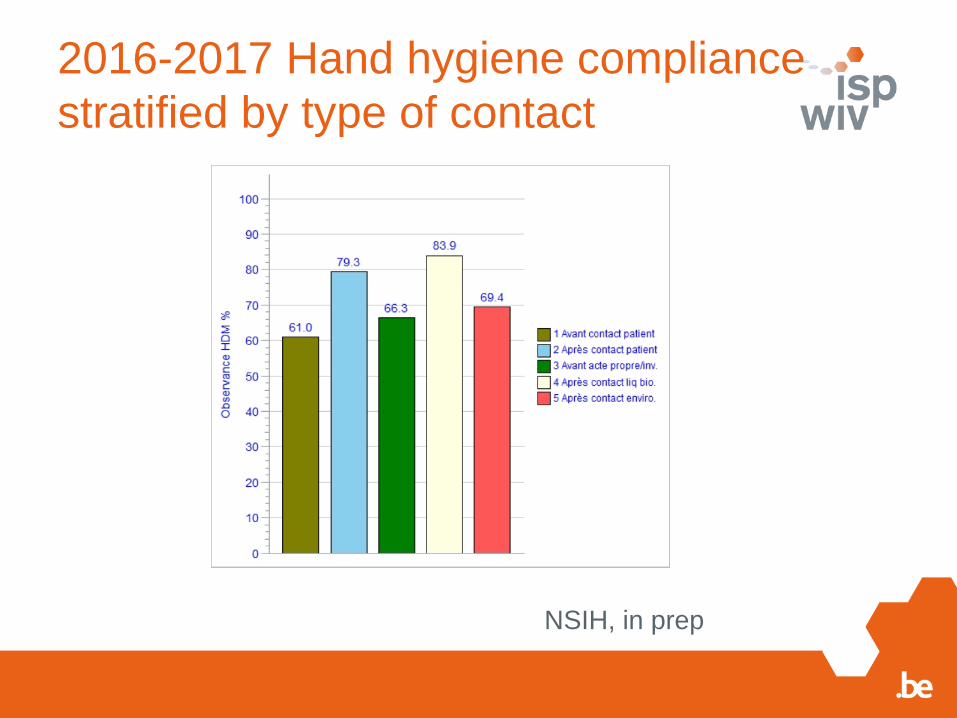
2016-2017 Hand hygiene compliance
stratified by type of contact
NSIH, in prep
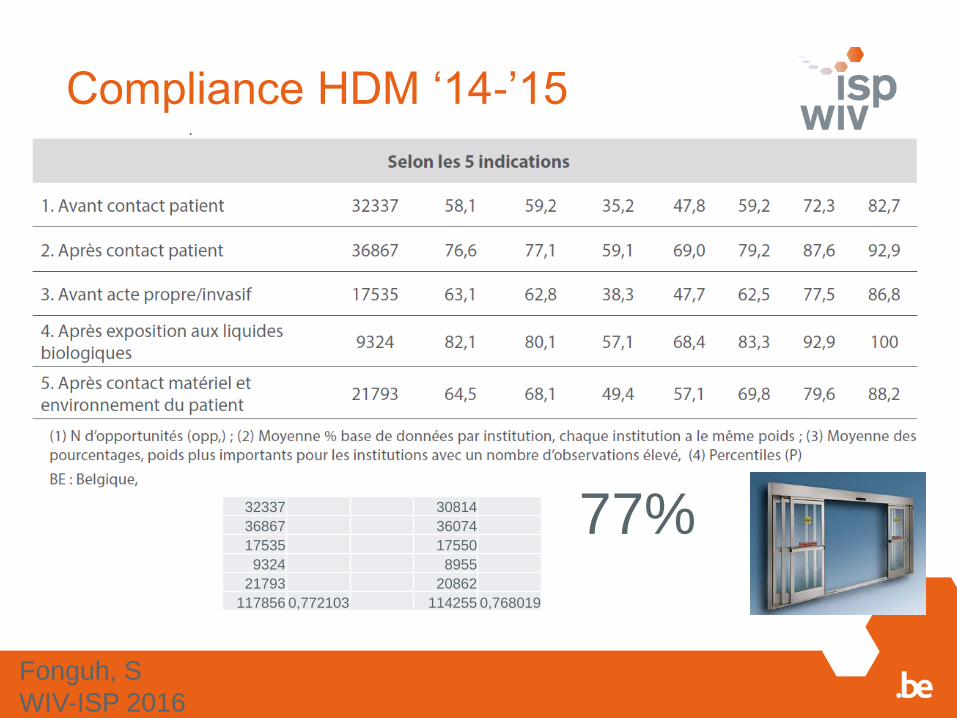
Compliance HDM ‘14-’15
77% 32337 30814
36867 36074
17535 17550
9324 8955
21793 20862
117856 0,772103 114255 0,768019
Fonguh, S
WIV-ISP 2016
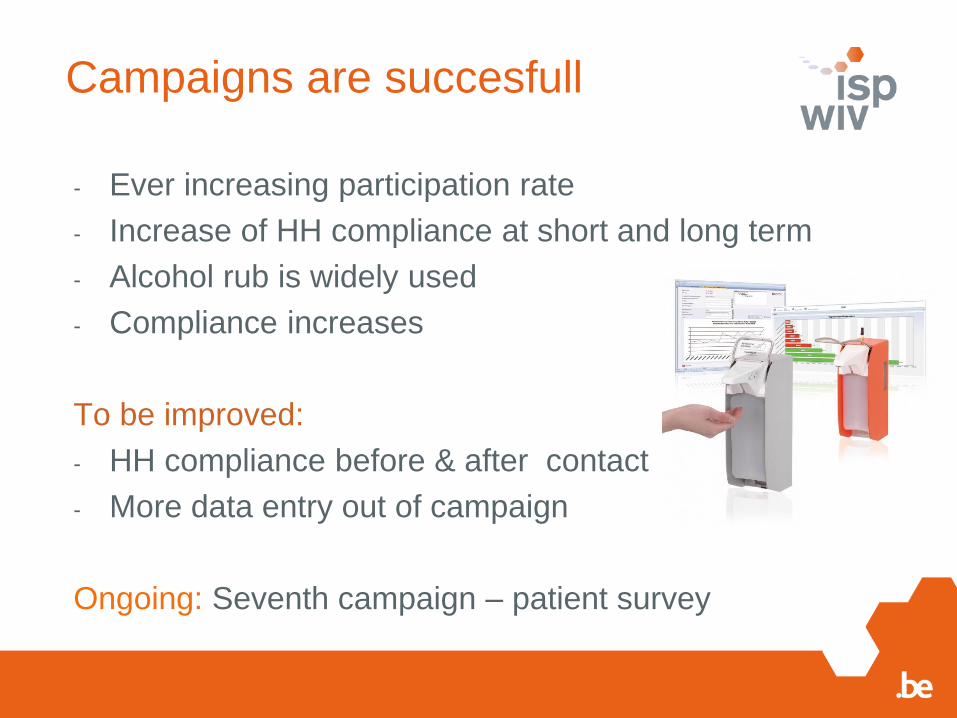
Campaigns are succesfull
- Ever increasing participation rate
- Increase of HH compliance at short and long term
- Alcohol rub is widely used
- Compliance increases
To be improved:
- HH compliance before & after contact
- More data entry out of campaign
Ongoing: Seventh campaign – patient survey

Quote: Svetlan Taneva, ICU Management & Practice, Spring 2017
“Asking indivudals to be more vigilant is essentially
aksing them to compensate for deficiencies in the
system”.
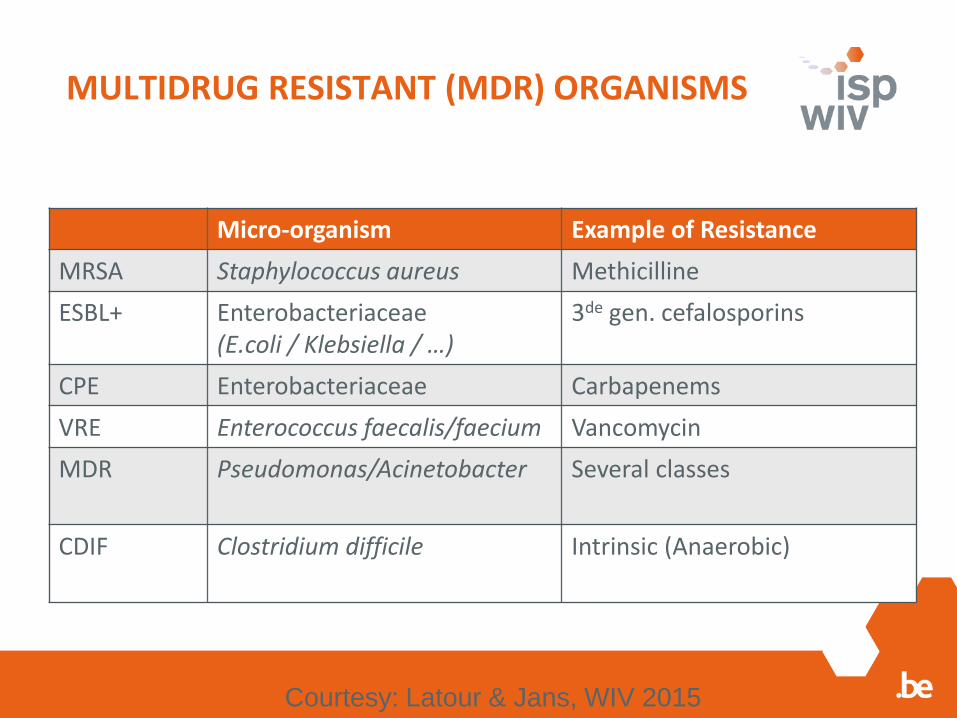
MULTIDRUG RESISTANT (MDR) ORGANISMS
Micro-organism Example of Resistance
MRSA Staphylococcus aureus Methicilline
ESBL+ Enterobacteriaceae (E.coli / Klebsiella / …)
3de gen. cefalosporins
CPE Enterobacteriaceae Carbapenems
VRE Enterococcus faecalis/faecium Vancomycin
MDR Pseudomonas/Acinetobacter Several classes
CDIF Clostridium difficile Intrinsic (Anaerobic)
Courtesy: Latour & Jans, WIV 2015
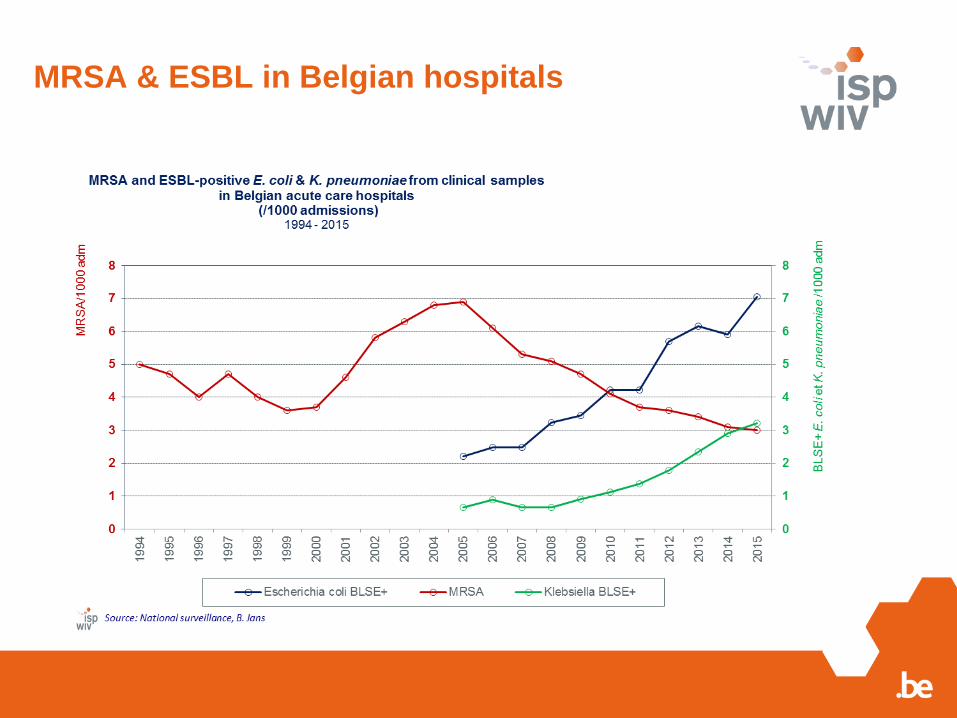
MRSA & ESBL in Belgian hospitals
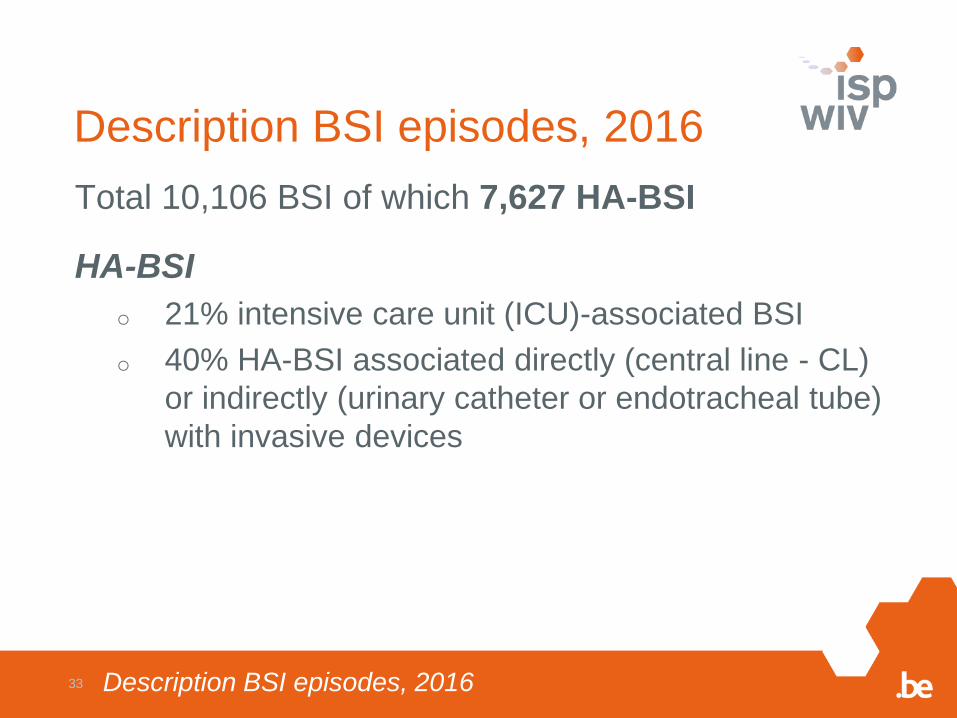
Description BSI episodes, 2016
Total 10,106 BSI of which 7,627 HA-BSI
HA-BSI
o 21% intensive care unit (ICU)-associated BSI
o 40% HA-BSI associated directly (central line - CL)
or indirectly (urinary catheter or endotracheal tube)
with invasive devices
33 Description BSI episodes, 2016
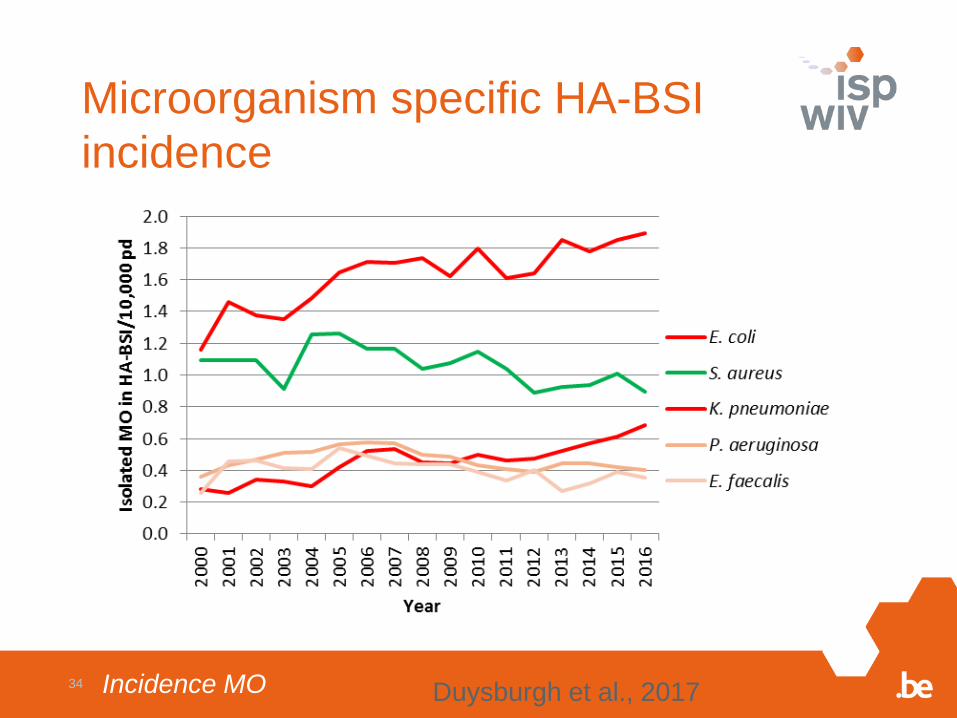
Microorganism specific HA-BSI
incidence
Incidence MO34Duysburgh et al., 2017
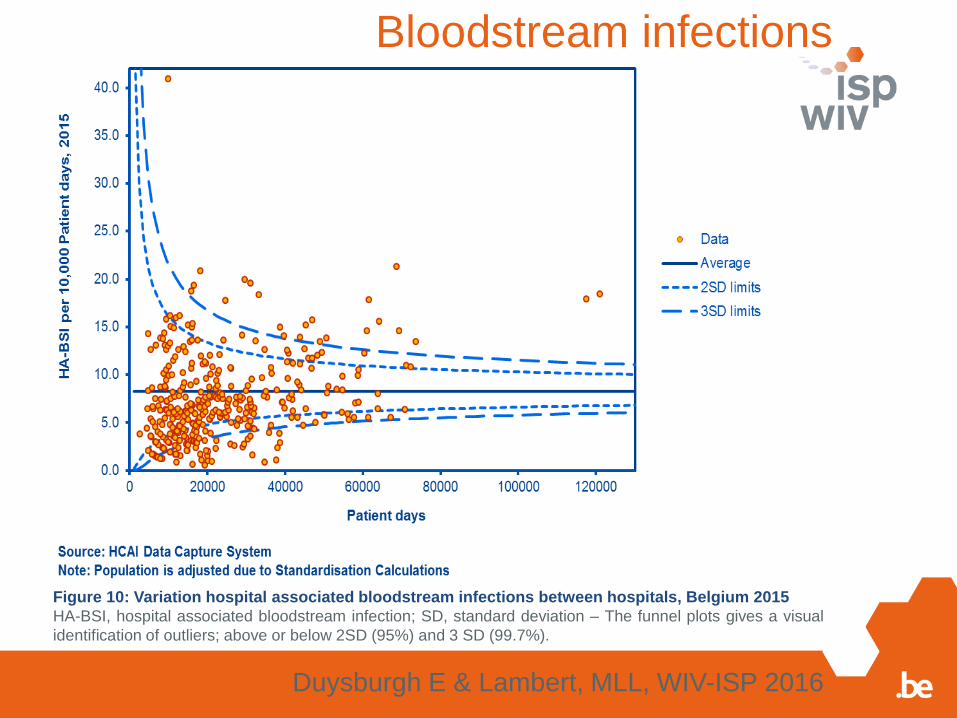
Duysburgh E & Lambert, MLL, WIV-ISP 2016
Figure 10: Variation hospital associated bloodstream infections between hospitals, Belgium 2015
HA-BSI, hospital associated bloodstream infection; SD, standard deviation – The funnel plots gives a visual
identification of outliers; above or below 2SD (95%) and 3 SD (99.7%).
Bloodstream infections
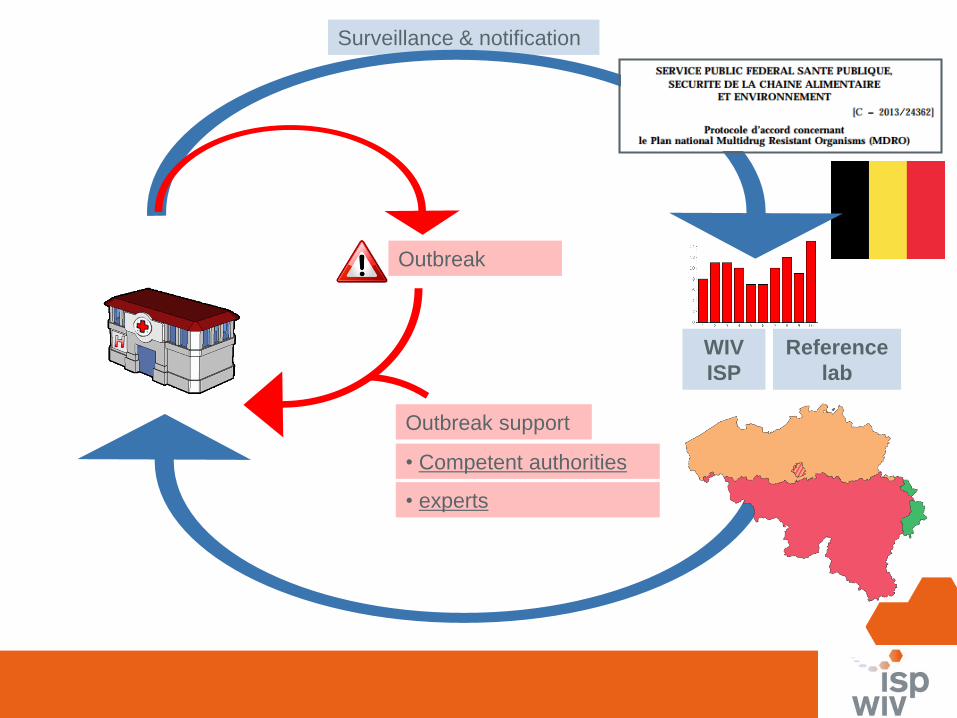
• Competent authorities
Outbreak
Surveillance & notification
• experts
Outbreak support
Reference
lab
WIV
ISP
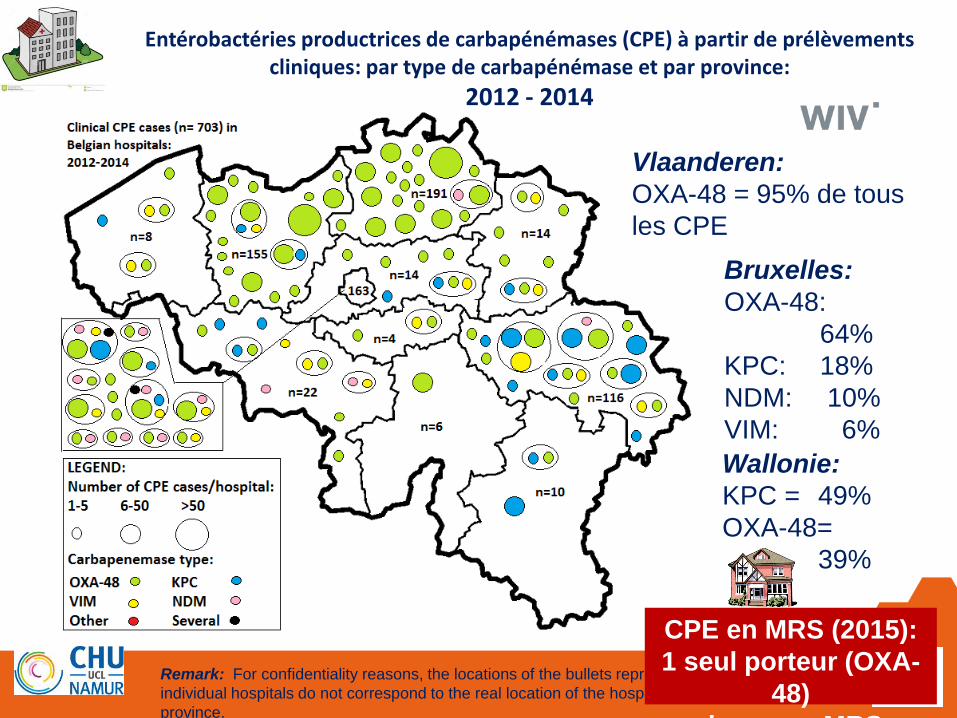
37Remark: For confidentiality reasons, the locations of the bullets representing
individual hospitals do not correspond to the real location of the hospitals in the
province.
Entérobactéries productrices de carbapénémases (CPE) à partir de prélèvementscliniques: par type de carbapénémase et par province:
2012 - 2014
CPE en MRS (2015):
1 seul porteur (OXA-
48)
dans une MRS
Vlaanderen:
OXA-48 = 95% de tous
les CPE
Wallonie:
KPC = 49%
OXA-48=
39%
Bruxelles:
OXA-48:
64%
KPC: 18%
NDM: 10%
VIM: 6%
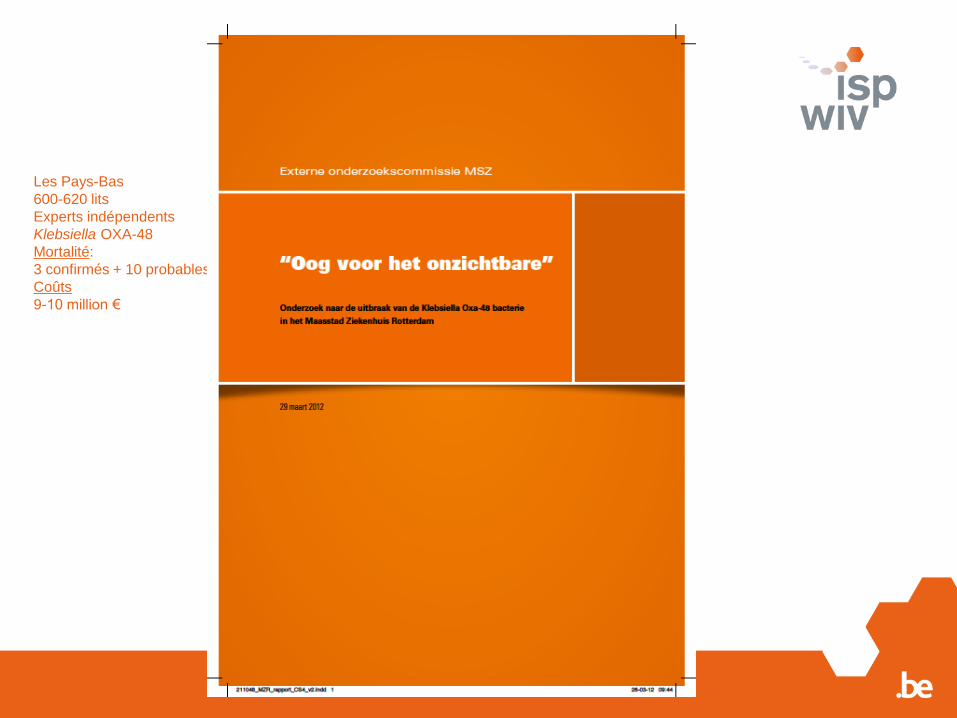
Les Pays-Bas
600-620 lits
Experts indépendents
Klebsiella OXA-48
Mortalité:
3 confirmés + 10 probables
Coûts
9-10 million €
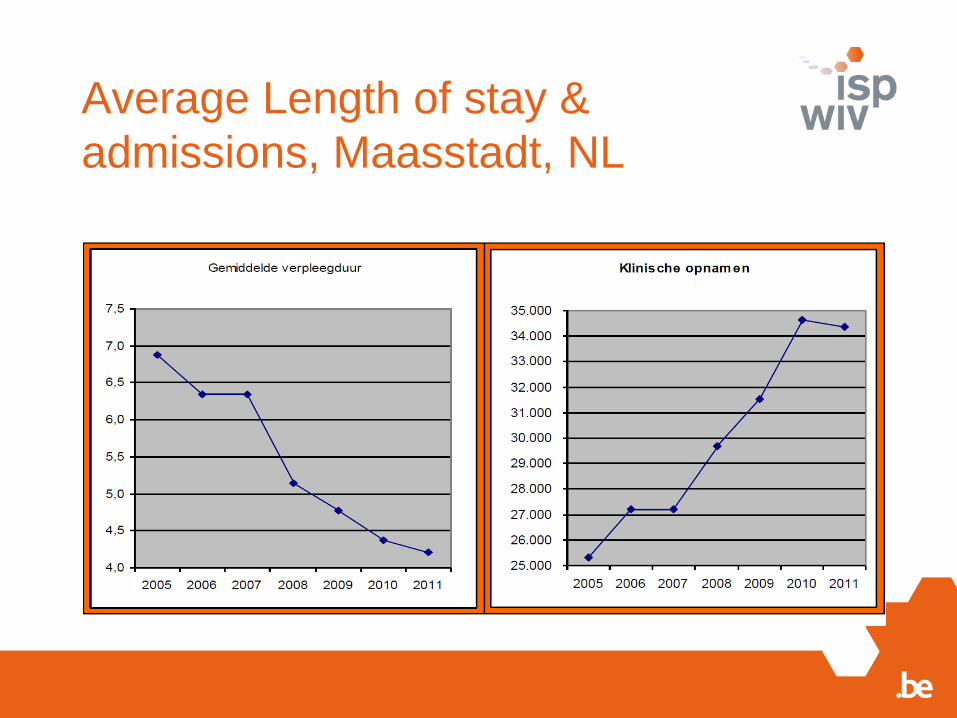
Average Length of stay &
admissions, Maasstadt, NL
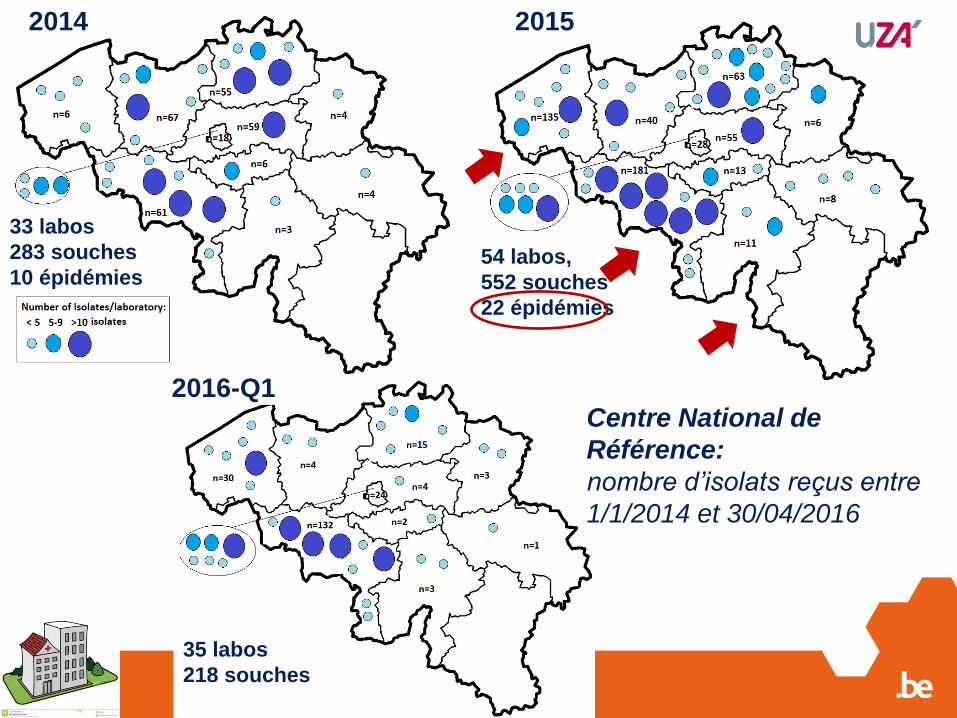
33 labos
283 souches
10 épidémies54 labos,
552 souches
22 épidémies
35 labos
218 souches
2014 2015
2016-Q1Centre National de
Référence:
nombre d’isolats reçus entre
1/1/2014 et 30/04/2016
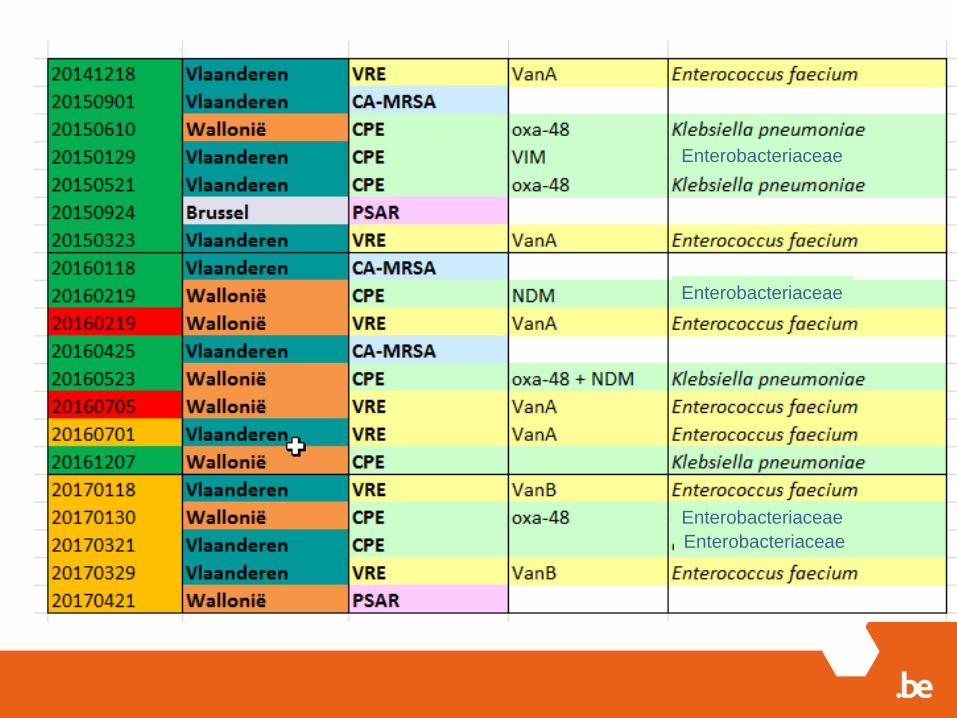
Enkele gegevensEnterobacteriaceae
Enterobacteriaceae
Enterobacteriaceae
Enterobacteriaceae
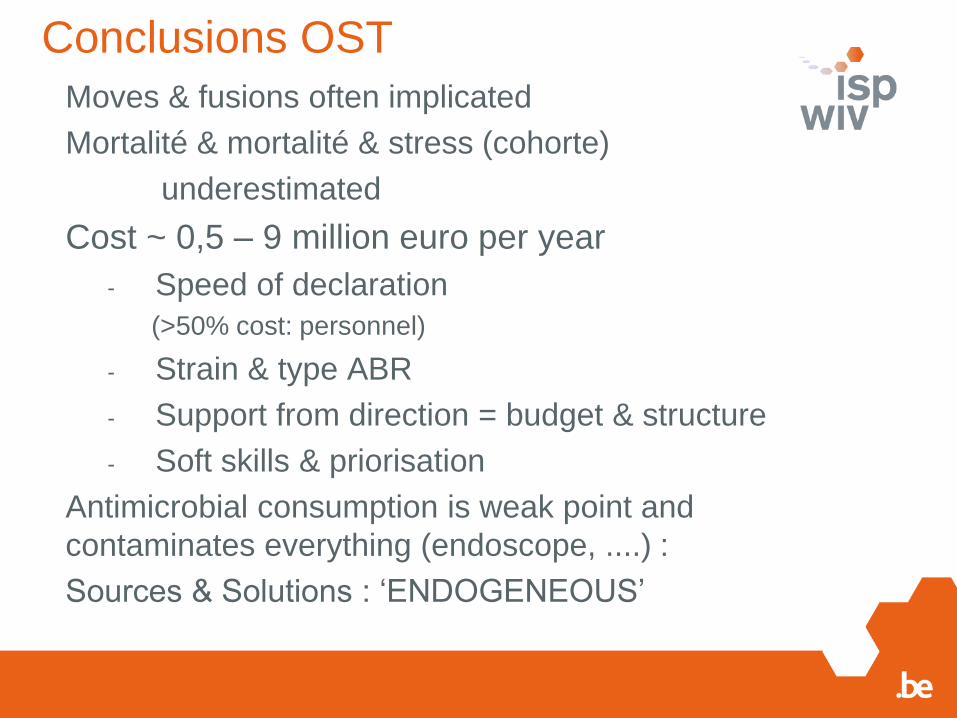
Conclusions OST
Moves & fusions often implicated
Mortalité & mortalité & stress (cohorte)
underestimated
Cost ~ 0,5 – 9 million euro per year
- Speed of declaration
(>50% cost: personnel)
- Strain & type ABR
- Support from direction = budget & structure
- Soft skills & priorisation
Antimicrobial consumption is weak point and
contaminates everything (endoscope, ....) :
Sources & Solutions : ‘ENDOGENEOUS’
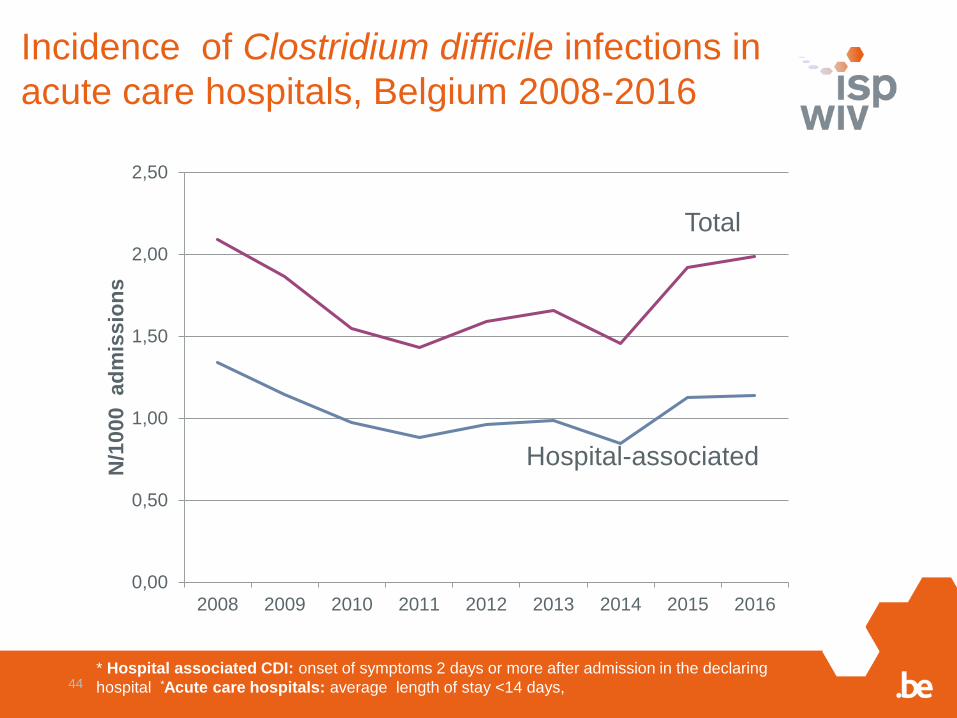
Incidence of Clostridium difficile infections in
acute care hospitals, Belgium 2008-2016
44* Hospital associated CDI: onset of symptoms 2 days or more after admission in the declaring
hospital *Acute care hospitals: average length of stay <14 days,
0,00
0,50
1,00
1,50
2,00
2,50
2008 2009 2010 2011 2012 2013 2014 2015 2016
N/1
000
ad
mis
sio
ns
Total
Hospital-associated
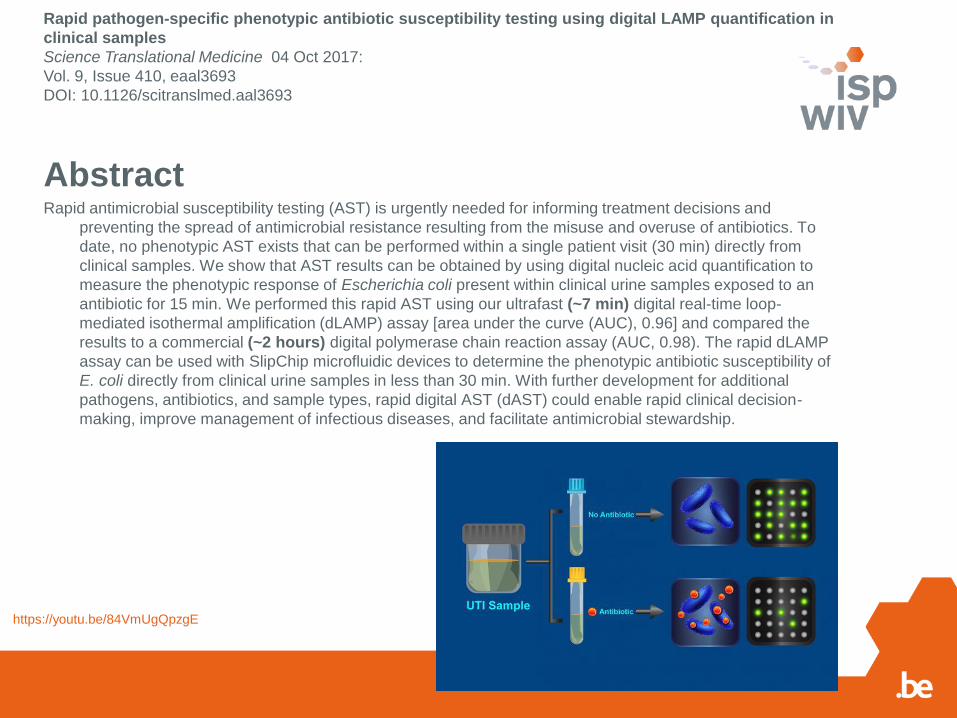
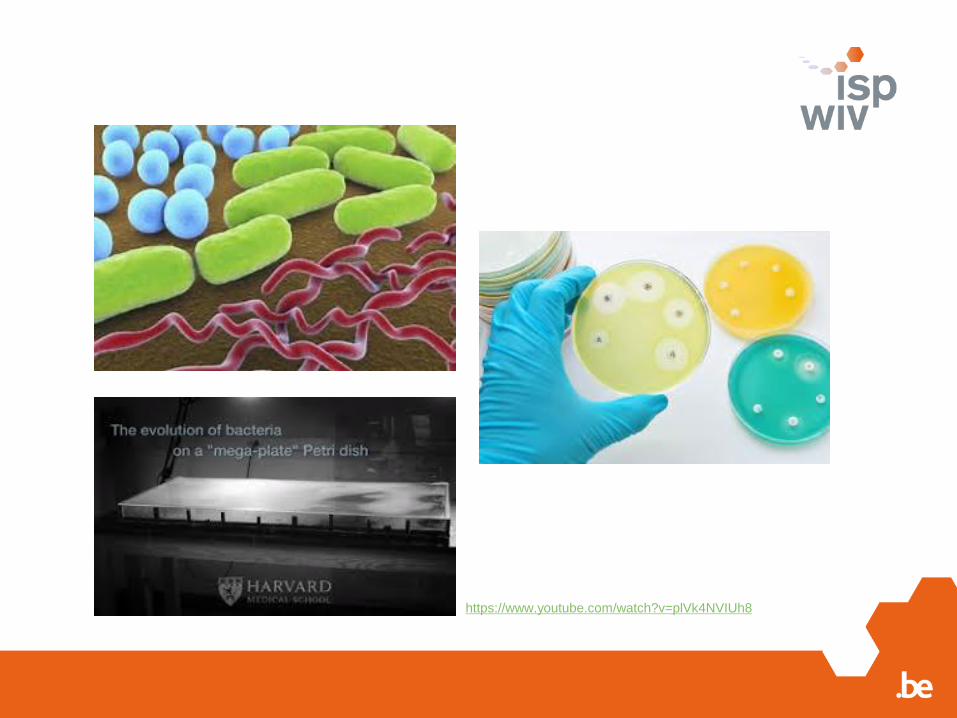
https://youtu.be/84VmUgQpzgE
AbstractRapid antimicrobial susceptibility testing (AST) is urgently needed for informing treatment decisions and
preventing the spread of antimicrobial resistance resulting from the misuse and overuse of antibiotics. To
date, no phenotypic AST exists that can be performed within a single patient visit (30 min) directly from
clinical samples. We show that AST results can be obtained by using digital nucleic acid quantification to
measure the phenotypic response of Escherichia coli present within clinical urine samples exposed to an
antibiotic for 15 min. We performed this rapid AST using our ultrafast (~7 min) digital real-time loop-
mediated isothermal amplification (dLAMP) assay [area under the curve (AUC), 0.96] and compared the
results to a commercial (~2 hours) digital polymerase chain reaction assay (AUC, 0.98). The rapid dLAMP
assay can be used with SlipChip microfluidic devices to determine the phenotypic antibiotic susceptibility of
E. coli directly from clinical urine samples in less than 30 min. With further development for additional
pathogens, antibiotics, and sample types, rapid digital AST (dAST) could enable rapid clinical decision-
making, improve management of infectious diseases, and facilitate antimicrobial stewardship.
Rapid pathogen-specific phenotypic antibiotic susceptibility testing using digital LAMP quantification in
clinical samples
Science Translational Medicine 04 Oct 2017:
Vol. 9, Issue 410, eaal3693
DOI: 10.1126/scitranslmed.aal3693
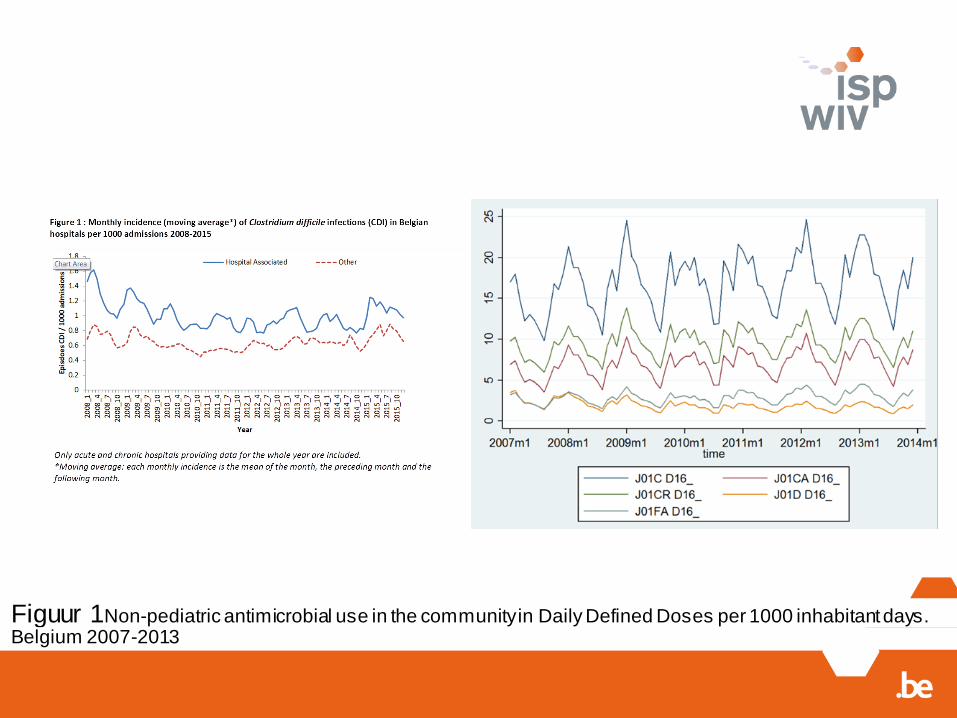
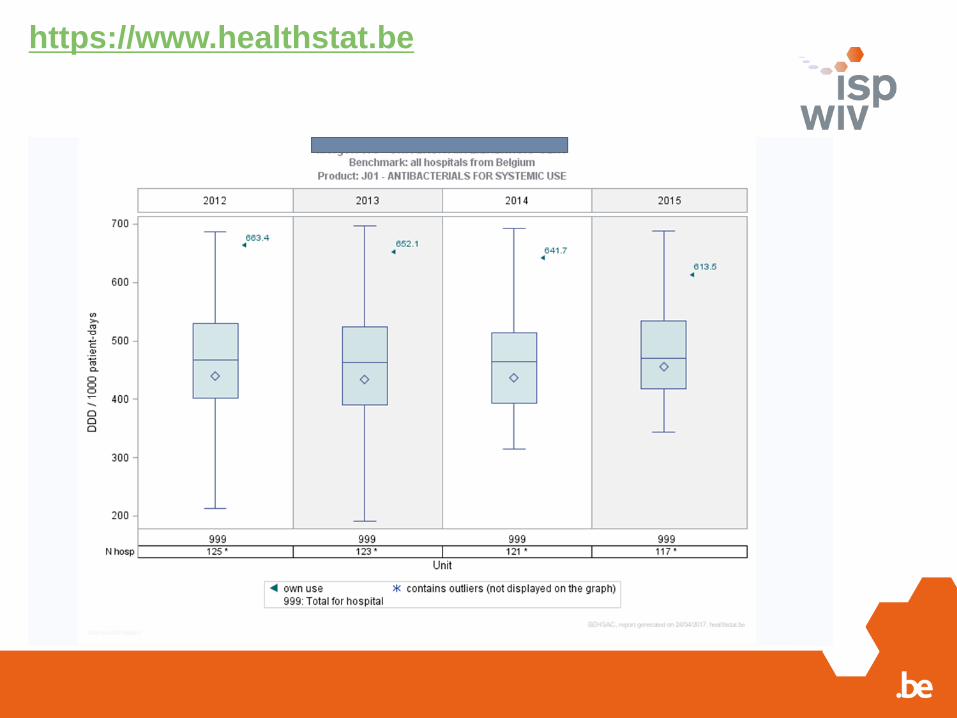
Figuur 1Non-pediatric antimicrobial use in the community in Daily Defined Doses per 1000 inhabitant days. Belgium 2007-2013
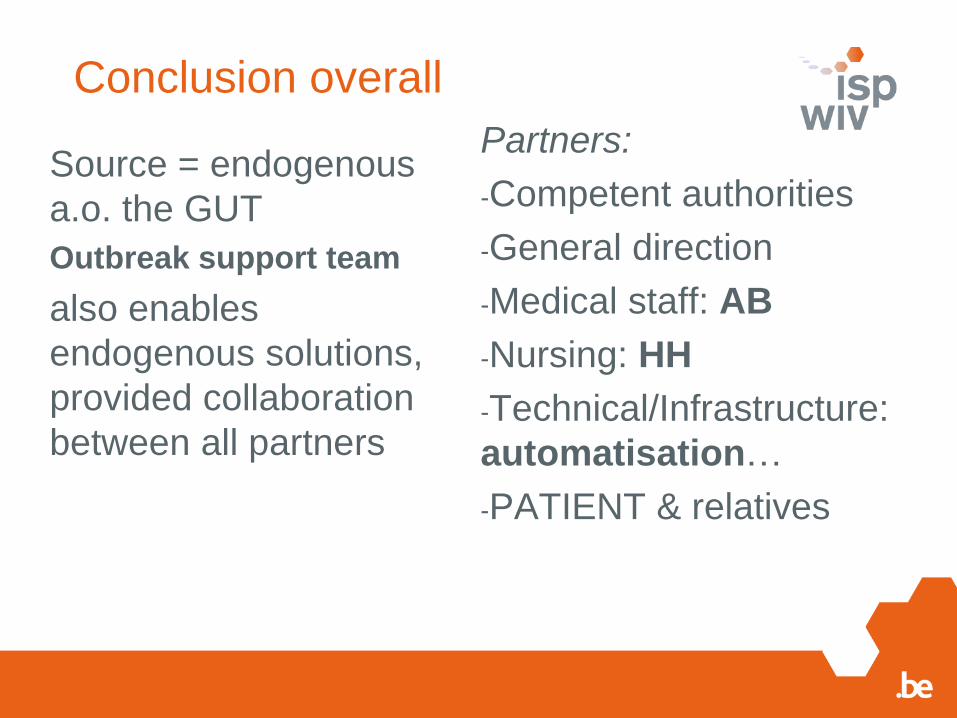
Conclusion overall
Source = endogenous
a.o. the GUT
Outbreak support team
also enables
endogenous solutions,
provided collaboration
between all partners
Partners:
-Competent authorities
-General direction
-Medical staff: AB
-Nursing: HH
-Technical/Infrastructure:
automatisation…
-PATIENT & relatives
Thanks to:
theNSIH team*, ECDC, EMA, EFSA, BAPCOC
The labs, NRCs & healthcare settings
www.nsih.be
*Eline Vandael, Karl Mertens, Thomas Struyf, Naima Benhammadi, Els Duysburgh, Laure Mortgat, Theofilos Papadopoulos, Barbara Legiest, Louisa Ben Abdelhafidh, Annie Uwineza, Hélène De Pauw, Katrien Latour.