Embed Size (px)
Citation preview

CATS-GSM-Web Portal
Operating Manual

CATS Manual for CATS web portal Date: 23-01-2017 www.cats.is [email protected]
2
CATS – GSM - Portal user manual (CGP)
CATS, is running two web portals: the GSM/CDMA portal and the Satellite portal for the Iridium-based CATS-SATag.
This manual refers to the GSM/CDMA portal associated with the CATS – GSM/CDMA tags (CGT/CCT). This portal is called the CATS – bear portal.
In order to access the portal please visit the following link: http://bear.cats.is/ or access the portal via your CATS – space in your login area on the www.cats.is website. You should have been issued a login name and password from us to log in.
Once you have successfully logged in to the portal you will see the main page, which is called the ‘Dashboard’ (see below). Here you can see all GSM/CDMA tags associated with your account. If there are any tags missing or wrongly displayed, please contact CATS immediately to remedy this problem. The ‘Dashboard’ shows you at one glance all your registered devices. It will show you when the last message has been received (Date and time) and shortcuts (left menu) to some often used info pages of the tag recordings.
In order to see the data of an individual CATS-GSM-Tag, select the tag in question on the left top drop-down menu. Once chosen, all other links you choose in the left user menu now pertain to this tag.
Depending to the GSM/CDMA device that you ordered, different sensors may be activated and therefore shown in the web portal. For example, if you have an activity sensor on board, but no pressure sensor, then the ‘Dive’ page will show no info for you; however, the Activity pages will have details for you.
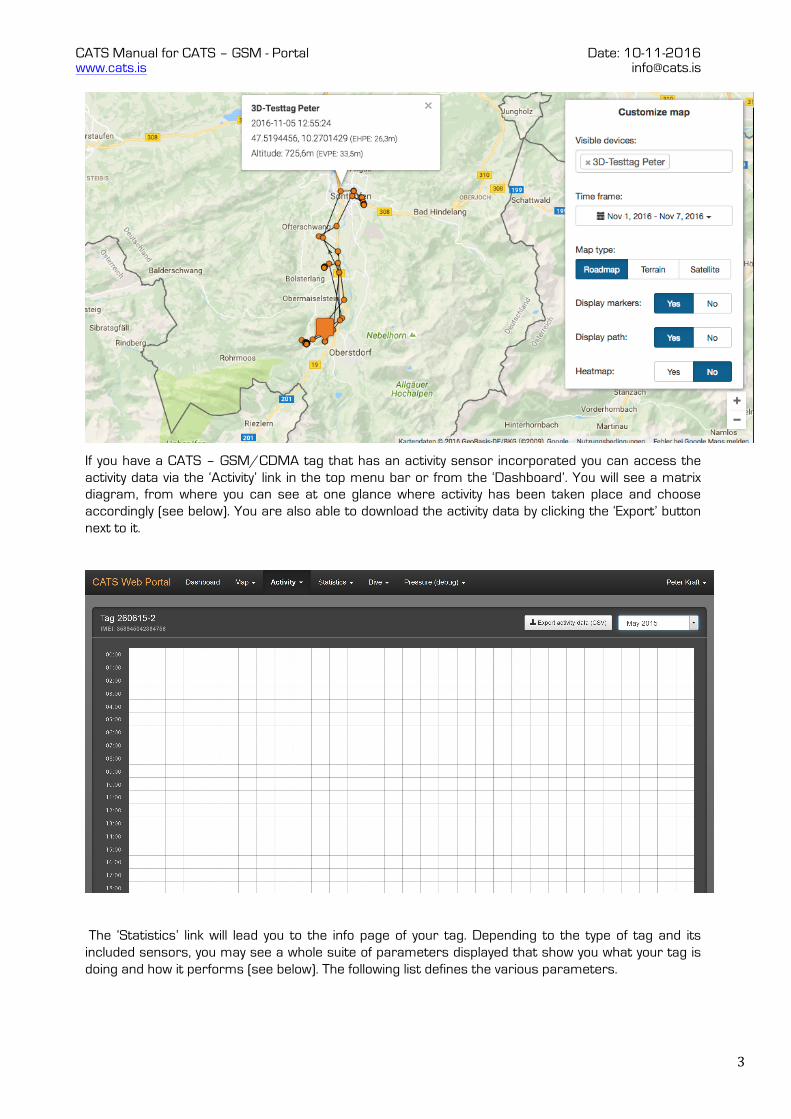
In order to see the GPS locations you can choose the ‘Location history’ button, which lets you access the positions in a table-view and its associated info. If you want to view your positions on a map, please click on the Map link and you are presented with the map (see below). Here you can choose the time frame (drop-down menu) you are interested in from the right menu – whether custom time frame, current day or the last month. In addition you can choose the typical displays, such as satellite image as a background etc.. You can also add the display of a different tag by choosing the quick access link on top of the map menu. (If you want to download your positions, please go to the dashboard again, see below).
CATS Manual for CATS – GSM - Portal Date: 10-11-2016 www.cats.is [email protected]
3
If you have a CATS – GSM/CDMA tag that has an activity sensor incorporated you can access the activity data via the ‘Activity’ link in the top menu bar or from the ‘Dashboard’. You will see a matrix diagram, from where you can see at one glance where activity has been taken place and choose accordingly (see below). You are also able to download the activity data by clicking the ‘Export’ button next to it.
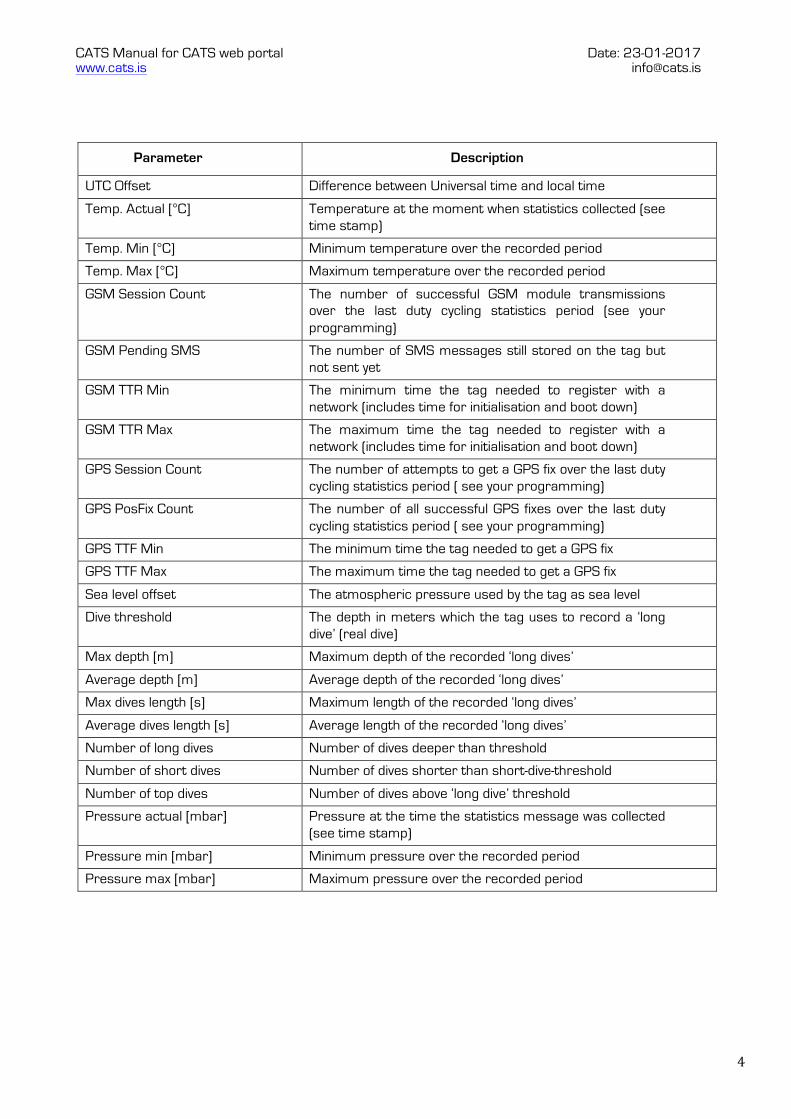
The ‘Statistics’ link will lead you to the info page of your tag. Depending to the type of tag and its included sensors, you may see a whole suite of parameters displayed that show you what your tag is doing and how it performs (see below). The following list defines the various parameters.
CATS Manual for CATS web portal Date: 23-01-2017 www.cats.is [email protected]
4
Parameter Description
UTC Offset Difference between Universal time and local time
Temp. Actual [°C] Temperature at the moment when statistics collected (see time stamp)
Temp. Min [°C] Minimum temperature over the recorded period
Temp. Max [°C] Maximum temperature over the recorded period
GSM Session Count The number of successful GSM module transmissions over the last duty cycling statistics period (see your programming)
GSM Pending SMS The number of SMS messages still stored on the tag but not sent yet
GSM TTR Min The minimum time the tag needed to register with a network (includes time for initialisation and boot down)
GSM TTR Max The maximum time the tag needed to register with a network (includes time for initialisation and boot down)
GPS Session Count The number of attempts to get a GPS fix over the last duty cycling statistics period ( see your programming)
GPS PosFix Count The number of all successful GPS fixes over the last duty cycling statistics period ( see your programming)
GPS TTF Min The minimum time the tag needed to get a GPS fix
GPS TTF Max The maximum time the tag needed to get a GPS fix
Sea level offset The atmospheric pressure used by the tag as sea level
Dive threshold The depth in meters which the tag uses to record a ‘long dive’ (real dive)
Max depth [m] Maximum depth of the recorded ‘long dives’
Average depth [m] Average depth of the recorded ‘long dives’
Max dives length [s] Maximum length of the recorded ‘long dives’
Average dives length [s] Average length of the recorded ‘long dives’
Number of long dives Number of dives deeper than threshold
Number of short dives Number of dives shorter than short-dive-threshold
Number of top dives Number of dives above ‘long dive’ threshold
Pressure actual [mbar] Pressure at the time the statistics message was collected (see time stamp)
Pressure min [mbar] Minimum pressure over the recorded period
Pressure max [mbar] Maximum pressure over the recorded period
CATS Manual for CATS – GSM - Portal Date: 10-11-2016 www.cats.is [email protected]
5
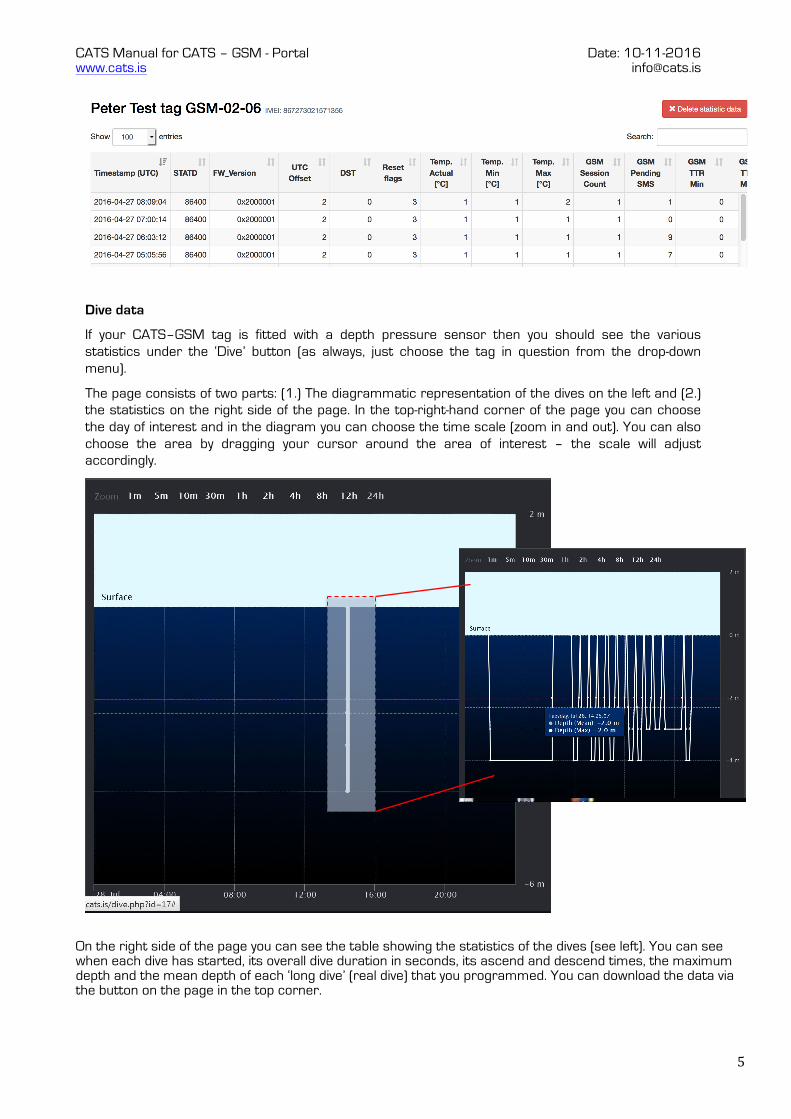
Dive data
If your CATS–GSM tag is fitted with a depth pressure sensor then you should see the various statistics under the ‘Dive’ button (as always, just choose the tag in question from the drop-down menu).
The page consists of two parts: (1.) The diagrammatic representation of the dives on the left and (2.) the statistics on the right side of the page. In the top-right-hand corner of the page you can choose the day of interest and in the diagram you can choose the time scale (zoom in and out). You can also choose the area by dragging your cursor around the area of interest – the scale will adjust accordingly.
On the right side of the page you can see the table showing the statistics of the dives (see left). You can see when each dive has started, its overall dive duration in seconds, its ascend and descend times, the maximum depth and the mean depth of each ‘long dive’ (real dive) that you programmed. You can download the data via the button on the page in the top corner.

CATS Manual for CATS web portal Date: 23-01-2017 www.cats.is [email protected]
6
Barometric data If your tag is fitted with a barometric sensor you will be able to see your barometric data by choosing your tag of interest (again, top left drop-down menu) and click the “Altitude” link on the left menu (see below). If you go along the data points, you will see via a pop-up menu the individual data points. The blue line corresponds to the altitude from the 3-D GPS, which can be inaccurate at times. However, the red data points represent the barometric data, which are usually very accurate (+/- 0.2m), temperature is associated with the barometric sensor.
Battery data

CATS Manual for CATS – GSM - Portal Date: 10-11-2016 www.cats.is [email protected]
7
The GSM – Portal lets you monitor the battery condition of the tag, allowing you to see and optimize the tag programming consequences. When the tag is fully charged this will be close to 4.2V, however, as the logger will measure the voltage as it transmits, which is under “load”, it will never show 100% capacity or 4.2 V, no matter how well charged it is. You can also see the amount of charge (in micro Amps) the tag was able to charge either via the solar cell or while being recharged via the USB. The CATS–GSM-Tag has an advanced power algorithm and is very efficient, however, inefficient programming will reduce its potential a lot. As there are a lot of programming options at your disposal, please make sure you have the right programming applied before deployment. Battery data will be delivered whenever a GSM transmission has been received.
Under your login name in the top-right hand corner of the main menu, you can log out. Downloading data
In order to download any data collected by the web portal, please go to the dashboard (left main menu), you can see the “Download data” field. Here you can choose either a single device or all together next to the label “Device”, then you can choose below that the type of data, again, for all types or just one that you are interested in. Uploading data
Because you can use the CATS-GSM also as an archival tag (deploy-record-retrieve), you are then able to upload the data to the portal to make the data visible and download it again in a usable format. For this you use the “Upload data” field in the dashboard again (see also the CATS-GSM Tag manual pdf for details. Test messages Test messages that have been sent via your user interface can be seen on the Dashboard page as last received messages (Raw messages with green background colour) under the tag in question.