Embed Size (px)
Citation preview
CMD 11-H12.33
File / dossier : 6.01.07 Date: 2011-11-14 Edocs: 3840038
Oral Presentation Submission from CCNB Action, Saint John Fundy Chapter In the Matter of New Brunswick Power Nuclear
Exposé oral Mémoire du CCNB Action, section Saint John Fundy À l’égard de Énergie nucléaire du Nouveau-Brunswick
Request for Approval to Reload Fuel and Restart Point Lepreau Nuclear Generating Station, and Application to renew the Power Reactor Operating licence for the Point Lepreau Generating Station
Demande concernant l’autorisation de recharger le combustible et redémarrer la centrale nucléaire de Point Lepreau, et demande concernant le renouvellement du permis d’exploitation délivré pour la centrale nucléaire de Point Lepreau
Public Hearing Day Two December 1 and 2, 2011
Deuxième jour de l’audience publique Les 1er et 2 décembre 2011

Submission on Relicensing of Point Lepreau Nuclear Generating Station and application to reload fuel
To the Canadian Nuclear Safety Commission
CNSC
Date Submitted: 14 November 2011
By CCNB Action, Saint John-Fundy Chapter
Public Hearing Day Two/
Scheduled for:
Dec. 1-2, 2011
Request for a Licensing Decision:
Regarding:
Point Lepreau Nuclear Reactor
Submitted by:
CCNB Action, Saint John-Fundy Chapter, Intervenor

Point Lepreau Operating Licence and permission to refuel
[CMD Number] i [Date Submitted]
TABLE OF CONTENTS
EXECUTIVE SUMMARY ................................................................................................ 1
1.0 INTRODUCTION .................................................................................................. 3
1.1 Background ........................................................................................................... 3
1.2 Summary of Intervention ....................................................................................... 4
2.0 BUSINESS PLAN ................................................................................................ 5
3.0 SAFETY AND CONTROL AREAS (SCAS) ......................................................... 7
3.1 Management System ............................................................................................ 7
3.2 Human Performance ............................................................................................. 8
3.3 Operating Performance ......................................................................................... 8
3.4 Safety Analysis ...................................................................................................... 9
3.5 Physical Design ................................................................................................... 35
3.6 Fitness for Service ............................................................................................... 35
3.7 Radiation Protection ............................................................................................ 40
3.8 Conventional Health and Safety .......................................................................... 40
3.9 Environmental Protection .................................................................................... 41
3.10 Emergency Management and Fire Protection ..................................................... 41
3.11 Waste Management ............................................................................................ 43
3.12 Security ............................................................................................................... 43
3.13 Safeguards .......................................................................................................... 44
3.14 Packaging and Transport .................................................................................... 45
4.0 OTHER MATTERS OF REGULATORY INTEREST .......................................... 45
4.1 Environmental Assessment ................................................................................. 45
4.2 Aboriginal Consultation ....................................................................................... 45
4.3 Other Consultation .............................................................................................. 46
4.4 Cost Recovery ..................................................................................................... 46
4.5 Financial Guarantees .......................................................................................... 46
4.6 Other Regulatory Approvals ................................................................................ 46
4.7 Licensee’s Public Information Program ............................................................... 46
4.8 Nuclear Liability Insurance .................................................................................. 47

Point Lepreau Operating Licence and permission to refuel
[CMD Number] 1 November 14 2011
EXECUTIVE SUMMARY
In this intervention we have tried to show from top down bottom up that there are many
issues with restarting Point Lepreau. Our position is that the refurbishment should be changed
into decommissioning. In light of the Fukushima accident there have been many lessons learned.
We feel that NB Power and the recommendation from the CNSC staff to be given a license and
application to refuel, have not fully addressed the seriousness of the Fukushima accident, and for
this reason no licence should be granted.

Point Lepreau Operating Licence and permission to refuel
[CMD Number] 2 November 14 2011

Point Lepreau Operating Licence and permission to refuel
[CMD Number] 3 November 14 2011
1.0 INTRODUCTION
1.1 Background
The group we are representing is CCNB Action SJ Fundy Chapter.
Our Vision:
CCNB believes the future of all life depends on bringing human activity in balance with
ecological limits.
Our Mission
CCNB is a citizens' action group that creates awareness of environmental problems and
advocates solutions through research, education and interventions.
This intervention and the research behind it have mostly been done by just a few people
in our chapter. They have been working in their spare time and even taken time off work to
address this very serious matter. In trying to fully understand the problems with Point Lepreau
we had discussions with many people who have been trying to shut down this White Elephant
since its conception. We would like to thank the many people who have taken their time to give
us their history regarding Point Lepreau, and talk about the white elephant in the room. We hope
that today we can finally get everyone in the room to recognize Pointless Lepreau for what it
really is and start discussions on how dangerous it really is.

Point Lepreau Operating Licence and permission to refuel
[CMD Number] 4 November 14 2011
1.2 Summary of Intervention
We would like too clearly state that we request that the licence to operate and permission
to refuel not be granted, and the project steered towards decommissioning. We will provide
information and ask some very tough questions in almost all of the areas of the licence to show
why we take this stance.
Specifically the topic of the Probabilistic Safety Analysis based Seismic Margin Analysis
covered under section 3.4 questions the reliability of the work done in regards to this very
important topic in light of the Fukushima accident. It may even suggest that misinformation
might have knowingly been given to the CNSC staff. This alone should question any work that
been submitted by NB Power as well as the CNSC staff’s recommendation to approve this
licence and request to refuel.
Almost all of the reference material used in this intervention has come from either the
CNSC or NB Power. Other documents that have been used are industry documents. We have
done our best to use the best available data and provide it in an understandable contextual way
that corresponds to the licencing of Point Lepreau. We have taken head to information on the
CNSC website and have used the template document provided. We have also familiarized
ourselves with the rules of proceeding for the Day 2 hearings.
It is also important to note that the core of this intervention has come from a few people
working in their spare time, two meetings with NB Power and a tour of the plant. If a couple of
people who are not from the industry can find this many serious problems, it might suggest that
this is only the tip of the ice burg. Also we would like to state that we do not feel comfortable
that we have been able to review everything necessary due to time constraints.
We encourage the commissioners to take this and all of the interveners concerns very
seriously when making your decisions on this very serious matter. One of the major lessons
learned from the Fukushima accident is the problems with industry and the regulators having too
close of a relationship. We truly hope that this is not the case for this hearing.
Point Lepreau Operating Licence and permission to refuel
[CMD Number] 5 November 14 2011
2.0 Business Plan
It is important for us to not be short sighted in our intervention and consider the economic
plan for Point Lepreau to a decommissioning phase instead of an operational phase. In
conversations about the hearings with the public a lot of the questions raised are how can they
spend all that money and not operate the plant, and what about jobs lost. We would like to put
forward our thoughts on this very important topic.
In 2002 New Brunswick’s own Public Utilities Board came to the conclusion after weeks
of testimony from NB Power and the interveners, that it was not in the public’s interest. Even
back in 2002 the project was not economical. Despite the warnings from the PUB NB Power
went ahead with the refurbishment. Many of the risks that where brought out, in the PUB
hearings have come to light, as well as many more. These are all upfront cost to the
refurbishment. We would like to show that regulatory risk will continue throughout the rest of
the life of the plant if operated. When looking at these risks especially in light of Fukushma
accident at any time the CNSC can impose new rules and regulations which could be a huge
financial risk to NB Power. One of the other major risks is that not all of the plant has been
refurbished, there is a lot of very expensive equipment that might have to be replaced if the plant
is continued to run.
When the plant was shut down in 2008 the cost to produce a kWh of electricity at Point
Lepreau was around 11 cents a kWh. Our residential rate is around 9.5 cents a kWh. It’s not hard
to see why the PUB advised us to decommission instead of refurbishment. This has not changed
and with all the new rules and regulations that have been implemented for refurbishment would
suggest the cost of operating the plant will only get worse.
Could NB Power comment if the costs of operating the plant will have increased since
the time of the PUB hearings.
We would also like to mention some details about the cost over runs at Point Lepreau.
The contract for the refurbishment was a fixed price contract; therefore most of the cost overruns
have been paid for from the Federal Government through AECL. Most of the cost overruns that
NB Power talks about are for replacement power and the costs associated with paying
employee’s to work at a plant that is not operational. Currently NB Power is buying cheap clean
hydro power from Hydro Quebec. They are then selling it at a profit, so any of the so called
replacement power cost overruns would not be true, they are actually substantially helping NB
Power in gaining revenue. This year NB Power actually made a profit of around 60 million
dollars much of this is associated with the cheap power they are getting from Quebec. If NB
Power is allowed to restart the reactor we will be no longer buy this cheap clean power from
Hydro Quebec but will be supplying power from a nuclear reactor and selling it for cheaper than
it is produced.
We would like to note that Point Lepreau has been out of service since 2008 and we
haven’t experienced any shortages of power, so therefore it is not needed.
Point Lepreau Operating Licence and permission to refuel
[CMD Number] 6 November 14 2011
I think this would satisfy the question of how they can spend all that money and not
operate the plant. You can see that it hasn’t been as much money provincially as it appears on the
surface, as well it would seem that it would be cheaper for us not to run the plant but to buy
cheap clean power from Quebec. Throwing good money after bad is never a good idea.
Now to address the question what about the jobs. A lot of the jobs for the refurbishment
have been contractor jobs, which will soon come to an end. The contractors in the area have
gotten more than double the amount of work than originally planned, so all these people will
soon be looking for work.
NB Power is required by law to have enough money in the bank for decommissioning.
They currently have approximately $500 million in the bank for decommissioning. This is
money that does not have to be borrowed for the decommissioning but already paid for. Some
might question if this is even enough money for decommissioning as the nuclear industry in
Canada has a bad habit of underestimating costs. The one thing that is really important to all this
is that most of the highly radioactive materials from the reactor has already been
decommissioned for the refurbishment.
Could NB Power Please comment on the costs associated to dismantle and store all the
waste from the refurbishment? It has been noted that there has been a lot more waste from the
refurbishment than originally expected, so it would seem that there must be cost overruns
associated with this. What portion the $500 million decommissioning fund would have been used
from these real life costs of decommissioning?
Turning the project into a decommissioning would in fact create more work for the local
community using funds already in place. A lot of the NB Power employees would still be
working as a result of decommissioning for quite some time.

Point Lepreau Operating Licence and permission to refuel
[CMD Number] 7 November 14 2011
3.0 Safety and Control Areas (SCAs)
3.1 Management System
Although NB Power’s management system looks good in the nice flow chart that they
provided on Day 1, I think it is best to look at their decisions and track record as a more accurate
description of how effective it is. NB Power has a history of making bad decisions that are not in
the public’s best interest.
One example was the Coleson Cove Orimulsion conversion fiasco. Against the advice
given by the public, and without a contract in hand for the cheap dirty fuel they intended to burn,
they spent a billion dollars to convert the plant to a fuel that no longer existed by the time the
plant was ready to operate. NB Power ran Coleson Cove for approximately 11 days last year,
because it is too expensive to run on oil. How many cents per kw hour does it cost to run
Coleson Cove for 11 days a year after spending all that money?
At the public hearing last year it was stated that the Public Utilities Board gave the go
ahead for the refurbishment of PLNGS. This is however untrue. The PUB in 2002 made it clear
that it should be decommissioned and that it wasn’t in the public’s interest to refurbish the
nuclear plant. NB Power however went ahead anyway knowing the many risks of this first of a
kind project. Pretty much all of the risks that were known then, came to life, as well as many
more. One of the major risks that they took was the regulatory risk, which will continue on for
the rest life of the plant as new rules and regulations are implemented. This should be of high
importance to New Brunswickers in light of the Fukushima accident, as this may put New
Brunswickers at more financial risk.
The project has had huge cost overruns. One of the inexplicable actions of management
was to continue to install the calandria tubes after they found they were leaking. Once they had
installed all the tubes, they had to take them all out again. We would like to note that the Korean
refurbishment stopped as soon as they knew there was a problem, unlike NB Power.
No one in NB Power management has taken responsibility for the bad decisions that will
be costing ratepayers and taxpayers so much money, and no one has been fired as a result of a
billion dollar mistake.
NB Power has around 5 billion dollars in debt. This is definitely a sign that the company is
mismanaged.
During a meeting this summer with Paul Thompson, Derreck Mullen and Kathleen
Duguay we expressed our concerns about the review level earthquakes for the PSA based SMA.
We told them about the Open file 2929 report during that meeting. Our concerns are expressed in
detail under section 3.4 of our intervention. There seems to be no mention of any potential gaps
in NB Power’s submissions about this, which would indicate they did not take this safety
concern of ours seriously.
Point Lepreau Operating Licence and permission to refuel
[CMD Number] 8 November 14 2011
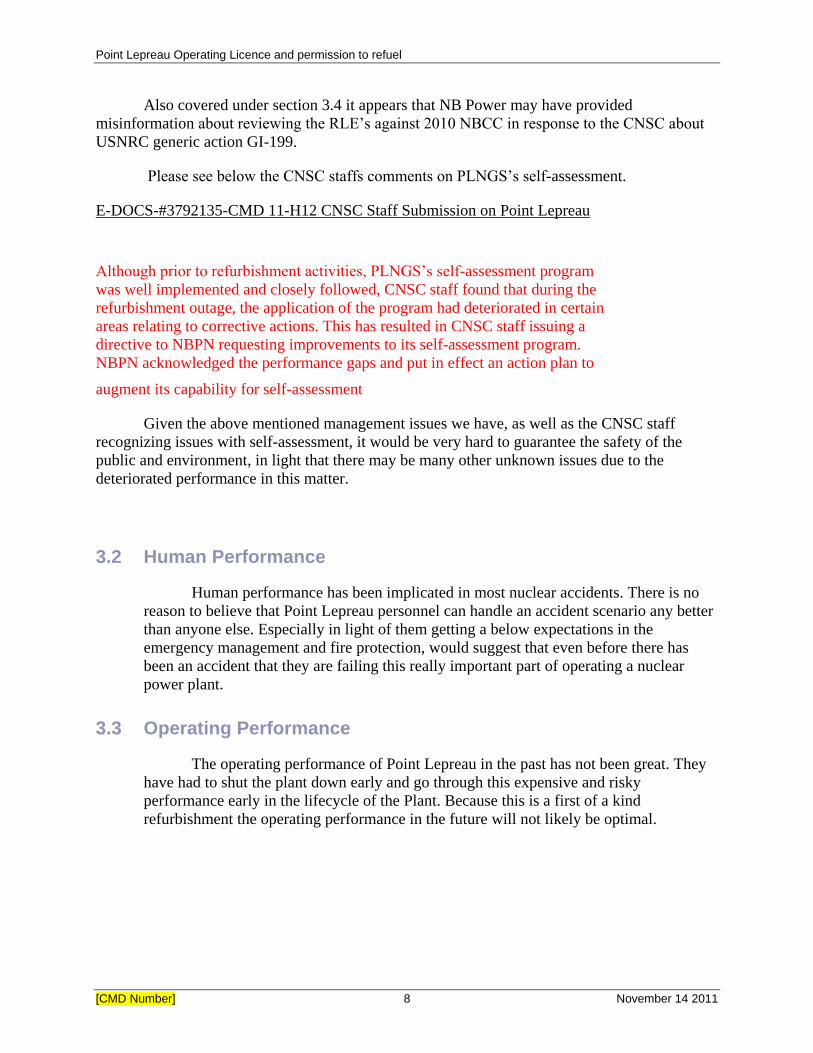
Also covered under section 3.4 it appears that NB Power may have provided
misinformation about reviewing the RLE’s against 2010 NBCC in response to the CNSC about
USNRC generic action GI-199.
Please see below the CNSC staffs comments on PLNGS’s self-assessment.
E-DOCS-#3792135-CMD 11-H12 CNSC Staff Submission on Point Lepreau
Although prior to refurbishment activities, PLNGS’s self-assessment program
was well implemented and closely followed, CNSC staff found that during the
refurbishment outage, the application of the program had deteriorated in certain
areas relating to corrective actions. This has resulted in CNSC staff issuing a
directive to NBPN requesting improvements to its self-assessment program.
NBPN acknowledged the performance gaps and put in effect an action plan to
augment its capability for self-assessment
Given the above mentioned management issues we have, as well as the CNSC staff
recognizing issues with self-assessment, it would be very hard to guarantee the safety of the
public and environment, in light that there may be many other unknown issues due to the
deteriorated performance in this matter.
3.2 Human Performance
Human performance has been implicated in most nuclear accidents. There is no
reason to believe that Point Lepreau personnel can handle an accident scenario any better
than anyone else. Especially in light of them getting a below expectations in the
emergency management and fire protection, would suggest that even before there has
been an accident that they are failing this really important part of operating a nuclear
power plant.
3.3 Operating Performance
The operating performance of Point Lepreau in the past has not been great. They
have had to shut the plant down early and go through this expensive and risky
performance early in the lifecycle of the Plant. Because this is a first of a kind
refurbishment the operating performance in the future will not likely be optimal.

Point Lepreau Operating Licence and permission to refuel
[CMD Number] 9 November 14 2011
3.4 Safety Analysis
PSA based SMA
From the below email from Lisa Love-Tedjou please see the brief but well
described method and functions of the Point Lepreau’s Level 1 and Level 2 PSA based
SMA
Email Correspondence with CNSC Staff
“A Seismic Margin Assessment (SMA) establishes the capability of the plant to
successfully shutdown and cooldown following a seismic event. The output of a SMA is
a plant value expressed as Peak Ground Acceleration (PGA)(g) with High Confidence
and Low Probability of Failure (HCLPF). A Probabilistic Safety Assessment (PSA) based
SMA utilizes the PSA model to establish the system functions and components that are
required in order to achieve a safe shutdown and cooldown and to quantify the limiting
earthquake magnitude that the plant will be able to survive. A PSA based SMA does not
quantify the risk of core damage or large release outside containment.
The process starts by performing a walkdown to screen out robust equipment and
structures (SQ @ 0.5g, NSQ @ 0.3g) in accordance with EPRI-NP-6041. Equipment,
which is not screened out by this walkdown, requires a fragility analysis to be performed.
This analysis will establish the HCLPF value (as per EPRI-TR-103959) for each
equipment and structure model in the PSA. A seismic fault tree is then developed, which
is based on the internal events fault tree, in order to add HCLPF values to each
component/equipment. Furthermore, a primary seismic event tree is developed in order to
establish the consequential accident type (Seismic Induced Initiating Events) resulting
from an array of seismic magnitude events. For each of these primary sequences,
secondary event trees are then developed to detail the mitigation of each seismic initiator
until they are properly mitigated or severe core damage has occurred. From these
secondary event trees, cutsets are generated from which the HCLPF value of the plant is
calculated by using a Min/Max method using only the pure seismic cutsets. This HCLPF
plant value is then compared to the selected Review Level Earthquake (RLE).
The RLE for Level 1 is 0.3g The calculation of the Point Lepreau plant HCLPF for the
level 1 PSA shows a result of 0.3g, and that of level 2 shows a result of 0.42g. The results
demonstrate a HCLPF of 0.3g for prevention of severe core damage frequency, an event
that has a frequency of occurrence of 1/10000 years, and a HCLPF of 0.42g for
prevention of large release of fission products from containment, an event that has a
frequency of about 1/100000 years.”

Point Lepreau Operating Licence and permission to refuel
[CMD Number] 10 November 14 2011
We verified with the CNSC staff with respect to the RLE
“Yes.
Andrei
-----Original Message-----
From: Chris R [mailto:[email protected]]
Sent: Friday, October 28, 2011 10:38 PM
To: Love-Tedjoutomo, Lisa
Cc: Bélanger, Pierre; Akl, Yolande; Karouni, Jaafar; Blahoianu, Andrei
Subject: Re: Answer to Question Two
Just to be clear, I am asking about the Review Level Earthquake. Is the RLE
for severe core damage a earthquake with a probability of 1 in 10000 years?
And the RLE for large early release a earthquake with a probability of 1 in
100000 years.
Thanks
Chris
Sent on the TELUS Mobility network with BlackBerry
-----Original Message-----
From: Love-Tedjoutomo Lisa <[email protected]>
Date: Sat, 29 Oct 2011 01:13:20
To: <[email protected]>
Cc: <[email protected]>; <[email protected]>;
<[email protected]>; <[email protected]>
Subject: RE: Answer to Question Two
No I believe it is a comparison to events, likely internal, that lead to
either severe core damage or large release; however, I will have the experts
confirm on Monday along with the source.
Cheers,
Lisa
-----Original Message-----
From: Chris R [mailto:[email protected]]
Sent: Friday, October 28, 2011 9:05 PM
To: Love-Tedjoutomo, Lisa
Cc: Bélanger, Pierre; Akl, Yolande; Karouni, Jaafar; Blahoianu, Andrei
Subject: Re: Answer to Question Two
Thank you Lisa. I'm sorry but may I ask just a few more questions? Are the
two events mentioned in the last paragraph, with a frequency of 1 in 10000
years and 1 in 100000 years, earthquakes? I am assuming yes but just want to
clarify. If so how was this determined. Could you tell me what report this
information came from and when this report was done?”
Point Lepreau Operating Licence and permission to refuel
[CMD Number] 11 November 14 2011
So in laymen’s terms so it is easily understood basically what they have done is
figured out what Structures Systems and Components are needed to prevent Severe Core
Damage and Large Early Release of radiation and have figured out what the HCLPF(High
Confidence Of Low Probability of Failure, This will be discussed later) of the equipment, this is
measured in g units and is compared to the RLE’s (Review Level Earthquake) for Level 1
(Severe Core Damage) and Level 2 (Large Early Release of radiation). Any of the equipment
that was determined to have a HCLPF lower than the RLE had to have seismic upgrades to meet
the appropriate RLE.
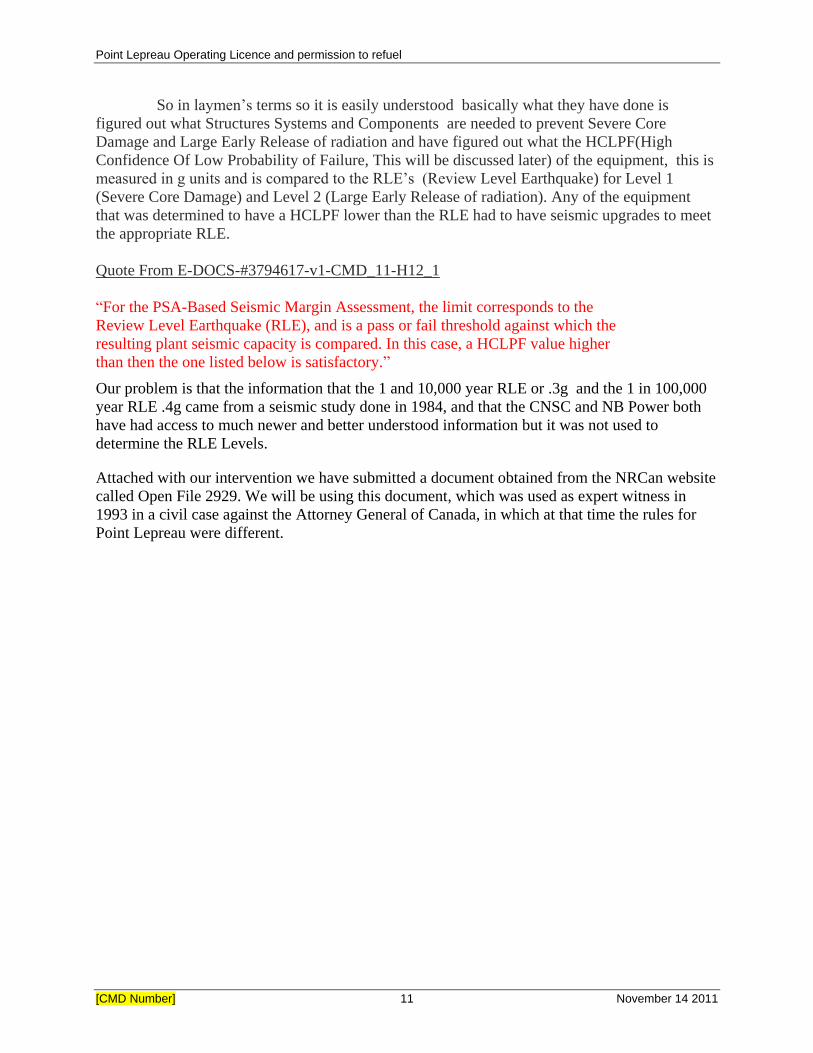
Quote From E-DOCS-#3794617-v1-CMD_11-H12_1
“For the PSA-Based Seismic Margin Assessment, the limit corresponds to the
Review Level Earthquake (RLE), and is a pass or fail threshold against which the
resulting plant seismic capacity is compared. In this case, a HCLPF value higher
than then the one listed below is satisfactory.”
Our problem is that the information that the 1 and 10,000 year RLE or .3g and the 1 in 100,000
year RLE .4g came from a seismic study done in 1984, and that the CNSC and NB Power both
have had access to much newer and better understood information but it was not used to
determine the RLE Levels.
Attached with our intervention we have submitted a document obtained from the NRCan website
called Open File 2929. We will be using this document, which was used as expert witness in
1993 in a civil case against the Attorney General of Canada, in which at that time the rules for
Point Lepreau were different.
Point Lepreau Operating Licence and permission to refuel
[CMD Number] 12 November 14 2011
From Open File 2929
Please Note that NB Powers Name is on the report. We find it quite hard to believe that they did
not know about this or if they just chose not to use this.
Also from a document obtained from the CNSC website acknowledging that the regulator was
well aware of this document, and even did a study to attest to the reliability of the document.
Please see below.
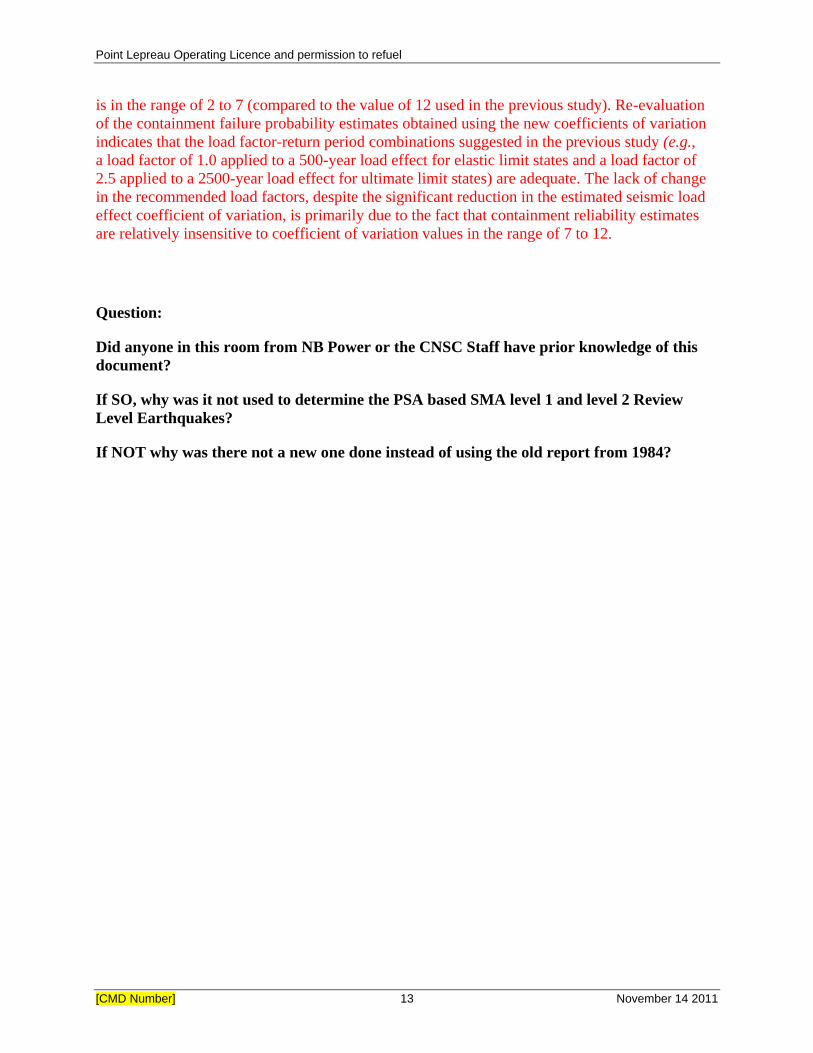
From INFO-0656
The new seismic hazard data, as reported by Weston Geophysical Corporation, indicates that the
coefficient of variation of the seismic load effect associated with Eastern Canadian reactor sites
Point Lepreau Operating Licence and permission to refuel
[CMD Number] 13 November 14 2011
is in the range of 2 to 7 (compared to the value of 12 used in the previous study). Re-evaluation
of the containment failure probability estimates obtained using the new coefficients of variation
indicates that the load factor-return period combinations suggested in the previous study (e.g.,
a load factor of 1.0 applied to a 500-year load effect for elastic limit states and a load factor of
2.5 applied to a 2500-year load effect for ultimate limit states) are adequate. The lack of change
in the recommended load factors, despite the significant reduction in the estimated seismic load
effect coefficient of variation, is primarily due to the fact that containment reliability estimates
are relatively insensitive to coefficient of variation values in the range of 7 to 12.
Question:
Did anyone in this room from NB Power or the CNSC Staff have prior knowledge of this
document?
If SO, why was it not used to determine the PSA based SMA level 1 and level 2 Review
Level Earthquakes?
If NOT why was there not a new one done instead of using the old report from 1984?

Point Lepreau Operating Licence and permission to refuel
[CMD Number] 14 November 14 2011
From Open File 2929
Please note the reference above about the longer-term value of the report, which it seems, has
been ignored.
Because the rules are different for Point Lepreau now, then when they were back then
we would like to keep our intervention in context by pointing some of these differences. When
this report was done the NPP’s had to be able to withstand an earthquake with a probability of 1
in 1000 years the DBE or Design Based Earthquake. The new rules as you have seen above state
that they must have certain parts of the plant able to withstand a 1 in 10,000 earthquake and a 1
in 100,000 earthquake for the Level 1 and Level 2 PSA based SMA for Point Lepreau.
Point Lepreau Operating Licence and permission to refuel
[CMD Number] 15 November 14 2011
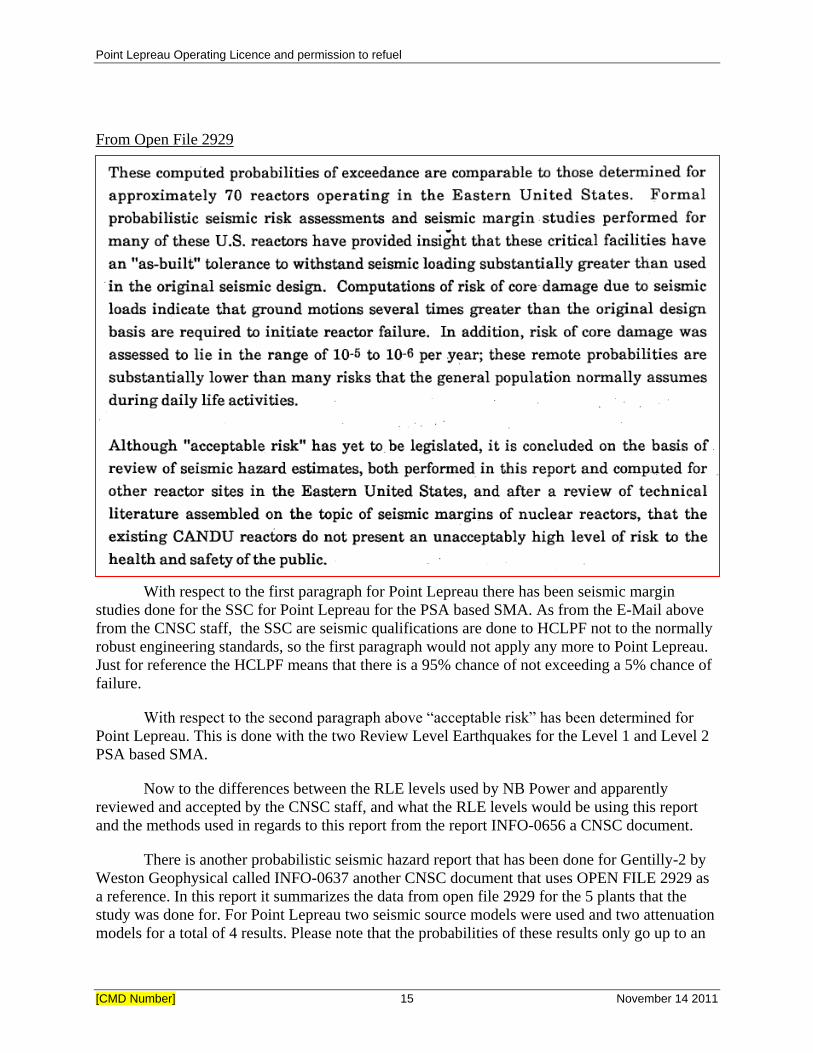
From Open File 2929
With respect to the first paragraph for Point Lepreau there has been seismic margin
studies done for the SSC for Point Lepreau for the PSA based SMA. As from the E-Mail above
from the CNSC staff, the SSC are seismic qualifications are done to HCLPF not to the normally
robust engineering standards, so the first paragraph would not apply any more to Point Lepreau.
Just for reference the HCLPF means that there is a 95% chance of not exceeding a 5% chance of
failure.
With respect to the second paragraph above “acceptable risk” has been determined for
Point Lepreau. This is done with the two Review Level Earthquakes for the Level 1 and Level 2
PSA based SMA.
Now to the differences between the RLE levels used by NB Power and apparently
reviewed and accepted by the CNSC staff, and what the RLE levels would be using this report
and the methods used in regards to this report from the report INFO-0656 a CNSC document.
There is another probabilistic seismic hazard report that has been done for Gentilly-2 by
Weston Geophysical called INFO-0637 another CNSC document that uses OPEN FILE 2929 as
a reference. In this report it summarizes the data from open file 2929 for the 5 plants that the
study was done for. For Point Lepreau two seismic source models were used and two attenuation
models for a total of 4 results. Please note that the probabilities of these results only go up to an

Point Lepreau Operating Licence and permission to refuel
[CMD Number] 16 November 14 2011
annual exceedance probability of .0001 which is an earthquake with a probability of 1 in 10,000
years the same probability as the RLE for the level 1 PSA based SMA. We will address the 1 in
100,000 year RLE later in our report.
CNSC Document INFO-0637
Point Lepreau Operating Licence and permission to refuel
[CMD Number] 17 November 14 2011
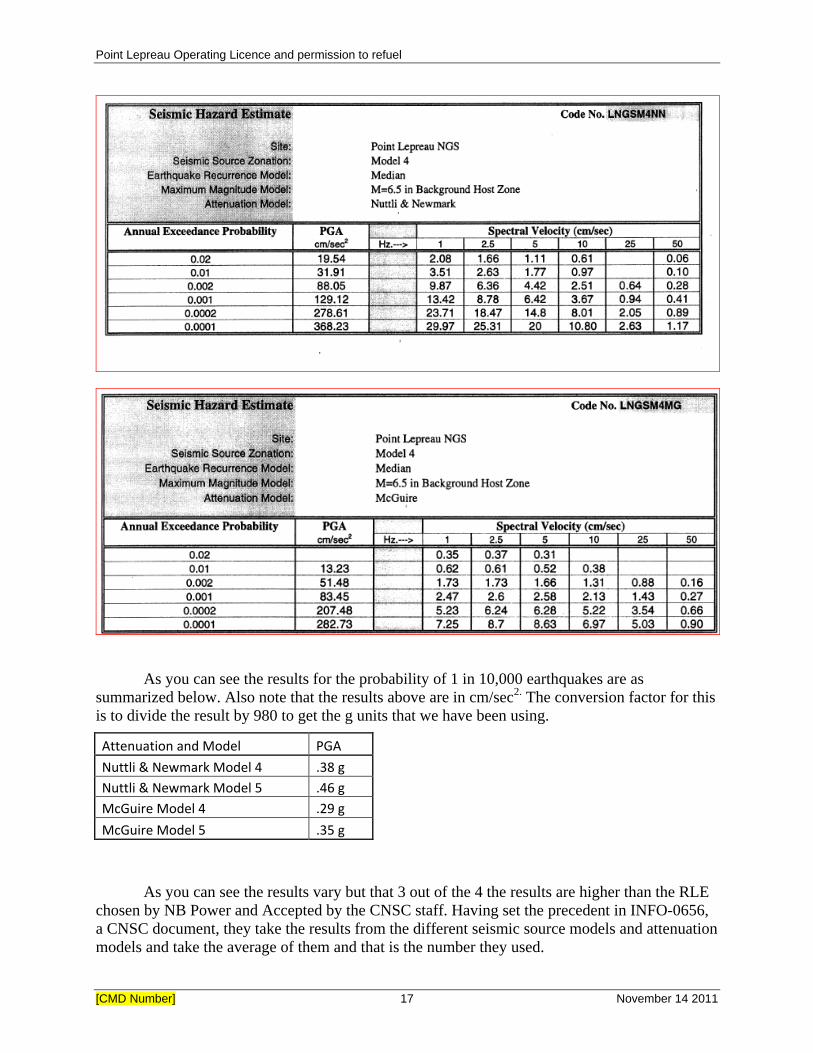
As you can see the results for the probability of 1 in 10,000 earthquakes are as
summarized below. Also note that the results above are in cm/sec2. The conversion factor for this
is to divide the result by 980 to get the g units that we have been using.
Attenuation and Model PGA
Nuttli & Newmark Model 4 .38 g
Nuttli & Newmark Model 5 .46 g
McGuire Model 4 .29 g
McGuire Model 5 .35 g
As you can see the results vary but that 3 out of the 4 the results are higher than the RLE
chosen by NB Power and Accepted by the CNSC staff. Having set the precedent in INFO-0656,
a CNSC document, they take the results from the different seismic source models and attenuation
models and take the average of them and that is the number they used.

Point Lepreau Operating Licence and permission to refuel
[CMD Number] 18 November 14 2011
CNSC Document INFO-0656
When the four results are averaged the result ends up being approximately .37 g. With 3
out of the 4 results being above the NB Powers RLE for the level 1 PSA based SMA and when
you take the approach that was taken from INFO-0656 we can clearly see that the level chosen
by NB Power and accepted by the CNSC staff is too low.
A request was made from us to get a copy of the 1984 probabilistic seismic hazard that
was used to determine the RLE’s for the PSA based SMA. We were not allowed to get a copy of
the document but NB Power did print a copy of it for us and let us review it at their office. We
were allowed to take notes. We did not have time to fully review this document but some notes
from it are summarized below.
There appeared to be 3 seismic source models used in this study with one attenuation
model, but the one attenuation model was done using 3 different inputs to it. One of the 3 seemed
to give unrealistic number significantly lower than the other two, and the other two gave similar
results to Open File 2929. Below is a summary of the notes we took for the g levels for a
probability of 1 in 10,000 year earthquake.
Model A Result 1 0.28 g
Model A Result 2 .36 g
Model A Result 3 .13 g
Model B Result 1 0.32 g
Model B Result 2 .43 g
Model B Result 3 .14 g
Model C Result 1 0.26 g
Model C Result 2 .3 g
Model C Result 3 .14 g
If the Result 3 from the chart above is not taken into account you end up with 3 of the 6
remaining being above the NB Power RLE for the Level 1 PSA based SMA and if you take the
average of them the result is .33 g. Even using the document NB Power used it would suggest
that the RLE should be set higher than .3 g.
. Now to discuss the RLE for the level 2 (Large Early Release) PSA based SMA. NB
Power has chosen .4g for an earthquake with a probability of 1 in 100,000 years. We will show
below using information from the OPEN FILE 2929, NRCan Data, the 1984 report that NB
Power used as well as information from an email from Greg Rzentkowski to show that this
number is grossly underestimated.
Point Lepreau Operating Licence and permission to refuel
[CMD Number] 19 November 14 2011
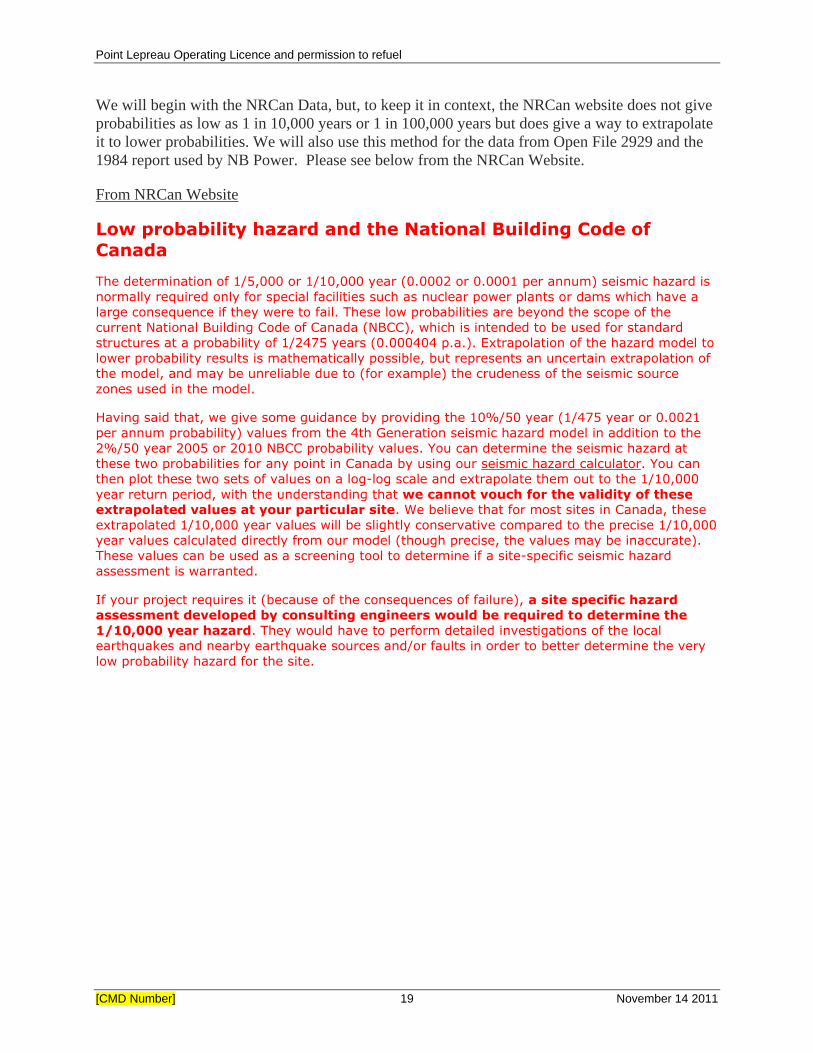
We will begin with the NRCan Data, but, to keep it in context, the NRCan website does not give
probabilities as low as 1 in 10,000 years or 1 in 100,000 years but does give a way to extrapolate
it to lower probabilities. We will also use this method for the data from Open File 2929 and the
1984 report used by NB Power. Please see below from the NRCan Website.
From NRCan Website
Low probability hazard and the National Building Code of
Canada
The determination of 1/5,000 or 1/10,000 year (0.0002 or 0.0001 per annum) seismic hazard is
normally required only for special facilities such as nuclear power plants or dams which have a
large consequence if they were to fail. These low probabilities are beyond the scope of the
current National Building Code of Canada (NBCC), which is intended to be used for standard
structures at a probability of 1/2475 years (0.000404 p.a.). Extrapolation of the hazard model to
lower probability results is mathematically possible, but represents an uncertain extrapolation of
the model, and may be unreliable due to (for example) the crudeness of the seismic source
zones used in the model.
Having said that, we give some guidance by providing the 10%/50 year (1/475 year or 0.0021
per annum probability) values from the 4th Generation seismic hazard model in addition to the
2%/50 year 2005 or 2010 NBCC probability values. You can determine the seismic hazard at
these two probabilities for any point in Canada by using our seismic hazard calculator. You can
then plot these two sets of values on a log-log scale and extrapolate them out to the 1/10,000
year return period, with the understanding that we cannot vouch for the validity of these
extrapolated values at your particular site. We believe that for most sites in Canada, these
extrapolated 1/10,000 year values will be slightly conservative compared to the precise 1/10,000
year values calculated directly from our model (though precise, the values may be inaccurate).
These values can be used as a screening tool to determine if a site-specific seismic hazard
assessment is warranted.
If your project requires it (because of the consequences of failure), a site specific hazard
assessment developed by consulting engineers would be required to determine the
1/10,000 year hazard. They would have to perform detailed investigations of the local
earthquakes and nearby earthquake sources and/or faults in order to better determine the very
low probability hazard for the site.

Point Lepreau Operating Licence and permission to refuel
[CMD Number] 20 November 14 2011
Sample extrapolation of 0.0021 p.a. and 0.000404 p.a. hazard values to a 0.0001 p.a. value, to
be used for screening purposes only to determine if a site specific seismic hazard
assessment is warranted.
Point Lepreau Operating Licence and permission to refuel
[CMD Number] 21 November 14 2011
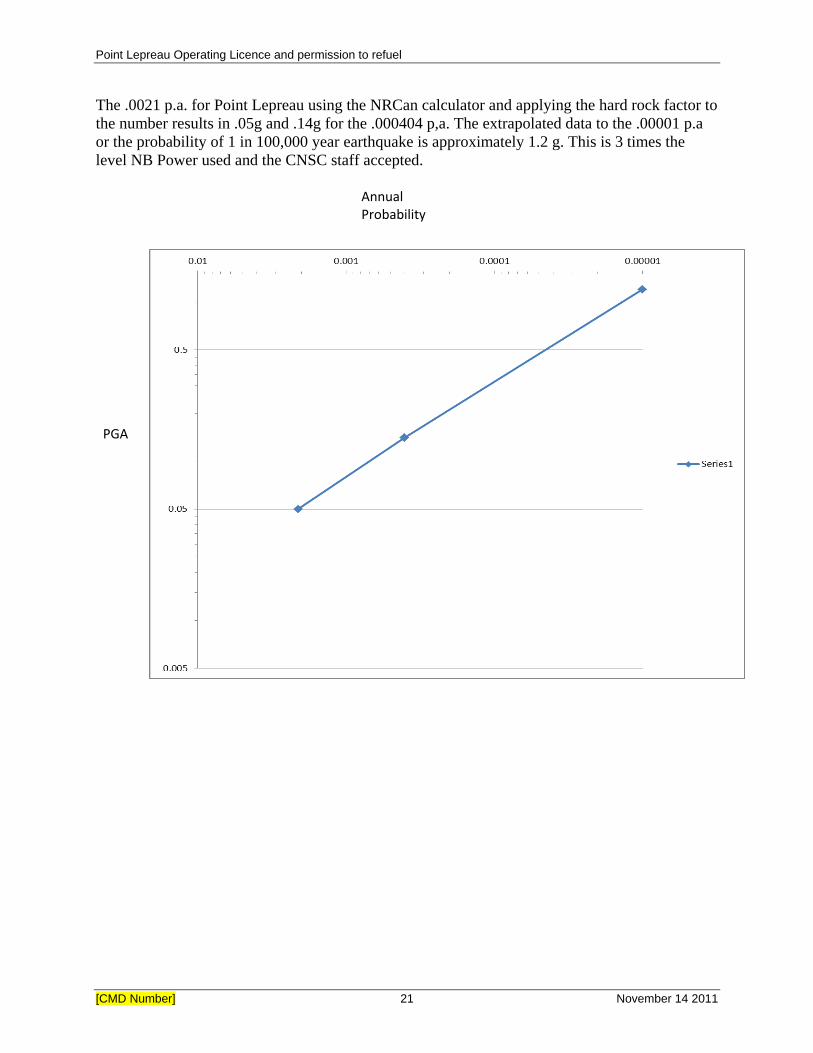
The .0021 p.a. for Point Lepreau using the NRCan calculator and applying the hard rock factor to
the number results in .05g and .14g for the .000404 p,a. The extrapolated data to the .00001 p.a
or the probability of 1 in 100,000 year earthquake is approximately 1.2 g. This is 3 times the
level NB Power used and the CNSC staff accepted.
Annual Probability
PGA
Point Lepreau Operating Licence and permission to refuel
[CMD Number] 22 November 14 2011
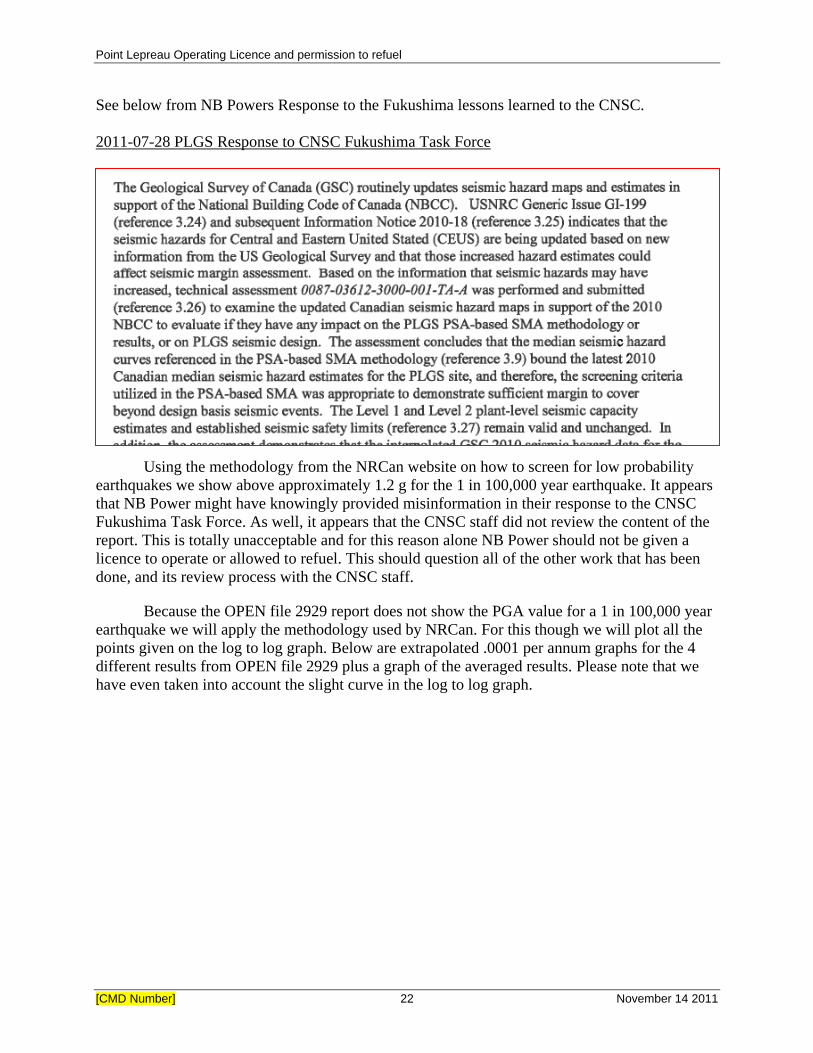
See below from NB Powers Response to the Fukushima lessons learned to the CNSC.
2011-07-28 PLGS Response to CNSC Fukushima Task Force
Using the methodology from the NRCan website on how to screen for low probability
earthquakes we show above approximately 1.2 g for the 1 in 100,000 year earthquake. It appears
that NB Power might have knowingly provided misinformation in their response to the CNSC
Fukushima Task Force. As well, it appears that the CNSC staff did not review the content of the
report. This is totally unacceptable and for this reason alone NB Power should not be given a
licence to operate or allowed to refuel. This should question all of the other work that has been
done, and its review process with the CNSC staff.
Because the OPEN file 2929 report does not show the PGA value for a 1 in 100,000 year
earthquake we will apply the methodology used by NRCan. For this though we will plot all the
points given on the log to log graph. Below are extrapolated .0001 per annum graphs for the 4
different results from OPEN file 2929 plus a graph of the averaged results. Please note that we
have even taken into account the slight curve in the log to log graph.
Point Lepreau Operating Licence and permission to refuel
[CMD Number] 23 November 14 2011
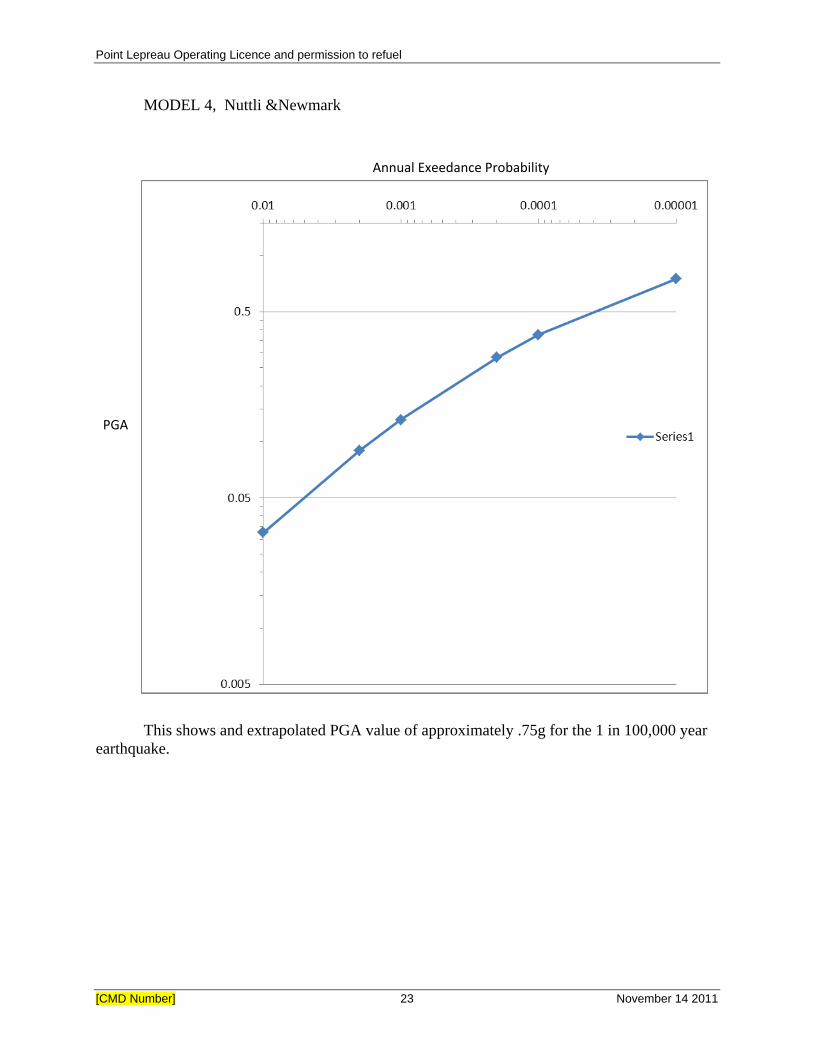
MODEL 4, Nuttli &Newmark
Annual Exeedance Probability
PGA
This shows and extrapolated PGA value of approximately .75g for the 1 in 100,000 year
earthquake.
Point Lepreau Operating Licence and permission to refuel
[CMD Number] 24 November 14 2011
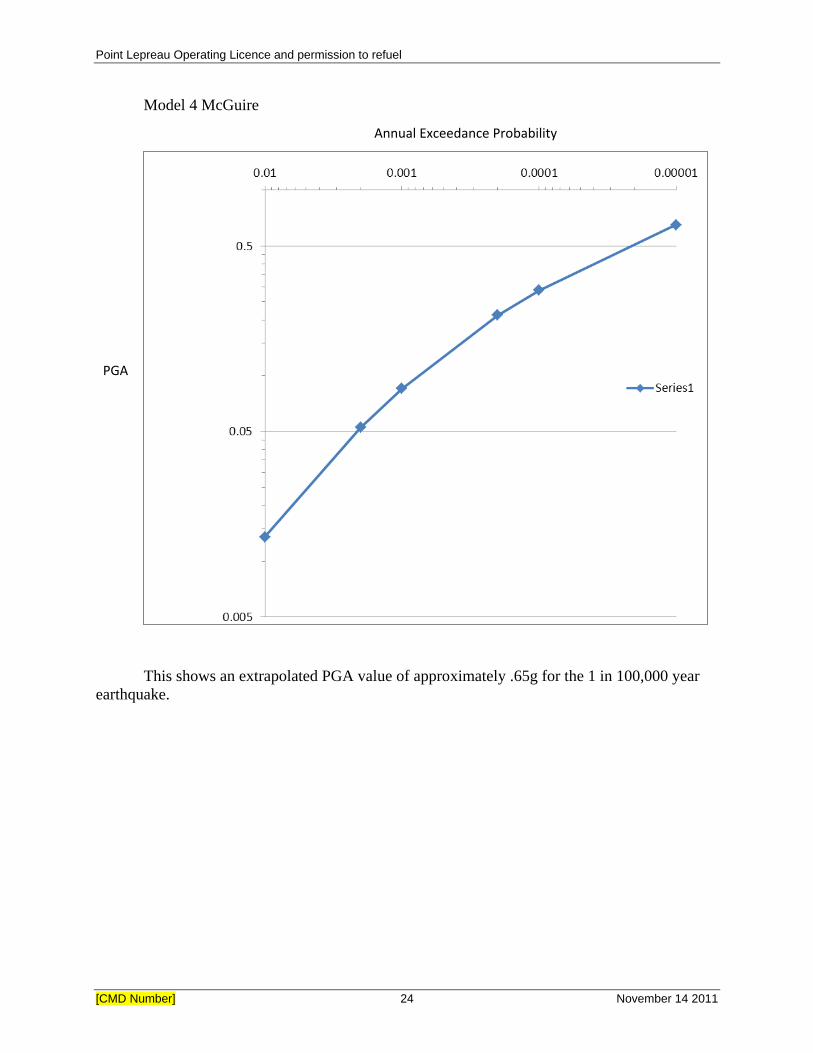
Model 4 McGuire
Annual Exceedance Probability
PGA
This shows an extrapolated PGA value of approximately .65g for the 1 in 100,000 year
earthquake.

Point Lepreau Operating Licence and permission to refuel
[CMD Number] 25 November 14 2011
Model 5 Nuttli & Newmark
Annual Exceedance Probability
PGA
This shows an extrapolated PGA value of approximately .9g for the 1 in 100,000 year
earthquake.

Point Lepreau Operating Licence and permission to refuel
[CMD Number] 26 November 14 2011
Model 5 McGuire
Annual Exceedance Probability
PGA
This shows an extrapolated PGA value of approximately .7g for the 1 in 100,000 year
earthquake.
Point Lepreau Operating Licence and permission to refuel
[CMD Number] 27 November 14 2011
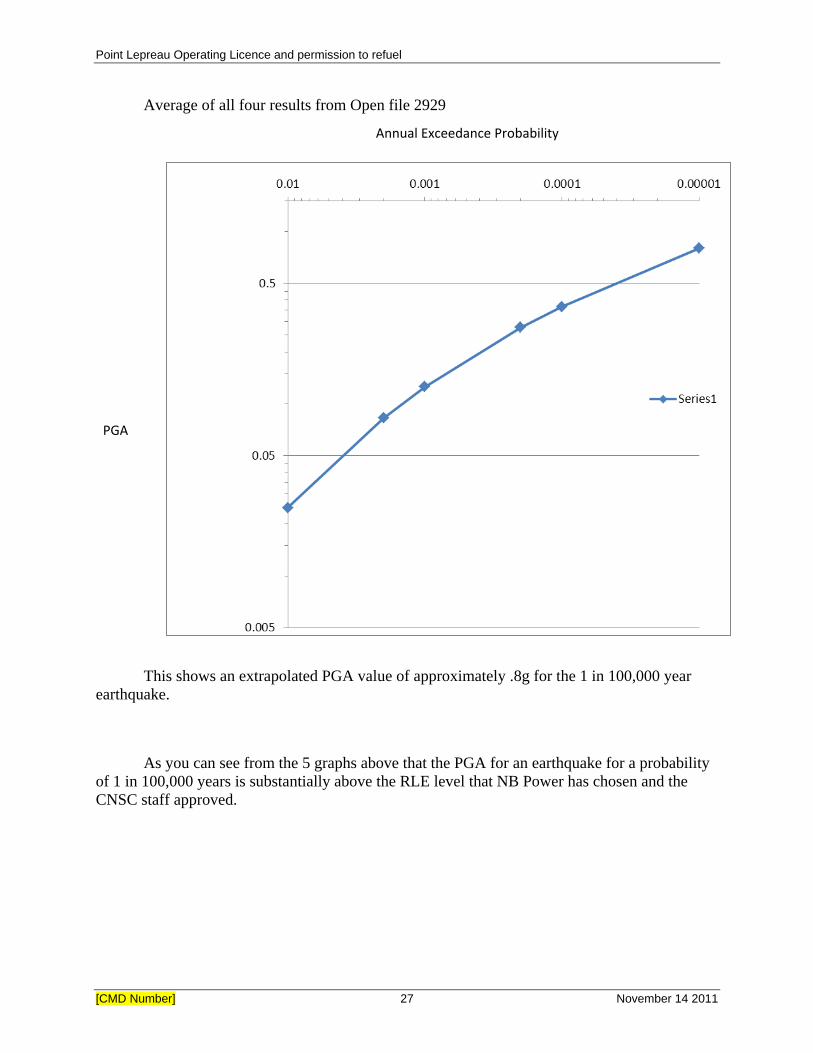
Average of all four results from Open file 2929
Annual Exceedance Probability
PGA
This shows an extrapolated PGA value of approximately .8g for the 1 in 100,000 year
earthquake.
As you can see from the 5 graphs above that the PGA for an earthquake for a probability
of 1 in 100,000 years is substantially above the RLE level that NB Power has chosen and the
CNSC staff approved.
Point Lepreau Operating Licence and permission to refuel
[CMD Number] 28 November 14 2011
Now we would like to discuss the 1984 report that NB power used to determine the RLE
for large early release. In this report it did not extend the probabilities to the 1 in 100,000 year
earthquake, but when we were there we extended the seismic hazard curve and got the following
two results from the document. One was approximately .65 g and the other was approximately
.8g. Again you can see that the RLE of .4g that NB Power has selected and CNSC staff approved
is substantially lower than even the information from the report they used.
Also in our brief look at the PSA based SMA one other thing that we noted was that the
raw service water intake and outtake tunnels were not considered as part of the SSC. These are
very critical parts of the plant to maintain cooling. Why were they not considered in the PSA
based SMA?
Point Lepreau Operating Licence and permission to refuel
[CMD Number] 29 November 14 2011
PSA Level 1 and Level 2
IAEA-TECDOC-1511 Determining the quality of probabilistic safety assessment (PSA) for applications in
nuclear power plants
4.1. Main objectives
The initiating events analysis is a highly iterative, multi-purpose task, which provides
the basis for the PSA and ensures its completeness. The risk profile can be incomplete and
distorted if important initiating events (IEs) are omitted or incorrectly included in the IE
Above is excerpt from an IAEA document that is referenced in the licence conditions for
the PSA’s as a guidance document. It shows the importance of looking at all the proper initiating
events. Please note as well that because a PSA based SMA was done instead of a PSA for
earthquakes that the core damage frequency and large early release numbers do not take into
account the true level of safety for the plant.
We would like to note that Hurricanes should have not been screened out of the PSA’s.
Below is a section from PLGS Response to Fukushima Lessons Learned.
Point Lepreau Operating Licence and permission to refuel
[CMD Number] 30 November 14 2011
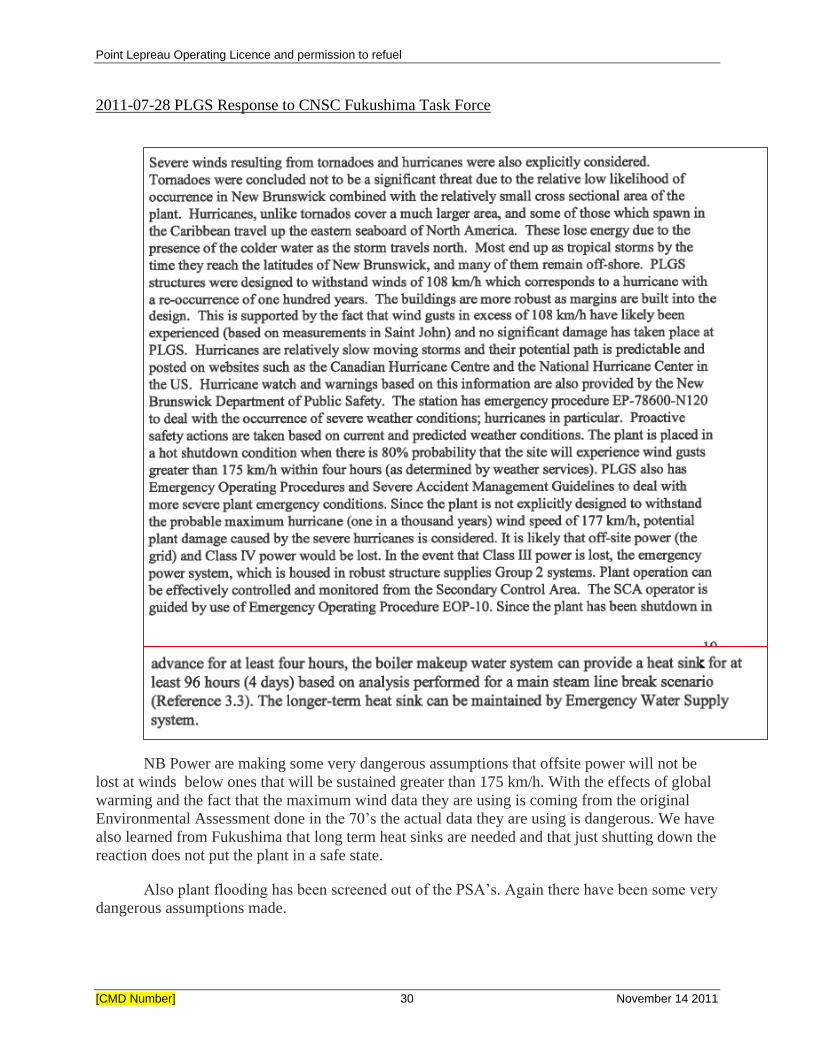
2011-07-28 PLGS Response to CNSC Fukushima Task Force
NB Power are making some very dangerous assumptions that offsite power will not be
lost at winds below ones that will be sustained greater than 175 km/h. With the effects of global
warming and the fact that the maximum wind data they are using is coming from the original
Environmental Assessment done in the 70’s the actual data they are using is dangerous. We have
also learned from Fukushima that long term heat sinks are needed and that just shutting down the
reaction does not put the plant in a safe state.
Also plant flooding has been screened out of the PSA’s. Again there have been some very
dangerous assumptions made.

Point Lepreau Operating Licence and permission to refuel
[CMD Number] 31 November 14 2011
2011-07-28 PLGS Response to CNSC Fukushima Task Force
We would like to point out that the data for rainfall more than likely came from the
Environmental Assessment done in the 70’s. With global warming the increase in magnitude and
probability of storms has increased using this old information could pose unacceptable risk to the
public.
They also mention that it is assumed that the capacity of the drainage system will be
exceeded. What they don’t take into account is that the capacity of the drainage system will be
lowered due to plugging or ice build-up etc. In the event that the drainage system is reduced the
external flooding scenario can become worse. It is important to note that emergency generators
could become flooded during this type of scenario.
It also mentions the maintenance of building sump pumps. Our Members asked during
the site visit if these pumps were on emergency power supplies and were told that they were not.
From the site visit our members went on it was noticed that the plant is surrounded by
higher elevations which would put the plant at risk to external flooding especially with reduced
drainage and the sump pumps not being on an emergency power supply. Please see below a

Point Lepreau Operating Licence and permission to refuel
[CMD Number] 32 November 14 2011
picture of Point Lepreau to get feel for this.
We would also like to point out that the PSA’s were developed for the plant under full
power. It was brought up in the Day 1 hearings that the electrical output of the plant will be
increased by 100MW. 25% of this is due to generator efficiencies, but the other 75% will have to
come from additional reactor power. How can the PSA’s be deemed appropriate when they used
the old reactor power rating before refurbishment? It was also noted that the PSA’s were based
on the pre- refurbishment plant configuration, again without the new PSA’s being done how can
we know if it is within the limits set for safe operations?
All of the above statements would also hold true for the Safe Operating Envelope as
Point Lepreau does not have any operating experience operating at this new level of reactor
output and current plant configuration.

Point Lepreau Operating Licence and permission to refuel
[CMD Number] 33 November 14 2011
RD-360 Life extensions of Nuclear Power Plants
Please see below a reference from RD-360
RD-360
The ISR should include:
1. Conformity reviews that confirm that the NPP meets and will continue to
meet the current plant-specific licensing and design basis;
2. A review against modern standards and practices to assess the level of
safety compared to that of modern NPPs (any shortcomings against these
modern standards and practices are identified and their safety
significance determined);
3. Any modifications that are necessary to improve the level of safety; and
4. A global assessment of plant safety for long-term operation in view of each
of the ISR safety factors.
We would like to note that in the CMD’ by either NB Power or the CNSC staff that there
is no comparison of Point Lepreau to modern NPP’s. During a meeting with NB Power we asked
if Point Lepreau would meet new build standards and were told point blank no that it would be
practically impossible. How can the commission possibly make a decision based on the CMD
documents without knowing the gaps between the refurbished reactor and a new or modern
reactor? Also in the spirit of the Nuclear Safety and Control Act, why was this scientifically
objective information not disseminated to the public?
Pickering ISR Rejection
In 2008 the Pickering ISR report was rejected by CNSC. We would like to see NB Power
or the CNSC staff to comment on each individual section of E-DOCS #3232348 / 2.01 and
explain why each does not apply to Point Lepreau, what measures have been taken to address
each of these issues. We are not looking for the usual answers that it is safe. Please provide
details and backup information.

Point Lepreau Operating Licence and permission to refuel
[CMD Number] 34 November 14 2011
Category 3 Candu Safety Issues
In 2007 a report came out on the Category 3 Candu Safety Issues. In reading the Annual
CNSC Staff Report on the Safety Performance of the Canadian Nuclear Power Industry since
2003 we can see that many of the safety issues are still not resolved. Some of these issues have
been known since 1995. 16 years later and dates for resolve of these issues being not met shows
that the resolve of these issues is not easy. This does not give us any confidence that these issues
will be resolved in a satisfactory way any time soon. 16 years is around half of the life of a
CANDU NPP, this is not a reasonable time frame for resolving serious safety issues. We would
like to note for the rest of the public that the positive void coefficient is the same design issue
that caused the Chernobyl accident as well as one of the first meltdowns that occurred in 1952 At
the NRX reactor in Chalk River Ontario.
We would like to also note that in the reports as well as the CMD documents for this
licencing hearing state that many of the original issues are closed. There is no mention of what
was done to close these issues. Can NB Power or the CNSC staff please address each issue
individually and explain each issue to us and the public and what has been done to resolve each
of the closed issues? Please provide details and backup information on each.
Location of Steam Pipes
It has been noted many times that there could be issues if there is a main steam pipe
rupture; that it could render the control room inoperable. In talking with NB Power about this we
were told that they have done pipe support upgrades, have leak before break technology on the
pipe, and now man the secondary control room at all times. During our site visit we noticed that
the main steam line leaving the reactor building is also over the secondary control room. It is
however up quite high, but this is a large pipe and if it were broken and fell down could also
render the secondary control room inoperable. We also asked what kind of automatic shutoff
there was to shut the steam off in the event of a leak. We were told there wasn’t any and that it
was all manual intervention. Would the operators have enough time to react to the leak before
the line did break? Steam is a very powerful source of energy and can do a lot of damage very
quickly. This problem has also been a Generic Action Item for CANDU plants, specifically high
energy line breaks. The fact that NB Power has not rerouted the steam line shows their lack of
regard for the safe operation of the plant.
Emergency Vault Make up water
We would like to discuss the new emergency vault makeup water line that was added for
the refurbishment. Is there not an emergency return water line as well so that water can be
circulated? If not where does all of the water go that is added? In light of the Fukushima accident
when all normal heat sinks are lost and emergency water from the sea had to be added to the
containment. There has been a lot of radiation release in the form of contaminated water from

Point Lepreau Operating Licence and permission to refuel
[CMD Number] 35 November 14 2011
Fukushima due to these emergency cooling scenarios. This does not appear in any of the CMD
documents and we would like to suggest that this is a gap that has not been addressed.
3.5 Physical Design
We have no comment on this issue as we did not have enough time to do any
research on the matter.
3.6 Fitness for Service
Stress Corrosion Cracking(SCC)
We would like to address the problem of SCC in regards to Point Lepreau. With the
references we sent with our intervention a document with regards to stress corrosion cracking at
Point Lepreau.
Risk-Reduction Strategies used to Manage Cracking of Carbon Steel
Primary Coolant Piping at the Point Lepreau Generating Station John P. Slade1, Tracy S. Gendron2
1New Brunswick Power Nuclear, Point Lepreau Generating Station, P.O. Box 600, Lepreau, New Brunswick, E5J 2S6
2Atomic Energy of Canada Ltd. Chalk River Laboratories, Chalk River, Ontario, K0J 1J0
We would like for the commissioner to please read this document.
After reading this it is apparent that there are many unknowns and risks associated with
SCC at Point Lepreau. It is noted that yes some of the primary heat transport system has been
replaced in the refurbishment but there is substantial amount of it that has not been replaced i.e.
steam generators.
We would also like to point out something that was mentioned in Day 1 hearings that a
new type of harder material has been used for some of the piping. This material has not been
tested and it seems should help with Flow Accelerated Corrosion but this will not necessarily
help with SCC.
Another point we would like to make is that chemistry plays an important part in SCC.
The heavy water for the primary heat transport system is going to be reused, so they are putting
the same chemistry back into the system with new the new and old piping. What if there is
something specific to the heavy water at Point Lepreau that is causing SCC that is not currently
monitored, measured and controlled through their chemistry control program?
As well we would like to point out that it says the amount of cold/hot work on the piping
can be a mechanism for SCC. With the fact that all the tubes have been put in then taken out
Point Lepreau Operating Licence and permission to refuel
[CMD Number] 36 November 14 2011
repaired and then put back in would suggest that the amount of cold/hot work on the piping
system has increased.
We don’t feel that NB Power has fully addressed this very serious problem.
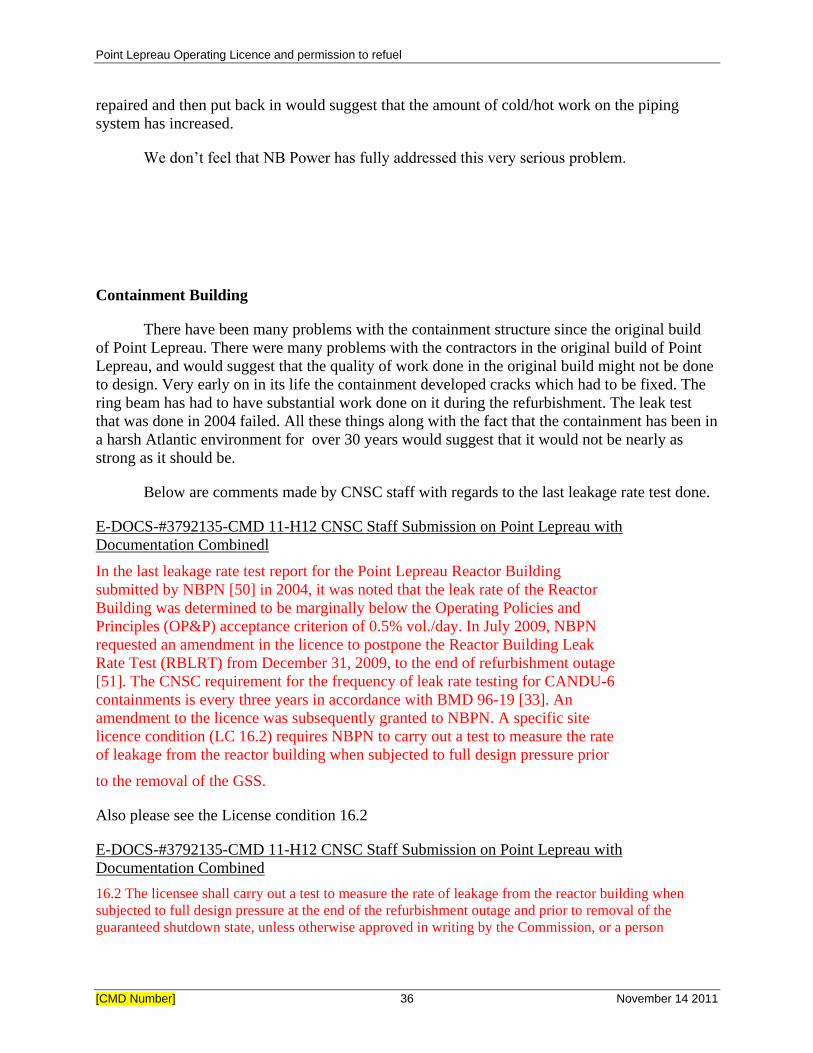
Containment Building
There have been many problems with the containment structure since the original build
of Point Lepreau. There were many problems with the contractors in the original build of Point
Lepreau, and would suggest that the quality of work done in the original build might not be done
to design. Very early on in its life the containment developed cracks which had to be fixed. The
ring beam has had to have substantial work done on it during the refurbishment. The leak test
that was done in 2004 failed. All these things along with the fact that the containment has been in
a harsh Atlantic environment for over 30 years would suggest that it would not be nearly as
strong as it should be.
Below are comments made by CNSC staff with regards to the last leakage rate test done.
E-DOCS-#3792135-CMD 11-H12 CNSC Staff Submission on Point Lepreau with
Documentation Combinedl
In the last leakage rate test report for the Point Lepreau Reactor Building
submitted by NBPN [50] in 2004, it was noted that the leak rate of the Reactor
Building was determined to be marginally below the Operating Policies and
Principles (OP&P) acceptance criterion of 0.5% vol./day. In July 2009, NBPN
requested an amendment in the licence to postpone the Reactor Building Leak
Rate Test (RBLRT) from December 31, 2009, to the end of refurbishment outage
[51]. The CNSC requirement for the frequency of leak rate testing for CANDU-6
containments is every three years in accordance with BMD 96-19 [33]. An
amendment to the licence was subsequently granted to NBPN. A specific site
licence condition (LC 16.2) requires NBPN to carry out a test to measure the rate
of leakage from the reactor building when subjected to full design pressure prior
to the removal of the GSS.
Also please see the License condition 16.2
E-DOCS-#3792135-CMD 11-H12 CNSC Staff Submission on Point Lepreau with
Documentation Combined
16.2 The licensee shall carry out a test to measure the rate of leakage from the reactor building when
subjected to full design pressure at the end of the refurbishment outage and prior to removal of the
guaranteed shutdown state, unless otherwise approved in writing by the Commission, or a person

Point Lepreau Operating Licence and permission to refuel
[CMD Number] 37 November 14 2011
authorized by the Commission.
Please note that the license condition only states that it has to do a leak rate test, not that
it has to pass a leak rate test prior to the removal of the guaranteed shutdown. This is
unacceptable and putting the public and environment at unreasonable risk.
From a document from the CNSC INFO-0584 please see below.
INFO-0584 Reliability of Containment and Safety Related Structures
This suggests that if the containment does not pass a leak test that there may be structural
problems with the containment which may have problems with enduring earthquakes. This is
relevant to our sub section on the PSA based SMA in section. This is not noted as a potential gap
in the CMD documents.
In another document we obtained from Science Direct an article entitled “Probabilistic
seismic risk analysis of CANDU containment structure for near-fault earthquakes by In-Kil
Choi ∗, Young-Sun Choun, Seong-Moon Ahn, Jeong-Moon Seo.”
It says that the cracking mode for a CANDU containment structure is at .28 g.
This is in contradiction to a level of approximately .42g that is given for the containment
building for the level 2 PSA based SMA talked about in detail in section 3.4. This would
also suggest not only problems with the determination of the RLE’s for the PSA based
SMA but also with the fragility analysis that has been done for the Structures Systems
and Components for it.
Point Lepreau Operating Licence and permission to refuel
[CMD Number] 38 November 14 2011
Intake outtake tunnels for Raw Service Water(RSW)
The functionality of the RSW for Point Lepreau is critical to maintaining cooling for the
reactor. It worries us that this was not taken into account in the PSA based SMA. Also we would
like to point out that during Day 1 the topic of mussels obstructing the RSW came up. It was said
that provisions for up to 1 foot of muscles in the intake and outtake was accounted for. We think
it would be safe to assume that there are mussels on the intake and outtake tunnels. On our site
visit we asked NB Power about the tunnels, and they said that they had divers go in and inspect
the tunnels during the refurbishment. How could divers properly inspect the tunnels if they are
covered in mussels?
CSA Standards
In day 1 there were a lot of discussions about the wrong CSA standard being used to
check for cracks on the pipes. In particular they only talk about the size of the calibration
standard, and that after they found out about the problem they found that other pipes were being
checked using the wrong calibration standard. Our question is what are ALL the differences
between the old CSA standard that was used and the new one that was supposed to be used. CSA
standards are usually long detailed documents with lots of information in them. Usually they
only update them when there are substantial changes. In the root cause analysis done for this
issue were all the differences between the two standards looked at to see how the safety of the
plant might be affected?

Point Lepreau Operating Licence and permission to refuel
[CMD Number] 39 November 14 2011
Old controls and electrical wiring
This section is by one of our members Chris Rouse who is an Industrial Control
Technologist who has worked in the Electrical and Controls engineering for over 15 years. He
should be considered as expert witness in this area and is offering his opinion from the brief tour
he went on.
During the first part of our trip when we went to the spent fuel bay I was looking at this
very old control panel and was amazed that equipment of this vintage was still being used. One
of the NB Power people saw me looking at it and made the comment “Looks hi tech doesn’t it?”
In my honest opinion I thought that it should be in a museum. Throughout the rest of the tour I
was shocked to see such old equipment that would have been considered old and obsolete when I
was attending community college 15 years ago. The control room again I couldn’t believe that
most of the Human Machine Interfaces where still push buttons and pilot lights on large consoles
surrounding the room. In the event of an earthquake it would be quite possible for some of the
pilot lights to burn out and not give proper indication to the operator about important
information.
Another thing I noticed was that some of the cable trays where full. In this situation as
per the Canadian Electrical Code the ampacity of the cables must be de-rated by as much as 50%
to prevent heat up and possible fire. Have all of the cables in the cable trays that are full been de-
rated as per the Canadian Electrical Code.
When we visited the secondary control room and the new emergency vent system I
noticed that some of the electrical enclosures used for the emergency vent system room where
not weather proof boxes and that some of them did not have any kind of environmental
qualification. In this room there were several pipes that if had a leak could and prevent this very
important equipment from operating properly or to give the operators key information they need
to assess the situation.
Point Lepreau Operating Licence and permission to refuel
[CMD Number] 40 November 14 2011
3.7 Radiation Protection
Members who visited the Point Lepreau Nuclear Plant recently noted that
procedures for dealing with possible contamination were inconsistent. After they went to
the spent fuel bay one of the members had to put his hands in a radiation detector, and it
came up that he was contaminated. NB Power then told him to try again and he passed,
and they continued to leave the spent fuel bay area where you have to go through a
different radiation detector. This time one of the NB power people tested positive for
radiation. She was taken back out of the detector and everyone seemed complacent that it
was just static electricity on her pants. They then checked her with a hand held radiation
detector on her pants where she then began rubbing her pants with her hands. Then they
checked again with the hand held device on her pants and it came out negative, but they
did not check her hands where she rubbed her pants. We would like to point out that our
member was told to just try again when he came up contaminated and was not tested with
the hand held device.
In 2008 and 2009 NBPN were unable to provide evidence that contractor
employees were completing the required dosimetry monitoring prior to leaving the site on
their last day of employment. This suggests that doses to workers may have been
underreported. CNSC on page 42 also suggests some workers may have had internal
uptakes that were unmonitored. Perhaps this partly explains why NBPN’s collective dose
performance was better than Canadian NPP utilities average in 2006 and 2007.
During the refurbishment, nuclear workers were exposed to higher radiation doses
than predicted. Some workers were exposed to more than 10 milliSieverts per year. Why
was the refurbishment not delayed until the radiation in the plant had decayed to lower
levels to make it safer for the workers? Why did the workers continue to install calandria
tubes after they had been found to be defective? This increased worker exposure by
1.4pSv unnecessarily. This is not in the spirit of ALARA.
Were workers at Lepreau exposed to alpha radiation prior to the implementation
of appropriate protective equipment for alpha hazards? If so, have their family doctors
been notified so that they can be monitored for future adverse health effects?
3.8 Conventional Health and Safety
We would like to note in NB Power’s Submissions that they only talk about lost
time accidents. This is only one of the Key Performance indicators for determining
conventional Health and Safety.

Point Lepreau Operating Licence and permission to refuel
[CMD Number] 41 November 14 2011
Quote from Telegraph Journal July 18th, 2011
By the end of May 2011, there had been nine "lost time" injuries where an employee was unable to work, 28 "restricted work" injuries where an employee could work but not at the same duties, 36 incidents requiring medical aid - not necessarily due to a workplace injury - and 1,125 incidents requiring onsite first aid. There were also 2,963 "near misses" such as when an employee falls but isn't injured and 327 incidents of property damage.
As you can see from the above that although the lost time injuries where relatively low there are a lot of other concerns. Looking at the above there was first aid required just about every day of the refurbishment, and almost 3 near misses per day.
WANO uses a metric of Industrial Safety Accident Rate as a performance indicator.
Question: For the years 2008, 2009, 2010 what is NB Powers Industrial Safety Accident Rate as per WANO’s performance indicator? Please compare them against the industry averages for those years.
3.9 Environmental Protection
Tritium releases to air appeared to be increasing prior to shutdown, reaching 200
Terabecquerels in2007 and Carbon-14 0.37 Terabecquerels. There was a large increase in
Carbon14 releases to water in 2007and 2008 compared to 2006. Why was this? There
was also a striking increase in tritium releases to water in 2008, of 2309 Terabecquerels,
when the reactor was shutdown, as compared to 2007 at 292 Terabecquerels. What could
have caused a higher emission rate in a shutdown than an operating reactor? Also why
were tritium levels in surface water at the waste facility so high from 1997-2006, almost
1600Bq/L.? If it was due to air emissions being washed out in the rainwater, as it the
report seems to suggest, perhaps people in the surrounding communities should be
warned about going out in the rain, breathing the air, drinking surface water?
3.10 Emergency Management and Fire Protection
CNSC found Emergency Management and Fire Protection to be BE or below
expectations in 2010, but have allowed the NBPNGS to defer compliance until after start
up. In view of the fact that the Point Lepreau Nuclear Generating Station has frequently

Point Lepreau Operating Licence and permission to refuel
[CMD Number] 42 November 14 2011
delayed compliance, we urge the CNSC not to issue the licence or allow fuel reload or
restart until the emergency management and fire protection have been brought up to
standard. This is vital for public health and safety.
The public has found the Lepreau Emergency Plan below expectations for 30
years. Many people do not feel they know what to do in an emergency, how they are to
be notified, where they are to go in an emergency, where to evacuate to. What are they to
do if telephones are knocked out along with the accident? They have seen the new E
signs on the highway, but these may send them into the path of fallout, like the
unfortunate people in the town in Japan who evacuated to a shelter in the path of the
fallout.
Past criticisms of the emergency plan were:
Emergency Planning and Nuclear Realities, MEC, 1981
1. Inadequate public notification (defective cold war emergency sirens, which
were later dismantled but what have they been replaced by?)
2. Inadequate size of evacuation zone, not even including Saint John, the largest
population centre. The U.S. military recommended 50 mile evacuation zone
for Fukushima, which would include Saint John.
3. Potassium iodide pre-distribution to too small an area, with inadequate
provisn for public health to distribute stockpiled tablets to the rest of the
population.
4. Inadequate coordination among agencies required for nuclear emergency
response.( Although fire, police, and hospital emergency personnel are used to
working together in emergencies, a nuclear emergency requires the prompt
communication by nuclear plant staff with government, and rapid deployment
of public health staff, with radiation-monitoring equipment and potassium
iodide tablets, as well as the usual fire, police, and emergency medical
personnel.)
A major lesson the public learned from the Fukushima accident in Japan is
that the nuclear culture of secrecy, lack of sharing of information, poor
coordination among government, industry and the scientific community and
lack of communication of the facts to the public, and delaying urgent action
can turn an emergency into a disaster and a disaster into a catastrophe with
far-reaching environmental and health consequences. Measures that could
have prevented the explosions were not ordered or carried out in time;
evacuations, sheltering and administration of potassium iodide were not
implemented in an optimal manner; knowledge of the radiation plume was not
given to those who needed to know, so that people evacuated into irradiated
areas without shelter.
Point Lepreau Operating Licence and permission to refuel
[CMD Number] 43 November 14 2011
In contrast to the Fukushima accident, where mitigating actions were
delayed, the Soviet Union evacuated people, and provided many with
prophylaxis against radioactive iodine, mobilized hundreds of thousands of
people to creatively and courageously fight the Chernobyl nuclear explosion
and fire, and try to clean up the area after the Chernobyl nuclear accident.
Although nearly a million people have died over the 25 years since the
accident, and the economy of the Soviet Union collapsed, it could have been
much worse. (New York Academy of
Sciences, Compilation of Chernobyl Studies, 2009)
………………………………………………………
3.11 Waste Management
It has been noted that there has been a lot more waste from refurbishment than
originally anticipated. They are now shipping some of the low level waste to the US for
incineration and the ashes brought back to Point Lepreau to take up less volume.
Apparently there are filters on the incinerator to catch any radioactive materials from
going into the air. While on our site visit we asked if the filters that have radioactive
materials from the incinerator are being brought back. We were told no. NB Power
should be responsible for that waste and should not be left for the US to take care of.
Please see questions and comments to in our Business Plan Section 2.0
3.12 Security
During a visit by a couple of our members we would like to explain a situation
that happened. Our members were told that as visitor we had to be accompanied by an
authorized person at all times. The person responsible for us had to wear a red badge. At
the beginning of our tour one of the people from NB Power had the red badge and was
responsible for the members. We went outside to look at the new emergency generators.
When walking back that person broke away from our group to go inside. When one of
our members noticed this he said are we not supposed to be with her. Then another NB
Power person showed us that he now had the red badge and that the other person had
given it to him back at the generators. We think it would be important for the visitors to
know when the person that is responsible for them has changed for their own safety in
case of something happening at the plant.

Point Lepreau Operating Licence and permission to refuel
[CMD Number] 44 November 14 2011
3.13 Safeguards
In NB Powers response to the Fukushima lessons learned it talks about airplane
crashes. Please see below excerpt.
2011-07-28 PLGS Response to CNSC Fukushima Task Force
Please note that the act of terrorism was not looked at in this report, but could
imagine that if the plant was designed to handle bigger planes than those smaller ones
from the SJ Airport, they would have mentioned it. Point Lepreau’s containment is
approximately 1 m think. The French nuclear company Areva has publically stated that
containment should be at least 2 m think to be able to withstand large airplane crashes.
We would also like to point out that there is no mention of the spent fuel bay in
this section of the plant. As we have learned from Fukushima that one of the most
dangerous parts of a nuclear plant is the spent fuel bay. This area is not within the
containment structure, and seen as its not mentioned in hear we would have to assume
that this is a gap that hasn’t been identified.
Point Lepreau Operating Licence and permission to refuel
[CMD Number] 45 November 14 2011
3.14 Packaging and Transport
We have no comment on this issue as we did not have enough time to do any research on
the matter.
4.0 OTHER MATTERS OF REGULATORY INTEREST
4.1 Environmental Assessment
An environmental assessment was not done because it was classed as a
maintenance outage. This was a mistake. Because they used old data from the original
EIA, which was 30 years out of date, problems like climate change were not considered.
The environment and environmental problems have changed a great deal in the last 30
years.
A recent lawsuit brought forward by Greenpeace on an inadequate nuclear reactor
environmental assessment shows how important doing a proper EIA is.
4.2 Aboriginal Consultation
We are aware that Point Lepreau, on the Bay of Fundy which is now the location
of the Point Lepreau nuclear generating station is located in traditional Passamaquoddy
first nation’s territory. Indeed the cove on the immediate west side of the Point Lepreau
generating station is named Indian cove on both federal navigational charts and both
federal and provincial land maps. A seasonal and sometimes permanent settlement was
located within a few hundred meters of the reactor site, and just above the beach in the
area where the pump house now exists. From this location the Passamaquoddy fished and
hunted marine mammals processing there catches on the beach.
The area was physically altered and the construction of Point Lepreau was
commenced without consultation or negotiation with the Passamaquoddy. We recognize
the sovereignty of the Passamaquoddy nation and are in full support of their position
regarding this licencing. We are also in full support of the will and desire of the
Passamaquoddy first nations regarding any future operation of the reactor at Point
Lepreau and the storage of radioactive waste and spent fuel.
Point Lepreau Operating Licence and permission to refuel
[CMD Number] 46 November 14 2011
4.3 Other Consultation
It would seem that NB Power and the CNSC staff have missed some very
important things. We would suggest that a full peer reviewed technical assessment of this
licence and NB Powers submissions and the CNSC staff’s recommendations before any
licence to operate is given.
4.4 Cost Recovery
We have no comment on this issue as we did not have enough time to do any
research on the matter.
4.5 Financial Guarantees
We have no comment on this issue as we did not have enough time to do any
research on the matter. But we would like to note that the money pit for this white
elephant of a nuclear power plant seems to be bottomless.
4.6 Other Regulatory Approvals
We have no comment on this issue as we did not have enough time to do any research on
the matter.
4.7 Licensee’s Public Information Program
We would like to thank Paul Thompson and Kathleen Duguay and everyone else at NB
Power for the time they spent with us answering our questions and the information that they gave
us, it has proved to be very useful in our intervention.
But I would like to point out one thing that a lot of the documents that were related to the
licence that we asked for they could only make available in paper copies and not allowed to take
them, only to view them at their office. We realize there is the right to information act, but
sometimes this is also a long process. Given the time constraints of the licencing period it makes
it hard for regular members of the public to fully review all the things that need be.
We would like to point out that we feel that although we have a pretty thorough
intervention, we would have liked to have more time and better access to information. For the
record we have not reviewed this licence to our satisfaction, due to lack of reasonable time and
access to information.
Another point that should be made is that Chris Rouse the main author of this document
technical researcher has spent hundreds of hour working on this since the Fukushima accident,
and has taken plenty of time off work without pay to attend meetings, go on site tour and write
this intervention. Not even half of the participant funding was used, and less than half of the
money we applied for was given to us. In our application we had $10,000 in our intervention for

Point Lepreau Operating Licence and permission to refuel
[CMD Number] 47 November 14 2011
him, but he was not approved. We feel this is an unfair financial burned to be put on a concerned
citizen of the public who can bring new information to the commission.
Another point we would like to make is that as a group there were a lot of questions
asked of the CNSC 101 meeting in Saint John. The CNSC were rather rude to us at the meeting.
It was made clear that we wanted these questions answered for our interventions. To date only a
few of these questions have been answered and thus a gap in our intervention.
We would also like to share an experience we had at the CNSC 101 meeting with one of
the CNSC inspectors at Point Lepreau. One of our members called the other just as the meeting
was supposed to be over. She was talking to a CNSC inspector when the other person called and
just put the phone on speaker. The first thing the person calling heard was “I don’t care about
your safety issues” and continued to be very rude in response to her concerns.
4.8 Nuclear Liability Insurance
Private insurance companies have always refused to provide insurance for nuclear
accidents, because the consequences are so severe and costs astronomical. (See your
house insurance policy for the exclusion.) To allow the nuclear industry to continue the
federal government limits their liability for an accident by law to a small amount, which
has recently been made smaller. The taxpayer is required to pay the rest. The Chernobyl
nuclear accident resulted in the collapse of the Soviet Union, and the former Prime
Minister of Japan stated that he considered evacuating Tokyo after the Fukushima nuclear
accident, but did not, because he feared it would cause the collapse of Japan.

Report submitted for the CNSC's re-licensing hearings for the Point Lepreau Nuclear Generating Station
NOTE FROM THE SECRETARIAT OF THE COMMISSION
NOTE DU SECRÉTARIAT DE LA COMMISSION
This document is listing several reference documents; not all of them are included in the current submission. Copies of the references can be obtained by contacting the Secretariat of the Commission: Louise Levert at 1-800-668-5284 or 613-996-9063 [email protected].
Ce document fournit une liste de plusieurs documents de référence. Ils ne sont pas tous inclus dans le présent mémoire. Pour obtenir une copie des références, veuillez communiquer avec le Secrétariat de la Commission : Louise Levert au 1-800-668-5284 ou 613-996-9063 [email protected]

The Potential Impacts of Climate Change and Seismicity in Relation to the Point Lepreau Nuclear Generating Station
Table of Contents
‐Introduction‐
Exec Summary
Section 1‐Ken Burke‐New Seismic data and uncertainty
A) Description of deliverable
B) Itemization of docs
c) summary of reports and docs
d) New information
e) Red Flag
f) references
Section 2‐More questions and unknowns‐ Alan Ruffman’s
A) Description of deliverable
B) Itemization of docs
c) summary of reports and docs
d) New information
e) Red Flag
f) references
Section 3‐ Climate Change Considerations Raphael Shay
A) Description of deliverable
B) Itemization of docs
c) summary of reports and docs
d) New and better understood information
e) Red Flags
f) References
g) Recommendations
Section 4‐ New Seismic considerations in Conjunction with other Nuclear Power Plant Hazards‐Professor Michel Duguay
A) Description of deliverable
B) Itemization of docs
c) summary of reports and docs
d) New and better understood information
e) Red Flags
Introduction‐
This report is compiled by the chair of the Saint John Fundy CCNB Action Chapter, Sharon Murphy‐Flatt, in consultation and input from the CCNB Action SJ Fundy Chapter members. The content is divided into 4 main sections, each drawing from the expertise of an expert in their field.
Exec Summary‐
There exists, in the fields of seismic studies, nuclear power and climate change a common link. They share many known uncertainties, better understood knowledge that has been acquired over time in a learning curve, and new data/knowledge that was not available at the time the Pt Lepreau generating plant was designed and built. During the refurbishment however, the uncertainties, new knowledge and better understood information was known but not properly interpreted, legislated, funded or implemented.
We consulted 2 of the professionals that NB Power has engaged over the years to research and justify their seismicity confidence and design. We also contacted a professor of nuclear physics from Montreal and asked him how seismicity might affect different systems in a nuclear plant and what are the dangers? We also contacted an unfunded, unsanctioned climate change expert that was brought in to replace our funded and sanctioned expert who had to decline as our expert due to personal reasons. The funders were unable to give us permission to replace our expert 2 weeks before the reports were due(apparently too close to the hearings) and so declined the resume of our climate change expert (attached). Our climate change expert was asked to provide a short “best practices” document regarding climate change adaptation and precautionary best practices.
In the case of seismicity, the uncertainties exist somewhat due to lack of funded studies, lack of responsible oversight, lack of the general concepts of who does what in the field and in one case, our expert wondered about conspiratorial behaviour.
Climate change itself is a certainty although when and how severe the coming storms will be is uncertain. New knowledge currently exists regarding best practices and precaution in this regard.
In the nuclear power industry, the new and current knowledge that exists regarding safety and concurrent accidents is rife with uncertainties, unknowns and recently, with the accident in Fukushima, lessons learned but not acted upon.
The CCNB SJ Fundy chapter is of the opinion that the uncertainties, concerns and risks that exist surrounding the refueling of the Pt Lepreau Nuclear generating plant far outweigh the adaptation and precaution that has been taken to mitigate such issues from happening.
This paper will endeavour to show that NB Power’s own experts as well as unrelated experts in their fields all share concerns about best practice, new knowledge that are not acted upon and a general lack of oversite or responsibility taken regarding Pt Lepreau and their field.
We are of the opinion that when the experts that do the research that is used to protect the health and safety of the citizens and the environment are concerned and raise red flags, society should listen. One of the NB Power experts even made the case that the accident in Fukushima was forwarned and the experts did nothing to mitigate the disaster. He believes something similar is happening here. It is time to act responsibly and decommission Lepreau before it’s too late.
Section 1‐Ken Burke‐New Seismic data and uncertainty
A) Description of deliverable‐
Professor Ken Burke was asked for his expertise and expert opinion in 2 areas: 1) Update seismic occurrences in the Lepreau area since 2002 including a comment on the unfinished work in this area resulting in unknown seismic data. A short description of the geography, the plates and 2 faults and their movement over the years including knowledge gaps in this area. 2) A description of the field of seismology including a description of the type of work done as a consultant and how your work fits into the larger assessments that you would expect decision makers to do when a project is undertaken.
B) Itemization of attached docs submitted by Professor Ken Burke
‐KB 2‐Permission to use email conversations
‐KB 3 ‐email exchange regarding expertise
‐KB 5‐ email exchange regarding neotectonic uncertainty
‐KB 4‐statement on Seismic hazard deliverable
‐KB 6 ‐ map of epicentres of earthquakes within 200 kms of point lepreau 2002‐2011_10_8
‐KB 7‐description of work normally complementing seismicity assessment
‐KB 9‐NB earthquakes for period 2002 0101 to 2011 1009 from Canada Online Bulletin
‐KB 11‐ update on the seismicity of Point Lepreau area; 2002‐2011
‐KB 8‐National Building code Seismic Hazard Calculation
C)Summary of reports and docs
Professor Burke updated the seismic events directory to the present in KB 11 and commented on the deliverable (KB4). He included a separate chart (KB 9) and map (KB 6) with his report although the data is also included within. He also used the online seismic hazard calculator and included the results (KB 8). Professor Burke also gave me permission (KB 2) to use several email conversations that I had with him regarding his field of expertise (KB 3, 7) and various uncertainties that currently exist (KB 5). Our concerns are that many uncertainties exist as well as a misunderstanding as to the job description of Professor Burke. He notes that he works to supply data that should be used by an engineer to discern seismic qualifications and design of the plant, not as stand alone decision making data.
D)New information
The data base for earthquakes within 200 km of Pt Lepreau for 2002‐Oct 8, 2011 has been updated. In his report, he points to: 2008 research that identifies a previously unmapped thrust fault with a NNW‐SSE strike and a dip of about 45 degrees W as being the causative feature; previously unlisted seismic events (colour coded); location changes of seismic events; acknowledgement of a 2006 survey which describes the results of a high sensitivity marine magnetic survey where a magnetic anomaly crosses the fault in the Passamaquoddy Bay; a link to the Ocean Mapping Group at UNB which is investigating the Passamaquoddy Bay pockmarks; a reference to a 2006 marine magnetic survey which suggests a 220m post‐upper Jurassic offset of the Oak Bay fault and similar offsets of NW trending faults in Passamaquoddy Bay.
E)Red Flags
The concerns, uncertainties and issues that come to light in the correspondence and report from Professor Burke are as follows:
‐in the report, professor Burke points to a caution that not all potentially active earthquake source locations in New England may have been found yet by present day seismic monitoring
‐in the report, professor Burke points out that for larger events, it is difficult to make a reliable estimate of the full extent of the felt area, with so few reports from poorly inhabited areas to the north, and the lack of observers in the seaward direction to the south.
‐in the report, Professor Burke notes that MM intensity values of IV to V were obtained for some of the earthquakes in southern localities, such as Saint John, St. Andrews, St George and St. Stephen. Similar intensities may have been experienced at Point Lepreau, but I found no reports for this area in the historical sources.

‐In the report, Professor Burke explains that Neotectonic investigations have continued in Passamaquoddy Bay, but much of the work is still in progress or incomplete.
‐In the report, Professor Burke notes that analysis of the data is still in progress but the initial results do suggest that seismicity in the Passamaquoddy Bay region may be explained by movements along NW trending faults.
‐In the report, Professor Burke notes that the origin of the Passamaquoddy Bay pockmarks continues to be a subject of investigation by the Ocean Mapping Group at University of New Brunswick
‐in the email exchange(KB5), Professor Burke noted that there has been little work done, at least to my knowledge of the public domain, on neotectonics in southern New Brunswick
‐ in the email exchange(KB5), Professor Burke says that “From my experience, research is never finished and there are always new scientific ideas to test and validate. I think NB Power have to demonstrate they are at least up to date in what is known.”
‐ in the email exchange(KB5), Professor Burke noted that NB Power have usually used outside contractors to do a seismic probability analysis. The only exception, of which I am aware, was when it was done in‐house by Maritime Nuclear for the proposed Lepreau 2 reactor. It should state in the Canadian Nuclear regulations what is required when a nuclear power plant is refurbished. I do not have a copy of the latest regulations. It would be my guess that an up to date seismic hazard assessment would be required.
‐ in the email exchange(KB5), Professor Burke says that It is surely the responsibility of NB Power to prepare a full environment assessment report and I assume this has already been done by a consulting company, similar to Jacques Whitford.
‐ in the email exchange (KB3), Professor Burke notes that “ I am a seismologist, and not an earthquake engineer. I do the front end of the seismic hazard studies; in other words study the previous earthquake history in regions of interest and try to determine their cause.” (Editors note: this is an important distinction. An earthquake engineer would need to use Burke’s data, rather than simply taking it as a stand alone piece of science that they base their earthquake ready confidence in. )
‐ In KB4, Burke explains that “This value (although conservative) would indicate that NB Power should have retained the services of consulting engineers to make a site specific hazard assessment. I do not have the resources to do this kind of assessment, so can only promise to review the report when it is released.”
f) references
‐I have attached all documents referred to above. Burke provides references to the docs he sites at the end of his report.
Section 2‐More questions and unknowns‐ Alan Ruffman

A) Description of deliverable
Professor Alan Ruffman was asked to produce a report and supply docs that included:
‐the Systematic Historical Seismicity Research paper and maps
‐the info contained in email conversations we had over the past month
‐his professional opinion as to the process that the CNSC is working under
‐a comment on any knowledge and research gaps that exist in the Bay of Fundy area
Unfortunately, Professor Ruffman was unable to produce a report but he did give us his expert opinion and permission to use some of his documents and email exchanges for our intervention.
B) Itemization of attached docs submitted by Professor Alan Ruffman
‐AR 1‐email exchange between Ken Burke and Alan Ruffman regarding our intervention
‐AR 5‐email exchange regarding his professional concerns
‐AR 3‐comment on process from his expert pt of view
‐AR2‐permission to use email exchanges and process concerns
‐AR 12‐ letter to Chris Rouse (chapter member and technical expert)
‐AR 13‐Systematic Historical Seismicity Research: An Essential Adjunct in the Pre‐Instrumental Period‐abstract, Alan Ruffman, 2009
‐AR 6‐Description of content in AR 13
‐AR 4‐ Alan Ruffman’s resume
‐AR 15‐ Jogan Tsunami doc
c) Summary of reports and docs
Professor Ruffman explained his concerns regarding seismicity and plant design in AR 1. He shares his professional concerns about safety and documents that may not exist in AR 5. He gives us permission to use his emails and other docs in AR 6 and AR 2. His process concerns are also noted in AR 2. AR 3 contains a comment from his professional pt of view on the hearing process. In AR 12, He describes a lesson that was not learned regarding Japan which highlights that we must change and adapt when new information is available to us. AR 15 is the doc he refers to in AR 12. AR 13 is an abstract of a report he did in 2009 where he states concern and uncertainty regarding Pt Lepreau which we see as significant since he is the expert NB power has been using for years to justify their seismic readiness. His resume is AR 4.
d) New information
Professor Ruffman refers to new documents in AR 5 now available by Ken Burke that he believes contain seismicity work that would lead to a larger possible ‘design’ earthquake. He refers to new building code standards in the Passamaquoddy Bay in AR 12.
e) Red Flags
The concerns, uncertainties and issues that come to light in the correspondence and docs from Professor Ruffman are as follows:
‐In AR 5, Professor Ruffman explains that he is concerned that he was unable to access documents cited in the Lepreau Env Assessment Report to ascertain exactly the data used to set the maximum magnitude earthquake for which the original Lepreau plant was designed.
‐In AR 5 Professor Ruffman expresses his concerns regarding seismicity. “Ken's subsequent historical seismicity work would have lead to a larger possible 'design' earthquake and the real question is did this more stringent requirement get applied and built into the current Lepreau refurbishment. I suspect that it was not”
‐In AR 2 Professor Ruffman expresses his concerns about the CNSC re‐licensing process. He says that “. I cannot bring myself to call this CNSC early December 2011 process a set of "Hearings" since they do seem to be a farce as far as "hearing' from very many persons and certainly there seems no opportunity to allow intervenors to challenge or to review the material and opinions submitted by the Lepreau authorities in support of their bid to get re‐licenced.”
‐In AR 13, Professor Ruffman expresses that there is uncertainty when you are limited to the last 100 years of data like when Pt Lepreau was designed using 1962 data.
‐In AR 13 Professor Ruffman expresses his concerns regarding the seismic standards that Lepreau was built to. He says “ One could reasonably argue with hindsight by 1985 that the Canadian plant, as built virtually on the US border 5‐6 years earlier, was under‐designed with respect to seismic risk..”
‐In a letter to Chris Rouse (chapter member and nuclear technical advisor to the chapter) , Professor Ruffman exemplifies the importance of action on new knowledge by including a document that warned of a Tsunami in Japan in 2001.
‐In AR 1, Professor Ruffman reiterates his concerns that the plant was possibly not re‐designed after Burke’s historic work had been done in the mid‐1980s ‐ as opposed to the Smith ca. 1962 catalogue which was all that was available in 1973‐1974. He suggests that there would have been a more stringent engineering requirement put on its design to withstand a somewhat higher seismic hazard.
‐As well, in AR 1, Professor Ruffman repeats that he had difficulties finding the docs used to justify the current design of the plant and eventually gave up with his due diligence.
f) references

‐I have attached all documents referred to above.
Section 4‐ Climate Change Considerations ‐Raphael Shay
A) Description of deliverable
Mr Shay works with the Conservation Council of New Brunswick as a climate change and energy expert. He is working on his Master of Arts in Environment and Management at Royal Roads University. He is an unfunded and unsanctioned expert so I will take the liberty to paste his resume here to convince the reader that his expertise is indeed in the field of climate change and energy.
Resume for Raphael Shay
EDUCATION
Royal Roads University Victoria, BC, Canada Expected Graduation 2012
Master of Arts in Environment and Management
Thesis: Increasing the role of environmental indicators in new energy systems.
Renaissance College, University of New Brunswick (UNB) Fredericton, NB, Canada 2003 – 2006
Bachelor of Philosophy in Interdisciplinary Leadership Studies, Dean’s List
Focus on community problem solving, public policy and organizational theory.
Secondary Major in Environmental Studies
Focus on environmental impact assessment, climate change and forestry.
Awards:
• Student Union Activity Award Bronze, 2006
• UNB Student Abroad Bursary, 2005
• Renaissance College International Internship Bursary, 2005
• Canadian Millennium Excellence in‐course Scholarship, 2004
• UNB Academic Scholarship, 2004
• James Somerville Scholarship, 2004
• William and Lois Paine Founder’s Scholarship, 2003
Internships:
Royal University of Bhutan, Canadian Cooperation Organization

Wangdicholing Secondary School, Bumthang, Kingdom of Bhutan May ‐ Aug 2005
Teacher & Sustainability Planner Camp‐école Trois‐Saumons St‐Aubert, QC, Canada May ‐ Aug 2004
Maître D’Hôtel Tatamagouche Centre Tatamagouche, NS, Canada May 2007
Dialogue for Peaceful Change Facilitation Trainee Collège St‐Louis & South Side High School
Montreal, QC, Canada & Rockville Centre, NY, USA 2003
International Baccalaureate
EXPERIENCE
Conservation Council of New Brunswick Fredericton, NB, Canada Feb 2010 – Jul 2011
Climate & Energy Program Coordinator
IBEKA (People Centered Business and Economic Institute) Jakarta, Indonesia Sep 2009 – Dec 2009
Renewable Energy & Community Development Advisor
iCAST (International Center for Appropriate and Sustainable Technology)
Lakewood, CO, USA Jun 2007 – Jul 2009 Sustainability Project Manager
Nordic Folkecenter for Renewable Energy & Falls Brook Centre
Ydby, Denmark & Knowlesville, NB, Canada Aug 2006 – May 2007
Appropriate Technology and Biofuels Marketing Research Associate Internship
• Scholarship: Canadian Department of Foreign Affairs and International Trade Canada (DFAIT)
Sierra Club of Canada – Atlantic Canada Chapter Halifax, NS, Canada Mar ‐ Jun 2006
Environmental Educator
International Youth Summit & UN Climate Change Conference (UNCCC) Montreal, QC, Canada Nov 2005
Delegate/Observer
• Scholarship: CAMBIO from Environment Canada
UNB Environmental Society Fredericton, NB, Canada 2003 ‐ 2006
Youth Environmental Symposium, Organization Committee (February 2005) Vice‐President (2005‐2006)
University of New Brunswick Student Union Fredericton, NB, Canada 2003 ‐ 2006
Environmental Commissioner (2005‐2006)
Renaissance College voting Representative on Student Union Council (2004‐2005)
We asked Mr Shay to provide a short “best practices” document regarding climate change adaptation and precautionary best practices in the field of climate change when related to society and planning. He submitted a report referencing the studies that currently exist in relation to climate change adaptation and best practices. As well, he offered his expert opinion as to how he felt adaptation to mitigate damage and danger was being handled for Pt Lepreau.
B) Itemization of docs
‐RS 2‐ Raphael Shay’s resume
‐RS 1‐ Climate Change Intervention report
c) summary of reports and docs
Raphael Shay’s resume(RS 2) shows that he is an expert in the field of climate change. His report (RS 1) , outlines new developments in the science of climate change, some of its consequences as well as possible implications for the Point Lepreau Generating Station. He believes these considerations are essential in any decision relating to the future safety of the nuclear plant.
d) New and better understood information
In his report, Mr Shay points to several pieces of new knowledge in the climate change field that could affect Pt Lepreau. He presents the fact that we now have data pointing out that the average temperature is rising. He cites a recent comprehensive study released in May of 2011 which concludes that climate change is occurring more quickly and with more drastic effects than previously expected. Another study he refers to states that warming temperature brings with it increased precipitation, more severe storms and rising sea levels to New Brunswick. Even the New Brunswick Emergency Management Organization has reacted to more than twice as many Severe Weather Events in the first decade of the new millennium than it did in the previous decade going from 6 in the 1990’s to 13 in the 2000s. A recent study by The National Roundtable on the Environment and the Economy is cited and a 2007 study that recognizes that “many structures and communities in coastal zones and flood plains will face significant risks from the changing climate as a result of sea level rise, increases in storm surges, increases in water and air temperature, more extreme rainfall and storm intensity, and resulting land erosion and inundation from the sea.” Significantly, he points out that “that risks of infrastructure failure will increase worldwide as weather patterns shift and extreme weather conditions become more variable and regionally more intense.” Finally he notes that the worst case scenario of 100cm sea‐level rise by 2100 is now likely and worst case scenarios range up to 160cm.

Mr Shay explains the much better understood science relating to sea level rise in the Maritimes. We now believe a slower and permanent rise in sea‐level is to be expected. He cites a nationwide study which found that 80% of the Maritimes coasts are moderately or highly sensitive to sea‐level rise compared to the Canadian average of a third. He pasted a colour coded map of coastal sensitivity to sea‐level rise from the Geological Survey of Canada into the report.
e) Red Flags
The concerns and misinformation that come to light in the report from Mr Shay are as follows:
‐ Mr Shay is concerned that the claim by certain media and policy‐makers that climate science is highly uncertain is not true
‐ Mr Shay is concerned that society’s inability to curb emissions globally also indicates we are currently following the higher emission scenarios that bring with them more significant impacts.
‐ Mr Shay is concerned that New Brunswick’s infrastructure will be put to the test and states that we must be prepared to deal with an increasing amount of severe storms, including hurricanes.
‐Mr Shay cited a National Roundtable on the Environment and the Economy which recently reported that the estimated that costs of climate change “could escalate from roughly $5 billion per year in 2020… to between $21 billion and $43 billion per year by the 2050s.” The study also concluded that these costs will have a highly uneven distribution on a per capita basis. New Brunswick was amongst the worst faring provinces, which will hinder its ability to adapt and mitigate climate impacts.
‐ Mr Shay noted that the National Roundtable did not consider the risks of a climate induced incident at Pt Lepreau
‐Mr Shay is concerned that the consequences of a failure at P Lepreau may be too great compared to the lessons that we would learn about climate change adaptation after the Saint John and Bay of Fundy are destroyed forever.
‐Mr Shay is concerned that recent cuts in climate design and monitoring in Canada render structure design of any kind particularly vulnerable.
‐Mr Shay pointed to Canada’s Commissioner of the Environment and Sustainable Development who underscore the concern that Canada has yet to take appropriate action to adapt to climate change. The Fall 2010 report, which occurred prior to the cuts at Environment Canada, point out that “overall, the departments we examined have not taken concrete actions to adapt to the impacts of a changing climate. With few exceptions, they have yet to adjust or develop policies and practices to better respond to the risks.”
‐Mr Shay noted that climate change is starting to overwhelm our engineered expectations using the recent example in the Missouri river to highlight this point
g) Recommendations

The CCNB Action SJ Fundy chapter would like to thank Raphael Shay for his solutions orientated report. We are certain after compiling this report that the following recommendations for adaptation should be acted upon immediately, before a scenario that we now should be considering occurs.
‐New Brunswick must be prepared to deal with an increasing amount of severe storms, including hurricanes
‐ Question original engineering and architectural assumptions and plan for a shorter lifespan.
‐ Implement “no regret” adaptation actions on our critical infrastructure as suggested by the International Panel on Climate Change
‐ regularly update design values meant to mitigate climate impacts
‐ regular maintenance is very important
‐ continuous analysis of failures is paramount
‐ introduce in codes and standards a “Climate Change Adaptation Factor” to existing design values that reflect the latest understanding of near future changes.
‐ Learn from the recent catastrophic events at Fukushima, Japan
‐design standards need to recognise that the fact that the forces of nature lie beyond our engineered expectations
Section 4‐New Seismic considerations in Conjunction with other Nuclear Power Plant Hazards‐Michel Duguay
A) Description of deliverable
Professor delivered his report to me on the same day as this report was due through no fault of his own. It should be noted that unrealistic deadlines on this extremely serious matter are unnecessary and only hinder meaningful public participation.
Professor Dugay submitted a report that addresses various nuclear power related concerns that pose very serious threats to the public safety and the environment when seismic concerns are also introduced.
B) Itemization of docs
‐MD 6‐ Professor Duguay’s report
c) summary of reports and docs

The report contains sections that pertains but is not limited to Positive void coefficient, pipe ruptures, lessons that should be learned from Fukushima, seismic concerns.
d) New information
New information that is brought forward comes from but is not limited to the lessons we should have learned from Fukushima and the aging problems of the high‐pressure tubes.
e) Red Flags
The History and significance of earthquake hazards is a concern.
The probabilities over a 50‐year interval of a serious seismic incident is the same probability of getting two sixes upon the single throw of two dice.
Pressure tube aging and large‐break loss‐of‐coolant accidents are a big concern
Large‐break loss‐of‐coolant accidents and the possibility of an earthquake are not analysed together
Dangerous build‐up of uranium oxide fuel damage is possible
Aging of equipment and structures can lead to accumulated fuel damage

Addendum to the Report submitted for the CNSC Hearings into Pt. Lepreau Dec 1, 2
KB 11‐ The Potential Impacts of Climate Change and Seismicity in Relation to the Point Lepreau Nuclear Generating Station
Submitted By Sharon Murphy for the CCNB Action SJ Fundy Chapter
Please add the following excerpt to Section 1, e) Red Flags
‐Professor Burke warns in his conclusions that the continuing activity is the latter region (Passamaquoddy Bay region) that it is the most likely source area for the next significant earthquake in Southern New Brunswick.

SADLER GEOPHYSICAL & ADMINISTRATIVE SERVICES LIMITED
378 Oxford Street, Fredericton, New Brunswick, E3B 2W7
Tel. No. (506) 450-3166 email: [email protected]
UPDATE ON THE SEISMICITY OF POINT LEPREAU AREA; 2002-2011
A report prepared as a background study for the environmental assessment of the renewal
of the operating license for the Point Lepreau Nuclear Generating Station.
by
Kenneth B.S. Burke.
October 24, 2011
KENNETH B.S. BURKE ELIZABETH BURKE
B.Sc.,B.Sc.,(Hons.)Min.Eng., Secretarial & Administrative
Dipl.Applied Geophysics,Ph.D.,P.Eng. Services
Consultant Geophysicist
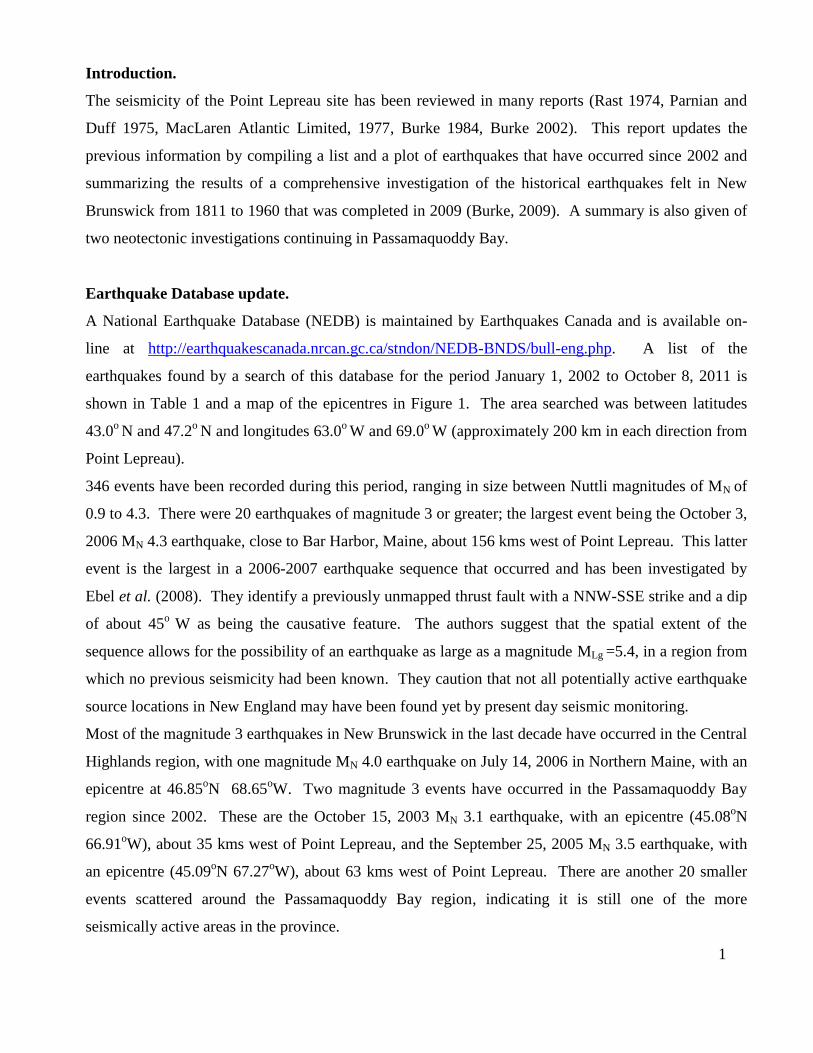
Introduction.
The seismicity of the Point Lepreau site has been reviewed in many reports (Rast 1974, Parnian and
Duff 1975, MacLaren Atlantic Limited, 1977, Burke 1984, Burke 2002). This report updates the
previous information by compiling a list and a plot of earthquakes that have occurred since 2002 and
summarizing the results of a comprehensive investigation of the historical earthquakes felt in New
Brunswick from 1811 to 1960 that was completed in 2009 (Burke, 2009). A summary is also given of
two neotectonic investigations continuing in Passamaquoddy Bay.
Earthquake Database update.
A National Earthquake Database (NEDB) is maintained by Earthquakes Canada and is available on-
line at http://earthquakescanada.nrcan.gc.ca/stndon/NEDB-BNDS/bull-eng.php. A list of the
earthquakes found by a search of this database for the period January 1, 2002 to October 8, 2011 is
shown in Table 1 and a map of the epicentres in Figure 1. The area searched was between latitudes
43.0o N and 47.2
o N and longitudes 63.0
o W and 69.0
o W (approximately 200 km in each direction from
Point Lepreau).
346 events have been recorded during this period, ranging in size between Nuttli magnitudes of MN of
0.9 to 4.3. There were 20 earthquakes of magnitude 3 or greater; the largest event being the October 3,
2006 MN 4.3 earthquake, close to Bar Harbor, Maine, about 156 kms west of Point Lepreau. This latter
event is the largest in a 2006-2007 earthquake sequence that occurred and has been investigated by
Ebel et al. (2008). They identify a previously unmapped thrust fault with a NNW-SSE strike and a dip
of about 45o
W as being the causative feature. The authors suggest that the spatial extent of the
sequence allows for the possibility of an earthquake as large as a magnitude MLg =5.4, in a region from
which no previous seismicity had been known. They caution that not all potentially active earthquake
source locations in New England may have been found yet by present day seismic monitoring.
Most of the magnitude 3 earthquakes in New Brunswick in the last decade have occurred in the Central
Highlands region, with one magnitude MN 4.0 earthquake on July 14, 2006 in Northern Maine, with an
epicentre at 46.85oN 68.65
oW. Two magnitude 3 events have occurred in the Passamaquoddy Bay
region since 2002. These are the October 15, 2003 MN 3.1 earthquake, with an epicentre (45.08oN
66.91oW), about 35 kms west of Point Lepreau, and the September 25, 2005 MN 3.5 earthquake, with
an epicentre (45.09oN 67.27
oW), about 63 kms west of Point Lepreau. There are another 20 smaller
events scattered around the Passamaquoddy Bay region, indicating it is still one of the more
seismically active areas in the province.
1

Historical earthquakes felt in New Brunswick (1811-1960).
Articles describing the effects of earthquakes felt in New Brunswick started to appear in newspapers in
the early 19th
century. Burke (2009) investigated contemporary reports of events attributed to
earthquakes in newspapers, diaries, letters and other documents for the years between 1811 and 1960.
For those events identified as earthquakes, dates and times of the earthquake were established and
modified Mercalli (MM) intensity values were estimated for all locations that were reported to have
felt the event.
Maps of the felt areas and isoseismals then allowed the epicentres and magnitudes of the earthquakes
to be determined. Table 2 lists the historical earthquakes and Figure 2 shows their location. The
colour coding indicates previously unlisted events and those earthquakes whose locations have been
changed as a result of this more comprehensive investigation of historical sources.
There are 81 earthquakes in the list, with 2 being identified as foreshocks and 7 as aftershocks. The
positions of epicentres plotted in Figure 2 supports the previous identification of most activity being in
the Central Highlands, Moncton and Passamaquoddy Bay regions of New Brunswick (Burke, 2004).
Other earthquakes have occurred in the Saint John region, and scattered throughout the province, but
they are generally smaller events and have not occurred as frequently. Also, events have been
associated with the only location that has reported their occurrence, such as the 1764 event in Saint
John, which may have been a larger regional earthquake, but no record of its effect has been found
from other places.
The magnitudes listed for most of the historical earthquakes are based on empirical relationships
between magnitude and felt area (i.e. Nuttli and Zollweg, 1974, Street and Lacroix, 1979, Sibol et al.,
1987 and EPRI, 1994). However, for larger events, it is difficult to make a reliable estimate of the full
extent of the felt area, with so few reports from poorly inhabited areas to the north, and the lack of
observers in the seaward direction to the south. Magnitudes determined from better established
isoseismal IV areas are believed to be more representative of the size of earthquakes in these cases.
Therefore, magnitudes of the five largest earthquakes in 1817, 1855, 1869, 1904 and 1922 have been
reassessed using the area within the MM intensity IV isoseismal.
The effects of seven large Eastern North America earthquakes with epicentres outside the province, in
the period 1811 to 1960, were also investigated (Table 3). MM intensities were estimated for each
reporting location (Table 4). MM intensity values of IV to V were obtained for some of the
earthquakes in southern localities, such as Saint John, St. Andrews, St George and St. Stephen. Similar
intensities may have been experienced at Point Lepreau, but I found no reports for this area in the
2
historical sources. MM intensity values of IV to V are typically associated with average peak
velocities of 1.1 to 8.1 cm/s and average peak accelerations of 0.014g to 0.092g (Kaka and Atkinson,
2004).
Neotectonic investigations.
Neotectonic investigations have continued in Passamaquoddy Bay, but much of the work is still in
progress or incomplete. Evangelatos and Butler (2006) describe the results of a high sensitivity marine
magnetic survey, which was conducted in parts of Passamaquoddy Bay and the St. Croix River estuary.
They state that plotting of the data shows an apparent sinistral offset of approximately 220 m along the
Oak Bay fault, where the dyke magnetic anomaly crosses the fault in the Saint Croix River estuary.
There are also other offsets of the dyke magnetic anomaly in the part of Passamaquoddy Bay surveyed,
which are associated with faults in the eastern part of the bay, although rapid changes in water depth
over the sub-cropping dyke was also offered as an explanation for the offset over the Big Bay Fault.
Analysis of the data is still in progress but the initial results do suggest that seismicity in the
Passamaquoddy Bay region may be explained by movements along NW trending faults.
The origin of the Passamaquoddy Bay pockmarks continues to be a subject of investigation by the
Ocean Mapping Group at University of New Brunswick as reported on the webpage at the following
URL. http://www.omg.unb.ca/Projects/PassamaquoddyBay/PassamaquoddyBayPockmarks.html
This group has conducted a multibeam survey of the entire bay and shown that that the pockmarks are
pervasive throughout most of the area. They found the highest density occurred between Navy and
Deer Islands, where the pockmarks frequently have a NW-SE alignment, which matches the large scale
glacial fluting seen in the provincial topographical relief. A 3.5 kHz sub-bottom survey was made of a
portion of the area of pockmarks and showed that they were all developed in an acoustically
transparent unit, with the largest pockmarks only extending in depth to the base of this unit. The linear
pockmark features outline buried glacial features such as eskers, moraines and drumlins. The workers
concluded the idea of Pecore and Fader (1990), that the NW alignment of pockmarks was possibly
associated with gas and fluid release during recent fault movement, does not appear to be correct.
Conclusions.
The update of the earthquake database for the last decade shows a similar distribution of epicentres to
that shown in previous Environmental Assessment Reports (MacLaren Atlantic Limited, 1977 and
Burke, 1984, Burke, 2002). Most earthquakes in southern New Brunswick tend to cluster in the
3

Passamaquoddy Bay region. The continuing activity in the latter region suggests that it is the most
likely source area for the next significant earthquake in southern New Brunswick.
The results of a detailed marine magnetic survey (Evangelos and Butler, 2006) suggests a 220m post-
upper Jurassic offset of the Oak Bay fault and similar offsets of NW trending faults in Passamaquoddy
Bay. However, the idea that the NW alignment of pockmarks in Passamaquoddy Bay is a possible
indicator of active faulting (Pecore and Fadere, 1990) has been refuted. The alignment of the
pockmarks is now interpreted to be caused by submerged NW trending glacial structural features in the
bay (Ocean Mapping Group, 2011).
References.
Burke, K.B.S., 1984. Seismicity of the Point Lepreau area, Report prepared as a background study for
the Lepreau 2 Environmental Impact Study, April, 1984, 32p.
Burke, K.B.S., 2002. Update on the seismicity of the Point Lepreau area; 1983-2002, Report prepared
for Jacques Whitford Ltd., as a background study for the Lepreau Solid Waste Management Facility
Expansion Project, June 18, 2002, 22p.
Burke, K.B.S., 2004. Historical seismicity in the Central Highlands, Passamaquoddy Bay, and
Moncton regions of New Brunswick, Canada, 1817-1961, Seismological Research Letters, 75, 419-
431.
Burke, K.B.S. 2009. Historical earthquakes felt in New Brunswick (1764, 1811-1960), Text published
by Sadler Geophysical and Administrative Services Ltd., Fredericton, 755 p. plus appendices.
Ebel, J.E., A.M. Moulis, D. Smith and M. Hagerty, 2008. The 2006-2007 earthquake sequence at Bar
Harbor, Maine, Seismological Research Letters, 79, 457-468.
EPRI. (1994).The earthquakes of stable continental regions: Volume 1 Assessment of large earthquake
potential, EPRI Report TR-102261-VI, prepared by the Center for Earthquake Research and
Information (CERI), University of Memphis, Memphis, Tennessee, 3, 24 - 39.
Evangelatos J. and K.E. Butler, 2006. Tracking the Ministers Island dyke using marine magnetics,
St Andrews, New Brunswick, Abstract in Atlantic Geology, 42, 82-83.
Kaka S.I. and G.M. Atkinson, 2004. Relationships between instrumental ground-motion parameters
and Modified Mercalli Intensity in eastern North America, Bulletin of Seismological Society of
America, 94, 1728 - 1736.
MacLaren Atlantic Limited, 1977. Point Lepreau EAI.
Natural Resources Canada, 2011. Earthquakes Canada, Earthquake search (on-line Bulletin).
Geological Survey of Canada, Oct 8, 2011 http://earthquakescanada.nrcan.gc.ca/stndon/NEDB-
BNDS/bull-eng.php.
Parnian, M. and C.G. Duff, 1975 Point Lepreau Generating Station Design Basis Earthquake Spectra,
Atomic Energy of Canada Ltd., Engineering Design Guide DG-87-01041-1, 19 p.
4
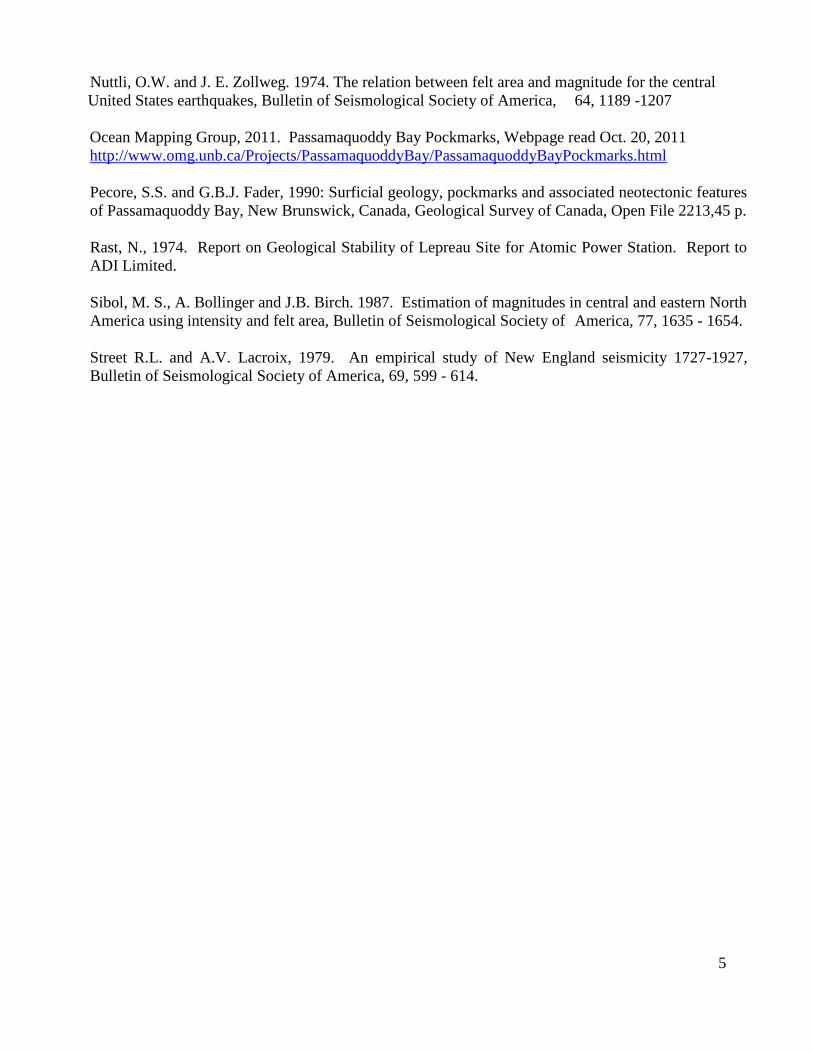
Nuttli, O.W. and J. E. Zollweg. 1974. The relation between felt area and magnitude for the central
United States earthquakes, Bulletin of Seismological Society of America, 64, 1189 -1207
Ocean Mapping Group, 2011. Passamaquoddy Bay Pockmarks, Webpage read Oct. 20, 2011
http://www.omg.unb.ca/Projects/PassamaquoddyBay/PassamaquoddyBayPockmarks.html
Pecore, S.S. and G.B.J. Fader, 1990: Surficial geology, pockmarks and associated neotectonic features
of Passamaquoddy Bay, New Brunswick, Canada, Geological Survey of Canada, Open File 2213,45 p.
Rast, N., 1974. Report on Geological Stability of Lepreau Site for Atomic Power Station. Report to
ADI Limited.
Sibol, M. S., A. Bollinger and J.B. Birch. 1987. Estimation of magnitudes in central and eastern North
America using intensity and felt area, Bulletin of Seismological Society of America, 77, 1635 - 1654.
Street R.L. and A.V. Lacroix, 1979. An empirical study of New England seismicity 1727-1927,
Bulletin of Seismological Society of America, 69, 599 - 614.
5
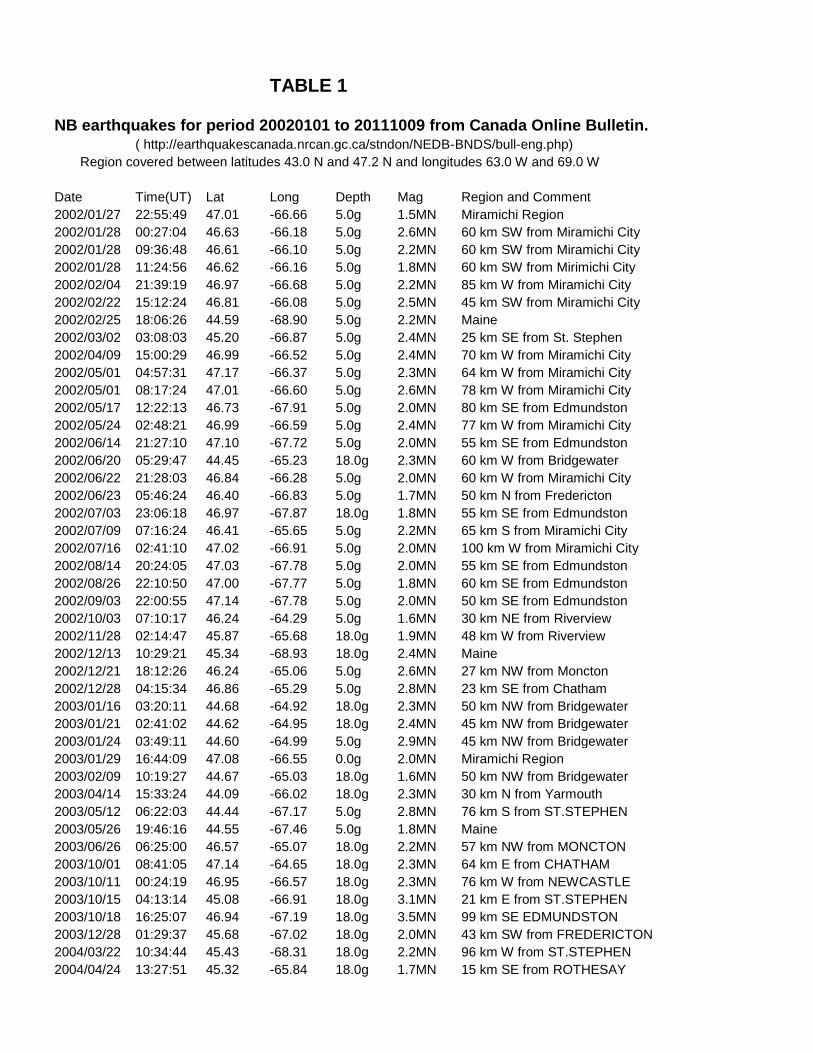
TABLE 1
NB earthquakes for period 20020101 to 20111009 from Canada Online Bulletin.
( http://earthquakescanada.nrcan.gc.ca/stndon/NEDB-BNDS/bull-eng.php)
Region covered between latitudes 43.0 N and 47.2 N and longitudes 63.0 W and 69.0 W
Date Time(UT) Lat Long Depth Mag Region and Comment 2002/01/27 22:55:49 47.01 -66.66 5.0g 1.5MN Miramichi Region
2002/01/28 00:27:04 46.63 -66.18 5.0g 2.6MN 60 km SW from Miramichi City 2002/01/28 09:36:48 46.61 -66.10 5.0g 2.2MN 60 km SW from Miramichi City 2002/01/28 11:24:56 46.62 -66.16 5.0g 1.8MN 60 km SW from Mirimichi City 2002/02/04 21:39:19 46.97 -66.68 5.0g 2.2MN 85 km W from Miramichi City 2002/02/22 15:12:24 46.81 -66.08 5.0g 2.5MN 45 km SW from Miramichi City 2002/02/25 18:06:26 44.59 -68.90 5.0g 2.2MN Maine
2002/03/02 03:08:03 45.20 -66.87 5.0g 2.4MN 25 km SE from St. Stephen 2002/04/09 15:00:29 46.99 -66.52 5.0g 2.4MN 70 km W from Miramichi City 2002/05/01 04:57:31 47.17 -66.37 5.0g 2.3MN 64 km W from Miramichi City 2002/05/01 08:17:24 47.01 -66.60 5.0g 2.6MN 78 km W from Miramichi City 2002/05/17 12:22:13 46.73 -67.91 5.0g 2.0MN 80 km SE from Edmundston 2002/05/24 02:48:21 46.99 -66.59 5.0g 2.4MN 77 km W from Miramichi City 2002/06/14 21:27:10 47.10 -67.72 5.0g 2.0MN 55 km SE from Edmundston 2002/06/20 05:29:47 44.45 -65.23 18.0g 2.3MN 60 km W from Bridgewater 2002/06/22 21:28:03 46.84 -66.28 5.0g 2.0MN 60 km W from Miramichi City 2002/06/23 05:46:24 46.40 -66.83 5.0g 1.7MN 50 km N from Fredericton 2002/07/03 23:06:18 46.97 -67.87 18.0g 1.8MN 55 km SE from Edmundston 2002/07/09 07:16:24 46.41 -65.65 5.0g 2.2MN 65 km S from Miramichi City 2002/07/16 02:41:10 47.02 -66.91 5.0g 2.0MN 100 km W from Miramichi City 2002/08/14 20:24:05 47.03 -67.78 5.0g 2.0MN 55 km SE from Edmundston 2002/08/26 22:10:50 47.00 -67.77 5.0g 1.8MN 60 km SE from Edmundston 2002/09/03 22:00:55 47.14 -67.78 5.0g 2.0MN 50 km SE from Edmundston 2002/10/03 07:10:17 46.24 -64.29 5.0g 1.6MN 30 km NE from Riverview 2002/11/28 02:14:47 45.87 -65.68 18.0g 1.9MN 48 km W from Riverview 2002/12/13 10:29:21 45.34 -68.93 18.0g 2.4MN Maine
2002/12/21 18:12:26 46.24 -65.06 5.0g 2.6MN 27 km NW from Moncton 2002/12/28 04:15:34 46.86 -65.29 5.0g 2.8MN 23 km SE from Chatham 2003/01/16 03:20:11 44.68 -64.92 18.0g 2.3MN 50 km NW from Bridgewater 2003/01/21 02:41:02 44.62 -64.95 18.0g 2.4MN 45 km NW from Bridgewater 2003/01/24 03:49:11 44.60 -64.99 5.0g 2.9MN 45 km NW from Bridgewater 2003/01/29 16:44:09 47.08 -66.55 0.0g 2.0MN Miramichi Region
2003/02/09 10:19:27 44.67 -65.03 18.0g 1.6MN 50 km NW from Bridgewater 2003/04/14 15:33:24 44.09 -66.02 18.0g 2.3MN 30 km N from Yarmouth 2003/05/12 06:22:03 44.44 -67.17 5.0g 2.8MN 76 km S from ST.STEPHEN 2003/05/26 19:46:16 44.55 -67.46 5.0g 1.8MN Maine
2003/06/26 06:25:00 46.57 -65.07 18.0g 2.2MN 57 km NW from MONCTON 2003/10/01 08:41:05 47.14 -64.65 18.0g 2.3MN 64 km E from CHATHAM 2003/10/11 00:24:19 46.95 -66.57 18.0g 2.3MN 76 km W from NEWCASTLE 2003/10/15 04:13:14 45.08 -66.91 18.0g 3.1MN 21 km E from ST.STEPHEN 2003/10/18 16:25:07 46.94 -67.19 18.0g 3.5MN 99 km SE EDMUNDSTON 2003/12/28 01:29:37 45.68 -67.02 18.0g 2.0MN 43 km SW from FREDERICTON
2004/03/22 10:34:44 45.43 -68.31 18.0g 2.2MN 96 km W from ST.STEPHEN 2004/04/24 13:27:51 45.32 -65.84 18.0g 1.7MN 15 km SE from ROTHESAY

2004/06/01 18:58:41 43.38 -67.30 18.0g 2.1ML 108 km SW from Yarmouth 2004/06/03 15:45:52 47.14 -66.72 18.0g 2.9MN 57 km NE from Plaster Rock 2004/07/05 03:15:03 45.13 -66.69 18.0g 1.8MN 30 km E from Saint Andrews 2004/07/10 03:12:23 43.91 -64.73 18.0g 1.7MN 14 km S from Liverpool 2004/08/02 07:36:10 46.98 -66.60 5.0g 1.7MN Miramichi region
2004/08/08 15:38:53 47.02 -66.51 5.0g 2.4MN Miramichi region 2004/08/23 14:38:32 47.02 -66.58 5.0g 1.8MN Miramichi region 2004/08/26 08:14:48 46.19 -64.00 18.0g 2.0MN 29 km SW from Summerside
2004/09/27 21:25:29 45.40 -64.99 5.0g 2.2MN Bay of Fundy. 2004/11/02 22:50:41 45.58 -65.87 5.0g 2.7MN Hampton
2004/11/02 23:42:31 45.70 -65.96 5.0g 1.3MN Hampton 2004/11/02 23:54:48 45.62 -65.89 5.0g 2.2MN Hampton 2004/11/03 01:07:34 45.49 -65.81 5.0g 1.2MN Hampton 2004/11/16 09:35:47 44.95 -67.89 5.0g 2.1MN Maine 2004/12/02 02:37:21 45.67 -65.94 5.0g 1.9MN Hampton 2004/12/02 02:45:23 45.61 -65.89 5.0g 1.9MN Hampton 2004/12/16 17:00:55 45.65 -65.92 5.0g 2.6MN Hampton 2004/12/20 23:29:12 47.09 -66.51 5.0g 2.4MN 70 km E from Plaster Rock
2005/01/05 15:32:42 47.02 -66.57 5.0g 3.7MN Miramichi region 2005/01/06 02:22:28 47.09 -66.56 5.0g 1.9MN Miramichi region 2005/01/06 03:56:55 47.03 -66.65 5.0g 2.3MN Miramichi region 2005/01/08 15:23:20 47.06 -66.66 5.0g 1.9MN Miramichi region 2005/01/08 15:31:59 47.06 -66.58 5.0g 1.7MN Miramichi region 2005/01/08 21:11:21 47.07 -66.68 5.0g 3.0MN Miramichi region 2005/01/09 13:22:33 47.06 -66.58 5.0g 2.7MN Miramichi region 2005/01/11 05:51:07 47.05 -66.49 5.0g 1.8MN Miramichi region 2005/01/22 11:21:43 47.00 -66.71 5.0g 1.8MN Miramichi region 2005/01/25 00:04:47 45.60 -65.88 5.0g 2.4MN Hampton
2005/02/01 18:38:11 43.59 -65.18 18.0g 2.2MN 22 km SE from Shelburne 2005/02/14 09:07:25 47.10 -66.61 5.0g 2.6MN Miramichi region
2005/02/16 05:39:25 45.17 -66.08 5.0g 1.6MN Saint John 2005/03/07 07:14:34 46.44 -65.56 5.0g 1.7MN 35 km S from Rogersville
2005/03/11 17:32:09 46.56 -65.42 5.0g 2.2MN 20 km S from Rogersville 2005/03/11 17:40:36 46.54 -65.41 5.0g 2.2MN 22 km S from Rogersville 2005/04/07 05:03:19 47.01 -66.60 5.0g 1.9MN Miramichi region
2005/05/13 00:04:15 47.13 -66.62 5.0g 1.7MN Miramichi region 2005/05/19 00:49:16 45.65 -66.22 5.0g 1.8MN 29 km SE from Oromocto
2005/06/05 08:51:37 46.69 -65.24 5.0g 2.1MN 16 km E from Rogersville 2005/06/23 04:34:56 46.93 -66.50 5.0g 1.6MN Miramichi region
2005/06/24 01:07:53 46.96 -66.56 5.0g 2.1MN Miramichi region 2005/06/26 02:13:57 45.58 -66.16 5.0g 2.2MN Hampton
2005/07/10 07:16:13 47.02 -66.62 5.0g 1.6MN Miramichi region 2005/07/10 11:05:31 45.18 -66.72 18.0g 0.9MN 29 km E from Saint Andrews
2005/07/10 12:22:12 47.16 -66.45 5.0g 1.2MN Miramichi region 2005/08/05 03:42:35 45.19 -65.80 5.0g 1.2MN 20 km SE from Saint John
2005/08/11 21:55:20 46.92 -67.58 5.0g 1.7MN 15 km W from Plaster Rock 2005/08/22 00:52:45 47.15 -66.79 5.0g 1.8MN 54 km NE from Plaster Rock 2005/08/30 03:03:28 45.11 -66.83 18.0g 1.4MN 19 km E from Saint Andrews 2005/09/12 07:50:17 47.13 -68.05 5.0g 1.6MN 11 km SW from St. Leonard 2005/09/23 02:39:58 45.92 -67.87 18.0g 1.5MN 34 km SW from Woodstock 2005/09/25 03:08:58 45.09 -67.27 5.0g 3.5MN 11 km S from St. Stephen 2005/09/25 15:39:22 45.00 -67.23 5.0g 1.8MN 21 km S from St. Stephen 2005/10/03 03:47:33 46.85 -64.67 17.0g 2.9MN 25 km NE from Richibucto 2005/10/03 14:29:46 46.81 -64.69 18.0g 2.4MN 20 km NE from Richibucto
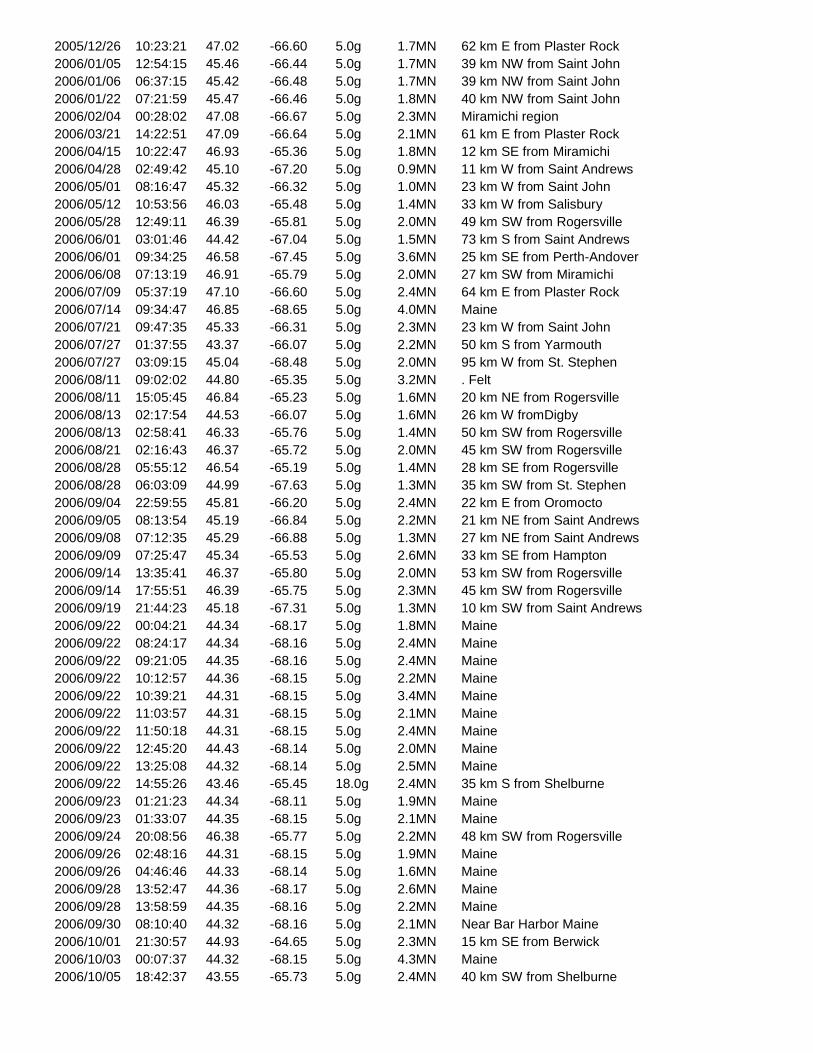
2005/12/26 10:23:21 47.02 -66.60 5.0g 1.7MN 62 km E from Plaster Rock 2006/01/05 12:54:15 45.46 -66.44 5.0g 1.7MN 39 km NW from Saint John 2006/01/06 06:37:15 45.42 -66.48 5.0g 1.7MN 39 km NW from Saint John 2006/01/22 07:21:59 45.47 -66.46 5.0g 1.8MN 40 km NW from Saint John 2006/02/04 00:28:02 47.08 -66.67 5.0g 2.3MN Miramichi region
2006/03/21 14:22:51 47.09 -66.64 5.0g 2.1MN 61 km E from Plaster Rock 2006/04/15 10:22:47 46.93 -65.36 5.0g 1.8MN 12 km SE from Miramichi 2006/04/28 02:49:42 45.10 -67.20 5.0g 0.9MN 11 km W from Saint Andrews 2006/05/01 08:16:47 45.32 -66.32 5.0g 1.0MN 23 km W from Saint John 2006/05/12 10:53:56 46.03 -65.48 5.0g 1.4MN 33 km W from Salisbury 2006/05/28 12:49:11 46.39 -65.81 5.0g 2.0MN 49 km SW from Rogersville 2006/06/01 03:01:46 44.42 -67.04 5.0g 1.5MN 73 km S from Saint Andrews 2006/06/01 09:34:25 46.58 -67.45 5.0g 3.6MN 25 km SE from Perth-Andover 2006/06/08 07:13:19 46.91 -65.79 5.0g 2.0MN 27 km SW from Miramichi 2006/07/09 05:37:19 47.10 -66.60 5.0g 2.4MN 64 km E from Plaster Rock 2006/07/14 09:34:47 46.85 -68.65 5.0g 4.0MN Maine
2006/07/21 09:47:35 45.33 -66.31 5.0g 2.3MN 23 km W from Saint John 2006/07/27 01:37:55 43.37 -66.07 5.0g 2.2MN 50 km S from Yarmouth 2006/07/27 03:09:15 45.04 -68.48 5.0g 2.0MN 95 km W from St. Stephen 2006/08/11 09:02:02 44.80 -65.35 5.0g 3.2MN . Felt
2006/08/11 15:05:45 46.84 -65.23 5.0g 1.6MN 20 km NE from Rogersville 2006/08/13 02:17:54 44.53 -66.07 5.0g 1.6MN 26 km W fromDigby
2006/08/13 02:58:41 46.33 -65.76 5.0g 1.4MN 50 km SW from Rogersville 2006/08/21 02:16:43 46.37 -65.72 5.0g 2.0MN 45 km SW from Rogersville 2006/08/28 05:55:12 46.54 -65.19 5.0g 1.4MN 28 km SE from Rogersville 2006/08/28 06:03:09 44.99 -67.63 5.0g 1.3MN 35 km SW from St. Stephen 2006/09/04 22:59:55 45.81 -66.20 5.0g 2.4MN 22 km E from Oromocto 2006/09/05 08:13:54 45.19 -66.84 5.0g 2.2MN 21 km NE from Saint Andrews 2006/09/08 07:12:35 45.29 -66.88 5.0g 1.3MN 27 km NE from Saint Andrews 2006/09/09 07:25:47 45.34 -65.53 5.0g 2.6MN 33 km SE from Hampton 2006/09/14 13:35:41 46.37 -65.80 5.0g 2.0MN 53 km SW from Rogersville 2006/09/14 17:55:51 46.39 -65.75 5.0g 2.3MN 45 km SW from Rogersville 2006/09/19 21:44:23 45.18 -67.31 5.0g 1.3MN 10 km SW from Saint Andrews 2006/09/22 00:04:21 44.34 -68.17 5.0g 1.8MN Maine
2006/09/22 08:24:17 44.34 -68.16 5.0g 2.4MN Maine 2006/09/22 09:21:05 44.35 -68.16 5.0g 2.4MN Maine 2006/09/22 10:12:57 44.36 -68.15 5.0g 2.2MN Maine 2006/09/22 10:39:21 44.31 -68.15 5.0g 3.4MN Maine 2006/09/22 11:03:57 44.31 -68.15 5.0g 2.1MN Maine 2006/09/22 11:50:18 44.31 -68.15 5.0g 2.4MN Maine 2006/09/22 12:45:20 44.43 -68.14 5.0g 2.0MN Maine 2006/09/22 13:25:08 44.32 -68.14 5.0g 2.5MN Maine 2006/09/22 14:55:26 43.46 -65.45 18.0g 2.4MN 35 km S from Shelburne
2006/09/23 01:21:23 44.34 -68.11 5.0g 1.9MN Maine 2006/09/23 01:33:07 44.35 -68.15 5.0g 2.1MN Maine 2006/09/24 20:08:56 46.38 -65.77 5.0g 2.2MN 48 km SW from Rogersville
2006/09/26 02:48:16 44.31 -68.15 5.0g 1.9MN Maine 2006/09/26 04:46:46 44.33 -68.14 5.0g 1.6MN Maine 2006/09/28 13:52:47 44.36 -68.17 5.0g 2.6MN Maine 2006/09/28 13:58:59 44.35 -68.16 5.0g 2.2MN Maine 2006/09/30 08:10:40 44.32 -68.16 5.0g 2.1MN Near Bar Harbor Maine
2006/10/01 21:30:57 44.93 -64.65 5.0g 2.3MN 15 km SE from Berwick 2006/10/03 00:07:37 44.32 -68.15 5.0g 4.3MN Maine
2006/10/05 18:42:37 43.55 -65.73 5.0g 2.4MN 40 km SW from Shelburne
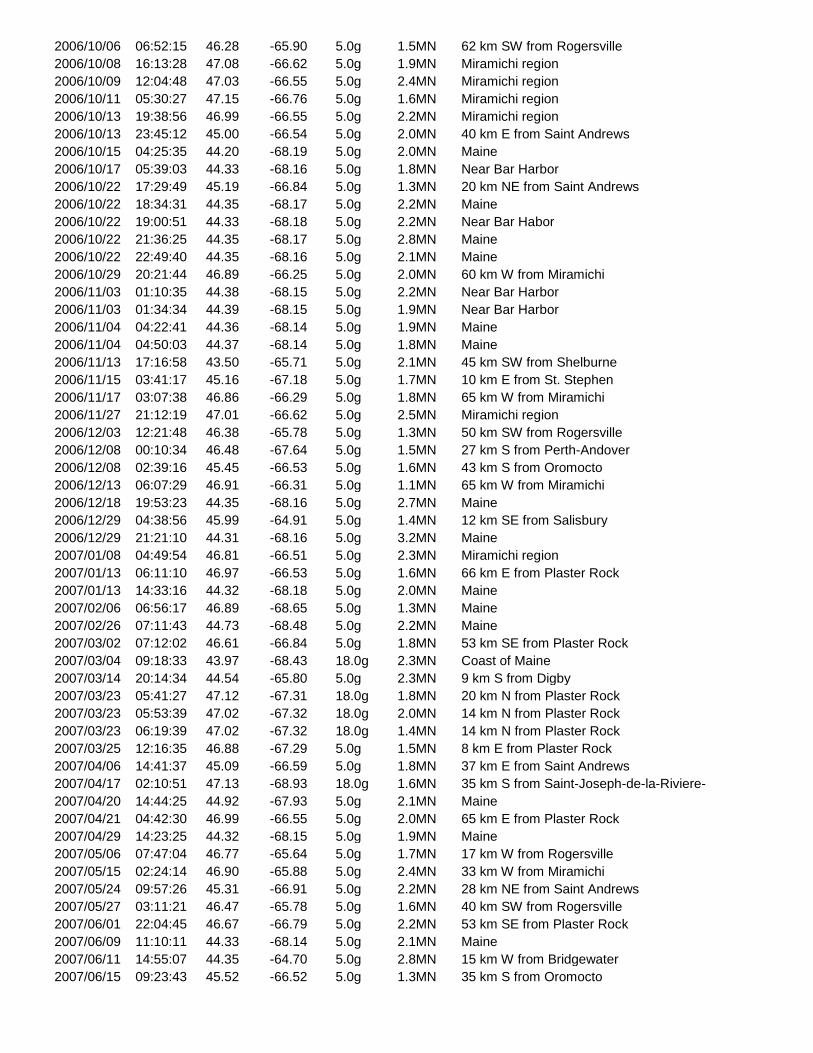
2006/10/06 06:52:15 46.28 -65.90 5.0g 1.5MN 62 km SW from Rogersville 2006/10/08 16:13:28 47.08 -66.62 5.0g 1.9MN Miramichi region
2006/10/09 12:04:48 47.03 -66.55 5.0g 2.4MN Miramichi region 2006/10/11 05:30:27 47.15 -66.76 5.0g 1.6MN Miramichi region 2006/10/13 19:38:56 46.99 -66.55 5.0g 2.2MN Miramichi region 2006/10/13 23:45:12 45.00 -66.54 5.0g 2.0MN 40 km E from Saint Andrews
2006/10/15 04:25:35 44.20 -68.19 5.0g 2.0MN Maine 2006/10/17 05:39:03 44.33 -68.16 5.0g 1.8MN Near Bar Harbor
2006/10/22 17:29:49 45.19 -66.84 5.0g 1.3MN 20 km NE from Saint Andrews 2006/10/22 18:34:31 44.35 -68.17 5.0g 2.2MN Maine
2006/10/22 19:00:51 44.33 -68.18 5.0g 2.2MN Near Bar Habor 2006/10/22 21:36:25 44.35 -68.17 5.0g 2.8MN Maine
2006/10/22 22:49:40 44.35 -68.16 5.0g 2.1MN Maine 2006/10/29 20:21:44 46.89 -66.25 5.0g 2.0MN 60 km W from Miramichi
2006/11/03 01:10:35 44.38 -68.15 5.0g 2.2MN Near Bar Harbor 2006/11/03 01:34:34 44.39 -68.15 5.0g 1.9MN Near Bar Harbor 2006/11/04 04:22:41 44.36 -68.14 5.0g 1.9MN Maine
2006/11/04 04:50:03 44.37 -68.14 5.0g 1.8MN Maine 2006/11/13 17:16:58 43.50 -65.71 5.0g 2.1MN 45 km SW from Shelburne
2006/11/15 03:41:17 45.16 -67.18 5.0g 1.7MN 10 km E from St. Stephen 2006/11/17 03:07:38 46.86 -66.29 5.0g 1.8MN 65 km W from Miramichi 2006/11/27 21:12:19 47.01 -66.62 5.0g 2.5MN Miramichi region
2006/12/03 12:21:48 46.38 -65.78 5.0g 1.3MN 50 km SW from Rogersville 2006/12/08 00:10:34 46.48 -67.64 5.0g 1.5MN 27 km S from Perth-Andover 2006/12/08 02:39:16 45.45 -66.53 5.0g 1.6MN 43 km S from Oromocto 2006/12/13 06:07:29 46.91 -66.31 5.0g 1.1MN 65 km W from Miramichi 2006/12/18 19:53:23 44.35 -68.16 5.0g 2.7MN Maine
2006/12/29 04:38:56 45.99 -64.91 5.0g 1.4MN 12 km SE from Salisbury 2006/12/29 21:21:10 44.31 -68.16 5.0g 3.2MN Maine
2007/01/08 04:49:54 46.81 -66.51 5.0g 2.3MN Miramichi region 2007/01/13 06:11:10 46.97 -66.53 5.0g 1.6MN 66 km E from Plaster Rock
2007/01/13 14:33:16 44.32 -68.18 5.0g 2.0MN Maine 2007/02/06 06:56:17 46.89 -68.65 5.0g 1.3MN Maine 2007/02/26 07:11:43 44.73 -68.48 5.0g 2.2MN Maine 2007/03/02 07:12:02 46.61 -66.84 5.0g 1.8MN 53 km SE from Plaster Rock
2007/03/04 09:18:33 43.97 -68.43 18.0g 2.3MN Coast of Maine 2007/03/14 20:14:34 44.54 -65.80 5.0g 2.3MN 9 km S from Digby 2007/03/23 05:41:27 47.12 -67.31 18.0g 1.8MN 20 km N from Plaster Rock
2007/03/23 05:53:39 47.02 -67.32 18.0g 2.0MN 14 km N from Plaster Rock 2007/03/23 06:19:39 47.02 -67.32 18.0g 1.4MN 14 km N from Plaster Rock 2007/03/25 12:16:35 46.88 -67.29 5.0g 1.5MN 8 km E from Plaster Rock 2007/04/06 14:41:37 45.09 -66.59 5.0g 1.8MN 37 km E from Saint Andrews 2007/04/17 02:10:51 47.13 -68.93 18.0g 1.6MN 35 km S from Saint-Joseph-de-la-Riviere-
2007/04/20 14:44:25 44.92 -67.93 5.0g 2.1MN Maine 2007/04/21 04:42:30 46.99 -66.55 5.0g 2.0MN 65 km E from Plaster Rock
2007/04/29 14:23:25 44.32 -68.15 5.0g 1.9MN Maine 2007/05/06 07:47:04 46.77 -65.64 5.0g 1.7MN 17 km W from Rogersville
2007/05/15 02:24:14 46.90 -65.88 5.0g 2.4MN 33 km W from Miramichi 2007/05/24 09:57:26 45.31 -66.91 5.0g 2.2MN 28 km NE from Saint Andrews 2007/05/27 03:11:21 46.47 -65.78 5.0g 1.6MN 40 km SW from Rogersville 2007/06/01 22:04:45 46.67 -66.79 5.0g 2.2MN 53 km SE from Plaster Rock 2007/06/09 11:10:11 44.33 -68.14 5.0g 2.1MN Maine
2007/06/11 14:55:07 44.35 -64.70 5.0g 2.8MN 15 km W from Bridgewater 2007/06/15 09:23:43 45.52 -66.52 5.0g 1.3MN 35 km S from Oromocto
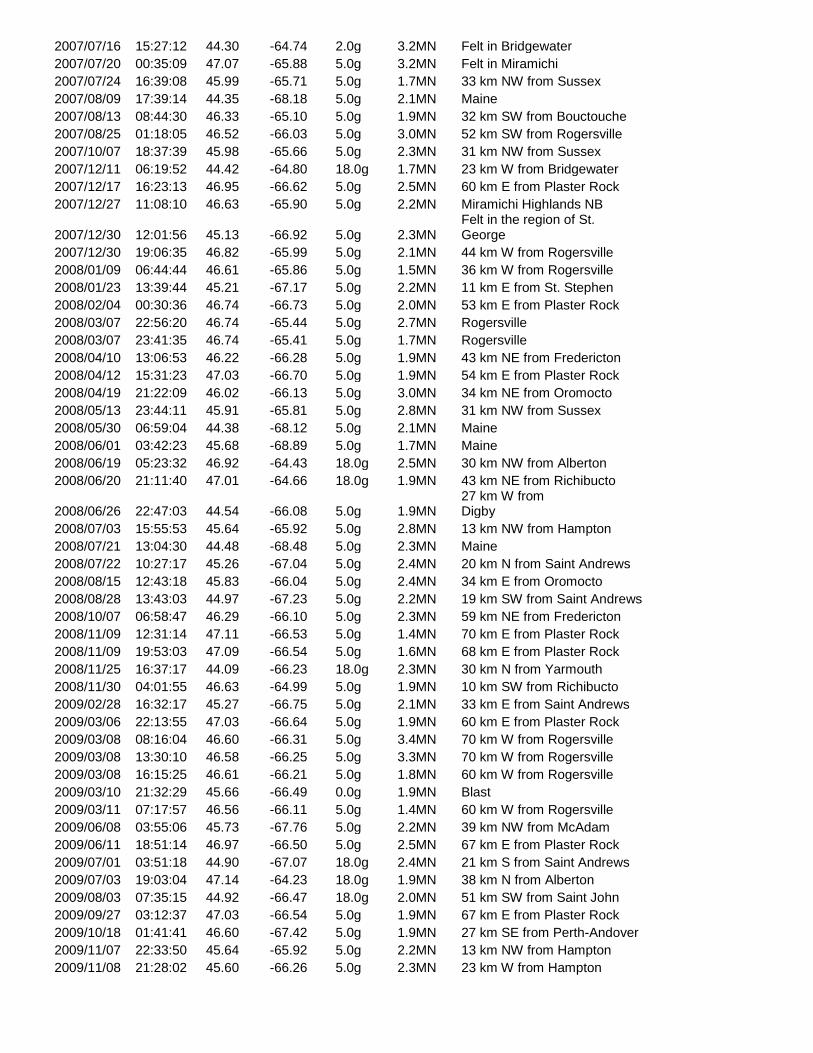
2007/07/16 15:27:12 44.30 -64.74 2.0g 3.2MN Felt in Bridgewater 2007/07/20 00:35:09 47.07 -65.88 5.0g 3.2MN Felt in Miramichi 2007/07/24 16:39:08 45.99 -65.71 5.0g 1.7MN 33 km NW from Sussex
2007/08/09 17:39:14 44.35 -68.18 5.0g 2.1MN Maine 2007/08/13 08:44:30 46.33 -65.10 5.0g 1.9MN 32 km SW from Bouctouche
2007/08/25 01:18:05 46.52 -66.03 5.0g 3.0MN 52 km SW from Rogersville 2007/10/07 18:37:39 45.98 -65.66 5.0g 2.3MN 31 km NW from Sussex 2007/12/11 06:19:52 44.42 -64.80 18.0g 1.7MN 23 km W from Bridgewater 2007/12/17 16:23:13 46.95 -66.62 5.0g 2.5MN 60 km E from Plaster Rock 2007/12/27 11:08:10 46.63 -65.90 5.0g 2.2MN Miramichi Highlands NB
2007/12/30 12:01:56 45.13 -66.92 5.0g 2.3MN Felt in the region of St. George
2007/12/30 19:06:35 46.82 -65.99 5.0g 2.1MN 44 km W from Rogersville 2008/01/09 06:44:44 46.61 -65.86 5.0g 1.5MN 36 km W from Rogersville 2008/01/23 13:39:44 45.21 -67.17 5.0g 2.2MN 11 km E from St. Stephen 2008/02/04 00:30:36 46.74 -66.73 5.0g 2.0MN 53 km E from Plaster Rock 2008/03/07 22:56:20 46.74 -65.44 5.0g 2.7MN Rogersville
2008/03/07 23:41:35 46.74 -65.41 5.0g 1.7MN Rogersville 2008/04/10 13:06:53 46.22 -66.28 5.0g 1.9MN 43 km NE from Fredericton
2008/04/12 15:31:23 47.03 -66.70 5.0g 1.9MN 54 km E from Plaster Rock 2008/04/19 21:22:09 46.02 -66.13 5.0g 3.0MN 34 km NE from Oromocto 2008/05/13 23:44:11 45.91 -65.81 5.0g 2.8MN 31 km NW from Sussex 2008/05/30 06:59:04 44.38 -68.12 5.0g 2.1MN Maine
2008/06/01 03:42:23 45.68 -68.89 5.0g 1.7MN Maine 2008/06/19 05:23:32 46.92 -64.43 18.0g 2.5MN 30 km NW from Alberton
2008/06/20 21:11:40 47.01 -64.66 18.0g 1.9MN 43 km NE from Richibucto
2008/06/26 22:47:03 44.54 -66.08 5.0g 1.9MN 27 km W from Digby
2008/07/03 15:55:53 45.64 -65.92 5.0g 2.8MN 13 km NW from Hampton 2008/07/21 13:04:30 44.48 -68.48 5.0g 2.3MN Maine
2008/07/22 10:27:17 45.26 -67.04 5.0g 2.4MN 20 km N from Saint Andrews 2008/08/15 12:43:18 45.83 -66.04 5.0g 2.4MN 34 km E from Oromocto 2008/08/28 13:43:03 44.97 -67.23 5.0g 2.2MN 19 km SW from Saint Andrews 2008/10/07 06:58:47 46.29 -66.10 5.0g 2.3MN 59 km NE from Fredericton 2008/11/09 12:31:14 47.11 -66.53 5.0g 1.4MN 70 km E from Plaster Rock 2008/11/09 19:53:03 47.09 -66.54 5.0g 1.6MN 68 km E from Plaster Rock 2008/11/25 16:37:17 44.09 -66.23 18.0g 2.3MN 30 km N from Yarmouth 2008/11/30 04:01:55 46.63 -64.99 5.0g 1.9MN 10 km SW from Richibucto 2009/02/28 16:32:17 45.27 -66.75 5.0g 2.1MN 33 km E from Saint Andrews 2009/03/06 22:13:55 47.03 -66.64 5.0g 1.9MN 60 km E from Plaster Rock 2009/03/08 08:16:04 46.60 -66.31 5.0g 3.4MN 70 km W from Rogersville 2009/03/08 13:30:10 46.58 -66.25 5.0g 3.3MN 70 km W from Rogersville 2009/03/08 16:15:25 46.61 -66.21 5.0g 1.8MN 60 km W from Rogersville 2009/03/10 21:32:29 45.66 -66.49 0.0g 1.9MN Blast
2009/03/11 07:17:57 46.56 -66.11 5.0g 1.4MN 60 km W from Rogersville 2009/06/08 03:55:06 45.73 -67.76 5.0g 2.2MN 39 km NW from McAdam 2009/06/11 18:51:14 46.97 -66.50 5.0g 2.5MN 67 km E from Plaster Rock 2009/07/01 03:51:18 44.90 -67.07 18.0g 2.4MN 21 km S from Saint Andrews 2009/07/03 19:03:04 47.14 -64.23 18.0g 1.9MN 38 km N from Alberton 2009/08/03 07:35:15 44.92 -66.47 18.0g 2.0MN 51 km SW from Saint John 2009/09/27 03:12:37 47.03 -66.54 5.0g 1.9MN 67 km E from Plaster Rock 2009/10/18 01:41:41 46.60 -67.42 5.0g 1.9MN 27 km SE from Perth-Andover 2009/11/07 22:33:50 45.64 -65.92 5.0g 2.2MN 13 km NW from Hampton 2009/11/08 21:28:02 45.60 -66.26 5.0g 2.3MN 23 km W from Hampton

2009/11/13 09:33:41 45.96 -64.95 5.0g 1.9MN 11 km SE from Salisbury 2009/11/21 05:24:07 46.45 -66.22 5.0g 2.0MN 66 km NE from Fredericton 2009/11/22 23:00:20 45.37 -66.05 5.0g 2.2MN 12 km N from Saint John 2009/11/24 22:16:45 46.67 -66.34 5.0g 1.9MN 70 km W from Rogersville 2009/11/24 23:22:56 45.34 -66.02 5.0g 1.3MN 9 km N from Saint John 2009/11/25 23:25:54 44.53 -67.07 5.0g 1.6MN 62 km S from Saint Andrews 2009/12/04 09:17:40 45.22 -66.81 5.0g 1.9MN 24 km NE from Saint Andrews 2009/12/10 15:28:28 46.97 -66.64 5.0g 2.6MN 58 km E from Plaster Rock 2009/12/14 14:11:43 45.80 -66.07 5.0g 1.8MN 32 km E from Oromocto 2010/01/05 22:25:58 46.69 -66.79 5.0g 1.9MN 50 km SE from Plaster Rock 2010/02/02 21:18:27 46.36 -68.20 5.0g 2.5MN Maine
2010/02/06 03:49:47 46.01 -65.69 5.0g 3.2MN 39 km NW from Sussex 2010/02/17 19:59:47 44.73 -67.13 5.0g 2.2MN 40 km S from Saint Andrews 2010/03/19 04:22:20 46.90 -66.36 5.0g 2.0MN 70 km W from Miramichi 2010/03/21 21:36:35 44.04 -67.23 5.0g 2.4MN 92 km W from Yarmouth 2010/03/30 20:42:17 44.58 -68.83 5.0g 3.0MN Maine
2010/04/21 05:11:53 47.01 -66.56 5.0g 2.2MN 65 km E from Plaster Rock 2010/05/03 08:04:27 44.93 -67.43 5.0g 2.0MN 30 km S from St. Stephen 2010/05/28 09:22:25 45.97 -65.70 5.0g 1.6MN 30 km NW from Sussex 2010/06/11 04:04:20 47.06 -66.82 5.0g 1.8MN 47 km E from Plaster Rock 2010/06/17 22:21:17 44.99 -66.76 5.0g 2.3MN 19 km E from Saint Andrews 2010/06/29 09:08:59 45.06 -66.65 5.0g 2.1MN 33 km E from Saint Andrews 2010/07/03 08:28:05 46.99 -66.59 5.0g 2.8MN 62 km E from Plaster Rock 2010/07/18 23:50:44 46.96 -66.61 5.0g 2.9MN 60 km E from Plaster Rock 2010/07/25 18:36:25 44.42 -66.85 5.0g 3.2MN 75 km S from Saint Andrews 2010/07/29 18:35:06 44.86 -67.67 5.0g 2.7MN 47 km SW from St. Stephen 2010/08/18 00:33:22 46.71 -65.45 5.0g 2.0MN 3 km SW from Rogersville 2010/08/21 09:54:08 46.94 -66.44 5.0g 1.3MN 73 km E from Plaster Rock 2010/08/25 03:07:54 46.74 -66.44 5.0g 1.9MN 75 km E from Plaster Rock 2010/08/25 08:16:02 45.03 -66.94 5.0g 2.4MN 11 km SE from Saint Andrews 2010/08/30 06:52:07 47.02 -66.68 5.0g 1.7MN 55 km E from Plaster Rock 2010/10/01 21:19:48 47.02 -66.63 5.0g 2.3MN 60 km E from Plaster Rock 2010/10/11 03:02:18 47.00 -66.66 5.0g 1.9MN 57 km E from Plaster Rock 2010/10/13 09:21:01 46.48 -64.88 5.0g 2.2MN 10 km W from Bouctouche 2010/10/20 02:28:05 47.06 -67.04 5.0g 1.9MN 32 km NE from Plaster Rock 2010/10/21 17:09:49 47.09 -65.65 5.0g 2.0MN 17 km NW from Miramichi 2010/10/25 15:09:59 47.12 -66.80 5.0g 2.0MN 50 km NE from Plaster Rock 2010/11/14 17:05:09 45.83 -66.41 5.0g 2.3MN 6 km E from Oromocto 2010/12/15 07:39:27 46.37 -67.65 5.0g 2.3MN 25 km N from Woodstock 2011/01/03 05:39:56 47.02 -66.54 5.0g 1.8MN 66 km E from Plaster Rock 2011/01/05 06:17:45 44.48 -67.04 5.0g 2.0MN 68 km S from Saint Andrews 2011/01/16 09:18:13 47.00 -66.56 5.0g 1.8MN 64 km E from Plaster Rock 2011/01/31 08:06:14 45.10 -67.13 5.0g 2.6MN 5 km W from Saint Andrews 2011/02/02 18:21:12 46.99 -66.60 5.0g 2.6MN 61 km E from Plaster Rock 2011/02/02 18:28:19 47.02 -66.59 5.0g 1.6MN 62 km E from Plaster Rock 2011/02/03 13:22:47 46.01 -64.40 5.0g 2.7MN 10 km N from Sackville 2011/02/07 01:06:01 47.06 -66.71 5.0g 1.6MN 55 km E from Plaster Rock 2011/02/07 20:58:06 46.96 -66.59 5.0g 2.4MN 62 km E from Plaster Rock 2011/02/10 07:03:08 46.99 -66.52 5.0g 1.9MN 67 km E from Plaster Rock 2011/02/14 10:00:30 46.98 -66.48 5.0g 1.9MN 70 km E from Plaster Rock 2011/03/10 04:38:27 46.53 -64.20 18.0g 1.7MN 30 km S from Alberton 2011/03/24 16:52:16 45.85 -65.65 5.0g 1.9MN 20 km NW from Sussex 2011/03/25 10:35:47 45.28 -68.35 5.0g 2.7MN Maine
2011/03/29 19:58:56 47.07 -66.83 5.0g 2.2MN 47 km NE from Plaster Rock
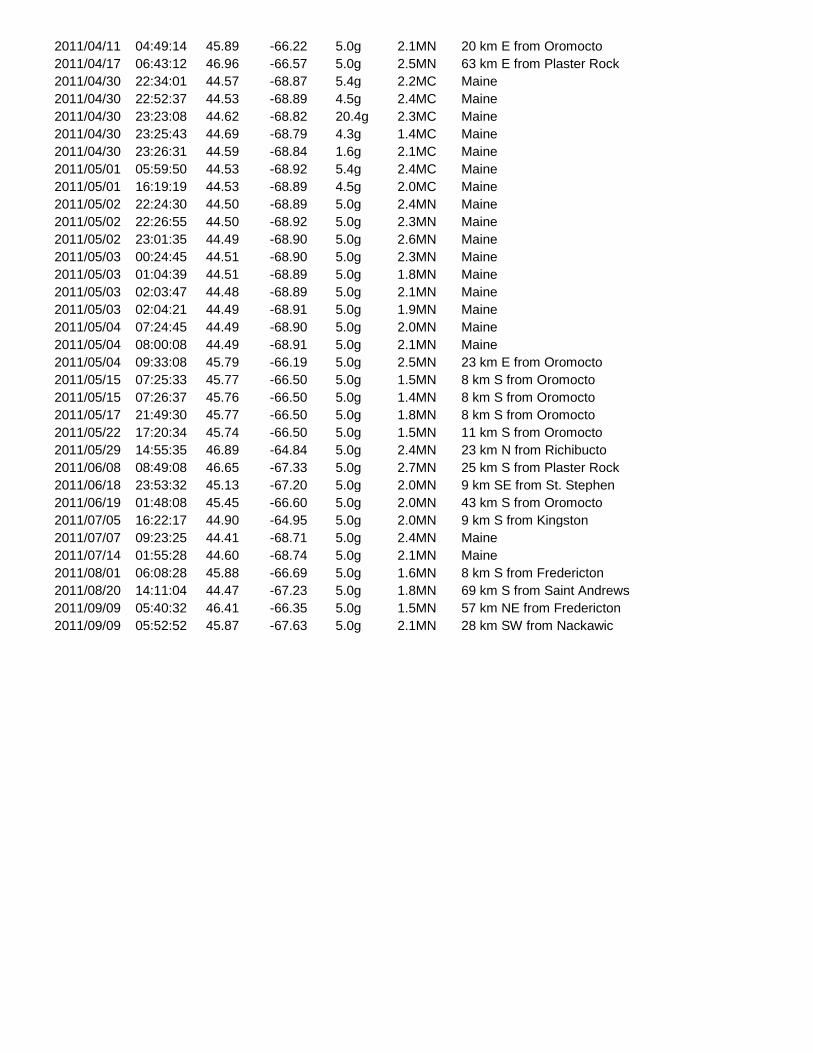
2011/04/11 04:49:14 45.89 -66.22 5.0g 2.1MN 20 km E from Oromocto 2011/04/17 06:43:12 46.96 -66.57 5.0g 2.5MN 63 km E from Plaster Rock 2011/04/30 22:34:01 44.57 -68.87 5.4g 2.2MC Maine
2011/04/30 22:52:37 44.53 -68.89 4.5g 2.4MC Maine 2011/04/30 23:23:08 44.62 -68.82 20.4g 2.3MC Maine 2011/04/30 23:25:43 44.69 -68.79 4.3g 1.4MC Maine 2011/04/30 23:26:31 44.59 -68.84 1.6g 2.1MC Maine 2011/05/01 05:59:50 44.53 -68.92 5.4g 2.4MC Maine 2011/05/01 16:19:19 44.53 -68.89 4.5g 2.0MC Maine 2011/05/02 22:24:30 44.50 -68.89 5.0g 2.4MN Maine 2011/05/02 22:26:55 44.50 -68.92 5.0g 2.3MN Maine 2011/05/02 23:01:35 44.49 -68.90 5.0g 2.6MN Maine 2011/05/03 00:24:45 44.51 -68.90 5.0g 2.3MN Maine 2011/05/03 01:04:39 44.51 -68.89 5.0g 1.8MN Maine 2011/05/03 02:03:47 44.48 -68.89 5.0g 2.1MN Maine 2011/05/03 02:04:21 44.49 -68.91 5.0g 1.9MN Maine 2011/05/04 07:24:45 44.49 -68.90 5.0g 2.0MN Maine 2011/05/04 08:00:08 44.49 -68.91 5.0g 2.1MN Maine 2011/05/04 09:33:08 45.79 -66.19 5.0g 2.5MN 23 km E from Oromocto
2011/05/15 07:25:33 45.77 -66.50 5.0g 1.5MN 8 km S from Oromocto 2011/05/15 07:26:37 45.76 -66.50 5.0g 1.4MN 8 km S from Oromocto 2011/05/17 21:49:30 45.77 -66.50 5.0g 1.8MN 8 km S from Oromocto 2011/05/22 17:20:34 45.74 -66.50 5.0g 1.5MN 11 km S from Oromocto 2011/05/29 14:55:35 46.89 -64.84 5.0g 2.4MN 23 km N from Richibucto 2011/06/08 08:49:08 46.65 -67.33 5.0g 2.7MN 25 km S from Plaster Rock 2011/06/18 23:53:32 45.13 -67.20 5.0g 2.0MN 9 km SE from St. Stephen 2011/06/19 01:48:08 45.45 -66.60 5.0g 2.0MN 43 km S from Oromocto 2011/07/05 16:22:17 44.90 -64.95 5.0g 2.0MN 9 km S from Kingston 2011/07/07 09:23:25 44.41 -68.71 5.0g 2.4MN Maine
2011/07/14 01:55:28 44.60 -68.74 5.0g 2.1MN Maine 2011/08/01 06:08:28 45.88 -66.69 5.0g 1.6MN 8 km S from Fredericton
2011/08/20 14:11:04 44.47 -67.23 5.0g 1.8MN 69 km S from Saint Andrews 2011/09/09 05:40:32 46.41 -66.35 5.0g 1.5MN 57 km NE from Fredericton 2011/09/09 05:52:52 45.87 -67.63 5.0g 2.1MN 28 km SW from Nackawic
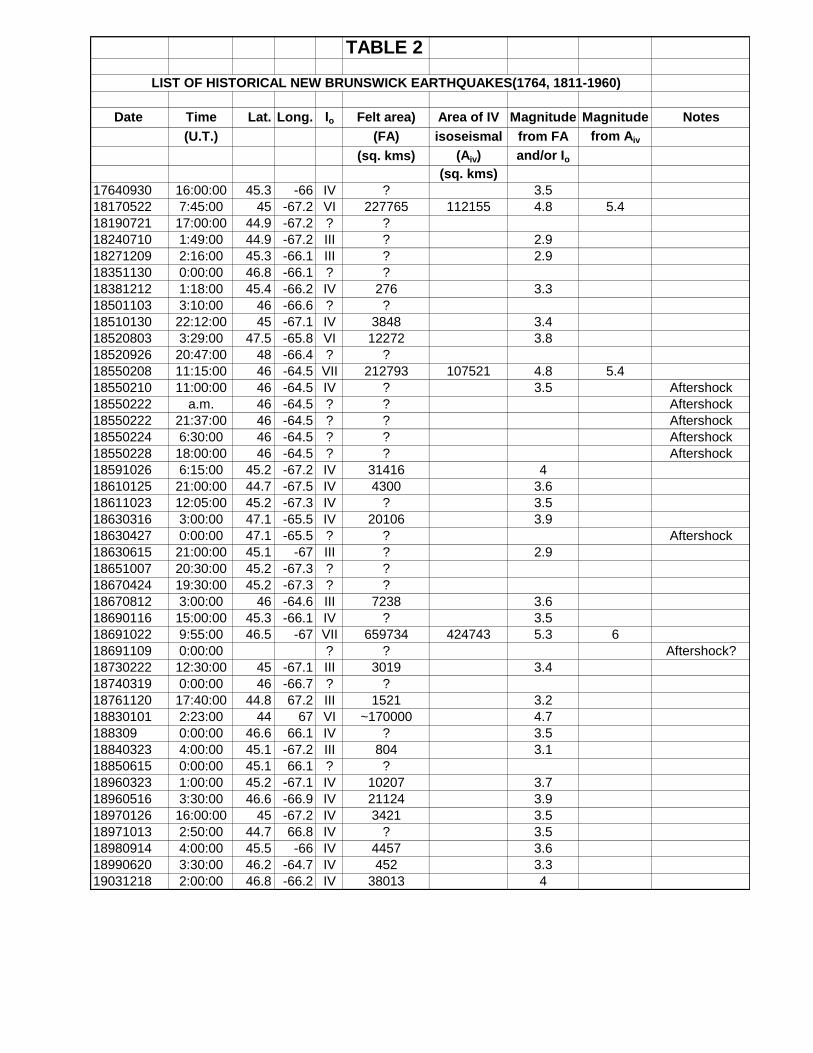
TABLE 2
LIST OF HISTORICAL NEW BRUNSWICK EARTHQUAKES(1764, 1811-1960)
Date Time Lat. Long. Io Felt area) Area of IV Magnitude Magnitude Notes
(U.T.) (FA) isoseismal from FA from Aiv
(sq. kms) (Aiv) and/or Io
(sq. kms)
17640930 16:00:00 45.3 -66 IV ? 3.5
18170522 7:45:00 45 -67.2 VI 227765 112155 4.8 5.4
18190721 17:00:00 44.9 -67.2 ? ?
18240710 1:49:00 44.9 -67.2 III ? 2.9
18271209 2:16:00 45.3 -66.1 III ? 2.9
18351130 0:00:00 46.8 -66.1 ? ?
18381212 1:18:00 45.4 -66.2 IV 276 3.3
18501103 3:10:00 46 -66.6 ? ?
18510130 22:12:00 45 -67.1 IV 3848 3.4
18520803 3:29:00 47.5 -65.8 VI 12272 3.8
18520926 20:47:00 48 -66.4 ? ?
18550208 11:15:00 46 -64.5 VII 212793 107521 4.8 5.4
18550210 11:00:00 46 -64.5 IV ? 3.5 Aftershock
18550222 a.m. 46 -64.5 ? ? Aftershock
18550222 21:37:00 46 -64.5 ? ? Aftershock
18550224 6:30:00 46 -64.5 ? ? Aftershock
18550228 18:00:00 46 -64.5 ? ? Aftershock
18591026 6:15:00 45.2 -67.2 IV 31416 4
18610125 21:00:00 44.7 -67.5 IV 4300 3.6
18611023 12:05:00 45.2 -67.3 IV ? 3.5
18630316 3:00:00 47.1 -65.5 IV 20106 3.9
18630427 0:00:00 47.1 -65.5 ? ? Aftershock
18630615 21:00:00 45.1 -67 III ? 2.9
18651007 20:30:00 45.2 -67.3 ? ?
18670424 19:30:00 45.2 -67.3 ? ?
18670812 3:00:00 46 -64.6 III 7238 3.6
18690116 15:00:00 45.3 -66.1 IV ? 3.5
18691022 9:55:00 46.5 -67 VII 659734 424743 5.3 6
18691109 0:00:00 ? ? Aftershock?
18730222 12:30:00 45 -67.1 III 3019 3.4
18740319 0:00:00 46 -66.7 ? ?
18761120 17:40:00 44.8 67.2 III 1521 3.2
18830101 2:23:00 44 67 VI ~170000 4.7
188309 0:00:00 46.6 66.1 IV ? 3.5
18840323 4:00:00 45.1 -67.2 III 804 3.1
18850615 0:00:00 45.1 66.1 ? ?
18960323 1:00:00 45.2 -67.1 IV 10207 3.7
18960516 3:30:00 46.6 -66.9 IV 21124 3.9
18970126 16:00:00 45 -67.2 IV 3421 3.5
18971013 2:50:00 44.7 66.8 IV ? 3.5
18980914 4:00:00 45.5 -66 IV 4457 3.6
18990620 3:30:00 46.2 -64.7 IV 452 3.3
19031218 2:00:00 46.8 -66.2 IV 38013 4
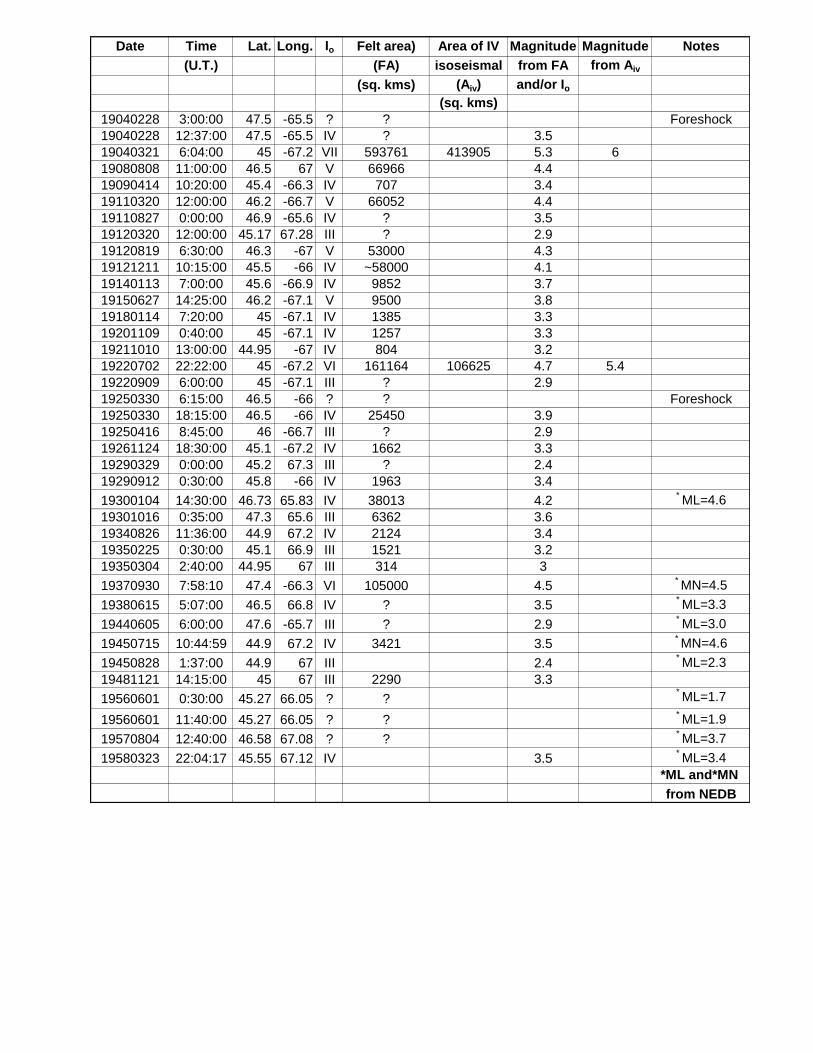
Date Time Lat. Long. Io Felt area) Area of IV Magnitude Magnitude Notes
(U.T.) (FA) isoseismal from FA from Aiv
(sq. kms) (Aiv) and/or Io
(sq. kms)
19040228 3:00:00 47.5 -65.5 ? ? Foreshock
19040228 12:37:00 47.5 -65.5 IV ? 3.5
19040321 6:04:00 45 -67.2 VII 593761 413905 5.3 6
19080808 11:00:00 46.5 67 V 66966 4.4
19090414 10:20:00 45.4 -66.3 IV 707 3.4
19110320 12:00:00 46.2 -66.7 V 66052 4.4
19110827 0:00:00 46.9 -65.6 IV ? 3.5
19120320 12:00:00 45.17 67.28 III ? 2.9
19120819 6:30:00 46.3 -67 V 53000 4.3
19121211 10:15:00 45.5 -66 IV ~58000 4.1
19140113 7:00:00 45.6 -66.9 IV 9852 3.7
19150627 14:25:00 46.2 -67.1 V 9500 3.8
19180114 7:20:00 45 -67.1 IV 1385 3.3
19201109 0:40:00 45 -67.1 IV 1257 3.3
19211010 13:00:00 44.95 -67 IV 804 3.2
19220702 22:22:00 45 -67.2 VI 161164 106625 4.7 5.4
19220909 6:00:00 45 -67.1 III ? 2.9
19250330 6:15:00 46.5 -66 ? ? Foreshock
19250330 18:15:00 46.5 -66 IV 25450 3.9
19250416 8:45:00 46 -66.7 III ? 2.9
19261124 18:30:00 45.1 -67.2 IV 1662 3.3
19290329 0:00:00 45.2 67.3 III ? 2.4
19290912 0:30:00 45.8 -66 IV 1963 3.4
19300104 14:30:00 46.73 65.83 IV 38013 4.2* ML=4.6
19301016 0:35:00 47.3 65.6 III 6362 3.6
19340826 11:36:00 44.9 67.2 IV 2124 3.4
19350225 0:30:00 45.1 66.9 III 1521 3.2
19350304 2:40:00 44.95 67 III 314 3
19370930 7:58:10 47.4 -66.3 VI 105000 4.5* MN=4.5
19380615 5:07:00 46.5 66.8 IV ? 3.5* ML=3.3
19440605 6:00:00 47.6 -65.7 III ? 2.9* ML=3.0
19450715 10:44:59 44.9 67.2 IV 3421 3.5* MN=4.6
19450828 1:37:00 44.9 67 III 2.4* ML=2.3
19481121 14:15:00 45 67 III 2290 3.3
19560601 0:30:00 45.27 66.05 ? ?* ML=1.7
19560601 11:40:00 45.27 66.05 ? ?* ML=1.9
19570804 12:40:00 46.58 67.08 ? ?* ML=3.7
19580323 22:04:17 45.55 67.12 IV 3.5* ML=3.4
*ML and*MN
from NEDB

TABLE 3
Large regional earthquakes felt in New Brunswick between 1811 and 1960
Date TimeU.T.) Latitude Longitude Magnitude CommentsoN
oW
Oct 17, 1860 11:15 47.50 70.10 6.0MLa
Charlevoix region, Que.
Oct 20, 1870 16:30 47.40 70.50 6.5MLa
Charlevoix region, Que.
Sept 30, 1924 8:54 47.80 69.80 5.5MLa
Charlevoix region, Que.
Mar 1, 1925 2:19 47.80 69.80 6.5MLb
Charlevoix region, Que.
Nov 18, 1929 20:32 44.69 56.00 7.1MLc
Grand Banks, NL.
Dec 20, 1940 7:27 43.87 71.37 5.5MLd
New Hampshire, USA
Dec 24, 1940 13:34 43.91 71.28 5.5MLd
New Hampshire, USA
a Lamontagne et al. (2007)b Bent. (1992)c Bent. (1995)d NEIC listing. http://neic.usgs.gov/neis/epic/epic.html
Note: Local magnitude scales have been retained in the above listing to allow an approximate comparison
to be made between the sizes of the regional earthquakes. Moment magnitude values of Mw = 6.2 0.2
for the March 1, 1925 earthquake and Mw = 7.2 0.3 for the November 18, 1929 have been determined by
Bent (1992, 1995).

TABLE 4
MM INTENSITIES FROM LARGER REGIONAL EARTHQUAKES
Grand
Banks New Hampshire
Quebec Earthquakes Earthquake Earthquakes
Community Latitude Longitude 1860 1870 1924 1925 1929 20.12.1940 24.12.1940oN
oW
Bathurst 47.62 65.65 F IV IV IV-V IV-V
Campbellton 48.00 66.67 F IV IV V IV-V F
Chatham 47.03 65.46 F F IV IV IV-V
Dalhousie 48.06 66.38 F III-IV V-VI V-VI
Edmundston 47.37 68.33 IV F
Fredericton 45.97 66.65 IV V-VI IV IV-V V-VI IV IV
Grand Falls 46.92 67.75 IV V-VI F
Hartland 46.30 67.53 IV F F
Moncton 46.10 64.78 F IV IV V F
Newcastle 47.01 65.57 IV-V F IV-V IV-V
Sackville 45.89 64.37 III IV V
Saint John 45.27 66.05 IV IV IV-V IV V IV IV
Shediac 46.22 64.55 F F III-IV
St. Andrews 45.08 67.05 IV IV F F
St. George 45.13 66.83 IV-V F
St. Stephen 45.19 67.28 IV F F IV-V IV
Sussex 45.73 65.52 IV IV
Woodstock 46.14 67.58 F IV IV-V IV III
Modified Mercalli (MM) intensity values assigned by Burke (2009).F indicates that an earthquake was felt.

FIG. 1 MAP OF EPICENTRES OF EARTHQUAKES WITHIN 200 KMS OF POINT LEPREAU 2002-2011_10_8
From Earthquakes Canada, GSC, Earthquake Search (On-line Bulletin),
http://seismo.nrcan.gc.ca/stnsdata/nedb/bull_e.php, Nat. Res. Can., {2011_10_8}.

FIG. 2 MAP OF HISTORICAL EARTHQUAKES FELT IN NEW BRUNSWICK (1764, 1811-1960)
From Burke, K.B.S. 2009. Historical earthquakes felt in New Brunswick (1764, 1811-1960), Text
published by Sadler Geophysical and Administrative Services Ltd., Fredericton, 755 p. plus appendices.

Risk-Reduction Strategies used to Manage Cracking of Carbon Steel Primary Coolant Piping at the Point Lepreau Generating Station
John P. Slade1, Tracy S. Gendron2
1New Brunswick Power Nuclear, Point Lepreau Generating Station, P.O. Box 600, Lepreau, New Brunswick, E5J 2S6 2Atomic Energy of Canada Ltd. Chalk River Laboratories, Chalk River, Ontario, K0J 1J0
Keywords: Stress Corrosion Cracking, Creep Cracking, Carbon Steel, Risk Management, Life Cycle Management, Piping
Abstract
Since 1997, sections of nine ASME SA 106 Grade B carbon steel primary coolant system piping at the Point Lepreau Generating Station (PLGS) have been replaced because of intergranular cracking. This cracking at PLGS is unique among the world’s CANDU® reactors and has potential to have a significant negative impact on the safe and reliable operation of the Station. Although the mechanism(s) of cracking initiated from both inside and outside surfaces has not been confirmed, several primary causal or proximate factors have been identified that form the basis for cost-effective risk management strategies.
New Brunswick Power Nuclear (NBPN) uses a combination of three strategies to manage the observed cracking, depending on the probability of cracking at that location in the piping system, the potential for risk reduction in applying the strategy, and the time in the reactor life cycle. The strategies are: Inspection and Repair, Demonstration of Low Risk, and Prevention of Cracking.
This paper describes the methods used to select appropriate management activities based on economic analysis and risk reduction.
Introduction
New Brunswick Power Nuclear (NBPN) operates a single unit, 680 MWe pressurized heavy water CANDU® reactor at the Point Lepreau Generating Station (PLGS) located on the Bay of Fundy. PLGS provides approximately one third of the electric power needs of the Province of New Brunswick.
Cracking of small diameter carbon steel feeder piping in the primary heat transport (PHT) system is considered to be a major threat to safe, reliable, and economical operation of PLGS. For information on the feeder design and degradation observed at PLGS, the reader is referred to Reference 1. Managing this threat is challenging because:
• Crack behavior is not readily predictable, • Crack stability is not yet demonstrated in thin wall locations, • Consequential costs of many management activities are high, • Consequential cost of failure is high.
Despite these challenges, NBPN developed an economical feeder Life Cycle Management (LCM) Plan [2] to ensure safe operation.
In consideration of the observed behaviour of feeder cracks and the cost-effective management activities available, NBPN selected three feeder management strategies for different locations within the feeder system and for different stages of reactor life. To prioritize management activities within each of the strategies, NBPN assigns a risk management index (RMI) for different component locations. The bases for assigning RMI are risk reduction and consequential cost in applying a particular activity.
This paper describes key elements of the PLGS feeder LCM Plan: feeder design and safety requirements, how degradation impairs performance, pertinent aspects of the observed cracking behavior, management strategies, operation and maintenance activities, and a rationale for the RMI. Also included is an evaluation of the cost-effectiveness of the LCM Plan.
Incentive for Feeder LCM Planning at PLGS
At PLGS, LCM plans are required for systems and components that, if not maintained properly, could result in an unreasonable risk to the safe and reliable operation of the plant.
Feeder cracking has had a significant impact on NBPN. Since 1997, cracking has caused two forced outages and extended three planned outages resulting in direct and indirect costs of approximately $60M. In addition, ongoing engineering and maintenance activities to manage cracking require about 5% of the total operating, maintenance and administration budget for the Station. Radiation exposure to perform inspection and maintenance on the affected piping is about 30% of total outage radiation exposure for the entire station.
Feeder cracking makes a disproportionate contribution to the total nuclear safety risk from all components at Point Lepreau. In particular, low margins on crack stability for outside surface-initiated cracks at thinned bend extradoses have increased the probability of rupture. The low margins and the incidence of cracking at PLGS have the potential to increase the probability of consequential feeder rupture and multiple feeder ruptures in the absence of remedial measures. The PLGS Safety Report does not permit design basis events to propagate into further failures.
Design and Nuclear Safety Requirements Pertinent to Risk Management Strategies for Cracking
Design and nuclear safety requirements are two of the most important considerations in the development of effective strategies to manage the risk of cracking. These requirements define the basis for safe and reliable operation.
Proceedings of the 12th International Conference onEnvironmental Degradation of Materials in Nuclear Power System – Water Reactors –
Edited by T.R. Allen, P.J. King, and L. Nelson TMS (The Minerals, Metals & Materials Society), 2005
785
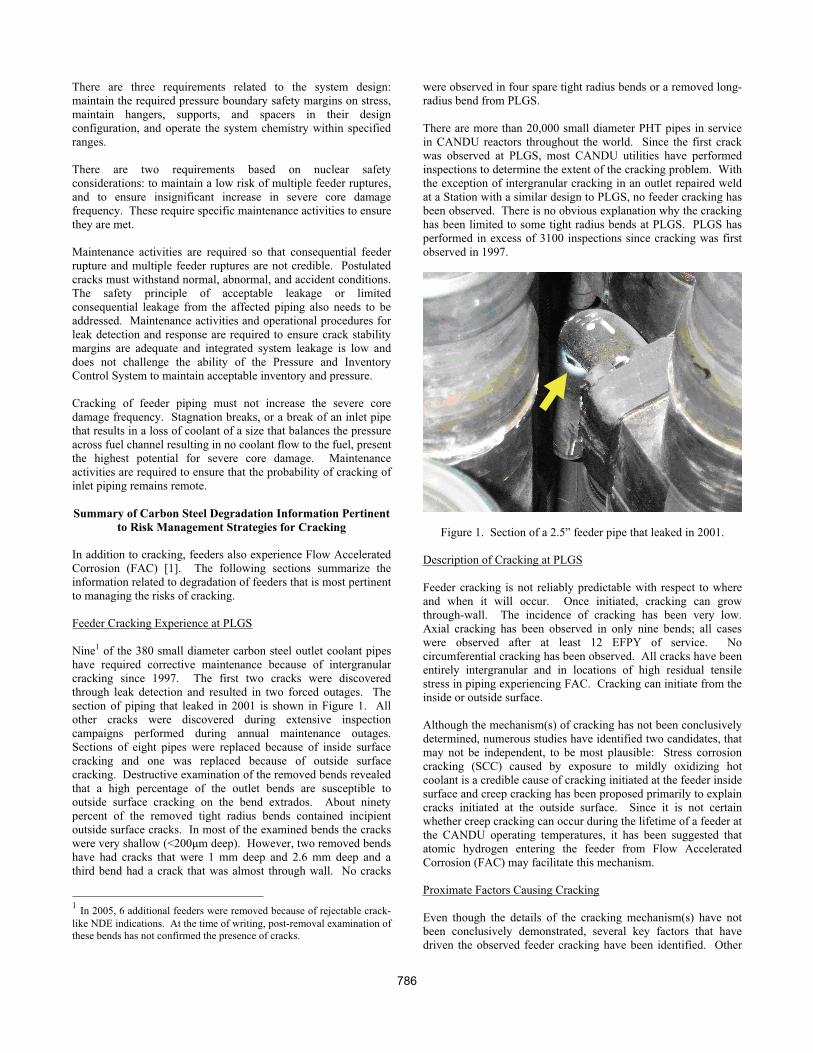
There are three requirements related to the system design: maintain the required pressure boundary safety margins on stress, maintain hangers, supports, and spacers in their design configuration, and operate the system chemistry within specified ranges.
There are two requirements based on nuclear safety considerations: to maintain a low risk of multiple feeder ruptures, and to ensure insignificant increase in severe core damage frequency. These require specific maintenance activities to ensure they are met.
Maintenance activities are required so that consequential feeder rupture and multiple feeder ruptures are not credible. Postulated cracks must withstand normal, abnormal, and accident conditions. The safety principle of acceptable leakage or limited consequential leakage from the affected piping also needs to be addressed. Maintenance activities and operational procedures for leak detection and response are required to ensure crack stability margins are adequate and integrated system leakage is low and does not challenge the ability of the Pressure and Inventory Control System to maintain acceptable inventory and pressure.
Cracking of feeder piping must not increase the severe core damage frequency. Stagnation breaks, or a break of an inlet pipe that results in a loss of coolant of a size that balances the pressure across fuel channel resulting in no coolant flow to the fuel, present the highest potential for severe core damage. Maintenance activities are required to ensure that the probability of cracking of inlet piping remains remote.
Summary of Carbon Steel Degradation Information Pertinent to Risk Management Strategies for Cracking
In addition to cracking, feeders also experience Flow Accelerated Corrosion (FAC) [1]. The following sections summarize the information related to degradation of feeders that is most pertinent to managing the risks of cracking.
Feeder Cracking Experience at PLGS
Nine1 of the 380 small diameter carbon steel outlet coolant pipes have required corrective maintenance because of intergranular cracking since 1997. The first two cracks were discovered through leak detection and resulted in two forced outages. The section of piping that leaked in 2001 is shown in Figure 1. All other cracks were discovered during extensive inspection campaigns performed during annual maintenance outages. Sections of eight pipes were replaced because of inside surface cracking and one was replaced because of outside surface cracking. Destructive examination of the removed bends revealed that a high percentage of the outlet bends are susceptible to outside surface cracking on the bend extrados. About ninety percent of the removed tight radius bends contained incipient outside surface cracks. In most of the examined bends the cracks were very shallow (<200μm deep). However, two removed bends have had cracks that were 1 mm deep and 2.6 mm deep and a third bend had a crack that was almost through wall. No cracks
1 In 2005, 6 additional feeders were removed because of rejectable crack-like NDE indications. At the time of writing, post-removal examination of these bends has not confirmed the presence of cracks.
were observed in four spare tight radius bends or a removed long-radius bend from PLGS.
There are more than 20,000 small diameter PHT pipes in service in CANDU reactors throughout the world. Since the first crack was observed at PLGS, most CANDU utilities have performed inspections to determine the extent of the cracking problem. With the exception of intergranular cracking in an outlet repaired weld at a Station with a similar design to PLGS, no feeder cracking has been observed. There is no obvious explanation why the cracking has been limited to some tight radius bends at PLGS. PLGS has performed in excess of 3100 inspections since cracking was first observed in 1997.
Figure 1. Section of a 2.5” feeder pipe that leaked in 2001.
Description of Cracking at PLGS
Feeder cracking is not reliably predictable with respect to where and when it will occur. Once initiated, cracking can grow through-wall. The incidence of cracking has been very low. Axial cracking has been observed in only nine bends; all cases were observed after at least 12 EFPY of service. No circumferential cracking has been observed. All cracks have been entirely intergranular and in locations of high residual tensile stress in piping experiencing FAC. Cracking can initiate from the inside or outside surface.
Although the mechanism(s) of cracking has not been conclusively determined, numerous studies have identified two candidates, that may not be independent, to be most plausible: Stress corrosion cracking (SCC) caused by exposure to mildly oxidizing hot coolant is a credible cause of cracking initiated at the feeder inside surface and creep cracking has been proposed primarily to explain cracks initiated at the outside surface. Since it is not certain whether creep cracking can occur during the lifetime of a feeder at the CANDU operating temperatures, it has been suggested that atomic hydrogen entering the feeder from Flow Accelerated Corrosion (FAC) may facilitate this mechanism.
Proximate Factors Causing Cracking
Even though the details of the cracking mechanism(s) have not been conclusively demonstrated, several key factors that have driven the observed feeder cracking have been identified. Other
786
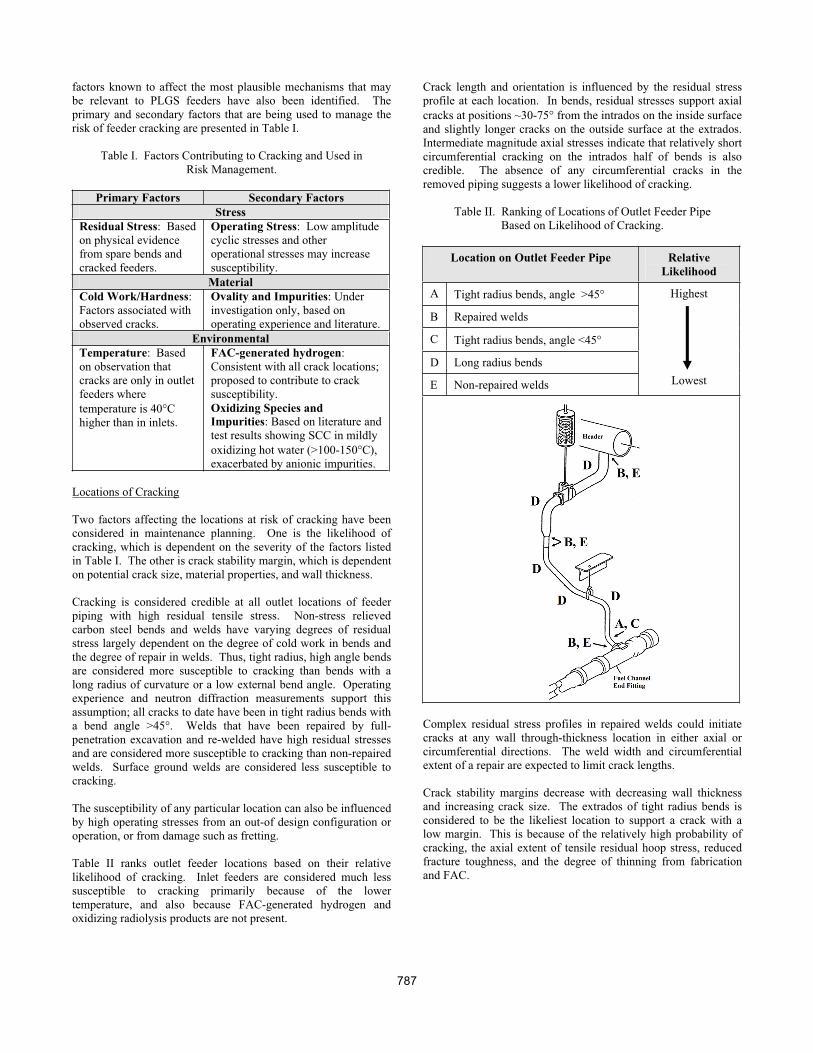
factors known to affect the most plausible mechanisms that may be relevant to PLGS feeders have also been identified. The primary and secondary factors that are being used to manage the risk of feeder cracking are presented in Table I.
Table I. Factors Contributing to Cracking and Used in Risk Management.
Primary Factors Secondary Factors Stress
Residual Stress: Based on physical evidence from spare bends and cracked feeders.
Operating Stress: Low amplitude cyclic stresses and other operational stresses may increase susceptibility. Material
Cold Work/Hardness:Factors associated with observed cracks.
Ovality and Impurities: Under investigation only, based on operating experience and literature.
Environmental Temperature: Based on observation that cracks are only in outlet feeders where temperature is 40°Chigher than in inlets.
FAC-generated hydrogen:Consistent with all crack locations; proposed to contribute to crack susceptibility. Oxidizing Species and Impurities: Based on literature and test results showing SCC in mildly oxidizing hot water (>100-150°C), exacerbated by anionic impurities.
Locations of Cracking
Two factors affecting the locations at risk of cracking have been considered in maintenance planning. One is the likelihood of cracking, which is dependent on the severity of the factors listed in Table I. The other is crack stability margin, which is dependent on potential crack size, material properties, and wall thickness.
Cracking is considered credible at all outlet locations of feeder piping with high residual tensile stress. Non-stress relieved carbon steel bends and welds have varying degrees of residual stress largely dependent on the degree of cold work in bends and the degree of repair in welds. Thus, tight radius, high angle bends are considered more susceptible to cracking than bends with a long radius of curvature or a low external bend angle. Operating experience and neutron diffraction measurements support this assumption; all cracks to date have been in tight radius bends with a bend angle >45°. Welds that have been repaired by full-penetration excavation and re-welded have high residual stresses and are considered more susceptible to cracking than non-repaired welds. Surface ground welds are considered less susceptible to cracking.
The susceptibility of any particular location can also be influenced by high operating stresses from an out-of design configuration or operation, or from damage such as fretting.
Table II ranks outlet feeder locations based on their relative likelihood of cracking. Inlet feeders are considered much less susceptible to cracking primarily because of the lower temperature, and also because FAC-generated hydrogen and oxidizing radiolysis products are not present.
Crack length and orientation is influenced by the residual stress profile at each location. In bends, residual stresses support axial cracks at positions ~30-75° from the intrados on the inside surface and slightly longer cracks on the outside surface at the extrados. Intermediate magnitude axial stresses indicate that relatively short circumferential cracking on the intrados half of bends is also credible. The absence of any circumferential cracks in the removed piping suggests a lower likelihood of cracking.
Table II. Ranking of Locations of Outlet Feeder Pipe Based on Likelihood of Cracking.
Location on Outlet Feeder Pipe RelativeLikelihood
A Tight radius bends, angle >45°
B Repaired welds
C Tight radius bends, angle <45°
D Long radius bends
E Non-repaired welds
Highest
Lowest
Complex residual stress profiles in repaired welds could initiate cracks at any wall through-thickness location in either axial or circumferential directions. The weld width and circumferential extent of a repair are expected to limit crack lengths.
Crack stability margins decrease with decreasing wall thickness and increasing crack size. The extrados of tight radius bends is considered to be the likeliest location to support a crack with a low margin. This is because of the relatively high probability of cracking, the axial extent of tensile residual hoop stress, reduced fracture toughness, and the degree of thinning from fabrication and FAC.
787
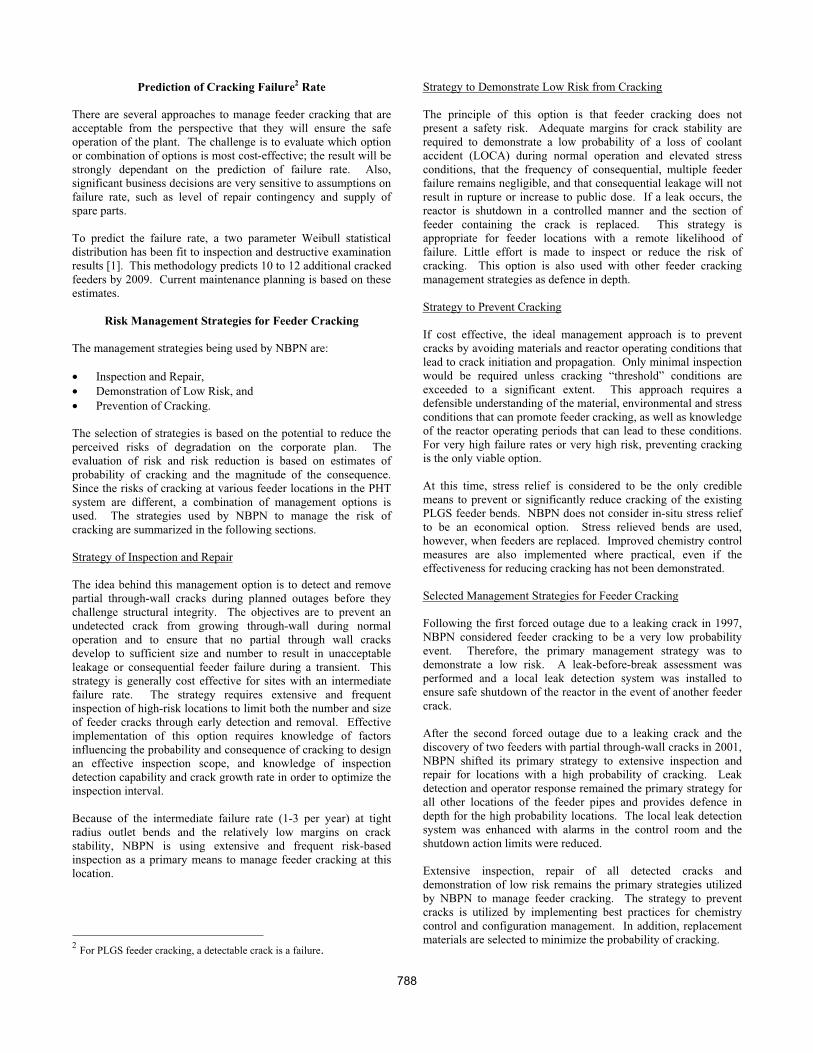
Prediction of Cracking Failure2 Rate
There are several approaches to manage feeder cracking that are acceptable from the perspective that they will ensure the safe operation of the plant. The challenge is to evaluate which option or combination of options is most cost-effective; the result will be strongly dependant on the prediction of failure rate. Also, significant business decisions are very sensitive to assumptions on failure rate, such as level of repair contingency and supply of spare parts.
To predict the failure rate, a two parameter Weibull statistical distribution has been fit to inspection and destructive examination results [1]. This methodology predicts 10 to 12 additional cracked feeders by 2009. Current maintenance planning is based on these estimates.
Risk Management Strategies for Feeder Cracking
The management strategies being used by NBPN are:
• Inspection and Repair, • Demonstration of Low Risk, and • Prevention of Cracking.
The selection of strategies is based on the potential to reduce the perceived risks of degradation on the corporate plan. The evaluation of risk and risk reduction is based on estimates of probability of cracking and the magnitude of the consequence. Since the risks of cracking at various feeder locations in the PHT system are different, a combination of management options is used. The strategies used by NBPN to manage the risk of cracking are summarized in the following sections.
Strategy of Inspection and Repair
The idea behind this management option is to detect and remove partial through-wall cracks during planned outages before they challenge structural integrity. The objectives are to prevent an undetected crack from growing through-wall during normal operation and to ensure that no partial through wall cracks develop to sufficient size and number to result in unacceptable leakage or consequential feeder failure during a transient. This strategy is generally cost effective for sites with an intermediate failure rate. The strategy requires extensive and frequent inspection of high-risk locations to limit both the number and size of feeder cracks through early detection and removal. Effective implementation of this option requires knowledge of factors influencing the probability and consequence of cracking to design an effective inspection scope, and knowledge of inspection detection capability and crack growth rate in order to optimize the inspection interval.
Because of the intermediate failure rate (1-3 per year) at tight radius outlet bends and the relatively low margins on crack stability, NBPN is using extensive and frequent risk-based inspection as a primary means to manage feeder cracking at this location.
2 For PLGS feeder cracking, a detectable crack is a failure.
Strategy to Demonstrate Low Risk from Cracking
The principle of this option is that feeder cracking does not present a safety risk. Adequate margins for crack stability are required to demonstrate a low probability of a loss of coolant accident (LOCA) during normal operation and elevated stress conditions, that the frequency of consequential, multiple feeder failure remains negligible, and that consequential leakage will not result in rupture or increase to public dose. If a leak occurs, the reactor is shutdown in a controlled manner and the section of feeder containing the crack is replaced. This strategy is appropriate for feeder locations with a remote likelihood of failure. Little effort is made to inspect or reduce the risk of cracking. This option is also used with other feeder cracking management strategies as defence in depth.
Strategy to Prevent Cracking
If cost effective, the ideal management approach is to prevent cracks by avoiding materials and reactor operating conditions that lead to crack initiation and propagation. Only minimal inspection would be required unless cracking “threshold” conditions are exceeded to a significant extent. This approach requires a defensible understanding of the material, environmental and stress conditions that can promote feeder cracking, as well as knowledge of the reactor operating periods that can lead to these conditions. For very high failure rates or very high risk, preventing cracking is the only viable option.
At this time, stress relief is considered to be the only credible means to prevent or significantly reduce cracking of the existing PLGS feeder bends. NBPN does not consider in-situ stress relief to be an economical option. Stress relieved bends are used, however, when feeders are replaced. Improved chemistry control measures are also implemented where practical, even if the effectiveness for reducing cracking has not been demonstrated.
Selected Management Strategies for Feeder Cracking
Following the first forced outage due to a leaking crack in 1997, NBPN considered feeder cracking to be a very low probability event. Therefore, the primary management strategy was to demonstrate a low risk. A leak-before-break assessment was performed and a local leak detection system was installed to ensure safe shutdown of the reactor in the event of another feeder crack.
After the second forced outage due to a leaking crack and the discovery of two feeders with partial through-wall cracks in 2001, NBPN shifted its primary strategy to extensive inspection and repair for locations with a high probability of cracking. Leak detection and operator response remained the primary strategy for all other locations of the feeder pipes and provides defence in depth for the high probability locations. The local leak detection system was enhanced with alarms in the control room and the shutdown action limits were reduced.
Extensive inspection, repair of all detected cracks and demonstration of low risk remains the primary strategies utilized by NBPN to manage feeder cracking. The strategy to prevent cracks is utilized by implementing best practices for chemistry control and configuration management. In addition, replacement materials are selected to minimize the probability of cracking.
788
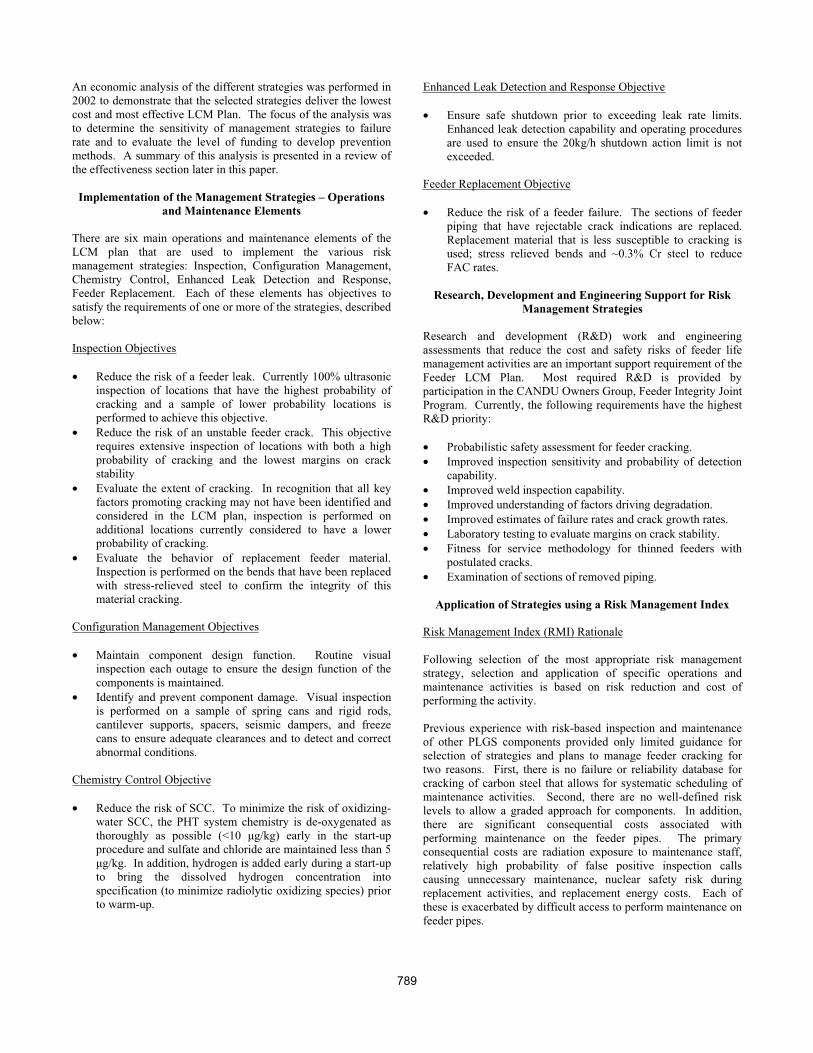
An economic analysis of the different strategies was performed in 2002 to demonstrate that the selected strategies deliver the lowest cost and most effective LCM Plan. The focus of the analysis was to determine the sensitivity of management strategies to failure rate and to evaluate the level of funding to develop prevention methods. A summary of this analysis is presented in a review of the effectiveness section later in this paper.
Implementation of the Management Strategies – Operations and Maintenance Elements
There are six main operations and maintenance elements of the LCM plan that are used to implement the various risk management strategies: Inspection, Configuration Management, Chemistry Control, Enhanced Leak Detection and Response, Feeder Replacement. Each of these elements has objectives to satisfy the requirements of one or more of the strategies, described below:
Inspection Objectives
• Reduce the risk of a feeder leak. Currently 100% ultrasonic inspection of locations that have the highest probability of cracking and a sample of lower probability locations is performed to achieve this objective.
• Reduce the risk of an unstable feeder crack. This objective requires extensive inspection of locations with both a high probability of cracking and the lowest margins on crack stability
• Evaluate the extent of cracking. In recognition that all key factors promoting cracking may not have been identified and considered in the LCM plan, inspection is performed on additional locations currently considered to have a lower probability of cracking.
• Evaluate the behavior of replacement feeder material. Inspection is performed on the bends that have been replaced with stress-relieved steel to confirm the integrity of this material cracking.
Configuration Management Objectives
• Maintain component design function. Routine visual inspection each outage to ensure the design function of the components is maintained.
• Identify and prevent component damage. Visual inspection is performed on a sample of spring cans and rigid rods, cantilever supports, spacers, seismic dampers, and freeze cans to ensure adequate clearances and to detect and correct abnormal conditions.
Chemistry Control Objective
• Reduce the risk of SCC. To minimize the risk of oxidizing-water SCC, the PHT system chemistry is de-oxygenated as thoroughly as possible (<10 μg/kg) early in the start-up procedure and sulfate and chloride are maintained less than 5 μg/kg. In addition, hydrogen is added early during a start-up to bring the dissolved hydrogen concentration into specification (to minimize radiolytic oxidizing species) prior to warm-up.
Enhanced Leak Detection and Response Objective
• Ensure safe shutdown prior to exceeding leak rate limits. Enhanced leak detection capability and operating procedures are used to ensure the 20kg/h shutdown action limit is not exceeded.
Feeder Replacement Objective
• Reduce the risk of a feeder failure. The sections of feeder piping that have rejectable crack indications are replaced. Replacement material that is less susceptible to cracking is used; stress relieved bends and ~0.3% Cr steel to reduce FAC rates.
Research, Development and Engineering Support for Risk Management Strategies
Research and development (R&D) work and engineering assessments that reduce the cost and safety risks of feeder life management activities are an important support requirement of the Feeder LCM Plan. Most required R&D is provided by participation in the CANDU Owners Group, Feeder Integrity Joint Program. Currently, the following requirements have the highest R&D priority:
• Probabilistic safety assessment for feeder cracking. • Improved inspection sensitivity and probability of detection
capability. • Improved weld inspection capability. • Improved understanding of factors driving degradation. • Improved estimates of failure rates and crack growth rates. • Laboratory testing to evaluate margins on crack stability. • Fitness for service methodology for thinned feeders with
postulated cracks. • Examination of sections of removed piping.
Application of Strategies using a Risk Management Index
Risk Management Index (RMI) Rationale
Following selection of the most appropriate risk management strategy, selection and application of specific operations and maintenance activities is based on risk reduction and cost of performing the activity.
Previous experience with risk-based inspection and maintenance of other PLGS components provided only limited guidance for selection of strategies and plans to manage feeder cracking for two reasons. First, there is no failure or reliability database for cracking of carbon steel that allows for systematic scheduling of maintenance activities. Second, there are no well-defined risk levels to allow a graded approach for components. In addition, there are significant consequential costs associated with performing maintenance on the feeder pipes. The primary consequential costs are radiation exposure to maintenance staff, relatively high probability of false positive inspection calls causing unnecessary maintenance, nuclear safety risk during replacement activities, and replacement energy costs. Each of these is exacerbated by difficult access to perform maintenance on feeder pipes.
789

An approach to evaluate the potential risk reduction and the consequential costs of specific activities was needed to assist in the decision making on activities to form the feeder LCM plan. A Risk Management Index (RMI) was developed to rank maintenance activities on components of the feeder piping to obtain the optimum reduction in risk. The RMI levels and rationale are described in Table III. Evaluation to determine the RMI level of an activity on a component requires knowledge of the probability of cracking, consequence of failure, potential for the activity to reduce the risk, and the consequential costs associated with the activity.
RMI Levels of Selected Inspection Activities
The feeder cracking inspection scope has increased since the first crack occurred in 1997, Table IV. The primary reason for the increase is that inspection provides significant risk reduction, cost effectively. The basis for the RMI ranking for the selected inspection activities is briefly described in this section.
Ultrasonic inspection of tight radius bends with a bend angle >45° on outlet feeders (location A, Table II) was ranked as RMI 1. Based on experience and performance demonstration, ultrasonic inspection can reliably detect cracks before they challenge structural integrity. This location provides opportunity for a high-risk reduction because it has the highest risk from cracking due to the relatively high likelihood of cracking and low margins on crack stability. This location also has relatively easy access for ultrasonic inspection which results in reasonable consequential costs. The most significant consequential cost for inspection is unnecessary maintenance arising from a relatively high probability of false positive calls. Feeders can be rejected based on ultrasonic signals that are just marginally above noise levels.
Eddy current inspection of the extrados outside surface of tight radius bends with the thinnest wall thickness on outlet feeders (location A, Table II) was ranked as RMI 1. This inspection supplements the ultrasonic inspection and is used to improve the probability of detection and increases the risk reduction for this location. The access for eddy current inspection is better than ultrasonic inspection and is faster resulting in relatively low costs to perform this activity.
Ultrasonic inspection of tight radius bends with a bend angle <45° on outlet feeders (location C, Table II) was ranked as RMI 2. This location is considered to have a lower likelihood of cracking than the bends that have an angle >45° because of less severe proximate factors, in particular cold work. As a result, the opportunity for risk-reduction is considered to be not as great but the consequential costs are about the same.
Ultrasonic inspection of long-radius bends (location D, Table II) and repaired welds (location B, Table II) on outlet feeders was ranked as RMI 3. These locations have a lower likelihood of cracking and acceptable margins on crack stability, therefore inspection does not significantly reduce the risk. Further, most of these locations are very difficult to access for inspection and repair, therefore consequential costs are very high.
Ultrasonic inspection of tight radius outlet bends (location A, Table II) that have been replaced with less susceptible material, tight radius bends on inlet feeders (location A, Table II), and repaired welds on inlet feeders are ranked as RMI 4. Each of these locations has a low or very low likelihood of cracking, therefore the potential for risk reduction by inspection methods is very limited. Some inspection is performed but is justified by reasons other than risk reduction. On-going monitoring of inlet feeder locations is justified primarily to address concerns related to our incomplete understanding of the mechanism of cracking.
Table III. RMI Levels used for Decision-Making for Risk-Based Inspection and Maintenance of Feeders
Risk Management Index (RMI) RMI Criteria Criteria Met by One or More of the Following:
High risk reduction Relatively high probability of an unacceptable condition, high predicted failure rate, inadequate margins to demonstrate acceptable consequence of failure. 1
Reasonable consequential cost Relatively easy maintenance access.
Low to moderate risk reduction Lower probability of an unacceptable condition, lower predicted failure rate based on less severe proximate factors or positive operating experience, margins to demonstrate acceptable consequence of failure deemed adequate. 2
Reasonable consequential cost Relatively easy maintenance access.
Low to moderate risk reduction Lower probability of an unacceptable condition, lower predicted failure rate based on less severe proximate factors or positive operating experience, margins to demonstrate acceptable consequence of failure deemed adequate. 3
High consequential cost Difficult maintenance access, high radiation fields
Low to very low risk reduction Very low or low probability of an unacceptable condition or predicted failure rate based on the absence of, or much less severe proximate factors and/or positive operating experience.
4Cost justified by another benefit.
E.g. stakeholder confidence, technique development, or mechanistic understanding.
790
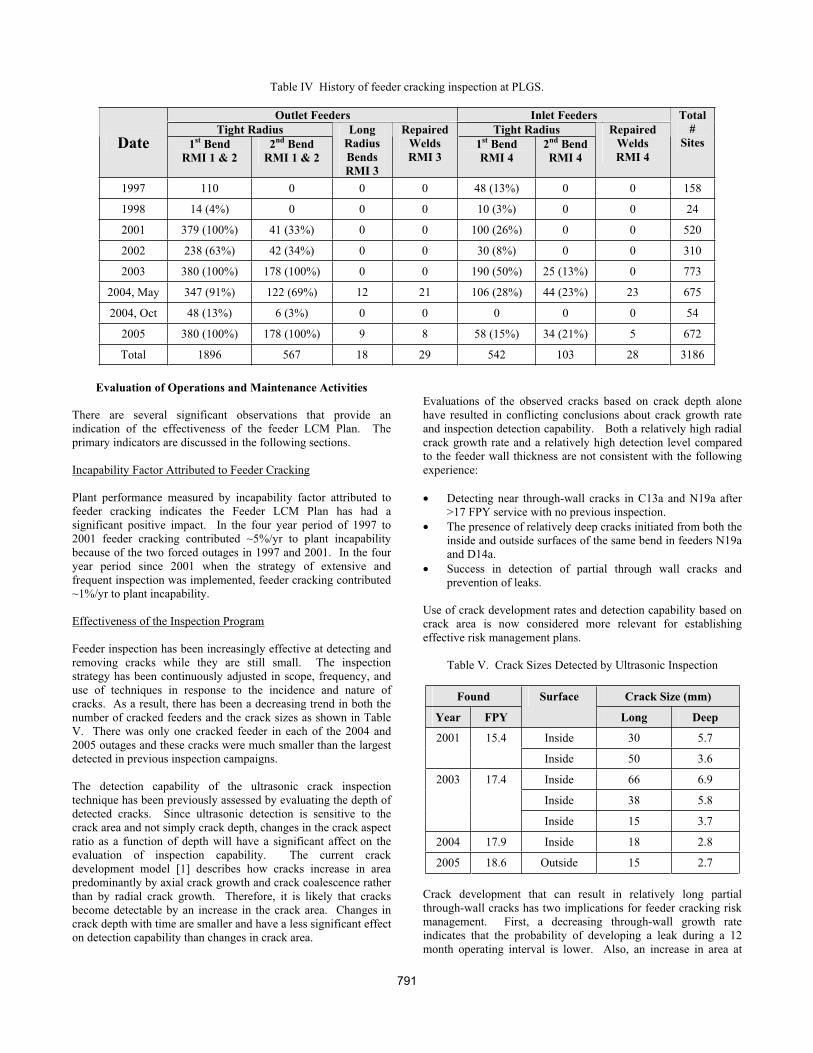
Table IV History of feeder cracking inspection at PLGS.
Outlet Feeders Inlet Feeders Tight Radius Tight Radius
Date 1st Bend RMI 1 & 2
2nd Bend RMI 1 & 2
LongRadiusBends RMI 3
Repaired WeldsRMI 3
1st Bend RMI 4
2nd Bend RMI 4
Repaired WeldsRMI 4
Total#
Sites
1997 110 0 0 0 48 (13%) 0 0 158
1998 14 (4%) 0 0 0 10 (3%) 0 0 24
2001 379 (100%) 41 (33%) 0 0 100 (26%) 0 0 520
2002 238 (63%) 42 (34%) 0 0 30 (8%) 0 0 310
2003 380 (100%) 178 (100%) 0 0 190 (50%) 25 (13%) 0 773
2004, May 347 (91%) 122 (69%) 12 21 106 (28%) 44 (23%) 23 675
2004, Oct 48 (13%) 6 (3%) 0 0 0 0 0 54
2005 380 (100%) 178 (100%) 9 8 58 (15%) 34 (21%) 5 672
Total 1896 567 18 29 542 103 28 3186
Evaluation of Operations and Maintenance Activities
There are several significant observations that provide an indication of the effectiveness of the feeder LCM Plan. The primary indicators are discussed in the following sections.
Incapability Factor Attributed to Feeder Cracking
Plant performance measured by incapability factor attributed to feeder cracking indicates the Feeder LCM Plan has had a significant positive impact. In the four year period of 1997 to 2001 feeder cracking contributed ~5%/yr to plant incapability because of the two forced outages in 1997 and 2001. In the four year period since 2001 when the strategy of extensive and frequent inspection was implemented, feeder cracking contributed ~1%/yr to plant incapability.
Effectiveness of the Inspection Program
Feeder inspection has been increasingly effective at detecting and removing cracks while they are still small. The inspection strategy has been continuously adjusted in scope, frequency, and use of techniques in response to the incidence and nature of cracks. As a result, there has been a decreasing trend in both the number of cracked feeders and the crack sizes as shown in Table V. There was only one cracked feeder in each of the 2004 and 2005 outages and these cracks were much smaller than the largest detected in previous inspection campaigns.
The detection capability of the ultrasonic crack inspection technique has been previously assessed by evaluating the depth of detected cracks. Since ultrasonic detection is sensitive to the crack area and not simply crack depth, changes in the crack aspect ratio as a function of depth will have a significant affect on the evaluation of inspection capability. The current crack development model [1] describes how cracks increase in area predominantly by axial crack growth and crack coalescence rather than by radial crack growth. Therefore, it is likely that cracks become detectable by an increase in the crack area. Changes in crack depth with time are smaller and have a less significant effect on detection capability than changes in crack area.
Evaluations of the observed cracks based on crack depth alone have resulted in conflicting conclusions about crack growth rate and inspection detection capability. Both a relatively high radial crack growth rate and a relatively high detection level compared to the feeder wall thickness are not consistent with the following experience:
• Detecting near through-wall cracks in C13a and N19a after >17 FPY service with no previous inspection.
• The presence of relatively deep cracks initiated from both the inside and outside surfaces of the same bend in feeders N19a and D14a.
• Success in detection of partial through wall cracks and prevention of leaks.
Use of crack development rates and detection capability based on crack area is now considered more relevant for establishing effective risk management plans.
Table V. Crack Sizes Detected by Ultrasonic Inspection
Found Crack Size (mm)
Year FPY
Surface
Long Deep
Inside 30 5.7 2001 15.4
Inside 50 3.6
Inside 66 6.9
Inside 38 5.8
2003 17.4
Inside 15 3.7
2004 17.9 Inside 18 2.8
2005 18.6 Outside 15 2.7
Crack development that can result in relatively long partial through-wall cracks has two implications for feeder cracking risk management. First, a decreasing through-wall growth rate indicates that the probability of developing a leak during a 12 month operating interval is lower. Also, an increase in area at
791
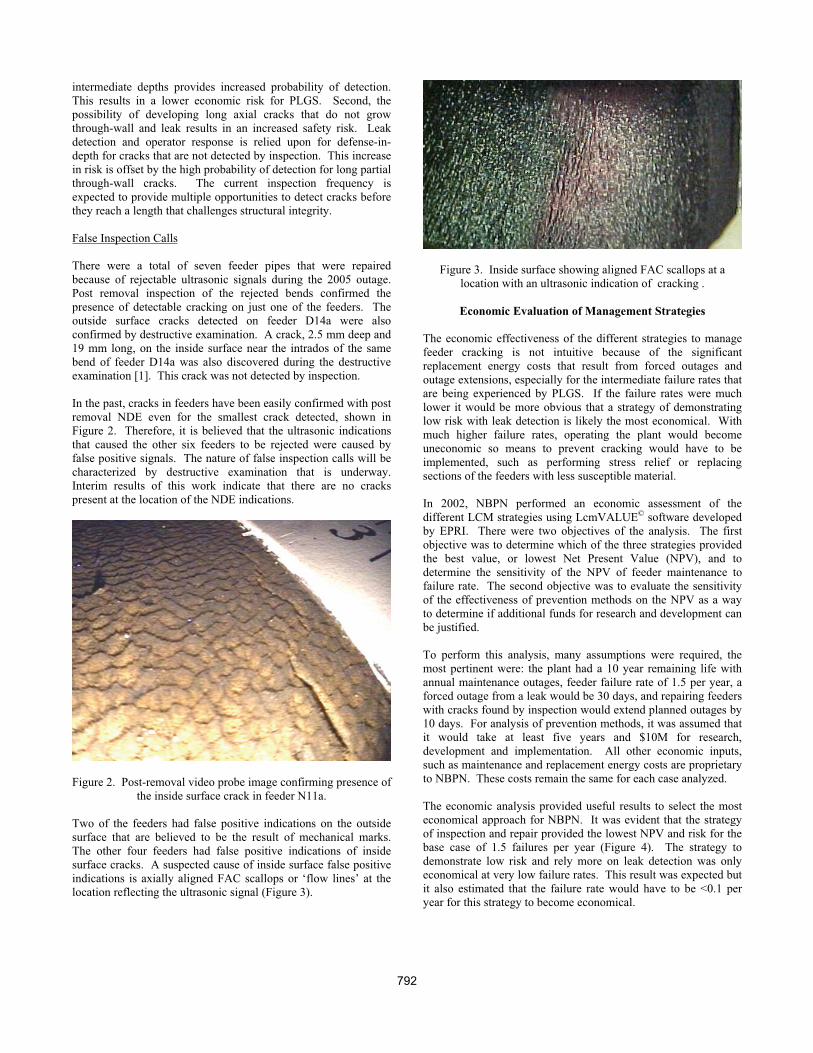
intermediate depths provides increased probability of detection. This results in a lower economic risk for PLGS. Second, the possibility of developing long axial cracks that do not grow through-wall and leak results in an increased safety risk. Leak detection and operator response is relied upon for defense-in-depth for cracks that are not detected by inspection. This increase in risk is offset by the high probability of detection for long partial through-wall cracks. The current inspection frequency is expected to provide multiple opportunities to detect cracks before they reach a length that challenges structural integrity.
False Inspection Calls
There were a total of seven feeder pipes that were repaired because of rejectable ultrasonic signals during the 2005 outage. Post removal inspection of the rejected bends confirmed the presence of detectable cracking on just one of the feeders. The outside surface cracks detected on feeder D14a were also confirmed by destructive examination. A crack, 2.5 mm deep and 19 mm long, on the inside surface near the intrados of the same bend of feeder D14a was also discovered during the destructive examination [1]. This crack was not detected by inspection.
In the past, cracks in feeders have been easily confirmed with post removal NDE even for the smallest crack detected, shown in Figure 2. Therefore, it is believed that the ultrasonic indications that caused the other six feeders to be rejected were caused by false positive signals. The nature of false inspection calls will be characterized by destructive examination that is underway. Interim results of this work indicate that there are no cracks present at the location of the NDE indications.
Figure 2. Post-removal video probe image confirming presence of the inside surface crack in feeder N11a.
Two of the feeders had false positive indications on the outside surface that are believed to be the result of mechanical marks. The other four feeders had false positive indications of inside surface cracks. A suspected cause of inside surface false positive indications is axially aligned FAC scallops or ‘flow lines’ at the location reflecting the ultrasonic signal (Figure 3).
Figure 3. Inside surface showing aligned FAC scallops at a location with an ultrasonic indication of cracking .
Economic Evaluation of Management Strategies
The economic effectiveness of the different strategies to manage feeder cracking is not intuitive because of the significant replacement energy costs that result from forced outages and outage extensions, especially for the intermediate failure rates that are being experienced by PLGS. If the failure rates were much lower it would be more obvious that a strategy of demonstrating low risk with leak detection is likely the most economical. With much higher failure rates, operating the plant would become uneconomic so means to prevent cracking would have to be implemented, such as performing stress relief or replacing sections of the feeders with less susceptible material.
In 2002, NBPN performed an economic assessment of the different LCM strategies using LcmVALUE© software developed by EPRI. There were two objectives of the analysis. The first objective was to determine which of the three strategies provided the best value, or lowest Net Present Value (NPV), and to determine the sensitivity of the NPV of feeder maintenance to failure rate. The second objective was to evaluate the sensitivity of the effectiveness of prevention methods on the NPV as a way to determine if additional funds for research and development can be justified.
To perform this analysis, many assumptions were required, the most pertinent were: the plant had a 10 year remaining life with annual maintenance outages, feeder failure rate of 1.5 per year, a forced outage from a leak would be 30 days, and repairing feeders with cracks found by inspection would extend planned outages by 10 days. For analysis of prevention methods, it was assumed that it would take at least five years and $10M for research, development and implementation. All other economic inputs, such as maintenance and replacement energy costs are proprietary to NBPN. These costs remain the same for each case analyzed.
The economic analysis provided useful results to select the most economical approach for NBPN. It was evident that the strategy of inspection and repair provided the lowest NPV and risk for the base case of 1.5 failures per year (Figure 4). The strategy to demonstrate low risk and rely more on leak detection was only economical at very low failure rates. This result was expected but it also estimated that the failure rate would have to be <0.1 per year for this strategy to become economical.
792

0
10
20
30
40
50
60
0% 20% 40% 60% 80% 100% 120% 140%Predicted Failure Rate (% of Base Case, 1.5 per year)
Net
Pre
sent
Val
ue ($
M)
Inspection
Leak Detection
Prevention
Figure 4. Sensitivity of the management strategies to failure rate.
The NPV for inspection was marginally lower than for developing crack prevention methods. Developing prevention methods becomes more attractive with failure rates greater than 3 per year. However, additional aspects of this strategy need to be considered. One of the most important considerations is the sensitivity of the effectiveness of the prevention method on NPV, Figure 5. This analysis indicates that there is a diminishing return on investment in crack prevention beyond a factor of 10 reduction in failure rate. This strategy is also considered to have a high risk because of uncertainties about the cracking mechanism and our inability to make reliable estimates of the reduction in failure rate that can be achieved.
The results of the analysis supported NBPN decisions to implement extensive inspection and to not embark on an aggressive research and development program to develop prevention methods.
0
10
20
30
40
50
60
0 10 20 30 40 50Predicted Failure Rate Reduction Factor
Net
Pre
sent
Val
ue ($
M)
Figure 5. Sensitivity of the effectiveness of a prevention method to NPV.
Future Direction for Feeder Cracking Risk Management
The future direction for risk management of feeder cracking depends strongly on NBPN’s corporate plans for PLGS. PLGS is planning to undergo a major 18 month refurbishment Outage starting in April 2008. The refurbishment plans include replacement of the feeder pipes with material that is less
susceptible to FAC and cracking. Following refurbishment, the risk management strategies will revert back to standard maintenance practices. The period leading up to refurbishment will require NBPN to continue to be aggressive with its risk management strategies for feeder cracking. The main focus areas for the short-term direction are as follows:
1. Probabilistic Safety Assessment: Probabilistic safety assessment methods are being implemented to demonstrate safe operation and to develop inspection plans and focus research and engineering activities. The assessment will include all credible degradation mechanisms for the feeder system. The implementation of probabilistic methods is important to allow more effective operability assessments that are required when there is a change to a single parameter or assumption as a result of operating experience, e.g. changes in the inspection detection capability or a material property.
2. Reduce the Probability of False Inspection Calls:Improvements to inspection techniques, verification methods, training, and evaluation logic are likely outcomes of an investigation that is currently underway to reduce the incidence of false calls in the future.
3. Industry Consistent Feeder LCM Planning: NBPN is participating in an industry initiative to develop LCM planning methods that utilize consistent risk management strategies and to provide opportunities to integrate information from other Utilities.
Acknowledgement
The authors would like to acknowledge Bill Rankin’s contribution to the development of the RMI.
References
1. J.P. Slade and T.S. Gendron, “Flow Accelerated Corrosion and Cracking of Carbon Steel Piping in Primary Water – Operating Experience at the Point Lepreau Generating Station”, to be presented at the 12th International Conference on Environmental Degradation of Materials in Nuclear Power Systems-Water Reactors, Salt Lake City, USA, TMS, August 14-18, 2005.
2. J.P. Slade and T.S. Gendron, “Point Lepreau Feeder Life Cycle Management Plan – 2005”, (Report IR-33126-32, Revision 0, Point Lepreau Generating Station, April 15, 2005).
793

Session Name: Operational Experience - I
Session Day/Time: Tuesday 8/16, 10:30am - noon
Risk-Reduction Strategies Used to Manage Cracking of Carbon Piping at the Point Lepreau Generating StationPresenter: John P. Slade
Name of Person Asking Question: David Tice
Affiliation of Person Asking Question: Serco Assurance
Question: Do you know why feeder leaching(?) hasn’t occurred in other CANDU plants?
Response: Many of the other plants have feeder elbows formed by different processes which result in lower cold work and residual stress. The most recent plants have stressed relieved bends. Of the plants with bends manufactured by similar means, no obvious operating difference has been identified. Point Lepream feeders have a high free N content. That may be unique among CANDU feeders and a possible explanation for the unique UPEX.
Name of Person Asking Question: Peter Ford
Affiliation of Person Asking Question: GE-GRC (retired)
Question: As Armin Roth mentioned in his question to Tracy, IGSCC is quite unusual in high-temperature oxygenated water. If IG impurities have been ruled out, the only other possibility (that I can think of) is ripple loading on top of the high residual stress. This may be caused by e.g. flow induced vibration (FIV), and if this is the case then it must be part of the management strategy. For instance, if you change your operational mode that increases FIV, then your current management strategy based on a failure rate of 1-2/year may be incomplete. Have you though of this?
Response: Secondary loads such as “ripple loads” have been considered and are believed to be only secondary factors that contribute to cracking. The extensive and frequent inspection will detect changes in the failure rate and maintenance plans will be revised based on updated predictions of failure rate.
794

CMD 11-H12.33A
File / dossier : 6.01.07 Date: 2011-11-17 Edocs: 3841118
Supplementary Information Submission from CCNB Action, Saint John Fundy Chapter In the Matter of New Brunswick Power Nuclear
Renseignements supplémentaires Mémoire du CCNB Action, section Saint John Fundy À l’égard de Énergie nucléaire du Nouveau-Brunswick
Request for Approval to Reload Fuel and Restart Point Lepreau Nuclear Generating Station, and Application to renew the Power Reactor Operating licence for the Point Lepreau Generating Station
Demande concernant l’autorisation de recharger le combustible et redémarrer la centrale nucléaire de Point Lepreau, et demande concernant le renouvellement du permis d’exploitation délivré pour la centrale nucléaire de Point Lepreau
Public Hearing Day Two December 1 and 2, 2011
Deuxième jour de l’audience publique Les 1er et 2 décembre 2011

Nov 16 2011
Re: Clarifications of CMD 11-12.33
Below are some formatting and a couple of typos in our CMD document CMD 11-12.33. Please
accept this as supplementary information to make our intervention more complete.
Page 8 Operating Performance there was a typo the paragraph should read
The operating performance of Point Lepreau in the past has not been great. They have
had to shut the plant down early and go through this expensive and risky refurbishment early in
the lifecycle of the Plant. Because this is a first of a kind refurbishment the operating
performance in the future will not likely be optimal.
Page 12 the reference is over these two paragraphs
Please Note that NB Powers Name is on the report. We find it quite hard to believe that they did
not know about this or if they just chose not to use this.
Also from a document obtained from the CNSC website acknowledging that the regulator was
well aware of this document, and even did a study to attest to the reliability of the document.
Please see below.
Page 14 the reference is over this paragraph
Please note the reference above about the longer-term value of the report, which it seems, has
been ignored.
Page 18 we made a reference to Greg Rzentkowski that was a typo that we would like to take
out. The bottom paragraph should read
Now to discuss the RLE for the level 2 (Large Early Release) PSA based SMA. NB Power has
chosen .4g for an earthquake with a probability of 1 in 100,000 years. We will show below using
information from the OPEN FILE 2929, NRCan Data, the 1984 report that NB Power used, to
show that this number is grossly underestimated.
The next two documents are reports from Mr. Michel Duguay and Mr. Raphael Shay.
New considerations concerning Point Lepreau refurbishment
Michel Duguay, 14 November
Summary
A new event in the field of seismic hazards affecting nuclear reactors has been the series of nuclear accidents in Fukushima following a 9.0-magnitude earthquake on March 11th 2011. One lesson that several seismologists have drawn from this event is that an earthquake happened which had a magnitude 0.6 higher than the strongest earthquakes recorded near Japan in the last 50 years. These seismologists have decided to revise their models upwards as far as maximum magnitudes are concerned. Another lesson that the dire consequences of the Fukushima catastrophe taught is that it is now widely seen as imperative to take more precautions than heretofore in order to prevent serious nuclear accidents and to cope with them should they occur. Along this line of thought the Canadian Nuclear Safety Commission (CNSC) published in October 2011 document INFO-0824 in which they put a very large emphasis on how to deal with the consequences of a serious nuclear accident.
Fukushima also moved Canadian public opinion in the direction of majority opposition to new investments in nuclear power. In this paper we present arguments that favor the choice of not operating a refurbished CANDU nuclear reactor as the safest option. In applying the Fukushima lessons to CANDU nuclear reactors, the aging problems of the high-pressure tubes must be taken into account. Various degradation phenomena cause the walls of pressure tubes to thin out and to change composition in a way that renders them more brittle. The fact is that in August 1983 a high-pressure zirconium-niobium alloy tube suddenly burst in the Pickering 2 nuclear reactor near Toronto; this is a clear signal that a significant earthquake could cause one or more degraded pressure tubes to burst and lead to a serious nuclear accident.
A great fear of nuclear reactor operators is a loss-of-coolant accident (acronym LOCA), and a greater fear is the so-called ‘’large-break loss-of-coolant accident’’ (acronym LBLOCA). On page 22 of INFO-0824 the CNSC recognizes that an earthquake could cause a ‘’small-break loss-of-coolant accident’’. We will argue here that an earthquake could cause an LBLOCA. One reason for this is that a small-break LOCA can lead to uranium fuel channel meltdown, which can propagate in the core through a cascading effect and lead to the loss of the moderator heavy water. Following this loss, a large fraction of the core will subsequently melt down so that one will get into a Fukushima-type situation.

Another reason that an LBLOCA is a credible possibility is that the CNSC now specifies that a nuclear reactor must be able to survive a significant earthquake that has a 10 000-year return frequency. For Point Lepreau this means an earthquake with a peak ground acceleration (PGA) of about 0.4 g (i.e. 40% of the gravity g), a figure that is substantially higher than what the reactor was designed in the 1970’s to resist, namely 0.18 g. A recent letter by CNSC Director General Greg Rzentkowski states that calculations by Hydro-Québec (H-Q) for Gentilly-2 indicate that an earthquake with a PGA above 0.38 g could cause core damage. Since the Point Lepreau and Gentilly-2 CANDU reactors are nearly identical, this means that the Point Lepreau nuclear reactor has nearly zero safety margin in terms of earthquake resistance.
On the basis of CNSC documentation the paper will also explain how a sudden LOCA arising spontaneously as a result of various pressure tube degradation phenomena could also lead to a serious nuclear accident. Another phenomenon which could escalate to a serious accident is the gradual build-up of uranium fuel damage in the zirconium-niobium high-pressure tubes.
As far as seismic hazards are concerned and the risk of nuclear accidents, the present report will be based on calculations made available by the Geological Survey of Canada (GSC) which is part of Natural Resources Canada (NRCAN, web site www.nrcan.gc.ca), on expertise presented in the extensive Weston Geophysical Corporation’s report to the Attorney General of Canada in 1994 (Open File 2929 at NRCAN), on the exhaustive documentation of the CNSC , and on previous articles and letters by the author, many of which are available on the CNSC web site (www.nuclearsafety.gc.ca).
-1. Introduction
In the wake of the series of serious nuclear accidents at the Fukushima Daiichi power plant after March 11th 2011 several countries, including Germany, Switzerland, Italy and Belgium, have decided to phase out nuclear power in the coming years. In the nineteen sixties and seventies, a majority of public opinion in many industrial countries had favored the development of nuclear power. However, following the major nuclear accidents at Three Mile Island in 1979, Chernobyl in 1986, and Fukushima in 2011, public opinion has changed on this topic. In Canada a public opinion poll by Abacus
Data published on 1 April 2011 showed that a clear majority is opposed to new investments in nuclear reactors. In addition, many pronuclear groups in the world have become aware that major nuclear accidents need to be avoided with an increased level of precaution because a repetition of Three Mile Island, Chernobyl or Fukushima would probably bring about the complete demise of civilian nuclear power.
Given the change in Canadian public opinion concerning new investments in nuclear power, and given the increased level of international vigilance, one could reasonably expect that the Canadian Nuclear Safety Commission (CNSC) would fully uphold its mission as it was originally defined in the Nuclear Safety and Control Act of 1997 (NSCA 1997) whose Article 9 states:
‘’The objects of the Commission are:
-(a) to regulate the development, production and use of nuclear energy and the production, possession and use of nuclear substances, prescribed equipment and prescribed information in order to (i) prevent unreasonable risk, to the environment and to the health and safety of persons, associated with that development, production, possession or use, (ii) prevent unreasonable risk to national security associated with that development, production, possession or use, and (iii) achieve conformity with measures of control and international obligations to which Canada has agreed; and -(b)to disseminate objective scientific, technical and regulatory information to the public concerning the activities of the Commission and the effects, on the environment and on the health and safety of persons, of the development, production, possession and use referred to in paragraph (a).
The boundary condition adopted in the present report is that the term ‘unreasonable risk’ mentioned in the NSCA of 1997 is from the point of view of an objectively informed public; an insufficiently informed public can be led to believe that a nuclear reactor is sufficiently safe, as was the case in Fukushima before the earthquake and tsunami events on 11 March 2011. Here below we will present arguments to the effect that the CANDU nuclear reactor presents an unreasonable risk to five Canadian provinces and to the State of Maine because of inherent design weaknesses that make it extremely vulnerable to earthquakes.
-2. History and significance of earthquake hazards as computed by the GSC

History. The Geophysical Survey of Canada (GSC) has done extensive studies of the statistics of earthquakes and of the geological structures. These studies provide an ever evolving framework for the evaluation of seismic hazards and are the basis for the National Building Code of Canada (NBCC), whose 2010 version is now in force. In a paper presented in June 2011 at the General Conference of the Canadian Society for Civil Engineering, Dr. John Adams reviewed the history of the NBCC. The element of interest in this report is the NBCC earthquake hazard map.
In 1970 the hazard map was calculated for a 0.01 (1 %) probability of occurrence per annum, i.e. per year. For a given probability of occurrence the map gives the peak ground acceleration (PGA) that could be exceeded at the selected location. In 1985 the GSC published a map with hazard probability calculated for earthquakes that occur with a probability down to 0.0021 (0.21%) per year. This number corresponds to a probability of 10% of occurrence over a 50-year interval. With the 2005 and 2010 versions of the GSC calculated maps, and with the on-line GSC calculator, one can evaluate seismic hazards occurring with a probability down to 0.0004/year (0.04%), which corresponds to 2% over 50 years.
Finally, both the NBCC and the CNSC now consider that an evaluation down to 0.0001/year probability can be applied to nuclear power plants, which is a probability of occurrence of 0.5% over a 50-year interval. On its web site the GSC explains that the calculations now available down to 0.0004/a probability can be extrapolated to lower probabilities, like 0.0001/a, by using a straight line approximation on a graph plotting log (PGA) versus log(probability/annum). Over a 50-year interval the 0.0001/a number corresponds to a 0.5% probability of occurrence. For this probability the GSC data approximated by a straight line on a log-log plot give a PGA in the range 0.4 to 0.5 g for Point Lepreau. The unit of acceleration g corresponds to the earth’s gravitational acceleration at the surface, that being 1 g = 9.88 m/s/s. This 0.4-0.5 g PGA bracket is substantially in excess of the 0.18 g PGA value that the reactor was designed to resist in the nineteen-seventies.
The Weston Geophysical Corporation (WGC) report and the CNSC INFO-0824 report explain that in the 1960s and early 1970s when many nuclear reactors were in the design stage, the science of seismology was underdeveloped and it was generally assumed that all of Eastern North America was characterized by a low seismicity. As John Adams of the GSC wrote in his June 2011 paper, the 5.9-magnitude November 1988 earthquake in Saguenay, Québec, taught again the important lesson that a

significant seismic event can occur in a region that previously had had a history of low seismicity. As geophysical science rapidly evolved in the last 40 years, the calculated probabilities of earthquakes increased, as did the level of earthquake resistance imposed on new construction. The latter is expressed as the design PGA value that an earthquake can reach and for which a safe shutdown of the reactor will take place. Such an earthquake is called SSE, for Safe Shutdown Earthquake.
WGC pointed out in their 1994 report that the peak ground acceleration (PGA) design value has been exceeded a few times for several U.S. nuclear reactors. WGC expressed their opinion that U.S. reactors were designed with a robust safety margin so that design PGA values in the US can be exceeded by some factor without a nuclear accident taking place. As for Canadian nuclear reactors the WGC 1994 report had this on page 6-19: ‘’No formal seismic margin analyses are available for the Canadian reactors that are the subject of this report.’’ This is a crucial piece of evidence that in the early years nuclear designers and operators in Canada had not been kept awake all night by seismic hazards and their potential consequences. As late as 2004 a Hydro-Québec report asserted that significant earthquakes can only take place in Québec at great distances from the Gentilly-2 nuclear power plant, an assertion that has been contradicted by the GSC.
Significance. The 0.0001/year probability of occurrence is also frequently expressed as a 10 000-year recurrence probability, meaning that on an average over a few hundred thousand years the event will occur once every 10 000 years. The psychological error can easily be made that one need not worry about such rare events by thinking that they are due to happen only after a few thousand years. The mathematician Gordon Edwards has come up with an excellent way of countering this widespread error of interpretation by comparing the probabilities over a 50-year interval to the probability of getting two sixes upon the single throw of two dice. The latter outcome’s probability is (1/6) x (1/6) = 1/36 = 0.0277 = 2.77 %, a number which is close to the standard NBCC calculation of PGA for a probability of occurrence of 2% over 50 years.
Some casinos offer a game in which one can bet on the outcome of rolling simultaneously three dice. The probability of three sixes on a single throw is (1/6) x (1/6) x (1/6) = 1/216 = 0.0046 = 0.46 %, a number that is very close to the 0.5% quoted above for the 10 000-year recurrence event. The casino pays 150 times the money that the player puts on the table. GSC data for Point Lepreau, when extrapolated to 0.0001/a probability, give a PGA value in the 0.4-0.5 g bracket, which exceeds the value of 0.18 g
which the Point Lepreau nuclear reactor was designed to withstand. At the 0.0004/a probability the PGA value is 0.3 g which again exceeds the 0.18 g design value.
These two probability values lie between the two-dice and the three-dice throws. This picture greatly simplifies the task of visualizing probabilities to the point where ten-year-old children could be asked if they wish their future to be submitted to the outcome of a two-dice or a three-dice throw. As for adults looking into this issue, an additional consideration would be to ask about the role of engineering ethics in such a ‘dicey situation’. Under their code of ethics engineers generally have a certain obligation to reveal to the public the amplitude of the risks attendant to engineering projects. The same obligation is clearly stipulated in paragraph (b) of the Nuclear Safety and Control Act of 1997.
-3. Pressure tube aging and large-break loss-of-coolant accidents
Pressure tube degradation. In its primary cooling system using heavy water the CANDU reactor at Point Lepreau has 380 zirconium-niobium alloy tubes going through the reactor core and an equal number of pairs of feeder pipes that are made of steel and that take the water in and out of the core. The total length of these high-pressure tubes is over six kilometers. At the outlet pipes the heavy water reaches a temperature of some 300 degrees Celsius under a pressure of about 100 atmospheres. This very high pressure, which is characteristic of that found in the ocean at a depth of one kilometer, in addition to a number of pressure tube degradation phenomena, presents a significant challenge to the primary system integrity.
The INFO-0824 CNSC Fukushima Task Force Report has mentioned at the beginning of section 6 that an earthquake could cause a small-break loss-of-coolant accident or LOCA. We argue that a large-break loss-of-coolant accident could very well be caused by an earthquake because of pressure tube aging. In August 1983 a zirconium-niobium alloy pressure tube suddenly ruptured over a length of more than one meter in the CANDU Pickering-2 reactor, thus triggering a LOCA. Through improvisation the operators and engineers were able to prevent the LOCA from progressing to a more serious accident. But the reactor was shut down for five years during which time all pressure tubes were replaced. In 2008 the Point Lepreau reactor was also deliberately
shut down in order to replace all pressure tubes because aging phenomena had degraded them close to the danger point.
Intense neutron bombardment of the zirconium-niobium alloy metal tubes causes them to considerably lengthen and sag in addition to weakening them. When sagging caused one of the 380 zirconium-niobium tubes to contact its concentric calandria tube in Pickering-2 in August 1983, the added stress caused the pressure tube to suddenly rupture. In general, due to intense neutron bombardment and to the phenomenon of deuterium ingress, the zirconium-niobium pressure tubes become brittle after several years and threaten to burst spontaneously.
An additional challenge to primary system integrity is flow-assisted corrosion and stress corrosion cracking in the steel feeder pipes which causes wall-thinning (see Jin et al’s paper). These steel pipes initially have a wall thickness of 6 millimeters. The CNSC allows reactor operation until the wall thickness is corroded down to about 4 mm. This six-to-four millimeter wall thickness is very far from presenting the level of corrosion resistance that a typical American reactor has with the typically 200-millimeter wall thickness of the large vessel housing the reactor core.
The Point Lepreau CANDU reactor was designed to withstand a maximum PGA of 0.18 g. If we adopt a rigorously prudent attitude, we must take into account the possibility that a 0.4-0.5 g PGA earthquake could cause one or several corrosion-weakened pipes to burst, and to trigger a large-break LOCA. The American journalists David McNeill and Jake Adelstein have reported that the 0.56 g PGA earthquake in Fukushima caused extensive damage to pipes before the tsunami washed in 40 minutes later (see http://www.atimes.com/atimes/Japan/MH12Dh02.html). One would be rigorously prudent by assuming that what happened in Fukushima during the earthquake could also happen in Point Lepreau. With its six kilometers of degraded pipes the CANDU reactor is arguably more vulnerable than its American counterpart which was in operation in Fukushima.
The CNSC has forced the CANDU owners to set up an extensive set of activities for monitoring degradation phenomena in the primary high pressure system. The problem with these monitoring activities is that they may be spaced in time by as much as six months, and they are carried out on a statistical basis, which means that only a certain percentage of the kilometers of feeder tubes is monitored each time and the total length of high pressure tubing remains in an uncertain condition. The very high radiation levels

near the reactor, even when the reactor is shut down, does not allow specialized employees to spend much time carrying out precise measurements on high-pressure tubes. This results in much uncertainty regarding the fitness for service of the pressure tubes.
This problem has been described in a paper entitled ‘’Fitness for service assessment of degraded CANDU feeder piping – Canadian regulatory expectations’’ dated August 2007 and authored by CNSC scientists John C. Jin, Raoul Awad, and Thomas Viglasky. In the fourth paragraph of their article the authors write: ‘’Nevertheless, regulatory staff believes that on-power failure of a thinned feeder pipe cannot be ruled-out. In particular, the staff’s major concern is that, in the absence of an adequate ageing management program, the ultimate failure mode of thinned feeder pipe would be sudden rupture without adequate prior warning by leakage, as has been known to occur in real-world cases.’’
The state of affairs with degraded feeder pipes introduces an additional hazard that one must take into account when trying to anticipate the damage that a significant earthquake could cause. In its INFO-0824 report the CNSC Fukushima Task Force recognized the problem but did not quantify it. What would happen in a significant earthquake at Point Lepreau is therefore uncertain. The safest approach would be to keep the reactor in a state of guarantied shutdown, i.e. with the uranium fuel removed.
Large-break loss-of-coolant accident. In hundreds of pages of its exhaustive technical documentation the CNSC discusses the consequences of a LOCA and an LBLOCA. Many LBLOCA scenarios described by the CNSC will lead to a partial core meltdown, rendering mandatory the new recommendations of INFO-0824 if one wishes to prevent radioactive elements to be released into the environment. Note that most discussions about the dreaded LBLOCA do not mention the possibility of an earthquake.
In the conditions triggered by an earthquake, the CNSC has recognized in INFO-0824 the possibility of a LOCA. The consequences of a LOCA would be aggravated by the gradual deterioration of uranium-oxide fuel channels in the reactor core, as explained in the next section.

-4. Dangerous build-up of uranium oxide fuel damage
Another dreaded physical condition in CANDU reactors that will exacerbate an earthquake-triggered LOCA is accumulated uranium oxide fuel damage. The complexity of neutron cloud control in a CANDU reactor is such that in the day-to-day operation of a CANDU reactor damage accumulates in the uranium-oxide fuel channels. The reason for this question is that spatial and temporal fluctuations in the neutron cloud density can lead to excessive temperatures and uranium oxide fuel damage in certain parts of the reactor core. Accumulated fuel damage in a pressure tube impairs cooling, which in turn leads to higher temperatures, further exacerbating the fuel damage problem. Given the reduced cooling capacity of water flowing through these degraded channels, and given an earthquake triggered LOCA, the possibility that the local overheating could snowball into an LBLOCA and partial core meltdown cannot be ruled out?
This possibility is supported by a CNSC study where a serious accident is contemplated even in the absence of an earthquake. The problem of uranium oxide fuel damage was addressed in a paper entitled ‘’CNSC Fuel Oversight Programme’’ and presented by A. El-Jaby, K. Conlon, W. Grant and M. Couture at the 11th International Conference on CANDU Fuel in Niagara Falls, 17-20 October 2010 (see http://media.cns-snc.ca/uploads/event_data/candu_fuel_2010/proceedings_updates/W2_-_Ali_EL-JABY-revised-.pdf).
The first two paragraphs of the paper read as follows:
‘’The safety issue which triggered Generic Action Item 94G02 – Impact of Fuel Bundle Condition on Reactor Safety (hereafter referred to as GAI-94G02) stems from the fact that, in some instances, the condition and degree of degradation of fuel bundles discharged from CANDU reactors was not what was expected and accounted for in the design, operation, and safety analysis of these reactors [1].
Excessive (or unexpected) bundle degradation typically manifests in the form of end-plate cracking, end-cap separation, extensive bundle deformation, sheath strain, as well as abnormally high degrees of wear in the spacer pads, bearing pads, and sheath material. Moreover, increased occurrences of defective fuel lead to higher than expected quantities of oxidized fuel and fission products released into the primary heat transport system (PHTS). Lastly, fuel bundle degradation is often associated with fretting and scratching of pressure tubes, the effects of which are compounded by other factors such as pressure tube diametric and axial creep.’’
Note that ‘’fretting and scratching of pressure tubes’’ increases their vulnerability to rupture. In CANDU reactors the zirconium-niobium alloy pressure tubes have a wall thickness of only 6 millimeters. Neutron bombardment and corrosion effects gradually degrade the pressure tubes, which is why they need to be replaced every 30 years or sooner. In the vast majority of nuclear reactors in the world a large pressure vessel holds the core; these vessels are made of a
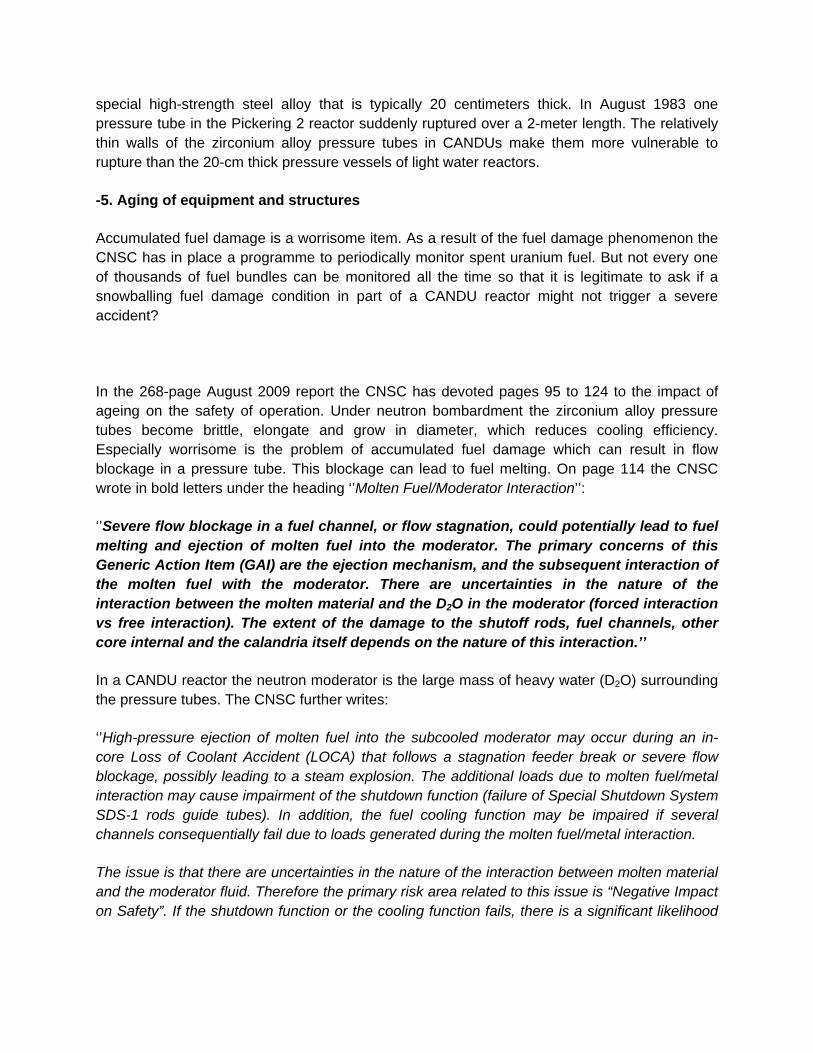
special high-strength steel alloy that is typically 20 centimeters thick. In August 1983 one pressure tube in the Pickering 2 reactor suddenly ruptured over a 2-meter length. The relatively thin walls of the zirconium alloy pressure tubes in CANDUs make them more vulnerable to rupture than the 20-cm thick pressure vessels of light water reactors.
-5. Aging of equipment and structures
Accumulated fuel damage is a worrisome item. As a result of the fuel damage phenomenon the CNSC has in place a programme to periodically monitor spent uranium fuel. But not every one of thousands of fuel bundles can be monitored all the time so that it is legitimate to ask if a snowballing fuel damage condition in part of a CANDU reactor might not trigger a severe accident?
In the 268-page August 2009 report the CNSC has devoted pages 95 to 124 to the impact of ageing on the safety of operation. Under neutron bombardment the zirconium alloy pressure tubes become brittle, elongate and grow in diameter, which reduces cooling efficiency. Especially worrisome is the problem of accumulated fuel damage which can result in flow blockage in a pressure tube. This blockage can lead to fuel melting. On page 114 the CNSC wrote in bold letters under the heading ‘’Molten Fuel/Moderator Interaction’’:
‘’Severe flow blockage in a fuel channel, or flow stagnation, could potentially lead to fuel melting and ejection of molten fuel into the moderator. The primary concerns of this Generic Action Item (GAI) are the ejection mechanism, and the subsequent interaction of the molten fuel with the moderator. There are uncertainties in the nature of the interaction between the molten material and the D2O in the moderator (forced interaction vs free interaction). The extent of the damage to the shutoff rods, fuel channels, other core internal and the calandria itself depends on the nature of this interaction.’’
In a CANDU reactor the neutron moderator is the large mass of heavy water (D2O) surrounding the pressure tubes. The CNSC further writes:
‘’High-pressure ejection of molten fuel into the subcooled moderator may occur during an in-core Loss of Coolant Accident (LOCA) that follows a stagnation feeder break or severe flow blockage, possibly leading to a steam explosion. The additional loads due to molten fuel/metal interaction may cause impairment of the shutdown function (failure of Special Shutdown System SDS-1 rods guide tubes). In addition, the fuel cooling function may be impaired if several channels consequentially fail due to loads generated during the molten fuel/metal interaction.
The issue is that there are uncertainties in the nature of the interaction between molten material and the moderator fluid. Therefore the primary risk area related to this issue is “Negative Impact on Safety”. If the shutdown function or the cooling function fails, there is a significant likelihood

that design basis accidents may propagate to severe core damage. As the containment integrity is not expected to be challenged, the public doses are not expected to be significant.’’
The last statement expresses the hope that the steam explosion alluded to would not be powerful enough to breach the one-meter thick reinforced concrete enclosure housing the reactor, so that the quantity of radioactive elements released into the environment would be much less than at Fukushima.
On page 120 the CNSC further writes:
Concerns during post-dryout operation of fuel arise from:
‘’ 1. Fuel cooling deterioration leading to fuel element and fuel bundle deformation that could aggravate the fuel cooling deterioration;
2. Potential for pressure tube rupture as a result of severe fuel bundle deformation in which hot outer ring elements contact the pressure tube.
Existing safety analysis predictions of no fuel failure or no pressure tube failure lack confidence, since the models do not account for fuel bundle deformation that could affect heat transfer from fuel elements or cause fuel-element/pressure-tube contact that might lead to consequential pressure tube rupture or for feedback between thermal-hydraulics and fuel bundle behaviour.’’
Post-dryout refers to a condition where the uranium oxide fuel is so hot that the cooling water quickly turns into steam and becomes very inefficient at cooling the fuel. On page 121 the CNSC writes in bold letters:
‘’The knowledge base for post-dryout fuel, fuel bundle and pressure tube behaviour, in support of the current safety case may be inadequate.’’
Finally, on page 122 the CNSC writes the following:
‘’Consequential pressure tube failure may lead to loss of a barrier to fission product release (if not already breached due to the initiating event), lead to severe core damage and loss of coolable geometry. Maintenance of a coolable geometry is a fundamental safety principle.’’
This brief conclusion explains well the seriousness of accumulated fuel damage. Since these dreaded events can occur in the absence of an earthquake, the sudden onset of the latter could only exacerbate the situation.
Conclusion

In drawing a conclusion one can find inspiration in the 1994 report by the Weston Geophysical Corporation. Its two authors, Gabriel A. Leblanc and George C. Klimkiewicz, had superb qualifications stemming from decades of seismic experience and familiarity with US reactors. They had been hired under contract by the Canada Department of Justice counsel, acting for the Attorney General of Canada. The context was litigation opposing Energy Probe in Toronto, the City of Toronto and other intervenors on the plaintiff side, to the Attorney General, Ontario Hydro and New Brunswick Power on the defense side.
In their conclusion the WGC authors first praise the excellent work and reputation of the GSC for their work on seismic hazards. They then go on to state that the annual probability of earthquakes exceeding the design PGA for the Ontario nuclear reactors and Point Lepreau lies ‘’in the range 10-3 and 10-4 (between one in 1000 and one in 10 000)’’. Recall that this range is pretty close to the probability of all sixes for a two-dice and a three-dice single throw.
Based on their extensive US experience the WGC authors then invoke the ‘’substantial seismic margins’’ of US reactors to predict that exceeding the design PGA leads to a probability in the 10-5 to 10-6 range for serious core damage. The higher one is 0.05 % (one chance in 2000) probability over 50 years, approximately equivalent to the 0.077% probability of four sixes for a four-dice single throw. Leblanc and Klimkiewicz express their opinion that this hazard level prevails in other human activities such as driving a car or flying.
The flaw in the WGC authors’ reasoning is to assume that Canadian reactors are vastly different in their design from US reactors. With respect to corrosion and to fracturing caused by the growth of microscopic cracks in steel, there is a considerable difference between 6 millimeters in CANDUs and 200 millimeters of steel in US reactors. In addition, the very large number of pipes in CANDU reactors implies a very large number of welds that can fail, a well-known failure point in mechanical structures. Leblanc and Klimkiewicz based their reasoning on US experience with earthquakes going over the design PGA for some of their 104 reactors in operation. No such experience exists for Canada. The 14 CANDU reactors in Ontario are in a region of low seismicity and no earthquake has yet produced a PGA over their 0.15 g design value.
In 1997 Ontario shut down seven of its 14 nuclear reactors then in operation. Ontario Hydro chairman Allan Kupcis, following the advice of American Andognini’s team of nuclear experts, had judged the safety margins of seven CANDU reactors in Pickering A and in Kincardine to be insufficient. This was done in the absence of earthquakes.
Leblanc and Klimkiewicz raised in their 1994 report the question of defining the level of acceptability. This could be evaluated in Canada by presenting the hazard data in terms of the multiple-dice single throws. It is this author’s experience that the broad public does not understand well the significance of negative powers of ten. Moreover, this question has to be raised: is the broad Canadian public invited to judge the acceptability of a nuclear project, or is it the exclusive prerogative of the CNSC?
References
-1. ‘’CNSC Fukushima Task Force Report’’, INFO-0824, October 2011 , http://www.nuclearsafety.gc.ca
-2. ‘’Seismological issues: history and examples of earthquake hazard assessment for Canadian nuclear generating stations’’, Weston Geophysical Corporation, G.A. Leblanc and G.C. Klimkiewicz, 1994; Geological Survey of Canada Open File 2929 (web site www.nrcan.gc.ca);
-3. John Adams, presentation at the General Conference of the Canadian Society for Civil Engineering, 14-17 June 2011, paper entitled ‘’Seismic Hazard Maps for the National Building Code of Canada’’, available on the Geophysical Survey of Canada web site at www.seismo.nrcan.gc.ca/hazards/ OF4459/index_f.php;
-4. M.A. Duguay, many articles and letters on the CNSC web site, with a critique by John Froats, former president of the CANDU Owners Group.
Some biographical notes on Michel A. Duguay
Michel A. Duguay studied physics at the Université de Montréal where he was granted a Bachelor of Science degree in 1961. One of his teachers was Hubert Reeves, now one of the best known physicists in Québec and in France. Reeves had advised Duguay to pursue his physics studies in the United States. In 1961 Duguay was accepted in the doctoral program in physics at Yale University and he chose nuclear physics as his area of research. Having obtained the Ph.D. in physics from Yale in 1966, Duguay joined the Bell Telephone Laboratories in Murray Hill, New Jersey. He carried out research work at Bell Labs in the Solid State Electronics Research department; his concentration was laser research.
In 1974 Michel Duguay was invited to work on an X-ray laser research project at the Sandia National Laboratories in Albuquerque, New Mexico. After one unsuccessful year on this project Duguay switched his activities to a solar optics project that quickly met with success. Duguay

returned to AT&T Bell Labs in 1977 in the area of telecommunications research. This was in Holmdel, New Jersey, where Duguay worked in the area of semiconductor lasers and photonics until 1987.
From 1978 until 1987 Michel Duguay was a member of the IEEE Energy Policy Committee, meeting principally in Washington, D.C. a few times a year. IEEE stands for Institute of Electrical and Electronics Engineers. The committee wrote position papers to influence US government policy in energy issues.
Since March 1988 Michel Duguay has been professor in the Département de génie électrique et de génie informatique at Laval University. He has been active in research in optical communications, in special relativity (the so-called ‘’diachronic’’ approach) and quantum optics, and on solar electric boats. Michel Duguay is the co-holder of 30 US patents.
Since 2004 Michel Duguay has been working with the Mouvement vert Mauricie. Duguay coordinates its spin-off, the ‘’Mouvement Sortons le Québec du nucléaire (MSQN)’’.
E-mail: [email protected]
Office telephone 418.656.3557 cell phone: 418.802.2740

Climate Change issues, concerns and recommended best practices for the CCNB Action SJ Fundy chapter’s intervention in the CNSC public hearing to be held December 1st and 2nd, 2011 on New Brunswick Power Nuclear’s application to renew Power Reactor Operating Licence. Author-Raphael Shay, Conservation Council of New Brunswick’s climate change and energy expert Dear Canadian Nuclear Safety Commission members, The following outlines new developments in the science of climate change, some of its consequences as well as possible implications for the Point Lepreau Generating Station. These considerations are essential in any decision relating to the future safety of the nuclear plant. The proximity to an important urban centre as well as being in the middle of a key ecosystem for the sustainability of the Atlantic seaboard only accentuates this importance. To begin, the claim by certain media and policy-makers that climate science is highly uncertain is not true. There is a scientific consensus in peer-reviewed literature that climate change is occurring.i The average temperatures in the last decade were higher than any other decade on recordii and signs indicate that the situation is worsening as temperature records were set in 19 countries covering a fifth of the world’s land area last year.iii Our inability to curb emissions globally also indicates we are currently following the higher emission scenarios that bring with them more significant impacts. The most recent comprehensive study released in May of 2011 concluded that climate change is occurring more quickly and with more drastic effects than previously expected. The worst case scenario of 100cm sea-level rise by 2100 is now likely and worst case scenarios range up to 160cm.iv Warming temperature brings with it increased precipitation, more severe storms and rising sea levels to New Brunswick.v We will likely see more severe weather events such as the floods and storm surges of December 2010, which cost the province $36 million and private insurance companies $50 million, in addition to costs borne by individual New Brunswickers. In fact the New Brunswick Emergency Management Organization has reacted to more than twice as many Severe Weather Events in the first decade of this new millennium than it did in the previous decade, going from 6 in the 1990’s to 13 in the 2000s. (Morton, A.(2011) Presentation in Moncton, NB. <note: Mr Morton is a Deputy Director of New Brunswick’s Emergency Measures Organisation>.. New Brunswick’s infrastructure will be put to the test and must be prepared to deal with an increasing amount of severe storms, including hurricanes. A slower and permanent rise in sea-level is also to be expected. A nationwide study found that 80% of the Maritimes coasts are moderately or highly sensitive to sea-level rise compared to the Canadian average of a third.vi Already parts of the Tantramar Marsh are being flooded to mitigate the impacts of storm surges, the town of Shippagan’s wells are being infiltrated by sea water and the village of Le Goulet is working on erecting protective barriers.

Figure 1: Coastal sensitivity to sea-level rise. Taken from: Shaw et al., 1998. Sensitivity of the coasts of Canada to sea-level rise. Geological Survey of Canada.
In a recent report Paying the Price, The National Roundtable on the Environment and the Economy began the work of calculating the costs of climate change for Canada.vii They estimated that costs “could escalate from roughly $5 billion per year in 2020… to between $21 billion and $43 billion per year by the 2050s.” The study also concluded that these costs will have a highly uneven distribution on a per capita basis. New Brunswick was amongst the worst faring provinces, which will hinder its ability to adapt and mitigate climate impacts. This study did not consider the risks of a climate induced incident at Point Lepreau. Climate change is impacting the safety of existing structures and increasing the premature weathering of our infrastructure. A 2007 report by Environment Canada on adaptation strategies for infrastructure in a changing climate provides many helpful points. First, it recognizes that “many structures and communities in coastal zones and flood plains will face significant risks from the changing climate as a result of sea level rise, increases in storm surges, increases in water and air temperature, more extreme rainfall and storm intensity, and resulting land erosion and inundation from the sea.”viii Significantly, they noted “that risks of infrastructure failure will increase worldwide as weather patterns shift and extreme weather conditions become more variable and regionally more intense.” The responsible course of action is therefore to put into question original engineering and architectural assumptions and plan for a shorter lifespan. At a very minimum, this requires we implement “no regret” adaptation actions on our critical infrastructure as suggested by the International Panel on Climate Change. These include regularly updating design values meant to mitigate climate impacts, regular maintenance and continuous analysis of failures. It also includes introducing in codes and standards a “Climate Change Adaptation Factor” to existing design values that reflect the latest understanding of near future changes.viii

However the impacts of climate change fall within a wide range. As such, Environment Canada’s 2007 report stated that in some cases “the impacts of the future climate will lie outside of existing experience and the coping ranges of existing infrastructure.”viii In most instances, an adaptive learning strategy where new adaptation methods are developed over time thanks to analyses of failure will be essential. But when it pertains to the Point Lepreau Nuclear Generation Station, the consequences of failure may be too large to learn from. This situation must be taken seriously given the “current longstanding gaps and deficiencies in the determination of climatic design values prevent optimum decision s from being made on infrastructure reliability and safety.” viii Recent cuts in climate design and monitoring in Canadaix render structure design of any kind particularly vulnerable. Canada’s Commissioner of the Environment and Sustainable Development underscored the concern that Canada has yet to take appropriate action to adapt to climate change. The Fall 2010 report, which occurred prior to the cuts at Environment Canada, point out that “overall, the departments we examined have not taken concrete actions to adapt to the impacts of a changing climate. With few exceptions, they have yet to adjust or develop policies and practices to better respond to the risks.”x These departments did not include the Canadian Nuclear Safety Commission nor did it include Atomic Energy Canada Limited.
If there is anything we can learn from the recent catastrophic events at Fukushima, Japan it is that the forces of nature lie beyond our engineered expectations. The destruction of Fort Calhoun’s flood walls during the 2011 floods of the Missouri river highlights this point. This brief letter started by outlining the scientific consensus on climate change. I then outlined some of the impacts from climate change that are relevant to the question at hand, notably an increase in severe storm events and rising sea-levels. An analysis of the financial costs of climate change followed to demonstrate the future limited ability of New Brunswick to cope with the demands of climate adaptation. I concluded with presenting the implications of climate change for our infrastructure.
References i Oreskes, 2004. The Scientific Consensus on Climate Change. Science. Vol 306: no. 5702, p 1686.
http://www.sciencemag.org/content/306/5702/1686.full ii NASA Goddard Institute for Space Studies Surface Temperature Analysis. http://data.giss.nasa.gov/gistemp/ iii Krugman, P. (February 8th, 2011). Revolution? It’s in the wind; in Telegraph Journal. (note: Krugman is a Nobel
prize-winning economist)
iv Arctic Monitoring and Assessment Program. (May 2011). Snow, Water, Ice, Permafrost in the Arctic - Executive
summary. http://amap.no/swipa/SWIPA2011ExecutiveSummaryV1.pdf v Vasseur, L., Catto, N. (2008). Atlantic Canada; in From Impacts to Adaptation: Canada in a Changing Climate
2007, Government of Canada, Ottawa, ON, p.119-170. vi Shaw, J., Taylor, R.B., Forbes, D.L., Ruz, M.H., Solomon, S., 1998. Sensitivity of the coasts of Canada to sea-
level rise. Geological Survey of Canada, Bulletin 505. vii National Roundtable on the Environment and the Economy. 2011. Paying the Price: The Economic Impacts of
Climate Change for Canada. http://nrtee-trnee.ca/wp-content/uploads/2011/09/paying-the-price.pdf viii Auld, H., MacIver, D., Klaassen, J., 2007. Adaption options for infrastructure under changing climate conditions.
Environment Canada. http://www.ec.gc.ca/Publications/71CA9FFD-DFE4-4EC2-BC36-8DC89BFCC885%5COccasionalPaper10English.pdf
ix Duck, T., Aug. 22, 2011. Hidden cost of cuts to Environment Canada. The Star. http://www.thestar.com/opinion/editorialopinion/article/1043380--hidden-cost-of-cuts-to-environment-canada
x Commissioner of the Environment and Sustainable Development. 2010 Fall Report. http://www.oag-bvg.gc.ca/internet/English/parl_cesd_201012_e_34435.html
Morton, A.(2011) Presentation in Moncton, NB. <note: Mr Morton is a Deputy Director of New Brunswick’s Emergency Measures Organisation

Raphael Shay 807-707-2341 [email protected]
EDUCATION
Royal Roads University Victoria, BC, Canada Expected Graduation 2012 Master of Arts in Environment and Management
o Thesis: Increasing the role of environmental indicators in new energy systems.
Renaissance College, University of New Brunswick (UNB) Fredericton, NB, Canada 2003 – 2006 Bachelor of Philosophy in Interdisciplinary Leadership Studies, Dean’s List
o Focus on community problem solving, public policy and organizational theory. Secondary Major in Environmental Studies
o Focus on environmental impact assessment, climate change and forestry. Awards:
• Student Union Activity Award Bronze, 2006 • UNB Student Abroad Bursary, 2005 • Renaissance College International Internship Bursary, 2005 • Canadian Millennium Excellence in-course Scholarship, 2004 • UNB Academic Scholarship, 2004 • James Somerville Scholarship, 2004 • William and Lois Paine Founder’s Scholarship, 2003
Internships: Royal University of Bhutan, Canadian Cooperation Organization Wangdicholing Secondary School, Bumthang, Kingdom of Bhutan May - Aug 2005 Teacher & Sustainability Planner Camp-école Trois-Saumons St-Aubert, QC, Canada May - Aug 2004 Maître D’Hôtel
Tatamagouche Centre Tatamagouche, NS, Canada May 2007 Dialogue for Peaceful Change Facilitation Trainee
Collège St-Louis & South Side High School Montreal, QC, Canada & Rockville Centre, NY, USA 2003 International Baccalaureate

Raphael Shay 807-707-2341 [email protected]
EXPERIENCE
Conservation Council of New Brunswick Fredericton, NB, Canada Feb 2010 – Jul 2011 Climate & Energy Program Coordinator IBEKA (People Centered Business and Economic Institute) Jakarta, Indonesia Sep 2009 – Dec 2009 Renewable Energy & Community Development Advisor iCAST (International Center for Appropriate and Sustainable Technology) Lakewood, CO, USA Jun 2007 – Jul 2009 Sustainability Project Manager
Nordic Folkecenter for Renewable Energy & Falls Brook Centre Ydby, Denmark & Knowlesville, NB, Canada Aug 2006 – May 2007 Appropriate Technology and Biofuels Marketing Research Associate Internship
• Scholarship: Canadian Department of Foreign Affairs and International Trade Canada (DFAIT)
Sierra Club of Canada – Atlantic Canada Chapter Halifax, NS, Canada Mar - Jun 2006 Environmental Educator International Youth Summit & UN Climate Change Conference (UNCCC) Montreal, QC, Canada Nov 2005 Delegate/Observer
• Scholarship: CAMBIO from Environment Canada UNB Environmental Society Fredericton, NB, Canada 2003 - 2006 Youth Environmental Symposium, Organization Committee (February 2005) Vice-President (2005-2006) Member (2003-2005) University of New Brunswick Student Union Fredericton, NB, Canada 2003 - 2006 Environmental Commissioner (2005-2006) Renaissance College voting Representative on Student Union Council (2004-2005)

CMD 11-H12.33B
File / dossier : 6.01.07 Date: 2011-11-24 Edocs: 3844248
Supplementary Information Submission from CCNB Action, Saint John Fundy Chapter In the Matter of New Brunswick Power Nuclear
Renseignements supplémentaires Mémoire du CCNB Action, section Saint John Fundy À l’égard de Énergie nucléaire du Nouveau-Brunswick
Request for Approval to Reload Fuel and Restart Point Lepreau Nuclear Generating Station, and Application to renew the Power Reactor Operating licence for the Point Lepreau Generating Station
Demande concernant l’autorisation de recharger le combustible et redémarrer la centrale nucléaire de Point Lepreau, et demande concernant le renouvellement du permis d’exploitation délivré pour la centrale nucléaire de Point Lepreau
Public Hearing Day Two December 1 and 2, 2011
Deuxième jour de l’audience publique Les 1er et 2 décembre 2011
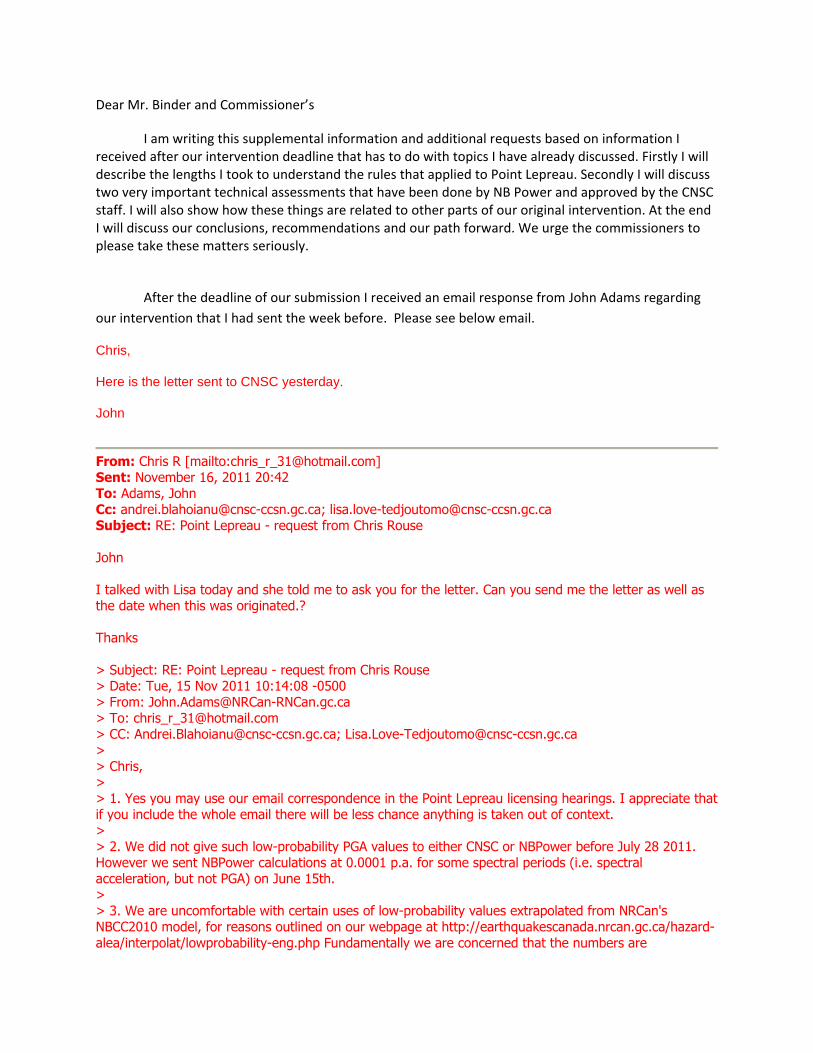
Dear Mr. Binder and Commissioner’s
I am writing this supplemental information and additional requests based on information I received after our intervention deadline that has to do with topics I have already discussed. Firstly I will describe the lengths I took to understand the rules that applied to Point Lepreau. Secondly I will discuss two very important technical assessments that have been done by NB Power and approved by the CNSC staff. I will also show how these things are related to other parts of our original intervention. At the end I will discuss our conclusions, recommendations and our path forward. We urge the commissioners to please take these matters seriously.
After the deadline of our submission I received an email response from John Adams regarding
our intervention that I had sent the week before. Please see below email.
Chris,
Here is the letter sent to CNSC yesterday.
John
From: Chris R [mailto:[email protected]] Sent: November 16, 2011 20:42 To: Adams, John Cc: [email protected]; [email protected] Subject: RE: Point Lepreau - request from Chris Rouse
John I talked with Lisa today and she told me to ask you for the letter. Can you send me the letter as well as the date when this was originated.? Thanks > Subject: RE: Point Lepreau - request from Chris Rouse > Date: Tue, 15 Nov 2011 10:14:08 -0500 > From: [email protected] > To: [email protected] > CC: [email protected]; [email protected] > > Chris, > > 1. Yes you may use our email correspondence in the Point Lepreau licensing hearings. I appreciate that if you include the whole email there will be less chance anything is taken out of context. > > 2. We did not give such low-probability PGA values to either CNSC or NBPower before July 28 2011. However we sent NBPower calculations at 0.0001 p.a. for some spectral periods (i.e. spectral acceleration, but not PGA) on June 15th. > > 3. We are uncomfortable with certain uses of low-probability values extrapolated from NRCan's NBCC2010 model, for reasons outlined on our webpage at http://earthquakescanada.nrcan.gc.ca/hazard-alea/interpolat/lowprobability-eng.php Fundamentally we are concerned that the numbers are
mathematically precise but their reliability (i.e. accuracy) is unknown. However we feel that such extrapolations may still be useful for screening and checking purposes. With that in mind, I can tell you that at the request of CNSC we extrapolated NRCan's NBCC2010 model to the levels of PGA shaking used in the 2002 Point Lepreau Seismic margin assessment (as given in NBPower documents supplied to us by CNSC). The extrapolated probabilities were lower than, or similar to, those assumed by NBPower. Our letter is currently moving between NRCan and CNSC, and you may wish to ask CNSC for it. > > John Adams > > _/_/_/_/_/_/_/_/_/_/_/_/_/_/_/_/_/_/_/_/_/ Personal signature block _/_/_/_/_/_/ > _/ John Adams Seismologist _/ > _/ Geological Survey of Canada email: [email protected] _/ > _/ Natural Resources Canada, phone: (613) 995-5519 (& voice mail) _/ > _/ 7 Observatory Crescent, fax : (613) 992-8836 _/ > _/ OTTAWA, K1A 0Y3 Canada WWW : http://www.earthquakesCanada.ca _/ > _/ __________________________________________________________________________ _/ > _/ hours: 0630-1520 EST or EDT (1130-2020 UT in winter) _/ > _/ visit: `Old Dominion Observatory' on Experimental Farm, _/ > _/ Red Brick building at SE corner of Maple and Carling Avenue, _/ > _/ 1.4 km WSW of Bronson/Carling intersection. _/ > _/_/_/_/_/_/_/_/_/_/_/_/_/_/_/_/_/_/_/_/_/_/_/_/_/_/_/_/_/_/_/_/_/_/_/_/_/_/_/_/ > > John Adams [email protected] (613) 995-5519 facsimile / télécopieur > (613) 992-8836 Natural Resources Canada, 7 Observatory Cres, Ottawa, Ontario K1A > 0Y3 Ressources naturelles Canada, 7 Place de l'Observatoire, Ottawa (Ontario) K1A 0Y3 > Government of Canada / Gouvernement du Canada > > > > > -----Original Message----- > From: Chris R [mailto:[email protected]] > Sent: November 10, 2011 11:54 > To: Adams, John > Subject: Point Lepreau > > As per our conversation I am asking permission to use our email correspondence in the Point Lepreau licencing hearings. Anything I use I will include the whole email so nothing is taken out of context. > > Also do you have any knowledge of NRCan giving pga values for annual probabilities of .0001 and .00001 to NB Power or the CNSC prior to July 28 2011 ? > > Also would it be possible to get the seismic hazard curve for point lepreau up to the .00001 annual probability calculated directly from the NRCan model using the site condition of hard rock? It would be great to see the whole curve but I would like to know the .0001 and .00001 annual probabilities specifically. > > Thank you for your help in this matter > > Chris Rouse
The intent of my email to John Adams was to determine as a SCREENING value only, for the
review level earthquakes for the Level 1 and Level 2 PSA based SMA’s directly from NRCan. At that time,

as you can see from our intervention, I had been led to believe that if NB Power had done it the way the
NRCan website gives instructions on how to extrapolate these low probabilities, that they must have not
done it correctly. I was also trying to determine if they had received information directly from NRCan
that would have given different PGA values for these low probabilities other than the method on the
NRCan website.
From this email you can see that neither the CNSC nor NB Power had gotten these low
probabilities directly from NRCan before July 28th, 2011, and appears to only been asked for recently,
one might guess after my email to John Adams.
Once I received the email back with the letter, I became very confused despite my best efforts
to understand the Review Level Earthquakes.
This is the Letter that he sent me.
Geological Survey of Canada Commission géologique du Canada
7 Observatory Crescent 7, place de l'Observatoire
Ottawa, Ontario Ottawa (Ontario)
K1A 0Y3 K1A 0Y3
2011 November 16
Andrei Blahoianu
Canadian Nuclear Safety Commission
Dear Dr Andrei Blahoianu,
Here is NRCan’s assessment of Technical Document 0087-03612-3000-001-TA-A1, forwarded by you in
relation to the October and December 2011 licensing hearings for the Point Lepreau Generating Station
(PLGS).
Sincerely,
John Adams.
Assessment of Énergie NB Power technical document 0087-03612-3000-001-TA-A “Evaluation of
updated seismic hazard information for eastern Canada” for CNSC.
Background
The Document considered NRCan’s (GSC’s) estimates of seismic hazard made for the 2010 National
Building Code of Canada (NBCC). It used NRCan’s online calculator
(http://earthquakescanada.nrcan.gc.ca/hazard-alea/interpolat/index_2010-eng.php ) to get the
standard NBCC2010 values (median hazard) for firm ground, and then adjusted them to a hard rock site
(see the Document’s Table 6). We concur that the PLGS is on hard rock, and that the adjustments were
done appropriately. (We note a minor typo in column 2: “3%/50 years” should be “2%/50 years” that
does not affect the conclusions).
Comparison with design basis
1 Note that although technical document 0087-03612-3001-001-TA-A was forwarded at the same time,
NRCan does not believe it has the technical expertise to comment on it.

The PLGS design basis earthquake (DBE) is the shaking level that is expected to occur with a probability
of 0.001 in any given year, and so there is approximately a 95% confidence that the level of shaking
would not be exceeded during a 50-year station life (this sentence is a better restatement of the
sentences on page 12 of the Document). In 1975 it was estimated that shaking with a Peak horizontal
Ground Acceleration (PGA) of 0.12 g corresponded to this probability level. [Note that although the
plant was designed to and checked against various spectra of ground motions, these spectra are
anchored to PGA, and only the PGA values used for anchoring are discussed here.]
However in the light of the historical earthquake record it was thought wise in 1975 to consider the
ground motion from a magnitude 6 earthquake located 20 km from the site, and at the time this was
thought to be approximately 0.15 to 0.20 g, leading to a DBE anchored at PGA = 0.20 g. Note that the
1904 earthquake near Passamaquoddy Bay was about 45 km away and is now thought to have had a
magnitude of 5.7, so the choice was slightly conservative (though not as conservative as is implied in the
Document when it stated the largest historical event was magnitude 5).
To improve the comparison with the design values NRCan has run its seismic hazard model for lower
probabilities than used in NBCC2010, and, for example, this gives a median rock value of 0.305 g for the
probability level of 0.0001 per annum (p.a.) at the PLGS site. NRCan wishes to emphasize that its model
is not necessarily appropriate for extrapolation to this lower probability level, as it was devised as a
national-scale model for the NBCC’s 0.000404 p.a. values. If a definitive comparison is required, a new
site-specific seismic hazard assessment should be made.
Considering these extrapolated PGA values, NRCan finds that probability of the 20% g PGA is about
0.00023 p.a., whereas it was taken as 0.001 p.a. when used as the DBE. Thus there is some
conservatism in using this value for design at the probability of 0.001 p.a.
Comparison with seismic margin assessment basis
Three ground motion-probability pairs (displayed in the following table) were used as part of the 2002
Seismic Margin Assessment, the probabilities of which were justified by a 1984 report. The final column
(in italics) of the table gives the probability of each ground motion level as estimated from the
extrapolation of NRCan’s model for NBCC2010. For each, the NRCan probability estimate is lower than
or essentially similar to the 1984 estimate. NBCC2010 used an improved representation of the
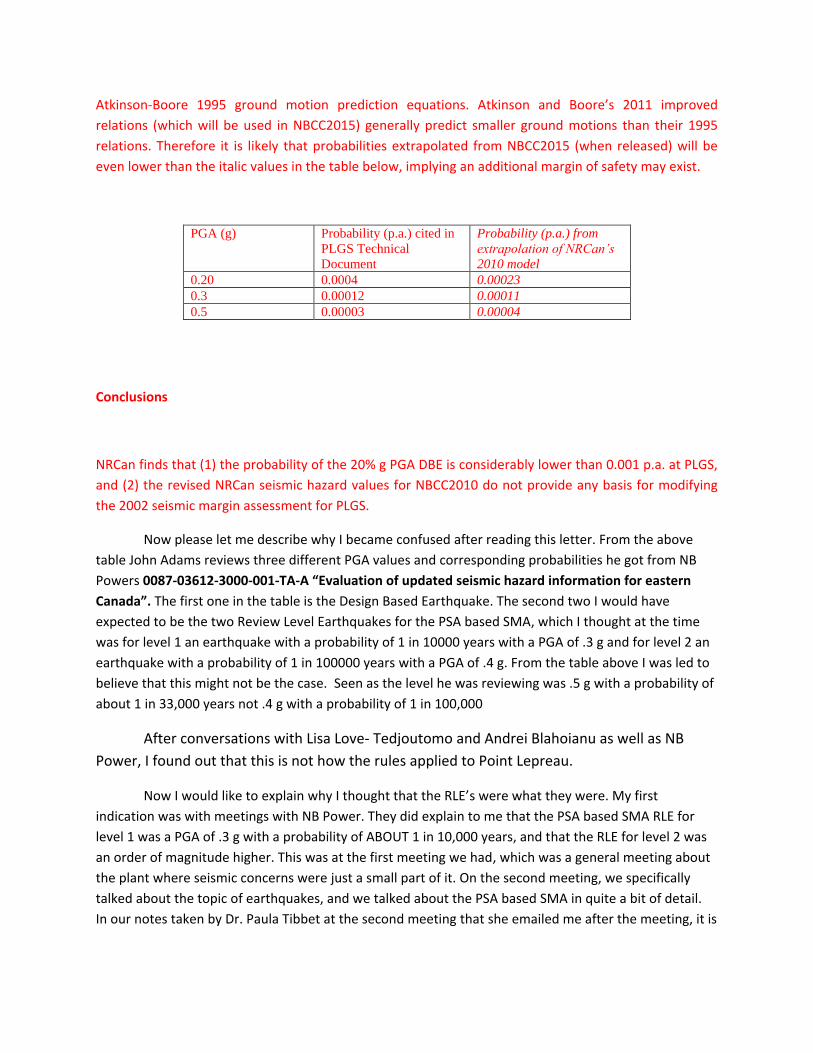
Atkinson-Boore 1995 ground motion prediction equations. Atkinson and Boore’s 2011 improved
relations (which will be used in NBCC2015) generally predict smaller ground motions than their 1995
relations. Therefore it is likely that probabilities extrapolated from NBCC2015 (when released) will be
even lower than the italic values in the table below, implying an additional margin of safety may exist.
PGA (g) Probability (p.a.) cited in
PLGS Technical
Document
Probability (p.a.) from
extrapolation of NRCan’s
2010 model 0.20 0.0004 0.00023 0.3 0.00012 0.00011 0.5 0.00003 0.00004
Conclusions
NRCan finds that (1) the probability of the 20% g PGA DBE is considerably lower than 0.001 p.a. at PLGS,
and (2) the revised NRCan seismic hazard values for NBCC2010 do not provide any basis for modifying
the 2002 seismic margin assessment for PLGS.
Now please let me describe why I became confused after reading this letter. From the above
table John Adams reviews three different PGA values and corresponding probabilities he got from NB
Powers 0087-03612-3000-001-TA-A “Evaluation of updated seismic hazard information for eastern
Canada”. The first one in the table is the Design Based Earthquake. The second two I would have
expected to be the two Review Level Earthquakes for the PSA based SMA, which I thought at the time
was for level 1 an earthquake with a probability of 1 in 10000 years with a PGA of .3 g and for level 2 an
earthquake with a probability of 1 in 100000 years with a PGA of .4 g. From the table above I was led to
believe that this might not be the case. Seen as the level he was reviewing was .5 g with a probability of
about 1 in 33,000 years not .4 g with a probability of 1 in 100,000
After conversations with Lisa Love- Tedjoutomo and Andrei Blahoianu as well as NB
Power, I found out that this is not how the rules applied to Point Lepreau.
Now I would like to explain why I thought that the RLE’s were what they were. My first
indication was with meetings with NB Power. They did explain to me that the PSA based SMA RLE for
level 1 was a PGA of .3 g with a probability of ABOUT 1 in 10,000 years, and that the RLE for level 2 was
an order of magnitude higher. This was at the first meeting we had, which was a general meeting about
the plant where seismic concerns were just a small part of it. On the second meeting, we specifically
talked about the topic of earthquakes, and we talked about the PSA based SMA in quite a bit of detail.
In our notes taken by Dr. Paula Tibbet at the second meeting that she emailed me after the meeting, it is
quite clear that we talked about the RLE’s and their relationships with the probabilities mentioned
above.
Please also see Email to Kathleen Duguay and Paul Thompson, where I am looking for the 1984
seismic hazard report used for the PSA bases SMA. Please note that I am clearly stating what I think the
facts on the matter are and NB Power never corrected me.
Chris:
Yes we can support you - We are available from 09:00 to 12:00.
Kathleen
-----Original Message-----
From: Chris R [mailto:[email protected]]
Sent: November 03, 2011 9:59 AM
To: Duguay, Kathleen
Subject: Re: 2 large tanks
I am just confirming if I can review those two documents on monday Sent on the TELUS Mobility
network with BlackBerry
-----Original Message-----
From: Duguay Kathleen <[email protected]>
Date: Wed, 2 Nov 2011 16:04:53
To: <[email protected]>
Subject: RE: 2 large tanks
Are you available for discussion on Friday November 4, 2011 from 10 15 to 11:00?
K
-----Original Message-----
From: Chris R [mailto:[email protected]]
Sent: November 02, 2011 1:00 PM
To: Thompson, Paul
Cc: Duguay, Kathleen
Subject: Re: 2 large tanks
Paul and Kathleen
At the end of the day on my visit to Point Lepreau I asked the question what seismic hazard study was
the review level earthquake for the level 1 psa based sma with a probability of 1 in 10000 years and the
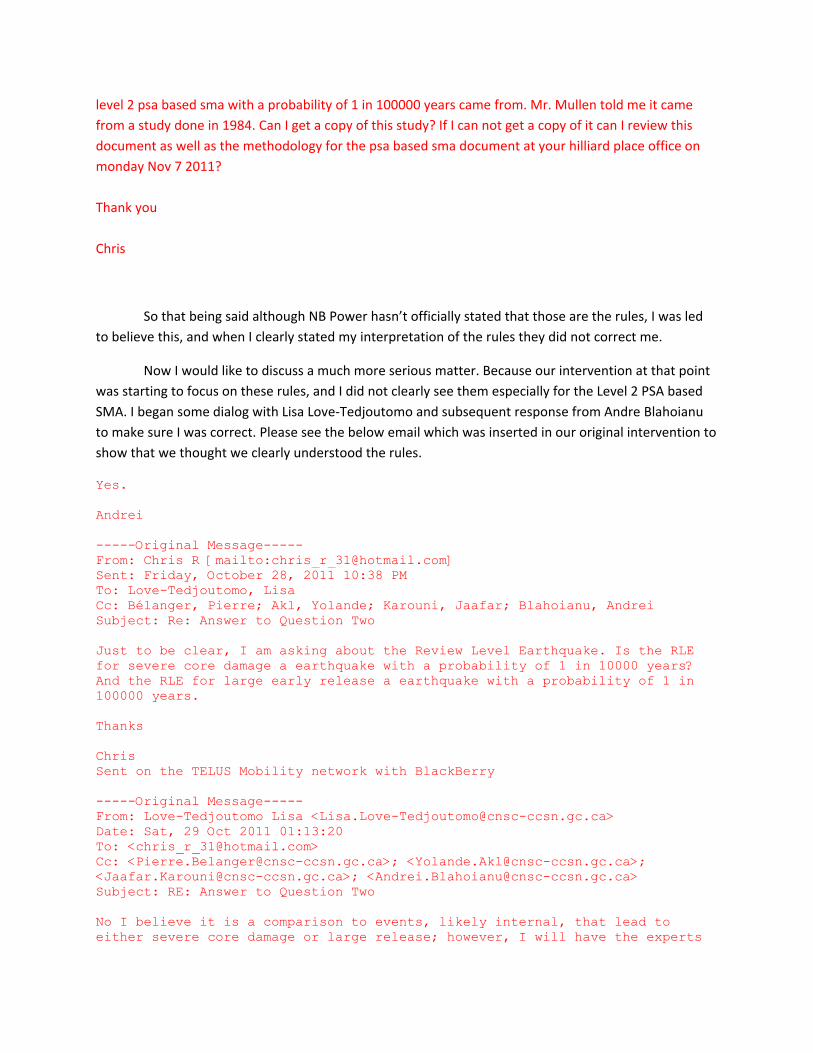
level 2 psa based sma with a probability of 1 in 100000 years came from. Mr. Mullen told me it came
from a study done in 1984. Can I get a copy of this study? If I can not get a copy of it can I review this
document as well as the methodology for the psa based sma document at your hilliard place office on
monday Nov 7 2011?
Thank you
Chris
So that being said although NB Power hasn’t officially stated that those are the rules, I was led
to believe this, and when I clearly stated my interpretation of the rules they did not correct me.
Now I would like to discuss a much more serious matter. Because our intervention at that point
was starting to focus on these rules, and I did not clearly see them especially for the Level 2 PSA based
SMA. I began some dialog with Lisa Love-Tedjoutomo and subsequent response from Andre Blahoianu
to make sure I was correct. Please see the below email which was inserted in our original intervention to
show that we thought we clearly understood the rules.
Yes.
Andrei
-----Original Message-----
From: Chris R [mailto:[email protected]]
Sent: Friday, October 28, 2011 10:38 PM
To: Love-Tedjoutomo, Lisa
Cc: Bélanger, Pierre; Akl, Yolande; Karouni, Jaafar; Blahoianu, Andrei
Subject: Re: Answer to Question Two
Just to be clear, I am asking about the Review Level Earthquake. Is the RLE
for severe core damage a earthquake with a probability of 1 in 10000 years?
And the RLE for large early release a earthquake with a probability of 1 in
100000 years.
Thanks
Chris
Sent on the TELUS Mobility network with BlackBerry
-----Original Message-----
From: Love-Tedjoutomo Lisa <[email protected]>
Date: Sat, 29 Oct 2011 01:13:20
To: <[email protected]>
Cc: <[email protected]>; <[email protected]>;
<[email protected]>; <[email protected]>
Subject: RE: Answer to Question Two
No I believe it is a comparison to events, likely internal, that lead to
either severe core damage or large release; however, I will have the experts
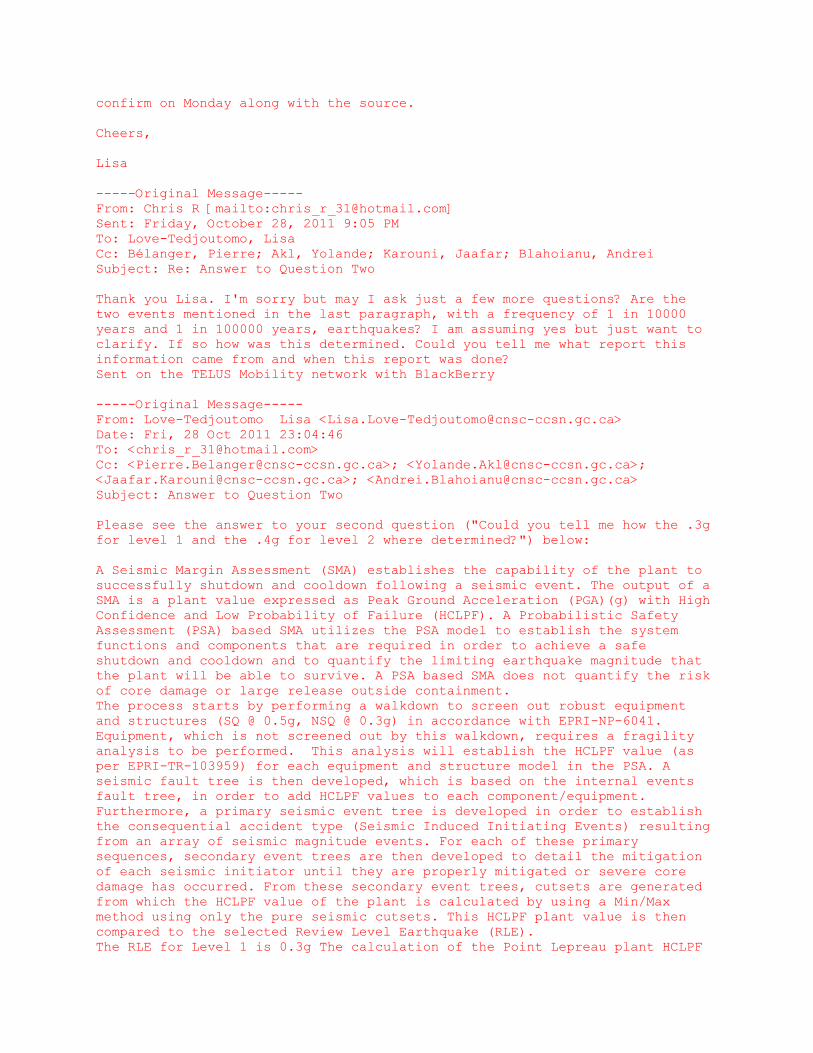
confirm on Monday along with the source.
Cheers,
Lisa
-----Original Message-----
From: Chris R [mailto:[email protected]]
Sent: Friday, October 28, 2011 9:05 PM
To: Love-Tedjoutomo, Lisa
Cc: Bélanger, Pierre; Akl, Yolande; Karouni, Jaafar; Blahoianu, Andrei
Subject: Re: Answer to Question Two
Thank you Lisa. I'm sorry but may I ask just a few more questions? Are the
two events mentioned in the last paragraph, with a frequency of 1 in 10000
years and 1 in 100000 years, earthquakes? I am assuming yes but just want to
clarify. If so how was this determined. Could you tell me what report this
information came from and when this report was done?
Sent on the TELUS Mobility network with BlackBerry
-----Original Message-----
From: Love-Tedjoutomo Lisa <[email protected]>
Date: Fri, 28 Oct 2011 23:04:46
To: <[email protected]>
Cc: <[email protected]>; <[email protected]>;
<[email protected]>; <[email protected]>
Subject: Answer to Question Two
Please see the answer to your second question ("Could you tell me how the .3g
for level 1 and the .4g for level 2 where determined?") below:
A Seismic Margin Assessment (SMA) establishes the capability of the plant to
successfully shutdown and cooldown following a seismic event. The output of a
SMA is a plant value expressed as Peak Ground Acceleration (PGA)(g) with High
Confidence and Low Probability of Failure (HCLPF). A Probabilistic Safety
Assessment (PSA) based SMA utilizes the PSA model to establish the system
functions and components that are required in order to achieve a safe
shutdown and cooldown and to quantify the limiting earthquake magnitude that
the plant will be able to survive. A PSA based SMA does not quantify the risk
of core damage or large release outside containment.
The process starts by performing a walkdown to screen out robust equipment
and structures (SQ @ 0.5g, NSQ @ 0.3g) in accordance with EPRI-NP-6041.
Equipment, which is not screened out by this walkdown, requires a fragility
analysis to be performed. This analysis will establish the HCLPF value (as
per EPRI-TR-103959) for each equipment and structure model in the PSA. A
seismic fault tree is then developed, which is based on the internal events
fault tree, in order to add HCLPF values to each component/equipment.
Furthermore, a primary seismic event tree is developed in order to establish
the consequential accident type (Seismic Induced Initiating Events) resulting
from an array of seismic magnitude events. For each of these primary
sequences, secondary event trees are then developed to detail the mitigation
of each seismic initiator until they are properly mitigated or severe core
damage has occurred. From these secondary event trees, cutsets are generated
from which the HCLPF value of the plant is calculated by using a Min/Max
method using only the pure seismic cutsets. This HCLPF plant value is then
compared to the selected Review Level Earthquake (RLE).
The RLE for Level 1 is 0.3g The calculation of the Point Lepreau plant HCLPF

for the level 1 PSA shows a result of 0.3g, and that of level 2 shows a
result of 0.42g. The results demonstrate a HCLPF of 0.3g for prevention of
severe core damage frequency, an event that has a frequency of occurrence of
1/10000 years, and a HCLPF of 0.42g for prevention of large release of
fission products from containment, an event that has a frequency of about
1/100000 years.
Lisa Love-Tedjoutomo, P. Eng.
Acting Director of the Point Lepreau Regulatory Program Division, DPRR
613-947-0218 or 613-293-5848 (BlackBerry)
****************************************************************************
***********************
The information contained in this e-mail is intended solely for the use of
the named addressee. Access, copying, or re-use of the e-mail or any
information contained therein by any other person is not authorized. If you
are not the intended recipient, please notify us immediately by returning
the e-mail to the originator.
Ce message est strictement réservé à l'usage du destinataire indiqué. Si
vous n'êtes pas le destinataire de ce message, la consultation ou la
reproduction même partielle de ce message et des renseignements qu'il
contient est non autorisée. Si ce message vous a été transmis par erreur,
veuillez en informer l'expéditeur en lui retournant ce message
immédiatement.
****************************************************************************
***********************
*** NOTE ***
The CNSC email security server scanned this email and found no potentially
hostile or malicious content. To be safe, do not open attachments from
unrecognized senders.
*** REMARQUE ****
Le serveur de sécurité de la CCSN a examiné ce courriel et n'y a trouvé aucun
contenu potentiellement hostile ou malveillant. Pour protéger votre
ordinateur, n'ouvrez pas les pièces jointes en provenance d'expéditeurs
inconnus.
Also please see from the supplemental CMD from the CNSC staff to the commissioners from the
day 1 hearings.
Based on the results of the probabilistic-based seismic margin assessment, it was
determined that in the event of an earthquake with horizontal ground acceleration
as high as 0.3g with a return frequency of about one in 10,000 years there is a
high confidence that core damage will be prevented. Additionally, there is a high
confidence that a large release of fission products from containment will be
prevented for an earthquake with a horizontal ground acceleration of as high as
0.4g and a return frequency of about one in 100,000 years. In simple terms, this
assessment approximately corresponds to an earthquake with a magnitude of
about 7 – 7.5 on the Richter scale, which is located above 30 – 35 km from the
site and is not credible for the tectonic plate of New Brunswick. This assessment
was reviewed and accepted by CNSC staff.
So note that it appears that not only have the CNSC staff NOT disseminated CCNB
Action SJ Fundy chapter with objective scientific, technical and regulatory information, they also
appear to have provided it officially in there supplemental CMD document to the commission
tribunal. The CNSC have sent out an additional CMD supplemental stating that it was just a
grammatical error. There seems to be a lot of the exact same grammatical error coming from
different sources asked in different ways. This would appear not to be just a grammatical error.
Also I think CNSC staff might be going through there emails about this looking for a way
to explain this. I do acknowledge that there were documents cited in other emails. I did look into
these documents and became confused to what the rules are. This is why I emailed them back
again for clarification on what the rules actually really were. If you look at the timeline of the
emails it would be clear that I had time and did look at these documents.
After talking on the phone with Lisa Love- Tedjoutomo and Andrei Blahoianu, they tried
to tell me that this was just a misunderstanding and that they were only trying to explain a
complicated subject in an easy to understandable way and defiantly didn’t explain it as a
grammatical error. There appears to be no provision in the Nuclear Safety and Control Act not to
provide objective scientific, technical and regulatory information to the public without the using
section 7 of the Act.
Even with that being said, there is no reason that the CNSC staff should have taken the
approach that we would not understand this complicated subject with respect to NB Powers
application for license renewal and application to reload fuel. We applied for and were granted
money for 4 expert witnesses through the Participant Funding Program. In our application it
would be quite evident that we were going to be focusing on Earthquakes. One of our experts is
Ken Burke who is the seismologist who has done much of the work for NB Power in the past.
Also, Allen Ruffman, one of our experts, suggested that there may have been conspiracy in his
earlier endeavors outside the scope of these hearings to obtain information regarding earthquakes
and Point Lepreau. This is noted in our original CMD. Also in this application I was named as an
expert to determine the rules, regulations and standards for our report. I was not named in the
approval and not granted any money for that part of our application, although I am more than
qualified. I work in an engineering environment and am familiar with many codes and standards,
and there would be no reason that I should not have been able grasp other codes, standards and
rules. Also, without giving us this portion for the participant funding, it would have left the most
important part of providing new or better understood information and comparing it to the rules
that apply to Point Lepreau.
I would think by now you would be asking yourself, “Why would NB Power, and the
CNSC staff go down such risky roads in giving us none objective scientific, technical and
regulatory information?” I have some thoughts on this, as well and an additional reason why I
thought the RLE’s for Point Lepreau were what they were.
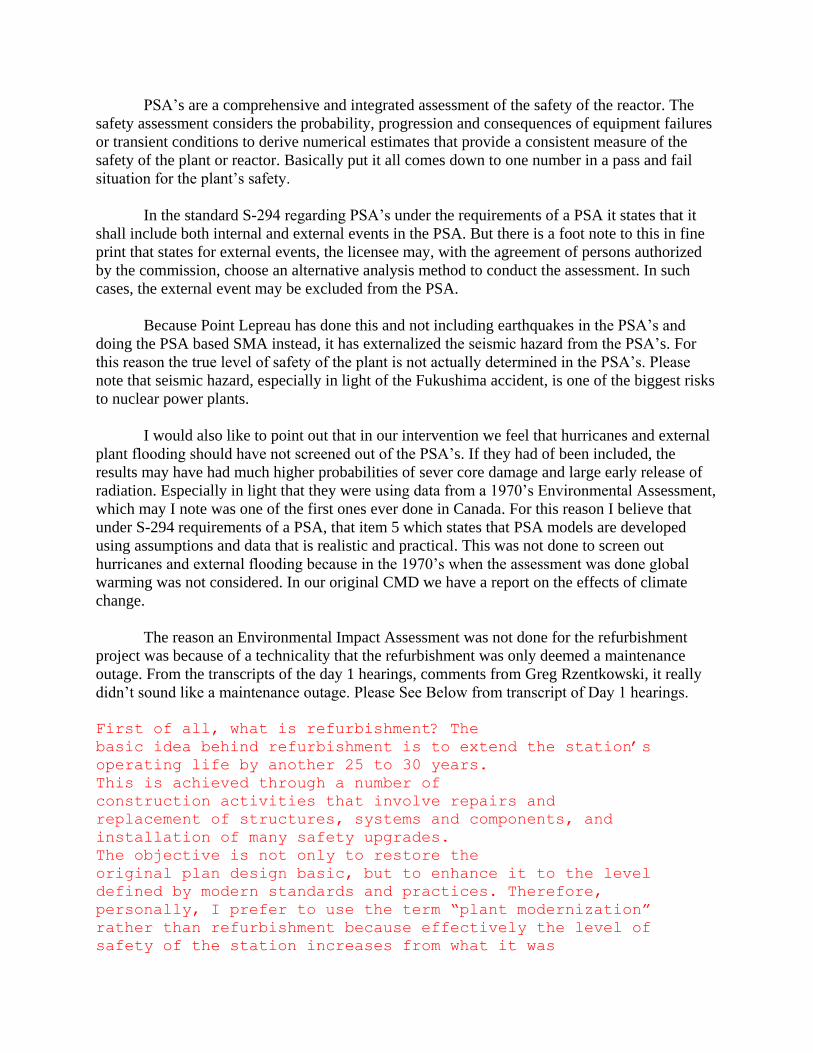
PSA’s are a comprehensive and integrated assessment of the safety of the reactor. The
safety assessment considers the probability, progression and consequences of equipment failures
or transient conditions to derive numerical estimates that provide a consistent measure of the
safety of the plant or reactor. Basically put it all comes down to one number in a pass and fail
situation for the plant’s safety.
In the standard S-294 regarding PSA’s under the requirements of a PSA it states that it
shall include both internal and external events in the PSA. But there is a foot note to this in fine
print that states for external events, the licensee may, with the agreement of persons authorized
by the commission, choose an alternative analysis method to conduct the assessment. In such
cases, the external event may be excluded from the PSA.
Because Point Lepreau has done this and not including earthquakes in the PSA’s and
doing the PSA based SMA instead, it has externalized the seismic hazard from the PSA’s. For
this reason the true level of safety of the plant is not actually determined in the PSA’s. Please
note that seismic hazard, especially in light of the Fukushima accident, is one of the biggest risks
to nuclear power plants.
I would also like to point out that in our intervention we feel that hurricanes and external
plant flooding should have not screened out of the PSA’s. If they had of been included, the
results may have had much higher probabilities of sever core damage and large early release of
radiation. Especially in light that they were using data from a 1970’s Environmental Assessment,
which may I note was one of the first ones ever done in Canada. For this reason I believe that
under S-294 requirements of a PSA, that item 5 which states that PSA models are developed
using assumptions and data that is realistic and practical. This was not done to screen out
hurricanes and external flooding because in the 1970’s when the assessment was done global
warming was not considered. In our original CMD we have a report on the effects of climate
change.
The reason an Environmental Impact Assessment was not done for the refurbishment
project was because of a technicality that the refurbishment was only deemed a maintenance
outage. From the transcripts of the day 1 hearings, comments from Greg Rzentkowski, it really
didn’t sound like a maintenance outage. Please See Below from transcript of Day 1 hearings.
First of all, what is refurbishment? The
basic idea behind refurbishment is to extend the station’s
operating life by another 25 to 30 years.
This is achieved through a number of
construction activities that involve repairs and
replacement of structures, systems and components, and
installation of many safety upgrades.
The objective is not only to restore the
original plan design basic, but to enhance it to the level
defined by modern standards and practices. Therefore,
personally, I prefer to use the term “plant modernization”
rather than refurbishment because effectively the level of
safety of the station increases from what it was

originally licensed to a level that approaches, to the
extent practical, that of new-build.
Now for another reason that I was led to believe the review level earthquakes were 1 in
10,000 years and 1 in 100,000 years. In the PSA’s there are Limits that have to be met. The limit
for is a frequency of 1 in 10,000 years for the level 1 and 1 in 100,000 years for the level 2. It
would be easy to assume that since earthquakes have been externalized from the PSA’s that the
earthquakes considered in the PSA based SMA would be earthquakes with a probability the same
as the PSA’s limits. I personally feel that in externalizing the seismic hazard from the PSA’s and
in the spirit of the PSA’s that the review level earthquakes should have been set to 1 in 10,000
years and 1 in 100,000 years and feel that the prevention of unreasonable risk to the people of
New Brunswick and the environment was not taken into consideration by not using these levels.
One might assume that maybe this is the reason that the misinformation was given. So that it
appeared that the PSA based SMA was in line with the PSA’s
When I watched the day 1 hearings, I was shocked when the topic of the numbers of the
PSA’s came up. Both senior members of the CNSC staff and senior members of NB Power
commented to the commissioners and emphasized that the numbers from the PSA’s not only
showed that Point Lepreau was safe but extremely safe. Without explaining that one of the
biggest risks to the plant, seismic hazard, was not included and that other serious events had been
screened out, I would hardly consider this scientific or objective.
Even in the 2009 IRRS report they note that external events may be excluded from the
PSA’s
Now I would like to get back to NB Powers document 0087-03612-3000-001-TA-A “Evaluation of updated seismic hazard information for eastern Canada”. In our intervention we came to the conclusion that NB Power may have knowingly given misinformation to the CNSC in regards to this. It turns out that, because of the information received since our deadline, that this is not true. However I still have many problems with the technical assessment that was done, and that I do not believe it was done properly by NB Power and not reviewed properly by the CNSC staff.
The first thing I would like to point out is that NB Power did not extrapolate the probabilities for
the PGA values of .3 g and .5 g from the NRCan data as is recommended on their website for screening of these low probabilities. They only used the numbers given from the online calculator which only got up to about 1 in 2475 years. So the only number that actually got reviewed was the DBE, not the screening levels of .3 g and .5 g. NB power assumed that everything was ok and the CNSC staff approved the technical assessment based on the limited seismic hazard curve from the NRCan fitting below the curves they were using. Please see below the justification from NB Power that everything was ok.
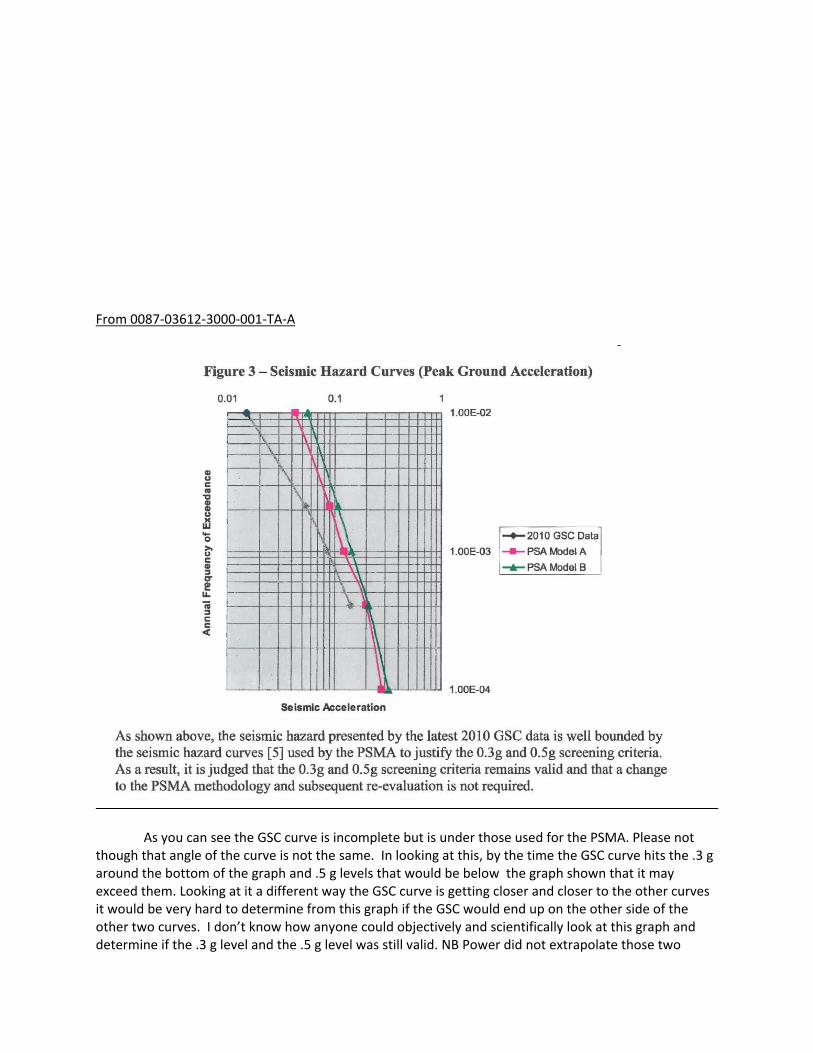
From 0087-03612-3000-001-TA-A
As you can see the GSC curve is incomplete but is under those used for the PSMA. Please not
though that angle of the curve is not the same. In looking at this, by the time the GSC curve hits the .3 g around the bottom of the graph and .5 g levels that would be below the graph shown that it may exceed them. Looking at it a different way the GSC curve is getting closer and closer to the other curves it would be very hard to determine from this graph if the GSC would end up on the other side of the other two curves. I don’t know how anyone could objectively and scientifically look at this graph and determine if the .3 g level and the .5 g level was still valid. NB Power did not extrapolate those two

points from the GSC hazard curve as recommended and shown how to on the GSC website. Although they attempted to extrapolate in a later report which I will comment on.
I ask the commissioners to please ask John Adams to comment on Day 2 that just by looking at
the report and not extrapolating the curves as he did in his letter to the CNSC if he could have come to the same scientific and objective conclusions as NB Power and the CNSC staff?
I have asked John to comment on a few things in the last week, but he told me his boss
recommended that he does not. On day 1 Mr. Binder specifically asked John Adams to discuss earthquakes using the
Richter scale. I noted from watching the hearings that he mentions the 1904 earthquake as a 5.7, but on the NRCan website is shows 5.9. Would the commissioners please ask John Adams why there is a difference to what he said on Day 1 and what is on the NRCan website.
It is important to know that the reason for this technical report was to determine, after the
Fukushima accident, if the seismic hazard had increased at Point Lepreau. This only came about from a warning from the NRC and was not initiated by the CNSC. One of the things I have heard repeatedly about the Japan disaster is that the operator had been caught fudging reports to the regulator, and that the regulator was accepting these fudged reports.
Also this would be a great example of the regulatory risk I mentioned in our original
intervention. What if there had of been a greater seismic risk at Point Lepreau, what additional work and money would have had to be spent bringing the plant up to a new level. Although I was misled in the rules that apply to Point Lepreau the basis of my original report was that it has increase. Using the NRCan curve to determine this is unethical because of its many warnings from them that there data is not reliable at these low probabilities. The only way to determine this would be to have a consulting engineering company do a current seismic hazard study on Point Lepreau, if they don’t want to use the Weston Geophysical report. You could also draw some similarities to this to the Ore Emulsion fiasco NB Power went through which I already mentioned in our first submission. Where they went ahead and spent a lot of money without a contract in hand there. Hear NB Power spent all this money and time on a SMA and PSA’s without a current seismic hazard report and Environmental Assessment in hand. But if everyone still insists on using this old 1984 report, please look at it closely. It references the Miramichi New Brunswick earthquake with a PGA level of around .5g
Looking at the letter from John Adams there is an additional document named 0087-03612-
3001-001-TA-A which the CNSC has asked him to review, but he declines saying NRCan does not believe it has the technical expertise to comment on it. It looks as if the CNSC have not had that document properly reviewed either even though it has been accepted by them. I have asked the CNSC for their official paperwork on accepting and approving this technical document, but again have not as of this time received anything. This does not seem to be very transparent.
I am assuming this is the document that the CNSC felt was too complicated for me and to
understand. It also seems might be the justification for why earthquakes were not included in the PSA’s. I have reviewed this document and I have some very serious problems with this one as well.
Before I get into the problems with this document I first would like to talk about ethics. Many of
the people involved in this licensing are professionals. In higher education there are almost always

ethics courses that have to be taken. Most professional associations have ethics clauses in them. I would like to remind all the engineers why they wear the iron ring on their baby fingers. It took me all of 3 minutes briefly reading this document on my blackberry to find many problems with it. This document really brings me to question the ethics of this whole process.
First of all I want to explain to the commissioners what this whole concept of HCLPF. I believe I
explained it in the original intervention but feel compelled to explain it again in more detail. This term means High Confidence of Low Probability of Failure. For this license it is defined by 95% confidence that there will be a low probability of failure. Normal and ethical engineering is robust with much thought put into it, and to take into account most importantly the safety of people. The HCLPF takes this normal ethical engineering and takes all the safety margins out of it till they are only 95% confident that there won’t be a failure. I as well as you commissioners should be concerned that they are only 95% confident. Ethically I have very strong objections to the concept of HCLPF and I think everyone in the licensing matter should. It really pushes the Nuclear Safety and Control Act to its limits to prevent unreasonable risk to the environment and to the health and safety of persons.
This document in my opinion takes ethics to a whole new level. They have taken these already
ethical levels of HCLPF, and data from the 1984 seismic hazard report which I have shown in my intervention to be too low, then improperly extrapolated the data from these curves and did a bunch of unproven un-peer reviewed math on them and tried to use the results to prove that there is no significant increase to the severe core damage frequency and large early release frequency. The worst part of it all is that the CNSC staff approved this. They tried to get John Adams to vouch for this very unethical piece of engineering but he declined.

First I would like to show from this document 0087-03612-3001-001-TA-A-01-0000 the reason
and conclusions for this document.

Again there seems to be a huge regulatory risk at play again. Where the CNSC will not approve
an already approved SMA, unless NB Power can show that it is still meeting its regulatory requirements. If this SMA is not approved it would be a HUGE financial risk to Point Lepreau. Note the reason for this

document is because industry review of their original submission has questioned their methods and uncertainty in the results of their expected risks. Has this method used in this report been industry approved? Also please note the use of hybrid method which would suggest that this is not a proven engineering method of assessing seismic risk. It even mentions later in the document that Kennedy’s proposed method would suggest that this is also not a proven engineering method.
Now I would like to discuss my second meeting with NB Power. This meeting request was
specifically on the topic of earthquakes. They told me they would bring their specialist in to talk to me. When I arrived I was introduced to Derek Mullen. He introduced himself, and I found out that instead of a seismologist or an earthquake engineer he was an electrical engineer. When we started talking about seismic hazard and the NRCan data we actually had a laugh because we had just gone through the same process of figuring out why the NRCan data was so high, and that it was because Point Lepreau was on hard rock not firm soil as the data is presented for the National Building Code. It really seemed like we had just went through the same learning curve. My qualifications are also in the electrical engineering field.
Please see below from the IAEA document on seismic margin analysis of existing Nuclear Plants. 5.4. The SMA assessment team should be a multidisciplinary team made up of systems engineers,
operations personnel and seismic engineers with recognized expertise in the subject area. The systems engineers focus on defining front-line and support systems necessary to achieve the desired plant end state on the basis of the assumptions listed in para. 5.3. Systems and operations personnel formulate the candidate alternatives for safe shutdown and select the final preferred safe shutdown path (and an alternative path, if required) with the assistance of the seismic engineers. Seismic engineers screen the selected SSCs for ruggedness and in-plant vulnerabilities, and calculate HCLPF values (see para. 5.11) for those SSCs that are included in the safe shutdown path(s). A typical assessment team has 3–5 members. The SMA assessment team doesn’t seem to need an electrical engineer. So everyone reading this is probably asking themselves how I might be qualified to comment on this, my background is not a seismic engineer either. Well I am not, but I have over the last few months done a lot of research and defiantly have gotten a pretty good grasp and in my line of work I deal with all kinds of charts and graphs, and have done many safety projects. One thing I have learned is that hazard curves are in FACT curves and not straight lines. How you turn a hazard curve into a straight or at least a near straight line is to plot it on a log to log scale. If anyone reading this, questions this, please refer to Page 19 and 20 of our original intervention, where there is an excerpt from the NRCan Website on how to properly extrapolate their seismic hazard curve. For the first two minutes I started to read this document, I was worried that this document was going to confuse the whole subject with this obscure method, till I saw how they extrapolated data from the seismic hazard curve. Please see below how not to extrapolate seismic hazard curves. If this method for extrapolating data was used in the report above there would have been a huge increase in seismic hazard for Point Lepreau.

Also please note the above reference [7] to the accepted practice to extrapolate data, I think
this document should be reviewed as well, or at least to see if Derek interpreted the method correctly. Commissioners the fact of the matter is if you have an earthquake with a probability of 10,000
years or 100,000 years and are comparing it to a PGA value that you have already taken the normally robust seismic design out of it, the probability of sever core damage or large early release is really just the probability of the g level of the earthquake. Therefore if seismic hazard was included in the PSA’s Point Lepreau would not meet its safety limits. Even if this fancy math is used if you extrapolated the data properly the large early release is not going to meet its limit. Just for your information in the level 2 PSA based SMA results show that Point Lepreau will be able to prevent large early release at .42g. When Extrapolated using the out of date seismic hazard report they are using, this is an earthquake with a probability of about 1 in about 20,000 years. This would be 1 fifth of the safety limit or goal or whatever NB Power and the CNSC decide on. Also if you add the other hazards to the level 1 PSA it also would not pass.
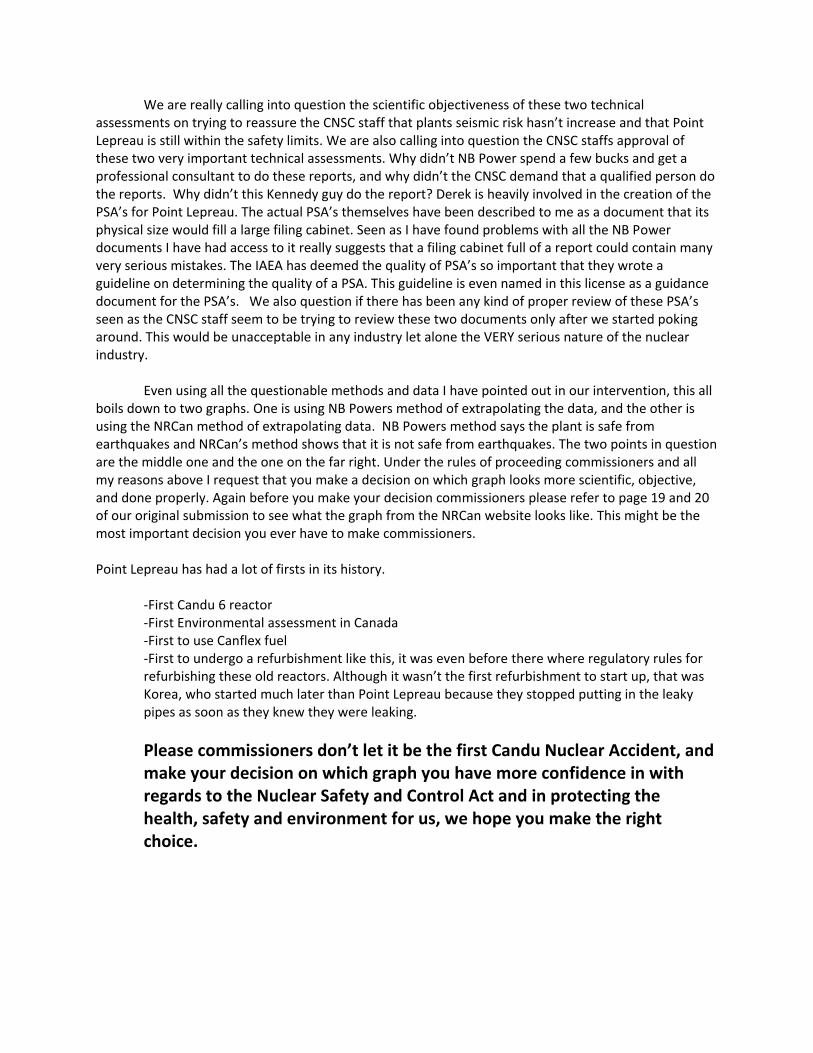
We are really calling into question the scientific objectiveness of these two technical assessments on trying to reassure the CNSC staff that plants seismic risk hasn’t increase and that Point Lepreau is still within the safety limits. We are also calling into question the CNSC staffs approval of these two very important technical assessments. Why didn’t NB Power spend a few bucks and get a professional consultant to do these reports, and why didn’t the CNSC demand that a qualified person do the reports. Why didn’t this Kennedy guy do the report? Derek is heavily involved in the creation of the PSA’s for Point Lepreau. The actual PSA’s themselves have been described to me as a document that its physical size would fill a large filing cabinet. Seen as I have found problems with all the NB Power documents I have had access to it really suggests that a filing cabinet full of a report could contain many very serious mistakes. The IAEA has deemed the quality of PSA’s so important that they wrote a guideline on determining the quality of a PSA. This guideline is even named in this license as a guidance document for the PSA’s. We also question if there has been any kind of proper review of these PSA’s seen as the CNSC staff seem to be trying to review these two documents only after we started poking around. This would be unacceptable in any industry let alone the VERY serious nature of the nuclear industry.
Even using all the questionable methods and data I have pointed out in our intervention, this all
boils down to two graphs. One is using NB Powers method of extrapolating the data, and the other is using the NRCan method of extrapolating data. NB Powers method says the plant is safe from earthquakes and NRCan’s method shows that it is not safe from earthquakes. The two points in question are the middle one and the one on the far right. Under the rules of proceeding commissioners and all my reasons above I request that you make a decision on which graph looks more scientific, objective, and done properly. Again before you make your decision commissioners please refer to page 19 and 20 of our original submission to see what the graph from the NRCan website looks like. This might be the most important decision you ever have to make commissioners. Point Lepreau has had a lot of firsts in its history.
-First Candu 6 reactor -First Environmental assessment in Canada -First to use Canflex fuel -First to undergo a refurbishment like this, it was even before there where regulatory rules for refurbishing these old reactors. Although it wasn’t the first refurbishment to start up, that was Korea, who started much later than Point Lepreau because they stopped putting in the leaky pipes as soon as they knew they were leaking.
Please commissioners don’t let it be the first Candu Nuclear Accident, and make your decision on which graph you have more confidence in with regards to the Nuclear Safety and Control Act and in protecting the health, safety and environment for us, we hope you make the right choice.
NB Power Method
PGA
Probability
Probability
Data Source
From
NRCan
Letter
From
NRCan
Letter
NB
Power
Method
From
NRCan
Letter
NB Power
Method
PGA 0.2 0.3 0.41 0.5 0.57
Probability 0.0004 0.00012 0.000022 0.00003 0.0000009
0.0000001
0.000001
0.00001
0.0001
0.001
0.01
0.005 0.05 0.5
Series1

NRCan Method
PGA
PGA
Probability
Probability
Probability
Data Source
Also I would like to mention that in the IAEA document, I mentioned above, at the very end of the process for doing a SMA is says PEER REVIEW which it seems isn’t done, as well as a proper CNSC staff review.
That is all I have for new information, but please note that we have many other problems with
this licensing from top down to bottom up in our intervention, and that this is only supplementing our original intervention. We also believe that this is only the tip of the ice burg, and that under a fine microscope even you would be shocked.
From NRCan Letter From NRCan Letter NRCan Method From NRCan Letter NRCan Method
PGA 0.2 0.3 0.41 0.5 0.57
Probability 0.0004 0.00012 0.00005 0.00003 0.00002
0.000001
0.00001
0.0001
0.001
0.01
0.005 0.05 0.5
Series1

CONCLUSIONS RECOMMENDATIONS AND OUR PATH FORWARD I feel compelled to tell a bit about my story on this. I haven’t been working on this for years and
years like a lot of the people I have met during the last few months. I actually started to have a look at it for my fiancée, who was an intervenor in the PUB hearings, after the Fukushima accident. I have been shocked at some of the stories I have heard about the CNSC but didn’t really grasp it all till the CNSC 101 meeting in Saint John. There I met Paul and Kathleen and they were really nice and cared about what we thought and took our concerns seriously, and for the most part have been very helpful. It was after the CNSC 101 I started attending our Nuclear Free NB Coalition meetings. From the first day I attended a meeting and agreed to help I stated that the way I wanted to do this was to only use the actual rules and regulations and only look at data from the source, and to try to stay as scientific and objective as I could. It really surprised me that the more I dug the worse it seemed. Every document I looked at, every meeting I attended, every phone call I had, every experience I have had with this has only made my opinion of how dangerous nuclear power in Canada really is, especially in the wrong hands.
This is however, not NB Powers fault. The CNSC staff should have never given them the go
ahead to proceed with this dangerous and expensive undertaking without the proper checks and balances in place. It truly is their fault at not insisting an environmental assessment be done. It is their fault they didn’t insist on a current seismic hazard analysis to be done. It was there fault that they didn’t make NB Power choose seismic levels that would put them in line with their own safety goals, and then make NB Power scramble to try and prove that they would. It is there fault none of NB Powers important safety documents have not been properly reviewed. It is their fault they didn’t insist that NB Power stop putting in the leaky tubes. This truly is the fault of the CNSC staff not NB Powers.
Seen as the level of our intervention went from mostly based on a regulatory basis to the
highest level of the regulatory framework the Nuclear Safety and Control Act, I recommend that the CNSC use section 7 of the Nuclear Safety and Control act to immediately make its decision on the license renewal and application to reload fuel for Point Lepreau, and that the decision be to not grant them.
Mr. Binder I don’t understand how all of this can be handled in the two days on Dec 1 and Dec 2.
Also I would like to point out that our intervention is quite technical in nature. Do you or the other commissioners feel comfortable making such important decisions on all of these technical matters? Especially seen as your supposedly very technical staff have recommended this license to you and all of these very serious concerns have come up, and the fact that they may have broken the Nuclear Safety and Control Act, specifically on the topic of earthquakes in light of the Fukushima accident?
Also after talking with your staff in regards to the Open file 2929 they had the nerve to try and
tell me that it was too conservative without them having a more current seismic hazard study in hand. Mr. Binder does your staff even know about the Fukushima accident, they certainly don’t seem to understand the lessons learned.
If your staff was concerned with upholding the Nuclear Safety and Control Act, the CNSC staff
wouldn’t be scrambling around trying to defend their decisions and trying to get stuff reviewed after it already has been accepted, but they should have been taking these matters very seriously and recommending to you that these hearing not proceed. Instead they put out another supplemental CMD correcting there grammatical error and still recommending this license. I thought when I saw the supplemental yesterday that at least they were going to update the license condition for the containment leak test to say it had to pass. This was put in as a license condition before refueling, what

difference does it make, if it doesn’t have to pass? I guess it is like the last time it didn’t pass and the CNSC staff still let them operate. They should be asking very serious questions like, should a full EIA take place, should a more current seismic hazard analysis be done, should earthquakes, hurricanes and external flooding be excluded from the PSA’s and most importantly is it SAFE to be refurbishing these old 1970’s reactors to run 30 years past their life expectancy. This is a very big concern of ours that it seems nobody on your staff has seriously looked at, and certainly the public hasn’t had any input too.
We do not feel that the CNSC staff should be telling us that in regards to the RLE’s that this is
just a grammatical error. There are so many things wrong with that. We are taking this very seriously and will be consulting legal advice on these matters, which it seems very clear cut to me. If the hearings do proceed, we will be asking under the rules of proceeding to get the commission to make the decision if the Nuclear Safety and Control Act has been broken by the CNSC staff in specific regards to this licensing.
Also another consideration so that we might stop wasting everyone’s time is that if the hearings
do proceed and a license is granted we will be most certainly and well within our rights to do so, appeal the decision under the rules of proceeding. We spent a considerable amount of our time, and the participant funding money on our intervention on rules the CNSC misled us on, and that will be the basis for our appeal.
Mr. Binder I would also like to comment on two things you said in the day 1 hearings, and I
believe the first one you were just talking to Andrei “You know, listening to you, you’re not calming our angst; in fact, you’re compounding it” and
“I read this page and it scared the hell out of me, you know”
Firstly, and to a much larger extent, I feel the same. Secondly, I somehow doubt you would want these people speaking on the record on day 2, especially since I am sure there will be many eyes watching? I was so shocked when I saw the CNSC staffs power point presentation for day 2 trying to defend their decision that I almost hit the floor.
If the hearings do proceed I am fully prepared to handle it technically, morally, and legally. I am
almost certain I could explain things to you and the commissioners better than your staff can and have. I had heard that the CNSC had invited the IAEA IRRS review team to the day 2 hearings but they
declined to go, because they had seen public hearings before. I think they may now like to see the hearings, so I will be emailing our intervention to the IAEA to see if they still want to decline.
Also if you are taking the external review committee for the Fukushima lessons learned seriously
I might suggest that you invite them to the day 2 hearings, as I think this would be very interesting to them.
We will also be sending copies of this to Stephen Harper, Joe Oliver, and David Alward. As well
begin writing press releases on our thoughts. Sincerely Chris Rouse CCNB Action SJ Fundy Chapter

Summary of CCNB Action Saint John Fundy Chapter Intervention‐Part 1
The CCNB Action SJ Fundy Chapter’s Intervention contains 2 parts. One is a scan of most of the aspects of the license to operate using NB Power’s own form with special focus on seismic and safety issues. The other is a report called “The Potential Impacts of Climate Change and Seismicity in Relation to the Point Lepreau Nuclear Generating Station”.
The license assessment deals with in depth and technical issues that are necessary to prove scientifically that the plant is not safe. The summary should make it easier for non‐technical people to understand how serious this is. We conclude that due to the very serious risk to the public, the economy and the environment, Pt Lepreau Nuclear generating plant should be decommissioned now.
I am sure the CNSC were unprepared for the serious concerns when they first read the interventions from all of our coalition supporters. However, like the unexpected disaster at Fukushima with the tidal wave that followed, our concerns demand immediate action. However, rather than waiting 3 days to pour sea water on the reactors, we hope the big lesson learned will be to shut the hearings down by pumping seawater on them now.
Despite insane deadlines and inadequate funding, our intervention paints a detailed picture of the problems at Pt Lepreau. We used NB Power and the CNSC’s own documents to show that there are serious holes in just about every aspect of this application to re‐ license. We were dismayed at the lack of studies, the unknowns and the confusion surrounding the correct data. Currently, to make matters worse, new information we obtained last week, points to very serious possible problems with the regulator. We believe we have uncovered only the tip of the ice burg as every time we read a document to do with Pt. Lepreau, have a meeting with those in charge, or go on a tour of the plant, our concerns only get worse. When CNSC President, Michael Binder said at the Day 1 hearings, “You know, listening to you, you’re not calming our angst; in fact, you’re compounding it”, we were happy that the CNSC President felt the same as us.
We make the point in our intervention that the economics of Pt Lepreau have never made sense. In 2002 at the Public Utilities Board Hearings it was decided that refurbishing the plant was not in the public’s interest. This is still the case in that the cost of power from Pt Lepreau would be at least 11 cents/kwh (cost at time of shut down) while we are currently paying 9.5 cents/kwh. As well, it has been shut down since 2008 and we have not had a power shortage. The cheaper power from Quebec is readily available and renders Pt Lepreau unnecessary. We have concluded that Pt Lepreau is too expensive and is not needed.
The money situation is bad but so are the management problems within NB Power. Now close to 5 billion dollars in debt , NB Power still allowed a major re‐tube of it’s core knowing the tubes where faulty. South Korea was doing the same refurbishment and stopped the installation of the tubes immediately when they found the same problem as NB Power. At Pt Lepreau however, the management allowed work to continue. We believe that a culture of mismanagement appears to exist within NB Power management which is not compatible with Nuclear Power Plants.
Sound science and up to date data are very important when we are dealing with lives, huge economies of scale and an entire biosphere. When billions are spent on a project, backing up your investment with quality assurance is a must. This was not the case with Pt Lepreau. An Environmental assessment wasn’t done because they were only shut down for a “maintenance outage”. It does not sound like a maintenance outage though when a senior CNSC member is on record reporting that so much work was done that it was almost considered to be in line with a new plant. Serious safety matters used old data from one of the first Environmental assessments in Canada.
Many important questions have not been asked around the issue of Pt Lepreau. One of the most obvious ones is, “is it safe to refurbish these old reactors?” This has never been seriously considered and if a proper EA had been done this question would have been answered. Right now, we know there are lawsuits surrounding the EA for the new reactors at Darlington. If there are that many concerns over new reactors that are known to be safer than the 1970’s version, it just doesn’t seem wise at all to try and run these old reactors for another 30 years past their life expectancy. The whole refurbishment is not being properly looked at. It is kind of like putting a new engine in old car that never worked great even when it was new.
Safety issues make up a major part of our intervention and we focus on earthquakes in light of the Fukushima accident. The complicated calculations are very important so we spent a great deal of time and effort to make sure we understood the limits and rules used to calculate earthquakes. We talked to NB Power about them. We talked to and have emails from the CNSC staff where we checked and double checked about them. Even in the supplemental information given by the CNSC staff to the commissioners after the day 1 hearings it quite clearly states that the limits are the same as what we understood them to be. We spent a lot of time preparing a major part of our intervention using these numbers. However, after receiving an email from John Adams (NRCan), and talking with the CNSC staff and NB Power, we found out that the rules, are really not the rules. Regardless, we have confidence in our intervention. The CNSC staff has downplayed this situation as just a misunderstanding because they were trying to dumb down a complicated matter. We note that we received money from the Participant Funding Program to hire Ken Burk as one of our expert witnesses. Ken Burk is a seismologist that has done much of the work for NB Power since the seventies. Dumbing down should not be necessary. We are taking this matter very seriously because we feel it is a violation of the Nuclear

Safety and Control Act which states that the CNSC are required by law to disseminate objective scientific and regulatory information to the public.
There is a newer seismic hazard analysis report, commissioned by the Attorney General of Canada and used by the CNSC already for an unrelated project that was not used to assess seismic risks at Pt Lepreau. In this document, the hazards at Pt Lepreau are larger than currently designed for. Instead, an even older document from 1984 is being used minus the worst case scenario. We have learned that the Fukushima earthquake was much larger than planned for. We believe those in charge of Pt Lepreau have not learned any lessons and that deliberately omitting worst case scenarios and using an out of date by a quarter century study to justify their seismic readiness is very dangerous.
Another very serious concern came out of the same email conversation from John Adams. It was regarding a technical report that NB Power had to do on the possibility of increased seismic hazard in light of the Fukushima accident. We feel there are many problems in this report. The methods used in this report did not follow the recommended guidelines. Very important information was left out of the report. We do not understand from the information in the report how the conclusion that there was no increase in seismic hazard could have possibly been made. We think that perhaps the CNSC staff approved this report, and that they only checked it against the proper data after the email to John Adams. In a separate letter from John Adams he also comments that he is not qualified to comment on another document concerning this, which would indicate that although we believe this report to be accepted by the CNSC that there is still a part of it yet to be reviewed.
We have serious issues with the main safety study that was done for the refurbishment, the probabilistic safety analysis (PSA). This study measures the whole plant safety, like a grading system with a pass or fail. Because they had old data from the first environmental assessment, hurricanes and flooding were not a concern to them. As well, seismic hazards weren’t included (they were allowed to exclude external risks in a footnote written in fine print) The International Atomic Energy Agency (IAEA) noted recently that regulatory improvements are necessary for Canada http://www.iaea.org/newscenter/pressreleases/2009/prn200909.html in many areas where safety is an issue. The seismic hazard was worked out using another method outside of the PSA calculation. That PSA # is essentially meaningless because it is missing seismic hazards which are a big part of safety. We find it hard to understand how plant safety can be measured when key climate change, seismic and flooding data is missing.
There are other serious design flaws dealing with safety that apply to all Candu reactors called generic action items. Many have not been solved including the positive void coefficient which was responsible for the Chernobyl accident and Canada’s first nuclear accident, an NRX reactor remarkably similar in design to the Candu. Although other countries will not even allow reactors with such serious design flaws to operate, Canada does. We believe that in this time of climate change, earthquakes and terrorism, reactors with design flaws that could cause mass devastation should not be licensed.
Point Lepreau has a known history of feeder pipes cracking for various reasons. Early refurbishment was the immediate answer to this problem but although the pipes are now new, the problem of stress cracks, pipe embrittlement and the resulting catastrophic accident if more than one breaks have not been solved or even completely understood. We believe that no licensing body anywhere should have confidence in the safety of crucial equipment that have a history of unforeseen breaks.
Advertising Canada has been clear with the nuclear industry that they are not to misrepresent nuclear power as non‐emitting. On top of the fossil fuel burned in the nuclear fuel cycle, many other radioactive elements are continually emitted from nuclear power plants. As a matter of fact, NB Power should not be representing nuclear power as green. Using tritium as an example, compared to other types of reactors, Candu reactors emit especially high amounts. The safe limit in Canada for tritium in drinking water is 7,000 Bq/L. The USA’s limit is 740 Bq/L. In Europe the limit is 100 Bq/L. Again this seems to be the rules fitting the reactor not the reactor fitting the rules. Nuclear is not Green. It leaves a legacy of waste behind forever and emits a host of mutating and cancer causing agents that permeate all living organisms for a very long time.
The final thing we are asking for is that these hearings to be cancelled. NB Power should not get an operating license. We believe that the Nuclear Safety and Control Act has been violated and intend to ask under the rules of procedure for the hearings for a decision from the commission as to whether the act has been broken.
Summary of CCNB Action Saint John Fundy Chapter Intervention Part 2
The CCNB Action SJ Fundy Chapter’s Intervention contains 2 parts. One is a scan of most of the aspects of the license to operate using NB Power’s own form with special focus on seismic and safety issues. The other is a report called “The Potential Impacts of Climate Change and Seismicity in Relation to the Point Lepreau Nuclear Generating Station”. This is the report summary. The whole report with all references available upon request is online on the CNSC’s website.
Seismic studies, nuclear power and climate change have a lot in common when examining the Pt. Lepreau generating station. They share many known uncertainties and are somewhat better understood now than 30‐40 years ago. During the refurbishment however, the uncertainties, new knowledge and better understood information was known but not properly interpreted, legislated, funded or implemented.
We consulted 2 of the professionals that NB Power has engaged over the years to research and justify their seismicity confidence and design and asked them for their expert opinions on seismicity in the Lepreau area and in relation to the plant including a request to update seismic data. We also contacted a professor of nuclear physics from Montreal and asked him how seismicity might affect different systems in a nuclear plant and what are the dangers? Finally, we asked a climate change expert for a “best practices” document regarding climate change adaptation and precautionary best practices.
After analyzing our expert’s reports and email conversations, the CCNB SJ Fundy chapter is of the opinion that the uncertainties, concerns and risks that exist surrounding the safety of Pt Lepreau Nuclear generating plant far outweigh the adaptation, precaution and regulation that have been taken to mitigate the hazards from happening.
This paper shines a light on the red flags, new knowledge and in the case of climate change, recommendations that came up in our expert’s submissions. All the experts share concerns about best practice, newer knowledge that has not been used in studies and a concern for the lack of oversite or responsibility taken regarding Pt Lepreau and their field.
We are of the opinion that when the experts that do the research that is used to protect the health and safety of the citizens and the environment are concerned and raise red flags, society should listen. One of the NB Power experts even made the case that the accident in Fukushima was forewarned and the experts did nothing to mitigate the disaster. He believes something similar may be happening here. It is time to act responsibly and decommission Lepreau before it’s too late.
Section 1‐Ken Burke‐New Seismic data and uncertainty
New Information: The data base for earthquakes within 200 km of Pt Lepreau for 2002‐Oct 8, 2011 has been updated. In his report, he points to: 2008 research that identifies a previously unmapped thrust fault with a NNW‐SSE strike and a dip of about 45 degrees W as being the causative feature; previously unlisted seismic events; location changes of seismic events; acknowledgement of a 2006 study which describes the results of a high sensitivity marine magnetic survey where a magnetic anomaly crosses the fault in the Passamaquoddy Bay; a link to the Ocean Mapping Group at UNB which is investigating the Passamaquoddy Bay pockmarks; a reference to a 2006 marine magnetic survey which suggests a 220m post‐upper Jurassic offset of the Oak Bay fault and similar offsets of NW trending faults in Passamaquoddy Bay.
Red Flags: The concerns, uncertainties and issues that come to light in the correspondence and report from Professor Burke are as follows:
‐He points out that not all potentially active earthquake source locations in New England may have been found
‐He explains that Neotectonic investigations have continued in Passamaquoddy Bay, but much of the work is still in progress or incomplete.
‐He notes that seismicity in the Passamaquoddy Bay region may be explained by movements along NW trending faults.
‐He notes that the origin of the Passamaquoddy Bay pockmarks continues to be a subject of investigation
‐He wrote that to his knowledge, there has been little work done on neotectonics in southern New Brunswick
‐ He wrote that “From my experience, research is never finished and there are always new scientific ideas to test and validate. I think NB Power have to demonstrate they are at least up to date in what is known.”
‐ He wrote that he thought an up to date seismic hazard assessment would be required for Pt Lepreau
‐ He wrote that “It is surely the responsibility of NB Power to prepare a full environment assessment report and I assume this has already been done by a consulting company, similar to Jacques Whitford.”
‐ He explained that he is “ a seismologist, and not an earthquake engineer. I do the front end of the seismic hazard studies; in other words study the previous earthquake history in regions of interest and try to determine their cause.” (Editors note: this is an important distinction. An earthquake engineer would need to use Burke’s data, rather than simply taking it as a stand alone piece of science that they base their earthquake ready confidence in. )
‐ He suggested that “NB Power should have retained the services of consulting engineers to make a site specific hazard assessment. I do not have the resources to do this kind of assessment, so can only promise to review the report when it is released.”
Section 2‐More questions and unknowns‐ Alan Ruffman
New information
Professor Ruffman refers to new documents in AR 5 now available by Ken Burke that he believes contain seismicity work that would lead to a larger possible ‘design’ earthquake. He refers to new building code standards in the Passamaquoddy Bay in AR 12.
Red Flags
The concerns, uncertainties and issues that come to light in the correspondence and docs from Professor Ruffman include:
‐ He was unable to access documents cited in the Lepreau Env Assessment Report to ascertain exactly the data used to set the maximum magnitude earthquake for which the original Lepreau plant was designed.
‐He was concerned about whether or not the plant was designed to the correct level of earthquake
‐He has concerns about the CNSC re‐licensing process
‐He was concerned about the use of old data

‐He was concerned the plant was under‐designed seismicity
‐He stresses the importance of action on new knowledge by including a document that warned of a Tsunami in Japan in 2001.
‐He suggests that there would have been a more stringent engineering requirement put on the plant design to withstand a somewhat higher seismic hazard.
Section 3‐New Seismic considerations in Conjunction with other Nuclear Power Plant Hazards‐Michel Duguay
The report contains sections that pertain but are not limited to Positive void coefficient, pipe ruptures, lessons that should be learned from Fukushima, seismic concerns.
New information
New information that is brought forward regarding the lessons we should have learned from Fukushima and the aging problems of the high‐pressure tubes.
Red Flags
‐He writes that the History and significance of earthquake hazards are a concern.
‐He points out that the probabilities over a 50‐year interval of a serious seismic incident is the same probability of getting two sixes upon the single throw of two dice.
‐He is concerned about pressure tube aging and large‐break loss‐of‐coolant accidents
‐He has concerns that large‐break loss‐of‐coolant accidents and the possibility of an earthquake are not analysed together
‐He points out that with a build‐up of uranium oxide fuel damage is possible
‐He is concerned that aging equipment and structures can lead to accumulated fuel damage
Section 4‐ Climate Change Considerations Raphael Shay
New and better understood information
In his report, Mr Shay points to several pieces of new knowledge in the climate change field that could affect Pt Lepreau. He presents the fact that we now have data pointing out that the average temperature is rising, climate change is occurring more quickly and with more drastic effects than previously expected, and that warming temperature brings with it increased precipitation, more severe storms and rising sea levels to New Brunswick. Significantly, he points out that “that risks of infrastructure failure will increase worldwide as weather patterns shift and extreme weather conditions become more variable and regionally more intense.” Finally he notes that the worst case scenario of 100cm sea‐level rise by 2100 is now likely and worst case scenarios range up to 160cm.
Mr Shay explains the much better understood science relating to sea level rise in the Maritimes. We now believe a slower and permanent rise in sea‐level is to be expected.
Red Flags

‐ Mr Shay is concerned that the claim by certain media and policy‐makers that climate science is highly uncertain is not true
‐ He is concerned about the higher emission scenarios that bring with them more significant impacts.
‐ He believes New Brunswick’s infrastructure will be put to the test and that we must be prepared to deal with an increasing amount of severe storms, including hurricanes.
‐ He is concerned that NB’s economy will hinder its ability to adapt and mitigate climate impacts.
‐ Mr Shay noted that the National Roundtable did not consider the risks of a climate induced incident at Pt Lepreau
‐Mr Shay is concerned that the consequences of a failure at P Lepreau may be too great
‐He points out that Canada has yet to take appropriate action to adapt to climate change.
‐Mr Shay noted that climate change is starting to overwhelm our engineered expectations
Recommendations
‐NB must be prepared to deal with an increasing amount of severe storms, including hurricanes
‐ NB should Implement “no regret” adaptation actions on our critical infrastructure as suggested by the International Panel on Climate Change
‐Engineers should regularly update design values at Pt Lepreau to mitigate climate impacts
‐ Continuous analysis of failures is paramount
‐NB Power should introduce in codes and standards a “Climate Change Adaptation Factor” to existing design values that reflect the latest understanding of near future changes.
‐ We should all learn from the recent catastrophic events at Fukushima, Japan
‐design standards need to recognize the fact that the forces of nature lie beyond our engineered expectations