Embed Size (px)
Citation preview
Central City South Community Food Resources Report: Assessment of Access
1
Community Food Resources Report: Assessment of Access Central City South, Phoenix, Arizona May 2011 Prepared by: Carolyn Crouch, MA School of Sustainability, Arizona State University In Partnership with: Phoenix Revitalization Corporation 1310 West Hadley St # B Phoenix, AZ 85007
Central City South Community Food Resources Report: Assessment of Access
2
Acknowledgements This project is generously supported by the Phoenix Revitalization Corporation and by the National Science Foundation Grant No. DEB-‐0423704, Central Arizona -‐ Phoenix Long-‐Term Ecological Research, and Grant No. GEO-‐ 0816168, Urban Vulnerability to Climate Change. The opinions, findings, and conclusions or recommendations expressed in this article are those of the author and do not necessarily reflect the views of the National Science Foundation.

Central City South Community Food Resources Report: Assessment of Access
3
Table of Contents Page
Executive Summary…………………………………………………………………………………………………………………..4
Chapter 1: Introduction and Overview………………………………………………………………………………………5
Chapter 2: Research Methods…………………………………………………………………………………………………..9
Chapter 3: Community Findings……………………………………………………………………………………………….11
Chapter 4: Neighborhood Summaries……………………………...........………………………………………………16
Grant Park Neighborhood Summary……………………………………………………………………………16
Marco De Niza Neighborhood Summary……………………………………………………………………..16
Matthew Henson Neighborhood Summary…………………………………………………………………17
7-‐11 Neighborhood Summary…………………………………………………………………………………….17
IG Homes Neighborhood Summary…………………………………………………………………………….17
New Homes Neighborhood Summary…………………………………………………………………………18
Sherman Park Neighborhood Summary……………………………………………………………………..18
Coffelt Neighborhood Summary…………………………………………………………………………………19
Chapter 5: Recommendations…………………………………………......................…………………………………20
Chapter 6: Conclusions……………………………………………………………….................................……………23

Central City South Community Food Resources Report: Assessment of Access
4
Executive Summary Arizona State University researchers and Phoenix Revitalization Corporation (PRC), a local community development organization engaged in Central City South (CCS), Phoenix, have formed a partnership to enhance the CCS community’s capacity to meet its health goals by improving access to healthy food. Residents of CCS have expressed frustration over the lack of a grocery store in the area and the inadequacy of their community’s food resources. Many studies have shown that access to healthy food in the US is unevenly distributed and that supermarkets and other fresh food retailers are less likely to be located in low-‐income minority communities, where convenience and dollar stores are more prevalent grocery options1. Community health goals were identified within the resident-‐driven Quality of Life Plan facilitated by PRC2, and the partnership established research objectives to improve access to healthy food for CCS. This report provides an update on progress toward reaching the following research objectives: 1) analyze the community food stores using the Nutrition Environment Measures Survey (NEMS), 2) assess the current level of food access and availability in CCS, and 3) work with community partners to create recommendations to improve healthy food access and availability. This research is key to meeting the community’s health goals through strategic, targeted interventions to improve residents’ access to healthy food choices. Key Findings:
• Fourteen food stores located in CCS were surveyed using the Nutrition Environment Measures Survey, none of which was a full-‐service grocery store or supermarket3 since this community lacks a full-‐service food store.
• Healthy food options were significantly less available in CCS than less healthy options.
Of a possible 54 points, CCS stores scored between 1 and 23 on the survey scoring rubric for healthy food access. The average total score for the 14 neighborhood stores was 10.9.
• Only half (7) the surveyed stores had fresh produce in stock, and three of the seven had
moderate to low quality produce. Of the seven stores that sold any fresh produce, the average quality score was 4.4 out of a possible 6 points.
• Healthier options were more expensive than unhealthy options in community stores
across six of the food categories. The affordability score (healthier food options compared to less healthy options) for the community stores ranged from -‐2 to 10, with an average of 1.5 out of a possible 18 points.
1 Farley, T. A., Rice, J., Bodor, J. N., & Cohen, D. A. (2009). Measuring the Food Environment: Shelf Space of Fruits, Vegetables, and Snack Foods in Stores. Journal of Urban Health, 86(5), 672-‐682. 2 PRC (2010). Central City South Phoenix, Arizona: Our community, our vision, our quality of life plan. Available online at: www.ccsqlp.org 3 For this study, a full-‐service grocery store was defined as a retailer that must have annual sales of at least $2 million and contain all the major food departments found in a traditional supermarket, including fresh meat and poultry, produce, dairy, dry and packaged foods, and frozen foods, which is the definition used in the 2009 USDA Food Access Study.

Central City South Community Food Resources Report: Assessment of Access
5
Figure 1: Central City South Map of Neighborhoods Source: PRC, 2010
Chapter 1: Introduction and Overview The core service area of PRC is a collection of eight neighborhoods, known as Central City South (CCS), located in the urban core of Phoenix, Arizona. Shown in Figure 1, the boundaries of CCS are Grant Street to the north, Central Avenue to the east, and Interstate 17 to the west and south.
CCS is a roughly two-‐square-‐mile area with a population of over 10,000 people. According to the 2000 U.S. Census, the average median annual household income for the eight neighborhoods is $14,500, and the highest median income among the neighborhoods is $23,500. In the last census, CCS had approximately 10,157 residents. The population composition is 76.2% Hispanic, 16.3% Non-‐Hispanic Black, 4.2% Non-‐Hispanic White, 1.4% American Indian/Alaskan Native, 1% Asian, and 0.9% Other4. This predominantly Hispanic community has a long history in Phoenix. Since the 1880s, these urban core neighborhoods have been negatively affected by poverty, ill health, and industrialization. The significant industrial presence and proximity to toxic outputs has continually contributed to poor conditions of both built environment and public health conditions in the area5. Post-‐WWII Phoenix experienced rapid industrial growth due to defense industry contracts, as well as rapid population growth. Postwar Phoenix experienced migration of white residents out of southwest Phoenix neighborhoods into newly developed areas on the outskirts of Phoenix. Known as ‘white flight,’ this population shift was
4 2000 U.S. Census Summary File. City of Phoenix Planning Department. 5 Bolin, B., Grineski, S. and T. Collins. (2005). The geography of despair: environmental racism and the making of South Phoenix, AZ, USA. Human Ecology Review 12(2), 156-‐168.
Central City South Community Food Resources Report: Assessment of Access
6
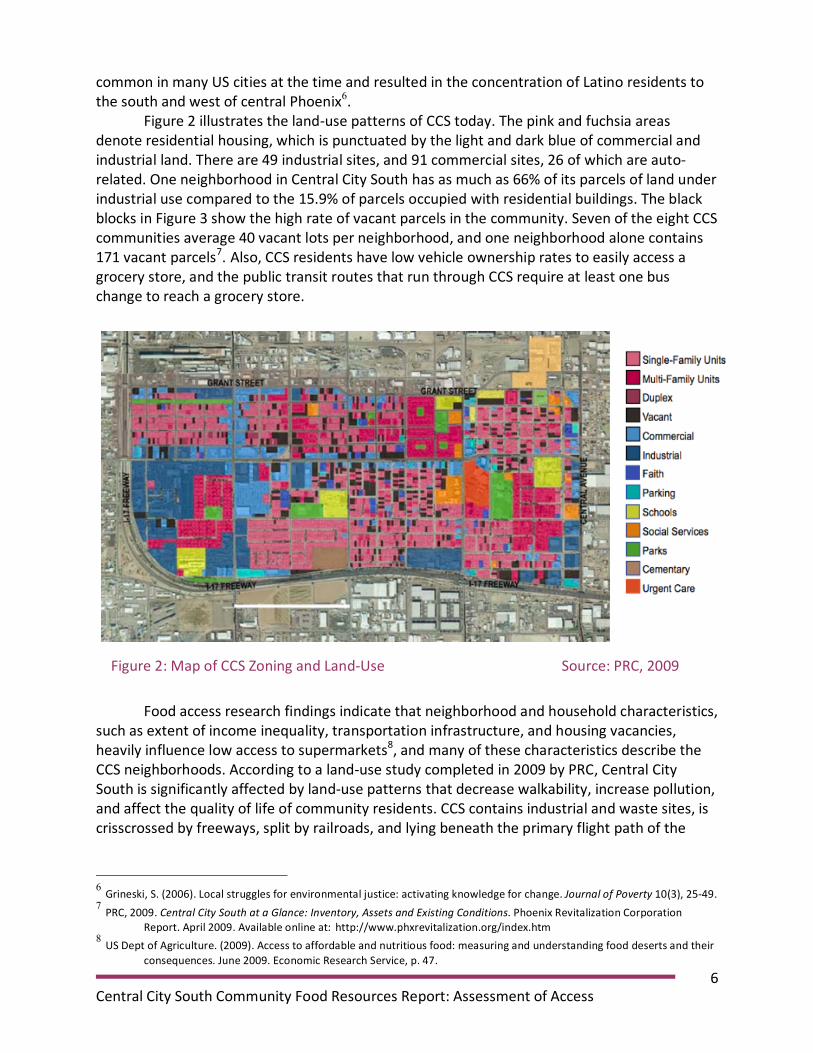
common in many US cities at the time and resulted in the concentration of Latino residents to the south and west of central Phoenix6. Figure 2 illustrates the land-‐use patterns of CCS today. The pink and fuchsia areas denote residential housing, which is punctuated by the light and dark blue of commercial and industrial land. There are 49 industrial sites, and 91 commercial sites, 26 of which are auto-‐related. One neighborhood in Central City South has as much as 66% of its parcels of land under industrial use compared to the 15.9% of parcels occupied with residential buildings. The black blocks in Figure 3 show the high rate of vacant parcels in the community. Seven of the eight CCS communities average 40 vacant lots per neighborhood, and one neighborhood alone contains 171 vacant parcels7. Also, CCS residents have low vehicle ownership rates to easily access a grocery store, and the public transit routes that run through CCS require at least one bus change to reach a grocery store.
Food access research findings indicate that neighborhood and household characteristics, such as extent of income inequality, transportation infrastructure, and housing vacancies, heavily influence low access to supermarkets8, and many of these characteristics describe the CCS neighborhoods. According to a land-‐use study completed in 2009 by PRC, Central City South is significantly affected by land-‐use patterns that decrease walkability, increase pollution, and affect the quality of life of community residents. CCS contains industrial and waste sites, is crisscrossed by freeways, split by railroads, and lying beneath the primary flight path of the
6 Grineski, S. (2006). Local struggles for environmental justice: activating knowledge for change. Journal of Poverty 10(3), 25-‐49. 7 PRC, 2009. Central City South at a Glance: Inventory, Assets and Existing Conditions. Phoenix Revitalization Corporation Report. April 2009. Available online at: http://www.phxrevitalization.org/index.htm 8 US Dept of Agriculture. (2009). Access to affordable and nutritious food: measuring and understanding food deserts and their consequences. June 2009. Economic Research Service, p. 47.
Figure 2: Map of CCS Zoning and Land-‐Use Source: PRC, 2009

Central City South Community Food Resources Report: Assessment of Access
7
Figure 3: Map of Surveyed CCS Food Stores Source: Adapted from Google Maps (2010)
Sherman
Park
Coffelt New
Homes
IG Homes Matthew
Henson
7-11
Grant
Park
Marcos
De Niza
W Buckeye Rd
Phoenix Sky Harbor airport, the 6th busiest airport in the US9. These aspects of the built environment influence the way that residents experience their community. For example, one study found that communities with the lowest socioeconomic status also have 2.5 times more fast food restaurants than communities with the highest socioeconomic status10. The overabundance of fast food outlets in combination with low access to supermarkets may produce an unhealthy food environment that encourages weight gain and obesity11. To address these health burdens, it is essential to understand the built environment of the area to address the community food resources and determine strategies for improving access to healthy food. To analyze the food environment of CCS, we used the NEMS Survey (see Chapter 2 for details). The survey sample included a total of 14 stores: 2 ethnic food stores, 5 convenience stores, and 7 stores classified as other. The ‘other’ stores in the sample were dollar stores and liquor stores that also sold food. The fourteen stores surveyed in this study are marked in red in Figure 3, as well as the three CCS neighborhoods designated as Low Access Areas in a nation-‐wide study of supermarket access by The Reinvestment Fund12 (outlined in blue). Prior to data collection, it was clear that CCS neighborhoods have been identified as experiencing low access to healthy food by nation-‐wide food-‐access studies.
9 Bolin, B., Nelson, A., Hackett, E., Pijawka, D. Smith, S., Sadalla , E., Sicotte, D., Matranga, E., O’Donnell, M. 2002. The Ecology of Technological Risk in a Sunbelt City. Environment and Planning A 34, 317-‐339. 10 Reidpath, D. D., Burns, C., Garrard, J., Mahoney, M., and Townsend, M. (2002). An ecological study of the relationship between social and environmental determinants of obesity. Health and Place. 8(2): 141–145. 11 Robert, S.A. and Reither, E.N. (2004). A multilevel analysis of race, community disadvantage, and body mass index among adults in the US. Social Science & Medicine. 59: 2421–2434. 12 The Reinvestment Fund. (2010). Estimating Supermarket Access: Summary of TRF’s Research and Analysis. Philadelphia, PA.

Central City South Community Food Resources Report: Assessment of Access
8
Another example of a nation-‐wide food access assessment is shown in Figure 4. Figure 4 blends multiple datasets13 to show that CCS is situated in a pocket of food inaccessibility and illustrates the lack of availability of a full-‐service grocery store for the CCS community. Supermarkets are clustered to the northwest of the community, as well as one supermarket each to the southeast and northeast corners of CCS. All full-‐service grocery stores are beyond an acceptable one-‐mile distance14 that would provide adequate service to CCS residents.
13 USGS, FAO, NPS, EPA, DeLorme, TANA, and USDA 14 US Dept of Agriculture. (2009). Access to affordable and nutritious food: measuring and understanding food deserts and their consequences. June 2009. Economic Research Service.
Figure 4: Map of Supermarket Access Study Source: ArgGIS.com
Central City South Community Food Resources Report: Assessment of Access
9
Chapter 2: Methods All food outlets in Central City South, found through observation and Maricopa County Food Establishment permit listings, were entered into a database and categorized as restaurants, liquor stores, convenience stores, ethnic food stores, or other. From this initial search, twenty-‐five stores met the basic criteria of a retail food outlet. Of the twenty-‐five stores, only fourteen stores were surveyed due to the fact that some stores were no longer in business or were specialty shops where only one food category was sold and was not part of the survey. For instance, a meat shop on the outer edge of CCS sold only pork products and pork is not a food item rated in the survey. The fourteen stores surveyed were in operation during the data collection period and sold a general assortment of grocery items that could be surveyed using the Nutrition Environment Measures Survey. Nutritional Environment Measures Survey (NEMS) Nutrition Environment Measures Survey, known as NEMS, is a tool developed to catalog the nutrition environment of retail and food service outlets (both stores and restaurants). For this study, only the food store measure was used. The NEMS survey tool was developed for researching community and consumer nutrition environments by surveying the type and location of food outlets, availability of healthful choices and information, food pricing, promotion, and placement of healthier food products. Data collection took place during October and November 2010 within a 4-‐week period. All community food outlets were visited to verify the address. Each store was assigned a coded number in the database and assigned randomly to the NEMS survey research teams. All NEMS survey research team members received training to use the survey instrument and were briefed on research protocol for this study prior to data collection. Research teams approached the store managers of each surveyed store to obtain permission to complete the surveys. All raters had a bilingual (English and Spanish) information letter about the project and researcher contact information was provided. The NEMS survey included sixteen measures of availability and pricing differences between healthier and less-‐healthy options: milk, fresh fruits and vegetables, ground beef, beef steak, chicken, hot dogs, frozen dinners, baked goods, beverages (nectar/juice), bread, tortillas, chips, cereal, cheese, and beans. Each food category has a defined healthy option and regular option to compare, such as skim or low-‐fat versus whole milk or low-‐sugar versus high-‐sugar cereal. Each store was placed in a store type category: grocery store, ethnic food store, carnicería, convenience store, or other. No grocery stores were in operation in CCS. For the purposes of this study, a grocery store was defined as “a retailer that must have annual sales of at least $2 million and contain all the major food departments found in a traditional supermarket, including fresh meat and poultry, produce, dairy, dry and packaged foods, and frozen foods15. Ethnic food stores are defined as a type of non-‐chain grocery store which sells food items that are distinctly Latino, items that are hard to find elsewhere, and often cater to Latino immigrants by conducting business and having signage in Spanish. Carnicerías are 15 US Dept of Agriculture. (2009). Access to affordable and nutritious food: measuring and understanding food deserts and their consequences. June 2009. Economic Research Service. p. 15.
Central City South Community Food Resources Report: Assessment of Access
10
defined as a type of specialty store with signage in Spanish, a meat counter with butcher that sells fresh meat including products not readily available in mainstream supermarkets, and which also sell a variety of pre-‐packaged food items, beverages, kitchen items, and produce including tomatoes, limes, and onions. Convenience store is a small retail store that is open long hours and that typically sells only staple groceries, mostly snack items, and sometimes gasoline. ‘Other’ stores are stores that did not easily fit another store definition, but sell food within the community. Ethnic food stores were defined as a type of non-‐chain grocery store which sells food items that are distinctly Latino, items that are hard to find elsewhere, and often cater to Latino immigrants by conducting business and having signage in Spanish. Carnicerías were defined as a type of specialty store with signage in Spanish, a meat counter with butcher that sells fresh meat including products not readily available in mainstream supermarkets, which also sell a variety of pre-‐packaged food items, beverages, kitchen items, and produce including tomatoes, limes, and onions. Convenience store is a small retail store that is open long hours and that typically sells only staple groceries, mostly snack items, and sometimes gasoline. ‘Other’ stores were stores that did not easily fit another store definition, but sell food within the community. The survey sample included 6 convenience stores, 2 ethnic food stores, and 6 stores classified as other. “Other” stores were mainly dollar stores and liquor stores that also sold food. NEMS Scoring The NEMS protocol has a scoring rubric to calculate scores for each store to indicate relative access to healthy versus unhealthy options within surveyed stores in the community. Total store scores take into account the overall availability, affordability, and quality of food items. Each store received a separate score for Overall Score (out of 54), as well as the component scores of Availability Score, Affordability Score, and Quality Score. The Availability Score was calculated by assigning two points per food category for the availability of healthier options. For example, the availability of skim or low-‐fat milk earned a store 2 availability points. If the store did not have skim or low-‐fat milk, those two points were not included in the Availability Score. An additional one or two availability points were tallied for the availability of multiple varieties of a healthy option (e.g., two extra points for three or more varieties of lean meat). The Affordability Score was calculated by assigning two points for a lower priced healthier option and subtracted one point for a higher priced healthier option. For example, if fat-‐free or low-‐fat hotdogs were less expensive than high-‐fat hot dogs in a store, the store Affordability Score went up by two points. If the high-‐fat hot dogs were less expensive than the fat-‐free or low-‐fat hot dogs, the Affordability Score went down by one point. The Quality Score applies only to fresh produce; hence many stores within CCS received a 0 since no fresh produce was available to rate. Up to three points were assigned for having more produce of acceptable quality. If 25-‐49% of the produce was acceptable quality, the store earned 1 quality point. If 50-‐74% of the produce was acceptable quality, the store earned 2 quality points. And if 75%+ of the produce was acceptable quality, the store earned 3 quality points.
Central City South Community Food Resources Report: Assessment of Access
11
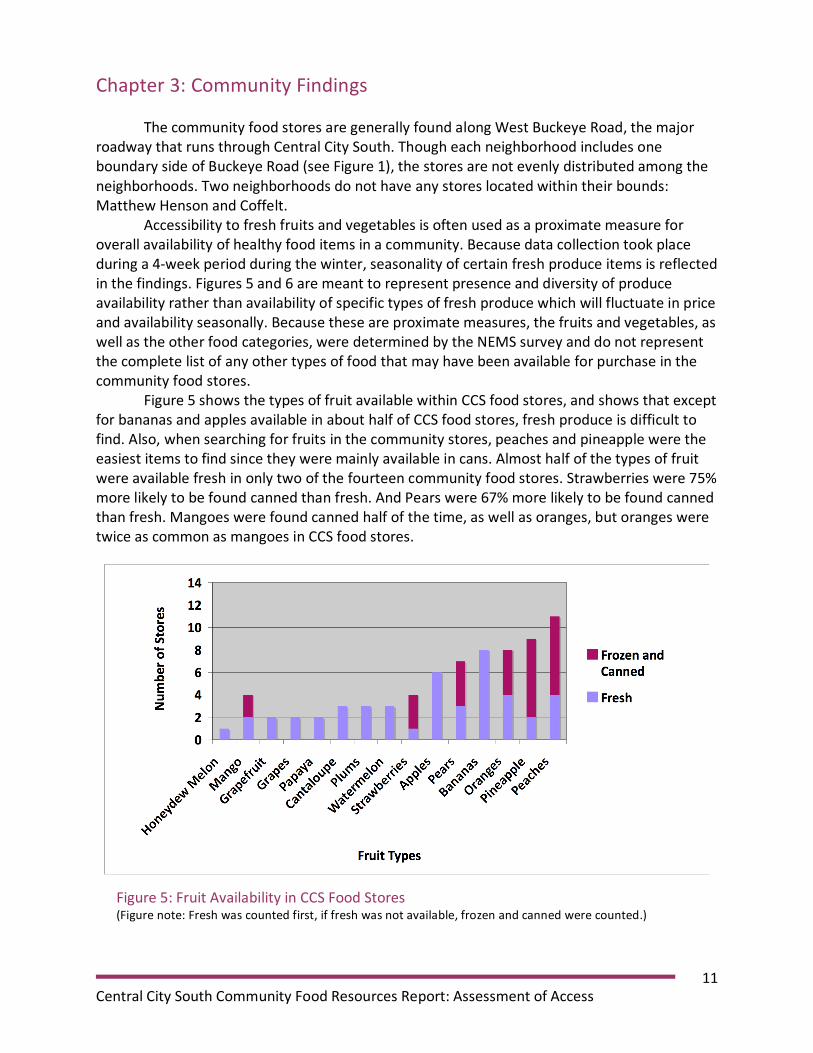
Chapter 3: Community Findings The community food stores are generally found along West Buckeye Road, the major roadway that runs through Central City South. Though each neighborhood includes one boundary side of Buckeye Road (see Figure 1), the stores are not evenly distributed among the neighborhoods. Two neighborhoods do not have any stores located within their bounds: Matthew Henson and Coffelt. Accessibility to fresh fruits and vegetables is often used as a proximate measure for overall availability of healthy food items in a community. Because data collection took place during a 4-‐week period during the winter, seasonality of certain fresh produce items is reflected in the findings. Figures 5 and 6 are meant to represent presence and diversity of produce availability rather than availability of specific types of fresh produce which will fluctuate in price and availability seasonally. Because these are proximate measures, the fruits and vegetables, as well as the other food categories, were determined by the NEMS survey and do not represent the complete list of any other types of food that may have been available for purchase in the community food stores. Figure 5 shows the types of fruit available within CCS food stores, and shows that except for bananas and apples available in about half of CCS food stores, fresh produce is difficult to find. Also, when searching for fruits in the community stores, peaches and pineapple were the easiest items to find since they were mainly available in cans. Almost half of the types of fruit were available fresh in only two of the fourteen community food stores. Strawberries were 75% more likely to be found canned than fresh. And Pears were 67% more likely to be found canned than fresh. Mangoes were found canned half of the time, as well as oranges, but oranges were twice as common as mangoes in CCS food stores.
Figure 5: Fruit Availability in CCS Food Stores (Figure note: Fresh was counted first, if fresh was not available, frozen and canned were counted.)
Central City South Community Food Resources Report: Assessment of Access
12
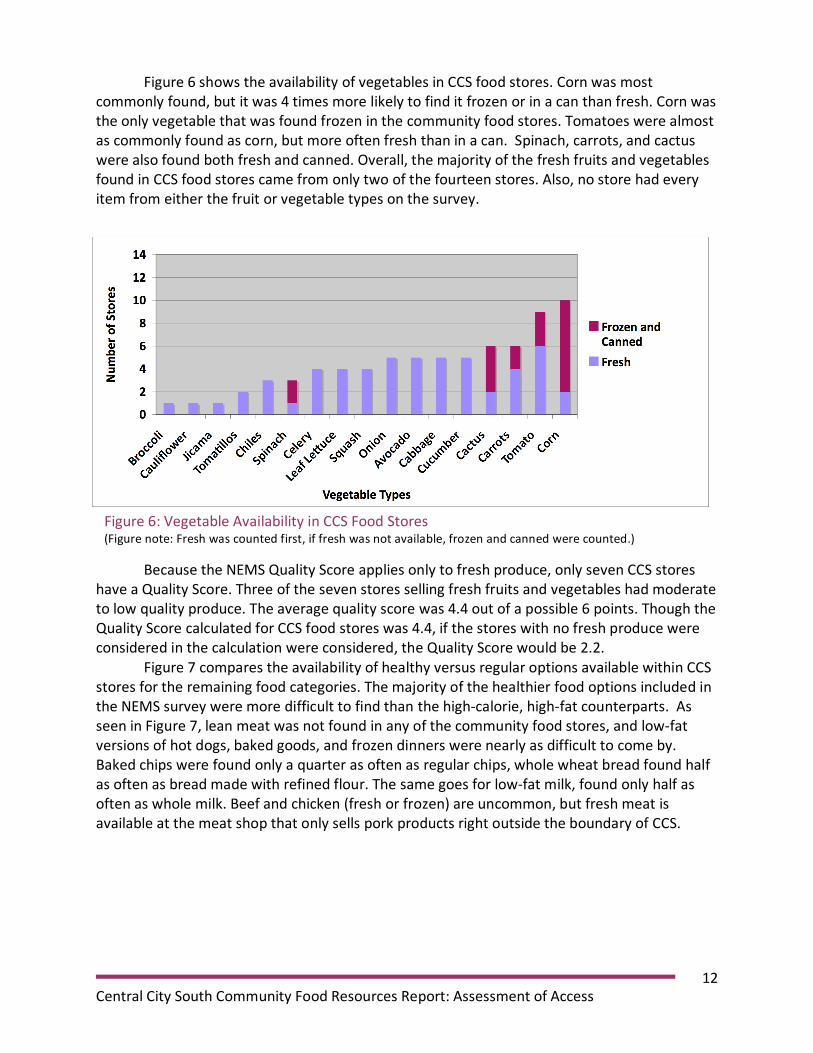
Figure 6 shows the availability of vegetables in CCS food stores. Corn was most commonly found, but it was 4 times more likely to find it frozen or in a can than fresh. Corn was the only vegetable that was found frozen in the community food stores. Tomatoes were almost as commonly found as corn, but more often fresh than in a can. Spinach, carrots, and cactus were also found both fresh and canned. Overall, the majority of the fresh fruits and vegetables found in CCS food stores came from only two of the fourteen stores. Also, no store had every item from either the fruit or vegetable types on the survey.
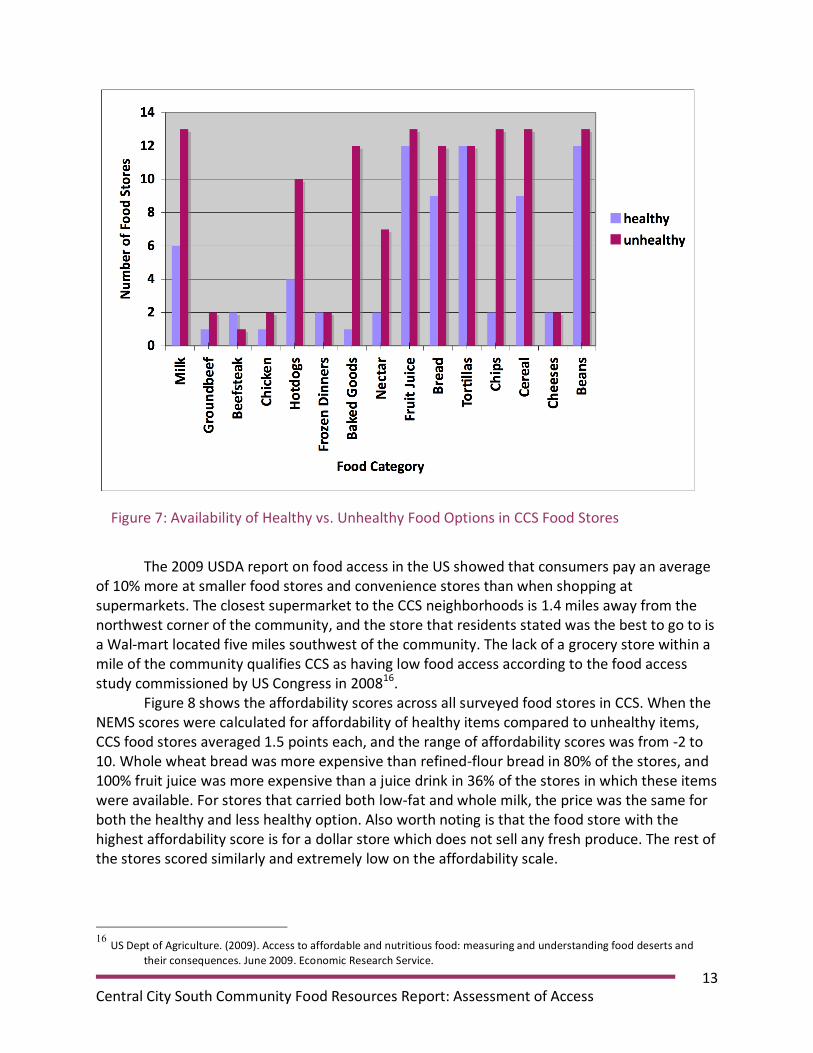
Because the NEMS Quality Score applies only to fresh produce, only seven CCS stores have a Quality Score. Three of the seven stores selling fresh fruits and vegetables had moderate to low quality produce. The average quality score was 4.4 out of a possible 6 points. Though the Quality Score calculated for CCS food stores was 4.4, if the stores with no fresh produce were considered in the calculation were considered, the Quality Score would be 2.2. Figure 7 compares the availability of healthy versus regular options available within CCS stores for the remaining food categories. The majority of the healthier food options included in the NEMS survey were more difficult to find than the high-‐calorie, high-‐fat counterparts. As seen in Figure 7, lean meat was not found in any of the community food stores, and low-‐fat versions of hot dogs, baked goods, and frozen dinners were nearly as difficult to come by. Baked chips were found only a quarter as often as regular chips, whole wheat bread found half as often as bread made with refined flour. The same goes for low-‐fat milk, found only half as often as whole milk. Beef and chicken (fresh or frozen) are uncommon, but fresh meat is available at the meat shop that only sells pork products right outside the boundary of CCS.
Figure 6: Vegetable Availability in CCS Food Stores (Figure note: Fresh was counted first, if fresh was not available, frozen and canned were counted.)
Central City South Community Food Resources Report: Assessment of Access
13
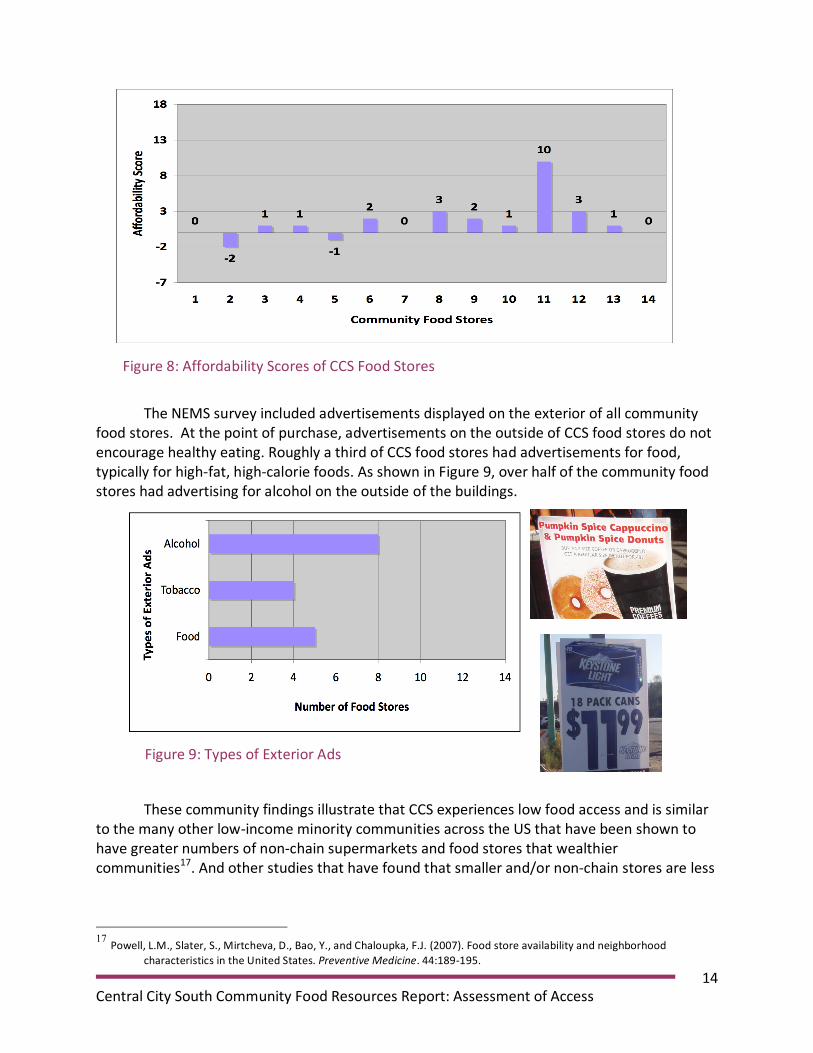
The 2009 USDA report on food access in the US showed that consumers pay an average of 10% more at smaller food stores and convenience stores than when shopping at supermarkets. The closest supermarket to the CCS neighborhoods is 1.4 miles away from the northwest corner of the community, and the store that residents stated was the best to go to is a Wal-‐mart located five miles southwest of the community. The lack of a grocery store within a mile of the community qualifies CCS as having low food access according to the food access study commissioned by US Congress in 200816. Figure 8 shows the affordability scores across all surveyed food stores in CCS. When the NEMS scores were calculated for affordability of healthy items compared to unhealthy items, CCS food stores averaged 1.5 points each, and the range of affordability scores was from -‐2 to 10. Whole wheat bread was more expensive than refined-‐flour bread in 80% of the stores, and 100% fruit juice was more expensive than a juice drink in 36% of the stores in which these items were available. For stores that carried both low-‐fat and whole milk, the price was the same for both the healthy and less healthy option. Also worth noting is that the food store with the highest affordability score is for a dollar store which does not sell any fresh produce. The rest of the stores scored similarly and extremely low on the affordability scale.
16 US Dept of Agriculture. (2009). Access to affordable and nutritious food: measuring and understanding food deserts and their consequences. June 2009. Economic Research Service.
Figure 7: Availability of Healthy vs. Unhealthy Food Options in CCS Food Stores
Central City South Community Food Resources Report: Assessment of Access
14
Figure 8: Affordability Scores of CCS Food Stores
Figure 9: Types of Exterior Ads
The NEMS survey included advertisements displayed on the exterior of all community food stores. At the point of purchase, advertisements on the outside of CCS food stores do not encourage healthy eating. Roughly a third of CCS food stores had advertisements for food, typically for high-‐fat, high-‐calorie foods. As shown in Figure 9, over half of the community food stores had advertising for alcohol on the outside of the buildings.
These community findings illustrate that CCS experiences low food access and is similar to the many other low-‐income minority communities across the US that have been shown to have greater numbers of non-‐chain supermarkets and food stores that wealthier communities17. And other studies that have found that smaller and/or non-‐chain stores are less
17 Powell, L.M., Slater, S., Mirtcheva, D., Bao, Y., and Chaloupka, F.J. (2007). Food store availability and neighborhood characteristics in the United States. Preventive Medicine. 44:189-‐195.

Central City South Community Food Resources Report: Assessment of Access
15
likely to stock healthful foods than chain supermarkets18. These smaller stores are also less likely to offer foods at lower prices19,20. And because the availability of supermarkets is associated with increased fruit and vegetable intake and more healthful diets21,22, the falling numbers of food stores available to low-‐income communities contributes to limited access to healthy food in these communities across the US.
18 Horowitz, Z., Colson, K.A., Herbert, P.L., and Lancaster, K. (2004). Barriers to buying healthy foods for people with diabetes: Evidence of environmental disparities. American Journal of Public Health. 94 (9): 1549-‐54. 19 Kaufman, P.R., MacDonald, J.M., Lutz, S.M., and Smallwood, D.M. (1997). Do the poor pay more for food? Item Selection and prices differences affect low-‐ income household food costs. Washington D.C.: Economic Research Service, U.S. Department of Agriculture, Agricultural Economic Report No. 759. 20 Chung, C. and Myers Jr., S.L. (1999). Do the poor pay more for food? An analysis of grocery store availability and food price
disparities. Journal of Consumer Affairs. 33(2): 276–296.
21 Morland, K., Wing, S., and Diez Roux, A. (2002). Neighborhood characteristics associated with the location of food stores and food service places. American Journal of Preventative Medicine. 22: 23-‐29.
22 Laraia, B.A., Siega-‐Riz, A.M., Kaufman, J.S., and Jones, S.J. (2004) Proximity of supermarkets is positively associated with diet quality index for pregnancy. Preventative Medicine. 39: 869–875.

Central City South Community Food Resources Report: Assessment of Access
16
Chapter 4: Neighborhood Summaries Grant Park Neighborhood Summary Grant Park has two food stores: a gas station convenience store and a corner market. This neighborhood is within a designated Low Access Area according to The Reinvestment Fund’s nation-‐wide study of supermarket access (see page 5). Only about a fourth of healthy food items surveyed were available in Grant Park food stores. Overall, the healthy choices were not affordably priced, as shown in Table 1. Each of the food stores received a 1 out of 18 for their Affordability Scores. Also, stores in Grant Park had moderate to low quality fresh produce. Few fresh options were found (9 total). The only other fruit and vegetable options in this neighborhood are mainly canned: cactus (nopales), pineapples, pears, peaches, and mandarin orange slices. Table 1: Grant Park Neighborhood Store Scores
Store ID
Overall Store Score
(Out of 54 points)
Availability Score (Out of 30 points)
Affordability Score
(Out of 18 points)
Fresh Food Quality Score (Out of 6 points)
04-‐002 7 5 1 1 05-‐001 13 8 1 4
Marco De Niza Neighborhood Summary The Marcos De Niza neighborhood has 2 food stores (two corner markets) among 9% industrial parcels, and nearly a fifth of parcels are vacant. This neighborhood is within a designated Low Access Areas according to The Reinvestment Fund’s nation-‐wide study of supermarket access (see page 5). Nine fresh foods were found available in this neighborhood: bananas, apples, oranges, carrots, tomatoes, lettuce, corn, celery, cucumbers. A Marcos De Niza food store contained the only instance of organic food in the CCS, which were organic carrots. The other store in the neighborhood had no fresh produce at all and only two healthy food items rated in the NEMS survey: diet soda and low-‐sugar cereal. Healthy items in the two food stores were not priced affordably compared to the less healthy food options. Table 2: Marcos De Niza Neighborhood Store Scores
Store ID
Overall Store Score
(Out of 54 points)
Availability Score (Out of 30 points)
Affordability Score
(Out of 18 points)
Fresh Food Quality Score (Out of 6 points)
02-‐002 20 14 0 6 05-‐005 8 5 3 n/a
Central City South Community Food Resources Report: Assessment of Access
17
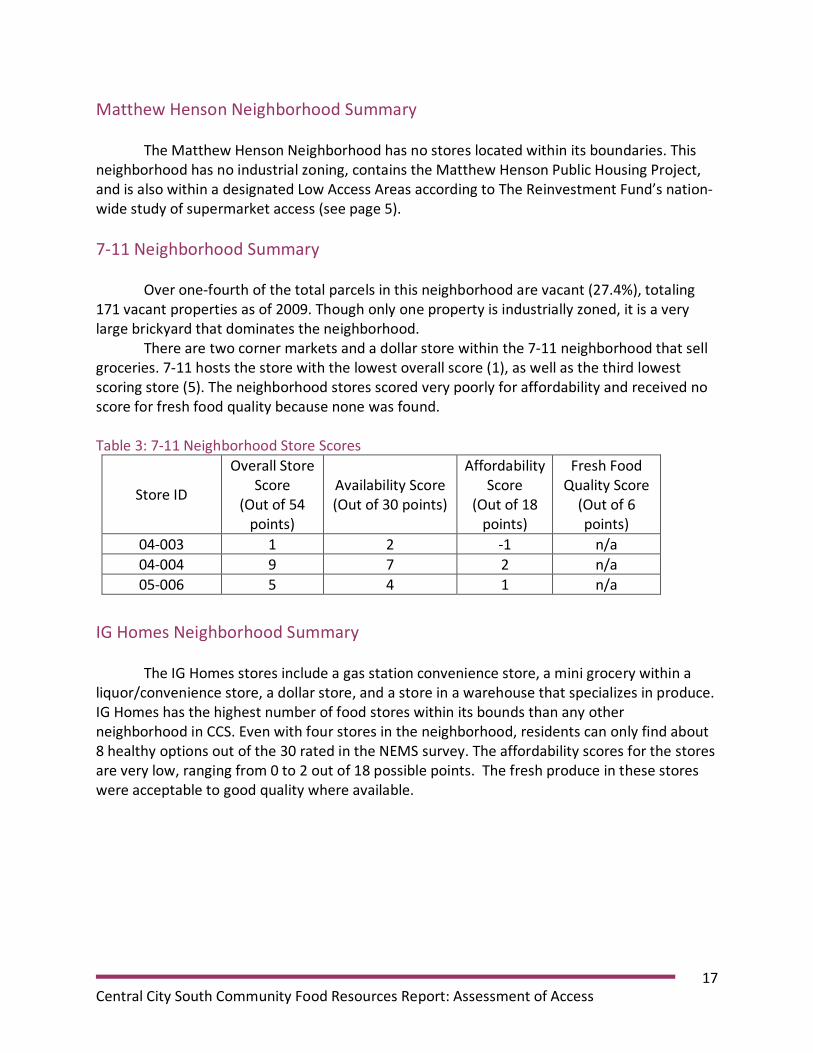
Matthew Henson Neighborhood Summary The Matthew Henson Neighborhood has no stores located within its boundaries. This neighborhood has no industrial zoning, contains the Matthew Henson Public Housing Project, and is also within a designated Low Access Areas according to The Reinvestment Fund’s nation-‐wide study of supermarket access (see page 5). 7-‐11 Neighborhood Summary Over one-‐fourth of the total parcels in this neighborhood are vacant (27.4%), totaling 171 vacant properties as of 2009. Though only one property is industrially zoned, it is a very large brickyard that dominates the neighborhood. There are two corner markets and a dollar store within the 7-‐11 neighborhood that sell groceries. 7-‐11 hosts the store with the lowest overall score (1), as well as the third lowest scoring store (5). The neighborhood stores scored very poorly for affordability and received no score for fresh food quality because none was found. Table 3: 7-‐11 Neighborhood Store Scores
Store ID
Overall Store Score
(Out of 54 points)
Availability Score (Out of 30 points)
Affordability Score
(Out of 18 points)
Fresh Food Quality Score (Out of 6 points)
04-‐003 1 2 -‐1 n/a 04-‐004 9 7 2 n/a 05-‐006 5 4 1 n/a
IG Homes Neighborhood Summary The IG Homes stores include a gas station convenience store, a mini grocery within a liquor/convenience store, a dollar store, and a store in a warehouse that specializes in produce. IG Homes has the highest number of food stores within its bounds than any other neighborhood in CCS. Even with four stores in the neighborhood, residents can only find about 8 healthy options out of the 30 rated in the NEMS survey. The affordability scores for the stores are very low, ranging from 0 to 2 out of 18 possible points. The fresh produce in these stores were acceptable to good quality where available.

Central City South Community Food Resources Report: Assessment of Access
18
Table 4: IG Homes Neighborhood Store Scores
Store ID
Overall Store Score
(Out of 54 points)
Availability Score (Out of 30 points)
Affordability Score
(Out of 18 points)
Fresh Food Quality Score (Out of 6 points)
04-‐001 9 5 1 3 05-‐004 4 4 0 n/a 05-‐008 15 8 2 5 02-‐004 10 4 0 6
New Homes Neighborhood Summary New Homes neighborhood has 300 single-‐ and multi-‐family housing units and only two food stores, neither of which sells any fresh fruits or vegetables. A dollar store in this neighborhood provides a moderate Affordability Score, however less than a third of the healthy food items surveyed were available for purchase there. Table 5: New Homes Neighborhood Store Scores
Store ID
Overall Store Score
(Out of 54 points)
Availability Score (Out of 30 points)
Affordability Score
(Out of 18 points)
Fresh Food Quality Score (Out of 6 points)
04-‐005 10 7 3 n/a 05-‐002 18 8 10 n/a
Sherman Park Neighborhood Summary Though it only has one store, Sherman Park hosts the food store with the most healthy food options available of all the stores in Central City South. This accomplishment is still lackluster because the store scored a 23 out of a 54. The Quality Score is high, a 6 out of 6, because what fresh produce is available in this neighborhood is of good quality. Sherman Park neighborhood also has a very low Affordability Score, so low that it is negative, representing that healthy options are significantly less affordable than higher-‐fat, higher-‐calorie, less nutritious food options. Though more healthy options exist in Sherman Park than in other neighborhoods, they are less affordable compared to other stores in the community. Table 6: Sherman Park Neighborhood Store Score
Store ID
Overall Store Score
(Out of 54 points)
Availability Score (Out of 30 points)
Affordability Score
(Out of 18 points)
Fresh Food Quality Score (Out of 6 points)
01-‐001 23 19 -‐2 6

Central City South Community Food Resources Report: Assessment of Access
19
Coffelt Neighborhood Summary Tucked in the curve of I-‐17 in the southwest corner of CCS, Coffelt lies in a pocket of light industrial land with no food stores within the neighborhood bounds. The Coffelt neighborhood has 4 times as many industrial parcels of land as residential parcels. The closest food store is the one food store located in the adjacent Sherman Park neighborhood, which has the highest score of all neighborhood food stores in CCS. This provides some options for residents, though the Coffelt neighborhood is among the least food accessible neighborhoods in CCS.
Central City South Community Food Resources Report: Assessment of Access
20
Chapter 5: Recommendations The NEMS survey findings reveal that healthy food options are not readily available for purchase within the bounds of CCS. There are a few instances of healthy food options priced the same as unhealthier options, but mostly unhealthy options are cheaper and much more convenient than traveling to a full-‐service grocery store. Also, healthy food options do not have the same advertising to consumers or affordability as less healthy options. The purchasing habits of CCS residents were not included in this study, but research findings suggest the built environment and convenience heavily influence dietary choices, which affect health and well being at both the individual and community levels. Though all of the CCS neighborhoods experience inadequate access to healthy food, three neighborhoods have fewer options than others based on the research findings and are priority areas for action: Matthew Henson, Coffelt, and 7-‐11. The following are recommendations based on academic literature and synthesis of stakeholder input and the community assessment. Each option does not need to be pursued and completed in order, rather multiple recommendations can be pursued simultaneously for maximum community benefit. Recommendations 1) Community Gardens Already mentioned in the community’s QLP as a priority by residents to beautify the neighborhoods and provide opportunities for socializing through community gardening. PRC established a partnership with the City of Phoenix to provide water for community gardening, as well as with Home Depot to supply seeds, tools, and soil amendments. However, the community gardens in CCS currently have low membership and only a handful of residents are eating food grown in them. PRC would like to see the gardens provide produce to a local market, but the gardens are not currently large enough or used enough to augment the healthy food available in CCS. Community gardens are explicitly mentioned in the community’s Quality of Life Plan, and PRC is actively pursuing funding and discussing plans for expanding the community gardening program in CCS. 2) Healthy Corner Store Initiative The small corner stores have a potential role in providing healthy and affordable food to neighborhood residents. By utilizing with the CCS food stores, local assets can be developed to better provide healthy food options for residents. Supporting small food stores through funding refrigeration and other retrofits and providing incentives for partnering with local producers may be a more effective strategy than to recruit grocery store chains to move into a community23. A leading example of this work is the Healthy Bodega Initiative of New York City. The NYC government sponsors an Adopt-‐a-‐Bodega program24 to work with small storeowners to offer more healthy food options.
23 Raja, S., Ma, C., Yadav, P. (2008). Beyond food deserts: measuring and mapping racial disparities in neighborhood food environments. Journal of Planning Education and Research. 27(4): 469-‐82. 24 Bronx Health Reach (2010). Bodega Initiative Information. Accessed January 2011. Found online at: http://www.institute2000.org/bhr/work/nutrition_and_fitness/bodega_initiative

Central City South Community Food Resources Report: Assessment of Access
21
Though few CCS stores had freezer capacity, most CCS stores have at least some cool storage units and thus have the capability to carry some amount of fresh produce. Also, some stores have the cool storage capacity to carry more produce than they currently do. However, the capacity to stock fresh produce does not mean that residents will buy it in volumes to support continual restocking. Even if canned produce items were offered at reasonable prices, food options available to residents could be greatly improved. The stores to partner with first can be targeted by referring to the NEMS scores, which could also be used to track progress of the CCS Healthy Corner Store Initiative. The stores that scored the lowest should most likely be addressed first. There is a community food store that scored a one, which indicates that significant progress with that store could be made immediately. This recommendation is also the one that would require the least amount of funding necessary to launch, and PRC has already begun hosting business breakfasts to network with local business owners. PRC has begun to approach food storeowners to start working together right away. 3) A Virtual Supermarket Baltimore's Virtual Supermarket Project, called Baltimarket, utilizes online grocery shopping, but adapts the model to consumers who cannot afford the delivery fees, may not have access to the Internet, or cannot meet a high minimum purchase amount typical of online grocery shopping. Originally funded with a $60,000 grant from the 2009 federal stimulus package, Baltimarket partners with local grocers and other sponsors to cover the extra costs associated with online grocery shopping for residents of Baltimore neighborhoods with low food access. This project currently serves two communities in Baltimore, Orleans and Washington Village. Because CCS residents have low access to personal vehicles, a virtual supermarket program could be based out of the local library branch, one of the four elementary schools, and/or one of the two senior centers located in the community so that ordering groceries is within a walkable distance. A virtual supermarket allows residents to order groceries once a week on designated ordering days and pick up their groceries the next day at the same location. In addition to the grocery ordering and delivery service, the program also provides healthy eating recipe books and a $10 incentive to purchase healthy food items every fourth order. According to the program's website, participant surveys showed that 91% of participants indicated that VSP “has improved their access to fresh and affordable groceries,” and 73% of people indicated that it has enabled them to make healthier purchases25. A smaller-‐scale partnership could be established with the grocer Safeway, which already has in place the infrastructure for online grocery ordering and delivery. A virtual supermarket in CCS could alleviate the extra cost and time that residents currently face to obtain their groceries. However, community organizers feel that residents would resist this recommendation. CCS residents have low access to the internet and are uncomfortable using computers. Internet assistance could be provided, and this is an important aspect of the Baltimarket program, but CCS residents will need to be significant help and/or convincing before there will be a virtual supermarket in the area.
25 Baltimore City Health Department (2011). Baltimarket: The Virtual Supermarket Project. Accessed February 2011 at http://www.baltimorehealth.org/virtualsupermarket.html.

Central City South Community Food Resources Report: Assessment of Access
22
4) Mobile Farm Stand Mobile food stands or trucks can provide access to healthy food options without the investment in a building or extensive staff. In 2006, the Food Bank of San Joaquin County, California, banded together with over 30 nutrition agencies, churches, and schools to create strategies aimed at reducing hunger and food insecurity. This partnership resulted in a mobile food stand that visits 54 sites per month in low-‐income communities, providing cooking and tasting demonstrations at each stop to introduce people to any unfamiliar produce, and then they are more likely to use it. About 90% of the produce distributed is donated by various suppliers, which range from small individual gardens to supermarkets and commercial food distributors26. A grant has been submitted by PRC and partners for funding a mobile farmer's market that would service the CCS area that could bring fresh produce and healthy food options to residents that are not readily available within community food stores. By utilizing the findings of this study, neighborhoods with the least food access have been identified and could be among the first stop sites of a new mobile farm stand. 5) A New Grocery Store Discussion with community stakeholders revealed that the main course of action apparent to them was to get a large grocery retailer to move into the neighborhoods. A “reputable grocery store” was the only solution specifically posed to researchers by the residents during community meetings. Further research can establish the amount of monetary leakage to other stores, as well as the potential revenue stream available for a grocer who locates within CCS. Working with a market analytics firm, such as Buxton Company, could be an opportunity to establish the possibility for a full-‐service grocery store to locate in CCS. Buxton (www.buxtonco.com) specializes in market analytics and retail site selection. A branch of their business model is tailored to community redevelopment in underserved areas by matching their needs with retail grocery chains. The skill set offered by such firms could be a next step to attracting a grocery store to CCS if a new store is the recommendation most preferred by community members. A new grocery store would increase food access for residents, but it would not necessarily take advantage of the relationships and assets already available within the community.
26 HEAC (2011). Mobile Farmers Market Delivers Fresh Produce and a Side of Nutrition Education to Low-‐Income Communities in San Joaquin County. Healthy Eating, Active Communities. Accessed January 2010 at: http://www.healthyeatingactivecommunities.org/communications3_15.php
Central City South Community Food Resources Report: Assessment of Access
23
Chapter 6: Conclusion The findings in this study are consistent with other nation-‐wide studies of food availability and access. It is important to consider community-‐wide programming and policy options that could provide more healthy choices to residents. The answer isn’t simply more fruits and vegetables or other healthy food options stocked on store shelves. A mulit-‐pronged effort that encompasses changes to current offerings and increased food options to increase healthy food access in conjunction with consumer education and store incentives. Each of the above recommendations is based on successful initiatives across the US, but there are additional considerations for implementation than are described in this report. There are various next steps from this research study to successfully increase food access in CCS, and these initial suggestions can begin the transition required to improve CCS residents’ access to healthy food. Updating the NEMS data periodically would keep this research relevant and up-‐to-‐date for its various uses. Also, further investigation would be beneficial in the following areas: shopping and eating habits of residents, nutritional analysis of residents’ food options and available choices, assessment of the food donation programs available to residents, and surveys of the restaurants in CCS using the NEMS restaurant measure. A current project in another Phoenix community is translating the Latino NEMS instrument and training materials into Spanish and training community members to conduct the store surveys in their neighborhoods. Implementing this program in CCS could help maintain the food resources assessment as a community tool for years to come. Continuing partnerships and research efforts produce new knowledge and introduce innovative solutions to improve access to healthy food for CCS residents.

Central City South Community Food Resources Report: Assessment of Access
24
List of Figures Page
Figure 1: Central City South Map of Neighborhoods……………………………..………...................…........5 Figure 2: Map of CCS Zoning and Land-‐Use Study…………………………………………………………….………..6 Figure 3: Map of Surveyed CCS Food Stores……….................................…………………….........………...7 Figure 4: Map of Supermarket Access……………………………..……………..........................................…..8 Figure 5: Fruit Availability in CCS Food Stores……………………………..………………..............................11 Figure 6: Vegetable Availability in CCS Food Stores……………………………..……………….....................12 Figure 7: Availability of Healthy vs. Unhealthy Food Options in CCS Food Stores……………………..13 Figure 8: Affordability Scores of CCS Food Stores……………………………..………………........................14 Figure 9: Types of Exterior Ads……………………………..……………….....................................................14 List of Tables Table 1: Grant Park Neighborhood Store Scores……………………………..……………….........................16 Table 2: Marcos De Niza Neighborhood Store Scores……………………………..………................……....16 Table 3: 7-‐11 Neighborhood Store Scores……………………………..……………......................................17 Table 4: IG Homes Neighborhood Store Scores……………………………..………………...........................18 Table 5: New Homes Neighborhood Store Scores……………………………..……………….......................18 Table 6: Sherman Park Neighborhood Store Scores……………………………..………………....................18