Embed Size (px)
Citation preview

CD Equisearch Pvt Ltd June 29, 2015
Equities Derivatives Commodities Distribution of Mutual Funds Distribution of Life Insurance
Apcotex Industries Ltd (AIL)
No. of shares (crore) 1.04
Mkt cap (Rs crs) 475
Current price (29/06/2015) 458
Price target (Rs)
539
52 week H/L (Rs.) 575/163
Book Value (Rs.) (fv:5) 96
P/BV (16e/17e)
4.0/3.3
P/E (16e/17e) 17.3/13.6
EPS growth (FY15/16e/17e) 88.0/11.5/26.9
ROE (FY15/FY16e/FY17e) 26.7/25.2/26.5
Beta 0.9
Daily volume (avg. quarterly) 7453
BSE Code 523694
NSE Code APCOTEXIND
Bloomberg APCO IN
Reuters APCI.BO
Shareholding pattern % Promoters 57.6
MFs / Banks / FIs 0.0
Foreign 1.4
Non-Promoter Corp. 4.3
Public & others 36.7
Total 100.0
As on Mar 31, 2015
Recommendation
ACCUMULATE
Analyst
KISHAN GUPTA, CFA, FRM
Phone: + 91 (33) 4488 0043
E- mail: [email protected]
(Figires in Rs crs)
FY13 FY14 FY15 FY16e FY17e
Income from operations 273.40 297.03 355.09 394.74 471.07
Other Income -0.02 2.43 5.58 4.81 6.01
EBITDA (other income included) 23.50 27.55 47.05 53.17 64.43
Net Profit after EO item 12.80 13.13 24.69 27.52 34.91
EPS (Rs) 12.35 12.66 23.81 26.54 33.67
EPS growth (%) 11.7 2.6 88.0 11.5 26.9
Company Brief Apcotex Industries is one of India's leading producers of performance
emulsion polymers (synthetic latexes and synthetic rubber). Synthetic latexes
find use in whole host of industries - tyre; paints; textiles; construction;
automotive components; paper- while its synthetic rubber finds use in
footwear, automotive components, moulded items, v-belts, conveyer belts and
hoses.
Highlights
� Higher styrene butadiene's demand from Asia - Pacific, Latin America
and Middle East and Africa (MEA) would boost order flows. According to
Transparency Market Research, a US based research provider, high
growth of coated paper market and increased off take from carpet
manufacturing industry would support growth of styrene butadiene
industry in Asia-Pacific region. Latin America is expected to be the fastest
growing region globally buoyed by sturdy growth in paper processing
industry in Brazil.
� But markets in Europe and North America (currently second and third
largest market respectively) would hit the skids for the slump in coated
paper market would spell doom. Several coated paper manufacturers
have already shut shop due to the fall in demand. Drop in business in
Germany and Finland, two large producers of papers in Europe, has
reduced demand for the latex.
� With tepidness in domestic demand, Apcotex is pulling out all stops to
grow its exports. It targets to book a quarter of its total revenues from it in
the next few years (currently at 18%). Exports doubled last fiscal as it
explored new markets and launched niche products.
� Apcotex demonstrates some pricing power not least because of its gut-
wrenching market share in user industries: 40-43% for paper & paper
boards; 65% for carpets; 40% for construction; 30-35% for tyres; 50% for
rubber. High returns on capital somewhat manifest that.
� The stock is currently trading at 17.3xFY16e EPS of Rs 26.54 and 13.6x
FY17e EPS of Rs 33.67. Despite robust growth potential and low financial
leverage, external risks could fray gains. Most notably, sharp fall in crude
oil prices could keep a tab on sales growth. We, therefore assign
‘accumulate’ rating on the stock with target of Rs 539 based on 16xFY17e
earnings (peg ratio: 0.8), over a period of 6-9 months.

2
2
CD Equisearch Pvt Ltd
Equities Derivatives Commodities Distribution of Mutual Funds Distribution of Life Insurance
[ [ [
[
Company Profile
Apcotex Industries, one of India’s leading producers of performance emulsion polymers (synthetic latexes and synthetic
rubber), produces vp latex, carboxylated and non-carboxylated sb latexes, acrylic latexes, nitrile latex and synthetic rubber. Its
synthetic latexes finds use in several industries - tyre (for tyre cord dipping); paper (for paper coating); carpet (carpet
backing); construction (concrete modification/ water proofing); paints; textiles (textile finishing); automotive components,
while its various grades of high styrene synthetic rubber finds use in footwear, automotive components, moulded items, v-
belts, conveyer belts and hoses. The company established as a division of Asian Paints Ltd in 1980 was later spun off as a
separate company in 1991. It pioneered the manufacturing of vinyl pyridine latex, an important raw material for the tyre
industry.
Today, the company supplies its wares to leading producers of tyres (Apollo Tyres; Birla Tyres; Continental Modi Tyres;
MRF), paper & paper board (ITC; Ballarpur Industries; JK Paper), rubber (Paragon Footwear; Relaxo Footwear), construction
products (Pidilite Industries; Sika; Fosroc) and carpet (ABC Industries; Obeetee Industries). It exports nearly a fifth of its total
revenues to countries in Middle East, North Africa, and South East Asia. Its key business risks stem from high volatility in
prices of crude oil and its downstream products for its major raw materials are petrochemical products. Apcotex’s plant is
strategically located at Taloja, just a few kilometers from the port city and commercial capital Mumbai on the west coast of
India.
Product Overview
Apcotex primarily deals in two product categories: synthetic latex and synthetic rubber.
Synthetic latex
Paper latex
Apcotex manufactures various kinds of carboxylated styrene – butadiene latex, which are used as a binder for metalized paper
coating and non- woven carpets; in top coating of art and chromo papers. Modified carboxylated styrene – butadiene latex is
used in coating varieties of boards like light weight coated (lwc), medium weight coated (mwc), high weight coated (hwc),
triplex white black and hwc-grey black; in coating of varieties of paper and paperboards. It also produces specialty styrene
acrylic latex which finds application in paper and paperboard coating.
Carpet latex
Various kinds of carboxylated styrene – butadiene latex are designed for stiff unitary and secondary backing as well as non-
thermoformable needlefelt backing of carpets; for soft secondary backings of tufted carpets. Apcotex's specialty styrene acrylic
latex is used for soft secondary and tertiary backing of tufted carpet.
Construction latex
Apcotex's various kinds of specialty styrene butadiene latex find use as an admixture in cement mortar and concrete. Its
carboxylated styrene – butadiene latex are designed for use in non-cementitious waterproofing coatings; while its specialty
styrene acrylic latex is used for modifying hydraulic binder for flexible cementitous coating; designed also for high
performance coatings.
3
3
CD Equisearch Pvt Ltd
Equities Derivatives Commodities Distribution of Mutual Funds Distribution of Life Insurance
Tyre latex
The company produces vinyl pyridine latex which is used for dipping of nylon, rayon, polyester fabrics and other textile
reinforcement materials. This dipped fabric, which is used to manufacture tyre, conveyor belts etc, provides great adhesion
between dipped fabrics and rubber compound.
Paint latex
Apcotex's specialty carboxylated syrene-butadiene-acrylic copolymer dispersion is designed for highly loaded paints and
primers. Its specialty styrene acrylic copolymer dispersion is designed for high performance paints for interior and exterior
applications. Also its specialty styrene acrylic latex is used for modifying hydraulic binder for flexible cementitous coating.
Not to mention the use of its products in water based acrylic emulsion paints and distempers and as a dispersing agent for
inorganic pigments/extenders.
Textile latex
Apcotex develops styrene butadiene rubber latex for textile finishing, which is used on a various kinds of polymers such as
polyester, nylon, etc. It also undertakes production of specialty pure acrylic, formaldehyde free emulsion designed for textile
coating application.
Synthetic rubber
High styrene butadiene rubber
It manufactures various kinds of such products for use in production of hawai chappals, micro cellular soilings, and other
products that require high hardness and abrasion resistance like moulded floor tiles and battery boxes.
Other rubber products
It manufactures high butadiene by emulsion polymerization, which is used to manufacture various rubber products.
Synthetic latex product portfolio
Source: Apcotex
4
4
CD Equisearch Pvt Ltd
Equities Derivatives Commodities Distribution of Mutual Funds Distribution of Life Insurance
Investment Thesis
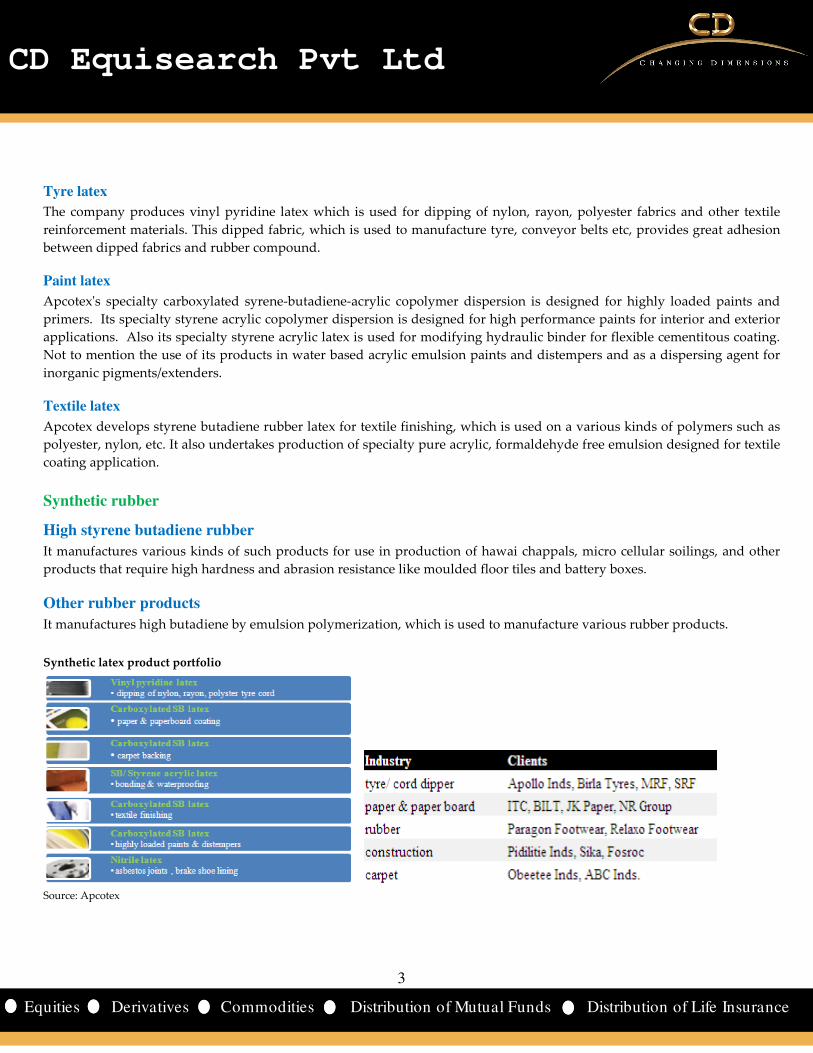
Global styrene butadiene latex market – on the march
According to a report - "Styrene Butadiene Latex Market - Global Industry Analysis, Size, Share, Growth, Trends and Forecast
2015 - 2023" - by Transparency Market Research, the global styrene butadiene latex market is estimated to grow a CAGR of
3.3% between 2015 and 2023, touching $9120 m in 2023 from $6810 m in 2014. The growth during the forecast period would be
led by Asia -Pacific region, which accounts for 45% of global styrene butadiene latex industry, due to high demand for coated
paper. China accounts for over half of the total demand in Asia-Pacific region followed by Japan at 20% share; the ASEAN
region follows next. High growth in carpet manufacturing industries and increase in the number of coated paper
manufacturers in these countries have resulted in increased demand for styrene butadiene latex.
Source: Transparency Market Research Analysis, 2015
Strong demand for the product is also anticipated in Latin America and the Middle East and Africa (MEA). High growth in
construction industry in these regions would propel demand during the forecast period. In fact, in terms of growth rate, Latin
America is expected to be the fastest growing region buoyed by sturdy growth in paper processing industry in Brazil. The
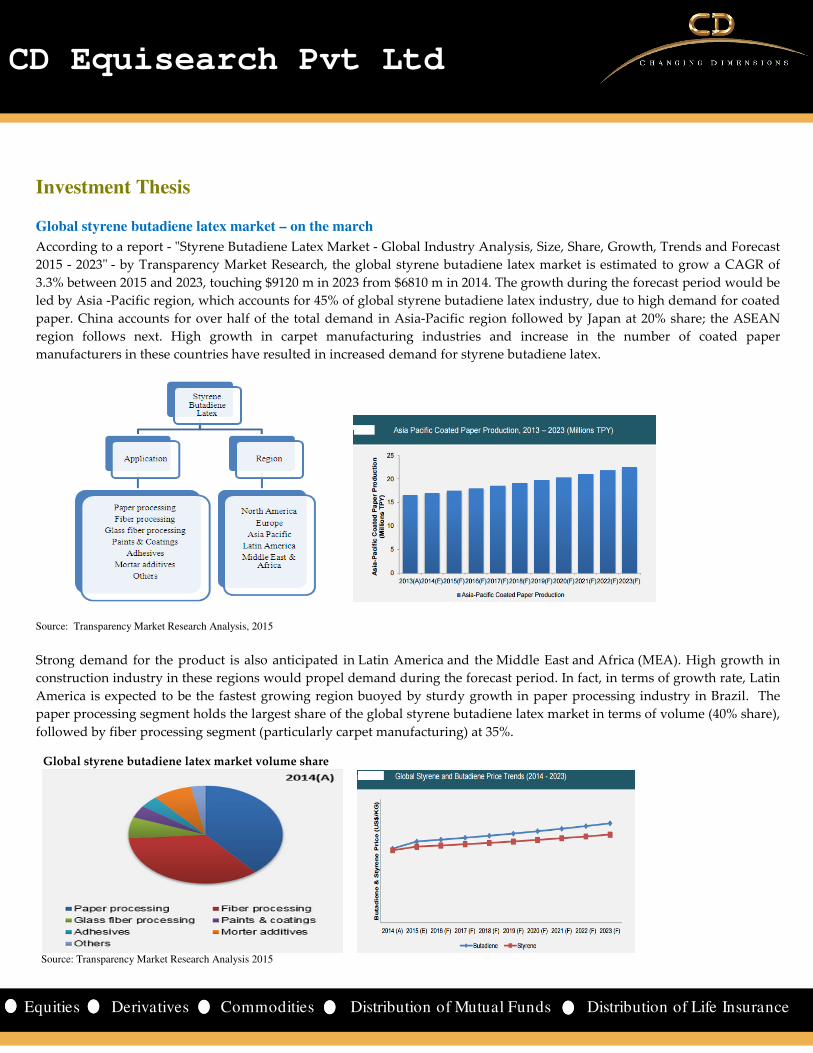
paper processing segment holds the largest share of the global styrene butadiene latex market in terms of volume (40% share),
followed by fiber processing segment (particularly carpet manufacturing) at 35%.
Global styrene butadiene latex market volume share
Source: Transparency Market Research Analysis 2015
5
5
CD Equisearch Pvt Ltd
Equities Derivatives Commodities Distribution of Mutual Funds Distribution of Life Insurance
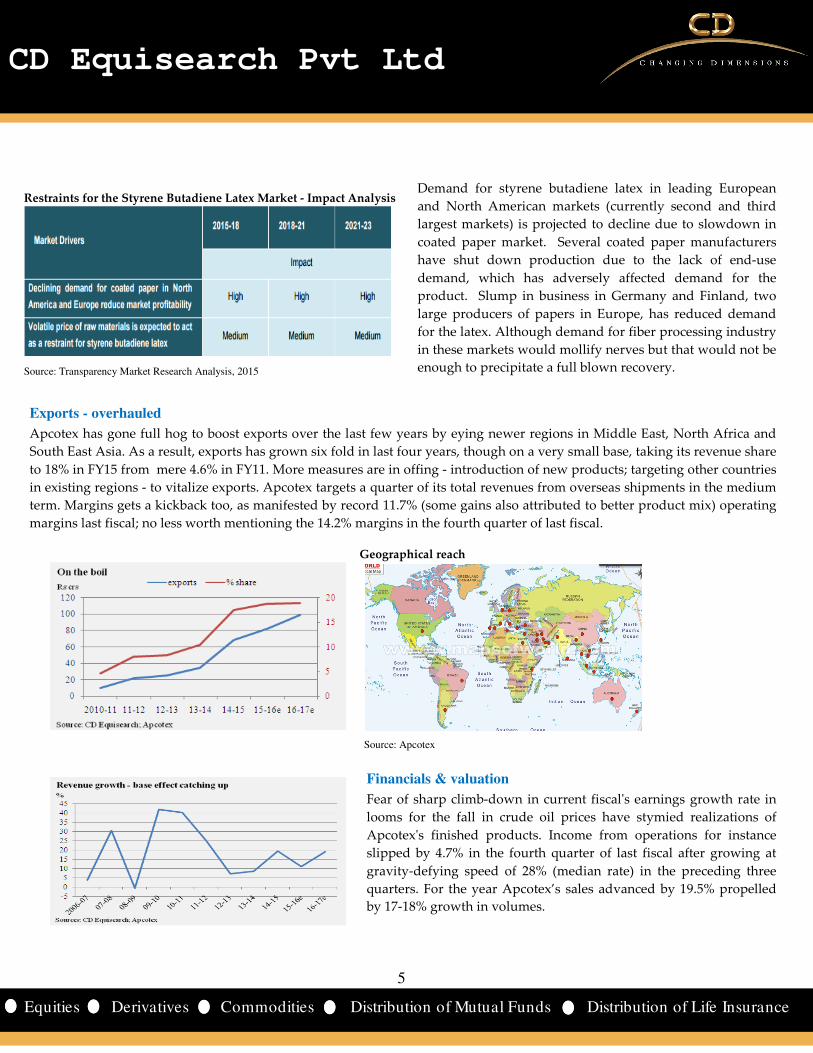
Restraints for the Styrene Butadiene Latex Market - Impact Analysis
Source: Transparency Market Research Analysis, 2015
Geographical reach
Source: Apcotex
Demand for styrene butadiene latex in leading European
and North American markets (currently second and third
largest markets) is projected to decline due to slowdown in
coated paper market. Several coated paper manufacturers
have shut down production due to the lack of end-use
demand, which has adversely affected demand for the
product. Slump in business in Germany and Finland, two
large producers of papers in Europe, has reduced demand
for the latex. Although demand for fiber processing industry
in these markets would mollify nerves but that would not be
enough to precipitate a full blown recovery.
Exports - overhauled
Apcotex has gone full hog to boost exports over the last few years by eying newer regions in Middle East, North Africa and
South East Asia. As a result, exports has grown six fold in last four years, though on a very small base, taking its revenue share
to 18% in FY15 from mere 4.6% in FY11. More measures are in offing - introduction of new products; targeting other countries
in existing regions - to vitalize exports. Apcotex targets a quarter of its total revenues from overseas shipments in the medium
term. Margins gets a kickback too, as manifested by record 11.7% (some gains also attributed to better product mix) operating
margins last fiscal; no less worth mentioning the 14.2% margins in the fourth quarter of last fiscal.
Financials & valuation
Fear of sharp climb-down in current fiscal's earnings growth rate in
looms for the fall in crude oil prices have stymied realizations of
Apcotex's finished products. Income from operations for instance
slipped by 4.7% in the fourth quarter of last fiscal after growing at
gravity-defying speed of 28% (median rate) in the preceding three
quarters. For the year Apcotex’s sales advanced by 19.5% propelled
by 17-18% growth in volumes.
6
6
CD Equisearch Pvt Ltd
Equities Derivatives Commodities Distribution of Mutual Funds Distribution of Life Insurance
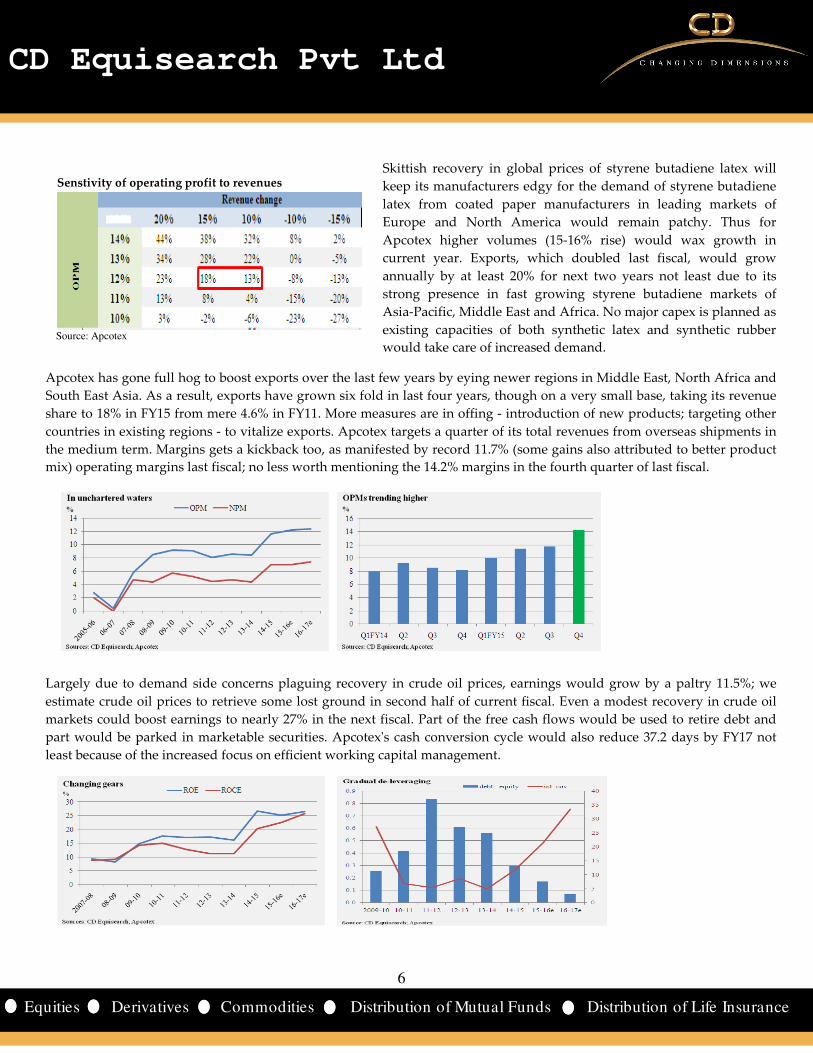
Senstivity of operating profit to revenues
Source: Apcotex
Skittish recovery in global prices of styrene butadiene latex will
keep its manufacturers edgy for the demand of styrene butadiene
latex from coated paper manufacturers in leading markets of
Europe and North America would remain patchy. Thus for
Apcotex higher volumes (15-16% rise) would wax growth in
current year. Exports, which doubled last fiscal, would grow
annually by at least 20% for next two years not least due to its
strong presence in fast growing styrene butadiene markets of
Asia-Pacific, Middle East and Africa. No major capex is planned as
existing capacities of both synthetic latex and synthetic rubber
would take care of increased demand.
Apcotex has gone full hog to boost exports over the last few years by eying newer regions in Middle East, North Africa and
South East Asia. As a result, exports have grown six fold in last four years, though on a very small base, taking its revenue
share to 18% in FY15 from mere 4.6% in FY11. More measures are in offing - introduction of new products; targeting other
countries in existing regions - to vitalize exports. Apcotex targets a quarter of its total revenues from overseas shipments in
the medium term. Margins gets a kickback too, as manifested by record 11.7% (some gains also attributed to better product
mix) operating margins last fiscal; no less worth mentioning the 14.2% margins in the fourth quarter of last fiscal.
Largely due to demand side concerns plaguing recovery in crude oil prices, earnings would grow by a paltry 11.5%; we
estimate crude oil prices to retrieve some lost ground in second half of current fiscal. Even a modest recovery in crude oil
markets could boost earnings to nearly 27% in the next fiscal. Part of the free cash flows would be used to retire debt and
part would be parked in marketable securities. Apcotex's cash conversion cycle would also reduce 37.2 days by FY17 not
least because of the increased focus on efficient working capital management.

7
7
CD Equisearch Pvt Ltd
Equities Derivatives Commodities Distribution of Mutual Funds Distribution of Life Insurance
Risks & Concerns
Volatility in raw material prices
As most of Apcotex's raw materials are petrochemical products, its business is exposed to high volatility in prices of crude oil
and its derivatives. As there always is a lag effect between pricing for raw materials and finished products, margins could
come under pressure in short to medium term.
Shortage of raw materials
Apcotex faces shortage of its two main raw materials - styrene and butadiene. The former is fully imported while the latter is
manufactured by handful of local players. It manages this risk by tracking overseas supplies of the product and by varying
inventories of such materials.
The stock current trades at 17.3xFY16e EPS of Rs 26.54 and 13.6x
FY17e EPS of Rs 33.67. Notwithstanding robust demand for
synthetic latexes, Apcotex's high market share in user industries
(paper & paperboards: 40%; carpets: 65%) and low financial
leverage, external risks abound. Apcotex's small scale of operation
helps little to quell concerns of volatility in earnings. Sharp
correction in crude oil prices could also hurt sales. We, therefore
assign ‘accumulate’ rating on the stock with target of Rs 539 based
on 16xFY17e earnings (peg ratio: 0.8), over a period of 6-9 months.
8
8
CD Equisearch Pvt Ltd
Equities Derivatives Commodities Distribution of Mutual Funds Distribution of Life Insurance
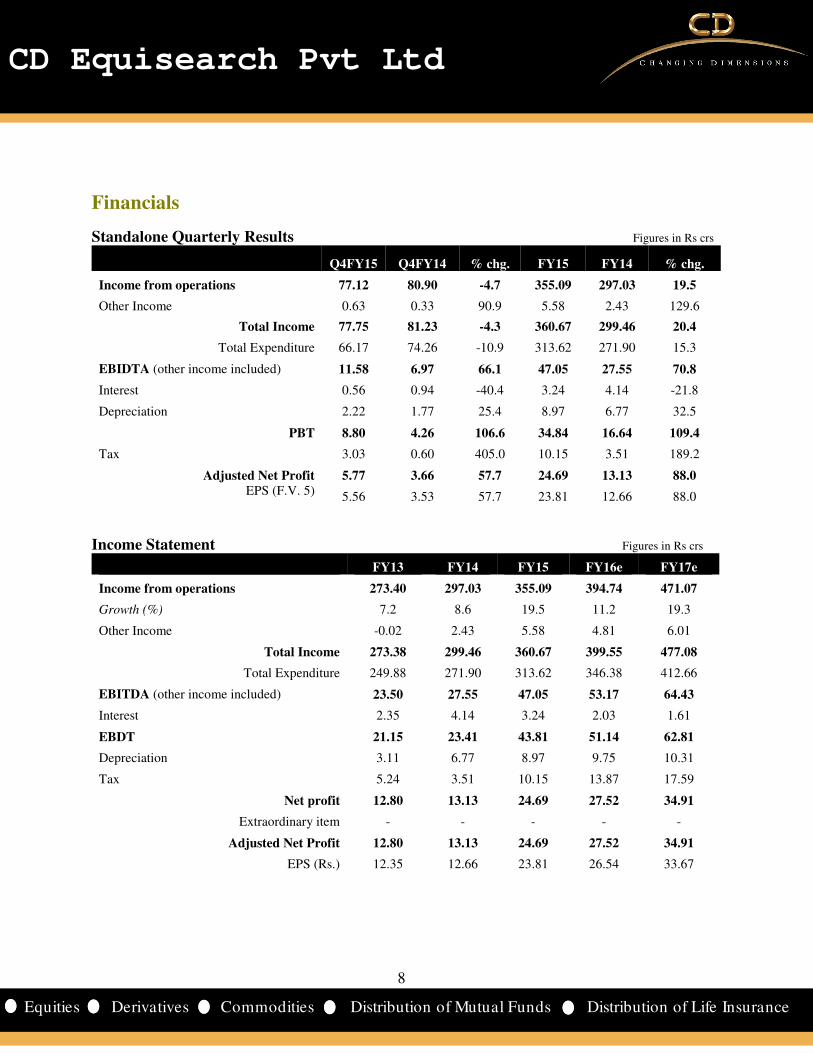
Financials
Standalone Quarterly Results Figures in Rs crs
Q4FY15 Q4FY14 % chg. FY15 FY14 % chg.
Income from operations 77.12 80.90 -4.7 355.09 297.03 19.5
Other Income 0.63 0.33 90.9 5.58 2.43 129.6
Total Income 77.75 81.23 -4.3 360.67 299.46 20.4
Total Expenditure 66.17 74.26 -10.9 313.62 271.90 15.3
EBIDTA (other income included) 11.58 6.97 66.1 47.05 27.55 70.8
Interest 0.56 0.94 -40.4 3.24 4.14 -21.8
Depreciation 2.22 1.77 25.4 8.97 6.77 32.5
PBT 8.80 4.26 106.6 34.84 16.64 109.4
Tax 3.03 0.60 405.0 10.15 3.51 189.2
Adjusted Net Profit 5.77 3.66 57.7 24.69 13.13 88.0
EPS (F.V. 5) 5.56 3.53 57.7 23.81 12.66 88.0
Income Statement Figures in Rs crs
FY13 FY14 FY15 FY16e FY17e
Income from operations 273.40 297.03 355.09 394.74 471.07
Growth (%) 7.2 8.6 19.5 11.2 19.3
Other Income -0.02 2.43 5.58 4.81 6.01
Total Income 273.38 299.46 360.67 399.55 477.08
Total Expenditure 249.88 271.90 313.62 346.38 412.66
EBITDA (other income included) 23.50 27.55 47.05 53.17 64.43
Interest 2.35 4.14 3.24 2.03 1.61
EBDT 21.15 23.41 43.81 51.14 62.81
Depreciation 3.11 6.77 8.97 9.75 10.31
Tax 5.24 3.51 10.15 13.87 17.59
Net profit 12.80 13.13 24.69 27.52 34.91
Extraordinary item - - - - -
Adjusted Net Profit 12.80 13.13 24.69 27.52 34.91
EPS (Rs.) 12.35 12.66 23.81 26.54 33.67
9
9
CD Equisearch Pvt Ltd
Equities Derivatives Commodities Distribution of Mutual Funds Distribution of Life Insurance
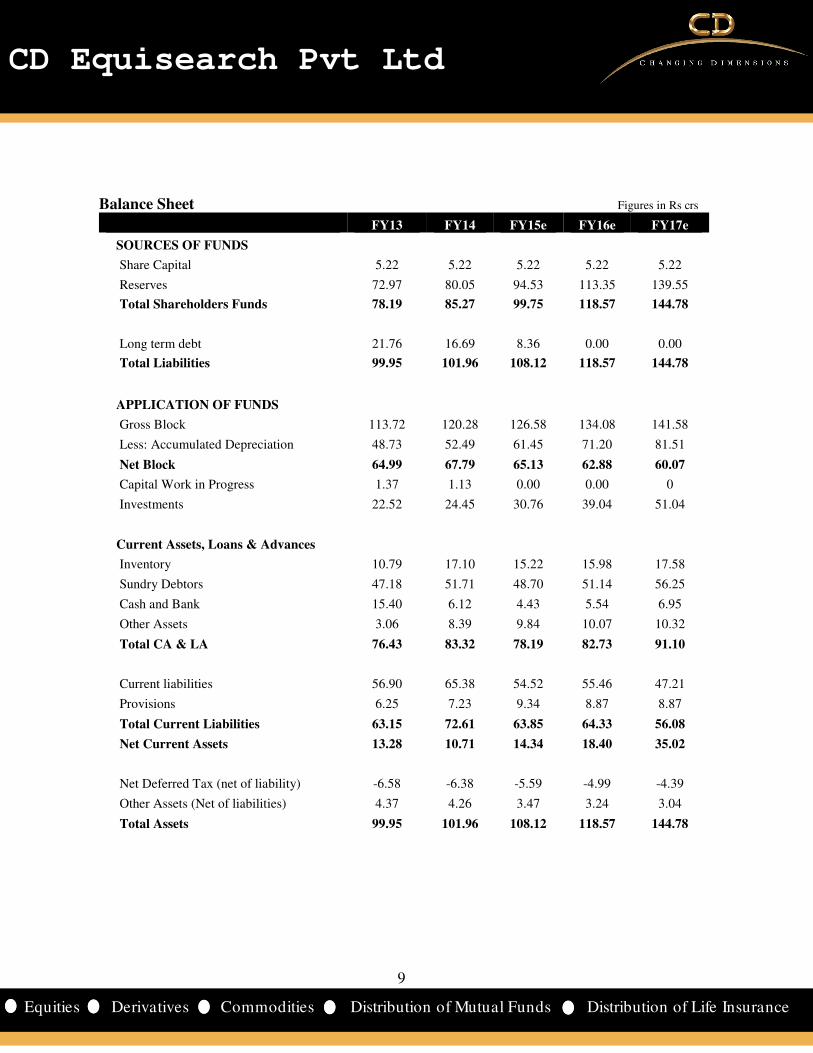
Balance Sheet Figures in Rs crs
FY13 FY14 FY15e FY16e FY17e
SOURCES OF FUNDS
Share Capital 5.22 5.22 5.22 5.22 5.22
Reserves 72.97 80.05 94.53 113.35 139.55
Total Shareholders Funds 78.19 85.27 99.75 118.57 144.78
Long term debt 21.76 16.69 8.36 0.00 0.00
Total Liabilities 99.95 101.96 108.12 118.57 144.78
APPLICATION OF FUNDS
Gross Block 113.72 120.28 126.58 134.08 141.58
Less: Accumulated Depreciation 48.73 52.49 61.45 71.20 81.51
Net Block 64.99 67.79 65.13 62.88 60.07
Capital Work in Progress 1.37 1.13 0.00 0.00 0
Investments 22.52 24.45 30.76 39.04 51.04
Current Assets, Loans & Advances
Inventory 10.79 17.10 15.22 15.98 17.58
Sundry Debtors 47.18 51.71 48.70 51.14 56.25
Cash and Bank 15.40 6.12 4.43 5.54 6.95
Other Assets 3.06 8.39 9.84 10.07 10.32
Total CA & LA 76.43 83.32 78.19 82.73 91.10
Current liabilities 56.90 65.38 54.52 55.46 47.21
Provisions 6.25 7.23 9.34 8.87 8.87
Total Current Liabilities 63.15 72.61 63.85 64.33 56.08
Net Current Assets 13.28 10.71 14.34 18.40 35.02
Net Deferred Tax (net of liability) -6.58 -6.38 -5.59 -4.99 -4.39
Other Assets (Net of liabilities) 4.37 4.26 3.47 3.24 3.04
Total Assets 99.95 101.96 108.12 118.57 144.78
10
10
CD Equisearch Pvt Ltd
Equities Derivatives Commodities Distribution of Mutual Funds Distribution of Life Insurance
[
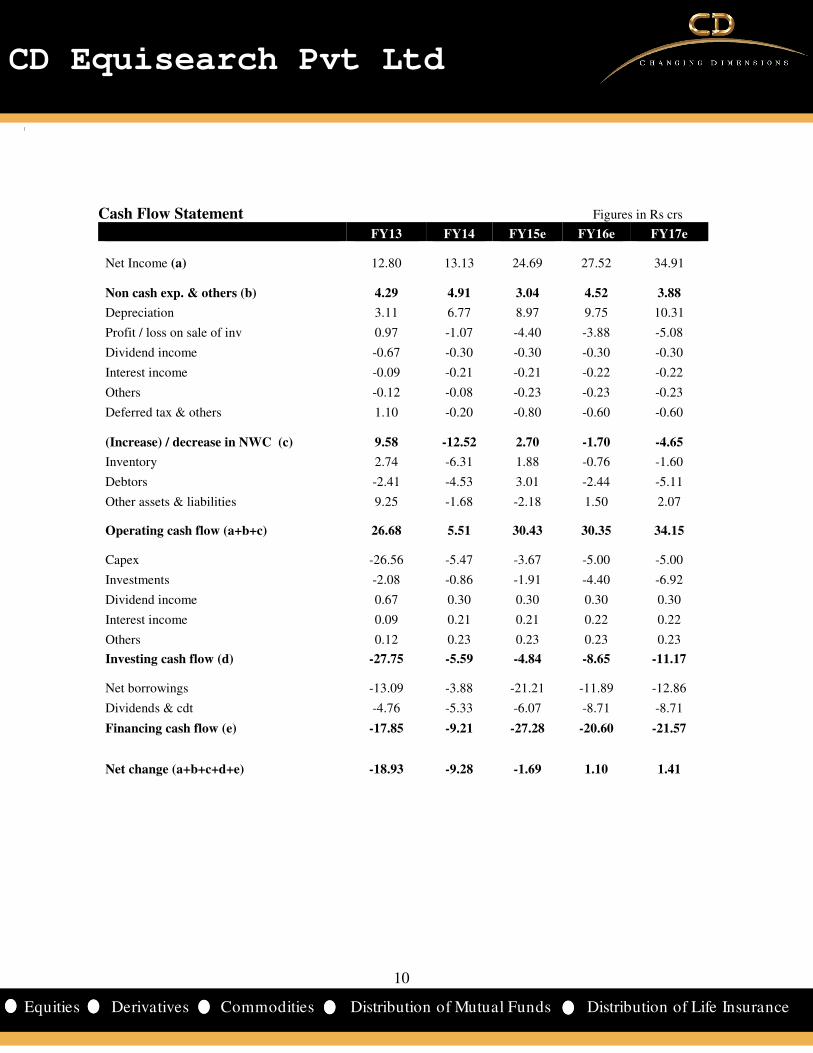
Cash Flow Statement Figures in Rs crs
FY13 FY14 FY15e FY16e FY17e
Net Income (a) 12.80 13.13 24.69 27.52 34.91
Non cash exp. & others (b) 4.29 4.91 3.04 4.52 3.88
Depreciation 3.11 6.77 8.97 9.75 10.31
Profit / loss on sale of inv 0.97 -1.07 -4.40 -3.88 -5.08
Dividend income -0.67 -0.30 -0.30 -0.30 -0.30
Interest income -0.09 -0.21 -0.21 -0.22 -0.22
Others -0.12 -0.08 -0.23 -0.23 -0.23
Deferred tax & others 1.10 -0.20 -0.80 -0.60 -0.60
(Increase) / decrease in NWC (c) 9.58 -12.52 2.70 -1.70 -4.65
Inventory 2.74 -6.31 1.88 -0.76 -1.60
Debtors -2.41 -4.53 3.01 -2.44 -5.11
Other assets & liabilities 9.25 -1.68 -2.18 1.50 2.07
Operating cash flow (a+b+c) 26.68 5.51 30.43 30.35 34.15
Capex -26.56 -5.47 -3.67 -5.00 -5.00
Investments -2.08 -0.86 -1.91 -4.40 -6.92
Dividend income 0.67 0.30 0.30 0.30 0.30
Interest income 0.09 0.21 0.21 0.22 0.22
Others 0.12 0.23 0.23 0.23 0.23
Investing cash flow (d) -27.75 -5.59 -4.84 -8.65 -11.17
Net borrowings -13.09 -3.88 -21.21 -11.89 -12.86
Dividends & cdt -4.76 -5.33 -6.07 -8.71 -8.71
Financing cash flow (e) -17.85 -9.21 -27.28 -20.60 -21.57
Net change (a+b+c+d+e) -18.93 -9.28 -1.69 1.10 1.41

11
11
CD Equisearch Pvt Ltd
Equities Derivatives Commodities Distribution of Mutual Funds Distribution of Life Insurance
Key Financial Ratios
FY13 FY14 FY15e FY16e FY17e
Growth Ratios
Revenue (%) 7.2 8.6 19.5 11.2 19.3
EBIDTA (%) 3.2 17.3 70.8 13.0 21.2
Net Profit (%) 11.7 2.6 88.0 11.5 26.9
EPS (%) 11.7 2.6 88.0 11.5 26.9
Margins
Operating Profit Margin (%) 8.6 8.5 11.7 12.3 12.4
Gross Profit Margin (%) 7.7 7.9 12.3 13.0 13.3
Net Profit Margin (%) 4.7 4.4 7.0 7.0 7.4
Return
ROCE (%) 11.2 11.2 20.3 22.6 25.8
RONW (%) 17.3 16.1 26.7 25.2 26.5
Valuations
Market Cap / Sales 0.4 0.4 1.5 1.2 1.0
EV/EBIDTA 4.8 5.2 10.9 8.8 7.3
P/E 8.0 9.5 20.9 17.3 13.6
P/BV 1.3 1.5 5.2 4.0 3.3
Other Ratios
Interest Coverage 8.7 5.0 11.8 21.4 33.5
Debt-Equity Ratio 0.6 0.6 0.3 0.2 0.1
Current Ratio 1.2 1.1 1.2 1.3 1.6
Turnover Ratios
Fixed Asset Turnover 5.7 4.5 5.3 6.2 7.7
Total Asset Turnover 2.8 2.9 3.4 3.5 3.6
Debtors Turnover 5.9 6.0 7.1 7.9 8.8
Inventory Turnover 20.5 19.5 19.4 22.2 24.6
Creditors Turnover 15.0 12.3 13.9 16.7 18.9
WC Ratios
Debtor Days 61.4 60.8 51.6 46.2 41.6
Inventory Days 17.8 18.7 18.8 16.4 14.8
Creditor Days 24.3 29.8 26.3 21.9 19.3
Cash Conversion Cycle 54.8 49.7 44.1 40.7 37.2
Cash Flows (Rs crs)
Operating Cash Flow 26.7 5.5 30.4 30.3 34.2
FCFF 0.6 2.8 27.9 23.1 24.1
FCFE -14.2 -4.0 4.4 9.8 10.1
12
12
CD Equisearch Pvt Ltd
Equities Derivatives Commodities Distribution of Mutual Funds Distribution of Life Insurance
Recommendation
Strong demand outlook for styrene butadiene latex, particularly in Asia - Pacific, bodes well for its suppliers globally.
According to a study by Transparency Market Research, a U.S.-based provider of syndicated research, customized
research, and consulting services, the global styrene butadiene latex market is estimated to grow a CAGR of 3.3% between
2015 and 2023. Higher demand for coated paper will buoy demand for latex in Asia - Pacific, region, which accounts for
45% of the global styrene butadiene latex industry. Other markets such as Latin America and the Middle East and Africa
(MEA) would also do reasonably well not least due to robust off take from the construction industry in these regions and
paper processing industry in Brazil.
Though leading European and North American markets of styrene butadiene latex would feel the heat of slowdown in
their coated paper market, Apcotex would yet steer clear for its shipments to these markets are awfully low. It is eying
more regions in its stronghold Middle East, North African and South East Asian regions and introducing more value add
products to stimulate exports. As a result, margins could further rise - operating margins rose to unsustainably high 14.2%
in fourth quarter of last fiscal. Apoctex reckons that its overall margins are more a function of product mix than of the cost
plus fixed-mark up.
Its roll out of acrylics products for paper, construction and carpet segments in last few years has been well received. More
such value added products would be unveiled over the next few years, which would further cement its market share in
these segments; current share at 40-43% for paper & paper boards; 65% for carpets; 40% for construction; 30-35% for tyres;
50% for rubber.
Capacity expansion of synthetic latex is not on anvil as its existing capacity of 55000 mt, which is currently operating at 70-
75% rate, would adequately cover next two years of presumed volume growth (utilization 80-90%). Even the existing
facility could churn out 60000-65000mt of latex depending on the product mix. Yet Apcotex could enhance capacity by
15000 mt at short notice by incurring capex of Rs 5-7 crs at its existing facility at Tajola, Maharahstra; although no such
expansion in on the cards yet.
High volumes estimated at 15-16% would more than make up for fall in realizations as income from operations would rise
by 11.5%. Though operating margins could rise marginally in current fiscal, increased volatility in crude oil prices dent
realization of finished products. No less significant would be shortage of key raw materials - styrene and butadiene - and
lag effect in fixing supply contracts with clients. Apcotex's synthetic rubber business has been struggling for few years now
because of shift in market preference for cheaper polymers.
The stock current trades at 17.3x FY16e EPS of Rs 26.54 and 13.6x FY17e EPS of Rs 33.67. Notwithstanding robust demand
for synthetic latexes, Apcotex's high market share in user industries (paper & paperboards: 40%; carpets: 65%) and low
financial leverage, external risks abound. Apcotex's puny business size helps little to quash concerns of volatility in
earnings due to high competition overseas. Sharp correction in crude oil prices could also impinge sales. Rerating of the
stock in last few months reflects Apcotex's improved growth prospects - earnings rose by some 88% last fiscal. But the base
effect is now visible. We, therefore assign ‘accumulate’ rating on the stock with target of Rs 539 based on 16xFY17e
earnings (peg ratio: 0.8), over a period of 6-9 months.

13
13
CD Equisearch Pvt Ltd
Equities Derivatives Commodities Distribution of Mutual Funds Distribution of Life Insurance
Disclosure& Disclaimer CD Equisearch Private Limited (hereinafter referred to as ‘CD Equi’) is a Member registered with National Stock Exchange of India Limited,
Bombay Stock Exchange Limited and Metropolitan Stock Exchange of India Limited (Formerly known as MCX Stock Exchange Limited). CD
Equi is also registered as Depository Participant with CDSL and AMFI registered Mutual Fund Advisor. The associates of CD Equi are
engaged in activities relating to NBFC-ND - Financing and Investment, Commodity Broking, Real Estate, etc.
CD Equi has applied for registration under SEBI (Research Analysts) Regulations, 2014. Further, CD Equi hereby declares that –
• No disciplinary action has been taken against CD Equi by any of the regulatory authorities.
• CD Equi/its associates/research analysts do not have any financial interest/beneficial interest of more than one percent/material
conflict of interest in the subject company(s).
• CD Equi/its associates/research analysts have not received any compensation from the subject company(s) during the past twelve
months.
• CD Equi/its research analysts has not served as an officer, director or employee of company covered by analysts and has not been
engaged in market making activity of the company covered by analysts.
This document is solely for the personal information of the recipient and must not be singularly used as the basis of any investment decision.
Nothing in this document should be construed as investment or financial advice. Each recipient of this document should make such
investigations as they deem necessary to arrive at an independent evaluation of an investment in the securities of the companies referred to
in this document (including the merits and risks involved) and should consult their own advisors to determine the merits and risks of such
an investment.
Reports based on technical and derivative analysis center on studying charts of a stock's price movement, outstanding positions and trading
volume, as opposed to focusing on a company's fundamentals and as such, may not match with a report on a company's fundamentals.
The information in this document has been printed on the basis of publicly available information, internal data and other reliable sources
believed to be true but we do not represent that it is accurate or complete and it should not be relied on as such, as this document is for
general guidance only. CD Equi or any of its affiliates/group companies shall not be in any way responsible for any loss or damage that may
arise to any person from any inadvertent error in the information contained in this report. CD Equi has not independently verified all the
information contained within this document. Accordingly, we cannot testify nor make any representation or warranty, express or implied, to
the accuracy, contents or data contained within this document.
While, CD Equi endeavors to update on a reasonable basis the information discussed in this material, there may be regulatory compliance or
other reasons that prevent us from doing so.
This document is being supplied to you solely for your information and its contents, information or data may not be reproduced,
redistributed or passed on, directly or indirectly. Neither, CD Equi nor its directors, employees or affiliates shall be liable for any loss or
damage that may arise from or in connection with the use of this information.
CD Equisearch Private Limited (CIN: U67120WB1995PTC071521)
Registered Office: 37, Shakespeare Sarani, 1st Floor, Kolkata – 700 017; Phone: +91(33) 4488 0000; Fax: +91(33) 2289 2557; Corporate Office: 10,
Vasawani Mansion, 2nd Floor, Dinshaw Wachha Road, Churchgate, Mumbai – 400 020; Phone: +91(22) 2283 0652/0653; Fax: +91(22) 2283, 2276
Website: www.cdequi.com; Email: [email protected]