Embed Size (px)
Citation preview
1
Supporting information
Integration of Fluorescence Imaging with Proteomics Enables Visualization and Identification of Metallo-proteomes in Living CellsYau-Tsz Lai†a, Ya Yang†a, Ligang Hua, Tianfan Chenga, Yuen-Yan Changa, Mohamad Koohi-Moghadama, Yuchuan Wangb, Jiang Xiac, Junwen Wangd,e, Hongyan Lia, Hongzhe Sun*a
a. Department of Chemistry, The University of Hong Kong, Pokfulam Road, Hong Kong SAR, P.R. China. E-mail: [email protected]; Fax: +852 28571586
b. MOE Key Laboratory of Bioinorganic and Synthetic Chemistry, School of Chemistry and Chemical Engineering, Sun Yat-sen University, Guangzhou, P.R. China
c. Department of Chemistry, The Chinese University of Hong Kong, Hong Kong, P.R. Chinad. Center for Individualized Medicine & Department of Health Sciences Research, Mayo Clinic,
Scottsdale, AZ 85259 USAe. Department of Biological Informatics, Arizona State University, Scottsdale, AZ 85259 USA
Electronic Supplementary Material (ESI) for Metallomics.This journal is © The Royal Society of Chemistry 2016
2
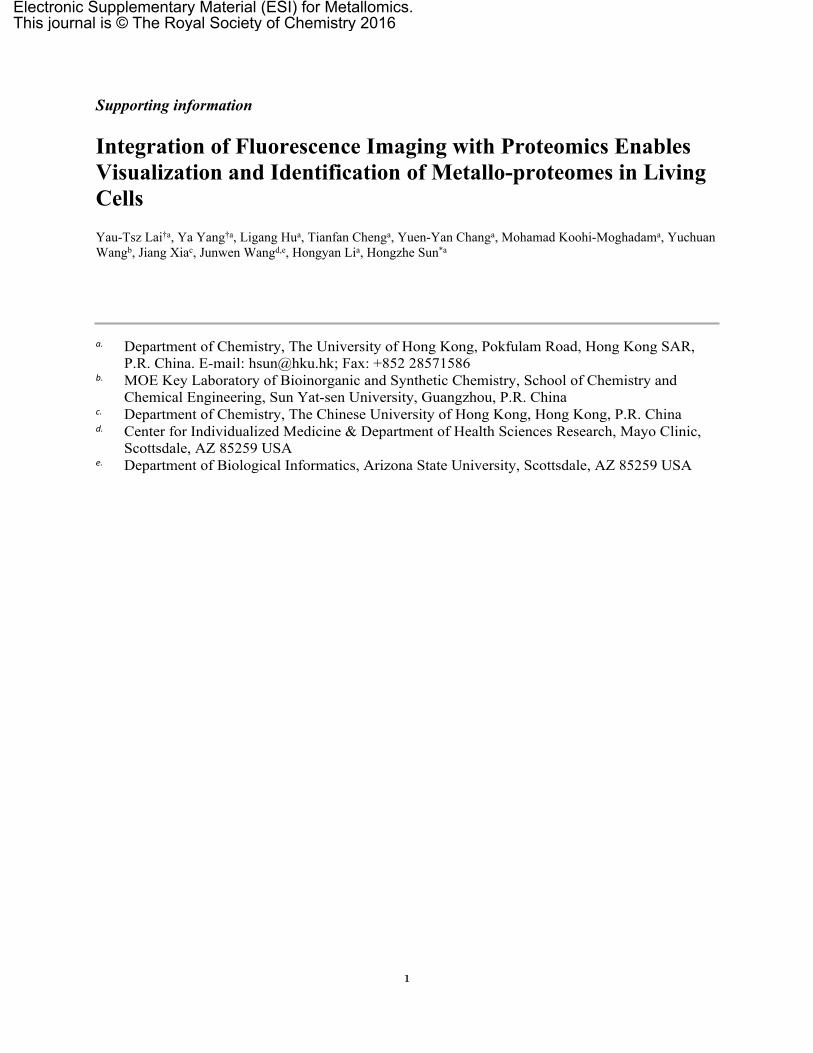
Figure S1. Plot of fluorescence against time upon the displacement of Cu2+ from Cu2+-TRACER (5 µM) by NTA (500 µM) in 20 mM Tris-HCl buffer, pH 7.2 to determine the dissociation kinetics to be (Koff) of 0.018 ± 0.002 s-1 by fitting the data with a single exponential rate equation.
3
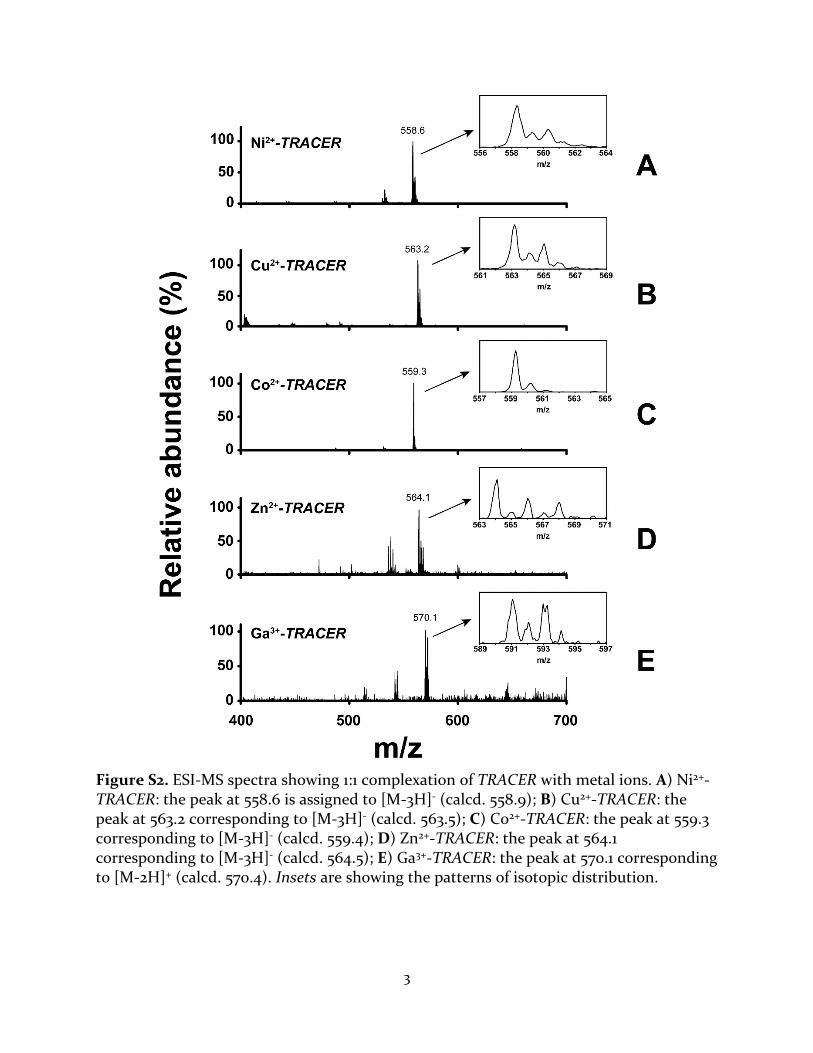
Figure S2. ESI-MS spectra showing 1:1 complexation of TRACER with metal ions. A) Ni2+-TRACER: the peak at 558.6 is assigned to [M-3H]- (calcd. 558.9); B) Cu2+-TRACER: the peak at 563.2 corresponding to [M-3H]- (calcd. 563.5); C) Co2+-TRACER: the peak at 559.3 corresponding to [M-3H]- (calcd. 559.4); D) Zn2+-TRACER: the peak at 564.1 corresponding to [M-3H]- (calcd. 564.5); E) Ga3+-TRACER: the peak at 570.1 corresponding to [M-2H]+ (calcd. 570.4). Insets are showing the patterns of isotopic distribution.
4
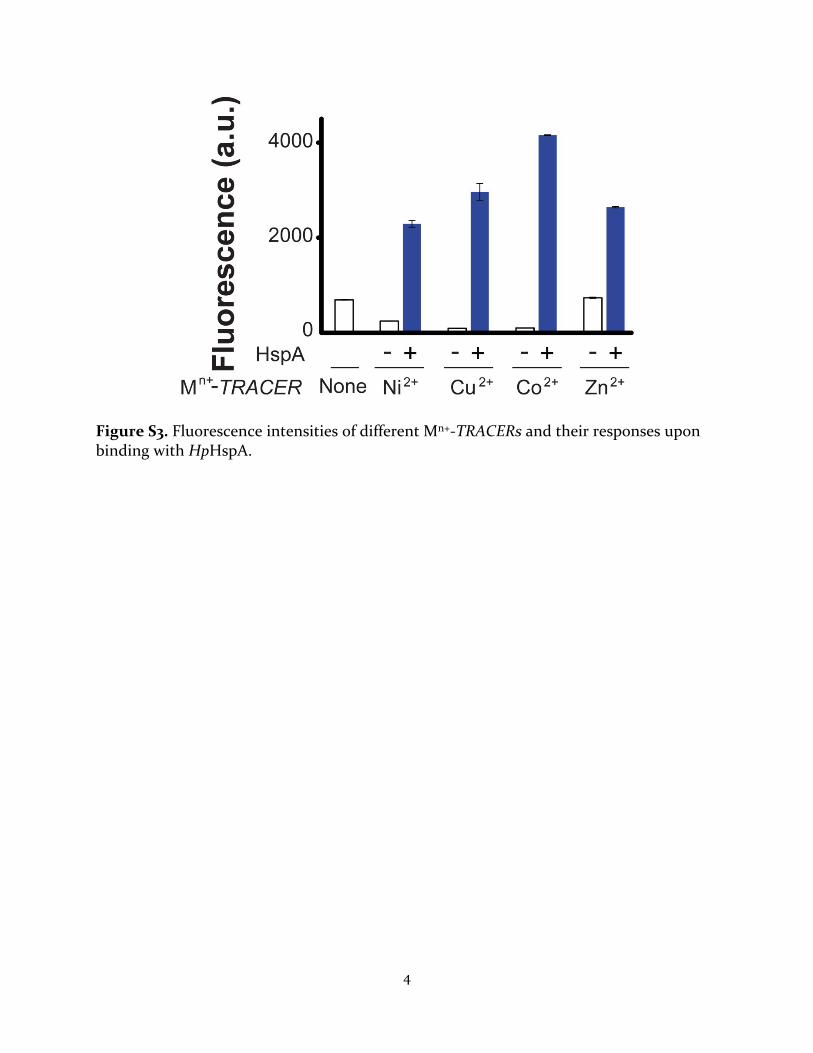
Figure S3. Fluorescence intensities of different Mn+-TRACERs and their responses upon binding with HpHspA.
5
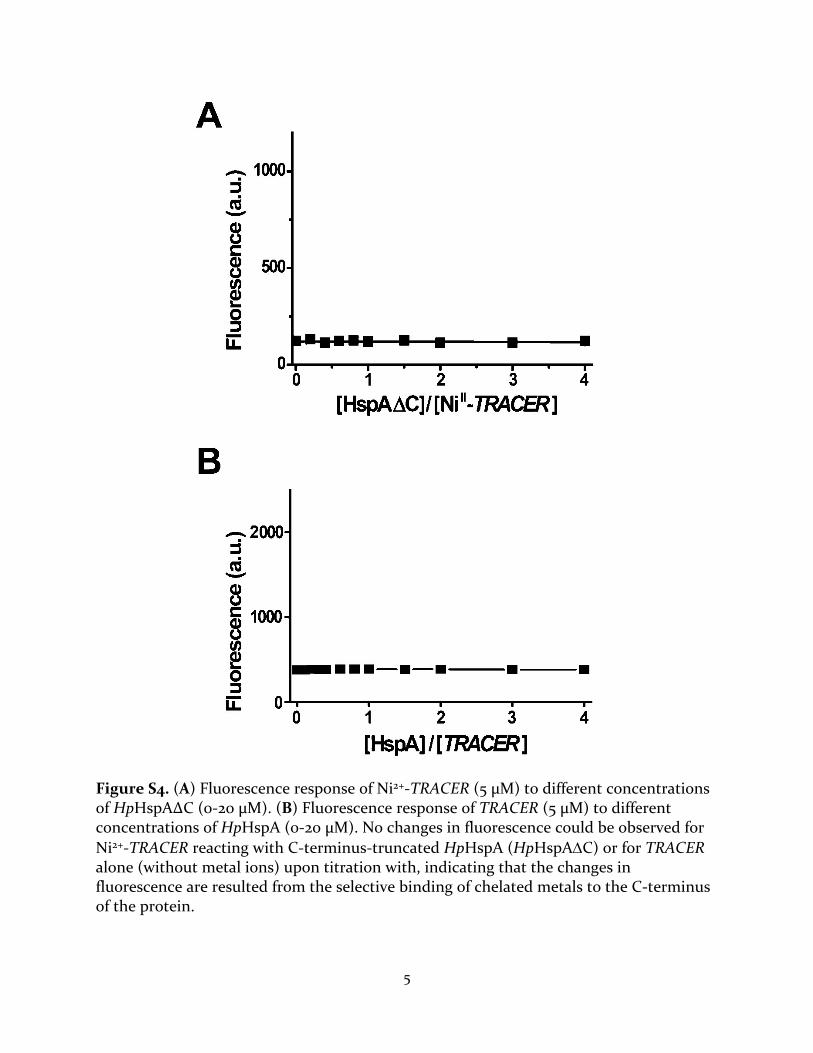
Figure S4. (A) Fluorescence response of Ni2+-TRACER (5 μM) to different concentrations of HpHspAΔC (0-20 μM). (B) Fluorescence response of TRACER (5 μM) to different concentrations of HpHspA (0-20 μM). No changes in fluorescence could be observed for Ni2+-TRACER reacting with C-terminus-truncated HpHspA (HpHspAC) or for TRACER alone (without metal ions) upon titration with, indicating that the changes in fluorescence are resulted from the selective binding of chelated metals to the C-terminus of the protein.
6
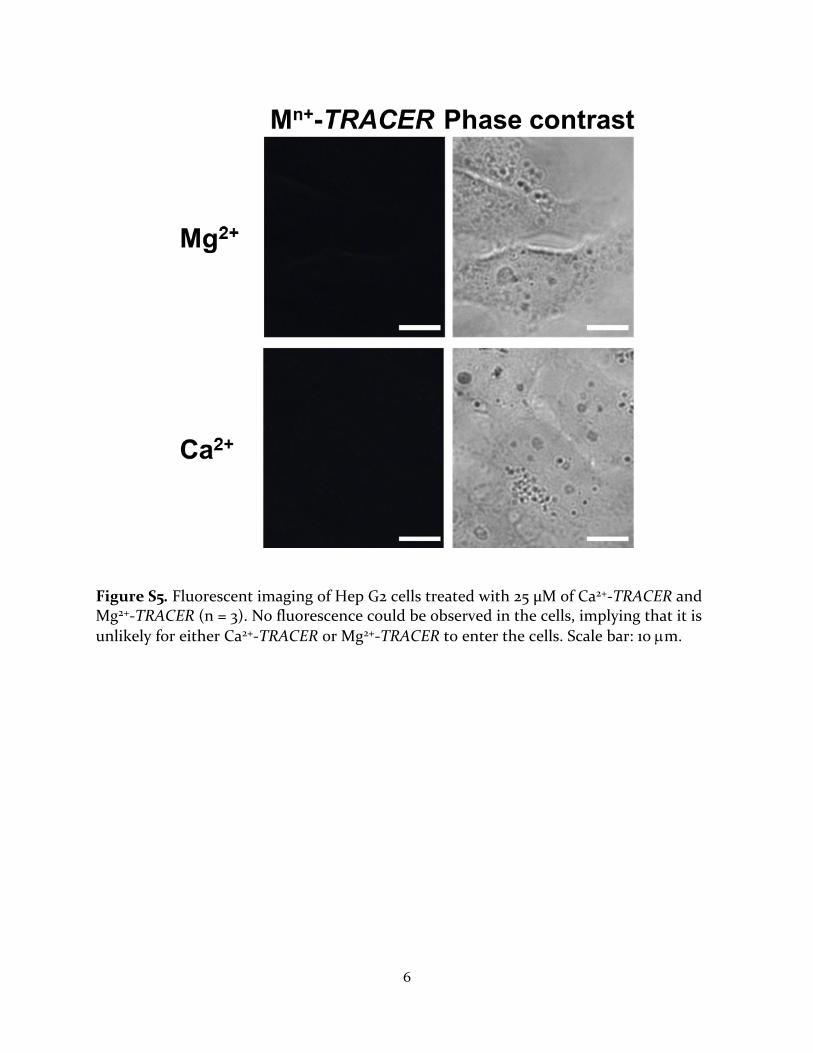
Figure S5. Fluorescent imaging of Hep G2 cells treated with 25 µM of Ca2+-TRACER and Mg2+-TRACER (n = 3). No fluorescence could be observed in the cells, implying that it is unlikely for either Ca2+-TRACER or Mg2+-TRACER to enter the cells. Scale bar: 10 m.
7
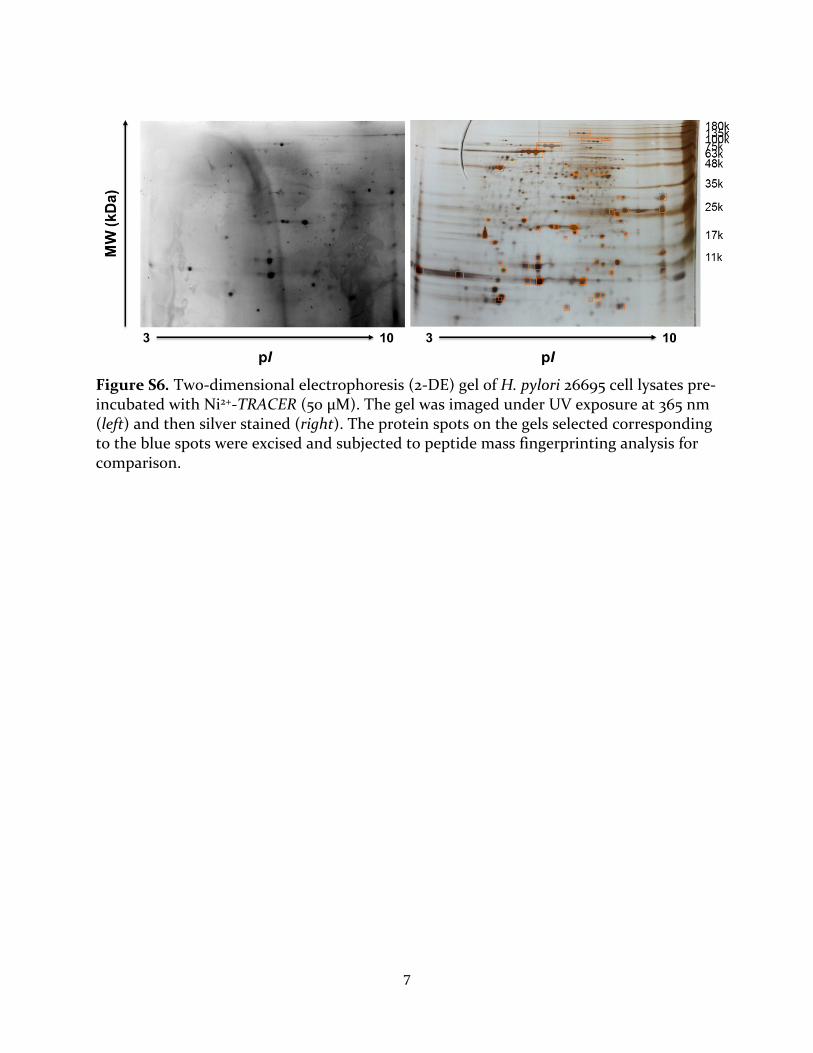
Figure S6. Two-dimensional electrophoresis (2-DE) gel of H. pylori 26695 cell lysates pre-incubated with Ni2+-TRACER (50 μM). The gel was imaged under UV exposure at 365 nm (left) and then silver stained (right). The protein spots on the gels selected corresponding to the blue spots were excised and subjected to peptide mass fingerprinting analysis for comparison.
8
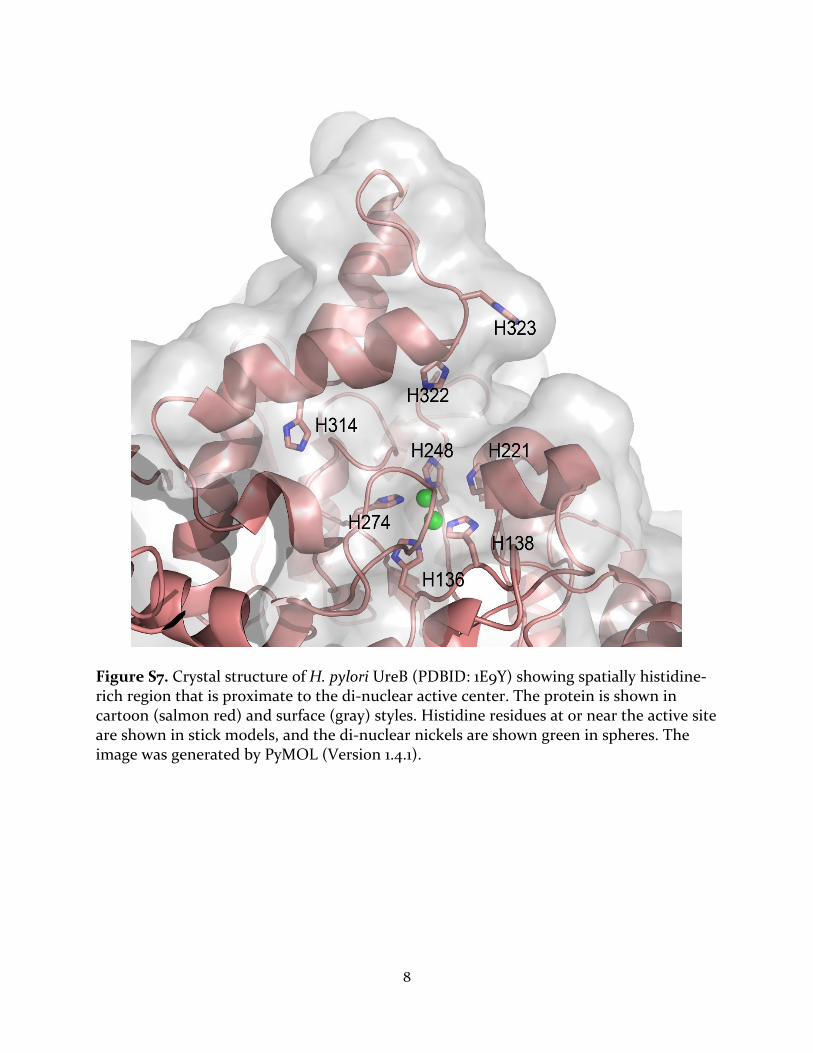
Figure S7. Crystal structure of H. pylori UreB (PDBID: 1E9Y) showing spatially histidine-rich region that is proximate to the di-nuclear active center. The protein is shown in cartoon (salmon red) and surface (gray) styles. Histidine residues at or near the active site are shown in stick models, and the di-nuclear nickels are shown green in spheres. The image was generated by PyMOL (Version 1.4.1).
9
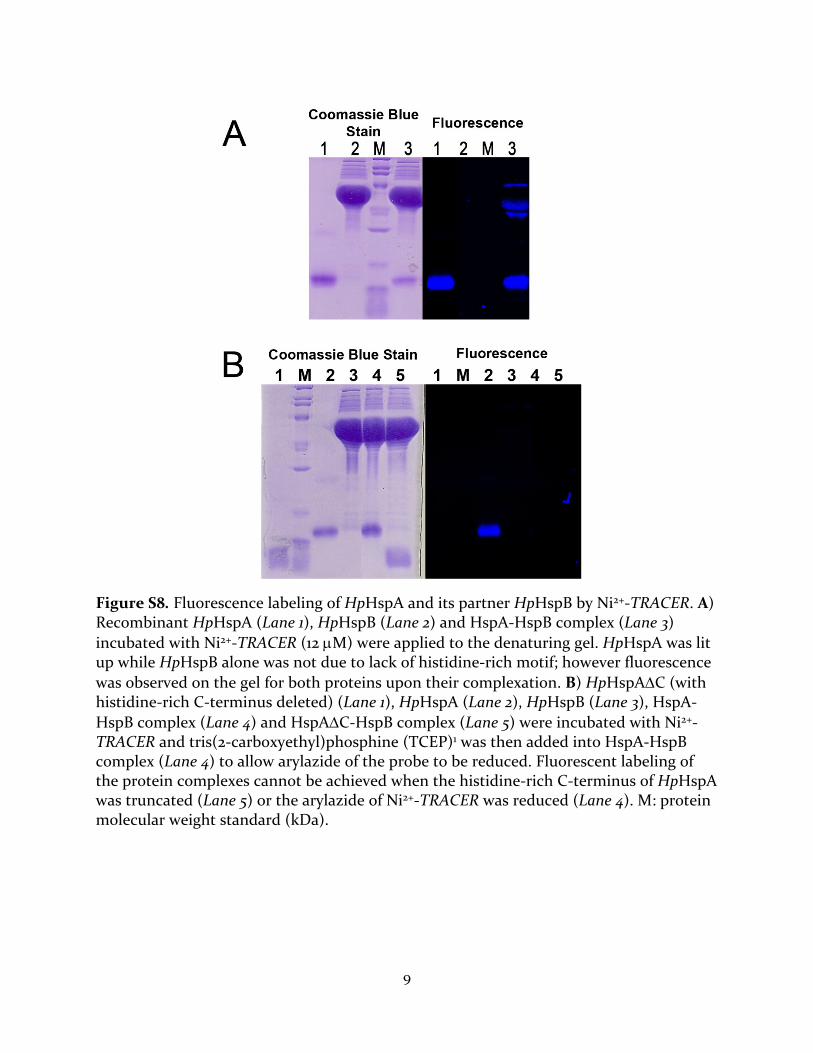
Figure S8. Fluorescence labeling of HpHspA and its partner HpHspB by Ni2+-TRACER. A) Recombinant HpHspA (Lane 1), HpHspB (Lane 2) and HspA-HspB complex (Lane 3) incubated with Ni2+-TRACER (12 M) were applied to the denaturing gel. HpHspA was lit up while HpHspB alone was not due to lack of histidine-rich motif; however fluorescence was observed on the gel for both proteins upon their complexation. B) HpHspAC (with histidine-rich C-terminus deleted) (Lane 1), HpHspA (Lane 2), HpHspB (Lane 3), HspA-HspB complex (Lane 4) and HspAC-HspB complex (Lane 5) were incubated with Ni2+-TRACER and tris(2-carboxyethyl)phosphine (TCEP)1 was then added into HspA-HspB complex (Lane 4) to allow arylazide of the probe to be reduced. Fluorescent labeling of the protein complexes cannot be achieved when the histidine-rich C-terminus of HpHspA was truncated (Lane 5) or the arylazide of Ni2+-TRACER was reduced (Lane 4). M: protein molecular weight standard (kDa).
10
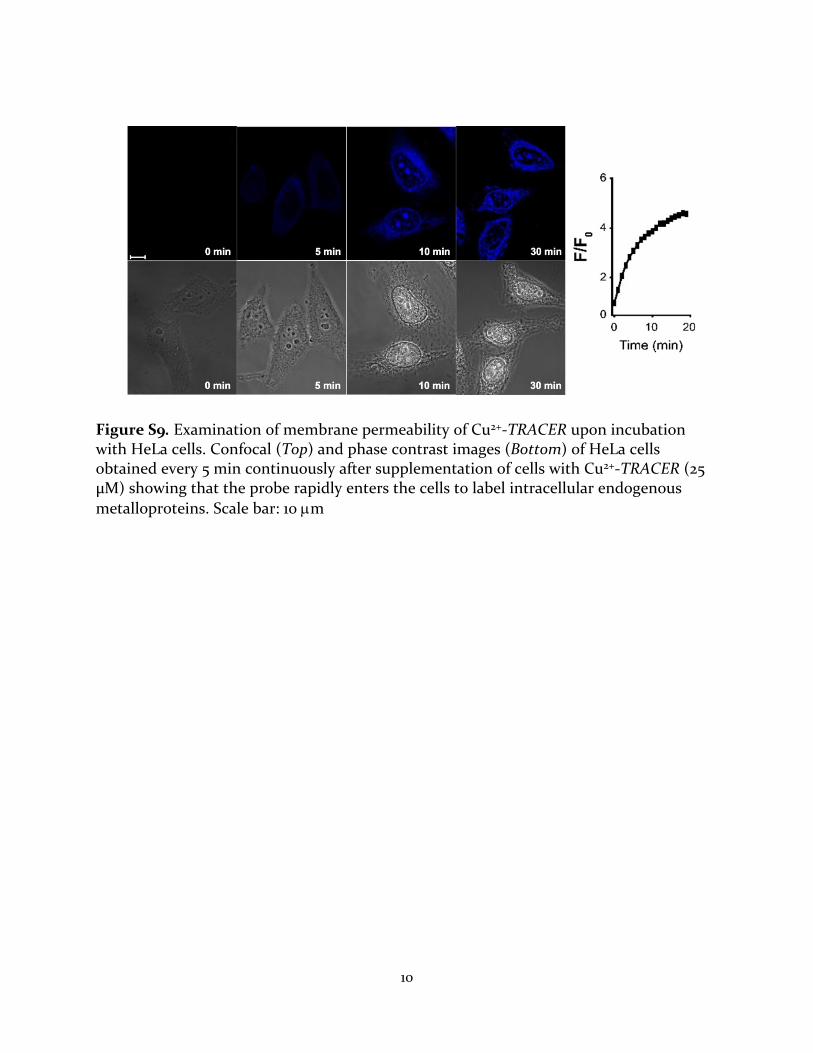
Figure S9. Examination of membrane permeability of Cu2+-TRACER upon incubation with HeLa cells. Confocal (Top) and phase contrast images (Bottom) of HeLa cells obtained every 5 min continuously after supplementation of cells with Cu2+-TRACER (25 µM) showing that the probe rapidly enters the cells to label intracellular endogenous metalloproteins. Scale bar: 10 m
11
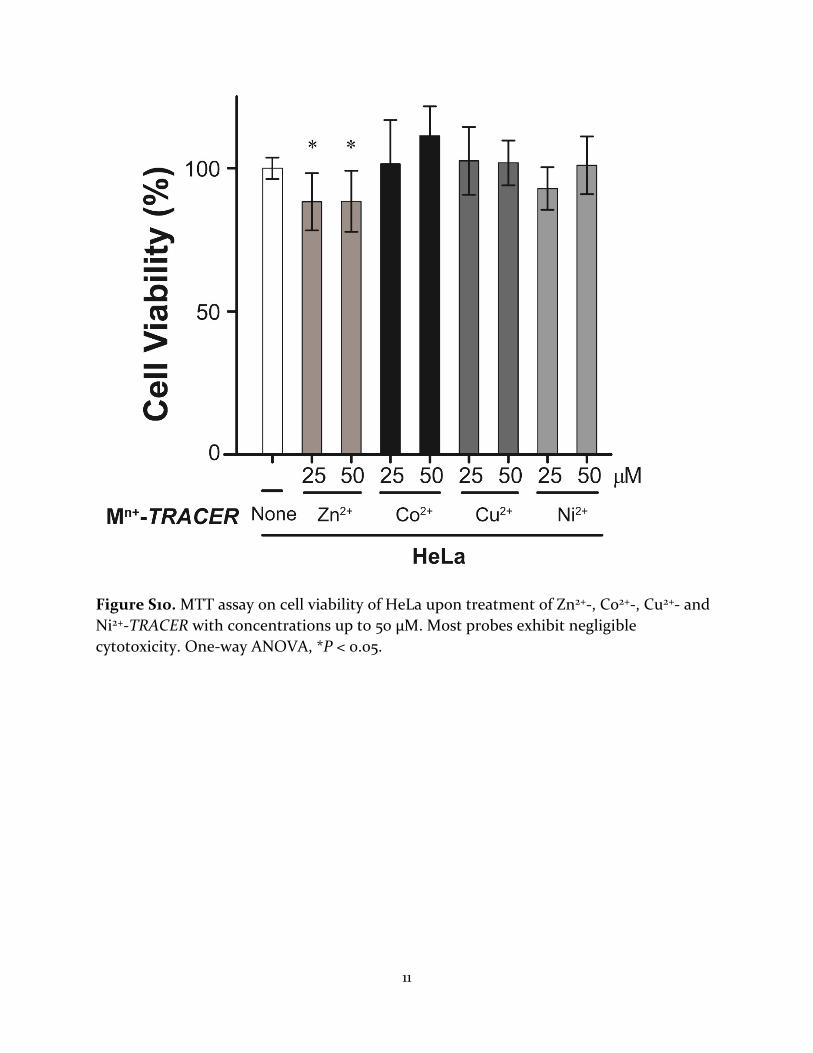
Figure S10. MTT assay on cell viability of HeLa upon treatment of Zn2+-, Co2+-, Cu2+- and Ni2+-TRACER with concentrations up to 50 µM. Most probes exhibit negligible cytotoxicity. One-way ANOVA, *P < 0.05.
12
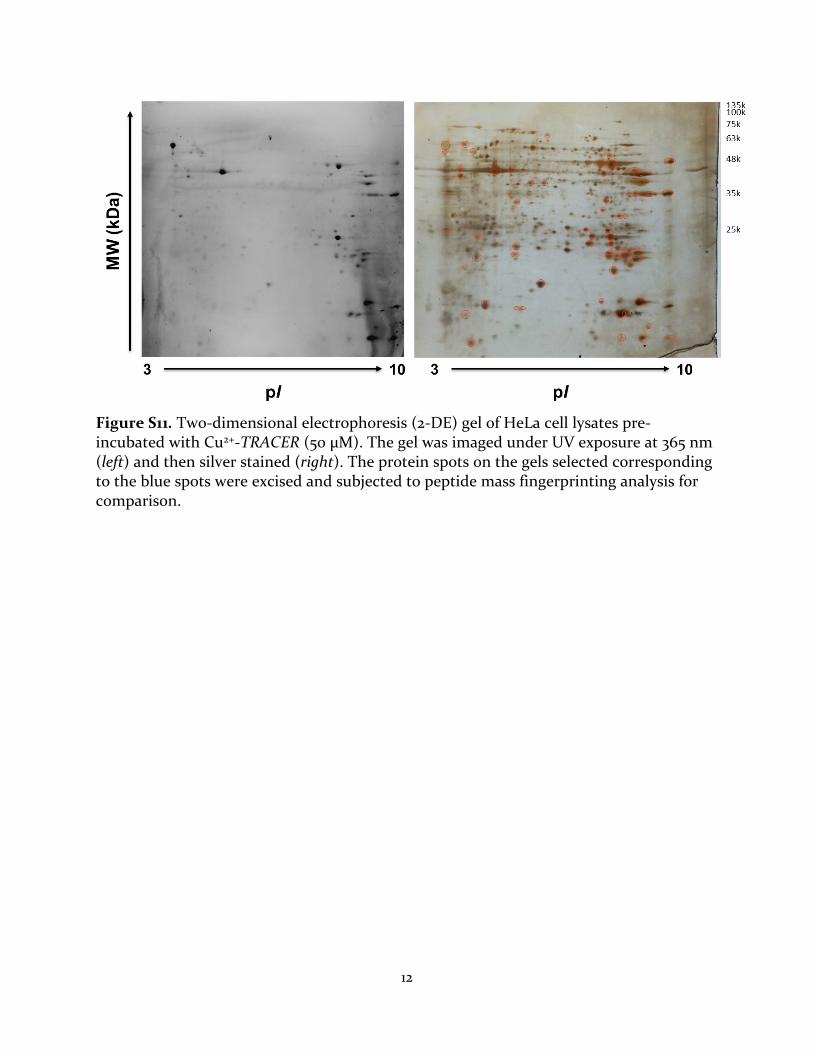
Figure S11. Two-dimensional electrophoresis (2-DE) gel of HeLa cell lysates pre-incubated with Cu2+-TRACER (50 μM). The gel was imaged under UV exposure at 365 nm (left) and then silver stained (right). The protein spots on the gels selected corresponding to the blue spots were excised and subjected to peptide mass fingerprinting analysis for comparison.
13
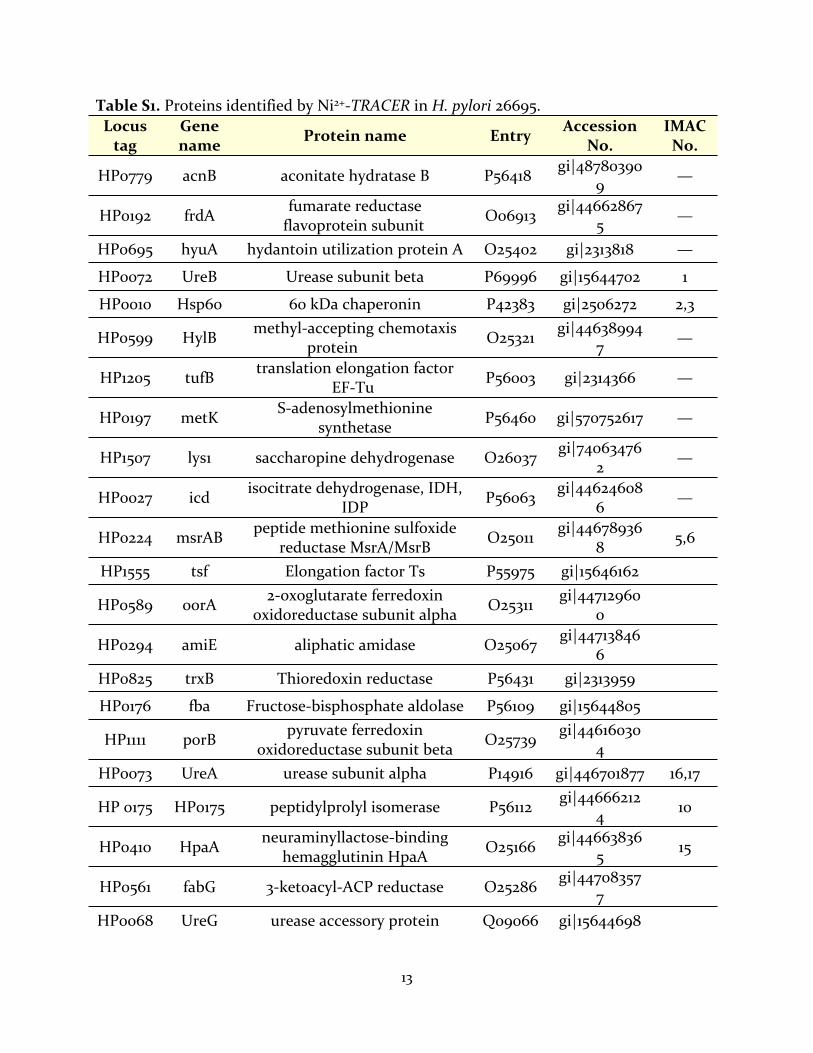
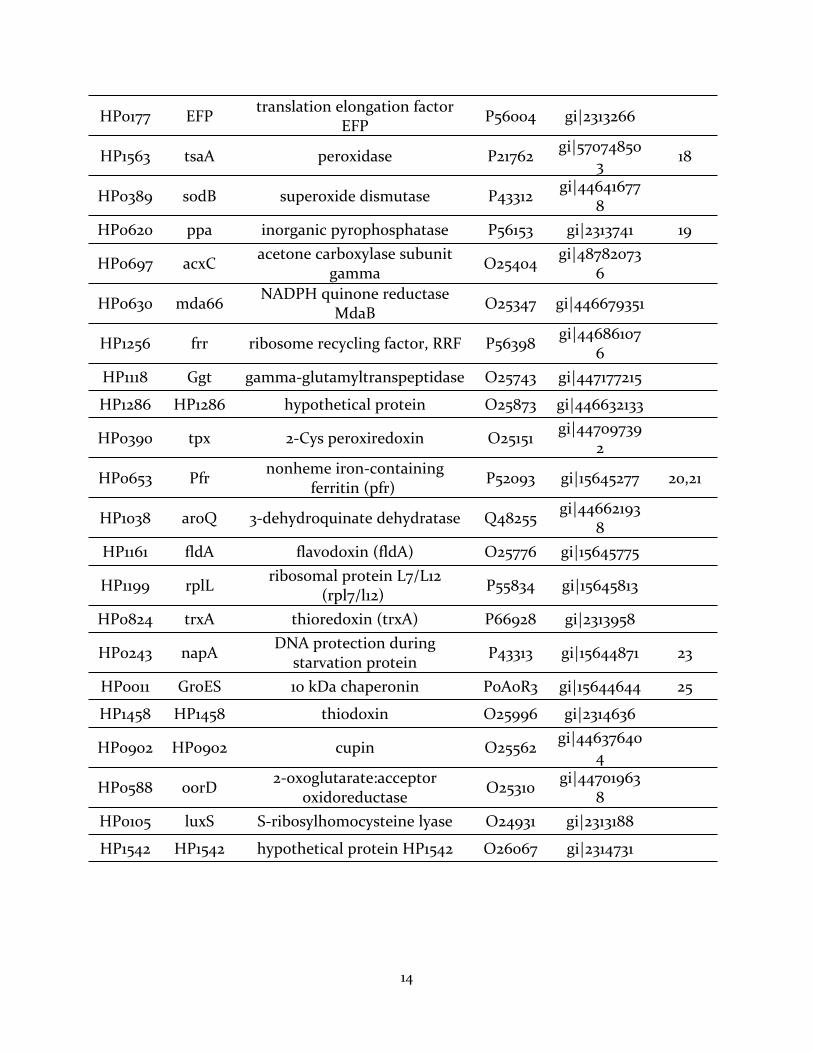
Table S1. Proteins identified by Ni2+-TRACER in H. pylori 26695.Locus
tagGene name Protein name Entry Accession
No.IMAC
No.
HP0779 acnB aconitate hydratase B P56418 gi|487803909 —
HP0192 frdA fumarate reductase flavoprotein subunit O06913 gi|44662867
5 —
HP0695 hyuA hydantoin utilization protein A O25402 gi|2313818 —
HP0072 UreB Urease subunit beta P69996 gi|15644702 1
HP0010 Hsp60 60 kDa chaperonin P42383 gi|2506272 2,3
HP0599 HylB methyl-accepting chemotaxis protein O25321 gi|44638994
7 —
HP1205 tufB translation elongation factor EF-Tu P56003 gi|2314366 —
HP0197 metK S-adenosylmethionine synthetase P56460 gi|570752617 —
HP1507 lys1 saccharopine dehydrogenase O26037 gi|740634762 —
HP0027 icd isocitrate dehydrogenase, IDH, IDP P56063 gi|44624608
6 —
HP0224 msrAB peptide methionine sulfoxide reductase MsrA/MsrB O25011 gi|44678936
8 5,6
HP1555 tsf Elongation factor Ts P55975 gi|15646162
HP0589 oorA 2-oxoglutarate ferredoxin oxidoreductase subunit alpha O25311 gi|44712960
0
HP0294 amiE aliphatic amidase O25067 gi|447138466
HP0825 trxB Thioredoxin reductase P56431 gi|2313959
HP0176 fba Fructose-bisphosphate aldolase P56109 gi|15644805
HP1111 porB pyruvate ferredoxin oxidoreductase subunit beta O25739 gi|44616030
4HP0073 UreA urease subunit alpha P14916 gi|446701877 16,17
HP 0175 HP0175 peptidylprolyl isomerase P56112 gi|446662124 10
HP0410 HpaA neuraminyllactose-binding hemagglutinin HpaA O25166 gi|44663836
5 15
HP0561 fabG 3-ketoacyl-ACP reductase O25286 gi|447083577
HP0068 UreG urease accessory protein Q09066 gi|15644698
14
HP0177 EFP translation elongation factor EFP P56004 gi|2313266
HP1563 tsaA peroxidase P21762 gi|570748503 18
HP0389 sodB superoxide dismutase P43312 gi|446416778
HP0620 ppa inorganic pyrophosphatase P56153 gi|2313741 19
HP0697 acxC acetone carboxylase subunit gamma O25404 gi|48782073
6
HP0630 mda66 NADPH quinone reductase MdaB O25347 gi|446679351
HP1256 frr ribosome recycling factor, RRF P56398 gi|446861076
HP1118 Ggt gamma-glutamyltranspeptidase O25743 gi|447177215
HP1286 HP1286 hypothetical protein O25873 gi|446632133
HP0390 tpx 2-Cys peroxiredoxin O25151 gi|447097392
HP0653 Pfr nonheme iron-containing ferritin (pfr) P52093 gi|15645277 20,21
HP1038 aroQ 3-dehydroquinate dehydratase Q48255 gi|446621938
HP1161 fldA flavodoxin (fldA) O25776 gi|15645775
HP1199 rplL ribosomal protein L7/L12 (rpl7/l12) P55834 gi|15645813
HP0824 trxA thioredoxin (trxA) P66928 gi|2313958
HP0243 napA DNA protection during starvation protein P43313 gi|15644871 23
HP0011 GroES 10 kDa chaperonin P0A0R3 gi|15644644 25
HP1458 HP1458 thiodoxin O25996 gi|2314636
HP0902 HP0902 cupin O25562 gi|446376404
HP0588 oorD 2-oxoglutarate:acceptor oxidoreductase O25310 gi|44701963
8HP0105 luxS S-ribosylhomocysteine lyase O24931 gi|2313188
HP1542 HP1542 hypothetical protein HP1542 O26067 gi|2314731
15
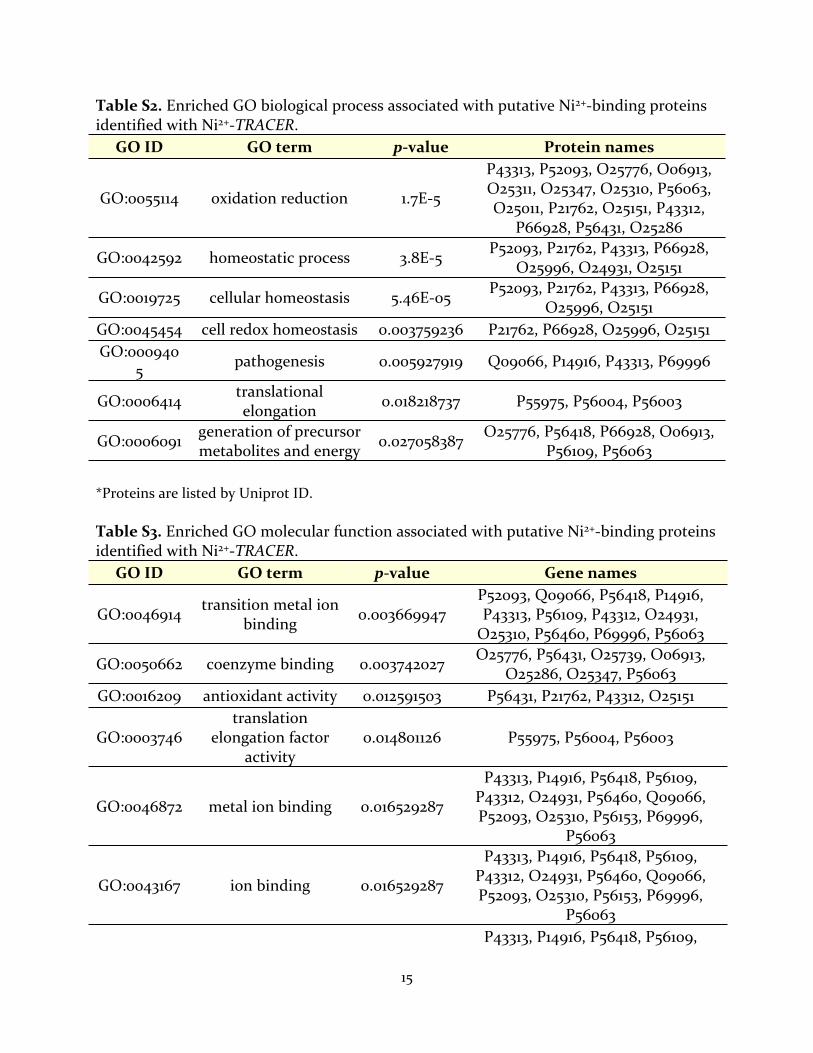
Table S2. Enriched GO biological process associated with putative Ni2+-binding proteins identified with Ni2+-TRACER.
*Proteins are listed by Uniprot ID.
Table S3. Enriched GO molecular function associated with putative Ni2+-binding proteins identified with Ni2+-TRACER.
GO ID GO term p-value Protein names
GO:0055114 oxidation reduction 1.7E-5
P43313, P52093, O25776, O06913, O25311, O25347, O25310, P56063, O25011, P21762, O25151, P43312,
P66928, P56431, O25286
GO:0042592 homeostatic process 3.8E-5 P52093, P21762, P43313, P66928, O25996, O24931, O25151
GO:0019725 cellular homeostasis 5.46E-05 P52093, P21762, P43313, P66928, O25996, O25151
GO:0045454 cell redox homeostasis 0.003759236 P21762, P66928, O25996, O25151GO:000940
5 pathogenesis 0.005927919 Q09066, P14916, P43313, P69996
GO:0006414 translational elongation 0.018218737 P55975, P56004, P56003
GO:0006091 generation of precursor metabolites and energy 0.027058387 O25776, P56418, P66928, O06913,
P56109, P56063
GO ID GO term p-value Gene names
GO:0046914 transition metal ion binding 0.003669947
P52093, Q09066, P56418, P14916, P43313, P56109, P43312, O24931,
O25310, P56460, P69996, P56063
GO:0050662 coenzyme binding 0.003742027 O25776, P56431, O25739, O06913, O25286, O25347, P56063
GO:0016209 antioxidant activity 0.012591503 P56431, P21762, P43312, O25151
GO:0003746translation
elongation factor activity
0.014801126 P55975, P56004, P56003
GO:0046872 metal ion binding 0.016529287
P43313, P14916, P56418, P56109, P43312, O24931, P56460, Q09066, P52093, O25310, P56153, P69996,
P56063
GO:0043167 ion binding 0.016529287
P43313, P14916, P56418, P56109, P43312, O24931, P56460, Q09066, P52093, O25310, P56153, P69996,
P56063
GO:0043169 cation binding 0.016529287
P43313, P14916, P56418, P56109,
16
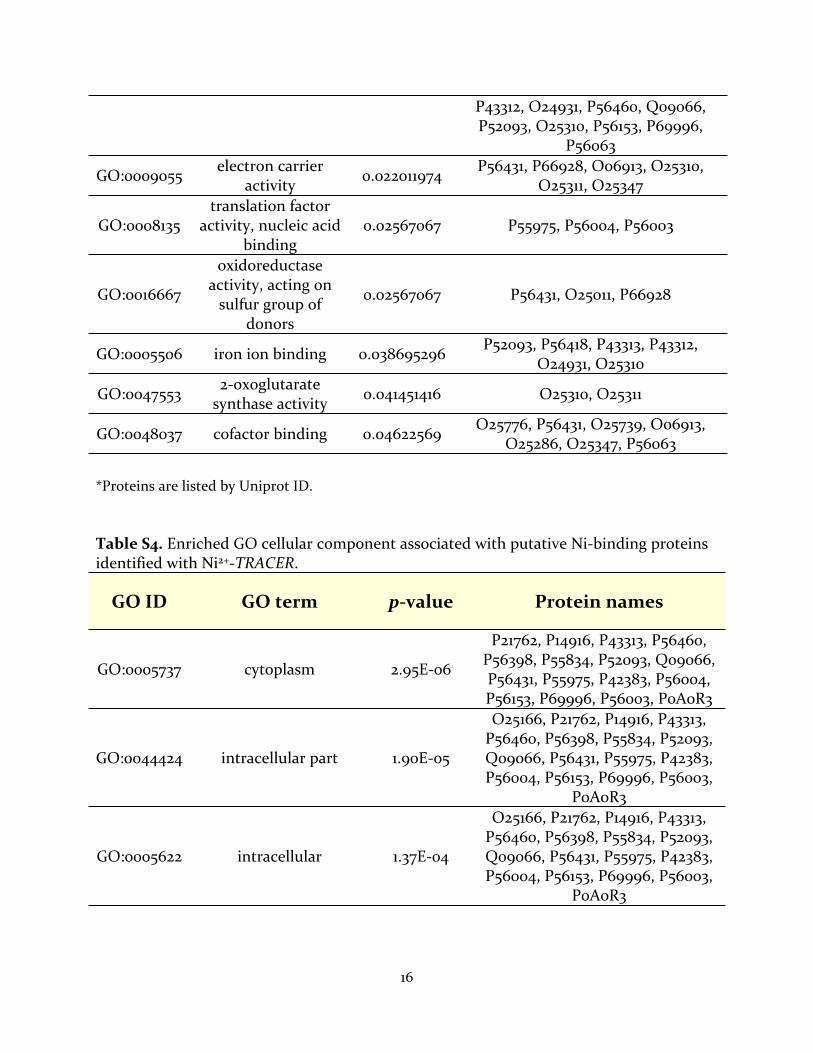
*Proteins are listed by Uniprot ID.
Table S4. Enriched GO cellular component associated with putative Ni-binding proteins identified with Ni2+-TRACER.
P43312, O24931, P56460, Q09066, P52093, O25310, P56153, P69996,
P56063
GO:0009055 electron carrier activity 0.022011974 P56431, P66928, O06913, O25310,
O25311, O25347
GO:0008135translation factor
activity, nucleic acid binding
0.02567067 P55975, P56004, P56003
GO:0016667
oxidoreductase activity, acting on
sulfur group of donors
0.02567067 P56431, O25011, P66928
GO:0005506 iron ion binding 0.038695296 P52093, P56418, P43313, P43312, O24931, O25310
GO:0047553 2-oxoglutarate synthase activity 0.041451416 O25310, O25311
GO:0048037 cofactor binding 0.04622569 O25776, P56431, O25739, O06913, O25286, O25347, P56063
GO ID GO term p-value Protein names
GO:0005737 cytoplasm 2.95E-06
P21762, P14916, P43313, P56460, P56398, P55834, P52093, Q09066, P56431, P55975, P42383, P56004, P56153, P69996, P56003, P0A0R3
GO:0044424 intracellular part 1.90E-05
O25166, P21762, P14916, P43313, P56460, P56398, P55834, P52093, Q09066, P56431, P55975, P42383, P56004, P56153, P69996, P56003,
P0A0R3
GO:0005622 intracellular 1.37E-04
O25166, P21762, P14916, P43313, P56460, P56398, P55834, P52093, Q09066, P56431, P55975, P42383, P56004, P56153, P69996, P56003,
P0A0R3

17
*Proteins are listed by Uniprot ID.
18
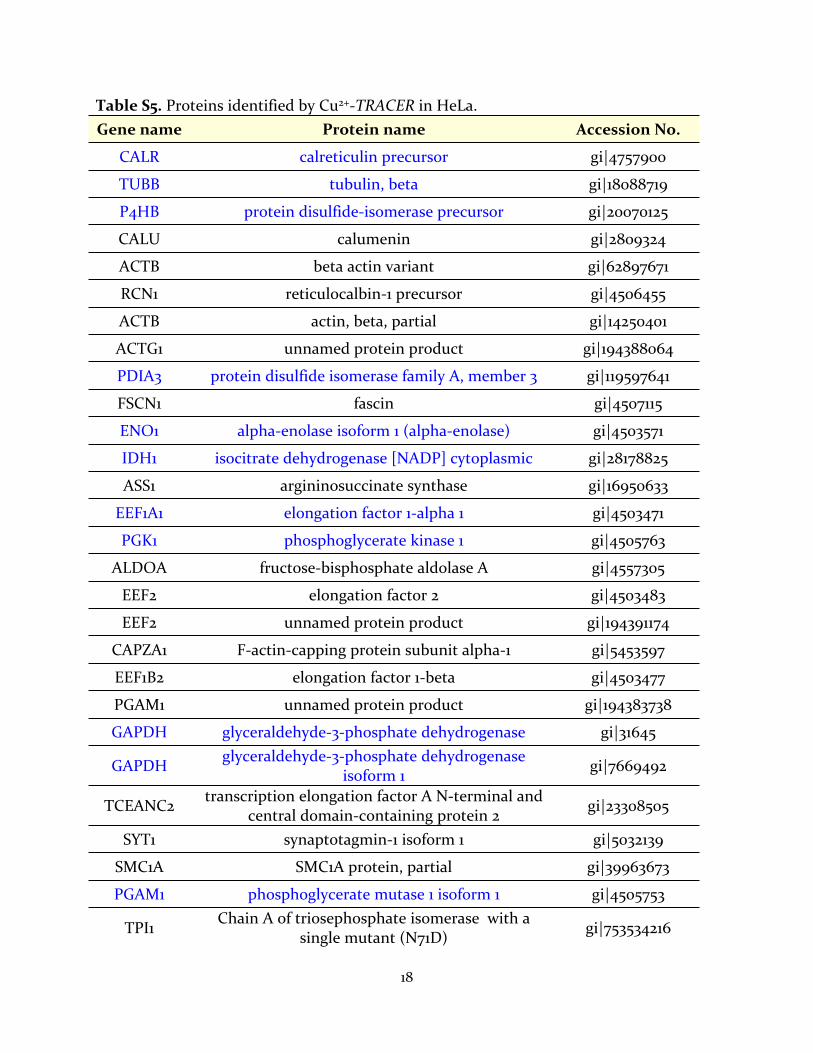
Table S5. Proteins identified by Cu2+-TRACER in HeLa.Gene name Protein name Accession No.
CALR calreticulin precursor gi|4757900
TUBB tubulin, beta gi|18088719
P4HB protein disulfide-isomerase precursor gi|20070125
CALU calumenin gi|2809324
ACTB beta actin variant gi|62897671
RCN1 reticulocalbin-1 precursor gi|4506455
ACTB actin, beta, partial gi|14250401
ACTG1 unnamed protein product gi|194388064
PDIA3 protein disulfide isomerase family A, member 3 gi|119597641
FSCN1 fascin gi|4507115
ENO1 alpha-enolase isoform 1 (alpha-enolase) gi|4503571
IDH1 isocitrate dehydrogenase [NADP] cytoplasmic gi|28178825
ASS1 argininosuccinate synthase gi|16950633
EEF1A1 elongation factor 1-alpha 1 gi|4503471
PGK1 phosphoglycerate kinase 1 gi|4505763
ALDOA fructose-bisphosphate aldolase A gi|4557305
EEF2 elongation factor 2 gi|4503483
EEF2 unnamed protein product gi|194391174
CAPZA1 F-actin-capping protein subunit alpha-1 gi|5453597
EEF1B2 elongation factor 1-beta gi|4503477
PGAM1 unnamed protein product gi|194383738
GAPDH glyceraldehyde-3-phosphate dehydrogenase gi|31645
GAPDH glyceraldehyde-3-phosphate dehydrogenase isoform 1 gi|7669492
TCEANC2 transcription elongation factor A N-terminal and central domain-containing protein 2 gi|23308505
SYT1 synaptotagmin-1 isoform 1 gi|5032139
SMC1A SMC1A protein, partial gi|39963673
PGAM1 phosphoglycerate mutase 1 isoform 1 gi|4505753
TPI1 Chain A of triosephosphate isomerase with a single mutant (N71D) gi|753534216
19
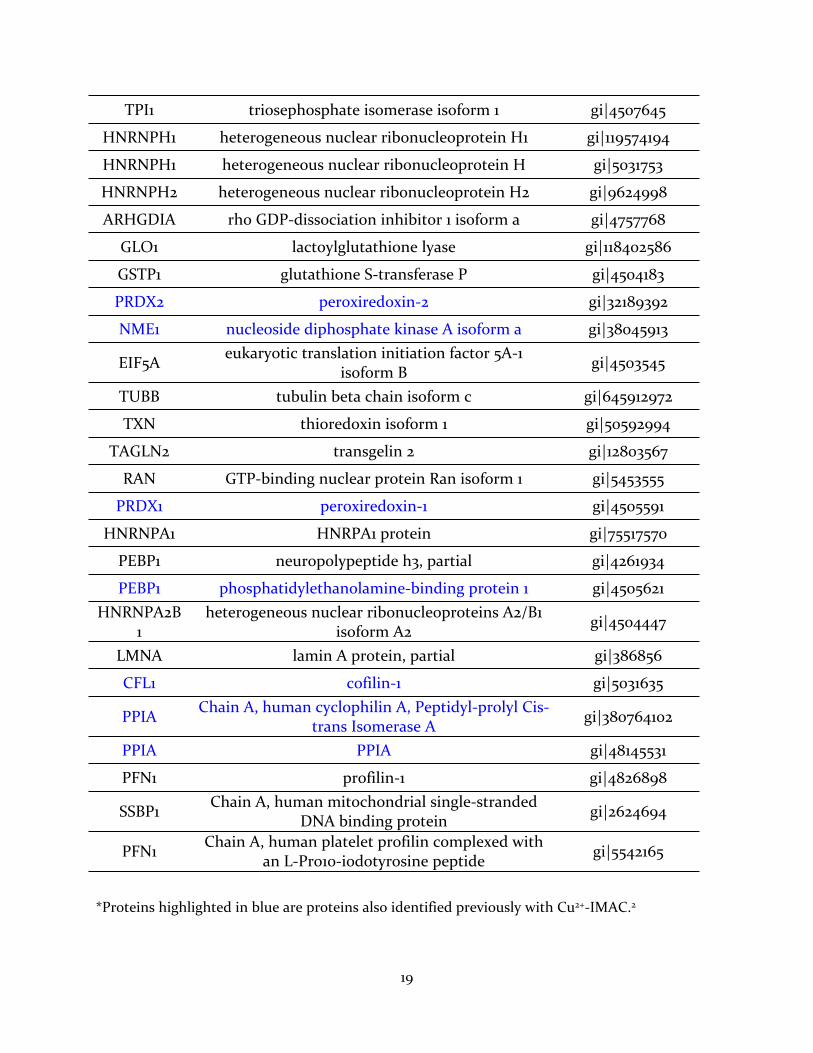
*Proteins highlighted in blue are proteins also identified previously with Cu2+-IMAC.2
TPI1 triosephosphate isomerase isoform 1 gi|4507645
HNRNPH1 heterogeneous nuclear ribonucleoprotein H1 gi|119574194
HNRNPH1 heterogeneous nuclear ribonucleoprotein H gi|5031753
HNRNPH2 heterogeneous nuclear ribonucleoprotein H2 gi|9624998
ARHGDIA rho GDP-dissociation inhibitor 1 isoform a gi|4757768
GLO1 lactoylglutathione lyase gi|118402586
GSTP1 glutathione S-transferase P gi|4504183
PRDX2 peroxiredoxin-2 gi|32189392
NME1 nucleoside diphosphate kinase A isoform a gi|38045913
EIF5A eukaryotic translation initiation factor 5A-1 isoform B gi|4503545
TUBB tubulin beta chain isoform c gi|645912972
TXN thioredoxin isoform 1 gi|50592994
TAGLN2 transgelin 2 gi|12803567
RAN GTP-binding nuclear protein Ran isoform 1 gi|5453555
PRDX1 peroxiredoxin-1 gi|4505591
HNRNPA1 HNRPA1 protein gi|75517570
PEBP1 neuropolypeptide h3, partial gi|4261934
PEBP1 phosphatidylethanolamine-binding protein 1 gi|4505621HNRNPA2B
1heterogeneous nuclear ribonucleoproteins A2/B1
isoform A2 gi|4504447
LMNA lamin A protein, partial gi|386856
CFL1 cofilin-1 gi|5031635
PPIA Chain A, human cyclophilin A, Peptidyl-prolyl Cis-trans Isomerase A gi|380764102
PPIA PPIA gi|48145531
PFN1 profilin-1 gi|4826898
SSBP1 Chain A, human mitochondrial single-stranded DNA binding protein gi|2624694
PFN1 Chain A, human platelet profilin complexed with an L-Pro10-iodotyrosine peptide gi|5542165
20
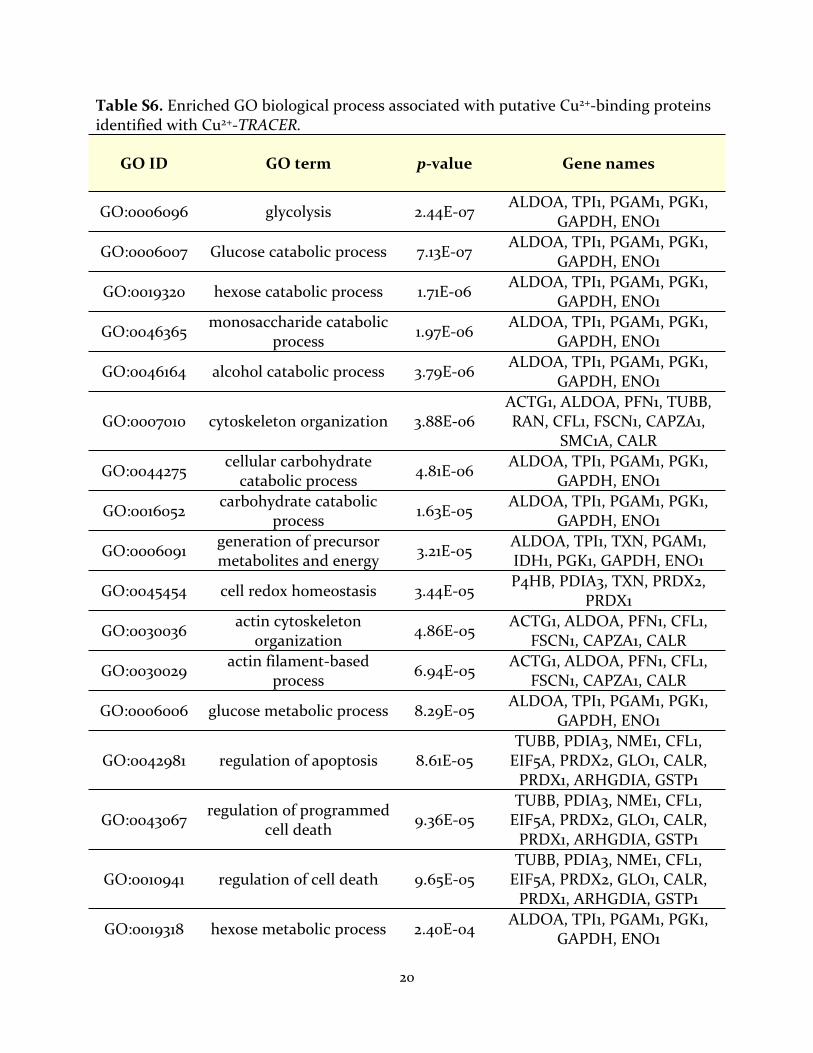
Table S6. Enriched GO biological process associated with putative Cu2+-binding proteins identified with Cu2+-TRACER.
GO ID GO term p-value Gene names
GO:0006096 glycolysis 2.44E-07 ALDOA, TPI1, PGAM1, PGK1, GAPDH, ENO1
GO:0006007 Glucose catabolic process 7.13E-07 ALDOA, TPI1, PGAM1, PGK1, GAPDH, ENO1
GO:0019320 hexose catabolic process 1.71E-06 ALDOA, TPI1, PGAM1, PGK1, GAPDH, ENO1
GO:0046365 monosaccharide catabolic process 1.97E-06 ALDOA, TPI1, PGAM1, PGK1,
GAPDH, ENO1
GO:0046164 alcohol catabolic process 3.79E-06 ALDOA, TPI1, PGAM1, PGK1, GAPDH, ENO1
GO:0007010 cytoskeleton organization 3.88E-06ACTG1, ALDOA, PFN1, TUBB, RAN, CFL1, FSCN1, CAPZA1,
SMC1A, CALR
GO:0044275 cellular carbohydrate catabolic process 4.81E-06 ALDOA, TPI1, PGAM1, PGK1,
GAPDH, ENO1
GO:0016052 carbohydrate catabolic process 1.63E-05 ALDOA, TPI1, PGAM1, PGK1,
GAPDH, ENO1
GO:0006091 generation of precursor metabolites and energy 3.21E-05 ALDOA, TPI1, TXN, PGAM1,
IDH1, PGK1, GAPDH, ENO1
GO:0045454 cell redox homeostasis 3.44E-05 P4HB, PDIA3, TXN, PRDX2, PRDX1
GO:0030036 actin cytoskeleton organization 4.86E-05 ACTG1, ALDOA, PFN1, CFL1,
FSCN1, CAPZA1, CALR
GO:0030029 actin filament-based process 6.94E-05 ACTG1, ALDOA, PFN1, CFL1,
FSCN1, CAPZA1, CALR
GO:0006006 glucose metabolic process 8.29E-05 ALDOA, TPI1, PGAM1, PGK1, GAPDH, ENO1
GO:0042981 regulation of apoptosis 8.61E-05TUBB, PDIA3, NME1, CFL1,
EIF5A, PRDX2, GLO1, CALR, PRDX1, ARHGDIA, GSTP1
GO:0043067 regulation of programmed cell death 9.36E-05
TUBB, PDIA3, NME1, CFL1, EIF5A, PRDX2, GLO1, CALR,
PRDX1, ARHGDIA, GSTP1
GO:0010941 regulation of cell death 9.65E-05TUBB, PDIA3, NME1, CFL1,
EIF5A, PRDX2, GLO1, CALR, PRDX1, ARHGDIA, GSTP1
GO:0019318 hexose metabolic process 2.40E-04 ALDOA, TPI1, PGAM1, PGK1, GAPDH, ENO1
21
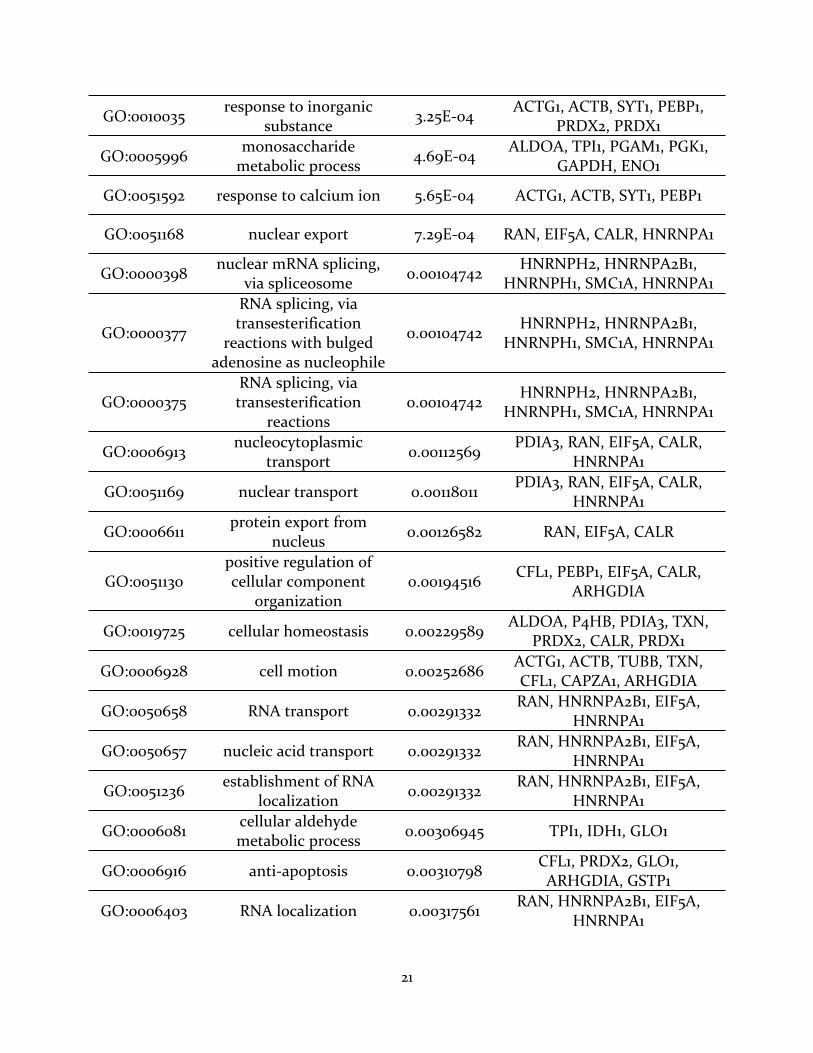
GO:0010035 response to inorganic substance 3.25E-04 ACTG1, ACTB, SYT1, PEBP1,
PRDX2, PRDX1
GO:0005996 monosaccharide metabolic process 4.69E-04 ALDOA, TPI1, PGAM1, PGK1,
GAPDH, ENO1
GO:0051592 response to calcium ion 5.65E-04 ACTG1, ACTB, SYT1, PEBP1
GO:0051168 nuclear export 7.29E-04 RAN, EIF5A, CALR, HNRNPA1
GO:0000398 nuclear mRNA splicing, via spliceosome 0.00104742 HNRNPH2, HNRNPA2B1,
HNRNPH1, SMC1A, HNRNPA1
GO:0000377
RNA splicing, via transesterification
reactions with bulged adenosine as nucleophile
0.00104742 HNRNPH2, HNRNPA2B1, HNRNPH1, SMC1A, HNRNPA1
GO:0000375RNA splicing, via transesterification
reactions0.00104742 HNRNPH2, HNRNPA2B1,
HNRNPH1, SMC1A, HNRNPA1
GO:0006913 nucleocytoplasmic transport 0.00112569 PDIA3, RAN, EIF5A, CALR,
HNRNPA1
GO:0051169 nuclear transport 0.00118011 PDIA3, RAN, EIF5A, CALR, HNRNPA1
GO:0006611 protein export from nucleus 0.00126582 RAN, EIF5A, CALR
GO:0051130positive regulation of cellular component
organization0.00194516 CFL1, PEBP1, EIF5A, CALR,
ARHGDIA
GO:0019725 cellular homeostasis 0.00229589 ALDOA, P4HB, PDIA3, TXN, PRDX2, CALR, PRDX1
GO:0006928 cell motion 0.00252686 ACTG1, ACTB, TUBB, TXN, CFL1, CAPZA1, ARHGDIA
GO:0050658 RNA transport 0.00291332 RAN, HNRNPA2B1, EIF5A, HNRNPA1
GO:0050657 nucleic acid transport 0.00291332 RAN, HNRNPA2B1, EIF5A, HNRNPA1
GO:0051236 establishment of RNA localization 0.00291332 RAN, HNRNPA2B1, EIF5A,
HNRNPA1
GO:0006081 cellular aldehyde metabolic process 0.00306945 TPI1, IDH1, GLO1
GO:0006916 anti-apoptosis 0.00310798 CFL1, PRDX2, GLO1, ARHGDIA, GSTP1
GO:0006403 RNA localization 0.00317561 RAN, HNRNPA2B1, EIF5A, HNRNPA1
22
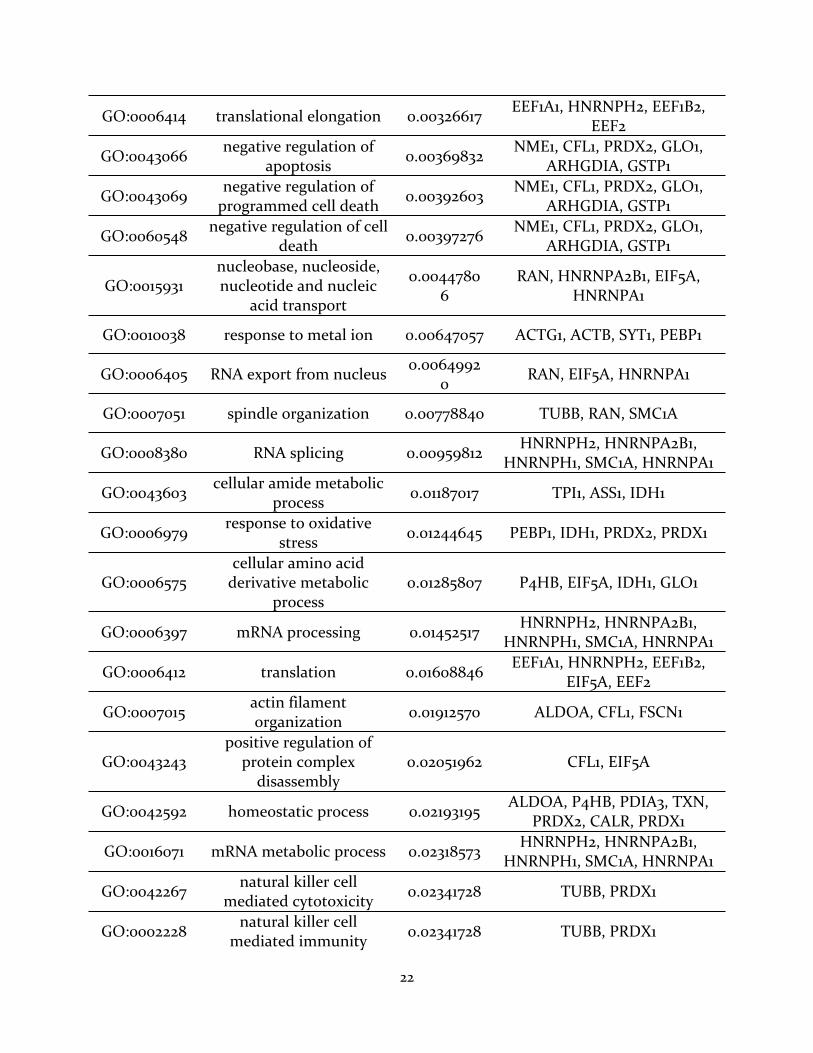
GO:0006414 translational elongation 0.00326617 EEF1A1, HNRNPH2, EEF1B2, EEF2
GO:0043066 negative regulation of apoptosis 0.00369832 NME1, CFL1, PRDX2, GLO1,
ARHGDIA, GSTP1
GO:0043069 negative regulation of programmed cell death 0.00392603 NME1, CFL1, PRDX2, GLO1,
ARHGDIA, GSTP1
GO:0060548 negative regulation of cell death 0.00397276 NME1, CFL1, PRDX2, GLO1,
ARHGDIA, GSTP1
GO:0015931nucleobase, nucleoside, nucleotide and nucleic
acid transport
0.00447806
RAN, HNRNPA2B1, EIF5A, HNRNPA1
GO:0010038 response to metal ion 0.00647057 ACTG1, ACTB, SYT1, PEBP1
GO:0006405 RNA export from nucleus 0.00649920 RAN, EIF5A, HNRNPA1
GO:0007051 spindle organization 0.00778840 TUBB, RAN, SMC1A
GO:0008380 RNA splicing 0.00959812 HNRNPH2, HNRNPA2B1, HNRNPH1, SMC1A, HNRNPA1
GO:0043603 cellular amide metabolic process 0.01187017 TPI1, ASS1, IDH1
GO:0006979 response to oxidative stress 0.01244645 PEBP1, IDH1, PRDX2, PRDX1
GO:0006575cellular amino acid
derivative metabolic process
0.01285807 P4HB, EIF5A, IDH1, GLO1
GO:0006397 mRNA processing 0.01452517 HNRNPH2, HNRNPA2B1, HNRNPH1, SMC1A, HNRNPA1
GO:0006412 translation 0.01608846 EEF1A1, HNRNPH2, EEF1B2, EIF5A, EEF2
GO:0007015 actin filament organization 0.01912570 ALDOA, CFL1, FSCN1
GO:0043243positive regulation of
protein complex disassembly
0.02051962 CFL1, EIF5A
GO:0042592 homeostatic process 0.02193195 ALDOA, P4HB, PDIA3, TXN, PRDX2, CALR, PRDX1
GO:0016071 mRNA metabolic process 0.02318573 HNRNPH2, HNRNPA2B1, HNRNPH1, SMC1A, HNRNPA1
GO:0042267 natural killer cell mediated cytotoxicity 0.02341728 TUBB, PRDX1
GO:0002228 natural killer cell mediated immunity 0.02341728 TUBB, PRDX1
23
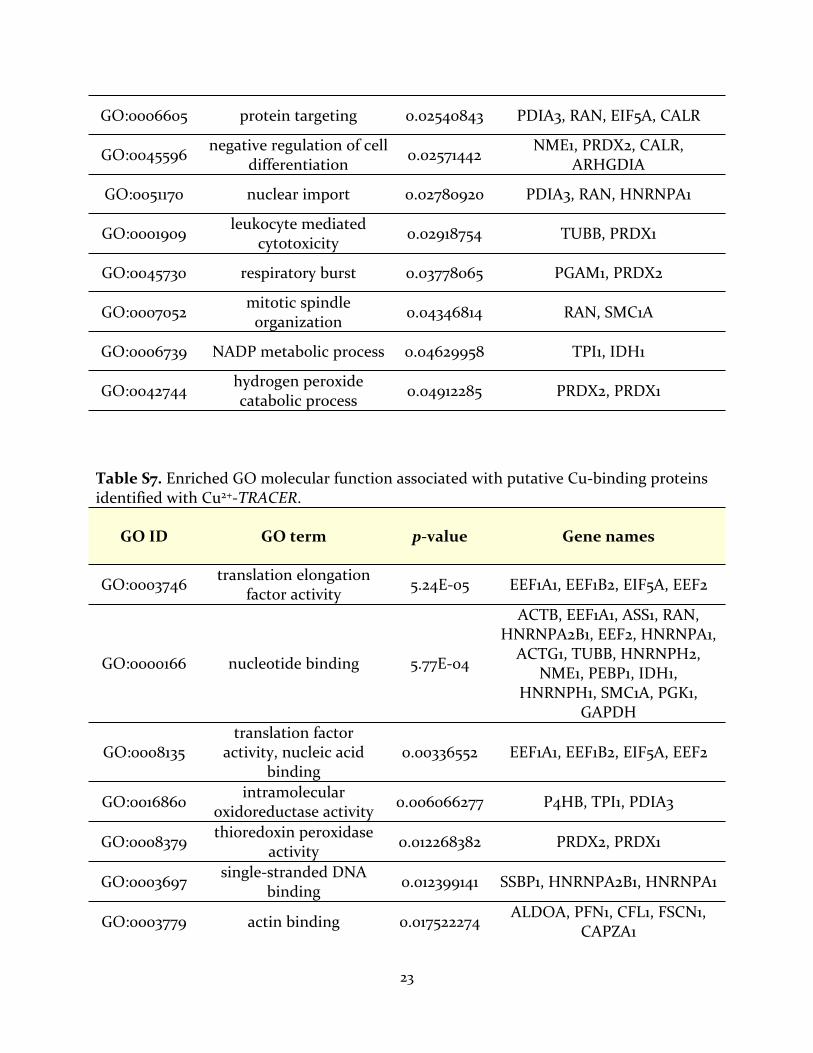
Table S7. Enriched GO molecular function associated with putative Cu-binding proteins identified with Cu2+-TRACER.
GO:0006605 protein targeting 0.02540843 PDIA3, RAN, EIF5A, CALR
GO:0045596 negative regulation of cell differentiation 0.02571442 NME1, PRDX2, CALR,
ARHGDIA
GO:0051170 nuclear import 0.02780920 PDIA3, RAN, HNRNPA1
GO:0001909 leukocyte mediated cytotoxicity 0.02918754 TUBB, PRDX1
GO:0045730 respiratory burst 0.03778065 PGAM1, PRDX2
GO:0007052 mitotic spindle organization 0.04346814 RAN, SMC1A
GO:0006739 NADP metabolic process 0.04629958 TPI1, IDH1
GO:0042744 hydrogen peroxide catabolic process 0.04912285 PRDX2, PRDX1
GO ID GO term p-value Gene names
GO:0003746 translation elongation factor activity 5.24E-05 EEF1A1, EEF1B2, EIF5A, EEF2
GO:0000166 nucleotide binding 5.77E-04
ACTB, EEF1A1, ASS1, RAN, HNRNPA2B1, EEF2, HNRNPA1,
ACTG1, TUBB, HNRNPH2, NME1, PEBP1, IDH1,
HNRNPH1, SMC1A, PGK1, GAPDH
GO:0008135translation factor
activity, nucleic acid binding
0.00336552 EEF1A1, EEF1B2, EIF5A, EEF2
GO:0016860 intramolecular oxidoreductase activity 0.006066277 P4HB, TPI1, PDIA3
GO:0008379 thioredoxin peroxidase activity 0.012268382 PRDX2, PRDX1
GO:0003697 single-stranded DNA binding 0.012399141 SSBP1, HNRNPA2B1, HNRNPA1
GO:0003779 actin binding 0.017522274 ALDOA, PFN1, CFL1, FSCN1, CAPZA1
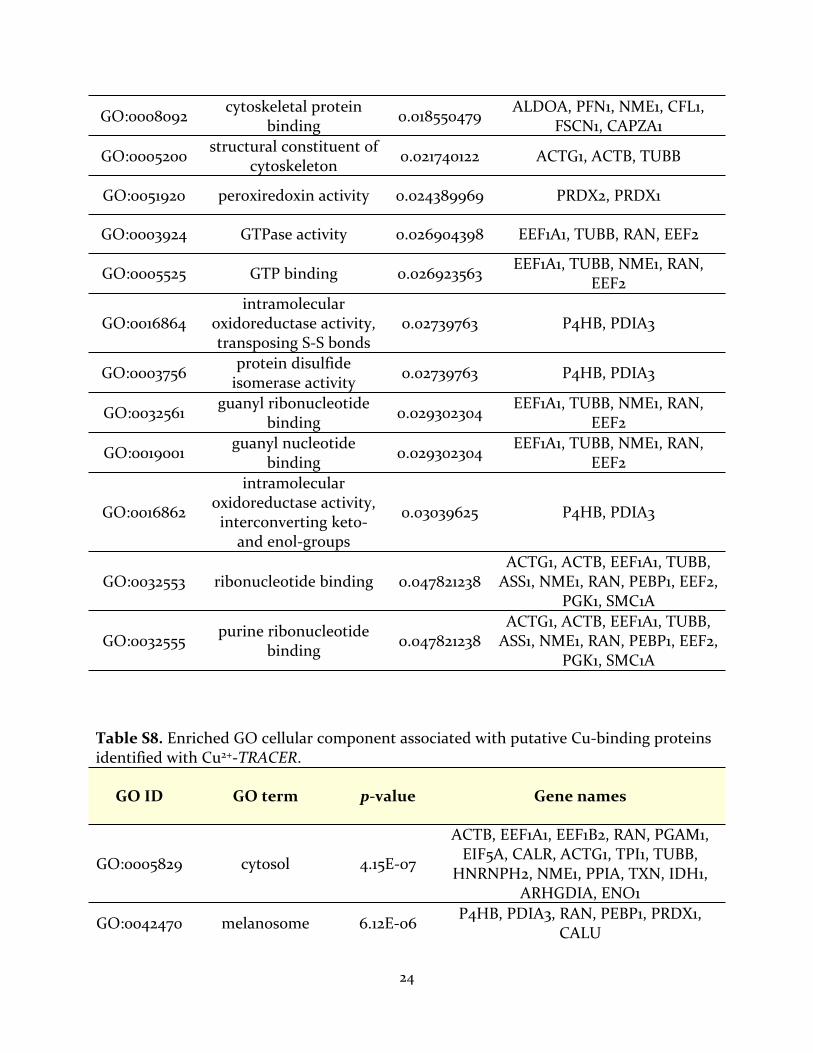
24
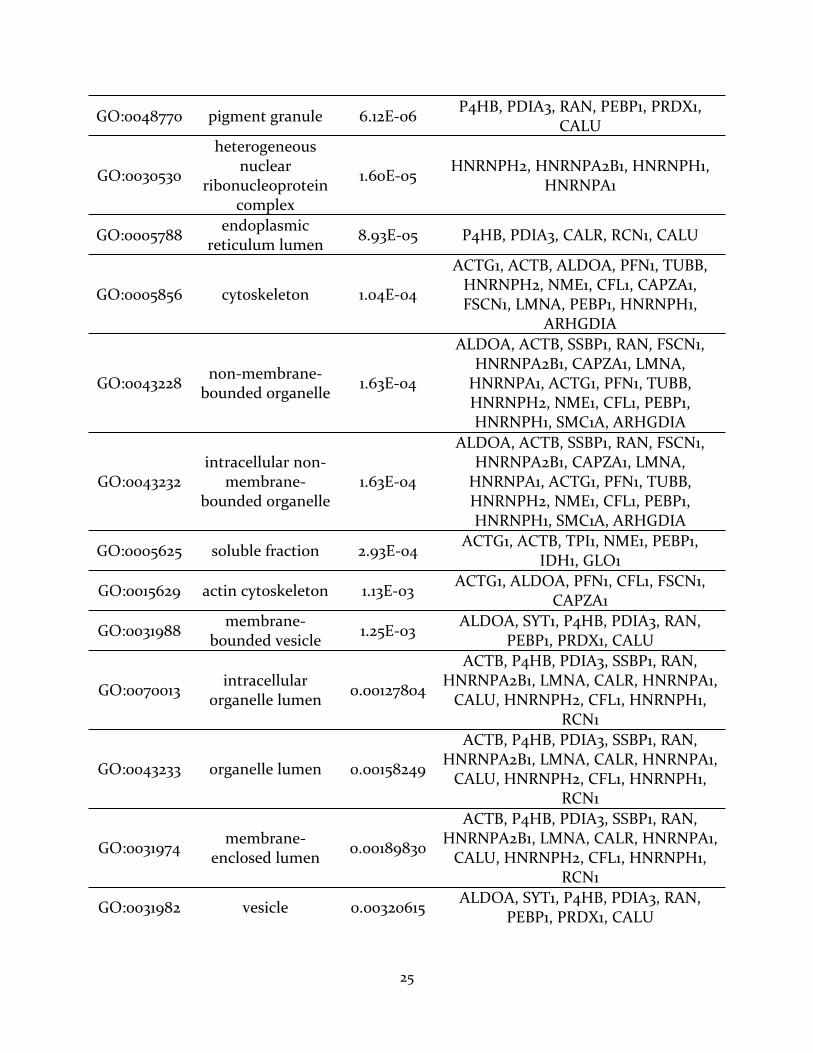
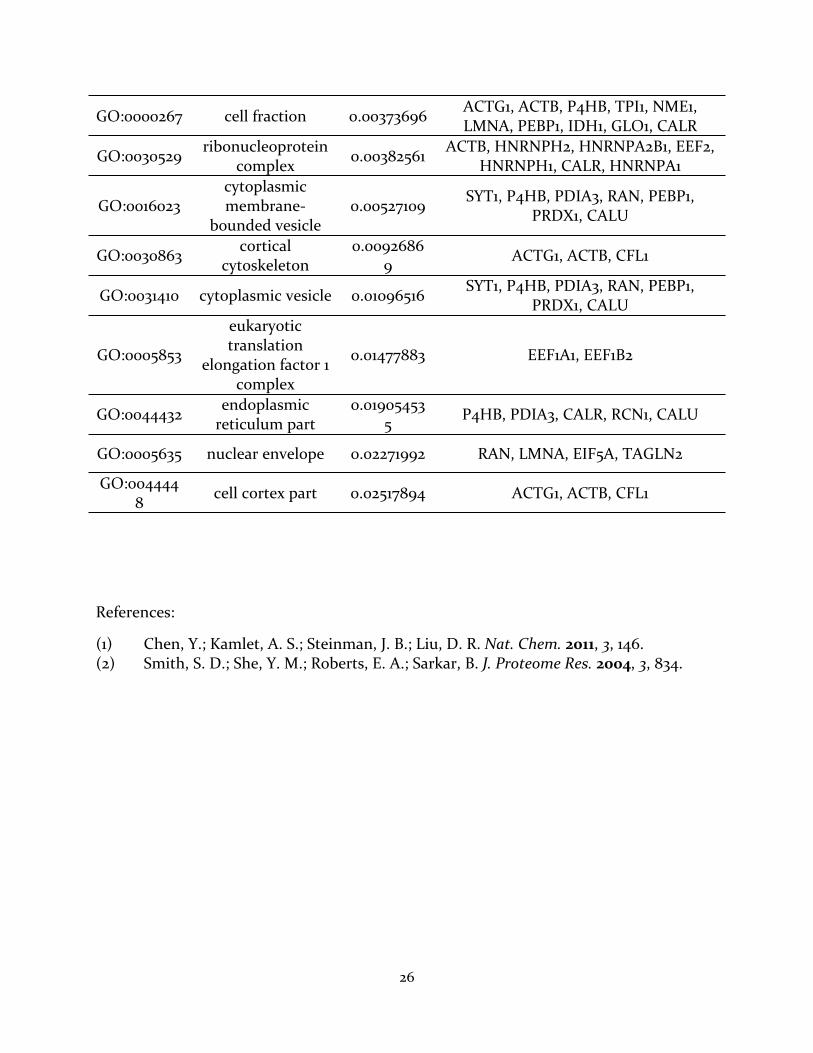
Table S8. Enriched GO cellular component associated with putative Cu-binding proteins identified with Cu2+-TRACER.
GO:0008092 cytoskeletal protein binding 0.018550479 ALDOA, PFN1, NME1, CFL1,
FSCN1, CAPZA1
GO:0005200 structural constituent of cytoskeleton 0.021740122 ACTG1, ACTB, TUBB
GO:0051920 peroxiredoxin activity 0.024389969 PRDX2, PRDX1
GO:0003924 GTPase activity 0.026904398 EEF1A1, TUBB, RAN, EEF2
GO:0005525 GTP binding 0.026923563 EEF1A1, TUBB, NME1, RAN, EEF2
GO:0016864intramolecular
oxidoreductase activity, transposing S-S bonds
0.02739763 P4HB, PDIA3
GO:0003756 protein disulfide isomerase activity 0.02739763 P4HB, PDIA3
GO:0032561 guanyl ribonucleotide binding 0.029302304 EEF1A1, TUBB, NME1, RAN,
EEF2
GO:0019001 guanyl nucleotide binding 0.029302304 EEF1A1, TUBB, NME1, RAN,
EEF2
GO:0016862
intramolecular oxidoreductase activity,
interconverting keto- and enol-groups
0.03039625 P4HB, PDIA3
GO:0032553 ribonucleotide binding 0.047821238ACTG1, ACTB, EEF1A1, TUBB,
ASS1, NME1, RAN, PEBP1, EEF2, PGK1, SMC1A
GO:0032555 purine ribonucleotide binding 0.047821238
ACTG1, ACTB, EEF1A1, TUBB, ASS1, NME1, RAN, PEBP1, EEF2,
PGK1, SMC1A
GO ID GO term p-value Gene names
GO:0005829 cytosol 4.15E-07
ACTB, EEF1A1, EEF1B2, RAN, PGAM1, EIF5A, CALR, ACTG1, TPI1, TUBB,
HNRNPH2, NME1, PPIA, TXN, IDH1, ARHGDIA, ENO1
GO:0042470 melanosome 6.12E-06 P4HB, PDIA3, RAN, PEBP1, PRDX1, CALU
25
GO:0048770 pigment granule 6.12E-06 P4HB, PDIA3, RAN, PEBP1, PRDX1, CALU
GO:0030530
heterogeneous nuclear
ribonucleoprotein complex
1.60E-05 HNRNPH2, HNRNPA2B1, HNRNPH1, HNRNPA1
GO:0005788 endoplasmic reticulum lumen 8.93E-05 P4HB, PDIA3, CALR, RCN1, CALU
GO:0005856 cytoskeleton 1.04E-04
ACTG1, ACTB, ALDOA, PFN1, TUBB, HNRNPH2, NME1, CFL1, CAPZA1, FSCN1, LMNA, PEBP1, HNRNPH1,
ARHGDIA
GO:0043228 non-membrane-bounded organelle 1.63E-04
ALDOA, ACTB, SSBP1, RAN, FSCN1, HNRNPA2B1, CAPZA1, LMNA,
HNRNPA1, ACTG1, PFN1, TUBB, HNRNPH2, NME1, CFL1, PEBP1, HNRNPH1, SMC1A, ARHGDIA
GO:0043232intracellular non-
membrane-bounded organelle
1.63E-04
ALDOA, ACTB, SSBP1, RAN, FSCN1, HNRNPA2B1, CAPZA1, LMNA,
HNRNPA1, ACTG1, PFN1, TUBB, HNRNPH2, NME1, CFL1, PEBP1, HNRNPH1, SMC1A, ARHGDIA
GO:0005625 soluble fraction 2.93E-04 ACTG1, ACTB, TPI1, NME1, PEBP1, IDH1, GLO1
GO:0015629 actin cytoskeleton 1.13E-03 ACTG1, ALDOA, PFN1, CFL1, FSCN1, CAPZA1
GO:0031988 membrane-bounded vesicle 1.25E-03 ALDOA, SYT1, P4HB, PDIA3, RAN,
PEBP1, PRDX1, CALU
GO:0070013 intracellular organelle lumen 0.00127804
ACTB, P4HB, PDIA3, SSBP1, RAN, HNRNPA2B1, LMNA, CALR, HNRNPA1,
CALU, HNRNPH2, CFL1, HNRNPH1, RCN1
GO:0043233 organelle lumen 0.00158249
ACTB, P4HB, PDIA3, SSBP1, RAN, HNRNPA2B1, LMNA, CALR, HNRNPA1,
CALU, HNRNPH2, CFL1, HNRNPH1, RCN1
GO:0031974 membrane-enclosed lumen 0.00189830
ACTB, P4HB, PDIA3, SSBP1, RAN, HNRNPA2B1, LMNA, CALR, HNRNPA1,
CALU, HNRNPH2, CFL1, HNRNPH1, RCN1
GO:0031982 vesicle 0.00320615 ALDOA, SYT1, P4HB, PDIA3, RAN, PEBP1, PRDX1, CALU
26
References:
(1) Chen, Y.; Kamlet, A. S.; Steinman, J. B.; Liu, D. R. Nat. Chem. 2011, 3, 146.(2) Smith, S. D.; She, Y. M.; Roberts, E. A.; Sarkar, B. J. Proteome Res. 2004, 3, 834.
GO:0000267 cell fraction 0.00373696 ACTG1, ACTB, P4HB, TPI1, NME1, LMNA, PEBP1, IDH1, GLO1, CALR
GO:0030529 ribonucleoprotein complex 0.00382561 ACTB, HNRNPH2, HNRNPA2B1, EEF2,
HNRNPH1, CALR, HNRNPA1
GO:0016023cytoplasmic membrane-
bounded vesicle0.00527109 SYT1, P4HB, PDIA3, RAN, PEBP1,
PRDX1, CALU
GO:0030863 cortical cytoskeleton
0.00926869 ACTG1, ACTB, CFL1
GO:0031410 cytoplasmic vesicle 0.01096516 SYT1, P4HB, PDIA3, RAN, PEBP1, PRDX1, CALU
GO:0005853
eukaryotic translation
elongation factor 1 complex
0.01477883 EEF1A1, EEF1B2
GO:0044432 endoplasmic reticulum part
0.019054535 P4HB, PDIA3, CALR, RCN1, CALU
GO:0005635 nuclear envelope 0.02271992 RAN, LMNA, EIF5A, TAGLN2
GO:0044448 cell cortex part 0.02517894 ACTG1, ACTB, CFL1


![[XLS]images.nature.com · Web viewLsat_1_v5_gn_1_50300.1 GO:0000015 phosphopyruvate hydratase complex GO:0004634 2-Phospho-D-glycerate Phosphoenolpyruvate + H2O, Gallus](https://img.pdfslide.net/doc/110x75/5ae6276c7f8b9a29048d2aba/xls-viewlsat1v5gn1503001-go0000015-phosphopyruvate-hydratase-complex-go0004634.jpg)