Embed Size (px)
Citation preview

U.S. Census Bureau Briefing | September 2019 | 1
U.S. Census BureauPartner Briefing
BostonSeptember 2019
U.S. Census Bureau Briefing | September 2019 | 2
Chuck BradyU.S. Census BureauChief, Respondent Outreach and Promotion Branch
Angelo BonaccorsyU.S. Census BureauProgram Analyst, Respondent Outreach and Promotion Branch
Agenda
• Welcome & Introductions
• Census Bureau EconomicSurveys – Overview
• Census Bureau EconomicData – Boston
• Reasons to Respond
• Next Steps
• Q&A

U.S. Census Bureau Briefing | July 2019 | 3
It’s time to expand… where should we open our next location?
Click here to play video: www.census.gov/econ
Using Census Bureau Statistics
U.S. Census Bureau Briefing | September 2019 | 4
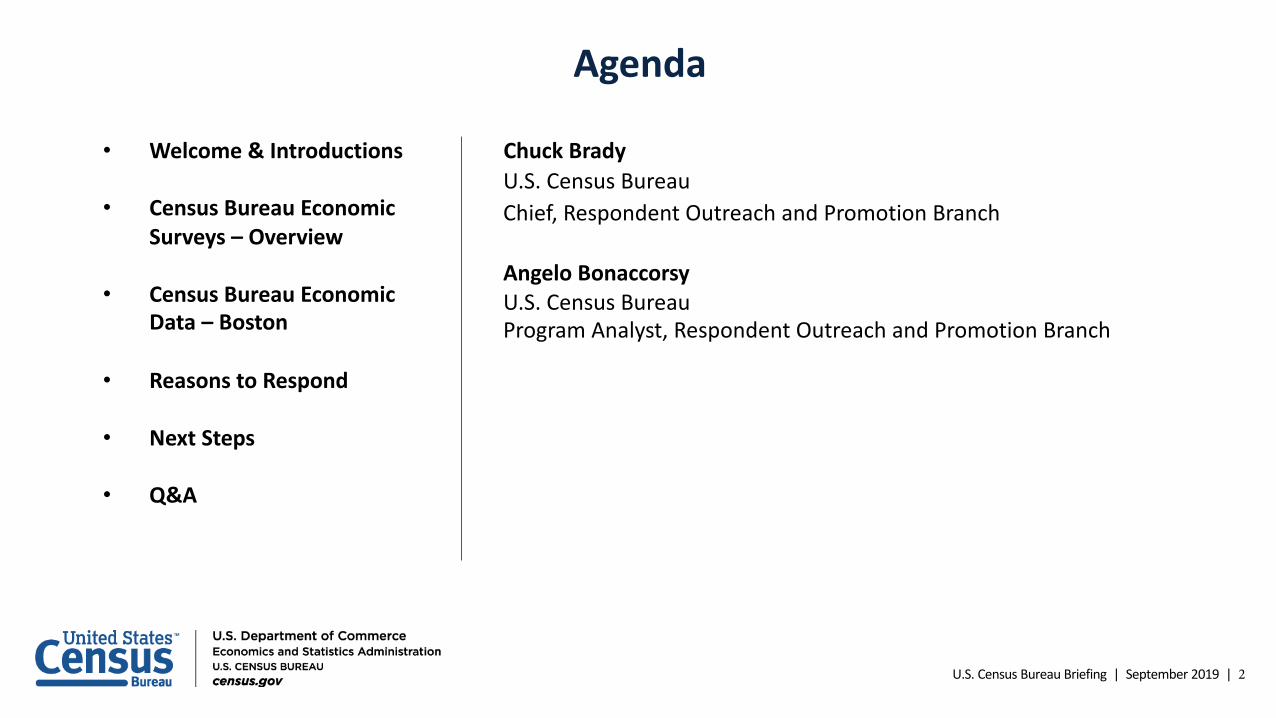
• The federal government’s largest statistical agency –part of the U.S. Department of Commerce.
• Conducts more than 130 censuses and surveys eachyear, including:
- The Decennial Census – the once-a-decadepopulation and housing count of all 50 states.
- The Census of Governments – measurement ofthe nation's state and local government sector.
- The Economic Census – the official five-yearmeasure of American business.
• Statistics from all surveys are free and availableonline to use for planning and decision making.
The U.S. Census Bureau
U.S. Census Bureau Briefing | September 2019 | 5
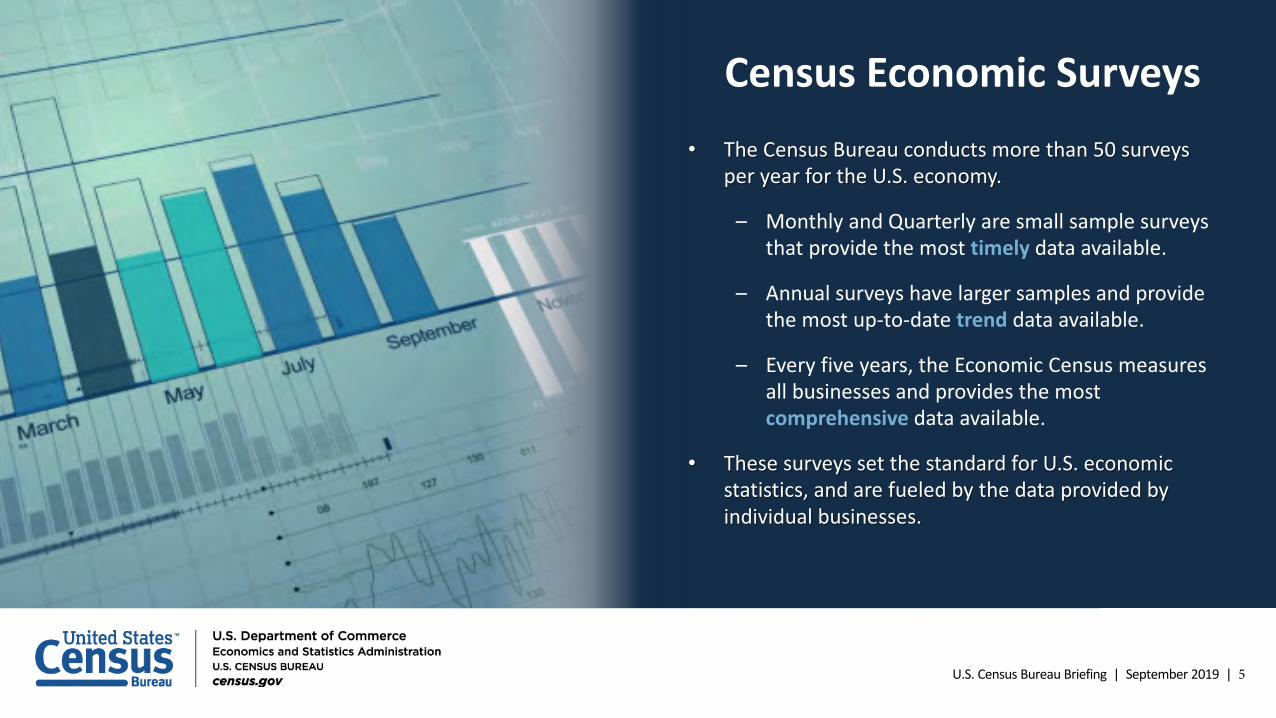
Census Economic Surveys• The Census Bureau conducts more than 50 surveys
per year for the U.S. economy.
– Monthly and Quarterly are small sample surveysthat provide the most timely data available.
– Annual surveys have larger samples and providethe most up-to-date trend data available.
– Every five years, the Economic Census measuresall businesses and provides the mostcomprehensive data available.
• These surveys set the standard for U.S. economicstatistics, and are fueled by the data provided byindividual businesses.
U.S. Census Bureau Briefing | September 2019 | 6
Monthly & Quarterly17 surveys including the nation’s key Economic Indicators, essential for tracking and reporting the GDP.
• National sample surveys – including Retail Trade,Wholesale Trade, Building Permits, Exports/Imports,Quarterly Financial Report, Quarterly Services.
Monthly & Quarterly
20 surveys that provide annual economic statistics for nearly every sector.
• National sample surveys – including Annual Retail Trade,Wholesale Trade, Service Annual Survey, County BusinessPatterns and Annual Survey of Entrepreneurs.
Annual Surveys
U.S. Census Bureau Briefing | September 2019 | 7
The Economic Census• The Census Bureau measures the nation’s population once every
10 years. It also measures U.S. businesses every 5 years with theEconomic Census.
• The most comprehensive economic data available – statistics forevery industry and geography, down to the local level.
• Collection for the latest Economic Census is now completed.Companies reported their 2017 year-end numbers.
• The Census is conducted online, and response is required by law.
• Responses are confidential. Company data is used for statisticalpurposes only. The Census Bureau is required by law to keep allinformation private and secure.
• Release of results begins in late September – free and availableonline.
U.S. Census Bureau Briefing | 8
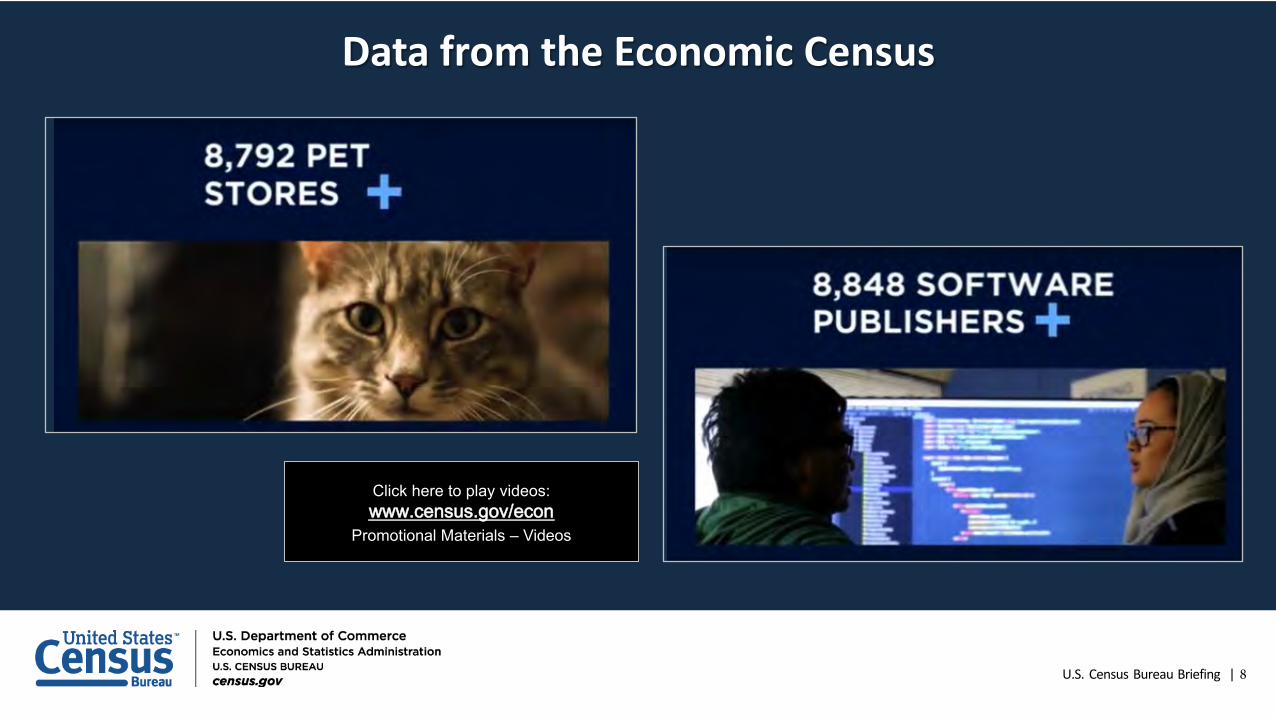
Click here to play videos: www.census.gov/econ
Promotional Materials – Videos
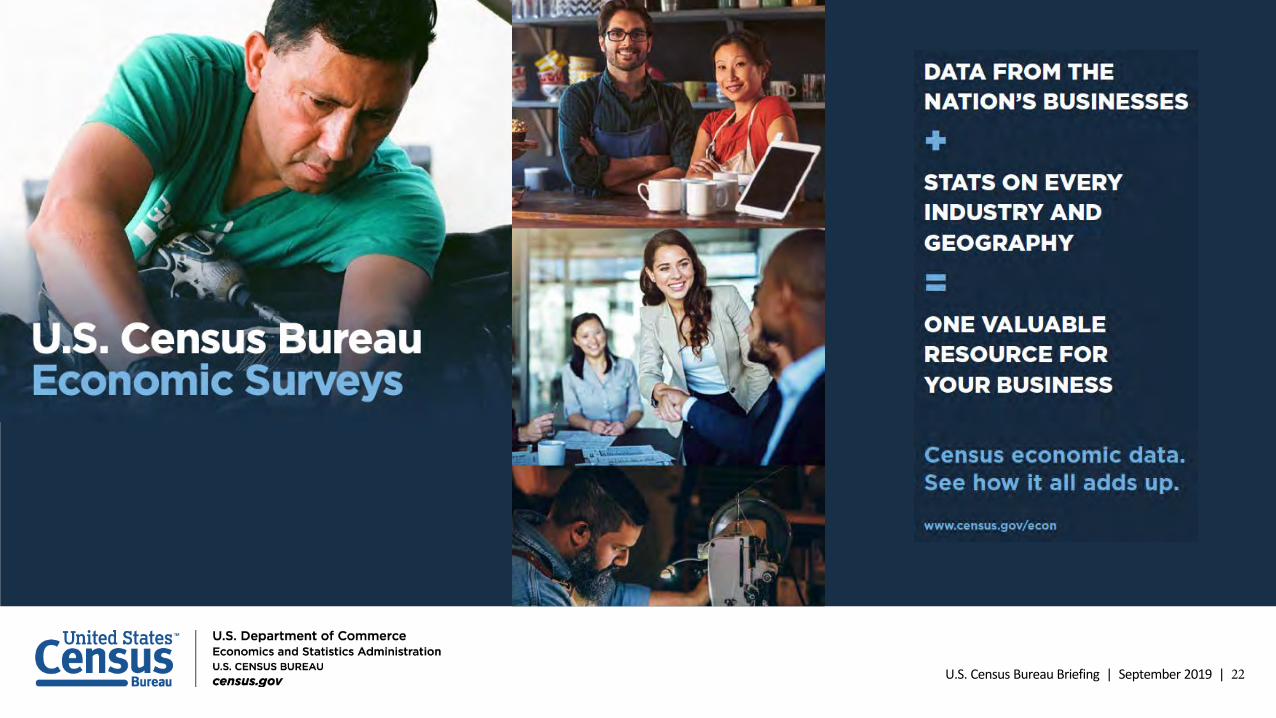
Data from the Economic Census
U.S. Census Bureau Briefing | September 2019 | 9
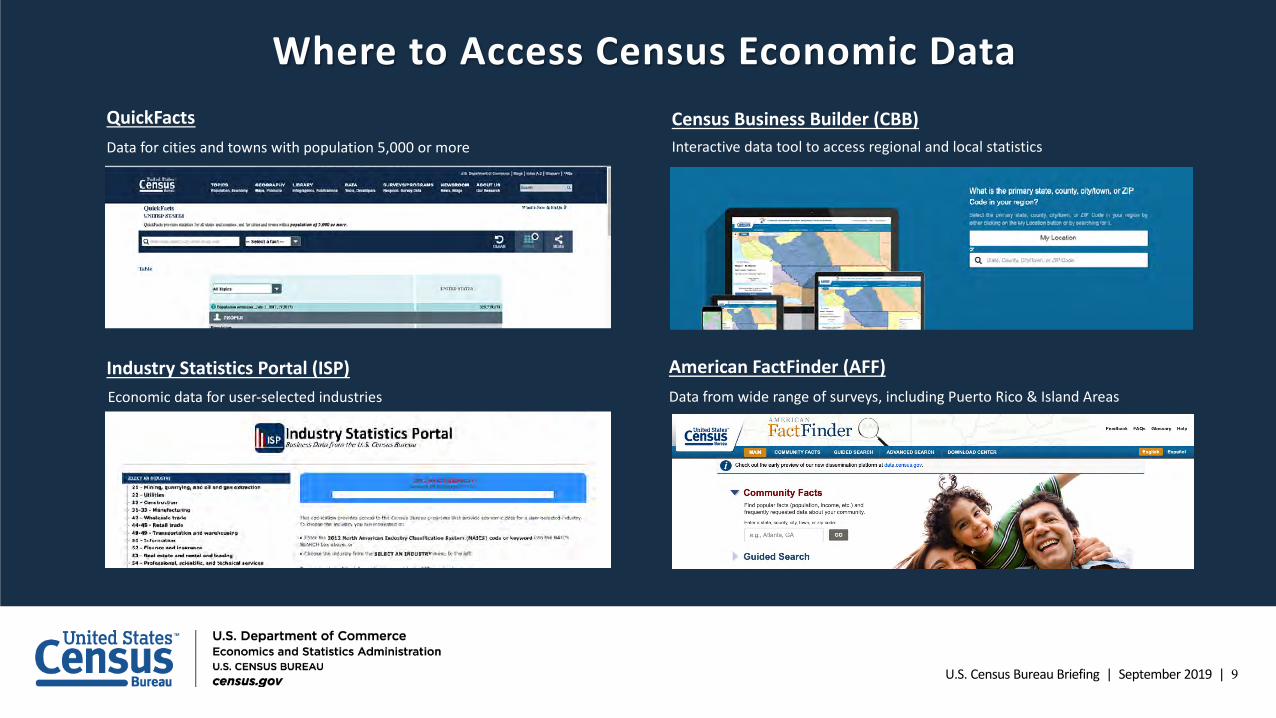
Where to Access Census Economic DataQuickFactsData for cities and towns with population 5,000 or more
Industry Statistics Portal (ISP)Economic data for user-selected industries
American FactFinder (AFF)Data from wide range of surveys, including Puerto Rico & Island Areas
Census Business Builder (CBB)Interactive data tool to access regional and local statistics
U.S. Census Bureau Briefing | September 2019 | 10
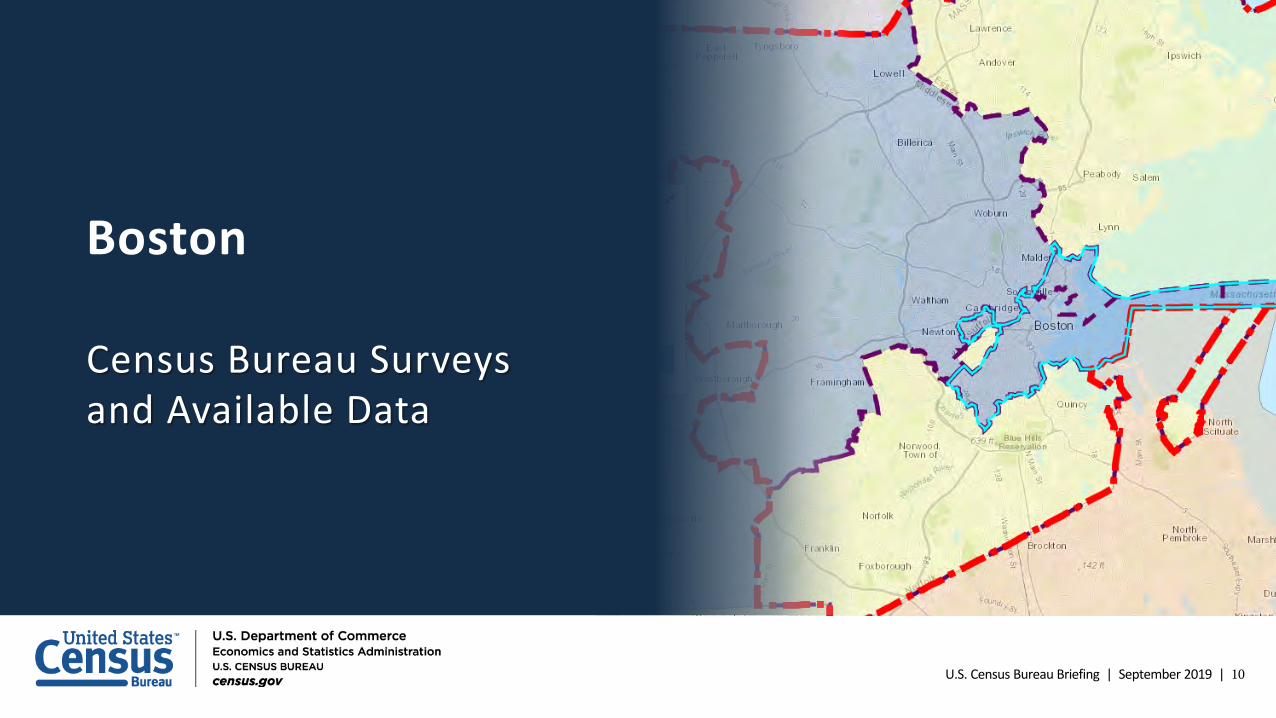
Boston
Census Bureau Surveys and Available Data
U.S. Census Bureau Briefing | September 2019 | 11
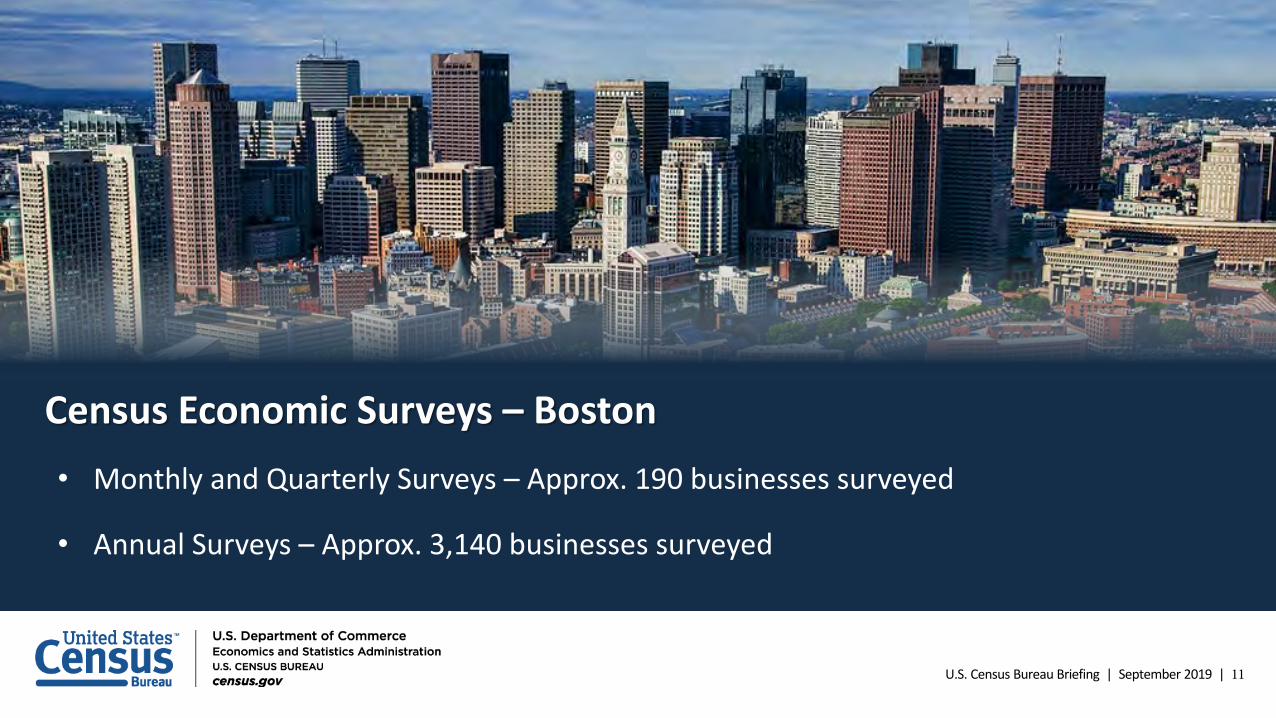
• Monthly and Quarterly Surveys – Approx. 190 businesses surveyed
• Annual Surveys – Approx. 3,140 businesses surveyed
Census Economic Surveys – Boston
U.S. Census Bureau Briefing | September 2019 | 12
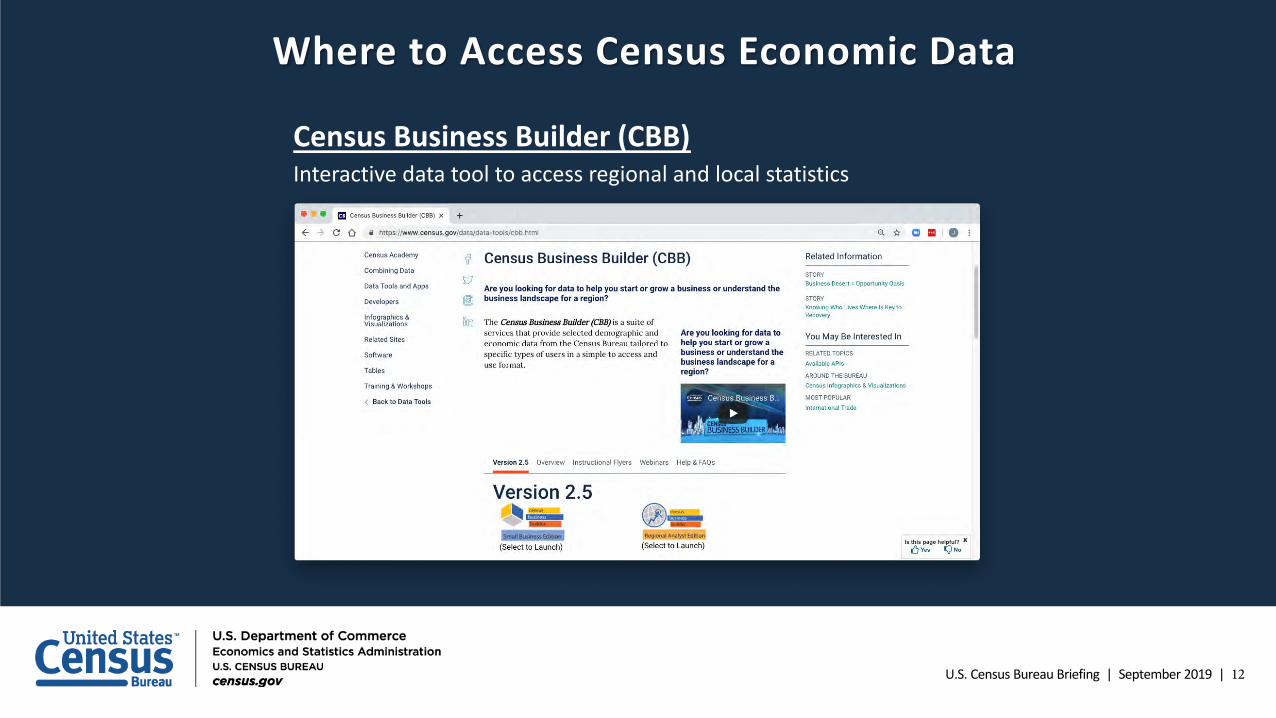
Census Business Builder (CBB)Interactive data tool to access regional and local statistics
Where to Access Census Economic Data
U.S. Census Bureau Briefing | September 2019 | 13
Census Bureau Data AvailableCensus Business Builder
U.S. Census Bureau Briefing | September 2019 | 14
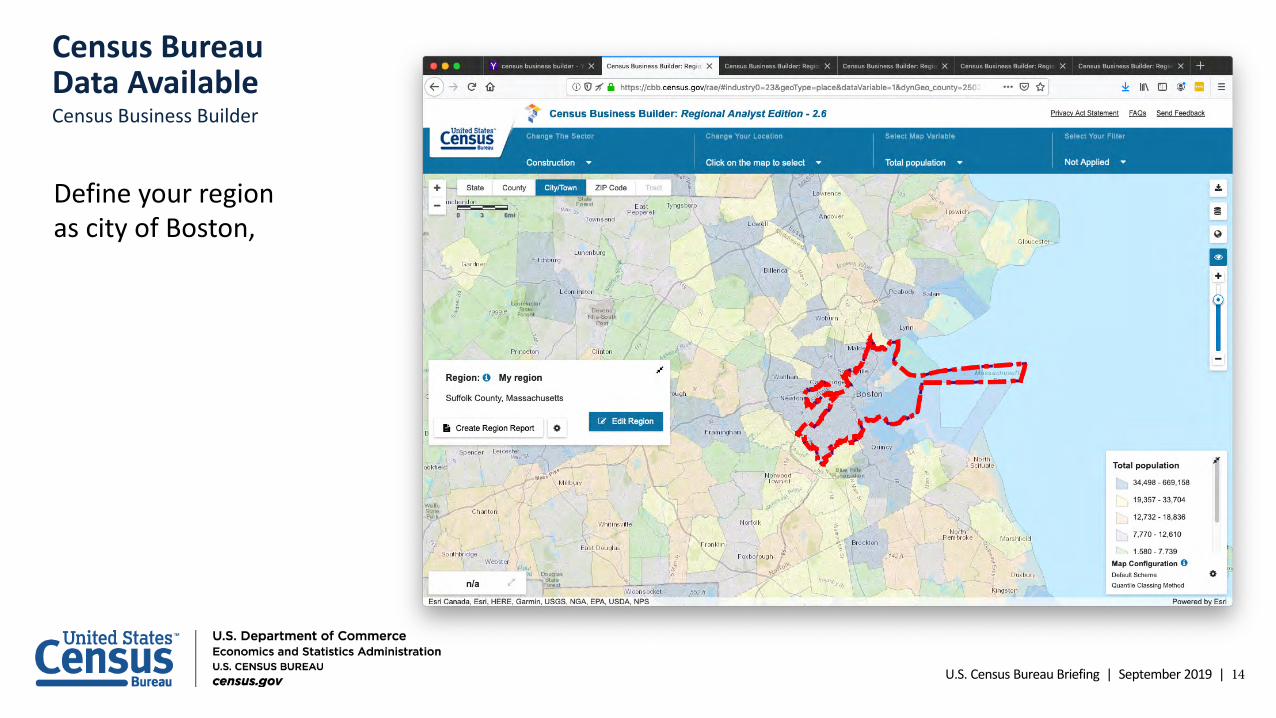
Census Bureau Data AvailableCensus Business Builder
Define your region as city of Boston,
U.S. Census Bureau Briefing | September 2019 | 15
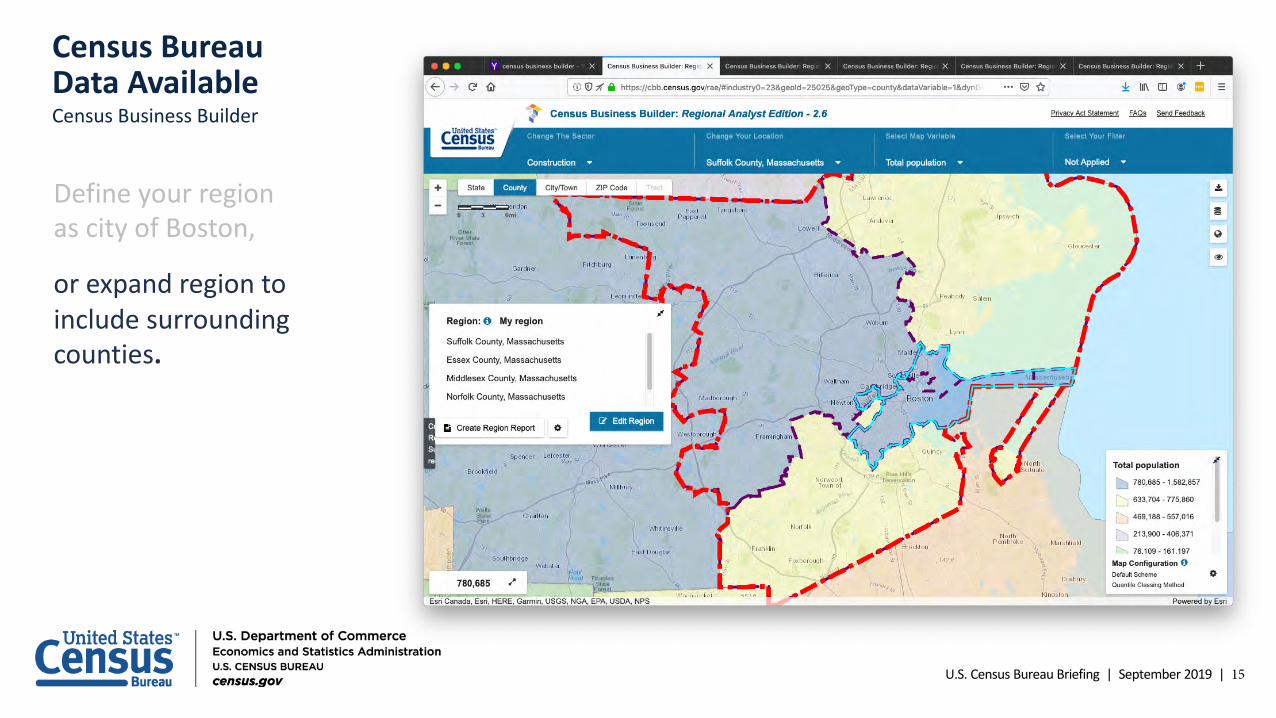
Census Bureau Data AvailableCensus Business Builder
Define your region as city of Boston,
or expand region to include surrounding counties.
U.S. Census Bureau Briefing | September 2019 | 16
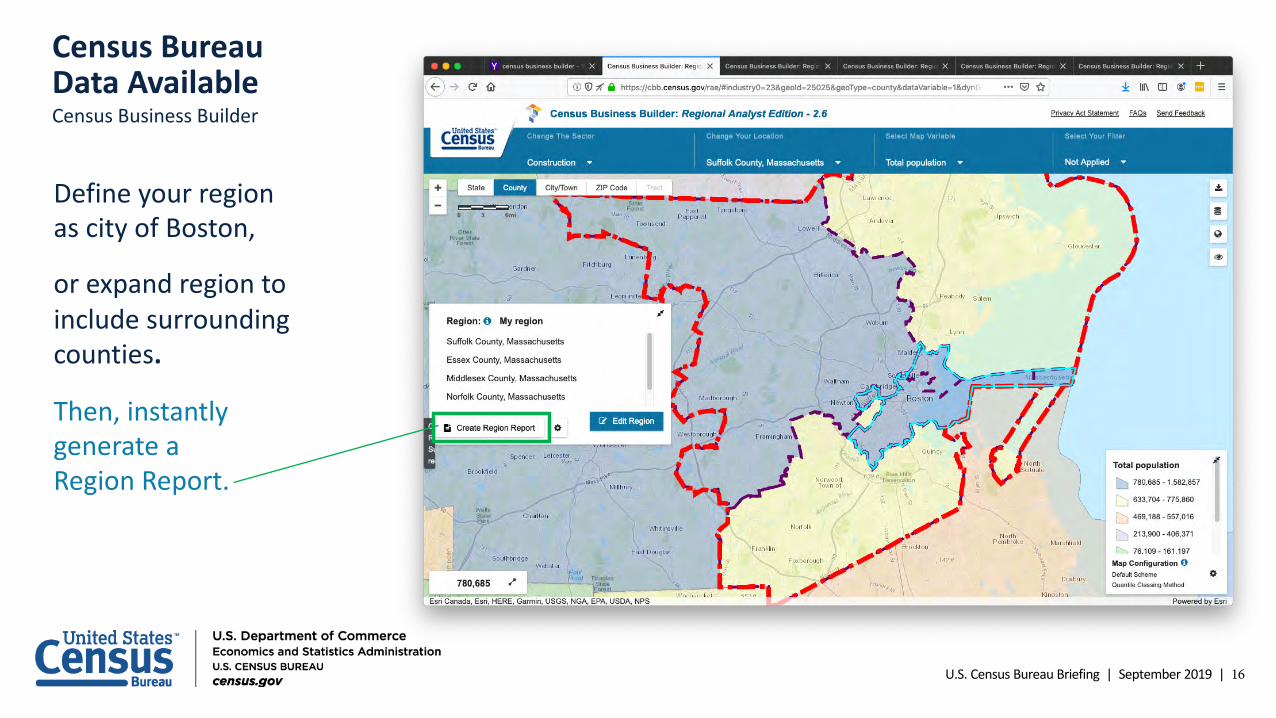
Census Bureau Data AvailableCensus Business Builder
Define your region as city of Boston,
or expand region to include surrounding counties.
Then, instantly generate a Region Report.
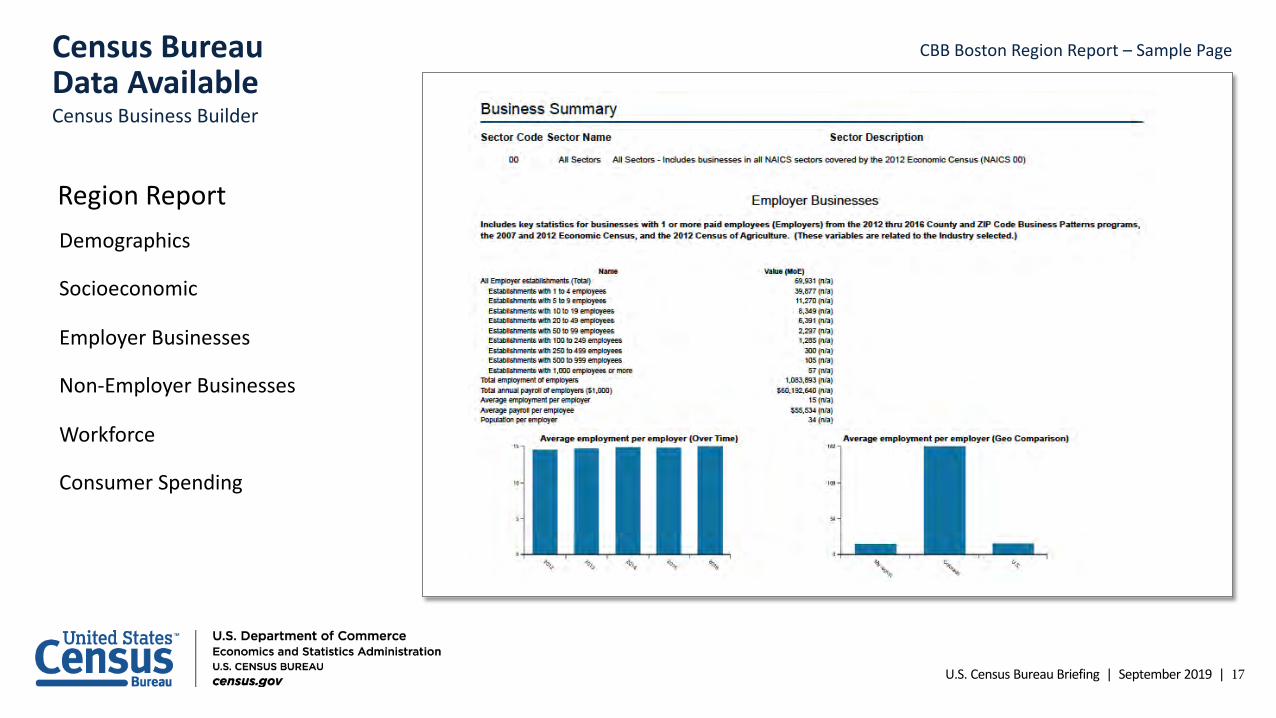
U.S. Census Bureau Briefing | September 2019 | 17
Region ReportDemographics
Socioeconomic
Employer Businesses
Non-Employer Businesses
Workforce
Consumer Spending
CBB Boston Region Report – Sample PageCensus Bureau Data AvailableCensus Business Builder
U.S. Census Bureau Briefing | September 2019 | 18
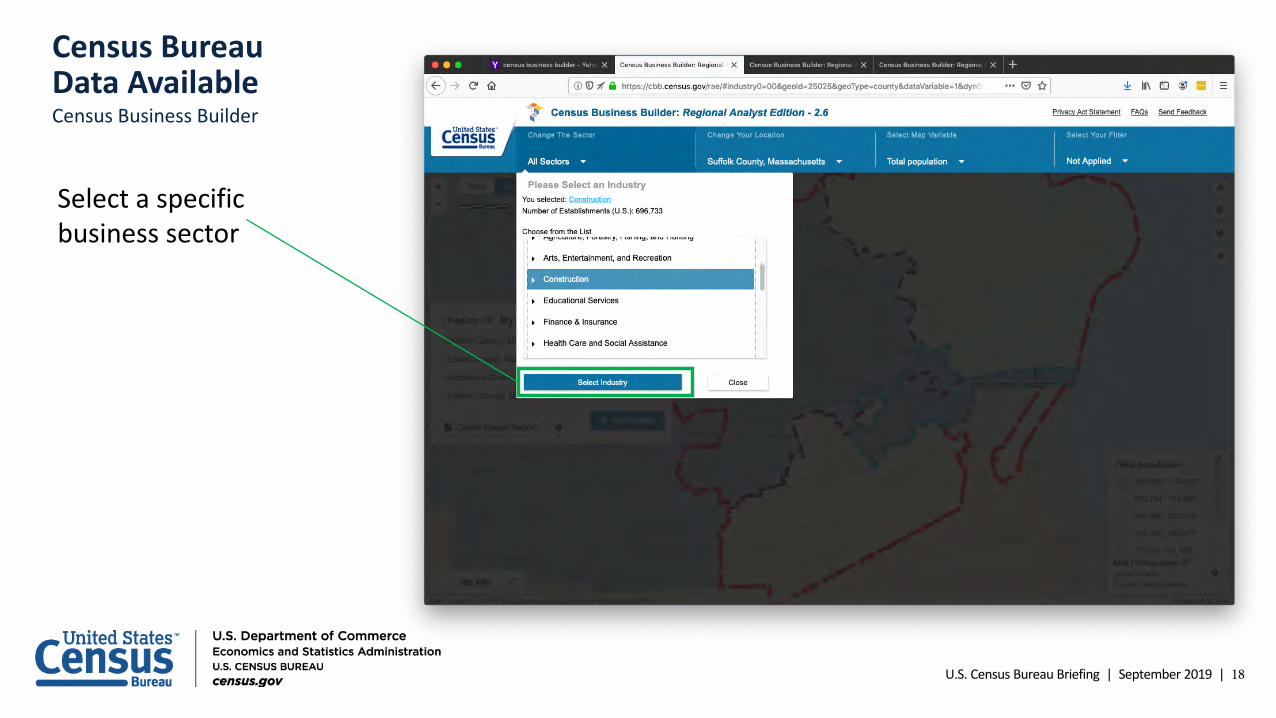
Select a specific business sector
Census Bureau Data AvailableCensus Business Builder
U.S. Census Bureau Briefing | September 2019 | 19
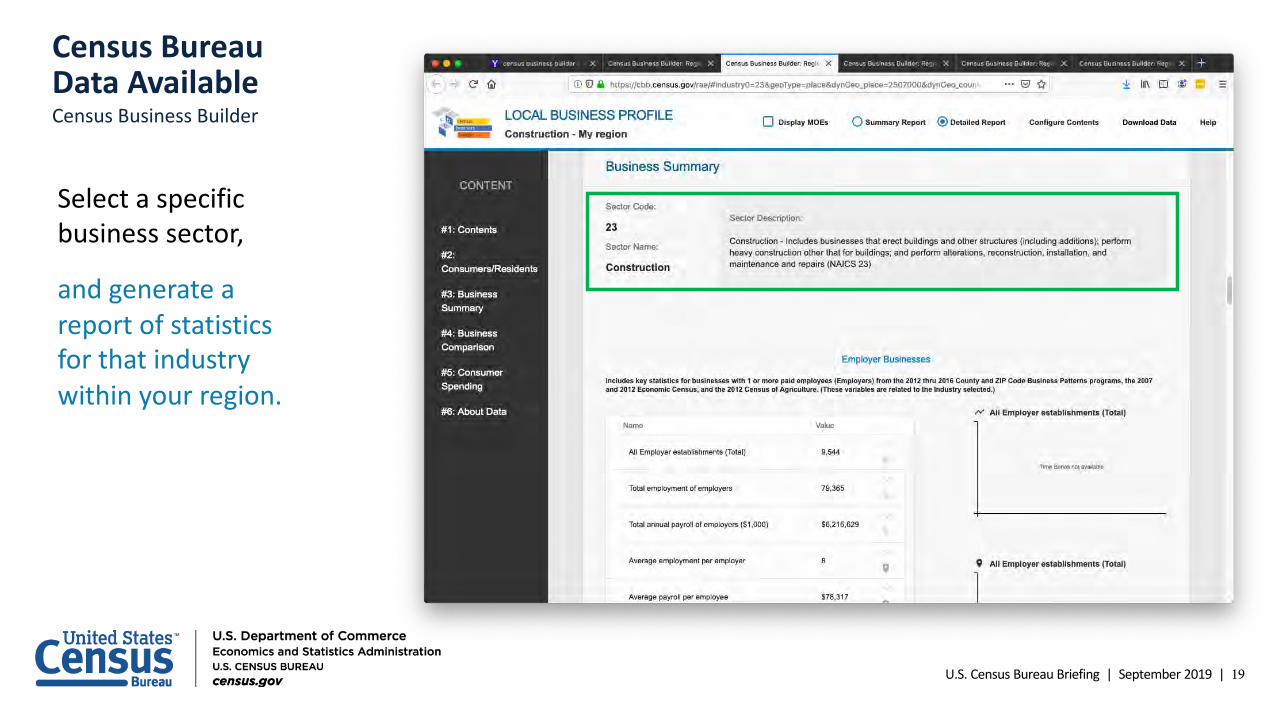
Select a specific business sector,
and generate a report of statistics for that industry within your region.
Census Bureau Data AvailableCensus Business Builder
U.S. Census Bureau Briefing | September 2019 | 20
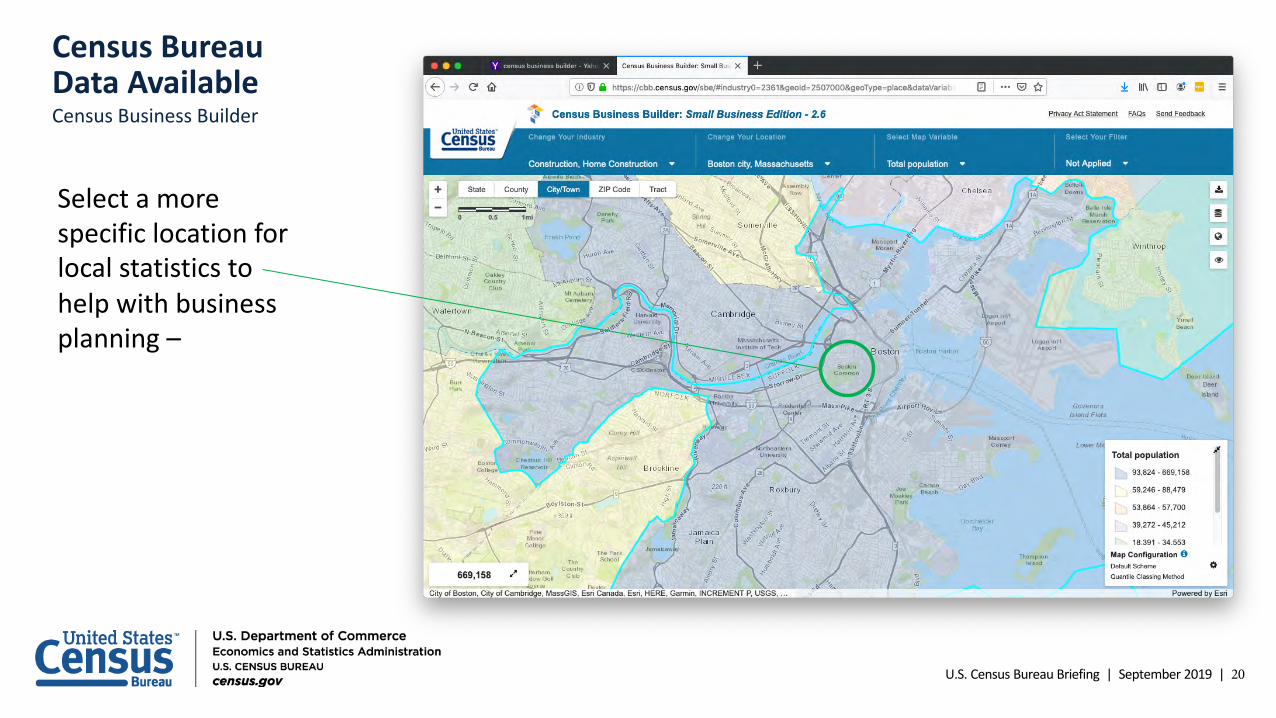
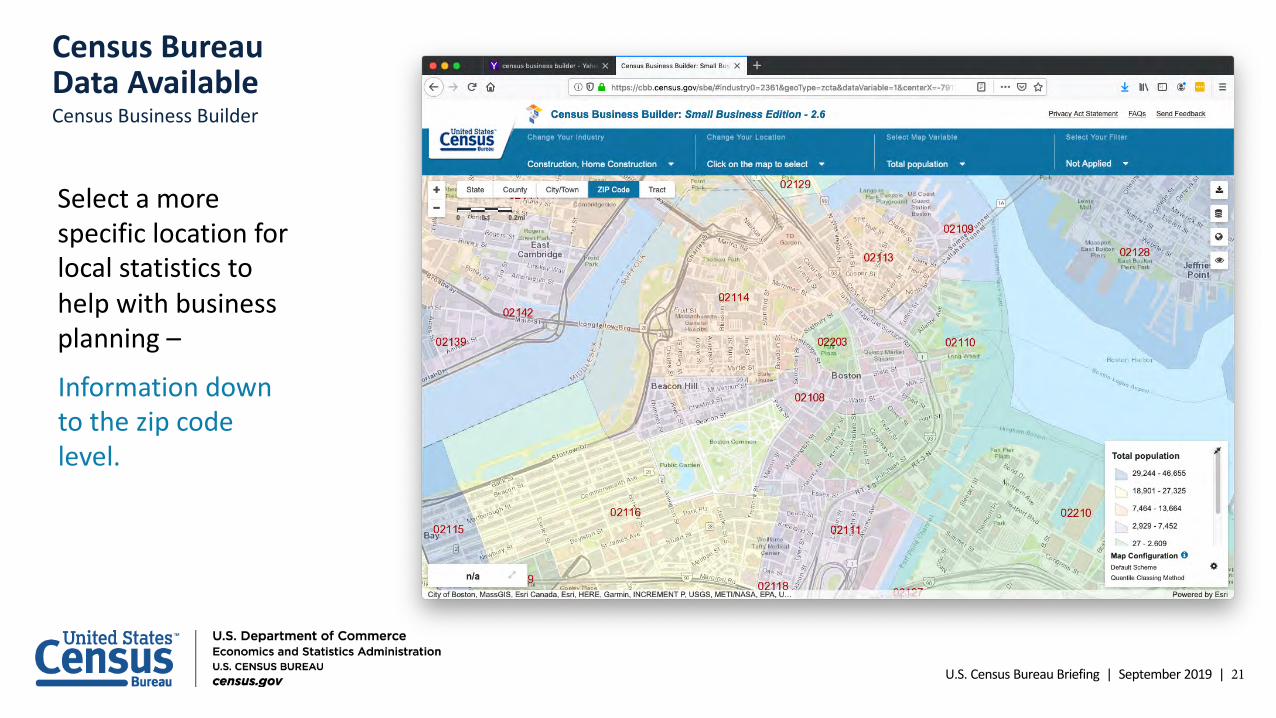
Select a more specific location for local statistics to help with business planning –
Census Bureau Data AvailableCensus Business Builder
U.S. Census Bureau Briefing | September 2019 | 21
Select a more specific location for local statistics to help with business planning –
Information down to the zip code level.
Census Bureau Data AvailableCensus Business Builder
U.S. Census Bureau Briefing | September 2019 | 22

U.S. Census Bureau Briefing | July 2019 | 26
Why should businesses respond?
Click here to play video: www.census.gov/econ
Information for Respondents
U.S. Census Bureau Briefing | September 2019 | 24
• You are your community’s trusted voice
• Spread the word/carry the message
• Distribute materials
• Promote the value of response
• Link to census.gov/econ
• Quarterly contact about updates and new data products
• Your specific geography or industry requests
Next Steps – Partnership with Census

U.S. Census Bureau Briefing
Q & AAppendix
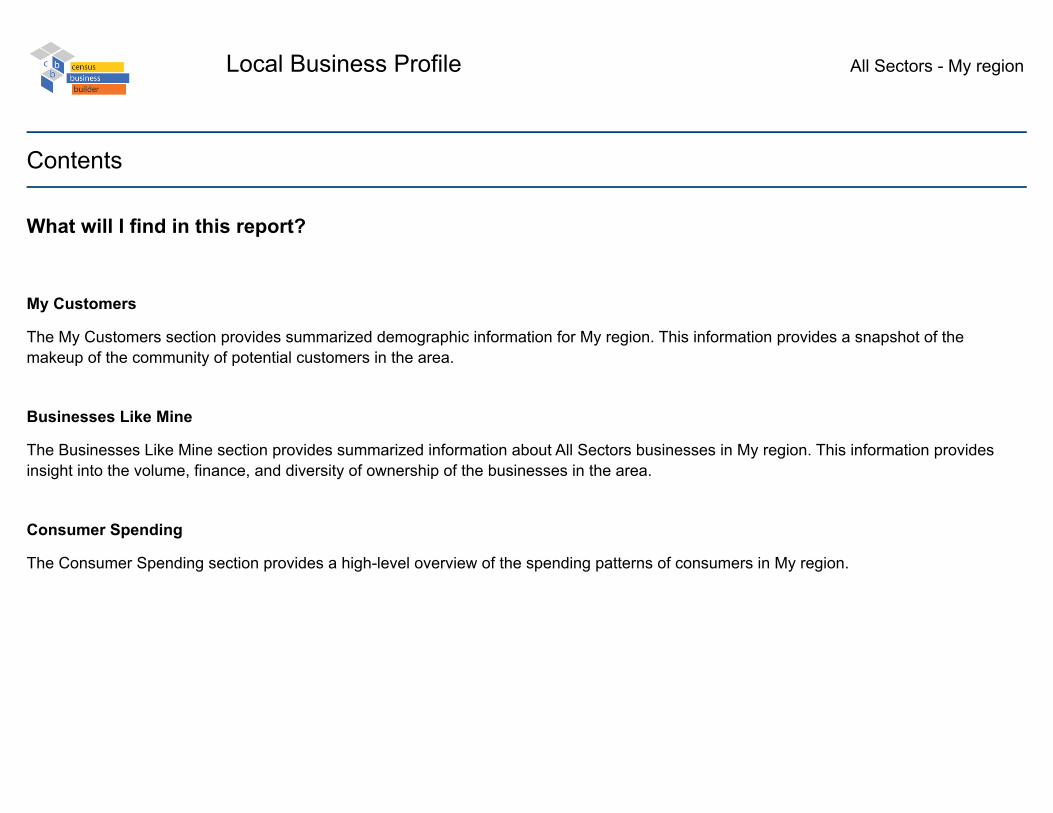
Local Business Profile All Sectors - My region
Contents
What will I find in this report?
My Customers
The My Customers section provides summarized demographic information for My region. This information provides a snapshot of the makeup of the community of potential customers in the area.
Businesses Like Mine
The Businesses Like Mine section provides summarized information about All Sectors businesses in My region. This information provides insight into the volume, finance, and diversity of ownership of the businesses in the area.
Consumer Spending
The Consumer Spending section provides a high-level overview of the spending patterns of consumers in My region.
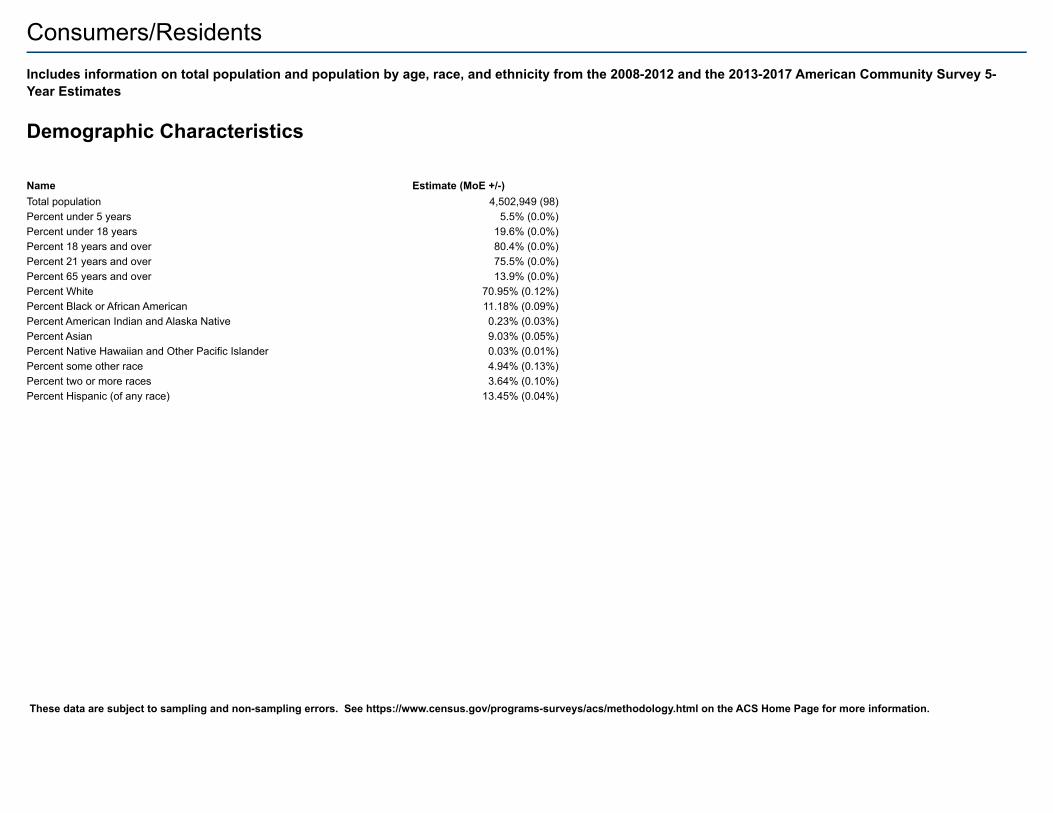
Consumers/ResidentsIncludes information on total population and population by age, race, and ethnicity from the 2008-2012 and the 2013-2017 American Community Survey 5-Year Estimates
Demographic Characteristics
Name Estimate (MoE +/-)Total population 4,502,949 (98)Percent under 5 years 5.5% (0.0%)Percent under 18 years 19.6% (0.0%)Percent 18 years and over 80.4% (0.0%)Percent 21 years and over 75.5% (0.0%)Percent 65 years and over 13.9% (0.0%)Percent White 70.95% (0.12%)Percent Black or African American 11.18% (0.09%)Percent American Indian and Alaska Native 0.23% (0.03%)Percent Asian 9.03% (0.05%)Percent Native Hawaiian and Other Pacific Islander 0.03% (0.01%)Percent some other race 4.94% (0.13%)Percent two or more races 3.64% (0.10%)Percent Hispanic (of any race) 13.45% (0.04%)
These data are subject to sampling and non-sampling errors. See https://www.census.gov/programs-surveys/acs/methodology.html on the ACS Home Page for more information.
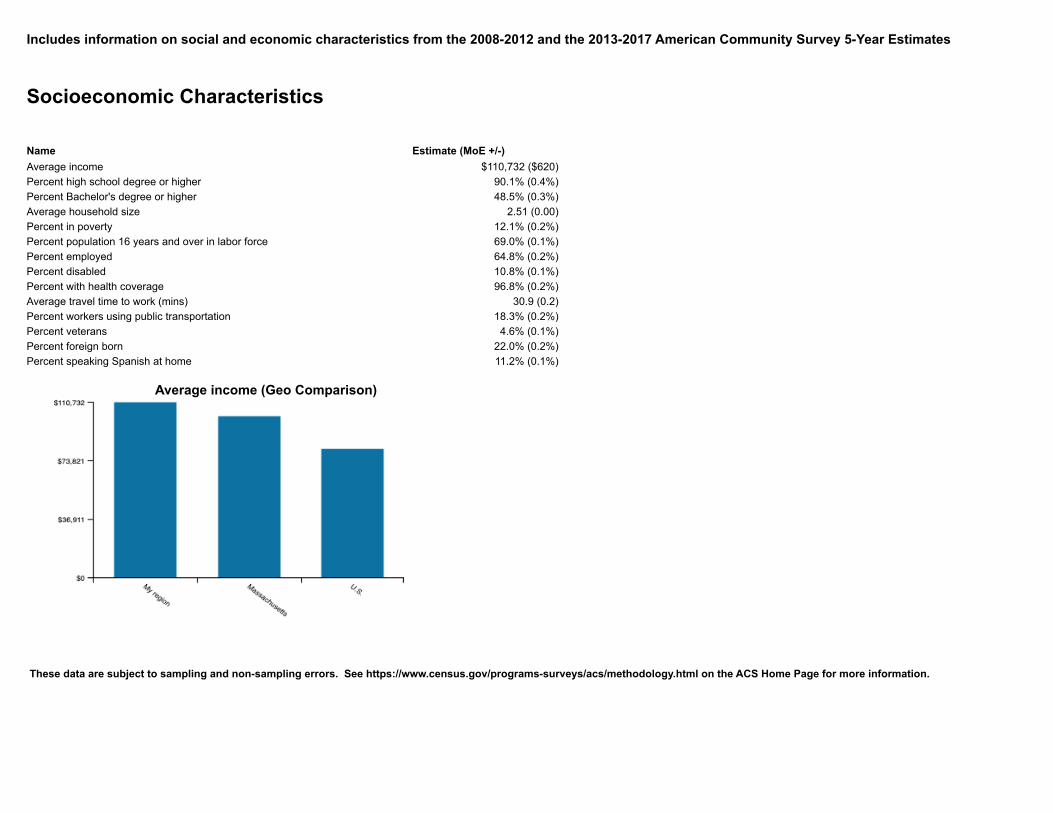
Includes information on social and economic characteristics from the 2008-2012 and the 2013-2017 American Community Survey 5-Year Estimates
Socioeconomic Characteristics
Name Estimate (MoE +/-)Average income $110,732 ($620)Percent high school degree or higher 90.1% (0.4%)Percent Bachelor's degree or higher 48.5% (0.3%)Average household size 2.51 (0.00)Percent in poverty 12.1% (0.2%)Percent population 16 years and over in labor force 69.0% (0.1%)Percent employed 64.8% (0.2%)Percent disabled 10.8% (0.1%)Percent with health coverage 96.8% (0.2%)Average travel time to work (mins) 30.9 (0.2)Percent workers using public transportation 18.3% (0.2%)Percent veterans 4.6% (0.1%)Percent foreign born 22.0% (0.2%)Percent speaking Spanish at home 11.2% (0.1%)
Average income (Geo Comparison)
These data are subject to sampling and non-sampling errors. See https://www.census.gov/programs-surveys/acs/methodology.html on the ACS Home Page for more information.
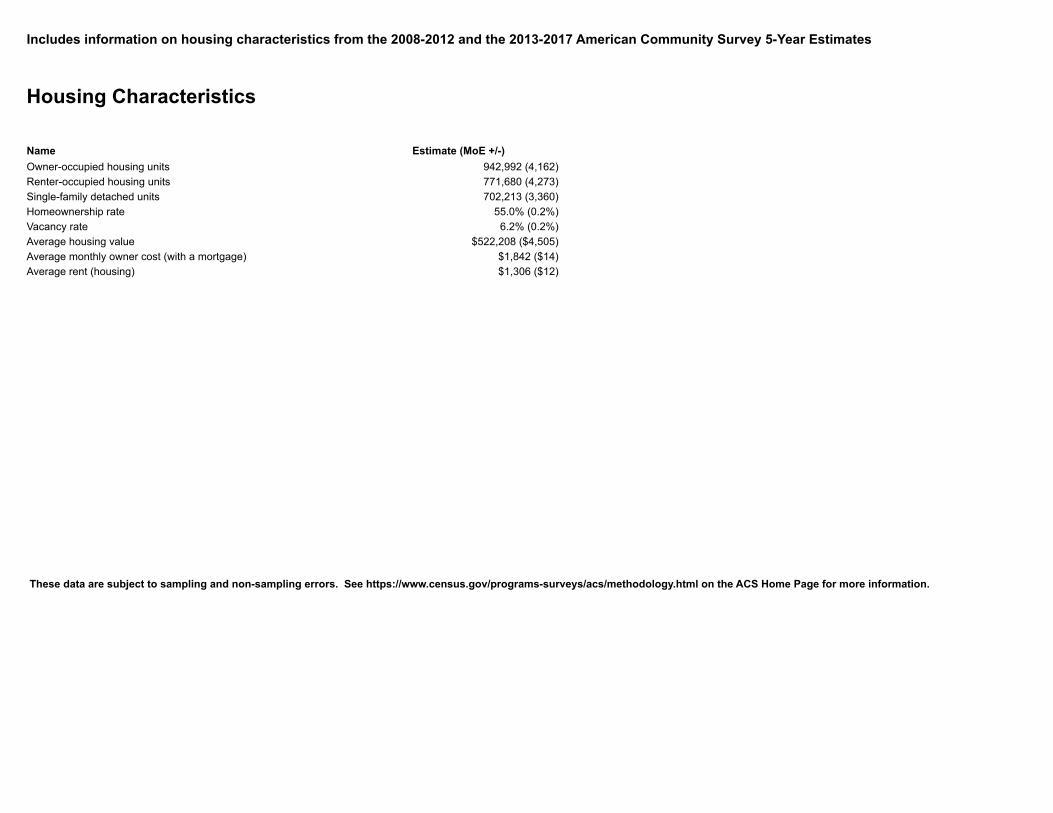
Includes information on housing characteristics from the 2008-2012 and the 2013-2017 American Community Survey 5-Year Estimates
Housing Characteristics
Name Estimate (MoE +/-)Owner-occupied housing units 942,992 (4,162)Renter-occupied housing units 771,680 (4,273)Single-family detached units 702,213 (3,360)Homeownership rate 55.0% (0.2%)Vacancy rate 6.2% (0.2%)Average housing value $522,208 ($4,505)Average monthly owner cost (with a mortgage) $1,842 ($14)Average rent (housing) $1,306 ($12)
These data are subject to sampling and non-sampling errors. See https://www.census.gov/programs-surveys/acs/methodology.html on the ACS Home Page for more information.
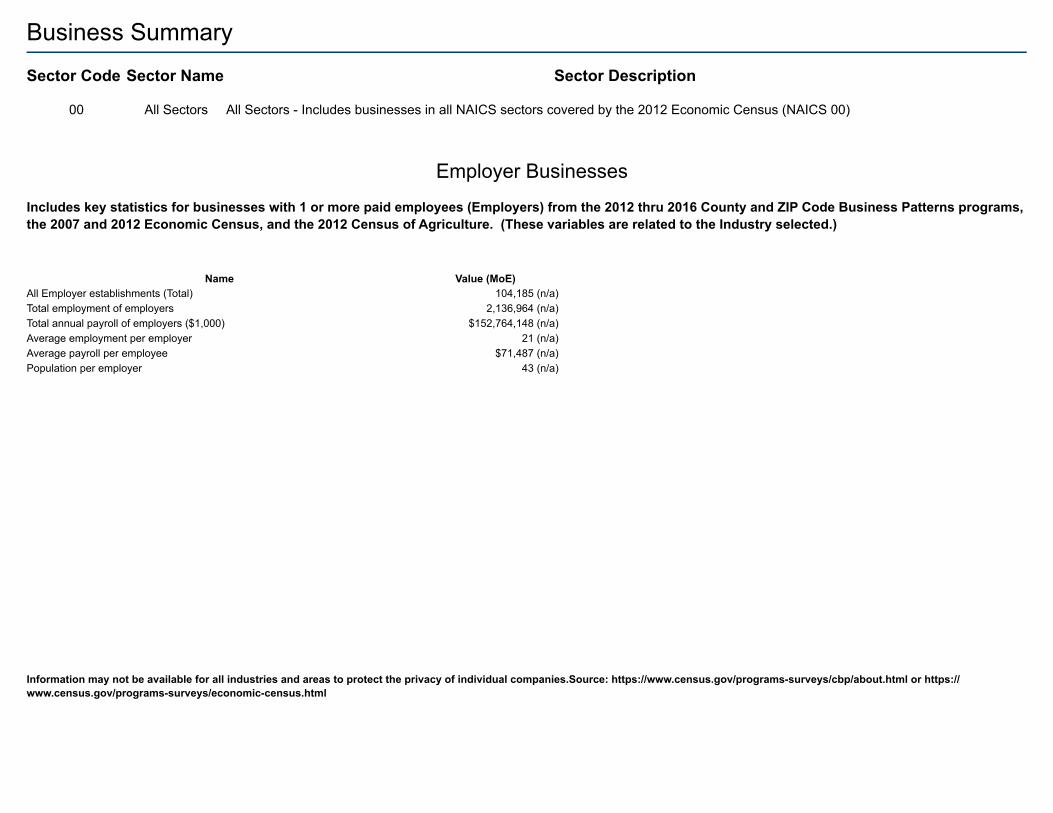
Business SummarySector Code Sector Name Sector Description
00 All Sectors All Sectors - Includes businesses in all NAICS sectors covered by the 2012 Economic Census (NAICS 00)
Employer BusinessesIncludes key statistics for businesses with 1 or more paid employees (Employers) from the 2012 thru 2016 County and ZIP Code Business Patterns programs, the 2007 and 2012 Economic Census, and the 2012 Census of Agriculture. (These variables are related to the Industry selected.)
Name Value (MoE)All Employer establishments (Total) 104,185 (n/a)Total employment of employers 2,136,964 (n/a)Total annual payroll of employers ($1,000) $152,764,148 (n/a)Average employment per employer 21 (n/a)Average payroll per employee $71,487 (n/a)Population per employer 43 (n/a)
Information may not be available for all industries and areas to protect the privacy of individual companies.Source: https://www.census.gov/programs-surveys/cbp/about.html or https://www.census.gov/programs-surveys/economic-census.html
Business RevenueIncludes key statistics on business revenue for businesses with 1 or more paid employees (Employers) from the 2007 and 2012 Economic Census. (These variables are related to the Industry selected.)
Name Value (MoE)
Information may not be available for all industries and areas to protect the privacy of individual companies.Source: https://www.census.gov/programs-surveys/economic-census.html
Nonemployer BusinessesIncludes key statistics for businesses with no paid employees (such as independent contractors and sole proprietors (Nonemployers)) from the 2012 thru 2016 Nonemployer Statistics programs and the 2007 and 2012 Economic Census. (These variables are related to the Industry selected.)
Name Value (MoE)
Information may not be available for all industries and areas to protect the privacy of individual companies.Source: https://www.census.gov/econ/nonemployer/
WorkforceIncludes quarterly labor force information from the 2017 Quarterly Workforce Indicators dataset. The measures shown on the map and report table are for Quarter 4 and the Industry selected.
Name Value (MoE)
For the latest quarterly data as well as data broken out by the gender, age, and educational attainment of the worker, go to https://qwiexplorer.ces.census.gov/.Source: https://lehd.ces.census.gov/data/#qwi
Quarterly BusinessesIncludes business information from the BLS Quarterly Census of Employment and Wages for the selected industry and geography. The information provides insight into the number of establishments, employment, and wages on a quarterly basis.
Name Value (MoE)
For more employment and wage data, including information on NAICS-based categories, visit https://www.bls.gov/cew/.See methodology in the Handbook of Methods on the www.bls.gov/opub/hom/cew/design.htm. Information may not be shown for all industries and areas to protect the privacy of individual companies. For more information, see https://www.bls.gov/bls/confidentiality.htm. For FAQs see https://www.bls.gov/cew/cewfaq.htm.Source: https://www.bls.gov/cew/.
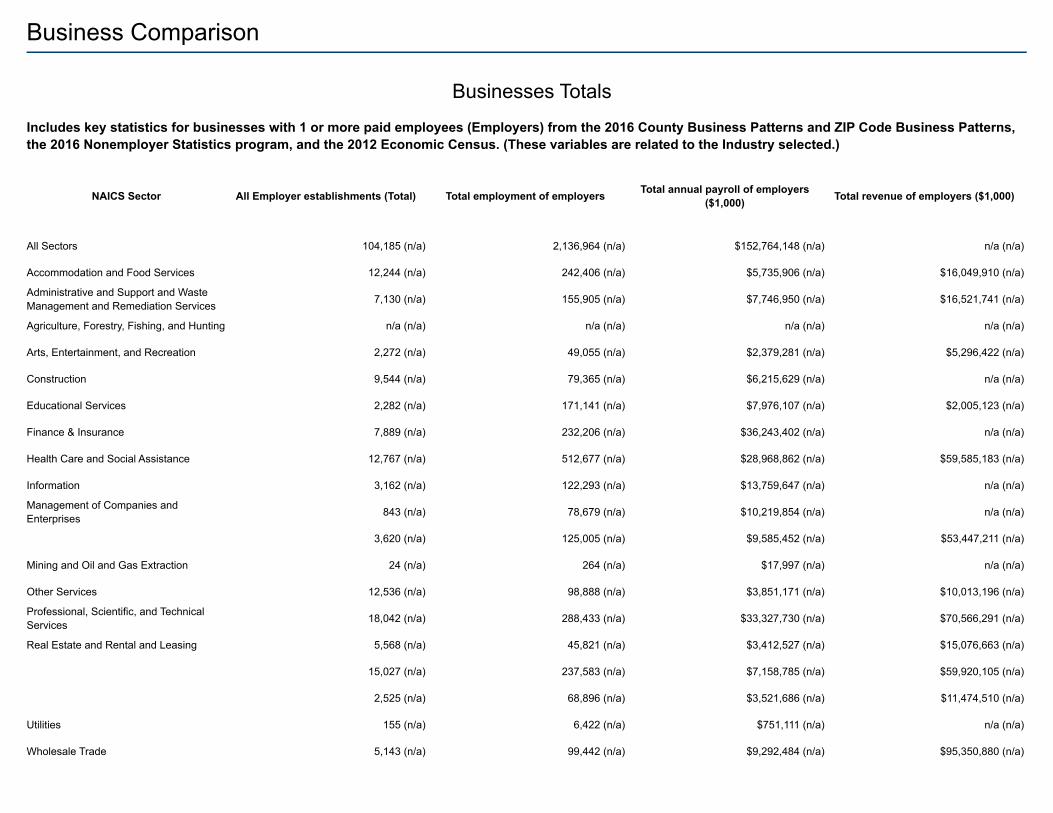
Business Comparison
Businesses TotalsIncludes key statistics for businesses with 1 or more paid employees (Employers) from the 2016 County Business Patterns and ZIP Code Business Patterns, the 2016 Nonemployer Statistics program, and the 2012 Economic Census. (These variables are related to the Industry selected.)
NAICS Sector All Employer establishments (Total) Total employment of employers Total annual payroll of employers ($1,000) Total revenue of employers ($1,000)
All Sectors 104,185 (n/a) 2,136,964 (n/a) $152,764,148 (n/a) n/a (n/a)
Accommodation and Food Services 12,244 (n/a) 242,406 (n/a) $5,735,906 (n/a) $16,049,910 (n/a)
Administrative and Support and Waste Management and Remediation Services 7,130 (n/a) 155,905 (n/a) $7,746,950 (n/a) $16,521,741 (n/a)
Agriculture, Forestry, Fishing, and Hunting n/a (n/a) n/a (n/a) n/a (n/a) n/a (n/a)
Arts, Entertainment, and Recreation 2,272 (n/a) 49,055 (n/a) $2,379,281 (n/a) $5,296,422 (n/a)
Construction 9,544 (n/a) 79,365 (n/a) $6,215,629 (n/a) n/a (n/a)
Educational Services 2,282 (n/a) 171,141 (n/a) $7,976,107 (n/a) $2,005,123 (n/a)
Finance & Insurance 7,889 (n/a) 232,206 (n/a) $36,243,402 (n/a) n/a (n/a)
Health Care and Social Assistance 12,767 (n/a) 512,677 (n/a) $28,968,862 (n/a) $59,585,183 (n/a)
Information 3,162 (n/a) 122,293 (n/a) $13,759,647 (n/a) n/a (n/a)
Management of Companies and Enterprises 843 (n/a) 78,679 (n/a) $10,219,854 (n/a) n/a (n/a)
3,620 (n/a) 125,005 (n/a) $9,585,452 (n/a) $53,447,211 (n/a)
Mining and Oil and Gas Extraction 24 (n/a) 264 (n/a) $17,997 (n/a) n/a (n/a)
Other Services 12,536 (n/a) 98,888 (n/a) $3,851,171 (n/a) $10,013,196 (n/a)
Professional, Scientific, and Technical Services 18,042 (n/a) 288,433 (n/a) $33,327,730 (n/a) $70,566,291 (n/a)
Real Estate and Rental and Leasing 5,568 (n/a) 45,821 (n/a) $3,412,527 (n/a) $15,076,663 (n/a)
15,027 (n/a) 237,583 (n/a) $7,158,785 (n/a) $59,920,105 (n/a)
2,525 (n/a) 68,896 (n/a) $3,521,686 (n/a) $11,474,510 (n/a)
Utilities 155 (n/a) 6,422 (n/a) $751,111 (n/a) n/a (n/a)
Wholesale Trade 5,143 (n/a) 99,442 (n/a) $9,292,484 (n/a) $95,350,880 (n/a)
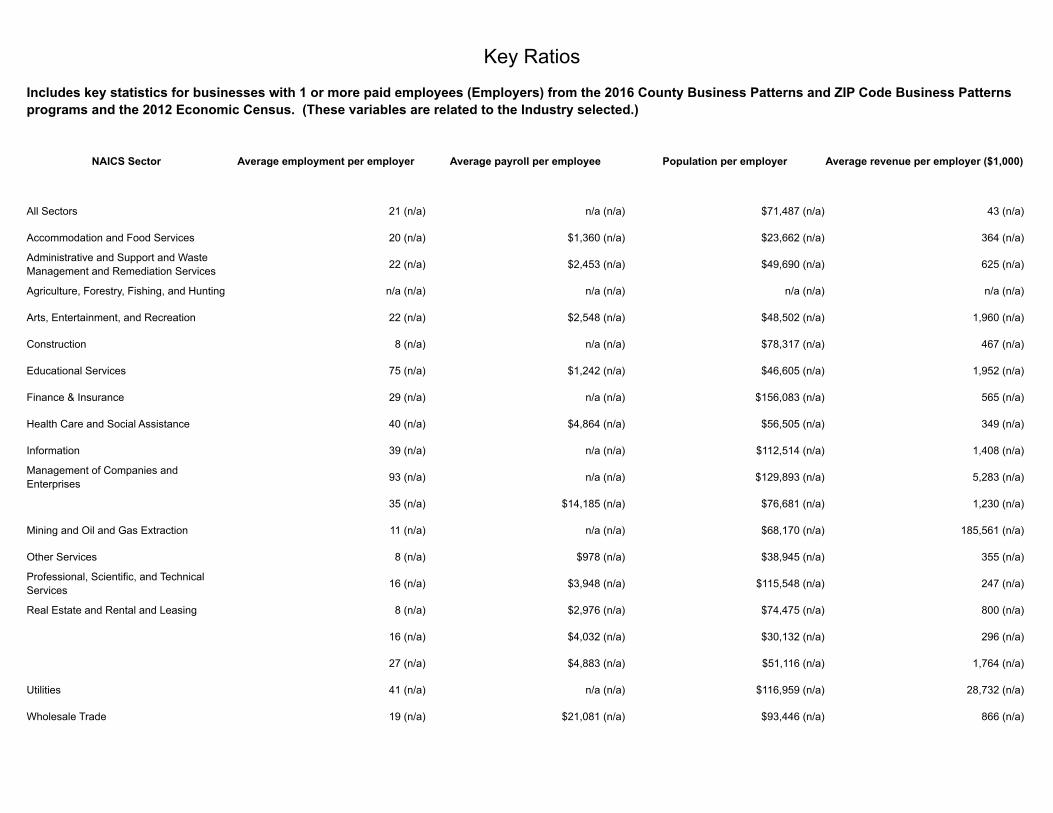
Key RatiosIncludes key statistics for businesses with 1 or more paid employees (Employers) from the 2016 County Business Patterns and ZIP Code Business Patterns programs and the 2012 Economic Census. (These variables are related to the Industry selected.)
NAICS Sector Average employment per employer Average payroll per employee Population per employer Average revenue per employer ($1,000)
All Sectors 21 (n/a) n/a (n/a) $71,487 (n/a) 43 (n/a)
Accommodation and Food Services 20 (n/a) $1,360 (n/a) $23,662 (n/a) 364 (n/a)
Administrative and Support and Waste Management and Remediation Services 22 (n/a) $2,453 (n/a) $49,690 (n/a) 625 (n/a)
Agriculture, Forestry, Fishing, and Hunting n/a (n/a) n/a (n/a) n/a (n/a) n/a (n/a)
Arts, Entertainment, and Recreation 22 (n/a) $2,548 (n/a) $48,502 (n/a) 1,960 (n/a)
Construction 8 (n/a) n/a (n/a) $78,317 (n/a) 467 (n/a)
Educational Services 75 (n/a) $1,242 (n/a) $46,605 (n/a) 1,952 (n/a)
Finance & Insurance 29 (n/a) n/a (n/a) $156,083 (n/a) 565 (n/a)
Health Care and Social Assistance 40 (n/a) $4,864 (n/a) $56,505 (n/a) 349 (n/a)
Information 39 (n/a) n/a (n/a) $112,514 (n/a) 1,408 (n/a)
Management of Companies and Enterprises 93 (n/a) n/a (n/a) $129,893 (n/a) 5,283 (n/a)
35 (n/a) $14,185 (n/a) $76,681 (n/a) 1,230 (n/a)
Mining and Oil and Gas Extraction 11 (n/a) n/a (n/a) $68,170 (n/a) 185,561 (n/a)
Other Services 8 (n/a) $978 (n/a) $38,945 (n/a) 355 (n/a)
Professional, Scientific, and Technical Services 16 (n/a) $3,948 (n/a) $115,548 (n/a) 247 (n/a)
Real Estate and Rental and Leasing 8 (n/a) $2,976 (n/a) $74,475 (n/a) 800 (n/a)
16 (n/a) $4,032 (n/a) $30,132 (n/a) 296 (n/a)
27 (n/a) $4,883 (n/a) $51,116 (n/a) 1,764 (n/a)
Utilities 41 (n/a) n/a (n/a) $116,959 (n/a) 28,732 (n/a)
Wholesale Trade 19 (n/a) $21,081 (n/a) $93,446 (n/a) 866 (n/a)
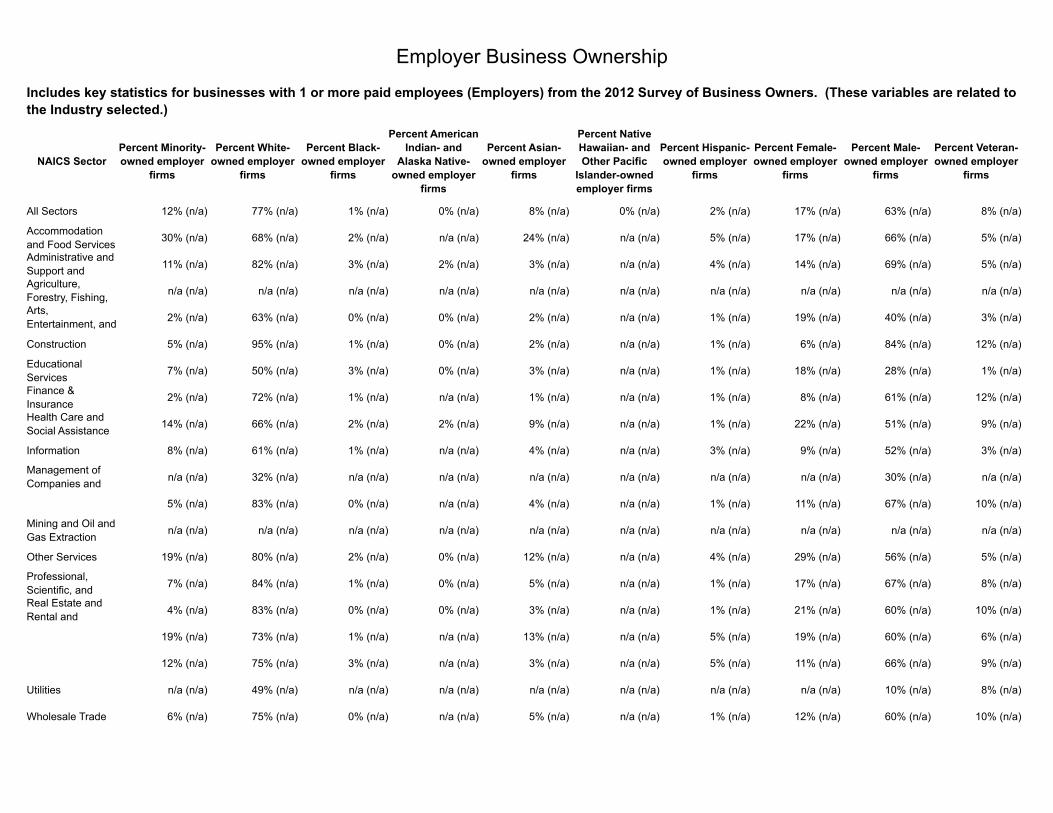
Employer Business OwnershipIncludes key statistics for businesses with 1 or more paid employees (Employers) from the 2012 Survey of Business Owners. (These variables are related to the Industry selected.)
NAICS SectorPercent Minority-owned employer
firms
Percent White-owned employer
firms
Percent Black-owned employer
firms
Percent American Indian- and
Alaska Native-owned employer
firms
Percent Asian-owned employer
firms
Percent Native Hawaiian- and Other Pacific
Islander-owned employer firms
Percent Hispanic-owned employer
firms
Percent Female-owned employer
firms
Percent Male-owned employer
firms
Percent Veteran-owned employer
firms
All Sectors 12% (n/a) 77% (n/a) 1% (n/a) 0% (n/a) 8% (n/a) 0% (n/a) 2% (n/a) 17% (n/a) 63% (n/a) 8% (n/a)
Accommodation and Food Services 30% (n/a) 68% (n/a) 2% (n/a) n/a (n/a) 24% (n/a) n/a (n/a) 5% (n/a) 17% (n/a) 66% (n/a) 5% (n/a)
Administrative and Support and Waste
11% (n/a) 82% (n/a) 3% (n/a) 2% (n/a) 3% (n/a) n/a (n/a) 4% (n/a) 14% (n/a) 69% (n/a) 5% (n/a)
Agriculture, Forestry, Fishing, and Hunting
n/a (n/a) n/a (n/a) n/a (n/a) n/a (n/a) n/a (n/a) n/a (n/a) n/a (n/a) n/a (n/a) n/a (n/a) n/a (n/a)
Arts, Entertainment, and Recreation
2% (n/a) 63% (n/a) 0% (n/a) 0% (n/a) 2% (n/a) n/a (n/a) 1% (n/a) 19% (n/a) 40% (n/a) 3% (n/a)
Construction 5% (n/a) 95% (n/a) 1% (n/a) 0% (n/a) 2% (n/a) n/a (n/a) 1% (n/a) 6% (n/a) 84% (n/a) 12% (n/a)
Educational Services 7% (n/a) 50% (n/a) 3% (n/a) 0% (n/a) 3% (n/a) n/a (n/a) 1% (n/a) 18% (n/a) 28% (n/a) 1% (n/a)
Finance & Insurance 2% (n/a) 72% (n/a) 1% (n/a) n/a (n/a) 1% (n/a) n/a (n/a) 1% (n/a) 8% (n/a) 61% (n/a) 12% (n/a)
Health Care and Social Assistance 14% (n/a) 66% (n/a) 2% (n/a) 2% (n/a) 9% (n/a) n/a (n/a) 1% (n/a) 22% (n/a) 51% (n/a) 9% (n/a)
Information 8% (n/a) 61% (n/a) 1% (n/a) n/a (n/a) 4% (n/a) n/a (n/a) 3% (n/a) 9% (n/a) 52% (n/a) 3% (n/a)
Management of Companies and Enterprises
n/a (n/a) 32% (n/a) n/a (n/a) n/a (n/a) n/a (n/a) n/a (n/a) n/a (n/a) n/a (n/a) 30% (n/a) n/a (n/a)
5% (n/a) 83% (n/a) 0% (n/a) n/a (n/a) 4% (n/a) n/a (n/a) 1% (n/a) 11% (n/a) 67% (n/a) 10% (n/a)
Mining and Oil and Gas Extraction n/a (n/a) n/a (n/a) n/a (n/a) n/a (n/a) n/a (n/a) n/a (n/a) n/a (n/a) n/a (n/a) n/a (n/a) n/a (n/a)
Other Services 19% (n/a) 80% (n/a) 2% (n/a) 0% (n/a) 12% (n/a) n/a (n/a) 4% (n/a) 29% (n/a) 56% (n/a) 5% (n/a)
Professional, Scientific, and Technical Services
7% (n/a) 84% (n/a) 1% (n/a) 0% (n/a) 5% (n/a) n/a (n/a) 1% (n/a) 17% (n/a) 67% (n/a) 8% (n/a)
Real Estate and Rental and Leasing
4% (n/a) 83% (n/a) 0% (n/a) 0% (n/a) 3% (n/a) n/a (n/a) 1% (n/a) 21% (n/a) 60% (n/a) 10% (n/a)
19% (n/a) 73% (n/a) 1% (n/a) n/a (n/a) 13% (n/a) n/a (n/a) 5% (n/a) 19% (n/a) 60% (n/a) 6% (n/a)
12% (n/a) 75% (n/a) 3% (n/a) n/a (n/a) 3% (n/a) n/a (n/a) 5% (n/a) 11% (n/a) 66% (n/a) 9% (n/a)
Utilities n/a (n/a) 49% (n/a) n/a (n/a) n/a (n/a) n/a (n/a) n/a (n/a) n/a (n/a) n/a (n/a) 10% (n/a) 8% (n/a)
Wholesale Trade 6% (n/a) 75% (n/a) 0% (n/a) n/a (n/a) 5% (n/a) n/a (n/a) 1% (n/a) 12% (n/a) 60% (n/a) 10% (n/a)
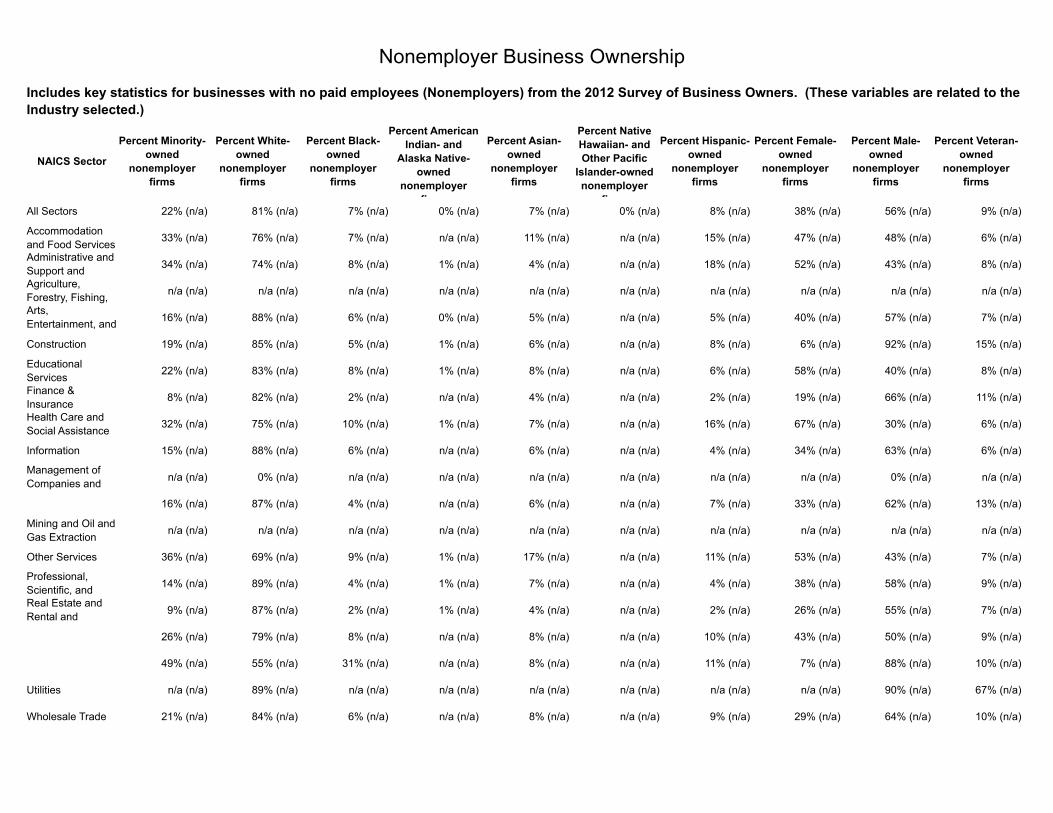
Nonemployer Business OwnershipIncludes key statistics for businesses with no paid employees (Nonemployers) from the 2012 Survey of Business Owners. (These variables are related to the Industry selected.)
NAICS Sector
Percent Minority-owned
nonemployer firms
Percent White-owned
nonemployer firms
Percent Black-owned
nonemployer firms
Percent American Indian- and
Alaska Native-owned
nonemployer firms
Percent Asian-owned
nonemployer firms
Percent Native Hawaiian- and Other Pacific
Islander-owned nonemployer
firms
Percent Hispanic-owned
nonemployer firms
Percent Female-owned
nonemployer firms
Percent Male-owned
nonemployer firms
Percent Veteran-owned
nonemployer firms
All Sectors 22% (n/a) 81% (n/a) 7% (n/a) 0% (n/a) 7% (n/a) 0% (n/a) 8% (n/a) 38% (n/a) 56% (n/a) 9% (n/a)
Accommodation and Food Services 33% (n/a) 76% (n/a) 7% (n/a) n/a (n/a) 11% (n/a) n/a (n/a) 15% (n/a) 47% (n/a) 48% (n/a) 6% (n/a)
Administrative and Support and Waste
34% (n/a) 74% (n/a) 8% (n/a) 1% (n/a) 4% (n/a) n/a (n/a) 18% (n/a) 52% (n/a) 43% (n/a) 8% (n/a)
Agriculture, Forestry, Fishing, and Hunting
n/a (n/a) n/a (n/a) n/a (n/a) n/a (n/a) n/a (n/a) n/a (n/a) n/a (n/a) n/a (n/a) n/a (n/a) n/a (n/a)
Arts, Entertainment, and Recreation
16% (n/a) 88% (n/a) 6% (n/a) 0% (n/a) 5% (n/a) n/a (n/a) 5% (n/a) 40% (n/a) 57% (n/a) 7% (n/a)
Construction 19% (n/a) 85% (n/a) 5% (n/a) 1% (n/a) 6% (n/a) n/a (n/a) 8% (n/a) 6% (n/a) 92% (n/a) 15% (n/a)
Educational Services 22% (n/a) 83% (n/a) 8% (n/a) 1% (n/a) 8% (n/a) n/a (n/a) 6% (n/a) 58% (n/a) 40% (n/a) 8% (n/a)
Finance & Insurance 8% (n/a) 82% (n/a) 2% (n/a) n/a (n/a) 4% (n/a) n/a (n/a) 2% (n/a) 19% (n/a) 66% (n/a) 11% (n/a)
Health Care and Social Assistance 32% (n/a) 75% (n/a) 10% (n/a) 1% (n/a) 7% (n/a) n/a (n/a) 16% (n/a) 67% (n/a) 30% (n/a) 6% (n/a)
Information 15% (n/a) 88% (n/a) 6% (n/a) n/a (n/a) 6% (n/a) n/a (n/a) 4% (n/a) 34% (n/a) 63% (n/a) 6% (n/a)
Management of Companies and Enterprises
n/a (n/a) 0% (n/a) n/a (n/a) n/a (n/a) n/a (n/a) n/a (n/a) n/a (n/a) n/a (n/a) 0% (n/a) n/a (n/a)
16% (n/a) 87% (n/a) 4% (n/a) n/a (n/a) 6% (n/a) n/a (n/a) 7% (n/a) 33% (n/a) 62% (n/a) 13% (n/a)
Mining and Oil and Gas Extraction n/a (n/a) n/a (n/a) n/a (n/a) n/a (n/a) n/a (n/a) n/a (n/a) n/a (n/a) n/a (n/a) n/a (n/a) n/a (n/a)
Other Services 36% (n/a) 69% (n/a) 9% (n/a) 1% (n/a) 17% (n/a) n/a (n/a) 11% (n/a) 53% (n/a) 43% (n/a) 7% (n/a)
Professional, Scientific, and Technical Services
14% (n/a) 89% (n/a) 4% (n/a) 1% (n/a) 7% (n/a) n/a (n/a) 4% (n/a) 38% (n/a) 58% (n/a) 9% (n/a)
Real Estate and Rental and Leasing
9% (n/a) 87% (n/a) 2% (n/a) 1% (n/a) 4% (n/a) n/a (n/a) 2% (n/a) 26% (n/a) 55% (n/a) 7% (n/a)
26% (n/a) 79% (n/a) 8% (n/a) n/a (n/a) 8% (n/a) n/a (n/a) 10% (n/a) 43% (n/a) 50% (n/a) 9% (n/a)
49% (n/a) 55% (n/a) 31% (n/a) n/a (n/a) 8% (n/a) n/a (n/a) 11% (n/a) 7% (n/a) 88% (n/a) 10% (n/a)
Utilities n/a (n/a) 89% (n/a) n/a (n/a) n/a (n/a) n/a (n/a) n/a (n/a) n/a (n/a) n/a (n/a) 90% (n/a) 67% (n/a)
Wholesale Trade 21% (n/a) 84% (n/a) 6% (n/a) n/a (n/a) 8% (n/a) n/a (n/a) 9% (n/a) 29% (n/a) 64% (n/a) 10% (n/a)
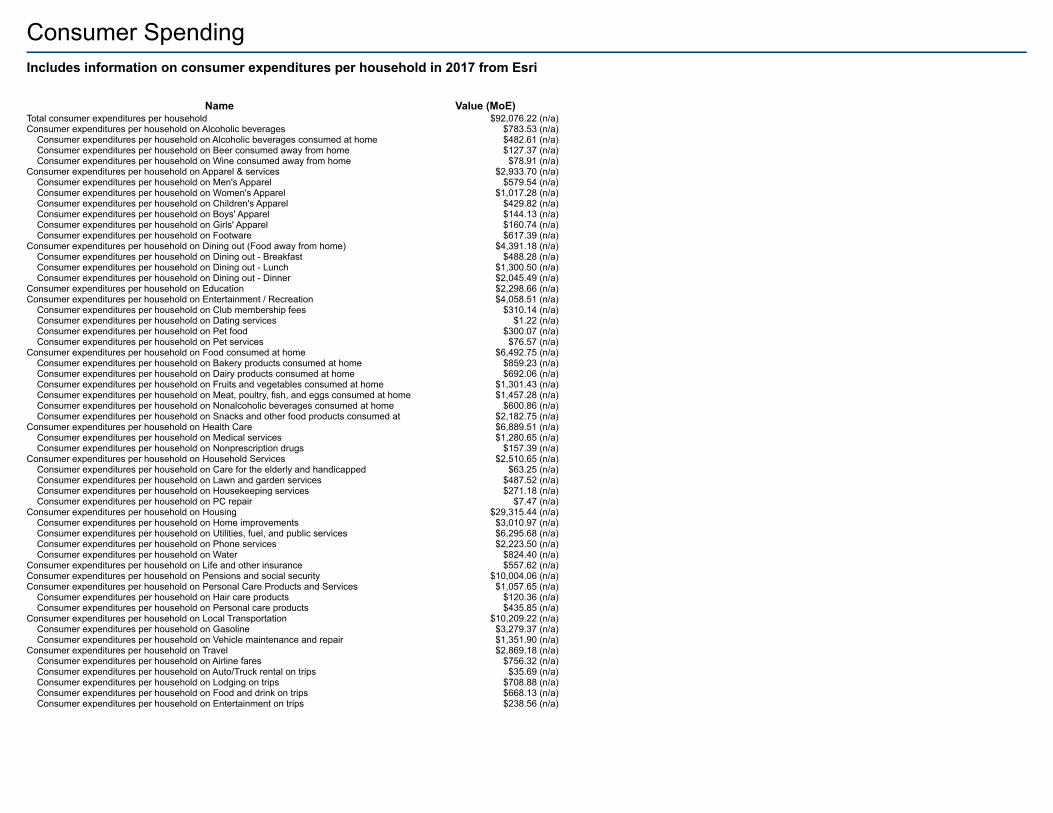
Consumer SpendingIncludes information on consumer expenditures per household in 2017 from Esri
Name Value (MoE)Total consumer expenditures per household $92,076.22 (n/a)Consumer expenditures per household on Alcoholic beverages $783.53 (n/a) Consumer expenditures per household on Alcoholic beverages consumed at home $482.61 (n/a) Consumer expenditures per household on Beer consumed away from home $127.37 (n/a) Consumer expenditures per household on Wine consumed away from home $78.91 (n/a)Consumer expenditures per household on Apparel & services $2,933.70 (n/a) Consumer expenditures per household on Men's Apparel $579.54 (n/a) Consumer expenditures per household on Women's Apparel $1,017.28 (n/a) Consumer expenditures per household on Children's Apparel $429.82 (n/a) Consumer expenditures per household on Boys' Apparel $144.13 (n/a) Consumer expenditures per household on Girls' Apparel $160.74 (n/a) Consumer expenditures per household on Footware $617.39 (n/a)Consumer expenditures per household on Dining out (Food away from home) $4,391.18 (n/a) Consumer expenditures per household on Dining out - Breakfast $488.28 (n/a) Consumer expenditures per household on Dining out - Lunch $1,300.50 (n/a) Consumer expenditures per household on Dining out - Dinner $2,045.49 (n/a)Consumer expenditures per household on Education $2,298.66 (n/a)Consumer expenditures per household on Entertainment / Recreation $4,058.51 (n/a) Consumer expenditures per household on Club membership fees $310.14 (n/a) Consumer expenditures per household on Dating services $1.22 (n/a) Consumer expenditures per household on Pet food $300.07 (n/a) Consumer expenditures per household on Pet services $76.57 (n/a)Consumer expenditures per household on Food consumed at home $6,492.75 (n/a) Consumer expenditures per household on Bakery products consumed at home $859.23 (n/a) Consumer expenditures per household on Dairy products consumed at home $692.06 (n/a) Consumer expenditures per household on Fruits and vegetables consumed at home $1,301.43 (n/a) Consumer expenditures per household on Meat, poultry, fish, and eggs consumed at home $1,457.28 (n/a) Consumer expenditures per household on Nonalcoholic beverages consumed at home $600.86 (n/a) Consumer expenditures per household on Snacks and other food products consumed at home
$2,182.75 (n/a)Consumer expenditures per household on Health Care $6,889.51 (n/a) Consumer expenditures per household on Medical services $1,280.65 (n/a) Consumer expenditures per household on Nonprescription drugs $157.39 (n/a)Consumer expenditures per household on Household Services $2,510.65 (n/a) Consumer expenditures per household on Care for the elderly and handicapped $63.25 (n/a) Consumer expenditures per household on Lawn and garden services $487.52 (n/a) Consumer expenditures per household on Housekeeping services $271.18 (n/a) Consumer expenditures per household on PC repair $7.47 (n/a)Consumer expenditures per household on Housing $29,315.44 (n/a) Consumer expenditures per household on Home improvements $3,010.97 (n/a) Consumer expenditures per household on Utilities, fuel, and public services $6,295.68 (n/a) Consumer expenditures per household on Phone services $2,223.50 (n/a) Consumer expenditures per household on Water $824.40 (n/a)Consumer expenditures per household on Life and other insurance $557.62 (n/a)Consumer expenditures per household on Pensions and social security $10,004.06 (n/a)Consumer expenditures per household on Personal Care Products and Services $1,057.65 (n/a) Consumer expenditures per household on Hair care products $120.36 (n/a) Consumer expenditures per household on Personal care products $435.85 (n/a)Consumer expenditures per household on Local Transportation $10,209.22 (n/a) Consumer expenditures per household on Gasoline $3,279.37 (n/a) Consumer expenditures per household on Vehicle maintenance and repair $1,351.90 (n/a)Consumer expenditures per household on Travel $2,869.18 (n/a) Consumer expenditures per household on Airline fares $756.32 (n/a) Consumer expenditures per household on Auto/Truck rental on trips $35.69 (n/a) Consumer expenditures per household on Lodging on trips $708.88 (n/a) Consumer expenditures per household on Food and drink on trips $668.13 (n/a) Consumer expenditures per household on Entertainment on trips $238.56 (n/a)
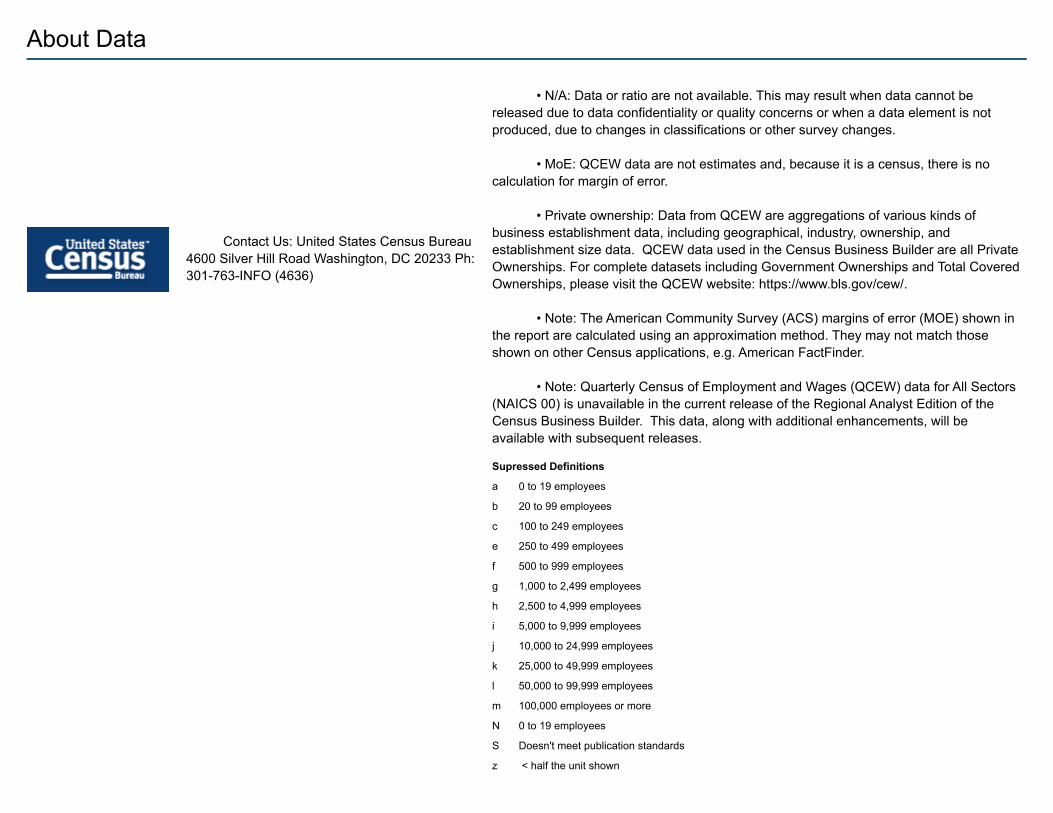
About Data
Contact Us: United States Census Bureau 4600 Silver Hill Road Washington, DC 20233 Ph: 301-763-INFO (4636)
• N/A: Data or ratio are not available. This may result when data cannot be released due to data confidentiality or quality concerns or when a data element is not produced, due to changes in classifications or other survey changes.
• MoE: QCEW data are not estimates and, because it is a census, there is no calculation for margin of error.
• Private ownership: Data from QCEW are aggregations of various kinds of business establishment data, including geographical, industry, ownership, and establishment size data. QCEW data used in the Census Business Builder are all Private Ownerships. For complete datasets including Government Ownerships and Total Covered Ownerships, please visit the QCEW website: https://www.bls.gov/cew/.
• Note: The American Community Survey (ACS) margins of error (MOE) shown in the report are calculated using an approximation method. They may not match those shown on other Census applications, e.g. American FactFinder.
• Note: Quarterly Census of Employment and Wages (QCEW) data for All Sectors (NAICS 00) is unavailable in the current release of the Regional Analyst Edition of the Census Business Builder. This data, along with additional enhancements, will be available with subsequent releases.
Supressed Definitions
a 0 to 19 employees
b 20 to 99 employees
c 100 to 249 employees
e 250 to 499 employees
f 500 to 999 employees
g 1,000 to 2,499 employees
h 2,500 to 4,999 employees
i 5,000 to 9,999 employees
j 10,000 to 24,999 employees
k 25,000 to 49,999 employees
l 50,000 to 99,999 employees
m 100,000 employees or more
N 0 to 19 employees
S Doesn't meet publication standards
z < half the unit shown