Embed Size (px)
Citation preview

Center for Economic Institutions
Working Paper Series
Center for Economic Institutions
Working Paper Series
Institute of Economic Research
Hitotsubashi University
2-1 Naka, Kunitachi, Tokyo, 186-8603 JAPAN
http://cei.ier.hit-u.ac.jp/English/index.html
Tel:+81-42-580-8405/Fax:+81-42-580-8333
No. 2012-11
“Household Vulnerability to Wild Animal Attacks in
Developing Countries: Experimental Evidence
from Rural Pakistan”
Takashi Kurosaki
Hidayat Ullah Khan
March 2013

1
Household Vulnerability to Wild Animal Attacks in Developing Countries:
Experimental Evidence from Rural Pakistan
March 2013
Takashi Kurosaki and Hidayat Ullah Khan*
Abstract: Based on a three-year panel dataset of households collected in rural Pakistan, we first quantify the extent to which farmers are vulnerable to attacks by wild boars; we then examine the impact of an intervention on households’ capacity to reduce related income losses. A local nongovernmental organization implemented the intervention as a randomized controlled trial at the beginning of the second survey year. This experimental design enabled us to cleanly identify the impact of the intervention. We find that the intervention was highly effective in eliminating the crop-income loss of treated households in the second year, but that effects were not discernible in the third year. The finding from the third year could be due to the high implicit cost incurred by the households in implementing the treatment. Regarding the impact of the intervention on a number of consumption measures, the difference-in-difference estimate for the impact on consumption was insignificant in the second year, but highly positive in the third year when estimated without other controls. A part of this consumption increase was because of changes in remittance inflows. The overall results indicate the possibility that treatment in the absence of subsidies was costly for households due to hidden costs, and hence, the income gain owing to the initial treatment was transient. JEL classification codes: O13, O15, Q12. Keywords: wild animal attack, agriculture, consumption, randomized controlled trial, Pakistan.
*Takashi Kurosaki is the corresponding author (Institute of Economic Research, Hitotsubashi University, 2-1 Naka, Kunitachi, Tokyo 186-8603, Japan. Phone: +81-42-580-8363; Fax: +81-42-580-8333; E-mail: [email protected]). Hidayat Ullah Khan ([email protected]) is at Kohat University of Science & Technology, Kohat, Pakistan. The authors are grateful to Pakistani Hoslamand Khawateen Network (PHKN) for helping them conduct the research and to Yutaka Arimoto, Katsuo Kogure, Yukichi Mano, and Takeshi Sakurai for their useful comments on earlier versions of this paper. Funding from a JSPS Grant-in-Aid for Scientific Research-S (22223003) and from the Center for Economic Institutions, Hitotsubashi University, is gratefully acknowledged. The views expressed in this paper are solely the authors’ and have no relation to those of PHKN or any funding agency.
2
1. Introduction Farmers around the world face various risks when they make a decision on agricultural
production. In low-income developing countries, research has been undertaken on household vulnerability to weather-related shocks, such as floods and droughts (Fafchamps, 2003; Dercon, 2005; Sawada, 2007). These studies have shown that poor households are likely to suffer not only from low levels of welfare on average, but also from fluctuations in their welfare due to their limited coping abilities and the vagaries of weather. As an intervention to cope with weather-related risks, there is now an expanding body of economics literature on weather index insurance (Binswanger-Mkhize, 2012; Cole et al., 2013).
In sharp contrast, farming risk stemming from wild animal attacks in developing countries has not been well analyzed in the literature by applied economists.1 This does not imply that such risk is not important; on the contrary, owing to the increased frequency of human–wildlife confrontation, farmers face the ever-growing risk of such attacks on their crops and subsequent income losses, as natural scientists have pointed out since the 1980s (e.g., Else and Lee, 1986; Naughton-Treves, 1998). Wild boars are universally notorious among wild animals and inflict substantial damage to crops. According to Chauhan et al. (2009), crop damages because of wild boar attacks (WBAs) have been reported for decades by farmers in the Indian subcontinent. However, the existing literature on WBAs mostly comprises technical reports, while ignoring the monetary and welfare aspects of agrarian households that have succumbed to WBAs.2 Furthermore, there is no economic research on the impact of an intervention that is specifically designed to reduce or cope with WBAs.
To fill the research gap, this study first quantifies the extent to which agricultural households in a developing country are vulnerable to WBAs; it then examines the impact of an intervention to enhance households’ capacity to mitigate income loss. A salient feature of this study is that it cleanly identifies the impact of the intervention through a randomized controlled trial (RCT) and the use of a three-year panel dataset of households. The RCT intervention was implemented at the beginning of the second year of the panel survey by a local nongovernmental organization (NGO) in rural Pakistan, where randomization was designed at the household level. The main component of the intervention was in human resource development (HRD). In the third year of the panel data, no intervention was conducted. To the best of our knowledge, none of the existing studies cleanly identifies the impact of HRD interventions on losses due to WBAs. As a result, the findings of this study are expected to add a new dimension to the existing literature on household vulnerability to the risk of wild animal attacks. 1 As an exceptional work in applied economics, Sutton et al. (2008) estimate the costs of living under the threat of wild animal attacks, using Namibian farmers’ willingness to pay. 2 See Khan (2013) for a reference list of these technical reports.

3
As a preview of the results, we found that the sample households did indeed face substantial risk with respect to WBAs. The attacks affected the crop income of 34% of the sample households, with the average damage equivalent to approximately 3% of the total annual consumption and 20% of self-produced food consumption. The HRD intervention was highly effective in eliminating the crop-income loss of treatment households in the second year, but its impact in the third year was indiscernible. The impact of interventions on a number of consumption measures was insignificant in the second year and significantly positive in the third year.
In the remainder of this paper, Section 2 describes the study area, data, and the RCT intervention by which to reduce WBAs. Section 3 proposes an empirical strategy to identify the impact of the intervention. Section 4 quantifies the incidence of WBAs among the sample households, as well as the impact of the intervention on crop-income loss. Section 5 assesses the intervention’s impact on household consumption. Section 6 concludes the paper.
2. Study Area, Data, and the RCT Intervention 2.1 Study Area and the NGO
Pakistan suffers from underdevelopment in terms of both economics and human development. For example, the United Nations Development Programme (UNDP; 2013) ranks Pakistan as the 146th of 185 countries in terms of its Human Development Index, with mean years of schooling at only 4.9 years and per-capita gross national income at USD 2,566 (in purchasing power parity dollars of 2005). Meanwhile, Pakistan’s economy is highly dependent on agriculture: in terms of value added, approximately 21% of GDP originates in agriculture; meanwhile, in terms of employment, approximately 45% of the labor force is absorbed by agriculture (Government of Pakistan, 2012). Given this dependence on agriculture, wild animal attacks pose a potential risk to the national economy and the rural population alike.
Given the Pakistani government’s failure to deliver basic services to the nation—and especially to the poor—NGOs have been intervening and providing such services. Several of them have adopted community-based development (CBD) approaches since the 1990s. To analyze the impact of such NGOs and identify the conditions underlying their success or failure, in 2010, we began a study on an NGO called the Pakistani Hoslamand Khawateen Network (PHKN), which has its headquarters in District Haripur of Khyber Pakhtunkhwa (KPK).3
PHKN intervenes in areas of microfinance, HRD training, micro infrastructure projects, and the like. In providing these services, PHKN adopts a CBD approach, under which
3 Pakistan is a federal state comprising four provinces, with the district as the basic unit of local administration under the province. Khyber Pakhtunkhwa (KPK) is one of those four provinces, formerly known as the North-West Frontier Province (NWFP). In April 2010, the constitution of Pakistan was amended and the former NWFP was renamed Khyber Pakhtunkhwa.
4
dwellers of a village or rural community are organized into community-based organizations. In the case of PHKN, such organizations are called community organisations (COs). COs are organized before any kind of intervention takes place in a village. Owing to social and cultural constraints, there are separate COs for males and females. Each CO has 16–40 members. Almost three-quarters of its COs are run by women. A unique characteristic of PHKN is that it is led by a woman and managed by an executive board comprising mostly women, and it undertakes activities focused on women. Such NGOs are rare in the context of the male-dominated society of Pakistan.
2.2 Data During September–December 2010, we implemented a three-tier survey as the
benchmark; the three tiers are villages, COs, and households. Khan et al. (2011) describe the three-tier benchmark survey in detail. The benchmark village survey was designed as a census survey to cover all villages that were (potential) target areas of PHKN. We gathered 105 observations of villages, of which 99 are located in District Haripur. In the CO benchmark survey, we successfully collected information from all 90 COs registered with PHKN; all 90 COs were located in District Haripur. In the household benchmark survey, three types of households were randomly chosen: (i) those who have been members of PHKN activities, (ii) nonmember households living in villages with COs (CO villages), and (iii) households living in villages where no CO exists (non-CO villages). The total size of the sample is 583, classified into 249 member households, 234 nonmember households in CO villages, and 100 nonmember households in non-CO villages. The population we intend to represent with the household data is that of rural households living in Haripur District that are potential targets of PHKN (those households excluding the rich).
After a year, during November–December 2011, we resurveyed the same sample households and collected village-level information from the villages having these resurveyed households. Due to refusal or nonavailability, 12 households were not resurveyed in the second round, and 2 households changed their membership status. In the resurvey, the 12 attrition households were replaced by 12 households, which were randomly chosen from the same household category to which the attrition households belonged.
After another year, during November–December 2012, we implemented the third round of the household survey. All the 583 households that were covered in the second round were resurveyed successfully in the third round. Therefore, from these three rounds of surveys, we compiled a balanced panel dataset of 569 households. The attrition or change of membership status does not affect the main analysis in this study, because we use the subset comprising the “eligible” households (see below) and there was no attrition in the subset. The dataset includes

5
detailed information on household characteristics; consumption expenditures, including the imputed cost of in-kind transactions; assets and credit access; involvement in PHKN and government welfare activities; and crop losses attributable to WBAs, inter alia. Information on crop-income loss as recalled by respondents was collected using a structured questionnaire. To compare monetary variables measured in Pakistan rupees (PKR) across three rounds of surveys in real terms, we deflated these variables from the resurvey and the third-round survey, using the official statistics of consumer price indices (Government of Pakistan, 2012).4 Therefore, all monetary variables are denoted in 2010 prices.
2.3 Descriptions of the RCT Intervention Presently, farmers in KPK frequently report incidents involving WBAs. The attacks
cause immense damage to crops, grasslands, and soil. Local agriculture and wildlife experts consider the loss of the wild boars’ natural habitat to be the root cause of WBAs. WBAs are at their peak frequency during the summer season, particularly at harvest time. Cereal crops—especially maize and wheat—are vulnerable to WBAs. Nothing can be salvaged of a farm’s crops once it is attacked by wild boars; the leftover crop cannot even be used as livestock fodder. As a result, crop losses owing to WBAs constitute not only a loss of grain for self-consumption and of buffer stock used to manage liquidity crisis; it also represents a loss of livestock fodder for use in the dry seasons. Because the main damage due to WBAs is the lost output of crops including fodder, the damage is short-term in nature. Villagers in the region once implemented basic techniques for scaring or trapping wild animal herds, but this knowledge has been lost in recent years, as villagers regarded the techniques obsolete and useless.
PHKN has observed news of widespread crop losses owing to WBAs and carefully reviewed the needs of its CO members for remedial action. Given the WBA information collected through the household benchmark survey, PHKN was able to convince donors and all stakeholders to fund this remedial action.
With the help of the district’s agriculture and livestock departments, PHKN designed a pilot version of the Anti-WBA Program (AWBAP). The main objective of this program was to prevent WBAs and subsequent crop-income losses. The program comprises HRD training that focuses on the awareness and prevention of WBAs. The prevention component of the program imparts information on basic techniques for scaring or trapping animals and for curtailing boar-population growth.5 Moreover, under the program, some basic equipment and animal
4 This is unsatisfactory, because the official inflation figures in Pakistan are notoriously underestimated, and there could be heterogeneous inflation across villages and household types. The use of more precise and disaggregated inflation rates is left for future research. 5 Drugs are used in the long term to control the boar population. It is claimed that female boars lose their fertility after consuming the drugs; however, the efficacy of the drugs has not yet been established.

6
drugs were provided free of charge to the treated households, upon the successful completion of training.6 The average direct cost of AWBAP treatment per household was around PKR 6,000,7 of which about one-third is the recurrent cost of equipment and drugs.
However, the funding was not sufficient to treat all households who reported crop losses due to WBAs. Therefore, to ensure equal treatment ex ante, PHKN decided to randomize the treatment. According to the household benchmark survey, 197 of the 583 households had reported WBAs (henceforth referred to as “eligible households”). PHKN selected 55 of the eligible households, using a random luck draw. We refer to these 55 households below as the “treatment households”; we call the remaining 142 eligible households not given treatment “control households.” In typical situations, the CBO approach does not allow nonmembers to be treated with any PHKN intervention. In the case of the AWBAP, however, nonmembers were also included but with a lower rate of being selected through the luck draw, owing to PHKN policies and donor restrictions.
The 55 treatment households are distributed as follows: 48 member households, 3 nonmember households in CO villages, and 4 nonmember households in non-CO villages. As the randomization was implemented at the household level, the number of treatment households in a village differed. Across villages, the eligible households spread over 30 villages—of which, 19 villages had at least one treatment household. Among the 19 villages with treatment households, the number of such households in the village is distributed as follows: 1 household in 8 villages; 2 households in 4 villages; 3 households in 3 villages; and 3, 6, 8, and 12 households in one village each. The villages with more than five treatment households were large villages with several wards within. Village-level variation with respect to the number of treatment households will be utilized in our empirical analysis to examine the spillover effects of the AWBAP. Household-level variation with respect to PHKN membership will be utilized to examine the possibly differential impact of member status.
The selected households were contacted in a telephone call about their participation in HRD training under the AWBAP. However, the theme and details of the program were not disclosed to participants until they actually attended the training sessions. The AWBAP was an intervention comprising HRD training, and hence, participants were given neither income transfers nor credit. The program was implemented in February–March 2011. All selected households completed all training sessions. Hence, the AWBAP has zero noncompliance, which
6 According to Chauhan et al. (2009) and Hone and Ackison (1983), fencing is an effective way of mitigating crop damage because of WBAs. However, it is a costly technique; it is also not suitable for the RCTs that have a potentially higher spillover effect among the control group. Furthermore, such a technique does not fall under the purview of HRD training. For these reasons, fencing was not included as a component of the AWBAP. 7 USD 1.0 = PKR 91 at the time of intervention; hence, the direct cost per household was around USD 70.
7
implies that the intent to treat impact equals the treatment on the treated impact. Figure 1 summarizes the process by which the AWBAP treatment and our three rounds
of surveys took place. The main objective of the AWBAP was to eliminate crop losses in the 2011 kharif crops that would be sown in June–July 2011 and harvested in September–October 2011. Therefore, the data on crop-income loss in the resurvey of November–December 2011 would fully reflect the AWBAP impact. On the other hand, it is possible that our measures of annual consumption in the resurvey (the 2011 consumption measures) may not reflect the full impact of the AWBAP. This is due to our survey design: in our three rounds of household surveys, we gathered information on consumption on a recall basis, with reference periods for food consumption items in the week preceding the survey, and for nonfood consumption items in the 12 months preceding the survey. From this detailed data, we compiled the annual consumption as the sum of (1) the sum of expenditures over items listed in nonfood consumption and (2) the sum of expenditures (including the imputed values of in-kind transactions) over items listed in food consumption, multiplied by 52 (weeks per year). In using this data compilation procedure, it is possible that not all of the impact of the AWBAP that is attributable to the crop-income loss reduction in 2011 is captured by the 2011 consumption measures; some of the impact may be captured by the 2012 consumption measures.
2.4 Balance Check
In Table 1, we compare treatment and control households. This comparison shows that in most cases, the difference between the means of the two sets of households is statistically insignificant. Especially when we look at variables corresponding to housing conditions, demographics, household asset indicators, cash inflows and outflows, and income loss due to WBAs, the difference is both small in terms of magnitude and statistically insignificant. Therefore, we can safely claim that the randomization process resulted in two almost similar sets of households, and that there is no systematic observable difference between them. Any difference observed in any of variables between the benchmark and later surveys can be safely attributed to the impact of the AWBAP.
One concern in Table 1 is that all five consumption measures have higher average values among control households than among treated households. The difference was statistically significant at the 5% level for food consumption and in-kind food consumption. As we implemented the randomization strictly, we assess this finding as a chance occurrence. However, since consumption is the endogenous variable for which we measure the impact of the AWBAP, to be safe, we control the imbalance in benchmark observations by using a double difference, rather than a single difference, as our main empirical specification (see Section 3 below).
8
On the other hand, although not important to the internal validity of our RCT, eligible households were not similar to noneligible households (Khan, 2013). For example, eligible households’ land holdings were five times larger than were those of noneligible ones; these households had an unpaid consumption level that was twice that of noneligible households and had slightly larger family sizes than did noneligible households. Eligible households closely resemble a typical Pakistani farm household. This is as expected, eligible households were not a random subset of the whole sample. The set of eligible households comprises farm households only, while the whole sample includes a large number of nonfarm and/or landless households. This implies that the internal validity of our RCT applies only to the subset of eligible households, and not to the whole sample of households in our dataset. In other words, the population we intend to represent through the AWBAP impact analysis comprises agricultural households living in Haripur District that are not affluent and are (potentially) susceptible to WBAs.
3. Empirical Strategy We first plot the distribution of crop-income loss due to WBAs and the total household
consumption differentiated by the survey year and treatment status. This allows us to undertake a graphical investigation of the AWBAP impact.
As the graphical perusal may have limited power in determining differentiated change, we turn to microeconometrics.8 For econometric analyses, we use the subsample of eligible households, because noneligible and eligible households are systematically different, while control and treatment households within the subset of eligible households are not. The basic model is specified as:
Yit = bi + b10T2011 + b11T2011×Xi + b20T2012 + b21T2012×Xi + uit, (1) where Yit is the crop-income loss due to WBAs, or a measure of household consumption for household i in period t; bi is the household fixed effect; T2011 is a dummy variable for the resurvey data; Xi is a dummy variable that represents the AWBAP treatment, and it takes a value of 1 if the household is in the treatment group; T2012 is a dummy variable for the third-round survey data; and uit is a zero-mean error term. Two coefficients on the interaction terms between Xi and Tt, b11 and b21, are the double difference (difference-in-difference, or DID) estimators for the treatment impact. If the AWBAP in early 2011 resulted in higher consumption in year 2011 than in 2010, the coefficient b11 should be positive and significant; if the intervention resulted in
8 As the household data were collected using villages as the primary sampling unit (Khan et al., 2011), we use in all regressions robust standard errors clustered at the village level.

9
higher consumption in year 2012 than in year 2010, the coefficient b21 should be positive and significant. In terms of crop-income loss due to WBAs, the expected sign is reversed.
If randomization is implemented properly and the resulting two groups are completely similar in the statistical sense, ex post, then the use of a single-difference estimator that compares the treatment and control groups will suffice in identifying the AWBAP impact. As suggested through the balance check test, however, the consumption of the control households was slightly higher than that of treatment households, ex post, despite the fact that we had implemented the randomization properly. Therefore, as our main specification, we employ the DID specification, which allows for potential nonrandomized elements conditional on household fixed factors.
To examine whether the intervention had a spillover effect on neighbors who were not treated directly, the basic specification is extended to distinguish control households living in villages where some households had been treated with the AWBAP from control households living in villages where no household had been treated with the AWBAP. Using the latter as the reference category, the basic model is extended as:
Yit = bi + b10T2011 + b11T2011×Xi + b12T2011×Xv
i + b20T2012 + b21T2012×Xi + b22T2012×Xvi + uit, (2)
where Xv
i is the dummy variable for a control household that lived in a village where there was at least one treatment household.
Theoretically, the spillover effect could be positive or negative. If control households living in a village with treatment households learn from those treatment households (social learning), a positive spillover effect on income and consumption is expected. Furthermore, if wild boars avoid a village where some households are implementing the AWBAP treatment (positive externality), a positive spillover effect on income and consumption is expected. On the other hand, if wild boars change their target plots within a village—thus going from attacking plots protected by the AWBAP treatment to unprotected plots (negative externality)—a negative spillover effect on income and consumption is expected. Thus, whether b12 and b22 are positive or negative is an empirical question. If the null hypothesis that b12 = b22 = 0 is not rejected, equation (2) is reduced to equation (1).
Equation (1) can be extended in other directions as well, allowing for a heterogeneous impact among treatment households. Let Di be the dummy variable for the subcategory of treatment households. Then we estimate:
Yit = bi + b10T2011 + b11T2011×Xi +b’11T2011×Xi×Di
+ b20T2012 + b21T2012×Xi +b’21T2012×Xi×Di + uit. (3)
10
We will attempt to distinguish treatment households in terms of PHKN membership status (Di = 1 if the treatment household is a nonmember of PHKN)9 and 2010 flood damage (Di = 1 if the treatment household was severely hit by the 2010 floods).10 If the null hypothesis that b’11 = b’21 = 0 is not rejected, equation (3) is reduced to equation (1).
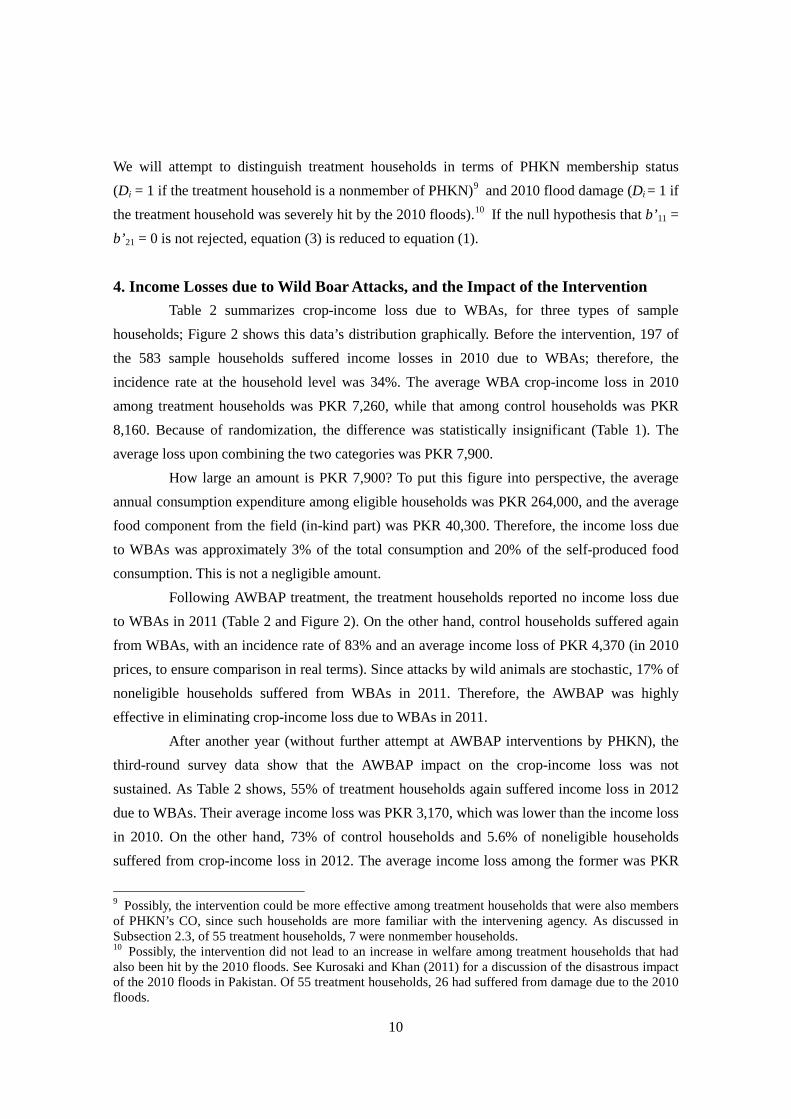
4. Income Losses due to Wild Boar Attacks, and the Impact of the Intervention Table 2 summarizes crop-income loss due to WBAs, for three types of sample
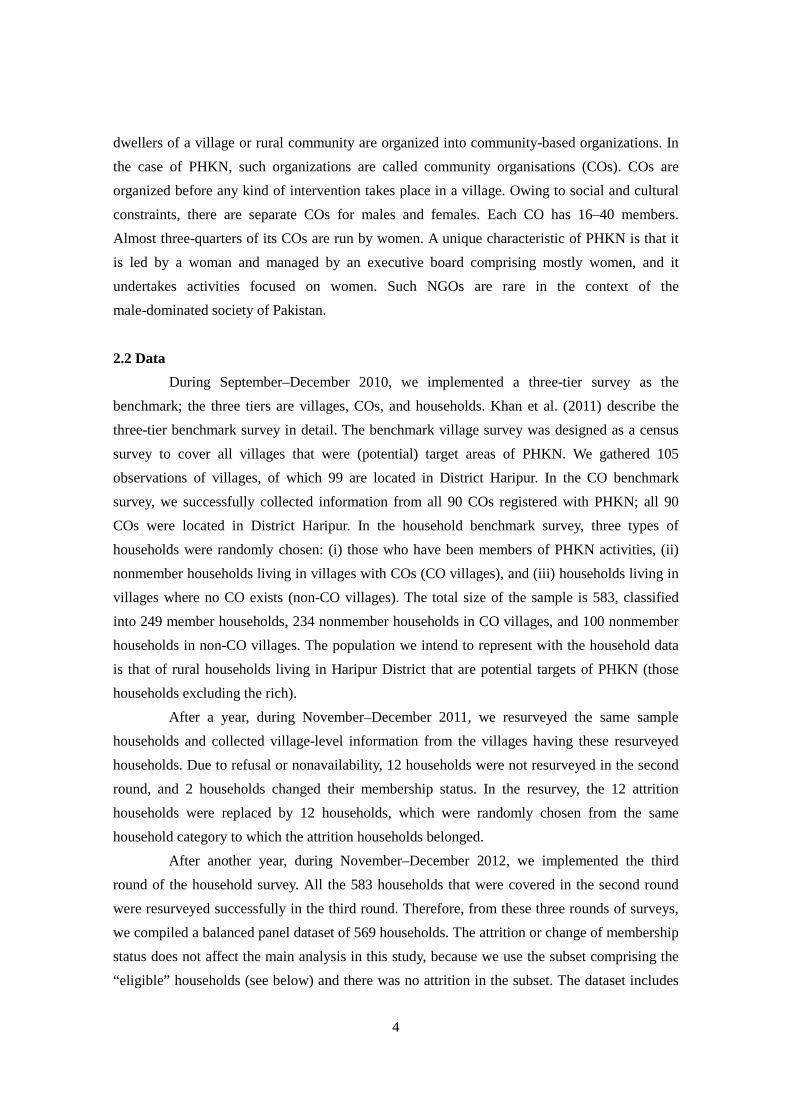
households; Figure 2 shows this data’s distribution graphically. Before the intervention, 197 of the 583 sample households suffered income losses in 2010 due to WBAs; therefore, the incidence rate at the household level was 34%. The average WBA crop-income loss in 2010 among treatment households was PKR 7,260, while that among control households was PKR 8,160. Because of randomization, the difference was statistically insignificant (Table 1). The average loss upon combining the two categories was PKR 7,900.
How large an amount is PKR 7,900? To put this figure into perspective, the average annual consumption expenditure among eligible households was PKR 264,000, and the average food component from the field (in-kind part) was PKR 40,300. Therefore, the income loss due to WBAs was approximately 3% of the total consumption and 20% of the self-produced food consumption. This is not a negligible amount.
Following AWBAP treatment, the treatment households reported no income loss due to WBAs in 2011 (Table 2 and Figure 2). On the other hand, control households suffered again from WBAs, with an incidence rate of 83% and an average income loss of PKR 4,370 (in 2010 prices, to ensure comparison in real terms). Since attacks by wild animals are stochastic, 17% of noneligible households suffered from WBAs in 2011. Therefore, the AWBAP was highly effective in eliminating crop-income loss due to WBAs in 2011.
After another year (without further attempt at AWBAP interventions by PHKN), the third-round survey data show that the AWBAP impact on the crop-income loss was not sustained. As Table 2 shows, 55% of treatment households again suffered income loss in 2012 due to WBAs. Their average income loss was PKR 3,170, which was lower than the income loss in 2010. On the other hand, 73% of control households and 5.6% of noneligible households suffered from crop-income loss in 2012. The average income loss among the former was PKR
9 Possibly, the intervention could be more effective among treatment households that were also members of PHKN’s CO, since such households are more familiar with the intervening agency. As discussed in Subsection 2.3, of 55 treatment households, 7 were nonmember households. 10 Possibly, the intervention did not lead to an increase in welfare among treatment households that had also been hit by the 2010 floods. See Kurosaki and Khan (2011) for a discussion of the disastrous impact of the 2010 floods in Pakistan. Of 55 treatment households, 26 had suffered from damage due to the 2010 floods.
11
5,080, which is lower than that in 2010. To cleanly identify the impact of the AWBAP on crop-income loss, equation (1) is
estimated (see column 1, Table 3). The DID impact in 2011 (the follow-up survey) is substantial, and statistically significant at the 1% level. The treatment households were able to reduce the loss by PKR 3,473. As there was no crop-income loss among treatment households in 2011 (i.e., no statistical variation), the DID impact is likely to be an underestimate. This is because the crop-income loss cannot be negative. For those treated with the AWBAP and having sustained an initial loss of PKR 5,000, for example, the observed reduction in crop-income loss was PKR 5,000. However, if their initial loss had been PKR 10,000 instead, the observed reduction could have been PKR 10,000, rather than PKR 5,000. The single difference impact can be calculated from column 1, Table 3 as PKR 7,260 (that is, (3.787 + 3.473) × 1,000). It could be possible that this single difference estimate is still an underestimate, for the same truncation reason. To be conservative, we set our estimate of the AWBAP impact on crop-income loss reduction in 2011 as being in the range of PKR 3,500–7,300. This indicates that if the impact was around PKR 7,300 and there was no implicit cost inherent in the AWBAP implementation, the AWBAP was cost-effective, as its direct cost per household was approximately PKR 6,000. If other indirect costs existed for PHKN or for the treatment households—or if the impact on crop-income loss were around PKR 3,500—the AWBAP could not be considered cost-effective.
On the other hand, column 1, Table 3 shows that the DID impact in 2012 (the third-round survey) was no longer significant. Although its point estimate shows that each treatment household’s income loss was PKR 1,000 smaller than that of control households, this difference is statistically insignificant. This finding seems to suggest that treatment households had difficulty in implementing the AWBAP measures strictly during 2012, in the absence of PHKN interventions. In other words, one-shot HRD training to reduce WBAs were not permanently effective. One of the reasons for this failure among treatment households could be the difficulty in obtaining the necessary drugs. However, since the nominal cost of the drugs is small, this reason is not likely to be important. Another reason could be that either there existed a nonnegligible implicit cost of implementing the AWBAP treatment (such as labor or effort), or that treatment households were not able to master the treatment technique to the extent that they could implement it without the help of PHKN.
Another interesting feature of column 1, Table 3 is that the coefficients on the time dummies (b10 and b20) are both highly negative and statistically significant. In other words, the whole set of eligible households, regardless of their treatment status, suffered less from WBAs in 2011 and 2012 than in 2010. This could be due to the positive externality of the treatment on wild boars—that is, the animals avoided the whole area because some of the villages there had been implementing the AWBAP treatments in early 2011. This interpretation assumes that wild

12
boars’ area of activity is wider than a district. At the same time, a part of the negative coefficient in 2011 could be explained by the stochastic nature of wild boar behavior. As the eligible households were defined as those that had suffered from WBAs in 2010, it is possible that their loss would have been smaller without any intervention in 2011, if the animals tended to choose plots for attack in a stochastic manner. To examine these possibilities further is beyond the scope of this study, as such an examination is in the realm of animal science, not economics.
Regarding the potential positive externality of the AWBAP, column 2, Table 3 shows the regression results of equation (2). Coefficient estimates for b12 and b22 are positive, indicating that control households tended to suffer more from WBAs if they lived in a village where other households were treated than if they lived in a village without any AWBAP treatment. This suggests negative externality within the village (i.e., the animals stop targeting plots owned by treatment households and turn to plots owned by control households), and that both positive externality and social learning were weak. However, the two coefficients have large standard errors so that the null hypothesis—that b12 = b22 = 0—is not rejected (see the last row of Table 3).
Regarding potential heterogeneity among treatment households, columns 3 and 4, Table 3 show the estimation results of equation (3). In all cases, the additional coefficients are small and statistically insignificant. The null hypothesis that b’11 = b’21 = 0 is not at all rejected (see the last row of Table 3). Therefore, the AWBAP impact on crop-income loss reduction is homogenous, with there being no difference, regardless of the treatment household’s PHKN membership or the extent of 2010 flood damage.
The results reported in Table 3 are robust to other alterations.11 For instance, we attempted to use the dummy variable for crop loss instead of the income loss amount in PKR as the dependent variable; we also tried replacing Xvi in equation (2) with the number of treatment households in the village that had interacted with the control household dummy, and we tried other definitions of Di in equation (3). The results were qualitatively similar to those reported in Table 3. Therefore, we regard column 1, Table 3 as our best estimate for the AWBAP impact; we conclude that the positive AWBAP impact occurred only in 2011, and that there was no significant spillover effect within a village, as far as crop-income losses due to WBAs are concerned.
5. Impact of the Intervention on Household Consumption Did the significant income gain in 2011—thanks to effective intervention—result in
higher welfare levels among the treated households? To address this question, this section examines the AWBAP’s impact on household consumption. This is because consumption is the
11 The robustness check results are available upon request from the authors.

13
summary statistics that reflects the welfare level of a household and is associated with its permanent income level.
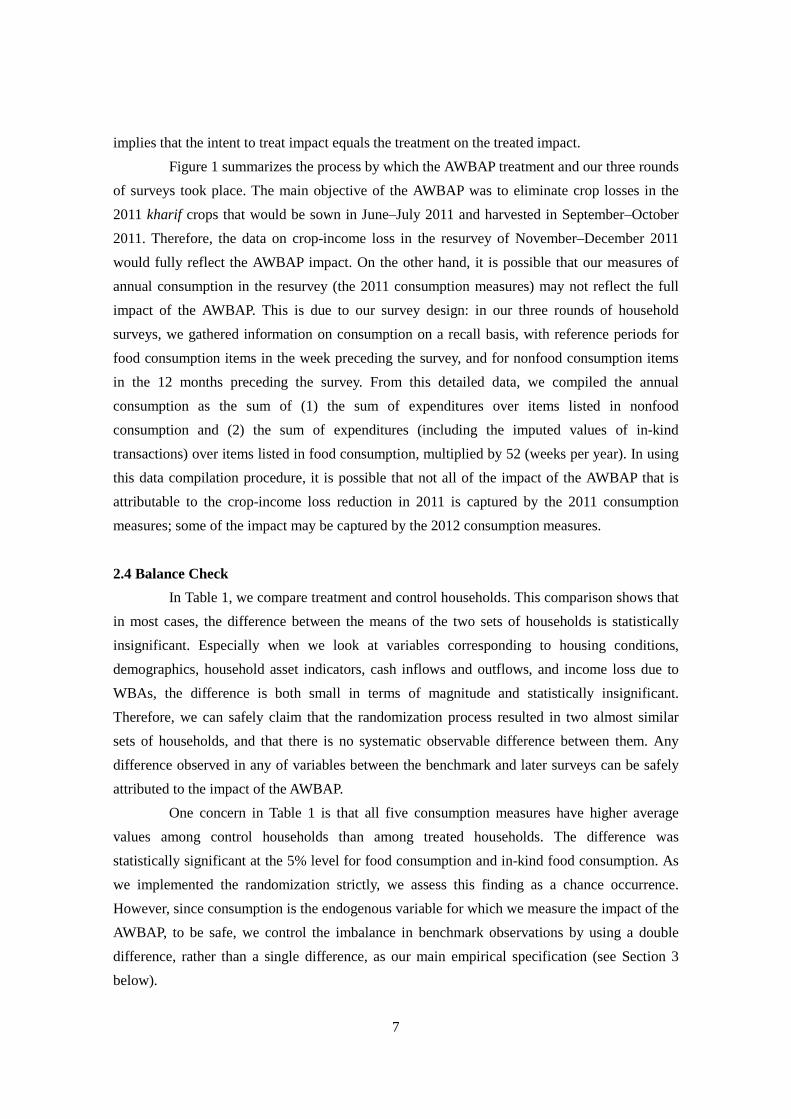
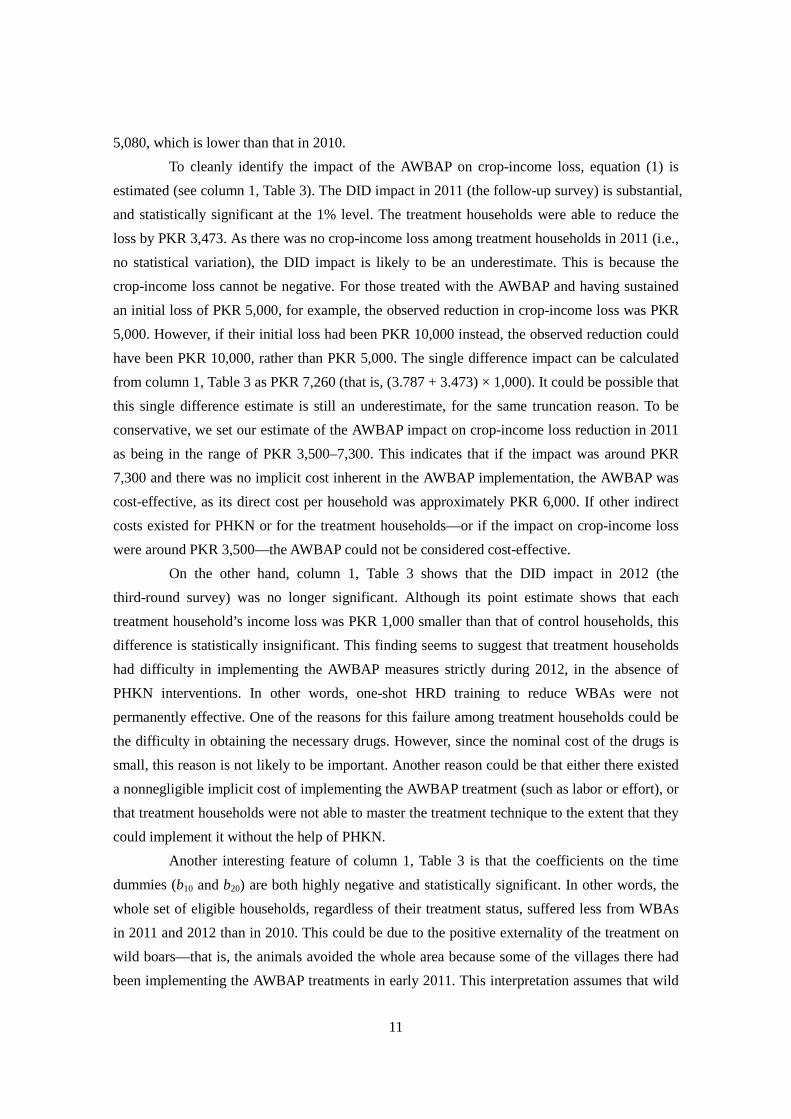
5.1 Basic and Extended Results We first plot in Figure 3 the distribution of total consumption, differentiated by survey
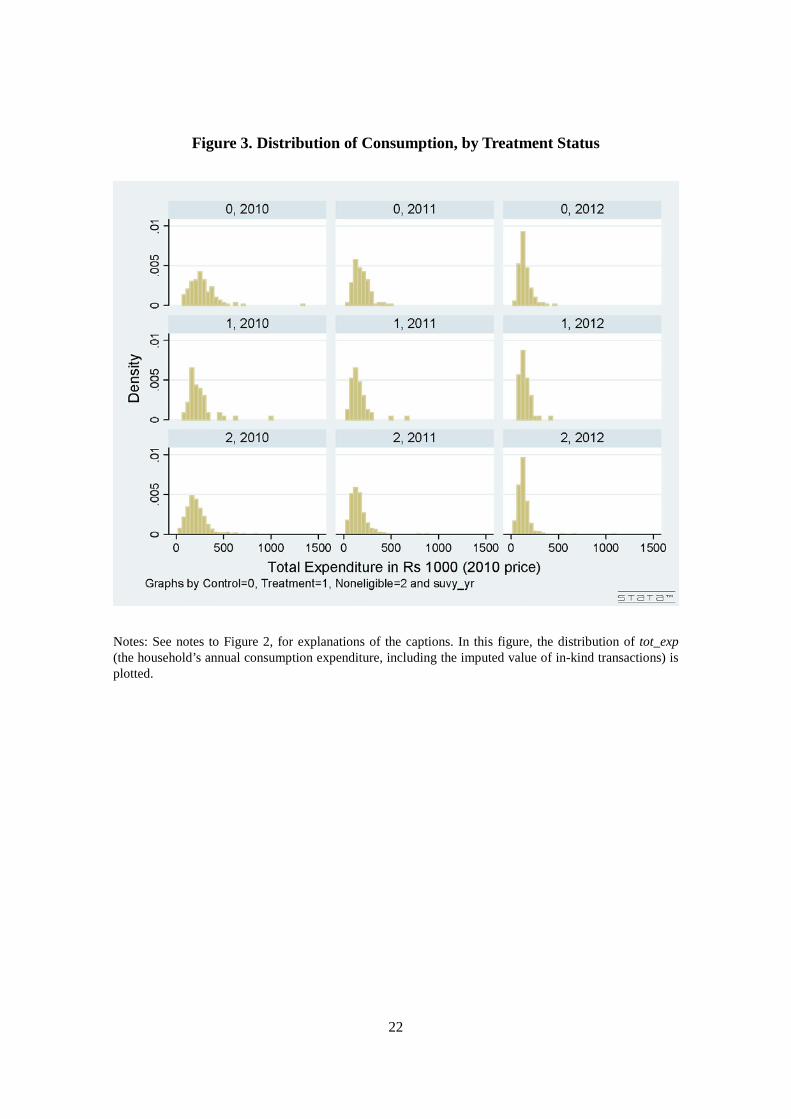
year and treatment status. In sharp contrast to Figure 2, Figure 3 appears to show no difference between treatment and control households. Both household types experienced a decline in overall consumption. The decline in consumption was attributable to macro-level shocks, including food-price hyperinflation during the posttreatment period that hit the study region (Khan, 2013). In response to the aggregate shocks, the sample households on average reduced their expenditures on luxury consumption items and shifted from high-quality to low-quality food items. The change over three years among noneligible households was similar to the change among treatment and control households.
In estimating equation (1), we use four measures of household annual consumption as the dependent variable Yi: total expenditures (tot_exp), per-capita expenditures (exp_pc), food expenditures (exp_food), and nonfood expenditures (exp_nonfd). All of these are direct measures of household welfare, but each captures a slightly different aspect. For instance, tot_exp is the best welfare measure if most of the household consumption items are public goods within the household; meanwhile, exp_pc is the best welfare measure if most of the household consumption items are private goods within the household (Deaton, 1997). Food expenditures (exp_food) are the most urgent concern for the poorest households, while nonfood expenditures (exp_nonfd) matter for welfare enhancement among other households. The estimation results are reported in Table 4. In three of the four specifications, the follow-up DID coefficients are positive, but none of them is statistically significant. After another year, all four of the third-round DID coefficients are positive, and two of them are statistically significant. For the case of food expenditure, the significance level is higher (p-value = 0.002). The coefficient shows that treatment households reduced their food consumption in 2012 by an amount PKR 26,400 less than control households did (a positive impact on food consumption with the magnitude of PKR 26,400). As described in Subsection 2.3, due to the reference period definitions, it is possible that not all of the impact of the AWBAP attributable to the crop-income loss reduction in 2011 is captured by 2011 consumption measures; some of the impact may be captured by 2012 consumption measures. The results in Table 4 appear to suggest that this is indeed the case. The treatment households mostly stored the grains saved from WBAs in 2011 and enjoyed their consumption mostly in 2012. If this interpretation is correct, the consumption level of the treatment households will become indistinguishable from that of the control households in 2013, because the crop-income loss reduction effect of the
14
AWBAP almost disappeared in 2012, as shown in the previous section. Regarding the potential externality of the AWBAP, panel A of Table 4 shows the
regression results of equation (2). The coefficient estimates for b12 and b22 are all statistically insignificant, and the null hypothesis that b12 = b22 = 0 is not rejected. Therefore, we observe no significant spillover effects on consumption. Panels B and C of Table 4 show the regression results of equation (3). Again, in all cases, the additional coefficients are individually insignificant. However, when the dependent variable is per-capita expenditure and the heterogeneity is with respect to PHKN membership, the homogeneity hypothesis is rejected at the 5% level. As coefficients on the additional dummy interactions are all negative in panel B, it is suggested that the AWBAP impact on consumption is mitigated if the treatment is given to households that were not PHKN members. As the power of this test is weak (recall that the number of nonmember treatment households is only seven), we regard this as weak evidence, for which further testing is needed.
The results reported in Tables 4–5 were robust to other alterations.12 As before, we replaced Xvi in equation (2) with the number of treatment households in the village that had interacted with the control household dummy, and we tried other definitions of Di in equation (3). The results were qualitatively the same as those in Tables 4–5. Therefore, we conclude that there is the possibility that the AWBAP resulted in higher consumption expenditures, especially with respect to food, in 2012.
5.2 Explaining the Over-response in 2012
One puzzle arising from Table 3 is a seeming over-response of consumption in 2012 to the AWBAP. As discussed in Section 4, our best estimates of the AWBAP’s impact on crop-income loss reduction in 2011 are in the range of PKR 3,500–7,300 per household. Even if the treatment households perceived this income increase as a permanent change, the consumption level would increase by a similar amount at the most; under typical circumstances, by an amount smaller than the gain in income, on the basis of the standard permanent income hypothesis (Deaton, 1992). Nevertheless, Table 4 shows that food consumption increased by PKR 26,400 in 2012 (significant at the 1% level), resulting in a total consumption increase with a point estimate of PKR 32,600 (significant at the 10% level). Even considering the lower bound of the 95% confidence interval (PKR 10,700; PKR 42,200) of the DID impact on food consumption in 2012, the estimates in Table 4 appear to constitute a substantial over-response. What could be at work here?
One of the reasons for this over-response could be remittance. The rural economy in the study area is highly dependent on remittances from villagers who work in cities in Pakistan
12 The robustness check results are available upon request from the authors.

15
or outside Pakistan. As shown in Table 1, the average remittance inflow among control households was PKR 83,300, and that among treatment households was PKR 47,300; the difference was significant only at the 15% level (p-value = 0.148). In the field, we observed that the amount of remittance inflow declined over the three-year period on average, but the decline was smaller among treatment households. Our data show that from 2010 to 2011, the remittance amount declined among control households by PKR 20,100 on average, while it increased among treatment households by PKR 42,000 on average. If there is a lag of consumption to the inflow of remittance in the study area, this inflow of remittance into the treatment households could be one of the reasons for the large AWBAP impact, as seen in Table 4.
To confirm this observation, we estimate equation (1) using the receipt of remittance (PKR 1,000 in 2010 prices) as the dependent variable. The estimation result is reported in column 1, Table 6. The follow-up DID coefficient is large (PKR 62,100) and statistically significant; the third-round DID coefficient, meanwhile, is positive (PKR 39,300) but statistically insignificant. As we randomized the AWBAP, one interpretation of column 1, Table 6 is that the AWBAP caused remittances to increase. Under this interpretation, the AWBAP response shown in Table 4 is not an over-response, but a genuine impact reflecting both direct impact through reduced crop income and indirect impact through increased remittance. In the field, we observed an instance where a treatment household received more remittance in 2011 after the AWBAP treatment, as the sender had become more confident that the remittance money would be used for more productive investment purposes. This anecdote suggests the rationale of how the AWBAP could have caused remittances to increase; in this way, the household consumption level increased by an amount much larger than the saved crop income, thanks to the AWBAP.
At the same time, however, theoretically speaking, the endogenous response of remittance to the AWBAP’s success in reducing crop-income loss could go in the opposite direction.13 If remittance is motivated by altruism, remittance for nonproductive purposes is likely to decline if the receipt household’s income position improves. When this effect dominates, the AWBAP should reduce the remittance receipt.
As we do not have good instrument variables to control for the endogeneity of remittance, we cannot test which scenario best explains our data. Instead, we re-estimate equation (1) conditional on the observed changes in remittance receipts, treating the observed values of remittance receipts as exogenous. As our sample size is small (only 55 treatment households), some unexpected shocks to remittance to some of the treatment households could lead to the results shown in column 1, Table 6. In other words, it is possible that the DID coefficients shown in the column are not the causal impact of the AWBAP on remittance, but
13 See, for example, Lucas (2005) for a survey of the theoretical and empirical literature on remittance.

16
the result of mere chance. If this is the case, we should control for remittance variables, to infer the causal impact of the AWBAP on consumption. In columns 2–5, Table 6, we report the regression results for equation (1), extended with three variables that capture the impact of remittance on consumption: the level of remittance receipt in each year, the lagged change of remittance from 2010 to 2011, and the interaction between the lagged change and the AWBAP treatment dummy. The results show that all eight DID coefficients are statistically insignificant at the conventional level. The 2012 DID coefficient in the food expenditure (exp_food) regression is PKR 14,300, much smaller than the amount suggested in Table 4. The coefficient is statistically significant at the 15% level (p-value = 0.102), so that it is consistent with the AWBAP impact on the crop income, which is in the order of PKR 3,500–7,300.
The direct impact of the AWBAP on consumption within this range is further confirmed by additional regression analysis, using the imputed value of food consumption in kind as the dependent variable for equations (1)–(3). This is also a robustness check regarding the way we evaluated in-kind consumption—mostly the household consumption of food produced by themselves. The results so far might have been affected by the (inappropriate) aggregation of consumption measures, in which the market-based components and self-produced, unpaid food consumption items were added, using shadow prices. If food markets are imperfect—bearing high transaction costs or large price volatility, for example— in-kind consumption should behave differently from market-based consumption expenditure, and food security concerns may affect the income-generation decisions of households (Kurosaki and Fafchamps, 2002). In our context, if food markets are highly imperfect—which could be possible, considering the subsistence nature of our study area—households who initially suffered a loss to their food due to WBAs but who reduced the loss thanks to the AWBAP should increase the amount of food consumption by the saved amount of the food they produce.
For these reasons, we replace the dependent variable for equations (1)–(3) with the households’ unpaid consumption. Under the condition of imperfect food markets, the DID impact will closely follow the direct AWBAP impact on crop-income loss when we use the alternative consumption measure. Table 7 reports the regression results. The 2011 DID coefficients are estimated with large standard errors, so that they are far from being statistically significant. On the other hand, the 2012 DID coefficients are mostly estimated at around PKR 8,000 and are marginally significant (p-values range from 0.075 to 0.233). The point estimate at around PKR 8,000 is consistent with the direct AWBAP impact on crop income, which is in the order of PKR 3,500–7,300. This suggests that the study area is characterized by some friction in the food markets, so that treatment households’ in-kind food consumption in 2012 changed by an amount similar to the saved crop-income loss due to the AWBAP in 2011.

17
6. Conclusion This study examined household vulnerability to wild animal attacks—an unexplored
source of production risk to agricultural households in developing countries—and the impact of an intervention to reduce their damage on crops. Based on a three-year panel dataset of households collected in rural Pakistan, we first quantified the extent to which farmers were vulnerable to attacks by wild boars prior to the intervention. We found that the attacks affected the crop income of 34% of the sample households, with the average extent of damage equivalent to approximately 3% of the total annual consumption and 20% of the self-produced food consumption.
We then examined the impact of a randomized intervention to enhance the households’ capacity to reduce income loss. The intervention was implemented in the early months of the second year. We found that the intervention was highly effective in eliminating the crop-income loss of treated households in the second year, but that the effect on these households was not discernible in the third year. The finding from the third year could be due to the high implicit cost for households to implement the treatment, in the sense that there existed a nonnegligible implicit cost of treatment implementation,14 or the treatment households were unable to master the treatment technique to the extent that they could implement it without agency assistance.
Regarding the impact of the intervention on consumption, the summary measure of household welfare, we obtained empirical results that were consistent with households consuming the saved crop income in the third year. In the absence of other controls, the difference-in-difference estimate for the impact on consumption was insignificant in the second year but highly positive in the third, with its magnitude much larger than the direct impact on crop income. A part of this consumption over-response was due to changes in remittance inflow. After controlling for remittance or using only in-kind food consumption, our estimate for the impact on food consumption in the third year was found to be in a range similar to the direct impact on crop income. The overall results thus suggest that treatment in the absence of subsidies is costly for households, and thus, the income gain due to the initial treatment was transient.
These interpretations need to be empirically tested using additional follow-up survey results and other experiments featuring randomly assigned design variations. Regarding the nature of changes in remittance, we provide in this study two extreme interpretations. One is that the observed changes in remittance were caused by the intervention; the other is that they
14 Regarding hidden and implicit costs, we can list the opportunity cost of labor in following directions, which could have resulted in lower wage income; the material and drug costs, whose shadow prices could be much higher than their market prices, if households are credit-constrained; the social cost of participating in human resource training organized by a women-led NGO within a male-dominated society, and the like.

18
occurred only by chance as exogenous changes. Since reality should lie between these two explanations, further investigations of remittance are required. On the other hand, since the main component of the intervention was human resource development training, we would like to know about the extent of capacity building within treatment households; these are currently unknown matters, and they too are left to future research. References Binswanger-Mkhize, H. P. (2012), “Is There Too Much Hype about Index-based Agricultural
Insurance?” Journal of Development Studies 48(2): 187–200. Chauhan, N. P. S., K. S. Barwal, and D. Kumar (2009), “Human–Wild Pig Conflict in Selected
States in India and Mitigation Strategies,” Acta Silvatica & Lignaria Hungarica 5: 189–197.
Cole, S. A., X. Gine, J. Tobacman, P. B. Topalova, R. M. Townsend, and J. I. Vickery (2013), “Barriers to Household Risk Management: Evidence from India,” American Economic Journal: Applied Economics 5(1): 104–135.
Deaton, A. (1992), Understanding Consumption, Oxford: Clarendon Press. ----- (1997), The Analysis of Household Surveys: A Microeconometric Approach to Development
Policy, Baltimore: Johns Hopkins University Press.
Dercon, S. (ed.) (2005), Insurance Against Poverty, Oxford: Oxford University Press. Else, J. G. and P. C. Lee (1986), “Primate Human Conflict,” in J. G. Else and P. C. Lee (eds.),
Primate Ecology and Conservation, Cambridge, UK: Cambridge University Press, pp. 213–214.
Fafchamps, M. (2003), Rural Poverty, Risk and Development, Cheltenham, UK: Edward Elgar. Government of Pakistan (2012), Pakistan Economic Survey 2012, Islamabad: Government of
Pakistan, Ministry of Finance, Economic Advisor’s Wing. Hone, J. and B. Ackison (1983), “Evaluation of Fencing to Control Feral Pig Movement,”
Australian Wildlife Research 10(3): 499–506. Khan, H. U. (2013), “Economic Analysis of Community-based Development Interventions in
Rural Pakistan,” unpublished Ph.D. dissertation, Graduate School of Economics, Hitotsubashi University, March 2013.
Khan, H. U., K. Miura, and T. Kurosaki (2011), “The Effectiveness of Community-based Development in Poverty Reduction: A Descriptive Analysis of a Women-Managed NGO in Rural Pakistan,” September 2011, PRIMCED DP No.13/CEI DP 2011-4.
Kurosaki, T. and M. Fafchamps (2002), “Insurance Market Efficiency and Crop Choices in Pakistan,” Journal of Development Economics 67(2): 419–453.
Kurosaki, T. and Humayun Khan (2011), “Floods, Relief Aid, and Household Resilience in
19
Rural Pakistan: Findings from a Pilot Survey in Khyber Pakhtunkhwa,” The Review of Agrarian Studies 1(2): 79–107.
Lucas, R. E. (2005), International Migration and Economic Development, Cheltenham: Edward Elgar.
Naughton-Treves, L. (1998), “Predicting Patterns of Crop Damage by Wildlife around Kibale National Park, Uganda,” Conservation Biology 12: 156–168.
Sawada, Y. (2007), “The Impact of Natural and Manmade Disasters on Household Welfare,” Agricultural Economics 37(s1): 59–73.
Sutton, W. R., D. M. Larson, and L. S. Jarvis (2008), “Assessing the Costs of Living with Wildlife in Developing Countries Using Willingness to Pay,” Environment and Development Economics 13(4): 475–495.
UNDP (2013), Human Development Report 2013―The Rise of the South: Human Progress in a Diverse World, New York: UNDP.

20
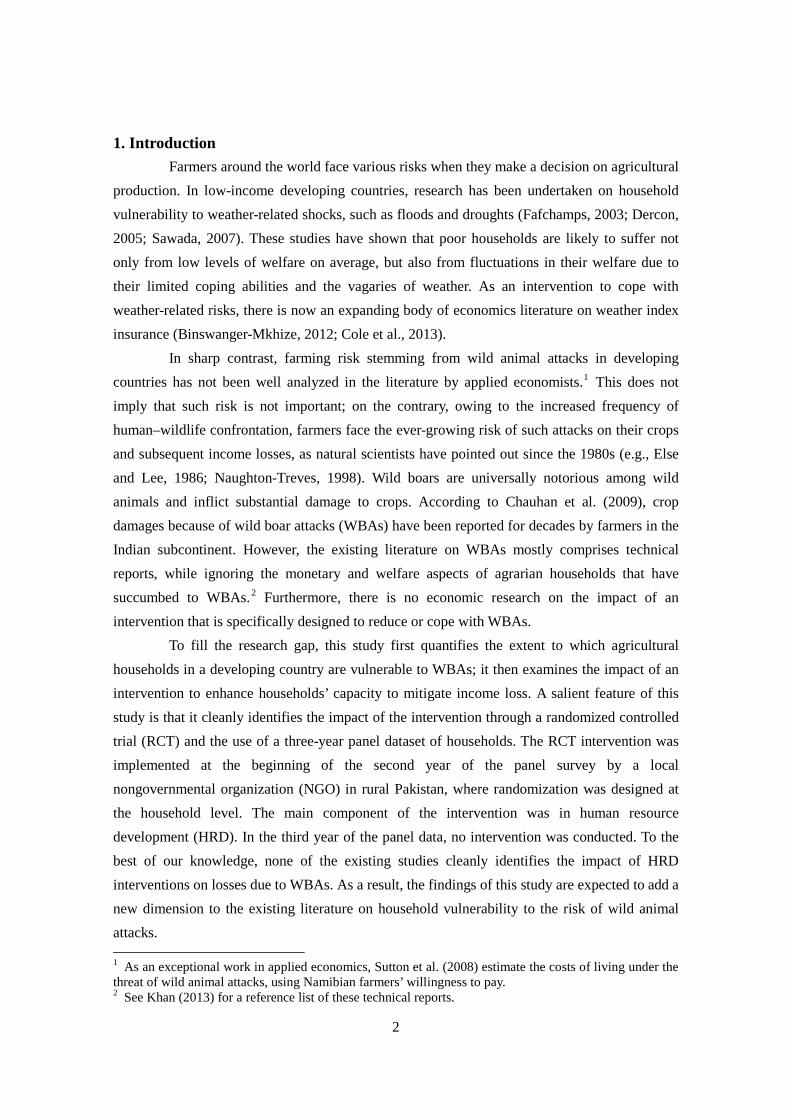
Figure 1. Timeline of the Anti-wild Boar Attacks Program (AWBAP)
Benchmark survey [Nov.–Dec. 2010]
Identification of 197 households with crop losses due to WBAs
Declaring the 197 households "eligible" for AWBAP
Random selection of 55 treatment households for AWBAP treatment
Implementation of AWBAP [Feb.–Mar. 2011]
Follow-up survey [Nov-Dec 2011]
Third-round survey [Nov.–Dec. 2012]

21
Figure 2. Distribution of Crop-income Loss, by Treatment Status
Notes: The first figure in the caption shows the treatment status, while the second figure shows the survey year. For instance, the caption “0, 2010” in the top-left graph indicates the distribution of crop-income loss among control households in 2010, while the caption “2, 2012” in the bottom-right graph indicates the distribution of crop-income loss among noneligible households in 2012.
22
Figure 3. Distribution of Consumption, by Treatment Status
Notes: See notes to Figure 2, for explanations of the captions. In this figure, the distribution of tot_exp (the household’s annual consumption expenditure, including the imputed value of in-kind transactions) is plotted.

Table 1. Balance Check
ControlHousehold
(n =142)
TreatmentHousehold
(n =55)Housing conditions
h_floor house floor is paved (dummy) 0.11 0.05 0.06 (0.04)h_cond house is made of bricks (dummy) 0.52 0.45 0.07 (0.08)h_boundry house boundry dummy 0.89 0.87 0.01 (0.05)room_no number of rooms in house 3.27 3.07 0.19 (0.21)toilet toilet exists in house (dummy) 0.89 0.87 0.02 (0.05)drainage drainage availability in house (dummy) 0.42 0.36 0.05 (0.08)
Household demographyhhsize household size 6.95 6.38 0.57 (0.43)fem_rate female/male ratio 1.03 1.22 -0.19 (0.14)hh_age household head's age 50.97 49.22 1.75 (1.98)hh_lite household head' literacy dummy 0.80 0.71 0.09 (0.07)hh_edu household head's years of education 6.69 5.91 0.78 (0.71)
Household asset indicatorscellphone cellphone ownership (dummy) 0.95 0.89 0.06 (0.05)area_hh area of house (in Marlas) 11.08 10.89 0.19 (1.09)tot_area_ol total landholding (area in Kanals) 14.83 11.09 3.74 (2.17)
Household cash flowfulltime_no number of fulltime employed members 1.56 1.60 -0.04 (0.15)zu_out zakat payment (dummy) 0.15 0.15 0.00 (0.06)remittance receipt of remittance (PKR 1,000) 83.27 47.31 35.96 (24.75)
Household consumptiontot_exp total expenditures (PKR 1,000) 272.23 241.15 31.07 (23.35)exp_pc per-capita expenditure (PKR 1,000) 40.61 39.72 0.89 (2.78)exp_food food expenditures (PKR 1,000) 190.20 163.75 26.45** (11.09)exp_nonfd nonfood expenditures (PKR 1,000) 82.03 77.41 4.62 (4.62)exp_kindfd in-kind food expenditures imputed using
village prices (PKR 1,000)44.34 29.72 14.62*** (4.49)
Crop-income loss due to wild boar attacksestloss_wba income loss due to WBAs (PKR1000) 8.16 7.26 0.90 (1.00)
23
Notes: All statistics are taken from the 2010 benchmark survey dat. The standard errors are reported in parentheses, estimatedunder the assumption that allows the unequal variance of two groups. * p < 0.1, ** p < 0.05, *** p < 0.01.
Source: Prepared by the author (same as the following tables and figures).
Variable
Mean for each group Mean difference(standard error):
Control-Treatment
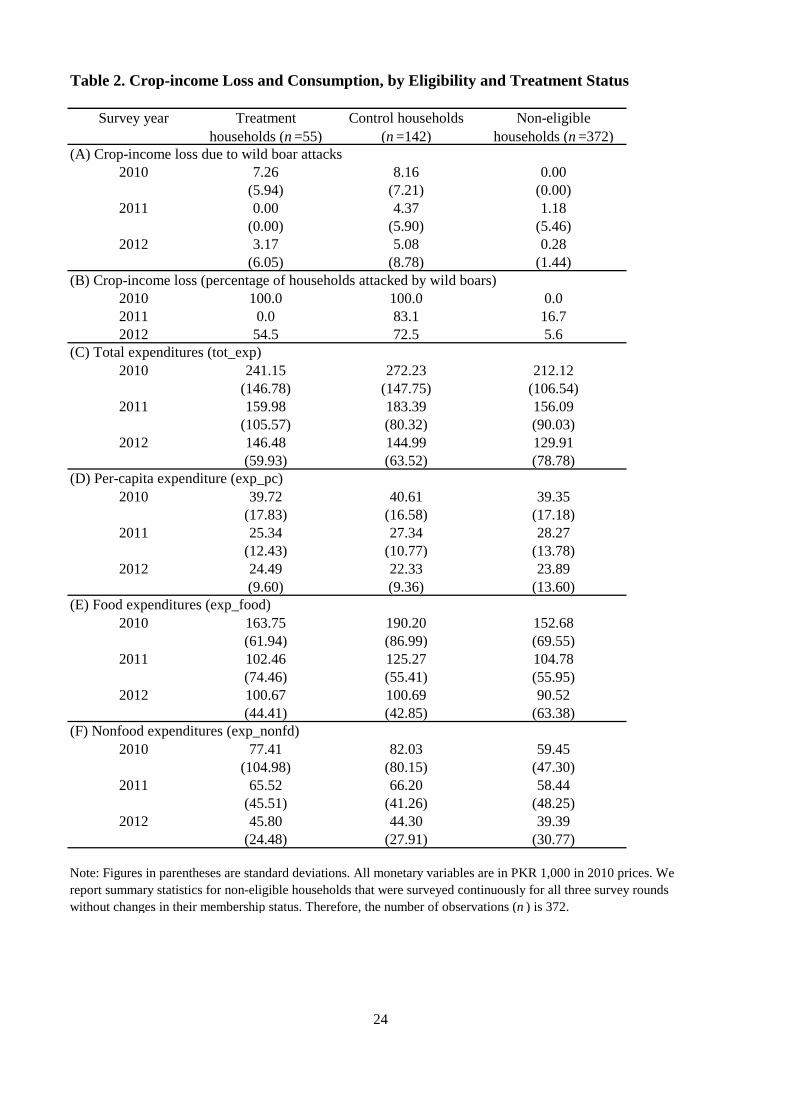
Table 2. Crop-income Loss and Consumption, by Eligibility and Treatment Status
Survey year Treatmenthouseholds (n =55)
Control households(n =142)
Non-eligiblehouseholds (n =372)
(A) Crop-income loss due to wild boar attacks2010 7.26 8.16 0.00
(5.94) (7.21) (0.00)2011 0.00 4.37 1.18
(0.00) (5.90) (5.46)2012 3.17 5.08 0.28
(6.05) (8.78) (1.44)(B) Crop-income loss (percentage of households attacked by wild boars)
2010 100.0 100.0 0.02011 0.0 83.1 16.72012 54.5 72.5 5.6
(C) Total expenditures (tot_exp)2010 241.15 272.23 212.12
(146.78) (147.75) (106.54)2011 159.98 183.39 156.09
(105.57) (80.32) (90.03)2012 146.48 144.99 129.91
(59.93) (63.52) (78.78)(D) Per-capita expenditure (exp_pc)
2010 39.72 40.61 39.35(17.83) (16.58) (17.18)
2011 25.34 27.34 28.27(12.43) (10.77) (13.78)
2012 24.49 22.33 23.89(9.60) (9.36) (13.60)
(E) Food expenditures (exp_food)2010 163.75 190.20 152.68
(61.94) (86.99) (69.55)2011 102.46 125.27 104.78
(74.46) (55.41) (55.95)2012 100.67 100.69 90.52
(44.41) (42.85) (63.38)(F) Nonfood expenditures (exp_nonfd)
2010 77.41 82.03 59.45(104.98) (80.15) (47.30)
2011 65.52 66.20 58.44(45.51) (41.26) (48.25)
2012 45.80 44.30 39.39(24.48) (27.91) (30.77)
Note: Figures in parentheses are standard deviations. All monetary variables are in PKR 1,000 in 2010 prices. Wereport summary statistics for non-eligible households that were surveyed continuously for all three survey roundswithout changes in their membership status. Therefore, the number of observations (n ) is 372.
24

Table 3. Impact of the AWBAP on Crop-income Loss
Explanatory variables:(1) Basic spec.
(2) Other =Control*Village_ level_treatment
(3) Other =Treatment*Non_member_dummy
(4) Other =Treatment*Flood_damage_dummy
Follow-up -3.787*** -5.179** -3.787*** -3.787***(0.847) (2.362) (0.848) (0.848)
Follow-up*Treatment -3.473*** -2.081 -3.573*** -3.688***(1.096) (2.508) (1.087) (1.312)
Follow-up*Other 1.749 0.789 0.457(2.516) (2.638) (1.349)
3rd_round -3.081*** -6.242** -3.081*** -3.081***(0.940) (2.361) (0.942) (0.942)
3rd_round*Treatment -1.009 2.151 -1.803 -0.514(1.195) (2.558) (1.197) (1.887)
3rd_round*Other 3.971 6.237 -1.046(2.547) (5.896) (2.251)
Household fixed effects Yes Yes Yes YesR-squared 0.106 0.148 0.145 0.139F-statistics for zero slopes 22.64*** 15.06*** 16.51*** 16.82***F-stat. for (1) Basic spec. (F(2, 29)) 1.54 0.62 0.58
Notes:
* p < 0.1, ** p < 0.05, *** p < 0.01.
Dependent variable: Crop-income loss (PKR 1,000 in 2010 prices)
Estimated by a fixed-effect panel specification with the number of observations at 591 (3 periods x 197eligible households).Robust standard errors clustered at the village level are shown in parentheses.
25
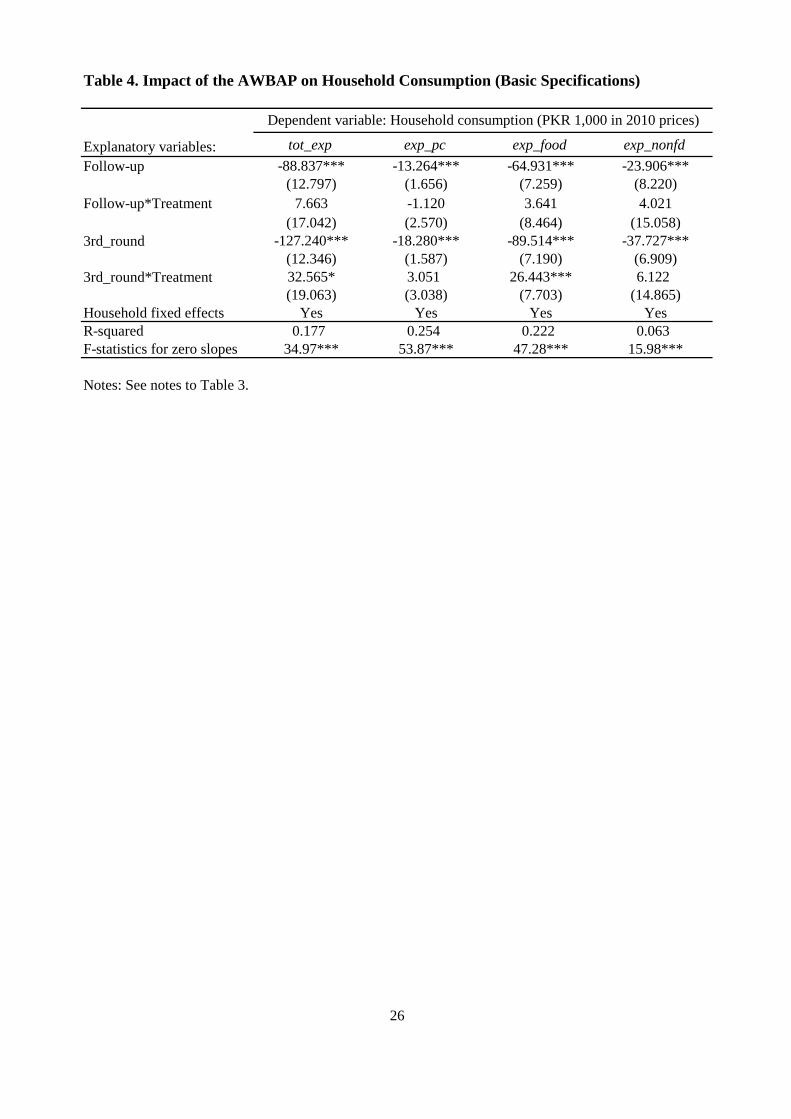
Table 4. Impact of the AWBAP on Household Consumption (Basic Specifications)
Explanatory variables: tot_exp exp_pc exp_food exp_nonfdFollow-up -88.837*** -13.264*** -64.931*** -23.906***
(12.797) (1.656) (7.259) (8.220)Follow-up*Treatment 7.663 -1.120 3.641 4.021
(17.042) (2.570) (8.464) (15.058)3rd_round -127.240*** -18.280*** -89.514*** -37.727***
(12.346) (1.587) (7.190) (6.909)3rd_round*Treatment 32.565* 3.051 26.443*** 6.122
(19.063) (3.038) (7.703) (14.865)Household fixed effects Yes Yes Yes YesR-squared 0.177 0.254 0.222 0.063F-statistics for zero slopes 34.97*** 53.87*** 47.28*** 15.98***
Notes: See notes to Table 3.
Dependent variable: Household consumption (PKR 1,000 in 2010 prices)
26
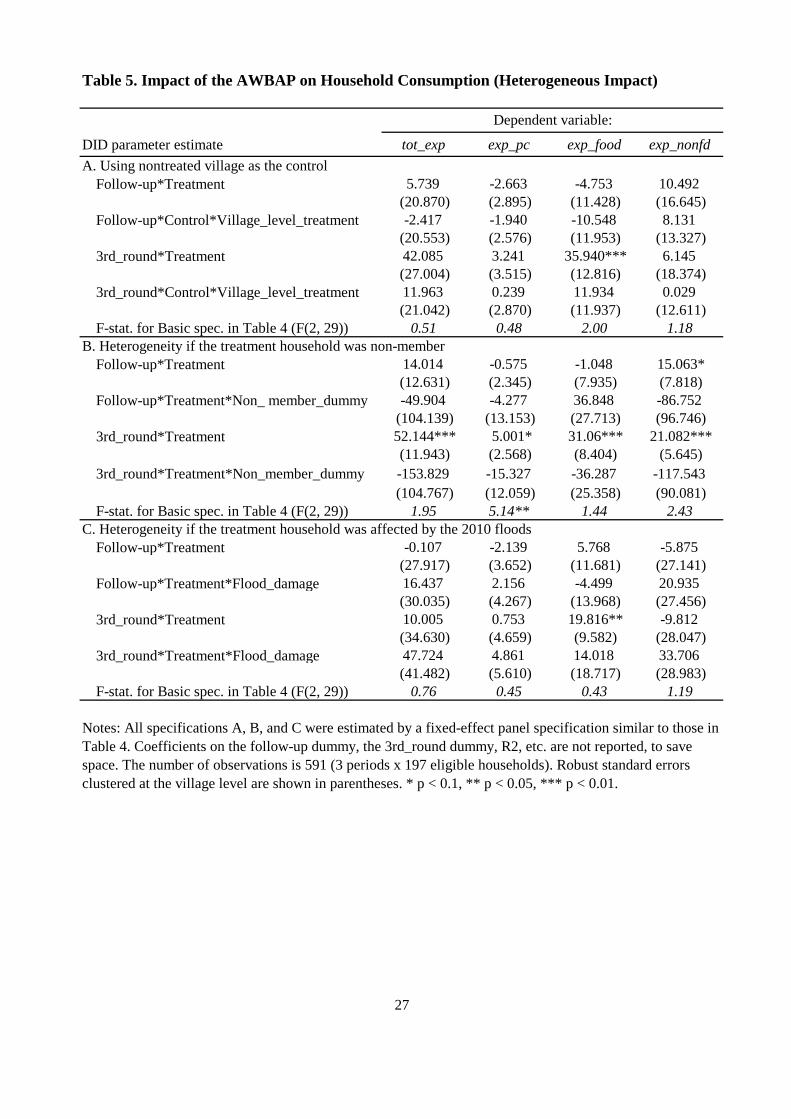
Table 5. Impact of the AWBAP on Household Consumption (Heterogeneous Impact)
DID parameter estimate tot_exp exp_pc exp_food exp_nonfdA. Using nontreated village as the control
Follow-up*Treatment 5.739 -2.663 -4.753 10.492(20.870) (2.895) (11.428) (16.645)
Follow-up*Control*Village_level_treatment -2.417 -1.940 -10.548 8.131(20.553) (2.576) (11.953) (13.327)
3rd_round*Treatment 42.085 3.241 35.940*** 6.145(27.004) (3.515) (12.816) (18.374)
3rd_round*Control*Village_level_treatment 11.963 0.239 11.934 0.029(21.042) (2.870) (11.937) (12.611)
F-stat. for Basic spec. in Table 4 (F(2, 29)) 0.51 0.48 2.00 1.18B. Heterogeneity if the treatment household was non-member
Follow-up*Treatment 14.014 -0.575 -1.048 15.063*(12.631) (2.345) (7.935) (7.818)
Follow-up*Treatment*Non_ member_dummy -49.904 -4.277 36.848 -86.752(104.139) (13.153) (27.713) (96.746)
3rd_round*Treatment 52.144*** 5.001* 31.06*** 21.082***(11.943) (2.568) (8.404) (5.645)
3rd_round*Treatment*Non_member_dummy -153.829 -15.327 -36.287 -117.543(104.767) (12.059) (25.358) (90.081)
F-stat. for Basic spec. in Table 4 (F(2, 29)) 1.95 5.14** 1.44 2.43C. Heterogeneity if the treatment household was affected by the 2010 floods
Follow-up*Treatment -0.107 -2.139 5.768 -5.875(27.917) (3.652) (11.681) (27.141)
Follow-up*Treatment*Flood_damage 16.437 2.156 -4.499 20.935(30.035) (4.267) (13.968) (27.456)
3rd_round*Treatment 10.005 0.753 19.816** -9.812(34.630) (4.659) (9.582) (28.047)
3rd_round*Treatment*Flood_damage 47.724 4.861 14.018 33.706(41.482) (5.610) (18.717) (28.983)
F-stat. for Basic spec. in Table 4 (F(2, 29)) 0.76 0.45 0.43 1.19
Dependent variable:
Notes: All specifications A, B, and C were estimated by a fixed-effect panel specification similar to those inTable 4. Coefficients on the follow-up dummy, the 3rd_round dummy, R2, etc. are not reported, to savespace. The number of observations is 591 (3 periods x 197 eligible households). Robust standard errorsclustered at the village level are shown in parentheses. * p < 0.1, ** p < 0.05, *** p < 0.01.
27
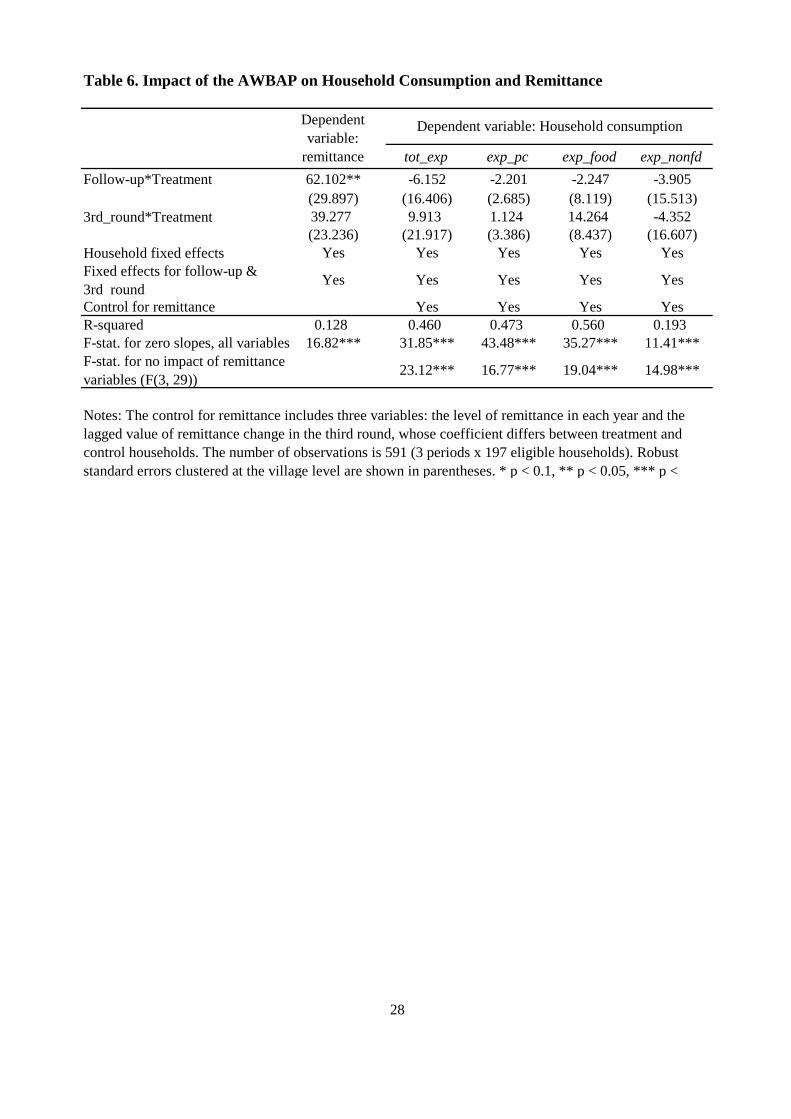
Table 6. Impact of the AWBAP on Household Consumption and Remittance
tot_exp exp_pc exp_food exp_nonfdFollow-up*Treatment 62.102** -6.152 -2.201 -2.247 -3.905
(29.897) (16.406) (2.685) (8.119) (15.513)3rd_round*Treatment 39.277 9.913 1.124 14.264 -4.352
(23.236) (21.917) (3.386) (8.437) (16.607)Household fixed effects Yes Yes Yes Yes YesFixed effects for follow-up &3rd round
Yes Yes Yes Yes Yes
Control for remittance Yes Yes Yes YesR-squared 0.128 0.460 0.473 0.560 0.193F-stat. for zero slopes, all variables 16.82*** 31.85*** 43.48*** 35.27*** 11.41***F-stat. for no impact of remittancevariables (F(3, 29))
23.12*** 16.77*** 19.04*** 14.98***
28
Notes: The control for remittance includes three variables: the level of remittance in each year and thelagged value of remittance change in the third round, whose coefficient differs between treatment andcontrol households. The number of observations is 591 (3 periods x 197 eligible households). Robuststandard errors clustered at the village level are shown in parentheses. * p < 0.1, ** p < 0.05, *** p <
Dependentvariable:
remittance
Dependent variable: Household consumption

Table 7. Impact of the AWBAP on Consumption in Kind
Explanatory variables:(1) Basic spec.
(2) Other =Control*Village_level_treatment
(3) Other =Treatment*Non_member_dummy
(4) Other =Treatment*Flood_damage_dummy
Follow-up -12.436*** -5.947 -12.436*** -12.436***(2.013) (4.485) (2.017) (2.017)
Follow-up*Treatment 3.544 -2.945 3.039 6.536(3.533) (5.399) (3.607) (3.901)
Follow-up*Other -8.154 3.972 -6.329(5.036) (6.677) (3.874)
3rd_round -20.391*** -21.623*** -20.391*** -20.391***(2.557) (6.484) (2.561) (2.561)
3rd_round*Treatment 7.433 8.665 8.682* 6.804(4.524) (7.109) (4.702) (4.841)
3rd_round*Other 1.548 -9.811 1.330(7.038) (15.584) (6.200)
Household fixed effects Yes Yes Yes YesR-squared 0.259 0.268 0.264 0.263F-statistics for zero slopes 36.66*** 30.26*** 25.55*** 27.88***F-stat. for (1) Basic spec. (F(2, 29)) 4.20** 1.20 5.10**
Notes: See notes to Table 3.
Dependent variable: In-kind food expenditures (PKR 1,000 in 2010 prices)
29
wp-1
Center for Economic Institutions Working Paper Series
2000-1 Jean Tirole, “Corporate Governance” , January 2000.
2000-2 Kenneth A. Kim and S. Ghon Rhee, “A Note on Shareholder Oversight and the Regulatory Environment: The Japanese Banking Experience”, January 2000.
2000-3 S. Ghon Rhee, “Further Reforms after the “BIG BANG”: The JapaneseGovernment Bond
Market”, June 2000.
2000-4 Stijn Claessens, Simeon Djankov , Joseph Fan , and Larry Lang, “Expropriation of Minority
Shareholders in East Asia”, July 2000.
2000-5 Stijn Claessens, Simeon Djankov, Joseph Fan , and Larry Lang, “The Costs of Group
Affiliation: Evidence from East Asia”, July 2000.
2001-1 Masaharu Hanazaki and Akie Takeuchi, “An International Comparison of Corporate
Investment Behavior -Some Implications for the Governance Structure in Japan-”, February
2001.
2001-2 Katsuyuki Kubo, “The Determinants of Executive Compensation in Japan and the UK:
Agency Hypothesis or Joint Determination Hypothesis?”, February 2001.
2001-3 Katsuyuki Kubo, “Changes in Directors’ Incentive Plans and the Performance of Firms in
the UK”, March 2001.
2001-4 Yupana Wiwattanakantang, “Controlling Shareholders and Corporate Value: Evidence from
Thailand”, March 2001.
2001-5 Katsuyuki Kubo, “The Effect of Managerial Ownership on Firm Performance: Case in
Japan”, March 2001.
2001-6 Didier Guillot and James R. Lincoln, “The Permeability of Network Boundaries: Strategic
Alliances in the Japanese Electronics Industry in the 1990s”, March 2001.
2001-7 Naohito Abe, “Ageing and its Macroeconomic Implications-A Case in Japan-”, May 2001.
2001-8 Yupana Wiwattanakantang, “The Equity Ownership Structure of Thai Firms”, July 2001.
2001-9 Megumi Suto, “Capital Structure and Investment Behaviour of Malaysian Firms in the
1990s--A study of Corporate Governance before the Crisis--”, August 2001.
2001-10 Naohito Abe, Noel Gaston, and Katsuyuki Kubo, “Executive Pay in Japan : The Role of
Bank-Appointed Monitors and the Main Bank Relationship”, September 2001.
2001-11 Colin Mayer, “The Financing and Governance of New Technologies”, September 2001.
2001-12 Masaharu Hanazaki and Akiyoshi Horiuchi, “Can the Financial Restraint Hypothesis
Explain Japan’s Postwar Experience?”, September 2001.
2001-13 Shin-ichi Fukuda, “The Role of Long-term Loans for Economic Development: Empirical
Evidence in Japan, Korea, and Taiwan”, September 2001.
wp-2
2001-14 S. Ghon Rhee, “Further Reforms of the JGB Market for the Promotion of Regional Bond
Markets”, September 2001.
2001-15 Stijn Claessens, Simeon Djankov, Joseph P. H. Fan, and Larry H. P. Lang, ”The Benefits
and Costs of Internal Markets: Evidence from Asia’s Financial Crisis”, September 2001.
2001-16 Kenneth A. Kim and John R. Nofsinger, “Institutional Herding, Business Groups, and
Economic Regimes: Evidence from Japan”, September 2001.
2001-17 Mitsuhiro Fukao, “Financial Deregulations, Weakness of Market Discipline, and Market
Development: Japan’s Experience and Lessons for Developing Countries”, September 2001.
2001-18 Akio Kuroda and Koichi Hamada, “Towards an Incentive Compatible Financial System:
Accounting and Managing the Non-Performing Loans”, September 2001.
2001-19 Randall Morck and Bernard Yeung, “Japanese Economic Success and the Curious
Characteristics of Japanese Stock Prices”, September 2001.
2001-20 Miguel A. García-Cestona, “Ownership Structure, Banks and the Role of Stakeholders: The
Spanish Case”, September 2001.
2001-21 Joseph P. H. Fan and T. J. Wong, “Corporate Ownership Structure and the Informativeness
of Accounting Earnings in East Asia”, September 2001.
2001-22 Heather Montgomery, “The Effect of the Basel Accord on Bank Lending in Japan”,
September 2001.
2001-23 Naoyuki Yoshino, Sahoko Kaji, and Ayako Suzuki, “The Basket-peg, Dollar-peg and
Floating---A Comparative Analysis of Exchange Rate Regimes”, September 2001.
2001-24 Colin Mayer, Koen Schoors, and Yishay Yafeh, “Sources of Funds and Investment
Strategies of Venture Capital Funds: Evidence from Germany, Israel, Japan and the UK”,
September 2001.
2001-25 Yukinobu Kitamura, Megumi Suto, and Juro Teranishi, “Towards a New Architecture for
the Japanese Financial System: Participation Costs, Intermediated Ownership and Wealth
Distribution”, September 2001.
2002-1 Evgeni Peev, “The Political Economy of Corporate Governance Change in Bulgaria:
Washington Consensus, Primitive Accumulation of Capital, and Catching-Up in the 1990” ,
March 2002.
2002-2 Naohito Abe, “Saving, Capital Flows, and the Symmetric International Spillover of
Industrial Policies” , June 2002.
2002-3 Masaharu Hanazaki and Akiyoshi Horiuchi, “A Review of Japan’s Bank Crisis from the
Governance Perspective” , July 2002.
2002-4 Chutathong Charumirind, Raja Kali and Yupana Wiwattanakantang, “Crony Lending:
Thailand before the Financial Crisis” , September 2002.
2002-5 Maitreesh Ghatak and Raja Kali, “Financially Interlinked Business Groups” , September
2002.
2002-6 Tarun Khanna, Joe Kogan, and Krishna Palepu, “Globalization and Similarities in Corporate
Governance: A Cross-Country Analysis” , September 2002.

wp-3
2002-7 Chongwoo Choe, “Delegated Contracting and Corporate Hierarchies” , September 2002.
2002-8 Tarun Khanna and Yishay Yafeh, “Business Groups and Risk Sharing around the World”,
September 2002.
2002-9 Yitae Kim, Kwangwoo Park, Ronald A. Ratti, and Hyun-Han Shin, “Do Main Banks Extract
Rents from their Client Firms? Evidence from Korean Chaebol” , September 2002.
2002-10 Armen Hovakimian, Edward J. Kane and Luc Laeven, “How Country and Safety-Net
Characteristics Affect Bank Risk-Shifting” , September 2002.
2002-11 Vidhan K. Goyal and Takeshi Yamada, “Asset Price Shocks, Financial Constraint, and
Investment: Evidence from Japan” , September 2002.
2002-12 Clive S. Lennox, “Opinion Shopping and Audit Committees” , September 2002.
2002-13 Seki Obata, “Pyramid Business Groups in East Asia: Insurance or Tunneling?” , September
2002.
2002-14 Ishtiaq Pasha Mahmood and Will Mitchell, “Two Faces: Effects of Business Groups on
Innovation in Emerging Economies” , September 2002.
2002-15 Kwangwoo Park, “Foreign Ownership and Firm Value in Japan” , September 2002.
2002-16 Adrian van Rixtel, Yupana Wiwattanakantang, Toshiyuki Souma, and Kazunori Suzuki,
“ Banking in Japan: Will “To Big To Fail” Prevail?”, December 2002.
2002-17 Stijn Claessens and Leora F. Klapper, “Bankruptcy around the World: Explanations of its
Relative Use” , December 2002.
2003-1 Anya Khanthavit, Piruna Polsiri, and Yupana Wiwattanakantang, “Did Families Lose or
Gain Control after the East Asian Financial Crisis?”, February 2003.
2003-2 Hidenobu Okuda, Hidetoshi Hashimoto, and Michiko Murakami, “The Estimation of
Stochastic Cost Functions of Malaysian Commercial Banks and Its Policy Implications to
Bank Restructuring”, February 2003.
2003-3 Masaharu Hanazaki and Liuqun, “Asian Crisis and Corporate Governance, (in Japanese)”,
March 2003.
2003-4 Fukuju Yamazaki and Hiroyuki Seshita, “Economic Analysis of Bankruptcy law in Japan,
(in Japanese) ”, February 2003.
2003-5 Hirofumi Uchida and Hiroshi Osano, “Bank Monitoring and Corporate Governance in Japan,
(in Japanese)”, March 2003.
2003-6 Fukunari Kimura and Kozo Kiyota, “Foreign Ownership and Corporate Performance:
Evidence from Japanese Micro Data, (in Japanese) ”, March 2003.
2003-7 Yukinobu Kitamura, “Corporate Profit and Debt- Panel Data Analysis of The Japanese
Firms in the 1990s, (in Japanese) ”, March 2003.
2003-8 Chaiyasit Aunchitworawong, Toshiyuki Soma, and Yupana Wiwattanakantang, “Do
Families Control Banks Prevail after the East Asia Financial Crisis? Evidence from
Thailand”, March 2003.

wp-4
2003-9 Junko Maru, Yasuhiro Yonezawa and Yuki Matsumoto, “Corporate Governance by Foreign
Investors in East Asia Corporations (in Japanese) ”, March 2003.
2003-10 Sui Qing-yuan, “Declining Firm's Dependence upon Bank Borrowing and Corporate
Performance (in Japanese) ”, March 2003.
2003-11 Katsumi Matsuura, “Changes in Ownership Structures and Their Impacts upon Corporate
Performance in Japan (in Japanese) ”, March 2003.
2003-12 Kathy S. He, Randall Morck and Bernard Yeung, “Corporate Stability and Economic
Growth”, May 2003.
2003-13 Robert Dekle and Heajin Ryoo, “Exchange Rate Fluctuations, Financing Constraints,
Hedging, and Exports: Evidence from Firm Level Data”, June 2003.
2003-14 Tsun-Siou Lee, Yin-Hua Yeh and Rong-Tze Liu, ”Can Corporate Governance Variables
Enhance the Prediction Power of Accounting-Based Financial Distress Prediction Models?”,
June 2003.
2003-15 Hideaki Miyajima and Yishay Yafeh, “Japan’s Banking Crisis: Who has the Most to Lose?”,
June 2003.
2003-16 Guifen Pei, “Asset Management Companies in China”, June 2003.
2003-17 Takeshi Nagase, “The Governance Structure of IPO Firm in Japan”, July 2003.
2003-18 Masaharu Hanazaki and Qun Liu, “The Asian Crisis and Corporate Governance ―
Ownership Structure, Debt Financing, and Corporate Diversification ―”, July 2003.
2003-19 Chutatong Charumilind, Raja Kali and Yupana Wiwattanakantang, “Connected Lending:
Thailand before the Financial Crisis”, July 2003.
2003-20 Gilles Hilary and Tomoki Oshika, “Shareholder activism in Japan: social pressure, private
cost and organized crime”, August 2003.
2003-21 Sanghoon Ahn, “Technology Upgrading with Learning Cost”, September 2003.
2003-22 Masaharu Hanazaki and Akiyoshi Horiuchi, “Have Banks Contributed to Efficient
Management in Japan’s Manufacturing?”, November 2003.
2003-23 Chongwoo Choe and In-Uck Park, “Delegated Contracting and Corporate Hierarchies”,
November 2003.
2003-24 Bruno Dallago, ”Comparative Economic Systems and the New Comparative Economics:
Foes, Competitors, or Complementary?”, November 2003.
2003-25 Adrian van Rixtel, Ioana Alexopoulou and Kimie Harada, “The New Basel Capital Accord
and Its Impact on Japanese Banking: A Qualitative Analysis”, November 2003.
2004-1 Masaharu Hanazaki, Toshiyuki Souma and Yupana Wiwattanakantang, “Silent Large
Shareholders and Entrenched Bank Management: Evidence from Banking Crisis in Japan” ,
January 2004.
2004-2 Ming Ming Chiu and Sung Wook Joh, “Bank Loans to Distressed Firms: Cronyism, bank
governance and economic crisis” , January 2004.
wp-5
2004-3 Keun Lee, Keunkwan Ryu and Jungmo Yoon, “Corporate Governance and Long Term
Performance of the Business Groups: The Case of Chaebols in Korea” , January 2004.
2004-4 Randall Morck and Masao Nakamura, “Been There, Done That –The History of Corporate
Ownership in Japan” , March 2004.
2004-5 Dong-Hua Chen, Joseph P. H. Fan and T. J. Wong, ”Politically-connected CEOs, Corporate
Governance and Post-IPO Performance of China’s Partially Privatized Firms” , March 2004.
2004-6 Jae-Seung Baek, Jun-Koo Kang and Inmoo Lee, “Business Groups and Tunneling: Evidence
from Private Securities Offerings by Korean Chaebols” , March 2004.
2004-7 E. Han Kim, “To Steal or Not to Steal: Firm Attributes, Legal Environment, and Valuation” ,
March 2004.
2004-8 Yin-Hua Yeh and Tracie Woidtke, “Commitment or Entrenchment?: Controlling
Shareholders and Board Composition” , June 2004.
2004-9 Hugh Patrick, “Thoughts on Evolving Corporate Governance in Japan” , June 2004.
2004-10 Utpal Bhattacharya and Hazem Daouk, “When No Law is Better than a Good Law”, June
2004.
2004-11 Sanghoon Ahn, Utpal Bhattacharya, Taehun Jung and Giseok Nam, “Do Japanese CEOs
Matter?”, June 2004.
2004-12 Megumi Suto and Masashi Toshino, “Behavioural Biases of Japanese Institutional
Investors; Fund management and Corporate Governance”, July 2004.
2004-13 Piruna Polsiri and Yupana Wiwattanakantang, “Business Groups in Thailand: Before and
after the East Asian Financial Crisis”, August 2004.
2004-14 Fumiharu Mieno, “Fund Mobilization and Investment Behavior in Thai Manufacturing
Firms in the Early 1990s”, August 2004.
2004-15 Chaiyasit Anuchitworawong, “Deposit Insurance, Corporate Governance and Discretionary
Behavior: Evidence from Thai Financial Institutions”, September 2004.
2004-16 Chaiyasit Anuchitworawong, “Financial fragility under implicit insurance scheme: Evidence
from the collapse of Thai financial institutions”, September 2004.
2004-17 Chaiyasit Anuchitworawong, “Ownership-based Incentives, Internal Corporate Risk and
Firm Performance”, September 2004.
2004-18 Jack Ochs and In-Uck Park, “Overcoming the Coordination Problem: Dynamic Formation
of Networks”, September 2004.
2004-19 Hidenobu Okuda and Suvadee Rungsomboon, “Comparative Cost Study of Foreign and
Thai Domestic Banks 1990–2002: Estimating Cost Functions of the Thai Banking
Industry” , February 2005.
2004-20 Hidenobu Okuda and Suvadee Rungsomboon, ”The Effects of Foreign Bank Entry on the
Thai Banking Market: Empirical Analysis from 1990 to 2002 “, March 2005.

wp-6
2004-21 Juro Teranishi, “Investor Right in Historical Perspective: Globalization and the Future of the
Japanese Firm and Financial System” , March 2005.
2004-22 Kentaro Iwatsubo, “Which Accounts for Real Exchange Rate Fluctuations, Deviations from
the Law of One Price or Relative Price of Nontraded Goods?”, March 2005.
2004-23 Kentaro Iwatsubo and Tomoyuki Ohta, ”Causes and effects of exchange rate regimes (in
Japanese)” , March 2005.
2004-24 Kentaro Iwatsubo, “Bank Capital Shocks and Portfolio Risk: Evidence from Japan”, March
2005.
2004-25 Kentaro Iwatsubo, “On the Bank-led Rescues Financially Distressed Firms in Japan” ,
March 2005.
2005-1 Yishay P. Yafeh and Tarun Khanna, “Business Groups in Emerging Markets: Paragons or
Parasities?” , September 2005.
2005-2 Renee B. Adams and Daniel Ferreira, “Do Directors Perform for Pay?," September 2005.
2005-3 Qun Liu, Shin-ichi Fukuda and Juro Teranishi, “What are Characteristics of Financial
Systems in East Asia as a Region?”, September 2005.
2005-4 Juro Teranishi, “Is the Financial System of Postwar Japan Bank-dominated or Market
Based?” , September 2005.
2005-5 Hasung Jang, Hyung-cheol Kang and Kyung Suh Park, “Determinants of Family
Ownership: The Choice between Control and Performance” , October 2005.
2005-6 Hasung Jang, Hyung-cheol Kang and Kyung Suh Park, “The Choice of Group Structure:
Divide and Rule” , October 2005.
2005-7 Sangwoo Lee, Kwangwoo Park and Hyun-Han Shin, “The Very Dark Side of International
Capital Markets: Evidence from Diversified Business Groups in Korea” , October 2005.
2005-8 Allen N. Berger, Richard J. Rosen and Gregory F. Udell, “Does Market Size Structure
Affect Competition? The Case of Small Business Lending” , November 2005.
2005-9 Aditya Kaul and Stephen Sapp, “Trading Activity and Foreign Exchange Market Quality” ,
November 2005.
2005-10 Xin Chang, Sudipto Dasgupta and Gilles Hilary, “The Effect of Auditor Choice on
Financing Decisions” , December 2005.
2005-11 Kentaro Iwatsubo, “Adjustment Speeds of Nominal Exchange Rates and Prices toward
Purchasing Power Parity” , January 2006.
2005-12 Giovanni Barone-Adesi, Robert Engle and Loriano Mancini, “GARCH Options in
Incomplete Markets”, March 2006.
2005-13 Aditya Kaul, Vikas Mehrotra and Blake Phillips, “Ownership, Foreign Listings, and Market
Valuation”, March 2006.
2005-14 Ricard Gil, “Renegotiation, Learning and Relational Contracting”, March 2006.

wp-7
2005-15 Randall Morck, “How to Eliminate Pyramidal Business Groups -The Double Taxation of
Inter-corporate Dividends and other Incisive Uses of Tax Policy-”, March 2006.
2005-16 Joseph P.H. Fan, T.J. Wong and Tianyu Zhang, “The Emergence of Corporate Pyramids in
China”, March 2006.
2005-17 Yan Du, Qianqiu Liu and S. Ghon Rhee, “An Anatomy of the Magnet Effect: Evidence
from the Korea Stock Exchange High-Frequency Data”, March 2006.
2005-18 Kentaro Iwatsubo and Junko Shimizu, “Signaling Effects of Foreign Exchange Interventions
and Expectation Heterogeneity among Traders”, March 2006.
2005-19 Kentaro Iwatsubo, “Current Account Adjustment and Exchange Rate Pass-Through(in
Japanese)”, March 2006.
2005-20 Piruna Polsiri and Yupana Wiwattanakantang, “Corporate Governance of Banks in
Thailand”, March 2006.
2006-1 Hiroyuki Okamuro and Jian Xiong Zhang, “Ownership Structure and R&D Investment of
Japanese Start-up Firms,” June 2006.
2006-2 Hiroyuki Okamuro, “Determinants of R&D Activities by Start-up Firms: Evidence from
Japan,” June 2006.
2006-3 Joseph P.H. Fan, T.J. Wong and Tianyu Zhang, “The Emergence of Corporate Pyramids in
China,” August 2006.
2006-4 Pramuan Bunkanwanicha, Jyoti Gupta and Yupana Wiwattanakantang, “Pyramiding of
Family-owned Banks in Emerging Markets,” September 2006.
2006-5 Bernardo Bortolotti and Mara Faccio, “Reluctant privatization,” September 2006.
2006-6 Jörn Kleinert and Farid Toubal, “Distance costs and Multinationals’ foreign activities”,
October 2006.
2006-7 Jörn Kleinert and Farid Toubal, “Dissecting FDI”, October 2006.
2006-8 Shin-ichi Fukuda and Satoshi Koibuchi, “The Impacts of “Shock Therapy” on Large and
Small Clients: Experiences from Two Large Bank Failures in Japan”, October 2006.
2006-9 Shin-ichi Fukuda, Munehisa Kasuya and Kentaro Akashi, “The Role of Trade Credit for
Small Firms: An Implication from Japan’s Banking Crisis”, October 2006.
2006-10 Pramuan Bunkanwanicha and Yupana Wiwattanakantang, “Big Business Owners and
Politics: Investigating the Economic Incentives of Holding Top Office”, October 2006.
2006-11 Sang Whi Lee, Seung-Woog(Austin) Kwang, Donald J. Mullineaux and Kwangwoo Park,
“Agency Conflicts, Financial Distress, and Syndicate Structure: Evidence from Japanese
Borrowers”, October 2006.
2006-12 Masaharu Hanazaki and Qun Liu, “Corporate Governance and Investment in East Asian
Firms -Empirical Analysis of Family-Controlled Firms”, October 2006.
2006-13 Kentaro Iwatsubo and Konomi Tonogi, “Foreign Ownership and Firm Value: Identification
through Heteroskedasticity (in Japanese)”, December 2006.

wp-8
2006-14 Kentaro Iwatsubo and Kazuyuki Inagaki, “Measuring Financial Market Contagion Using
Dually-Traded Stocks of Asian Firms”, December 2006.
2006-15 Hun-Chang Lee, “When and how did Japan catch up with Korea? –A comparative study of
the pre-industrial economies of Korea and Japan”, February 2007.
2006-16 Kyoji Fukao, Keiko Ito, Shigesaburo Kabe, Deqiang Liu and Fumihide Takeuchi, “Are
Japanese Firms Failing to Catch up in Localization? An Empirical Analysis Based on
Affiliate-level Data of Japanese Firms and a Case Study of the Automobile Industry in
China”, February 2007.
2006-17 Kyoji Fukao, Young Gak Kim and Hyeog Ug Kwon, “Plant Turnover and TFP Dynamics in
Japanese Manufacturing”, February 2007.
2006-18 Kyoji Fukao, Keiko Ito, Hyeg Ug Kwon and Miho Takizawa, “Cross-Border Acquisitons
and Target Firms' Performance: Evidence from Japanese Firm-Level Data”, February 2007.
2006-19 Jordan Siegel and Felix Oberholzer-Gee, “Expropriators or Turnaround Artists? The Role of
Controlling Families in South Korea (1985-2003)”, March 2007.
2006-20 Francis Kramarz and David Thesmar, “Social Networks in The Boardroom”, March 2007.
2006-21 Morten Bennedsen, Francisco Pérez-González and Daniel Wolfenzon, “Do CEOs matter?”,
March 2007.
2007-1 Ichiro Iwasaki, “Endogenous board formation and its determinants in a transition economy:
evidence from Russia*”, April 2007, Revised on October 2007.
2007-2 Joji Tokui, Tomohiko Inui, and Katsuaki Ochiai, “The Impact of Vintage Capital and R&D
on Japanese Firms’ Productivity”, April 2007.
2007-3 Yasuo Nakanishi and Tomohiko Inui, “Deregulation and Productivity in Japanese
Industries”, April 2007.
2007-4 Kyoji Fukao, “The Performance of Foreign Firms and the Macroeconomic Impact of FDI”,
May 2007.
2007-5 Taku Suzuki, “The Role of the State in Economic Growth of Post-Communist Transitional
Countries”, June 2007.
2007-6 Michiel van Leuvensteijn, Jacob A. Bikker, Adrian A.R.J.M. van Rixtel and Christoffer
Kok-Sørensen*, “A new approach to measuring competition in the loan markets of the euro
area”, June 2007.
2007-7 Sea Jin Chang, Jaiho Chung, and Dean Xu, “FDI and Technology Spillovers in China”, July
2007.
2007-8 Fukunari Kimura, “The mechanics of production networks in Southeast Asia: the
fragmentation theory approach”, July 2007.
2007-9 Kyoji Fukao, Tsutomu Miyagawa, Miho Takizawa, “Productivity Growth and Resource
Reallocation in Japan”, November 2007.
2007-10 YoungGak Kim, “A Survey on Intangible Capital”, December 2007.
wp-9
2007-11 Sea-Jing Chang and Jay Hyuk Rhee, “Rapid International Expansion Strategy of Emerging
Market Enterprises: The Interplay between Speed and Competitive Risks on International
performance”, November 2007.
2007-12 Ishtiaq Mahmood, Will Mitchell, and Chi-Nien Chung, “The Structure of Intra-Group Ties:
Innovation in Taiwanese Business”, January 2008.
2007-13 Kyoji Fukao, Tomohiko Inui, Shigesaburo Kabe and Deqiang Liu, “ An International
Comparison of the TFP Levels of Japanese, Korean and Chinese Listed Firms“, March
2008.
2007-14 Pramuan Bunkanwanicha and Yupana Wiwattanakantang, “Allocating Risk Across
Pyramidal Tiers: Evidence from Thai Business Groups”, March 2008.
2008-1 Rüdiger Fahlenbrach and René M. Stulz, "Managerial Ownership Dynamics and Firm
Value", April 2008.
2008-2 Morten Bennedsen, Kasper Meisner Nielsen, and, Thomas Vester Nielsen, “Private
Contracting and Corporate Governance: Evidence from the Provision of Tag-Along Rights
in an Emerging Market”, April 2008.
2008-3 Joseph P.H. Fan, Jun Huang, Felix Oberholzer-Gee, and Mengxin Zhao, “Corporate
Diversification in China: Causes and Consequences”, April 2008.
2008-4 Daniel Ferreira, Miguel A. Ferreira, Clara C. Raposo, “Board Structure and Price
Informativeness”, April 2008.
2008-5 Nicola Gennaioli and Stefano Rossi, “Judicial Discretion in Corporate Bankruptcy”, April
2008.
2008-6 Nicola Gennaioli and Stefano Rossi, “Optimal Resolutions of Financial Distress by
Contract”, April 2008.
2008-7 Renée B. Adams and Daniel Ferreira, “Women in the Boardroom and Their Impact on
Governance and Performance”, April 2008.
2008-8 Worawat Margsiri, Antonio S. Melloy, and Martin E. Ruckesz, “A Dynamic Analysis of
Growth via Acquisition”, April 2008.
2008-9 Pantisa Pavabutra and Sukanya Prangwattananon, “Tick Size Change on the Stock
Exchange of Thailand”, April 2008.
2008-10 Maria Boutchkova, Hitesh Doshi, Art Durnev, and Alexander Molchanov, “Politics and
Volatility”, April 2008.
2008-11 Yan-Leung Cheung, P. Raghavendra Rau, and Aris Stouraitis, “The Helping Hand, the Lazy
Hand, or the Grabbing Hand? Central vs. Local Government Shareholders in Publicly Listed
Firms in China”, April 2008.
2008-12 Art Durnev and Larry Fauver, “Stealing from Thieves: Firm Governance and Performance
when States are Predatory”, April 2008.
2008-13 Kenneth Lehn, Sukesh Patro, and Mengxin Zhao, “Determinants of the Size and Structure of
Corporate Boards: 1935-2000”, April 2008.
wp-10
2008-14 Ishtiaq P. Mahmood, Hong-Jin Zhu and Edward J. Zajac, “Where Can Capabilities Come
From? How the Content of Network Ties Affects Capability Acquisition”, April 2008.
2008-15 Vladimir I. Ivanov and Ronald W. Masulis, “Corporate Venture Capital, Strategic Alliances,
and the Governance of Newly Public Firms”, May 2008.
2008-16 Dick Beason, Ken Gordon, Vikas Mehrotra and Akiko Watanabe, “Does Restructuring Pay
in Japan? Evidence Following the Lost Decade”, July 2008 (revision uploaded on Oct.
2009).
2009-1 Vikas Mehrotra, Dimitri van Schaik, Jaap Spronk, and Onno Steenbeek, “Creditor-Focused
Corporate Governance: Evidence from Mergers and Acquisitions in Japan,” August, 2009.
2009-2 Debin Ma, “Law and Economic Change in Traditional China: A Comparative Perspective,”
September, 2009.
2009-3 Robert C. Allen, Jean-Pascal Bassino, Debin Ma, Christine Moll-Murata, and Jan Luiten van
Zanden, “Wages, Prices, and Living Standards in China, 1738-1925: in Comparison with
Europe, Japan, and India,” June 2009.
2009-4 Jung-Wook Shim, “The Existence of Nepotism: Evidence from Japanese Family Firms,”
October 2009.
2009-5 Morten Bennedsen and Kasper Meisner Nielsen, “Incentive and Entrenchment Effects in
European Ownership,” March 2009.
2009-6 Joseph P.H. Fan, TJ Wong, Tianyu Zhang, “Founder Succession and Accounting Properties,”
April 2009.
2009-7 Hiroyuki Okamuro, Masatoshi Kato, and Yuji Honjo, “Determinants of R&D Cooperation in
Japanese High-tech Start-ups,” November 2009.
2009-8 Bill Francis, Iftekhar Hasan, Michael Koetter, and Qiang Wu, “The Effectiveness of
Corporate Boards: Evidence from Bank Loan Contracting,” November 2009.
2009-9 Allen N. Berger, Iftekhar Hasan and Mingming Zhou, “The Effects of Focus Versus
Diversification on Bank Performance: Evidence from Chinese Banks,” November 2009.
2009-10 Leonardo Becchetti, Andrea Carpentieri and Iftekhar Hasan, ”The Determinants of Option
Adjusted Delta Credit Spreads: A Comparative Analysis on US, UK and the Eurozone,”
November 2009.
2009-11 Luciano I. de Castro and Harry J. Paarsch, “Testing Affiliation in Private-values Models of
First-price Auctions Using Grid Distributions,” December 2009.
2009-12 Chulwoo Baek, YoungGak Kim and Heog Ug Kwon, “Market Competition and Productivity
after the Asian Financial Crisis: Evidence from Korean Firm Level Data,” December 2009.

wp-11
2009-13 Jee-Hyeong Park, Stephen J. Spurr, and Sheng-Kai Chang, “A Model of Hierarchical
Professionals: Cooperation and Conflict between Anesthesiologists and CRNAs,” October
2009.
2009-14 Jee-Hyeong Park, “Enforcing International Trade Agreements with Imperfect Private
Monitoring: Private Trigger Strategies and the Possible Role of the WTO,” December 2009.
2009-15 Yuji Honjo, Masatoshi Kato and Hiroyuki Okamuro, “R&D financing of start-up firms:
How much does founders’ human capital matter?”, March 2010.
2010-1 Sergei V. Ryazantsev, “Migrant Workers from Central Asian Russian Federation”, June
2010.
2010-2 Tue Gørgens, Xin Meng, and Rhema Vaithianathan, “Stunting and Selection Effects of
Famine: A Case Study of the Great Chinese Famine,” October 2010.
2010-3 Masatoshi Kato and Yuji Honjo, “Heterogeneous Exits: Evidence from New Firms,”
November 2010.
2010-4 Sung-Jin Cho, Harry J. Paarsch, and John Rust, “Is the ’Linkage Principle’ Valid?:
Evidence from the Field,” November 2010.
2010-5 Jean-Pascal Bassino and Noriko Kato, “Rich and slim, but relatively short Explaining the
halt in the secular trend in Japan,” November 2010.
2010-6 Robert G Gregory, Dark Corners in a Bright Economy; The Lack of Jobs for Unskilled
Men,” December 2010.
2010-7 Masatoshi Kato and Hiroyuki Odagiri, “Development of University Life-Science Programs
and University-Industry Joint Research in Japan,” December 2010.
2010-8 Han Hong, Harry J. Paarsch and Pai Xu, “On the Asymptotic Distribution of the Transaction
Price in a Clock Model of a Multi-Unit, Oral, Ascending-Price Auction within the
Common-Value Paradigm,” January 2011.
2010-9 Tue Gørgens and Allan W¨urtz, “Testing a Parametric Function Against a Nonparametric
Alternative in IV and GMM Settings,” January 2011.
2010-10 Timothy P. Hubbard, Tong Li and Harry J. Paarsch, “Semiparametric Estimation in Models
of First-Price, Sealed-Bid Auctions with Affiliation,” January 2011.
2010-11 Yutaka Arimoto, Kentaro Nakajima, and Tetsuji Okazaki, “Agglomeration or Selection? The
Case of the Japanese Silk-Reeling Clusters, 1908–1915,” March 2011.
2010-12 Yukiko Abe, “Regional Variations in Labor Force Behavior of Women in Japan,” March
2011.
2010-13 Takashi Kurosaki and Hidayat Ullah Khan, “Vulnerability of Microfinance to Strategic
Default and Covariate Shocks: Evidence from Pakistan” , March 2011.
wp-12
2010-14 Fumiharu Mieno, “Foreign Ownership, Listed Status and the Financial System in East Asia:
Evidence from Thailand and Malaysia”, March 2011.
2010-15 Hidenobu Okuda and Lai Thi Phuong Nhung, "Fundraising Behaviors of Listed Companies
in Vietnam: An Estimation of the Influence of Government Ownership", March 2011.
2011-1 Hiroyuki Okamuro and Junichi Nishimura, “Impact of University Intellectual Property
Policy on the Performance of University-Industry Research Collaboration”, May 2011.
2011-2 Yutaka Arimoto, “Participatory Rural Development in 1930s Japan: The Economic
Rehabilitation Movement”, July 2011.
2011-3 Yutaka Arimoto, “The Impact of Farmland Readjustment and Consolidation on Structural
Adjustment: The Case of Niigata, Japan”, July 2011.
2011-4 Hidayat Ullah Khan, Takashi Kurosaki, and Ken Miura, “The Effectiveness of
Community-Based Development in Poverty Reduction: A Descriptive Analysis of a
Women-Managed NGO in Rural Pakistan”, September 2011.
2011-5 Jane Harrigan, “Food Security in the Middle East and North Africa (MENA) and
sub-Saharan Africa: A Comparative Analysis”, September 2011.
2011-6 Machiko Nissanke, “International and Institutional Traps in Sub-Saharan Africa under
Globalisation: A Comparative Perspective”, September 2011.
2011-7 Hiroyuki Okamuro and Junichi Nishimura, “Management of Cluster Policies: Case Studies
of Japanese, German, and French Bio-clusters”, October 2011.
2011-8 Anne Booth, “Growing Public? Explaining the Changing Economic Role of the State in
Asia over the 20th Century”, December 2011.
2011-9 Jarko FidrmucI, Iikka KorhonenII, and Ivana BátorováIII, “China in the World Economy:
Dynamic Correlation Analysis of Business Cycles”, December 2011.
2011-10 Yutaka Arimoto, Kentaro Nakajima, and Tetsuji Okazaki, “Productivity Improvement in the
Specialized Industrial Clusters: The Case of the Japanese Silk-Reeling Industry”, December
2011.
2011-11 Masatoshi Kato, Hiroyuki Okamuro, and Yuji Honjo, “Does Founders’ Human Capital
Matter for Innovation? Evidence from Japanese Start-ups”, December 2011.
2011-12 Yoshihisa Godo, “A New Database on Education Stock in Taiwan”, February 2012.
2011-13 Yutaka Arimoto, Narumi Hori, Seiro Ito, Yuya Kudo, and Kazunari Tsukada, “Impacts of an
HIV Counselling and Testing Initiative: Results from an Experimental Intervention in South
Africa”, March 2012.
2011-14 Fumiharu Mieno and Hisako Kai, “Do Subsidies Enhance or Erode the Cost Efficiency of
Microfinance? Evidence from MFI Worldwide Micro Data”, April 2012.

wp-13
2012-1 Youngho Kang and Byung-Yeon Kim, “Immigration and Economic Growth: Do Origin and
Destination Matter?”, July 2012.
2012-2 Hee-Dong Yang, Christoph Karon, Sora Kang, “To Convert or not to Convert to the
Upgraded Version of de-facto Standard Software?”, August 2012.
2012-3 Yutaka Arimoto, Takeshi Fujie, and Tetsuji Senda, “Farmers' Debt in 1930's Japan”, October
2012.
2012-4 Kyoji Fukao and Tangjun Yuan, “China’s Economic Growth, Structural Change and the
Lewisian Turning Point”, November 2012.
2012-5 Jonathan Morduch, Shamika Ravi, and Jonathan Bauchet, “Failure vs. Displacement: Why
an Innovative Anti-Poverty Program Showed No Net Impact”, December 2012.
2012-6 Yutaka Arimoto, Seiro Ito, Yuya Kudo, and Kazunari Tsukada, “Stigma, Social Relationship
and HIV Testing in the Workplace: Evidence from South Africa”, February 2013.
2012-7 Yutaka Arimoto, Shinsaku Nakajima, and Kohji Tomita, “Farmland Consolidation by Plot
Exchange: A Simulation-based Approach”, March 2013.
2012-8 Takashi Kurosaki, “Household-level Recovery after Floods in a Developing Country:
Evidence from Pakistan”, November 2012.
2012-9 Yuko Mori and Takashi Kurosaki, “Does Political Reservation Affect Voting Behavior?
Empirical Evidence from India”, January 2013.
2012-10 Takashi Kurosaki, “Vulnerability of Household Consumption to Floods and Droughts in
Developing Countries: Evidence from Pakistan”, March 2013.
2012-11 Takashi Kurosaki and Hidayat Ullah Khan, “Household Vulnerability to Wild Animal
Attacks in Developing Countries: Experimental Evidence from Rural Pakistan”, March
2013.