Embed Size (px)
Citation preview

Centralia Power Plant Centralia Power Plant BART-Like Control BART-Like Control
Technology AnalysisTechnology Analysis
Alan Newman, PEAlan Newman, PEWashington State Department of Washington State Department of
EcologyEcology


Why was the BART-like process Why was the BART-like process done?done?
• Response to requests from NPS, USFS, and EPA Region 10 to recognize Reasonably Available Control Technology decision as equal to or better than BART
• Done by Ecology for inclusion in the SWCAA’s RACT Order Technical Support Document
• The RACT technology review was in response to a SWCAA request for the plant to evaluate and implement emission controls to reduce the air quality impacts of the plant.

Brief historyBrief history
• Permitted in 1969 for construction• Unit 1 on line in 1972, Unit 2 in 1972• Initial operational problems with particulate
controls limited generation to less than full design rate
• Particulate problems fixed but new coal field increased SO2 causing continuing operational limitations until company could address

Plant descriptionPlant description
• 2 B&W tangentially fired dry bottom pulverized coal boilers
• Steam turbines rated at 1440 MWe, boiler limited to 1404 MWe
• Mine mouth plant designed for Centralia coal field’s sub-bituminous coal
• At full production, uses about 6.5 million tons of coal per year, Powder River Basin provides coal that the mine can’t produce

Initial Design criteria for PlantInitial Design criteria for Plant
Coal BTU 6681 BTU/lb
% sulfur 0.85%
Flue gas 7,730,000 lb/hr, 40,400 acfs
Inlet grain loading
10.72 g/scf
Outlet “ 0.06 “
ESP efficiency 99.44%
Steam Generator Capacity
5,168,000 lb/hr @ 2990 psig and 700 degrees F (700 MWe)

1988/89 Control Technology Analysis1988/89 Control Technology Analysis
• Required to look at plant solutions for measured stack and ambient SO2 violations
• Concluded that no cost effective SO2 or NOx control existed to implement at the plant

Plant Emissions Before RACTPlant Emissions Before RACT
Pollutant 1996 emissions Potential to emit
SO2 78,272 tpy 100,000 – 120,000 tpy
NOx 18,565 tpy ~25,000 tpy
PM 0.02 – 0.03 g/dscf 0.06 g/dscf

1995 RACT Analysis1995 RACT Analysis
• Required by local air pollution control authority to comply with state law
• Established SO2 limit at Acid Rain Allowance level (55,000 tpy)
• Did not address other pollutants• RACT Order appealed
– Conclusion that RACT limit did not protect human health
– SWCAA repealed the order setting stage for negotiated process and final RACT report and Order

Collaborative Decision Making Collaborative Decision Making ProcessProcess
• Year long negotiation process involving Pacific Corp, the rest of the owners and
• Used a facilitator/mediator to move the process along
Southwest Clean Air Agency
Ecology National Park Service
US Forest Service
EPA Puget Sound Clean Air Agency

Ground Rules Of The CDM Ground Rules Of The CDM NegotiationsNegotiations
• Result would not cause plant to close• Accepted NPS visibility impacts modeling • Agreed plant subject to BART based on unit age
and emissions• Agreed that a an attribution of visibility impacts
would not be done• Goal would be to minimize visibility impacts
based on the NPS monitoring

Visibility Evaluation by NPSVisibility Evaluation by NPS
SO2 Emissions in tpy % control Potentially Impacted days at all Modeled sites
94,526[1] 0 53
69,414 0 36
34,707 50 13
20,824 70 4
13,883 80 2
6,941 90 0
[1] 2/24/95 National Park Service comment letter on Draft 1995 RACT Order Estimated as the PTE for the plant

Technology EvaluationTechnology Evaluation
• 74 different SO2 control techniques evaluated
• 37 different NOx control techniques evaluated
• Lists included experimental technologies which would remove SO2 and NOx
• PM/PM10 emission limits based on series ESPs would be evaluated

Types Of SOTypes Of SO22 Technologies Technologies
EvaluatedEvaluated• Experimental
– Chemical recovery technologies– Joint SO2 and NOx removal technologies
• Conventional– Multiple vessel configurations– Single vessel configurations– Lime and limestone based– Ammonia based– 100% PRB coal– Conversion to natural gas

Criteria to Shorten ListCriteria to Shorten List
• Only available technologies• Meets emission limits from the CDM negotiation• Used on coal fired powerplants• At least as effective in reducing pollutant as
controls installed• Technical feasibility• Does not generate safety hazards at plant• Minimal adverse impact on salability of by-
products
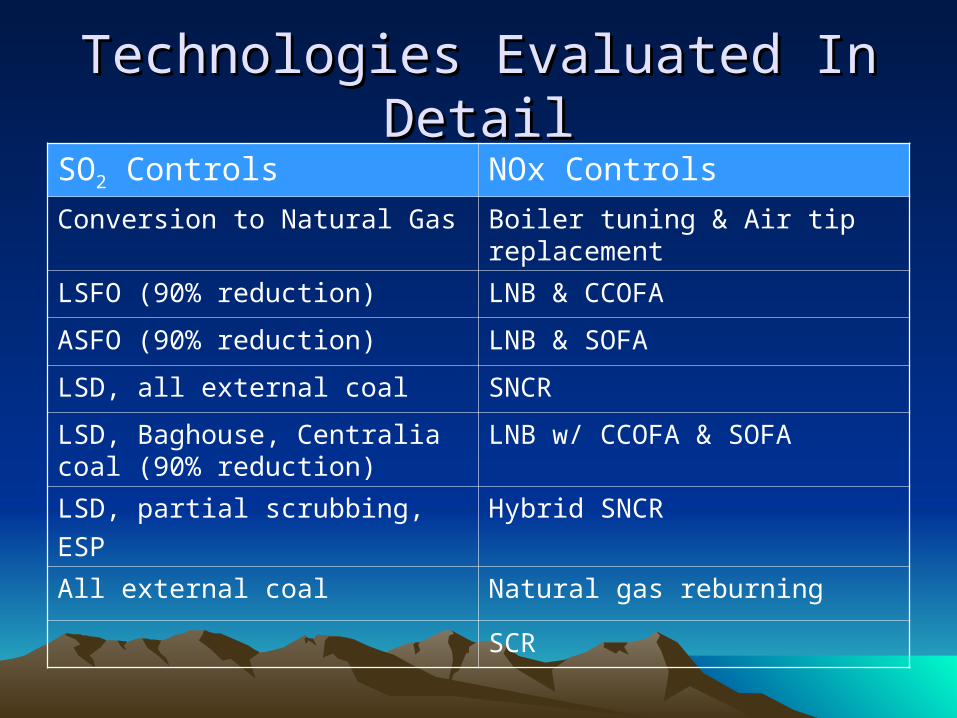
Technologies Evaluated In DetailTechnologies Evaluated In Detail
SO2 Controls NOx Controls
Conversion to Natural Gas Boiler tuning & Air tip replacement
LSFO (90% reduction) LNB & CCOFA
ASFO (90% reduction) LNB & SOFA
LSD, all external coal SNCR
LSD, Baghouse, Centralia coal (90% reduction)
LNB w/ CCOFA & SOFA
LSD, partial scrubbing,
ESP
Hybrid SNCR
All external coal Natural gas reburning
SCR
Common CharacteristicsCommon Characteristics
• By products would be marketable• No changes to wastewater discharge
permits required• No or minimal hazardous waste generated• Took advantage of 20+ years of FGD
technology and reliability improvements by minimizing component count
• Reduced modeled visibility impacts to 2 days or less impacted per year

Cost Effectiveness - NOx Controls
0
2000
4000
6000
8000
10000
12000
14000
0 1000 2000 3000 4000 5000 6000
$/TPY reduced
TP
Y R
ED
UC
ED
Selected Controls

Selected SOSelected SO22 Technology Technology
• LSFO FGD system– 1 ball mill for both FGD vessels– 1 FGD vessel per boiler– 1 common FO/clarifier unit– Gypsum sold for wallboard
• Cost effectiveness of $250 – 300/ton
• Emission limit of 10,000 ton SO2 per 12 month period

Selected NOx Control TechnologySelected NOx Control Technology
• Combustion Controls– Low NOx burners
– CCOFA
– SOFA
• Cost effectiveness of $113 – 233/ton
• Emission limit of 0.30 lb/MMBtu

PM/PM10 ControlPM/PM10 Control
• No technology changes seriously evaluated
• Some changes considered as part of adding Lime Spray Drier controls
• Review supported PM limit of 0.010 grains/dscf to include effects of selected FGD process

Effects of Selected ControlsEffects of Selected Controls
• Reduced modeled visibility impacts to 2 days or less impacted per year
• Did not affect salability of collected fly ash for pozzolan
• Gypsum produced is salable for wall board
• Fits the plant site
• Did not generate a hazardous waste of require NPDES permit to be modified
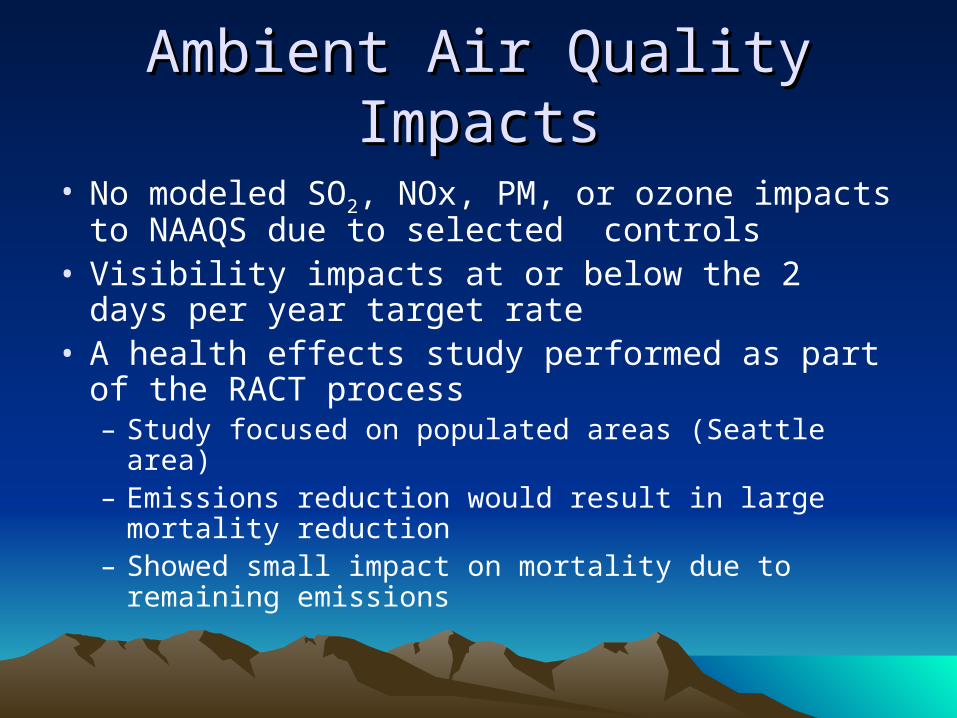
Ambient Air Quality ImpactsAmbient Air Quality Impacts
• No modeled SO2, NOx, PM, or ozone impacts to NAAQS due to selected controls
• Visibility impacts at or below the 2 days per year target rate
• A health effects study performed as part of the RACT process– Study focused on populated areas (Seattle area) – Emissions reduction would result in large mortality
reduction– Showed small impact on mortality due to remaining
emissions

BART like analysisBART like analysis• Evaluation done by Ecology for inclusion in
SWCAA support document
• Done to support inclusion of the SO2 and NOx limitations in the SIP
• Followed process in the 1980 BART for fossil fueled electric generating plants guidance
• Used the RACT technical evaluation for its base
• Included a comparison to the NSPS limits

Legal Results Of ProcessLegal Results Of Process
• One person appealed the results of the RACT process numerous times
• Contended that public health from SO2 impacts not protected
• Health effects study supported RACT decision
• Courts supported SWCAA process and decision in the final RACT order at every appeal

Financing and Tax Aspects of Financing and Tax Aspects of ProjectProject
• Capital costs estimated at $250,000,000 (final costs about $200,000,000)
• Owners insisted that project needed tax breaks to make economically feasible
• Went to legislature to get sales and property tax relief on new control equipment
• Tax relief law passed second time proposed– contained the RACT SO2 emission limit– “banked” certain sales taxes while construction underway– Releases banked taxes once plant met emission limits– Contains tax penalty if emission limit not maintained– Contained requirement to educate plant and mine workers of
owners chose to close plant rather than install controls

Phase 1 Visibility SIP Phase 1 Visibility SIP
• Contains Centralia RACT limits for SO2 and NOx as part of reasonable progress

Centralia Emission LimitsCentralia Emission LimitsPollutant Limitation Control Equipment
Sulfur Dioxide 10,000 tons per year, rolling 12 month total
250 ppm @ 7% O2, 1 hour average
Wet Limestone, Forced Oxidation or
Ammonium Sulfate Forced Oxidation
Nitrogen oxides 0.30 lb/mmBtu, calendar year average, both units averaged together for all operating hours when the a unit’s generating load is over 360 MW gross
0.35 lb/mmBtu calendar year average, both units averaged together, all operating hours
Low NOx burners plus Close Coupled Over-fire Air and Separated Over-fire Air (Level 3)
Particulate Matter 0.010 g/dscf, EPA RM 5, front half only
20% opacity, 6 minute average except for 1, 6 minute period per hour of not more than 27% opacity
Existing, series electrostatic precipitators with wet SO2 control system
Carbon Monoxide 200 ppm calendar year average Good combustion practices