Embed Size (px)
Citation preview
CESIS Electronic Working Paper Series
Paper No. 96
Institutional Owners and the Return on Investments
by
Per-Olof Bjuggren, Johan E. Eklund and Daniel Wiberg
(JIBS and CESIS)
September 2007
1
Institutional Owners and the Return on Investments
Per-Olof Bjuggren, Johan E. Eklund, and Daniel Wiberg*
Jönköping International Business School (JIBS), and Centre of Excellence for Science and Innovation Studies (CESIS), Royal Institute of Technology, Stockholm.
Adress:
Jönköping International Business School (JIBS), Department of Economics, P.O. Box 1026
SE-551 11 Jönköping, SWEDEN Phone: +46-36-157700, Fax: +46-36-121832
E-mail: [email protected]
[email protected] [email protected]
*Corresponding author Abstract
Examining a large number of Swedish listed firms, this paper analyses how institutional owners affects the investment decisions and firm performance. During the last decades the ownership structure of Swedish firms has undergone dramatic changes: institutional and foreign investors have been increasing their stakes, whereas Swedish households have decreased in importance. Controlling owners, often founding families, remain in control by resorting to an extensive use of dual-class shares. To measure investment performance Mueller and Reardon’s (1993) marginal q is used. Marginal q measures the ratio of the return on investments to the cost of capital. We find that institutional and foreign owners positively influence the performance of firms. Furthermore a non-liner relation between ownership concentration and performance is found. This is consistent with positive incentive effects and negative entrenchment effects. The practice of dual-class shares which separate cash-flow rights and control rights is also found to be an important determinant of firm performance. JEL Codes: G 30, C 23, K22, L25 Acknowledgments: Financial support from Sparbankernas Forskningsstiftelse to Daniel Wiberg’s and Johan Eklund’s dissertation work is gratefully acknowledged. A research grant from the Ratio Institute and the Marcus and Amalia Wallenberg Memorial Fund Foundation and support from the Centre for Excellence for Science and Innovation Studies (CESIS) is also gratefully acknowledged.
2
1. Introduction
Over the last decades the role of institutional and foreign investors has grown
dramatically. Along with the increased importance of this kind of investors have
followed an increased interest in the role, and effect’s, of this “anonymous-capital”.
These institutional investors, both foreign and domestic, are often called upon to solve
and minimize the managerial discretion problems through their role as large and
influential owners.
One problem with institutional investors as owners is that they often own relatively
small stakes in the individual firms in their investment portfolios, which provides
weak incentives to actively exercise corporate control. Furthermore, it is sometimes
argued that even though they might exert substantial pressure on managements, the
costs of monitoring often seem to outweigh the benefits.
This paper provides empirical evidence on the impact of ownership on firms’
investment performance. In particular the influence of institutional and foreign
investors is investigated. An additional question addressed in the paper is how control
instruments such as dual-class shares relate to ownership and firm performance.
Similar studies have used measures’ of Tobin’s average q, as a measure of firm
performance. However, for the purpose of testing investment efficiency a marginal
performance measure is more appropriate. This paper adopts such a performance
measure, marginal q, developed by Mueller and Reardon (1993). This measure gives
the ratio of a firm’s returns on investment, or marginal adjustment of the capital stock,
to its cost of capital.
3
A distinctive feature of the continental European governance system, and particularly
the Swedish, is the strong concentration of ownership. Pyramids, cross-holdings and
dual-class shares are three common methods used to maintain ownership whilst attract
new capital.1 In Sweden this system has produced remarkable persistent ownership
structures, in combination with a relatively vital capital market. As in most
Continental European countries, large commercial banks have played, and still play, a
fundamental role. These factors make Sweden a particularly interesting country to
study when the impact of ownership on firm performance is examined.
The remainder of the paper is organized in 7 sections. Section 2 gives a short
description of the Swedish Corporate ownership structure in general. In section 3
institutional investors are discussed. From this discussion we also formulate our
hypothesis about the impact of ownership on firm performance. Methodology and
derivation of the marginal q measure are given in section 4. Variables and descriptive
statistics are presented along a discussion about the data in section 5. Section 6 then
follows with the empirical results and analysis. Conclusions end the paper in section
7.
1 Dual-class shares: A company that issues more than one type of shares that entitles to different voting rights or a non-voting share type. In effect the strongest form of anti-takeover provision, where a shareholder can gain control without holding the proportional stake of equity. Pyramidal ownership: A way of assuring ownership concentration among a smaller group of shareholders by investing a majority stake in one company, which in its turn owns large stakes in other companies. Cross-holdings: A situation where a company indirectly holds shares in itself through its own shareholders. Through indirectly investing in the company using cross- holding arrangements, a controlling owner can strengthen his position vis-à-vis other shareholders without bearing the entire cost.
4
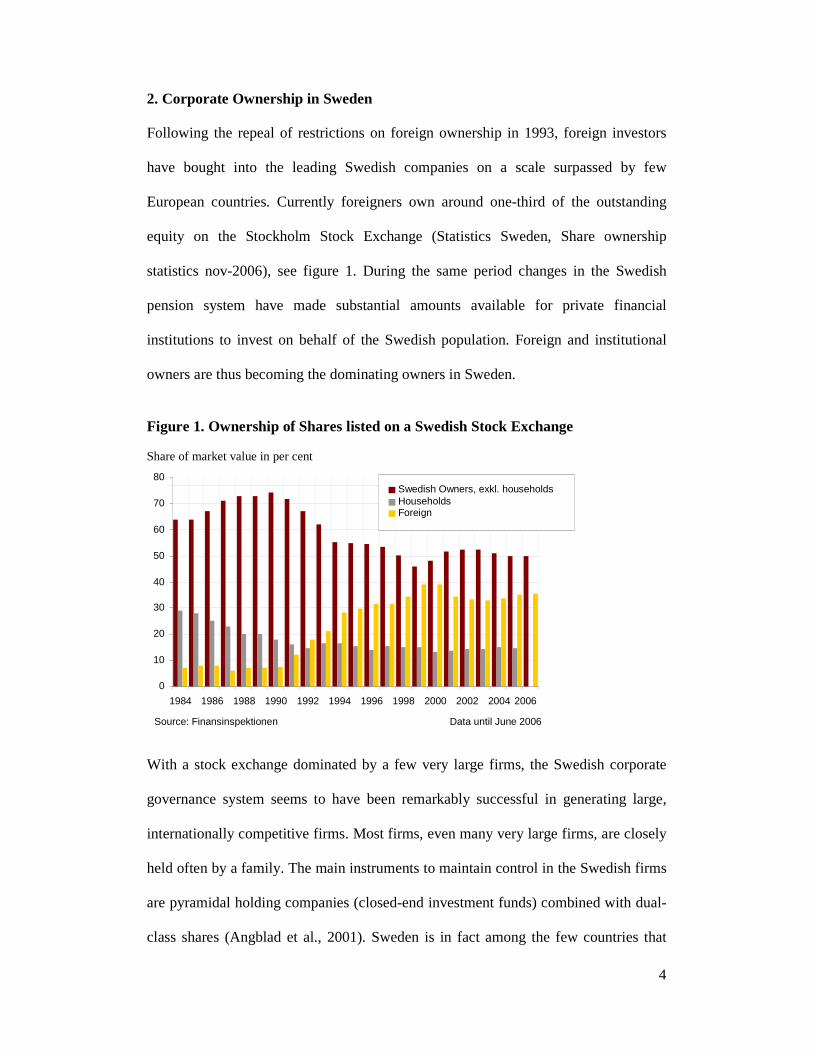
2. Corporate Ownership in Sweden
Following the repeal of restrictions on foreign ownership in 1993, foreign investors
have bought into the leading Swedish companies on a scale surpassed by few
European countries. Currently foreigners own around one-third of the outstanding
equity on the Stockholm Stock Exchange (Statistics Sweden, Share ownership
statistics nov-2006), see figure 1. During the same period changes in the Swedish
pension system have made substantial amounts available for private financial
institutions to invest on behalf of the Swedish population. Foreign and institutional
owners are thus becoming the dominating owners in Sweden.
Figure 1. Ownership of Shares listed on a Swedish Stock Exchange Share of market value in per cent
With a stock exchange dominated by a few very large firms, the Swedish corporate
governance system seems to have been remarkably successful in generating large,
internationally competitive firms. Most firms, even many very large firms, are closely
held often by a family. The main instruments to maintain control in the Swedish firms
are pyramidal holding companies (closed-end investment funds) combined with dual-
class shares (Angblad et al., 2001). Sweden is in fact among the few countries that
0
10
20
30
40
50
60
70
80
1984 1986 1988 1990 1992 1994 1996 1998 2000 2002 2004 2006
Swedish Owners, exkl. householdsHouseholdsForeign
Source: Finansinspektionen Data until June 2006
5
allow both dual-class share systems and pyramidal ownership structures (La Porta et
al., 1999).
Proponents of the Swedish governance system often argue that significant ownership
stakes and control in the hands of one or few owners is vital in order to create correct
incentive structures of entrepreneurs and managers. There is however no research
which give support to these claims.
Equity stakes may tilt management’s incentives towards the pursuit of share-value
maximizing strategies, but substantial management ownership could also lead to
expropriation of outside minority shareholders, as shown by Jensen and Meckling
(1976). Thus, large voting stakes held by insiders may not necessarily lead to
performance improvement. In fact, McEachern (1975) argued that large shareholdings
in the hands of the managers might actually worsen the performance of the firms.
Since then more studies supportive to this claim, such as Morck et al., (1988) and
Gugler et al., (2002), have been carried out on the relationship between managerial
ownership and firm performance.
Despite the dominance of a few large firms and despite the stringent ownership
structure, the financial market in Sweden is vital. According to Agnblad et al., (2001),
the market for corporate control, Initial Public Offerings (IPO’s) and Seasoned Equity
Offerings (SEOs) are active by European standards, and the markets for standardized
derivatives are sophisticated and active. Still, this is by European standards where
hostile takeovers are very rare, IPOs done mainly by fairly mature firms, and
securitization of loans has just begun to develop.
6
Another effect of the Swedish corporate governance model, with its strong separation
of ownership and control, is that it locks in owners for long periods of time. The
widespread use of dual-class shares and pyramid structures can thus have substantial
costs in terms of loss of dynamics in ownership and control. Due to these minority
control arrangements hostile takeovers for example, have gone from very few in the
late 1980s to virtually none. Moreover, the costs of rising outside capital may
significantly constrain growth options open to the Swedish firms.
3. Institutional Investors
Common features to all institutional investors is that they provide a form of risk
pooling for small investors, hence providing a better trade-off of risk and return than
what is achievable via direct holdings. Today, different kinds of institutional investors
deal with various markets and clients, and for various purposes. Many act on several
markets simultaneously and the competition is fears for market shares and clients.
Hence, institutional investors are a far from homogeneous group. They differ in terms
of contractual relations between the owners of the assets and the asset managers, that
is, the rules determining the distribution of risk and return, as well as in the definition
of their liabilities. The institutional investors that this paper concerns can be
summarized as pension funds, life insurance companies, and mutual funds.
One factor favouring institutional investors relative to individuals is their ability to
absorb and process information. In many cases it is this informational advantage that
the consumer pays for. This advantage has also given rise to the expression “informed
investors” which distinguish this type of professional investor from the average
7
individual. However, the information advantage might be large or small depending on
the type of institution, and the type of information.
With the size of many institutions also follows the potential for improved control over
companies in which they invest. Hirschman (1970) showed how “exit and voice”
behaviour might work to reduce moral hazard problems. Berle (1960) also argued that
institutional investors might discipline managers through their importance as market
participants; he described this as “power without property” (Mueller, 2003).
Institutional owners might for that reason be well apt to minimize the problems
associated with the separation of ownership and control, originally presented by Berle
and Means (1932).
It is important to note however, that the institution in it self suffer from the same
incentive problems between its owners and managers. These kinds of incentive
problems may also arise between other parties related to, and within the institution;
for instance, between the board of directors and the asset management. This leads us
to another characteristic of the institutional investors, the asset management.
There are different incentive problems in the asset management relationship. On the
one hand, it gives rise to an essentially fiduciary relationship to the ultimate investor,
a relationship that often entails a degree of caution in the portfolio strategy and a
desire to limit risks incurred. On the other hand, such delegation raises principal-agent
problems. So, unless the fund manager is perfectly monitored and/or a perfect contract
is drawn up, the fund manager may act in his or her own interests (e.g., in generating
excessive commission income) or in the interest of financial institutions related to
8
them. These objectives may even be contrary to those of the liability holders or at
least not direct in line with their interests (Davis and Steil, 2001).
Despite the very high percentage of the total market capitalization controlled by
institutions, they are not major players from an ownership perspective (Goergen and
Renneboog, 2001), although their accumulated share holdings are significant,
shareholdings in individual companies are often small (An explanation to this is that
institutions more than others invest in large companies. Gompers et al. (2001) have
provided evidence that it is the case in the U.S. stock market). In the Swedish listed
firms the aggregate institutional shareholdings is on average around ten per cent.
Hence the potential benefits from active monitoring can hardly outweigh the costs for
institutional investors. This prompts institutions to free ride on corporate control
(Shleifer and Vishny, 1997). Furthermore, some institutional investors, such as some
mutual funds, invest in accordance with low-cost passive strategies and thus lack the
resources for active monitoring of the large number of companies in their portfolios.
In order to remain cost-efficient, rather than engage in active monitoring, institutional
investors prefer to simply “exit” and sell of poorly performing firms. The crucial
question is therefore whether or not the potential benefits from monitoring outweighs
the costs of doing so.
Another reason for the low institutional involvement in corporate governance issues is
insider-trading regulations (Goergen and Renneboog, 2001). If the institutional
investors do not want to immobilize parts of their portfolios, they might have to
restrict active involvement in corporate strategies.
9
From the discussion above it seems like a negative relationship between institutional
ownership should be expected. There are however, as pointed out in a number of
recent articles, many reasons to expect that the relationship is actually positive.
As institutional investors are constantly being evaluated by how well they succeed in
creating shareholder value (Thomsen and Pedersen, 2000). There is not much room
for catering to other objectives (as far as competition works as a stick). In this sense
the incentives to use voice or exit in value-increasing manner are probably stronger
than for other types of owners. That is, in spite of comparatively low ownership
stakes, the focus of institutional investors is predominantly on shareholder value.
Furthermore risk aversion is less likely to play a role in the governance actions of
institutional owners. Risk diversification characterizes institutional owners to a larger
extent than other ownership categories. Therefore they can be argued to have a more
positive view of risky projects with a higher net present value. Considering these two
aspects as well as favourable financing conditions we expect similar to Thomsen and
Pedersen (2000) (see also Nickel et al., (1997), McConnell and Servaes (1990) and
Levin and Levin (1982)) a positive relation between institutional ownership and
investment performance.
As most foreign investors are in fact institutions we expect the same effect on firm
performance as for domestic institutional investors. Based on this and the discussion
above we formulate hypothesis one.
10
Hypothesis 1 (H1): Institutional and foreign ownership has a positive impact
on investment performance.
Most likely this potentially positive effect will be diminishing. The relation between
institutional ownership and the firms’ investment performance might consequently be
non-linear.
In line with Thomsen and Pedersen (2000) we also expect that institutional and
foreign owners will use the influence that goes along with increasing ownership
shares in a value increasing manner, i.e.
Hypothesis 2 (H2): Investment performance will increase with increasing
institutional and foreign ownership share.
There are also some studies that have investigated institutional ownership and vote
differentiated shares i.e. Bjuggren, et al., (2007) and Gompers and Metrick (2001). A
recently published working paper by Li et al., (2006) also addresses this issue. They
find for U.S. data that institutions have smaller ownership stakes in firms with vote
differentiated shares. Furthermore Li et al., (2006) find that institutional owners to a
larger extent “vote” trough exit in this type of firms. Their findings give an extra
explanation to the arguments put forward in (Bjuggren et al., 2007) on why the
existence of vote differentiated shares are likely to have a negative impact on
investment performance. In a market where this type of control instrument is allowed
it is consequently important to control for this effect. Based on this reasoning we
therefore formulate hypothesis 3.
11
Hypothesis 3 (H3): Existence of vote differentials has a negative impact on
investment performance.
Since the incentive structure and the ability to excerpt control is altered when vote
rights are separated from cash-flow rights by vote differentiated share structure we
expect an impact on the incentives of ownership:
Hypothesis 4 (H4): Separation of cash-flow rights from control by the use of
dual-class shares will reduce the effects of ownership has on firm
performance.
Given the negative view of vote differentiated shares an explanation has to be
provided why these types of share are bought by institutional investors. Gompers et al
(2001) find that institutions invest in liquid stock. For many Swedish companies with
A- and B-shares it is only the B-shares that are regularly traded. We therefore expect
that institutional and foreign owners primarily invest in capital-shares.
4. Methodology
To test the impact of institutional ownership on firm performance we estimate the
firms’ marginal q (Mueller and Reardon, 1993). The marginal q is essentially a
marginal version Tobin’s q. This is a more correct measure to use when evaluating
firm performance since it is the return on the marginal investment rater than the
average that show weather the firm is over- or under-investing relative to its cost of
capital.
12
Marginal q can be derived from Tobin’s q, where Tobin’s average q, qa, is defined as
the market value, Mt, divided by the replacement cost of the firm capital, Kt:
tatt qKM ,/ = 1)
This measures the average return on the capital over its cost of capital. If qa is above
one this implies that the firm should be investing further. However for adjustments of
the capital stock the marginal return on capital is more relevant. Marginal q measures
the marginal return on capital, i.e. investments. Marginal q, qm, can be derived from
Tobin’s average q. The marginal return on capital is then:
1
11
−
−−
−−−
=∆∆
=tt
ttt
t
tm KK
MMM
K
Mq
δ 2)
where –δ is the depreciation rate. Since the market value in period t can be written as:
ttttt MPVMM µδ +−+= −− 11 3)
where PVt is the present value of the cash flows that investments in period t, It,
generates. The net present value rule of investments stipulates that investments should
be made up to the point where PVt = It. This implies the PVt/It = 1, which can be
rewritten as PVt/It = qm. By dividing both sides of equation 3 with 1−tM and
rearranging we get following empirically testable equation:
111
1
−−−
− ++−=−
t
t
t
tm
t
tt
MM
Iq
M
MM µδ 4)
Equation (4) assumes that the capital market is efficient in the sense that future cash
flows are unbiased estimates. As t grows larger the term 1−tt Mµ will approach 0.
The marginal q, qm, has a number of advantages. Above all a marginal performance
measure is more appropriate than an average Tobin’s q, when testing hypotheses
13
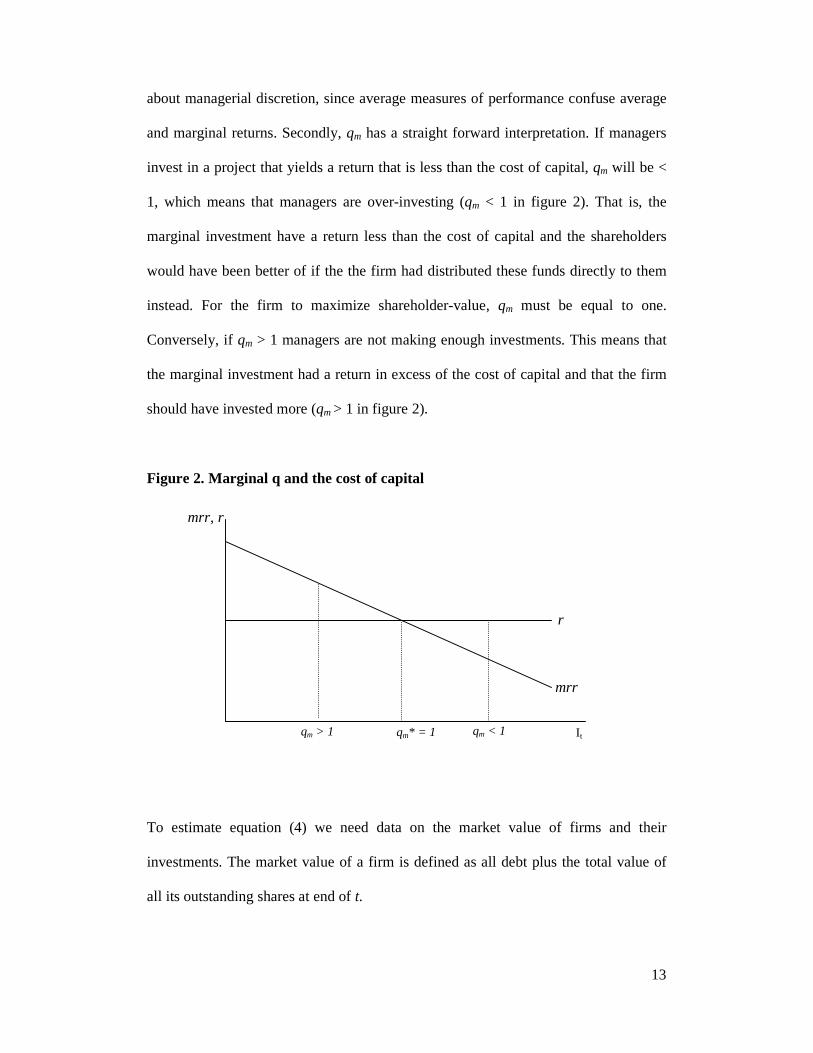
about managerial discretion, since average measures of performance confuse average
and marginal returns. Secondly, qm has a straight forward interpretation. If managers
invest in a project that yields a return that is less than the cost of capital, qm will be <
1, which means that managers are over-investing (qm < 1 in figure 2). That is, the
marginal investment have a return less than the cost of capital and the shareholders
would have been better of if the the firm had distributed these funds directly to them
instead. For the firm to maximize shareholder-value, qm must be equal to one.
Conversely, if qm > 1 managers are not making enough investments. This means that
the marginal investment had a return in excess of the cost of capital and that the firm
should have invested more (qm > 1 in figure 2).
Figure 2. Marginal q and the cost of capital
To estimate equation (4) we need data on the market value of firms and their
investments. The market value of a firm is defined as all debt plus the total value of
all its outstanding shares at end of t.
I t qm* = 1
mrr, r
mrr
r
qm > 1 qm < 1
14
According to the originators, Mueller and Reardon (1993) the investment is defined
as: I = After tax profits + Depreciation – Dividends + ∆Debt + ∆Equity + R&D +
ADV.
where ∆D and ∆E are funds raised using new debt and equity issues. R&D and ADV
(advertising expenditures) are also forms of investment, which may contribute to a
company’s market value and they are therefore included in the investment function.
5. Data and variables
All data on the firms’ market values and investments is provided by Standard and
Poor’s Compustat Global database. The period covered by the data is 1999 until 2005.
The time period covered in the regressions is 2000-2005, due to the first difference in
the dependent variable. In order to study the same individual firms for several periods,
all firms had to provide data for at least three subsequent years. Furthermore, financial
firms where removed form the sample, due to the particular nature of their
investments. The ownership data is provided by SIS-Ägarservice, which is a unique
database covering ownership structure, on a yearly basis, of more than 300 Swedish
listed firms (all firms listed on one of the three major lists at the Stockholm stock
exchange).2
All things considered, the set up requirements produced a sample of 110 Swedish
firms. The sample firms correspond to an aggregate share of more than 85 percent of
2 These firms have all reported their ownership structure to VPC, which operates under the supervision of the Swedish Financial Supervisory Authority and is authorised as a central securities depository and clearinghouse.
15
the total market capitalisation at the Stockholm stock exchange, and approximately 75
percent of the total Swedish export value.
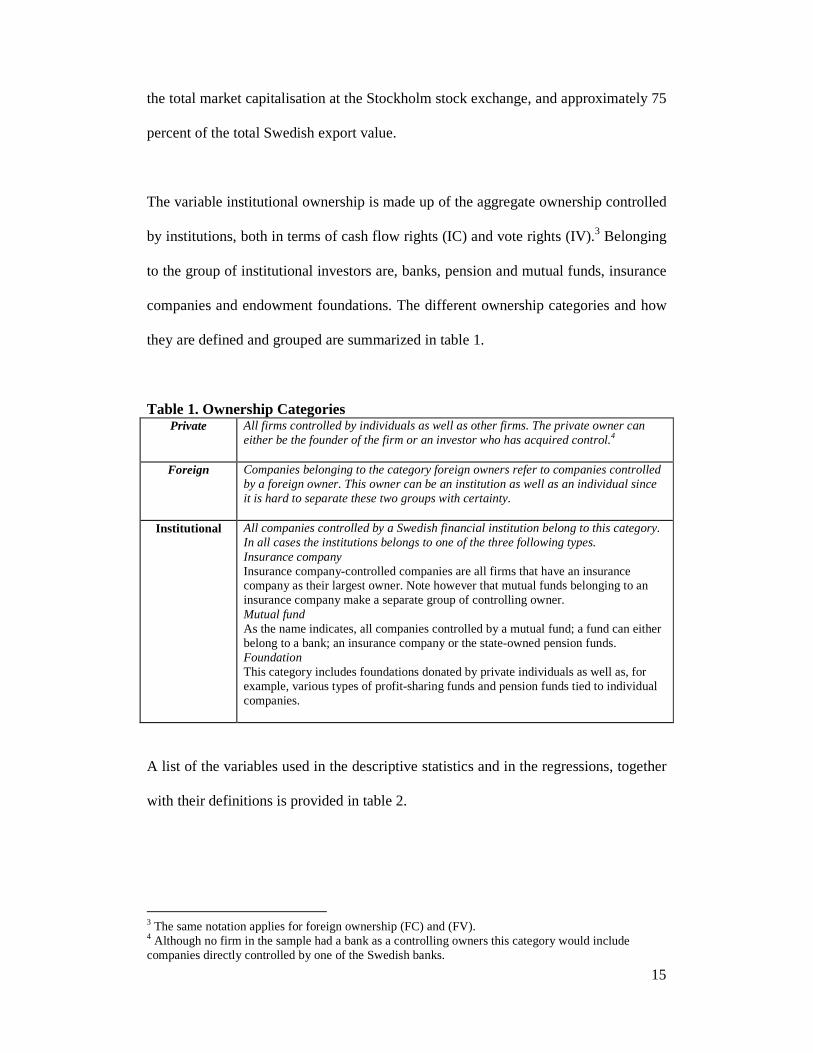
The variable institutional ownership is made up of the aggregate ownership controlled
by institutions, both in terms of cash flow rights (IC) and vote rights (IV).3 Belonging
to the group of institutional investors are, banks, pension and mutual funds, insurance
companies and endowment foundations. The different ownership categories and how
they are defined and grouped are summarized in table 1.
Table 1. Ownership Categories Private
All firms controlled by individuals as well as other firms. The private owner can either be the founder of the firm or an investor who has acquired control.4
Foreign Companies belonging to the category foreign owners refer to companies controlled by a foreign owner. This owner can be an institution as well as an individual since it is hard to separate these two groups with certainty.
Institutional All companies controlled by a Swedish financial institution belong to this category. In all cases the institutions belongs to one of the three following types. Insurance company Insurance company-controlled companies are all firms that have an insurance company as their largest owner. Note however that mutual funds belonging to an insurance company make a separate group of controlling owner. Mutual fund As the name indicates, all companies controlled by a mutual fund; a fund can either belong to a bank; an insurance company or the state-owned pension funds. Foundation This category includes foundations donated by private individuals as well as, for example, various types of profit-sharing funds and pension funds tied to individual companies.
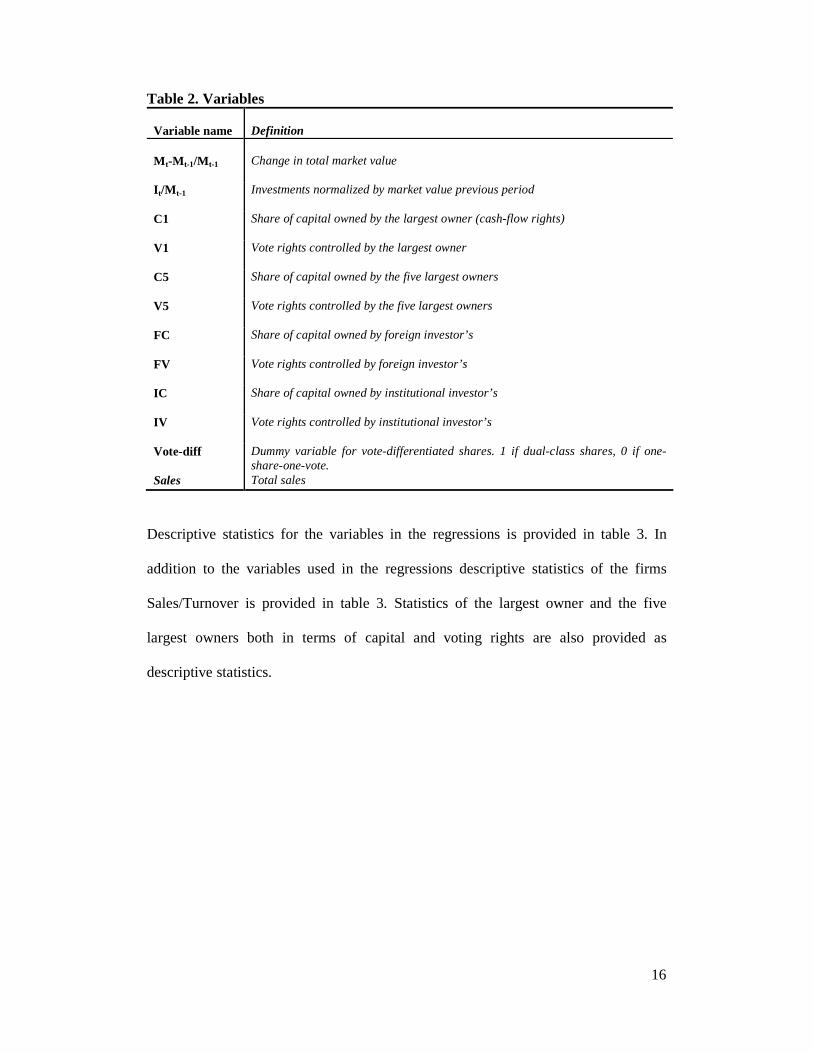
A list of the variables used in the descriptive statistics and in the regressions, together
with their definitions is provided in table 2.
3 The same notation applies for foreign ownership (FC) and (FV). 4 Although no firm in the sample had a bank as a controlling owners this category would include companies directly controlled by one of the Swedish banks.
16
Table 2. Variables Variable name
Definition
Mt-Mt-1/Mt-1
Change in total market value
It/Mt-1 Investments normalized by market value previous period
C1 Share of capital owned by the largest owner (cash-flow rights)
V1 Vote rights controlled by the largest owner
C5 Share of capital owned by the five largest owners
V5 Vote rights controlled by the five largest owners
FC Share of capital owned by foreign investor’s
FV Vote rights controlled by foreign investor’s
IC Share of capital owned by institutional investor’s
IV Vote rights controlled by institutional investor’s
Vote-diff Dummy variable for vote-differentiated shares. 1 if dual-class shares, 0 if one-share-one-vote.
Sales Total sales
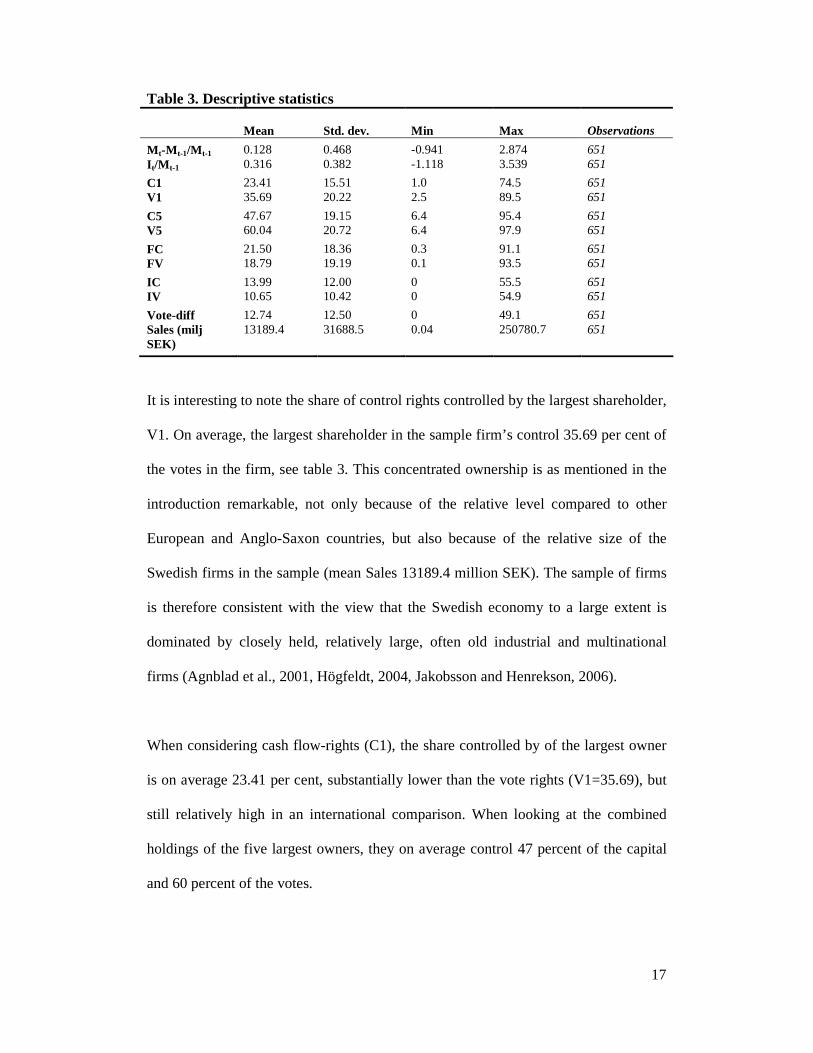
Descriptive statistics for the variables in the regressions is provided in table 3. In
addition to the variables used in the regressions descriptive statistics of the firms
Sales/Turnover is provided in table 3. Statistics of the largest owner and the five
largest owners both in terms of capital and voting rights are also provided as
descriptive statistics.
17
Table 3. Descriptive statistics
Mean Std. dev.
Min
Max
Observations
Mt-Mt-1/Mt-1 0.128 0.468 -0.941 2.874 651 It/Mt-1 0.316 0.382 -1.118 3.539 651
C1 23.41 15.51 1.0 74.5 651 V1 35.69 20.22 2.5 89.5 651
C5 47.67 19.15 6.4 95.4 651 V5 60.04 20.72 6.4 97.9 651
FC 21.50 18.36 0.3 91.1 651 FV 18.79 19.19 0.1 93.5 651
IC 13.99 12.00 0 55.5 651 IV 10.65 10.42 0 54.9 651
Vote-diff 12.74 12.50 0 49.1 651 Sales (milj SEK)
13189.4 31688.5 0.04 250780.7 651
It is interesting to note the share of control rights controlled by the largest shareholder,
V1. On average, the largest shareholder in the sample firm’s control 35.69 per cent of
the votes in the firm, see table 3. This concentrated ownership is as mentioned in the
introduction remarkable, not only because of the relative level compared to other
European and Anglo-Saxon countries, but also because of the relative size of the
Swedish firms in the sample (mean Sales 13189.4 million SEK). The sample of firms
is therefore consistent with the view that the Swedish economy to a large extent is
dominated by closely held, relatively large, often old industrial and multinational
firms (Agnblad et al., 2001, Högfeldt, 2004, Jakobsson and Henrekson, 2006).
When considering cash flow-rights (C1), the share controlled by of the largest owner
is on average 23.41 per cent, substantially lower than the vote rights (V1=35.69), but
still relatively high in an international comparison. When looking at the combined
holdings of the five largest owners, they on average control 47 percent of the capital
and 60 percent of the votes.
18
For the Foreign and Institutional owners cash flow rights seem to be more important
than control which is in line with our expectation. The ownership of vote rights
(FV=18.79% and IV=10.65%) is substantially below the level of cash flow rights
(FC=21.50% and IC=13.99)). For both ownership types the difference is around three
per cent, which also support the hypothesis that the two ownership types are in fact
very similar. That is, the overwhelming majority of the foreign owners are in fact
institutions. The incentive structure and the influence of ownership on the
performance should therefore be similar for foreign and institutional owners.
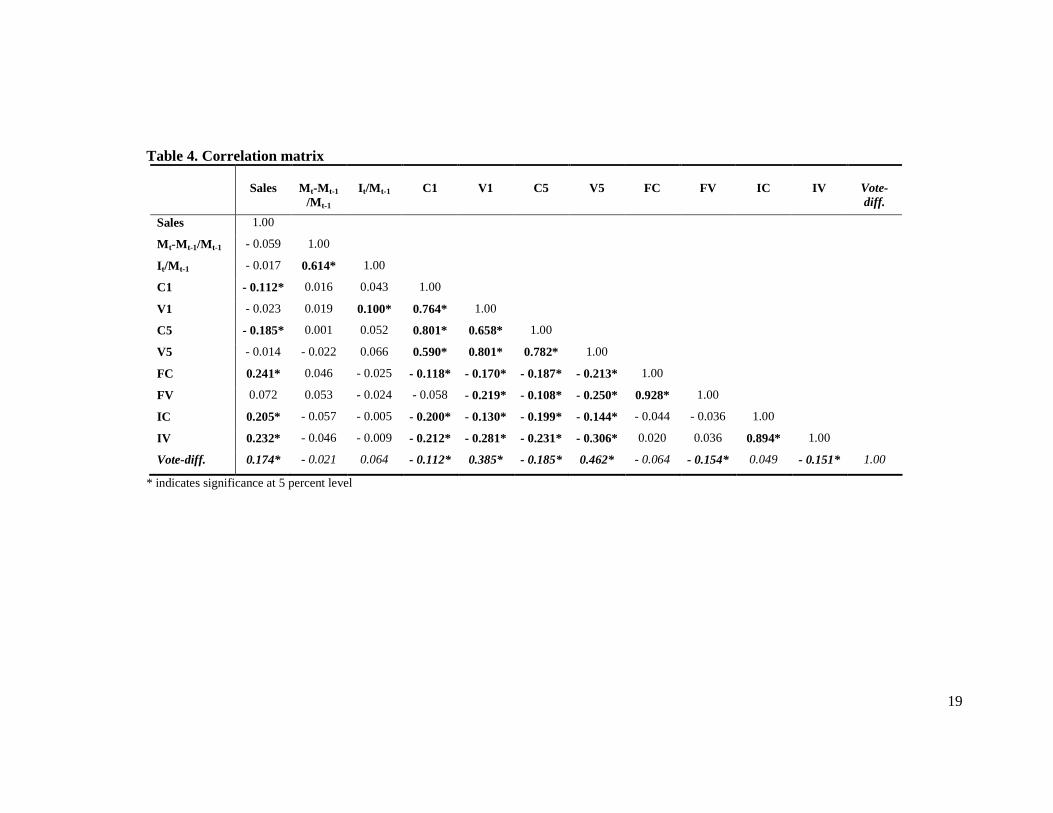
The correlation matrix in table 4 also confirms the negative relationship between both
foreign and institutional ownership vis-à-vis control instruments such as vote-
differentiation.
19
Table 4. Correlation matrix
Sales
Mt-Mt-1
/Mt-1
It/Mt-1
C1
V1
C5
V5
FC
FV
IC
IV
Vote-diff.
Sales 1.00
Mt-Mt-1/Mt-1 - 0.059 1.00
It/Mt-1 - 0.017 0.614* 1.00
C1 - 0.112* 0.016 0.043 1.00
V1 - 0.023 0.019 0.100* 0.764* 1.00
C5 - 0.185* 0.001 0.052 0.801* 0.658* 1.00
V5 - 0.014 - 0.022 0.066 0.590* 0.801* 0.782* 1.00
FC 0.241* 0.046 - 0.025 - 0.118* - 0.170* - 0.187* - 0.213* 1.00
FV 0.072 0.053 - 0.024 - 0.058 - 0.219* - 0.108* - 0.250* 0.928* 1.00
IC 0.205* - 0.057 - 0.005 - 0.200* - 0.130* - 0.199* - 0.144* - 0.044 - 0.036 1.00
IV 0.232* - 0.046 - 0.009 - 0.212* - 0.281* - 0.231* - 0.306* 0.020 0.036 0.894* 1.00
Vote-diff. 0.174* - 0.021 0.064 - 0.112* 0.385* - 0.185* 0.462* - 0.064 - 0.154* 0.049 - 0.151* 1.00
* indicates significance at 5 percent level
6. Results and analysis
In order to test the impact of different type of owners a panel data estimation was constructed.
With an emphasis on data where the cross-sectional dimension is larger than the time dimension,
a panel data model can be constructed to follow the same individual firm over the entire period.
The major motivation for using a panel data model in this way is the ability to control for
possibly correlated, time-invariant heterogeneity without observing it.
When testing the functional relationship of ownership types and performance of firms one would
then like to control for the firm or industry specific effects. We therefore use a fixed-effects
model with time and industry effects. For all the estimations an unbalanced panel data set
consisting of 651 observations was used5.
In the regressions the change in market value from period t-1 until t 11)( −−− ttt MMM is the
dependent variable. The ratio of investments in t to market value in t-1 ( 1−tt MI ) is used as an
explanatory variable. In addition to the explanatory variable, interaction terms of 1−tt MI and
relevant ownership variables (measured in percentage) are employed in order to test the effects of
ownership concentration and vote-differentiation.
Thus, the equations estimated has the following general form: XZXY 321 βββ ++= and the
marginal effect )/( dXdY is therefore Z32 ββ + which in this case has the economic interpretation
marginal q, qm.
5 The data set contain 110 firms over a period of 6 years. Of these 660 observations 9 were identified as outliers and consequently deleted.
- 1 -
The equations where then estimated both in terms of cash-flow rights (Capital, C) and control
rights (Votes, V), for each ownership type. The functional form of the impact of ownership on
performance is then tested by incorporating the squared institutional or foreign ownership
with 1−tt MI . The estimate equations are thus of the following form:
it
tii
t
t
t
t
t
tt
M
IZ
M
IZ
M
I
M
MM εβββδ +++++−=−
−+
−−−
−
11
112
11
1
1K 5)
where Zi represent explanatory variables. The marginal effect, qm, of equation 5 is therefore:
iim ZZq 1121 ++++= βββ K 6)
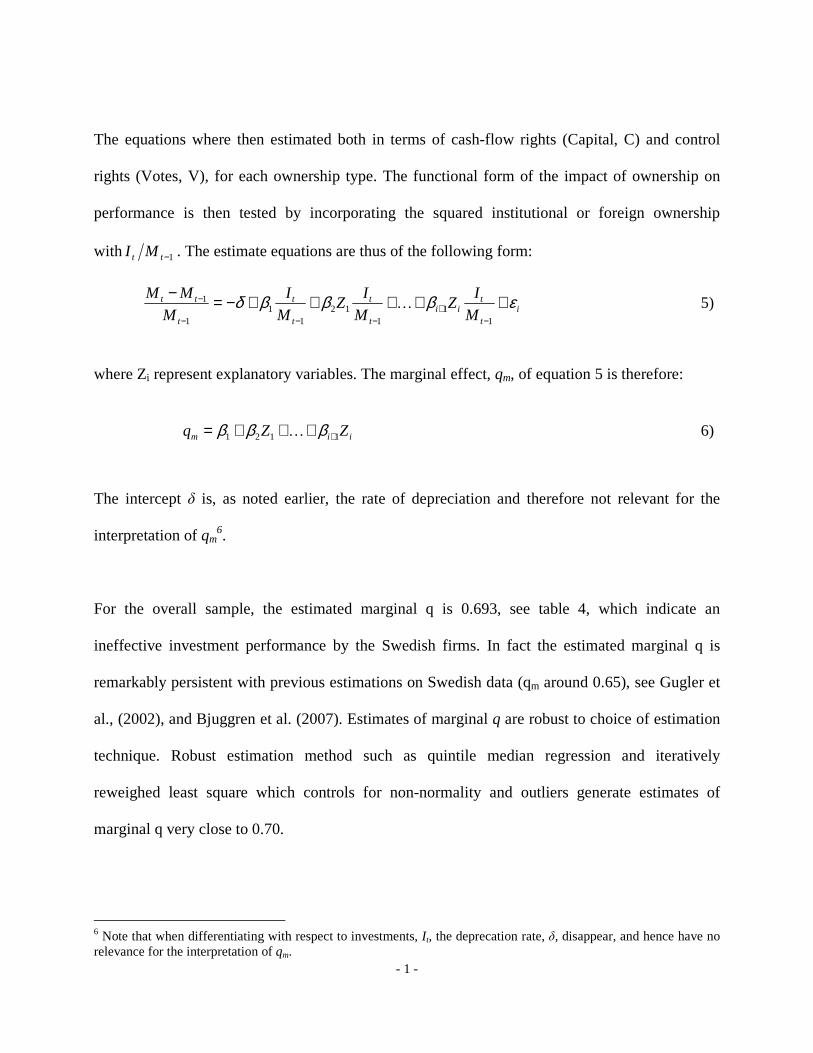
The intercept δ is, as noted earlier, the rate of depreciation and therefore not relevant for the
interpretation of qm6.
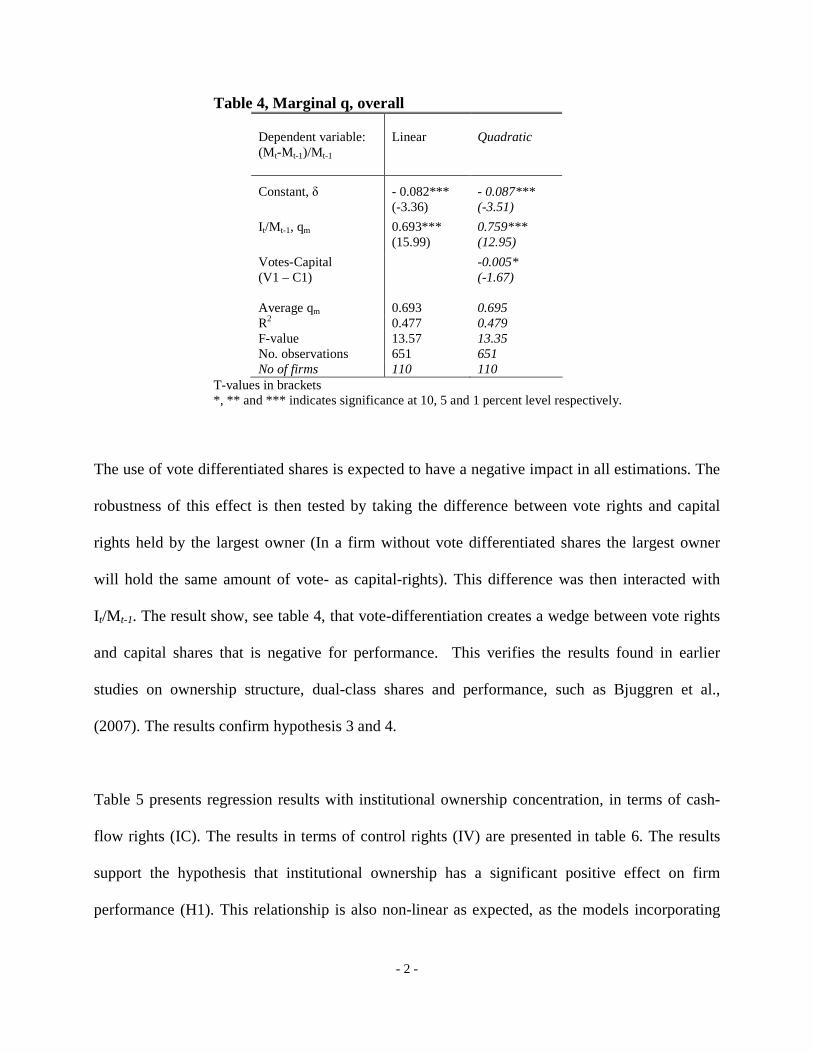
For the overall sample, the estimated marginal q is 0.693, see table 4, which indicate an
ineffective investment performance by the Swedish firms. In fact the estimated marginal q is
remarkably persistent with previous estimations on Swedish data (qm around 0.65), see Gugler et
al., (2002), and Bjuggren et al. (2007). Estimates of marginal q are robust to choice of estimation
technique. Robust estimation method such as quintile median regression and iteratively
reweighed least square which controls for non-normality and outliers generate estimates of
marginal q very close to 0.70.
6 Note that when differentiating with respect to investments, I t, the deprecation rate, δ, disappear, and hence have no relevance for the interpretation of qm.
- 2 -
Table 4, Marginal q, overall Dependent variable: (Mt-Mt-1)/Mt-1
Linear
Quadratic
Constant, δ
- 0.082*** (-3.36)
- 0.087*** (-3.51)
It/Mt-1, qm 0.693*** (15.99)
0.759*** (12.95)
Votes-Capital (V1 – C1)
-0.005* (-1.67)
Average qm 0.693 0.695 R2 0.477 0.479 F-value 13.57 13.35 No. observations 651 651 No of firms 110 110
T-values in brackets *, ** and *** indicates significance at 10, 5 and 1 percent level respectively.
The use of vote differentiated shares is expected to have a negative impact in all estimations. The
robustness of this effect is then tested by taking the difference between vote rights and capital
rights held by the largest owner (In a firm without vote differentiated shares the largest owner
will hold the same amount of vote- as capital-rights). This difference was then interacted with
It/M t-1. The result show, see table 4, that vote-differentiation creates a wedge between vote rights
and capital shares that is negative for performance. This verifies the results found in earlier
studies on ownership structure, dual-class shares and performance, such as Bjuggren et al.,
(2007). The results confirm hypothesis 3 and 4.
Table 5 presents regression results with institutional ownership concentration, in terms of cash-
flow rights (IC). The results in terms of control rights (IV) are presented in table 6. The results
support the hypothesis that institutional ownership has a significant positive effect on firm
performance (H1). This relationship is also non-linear as expected, as the models incorporating
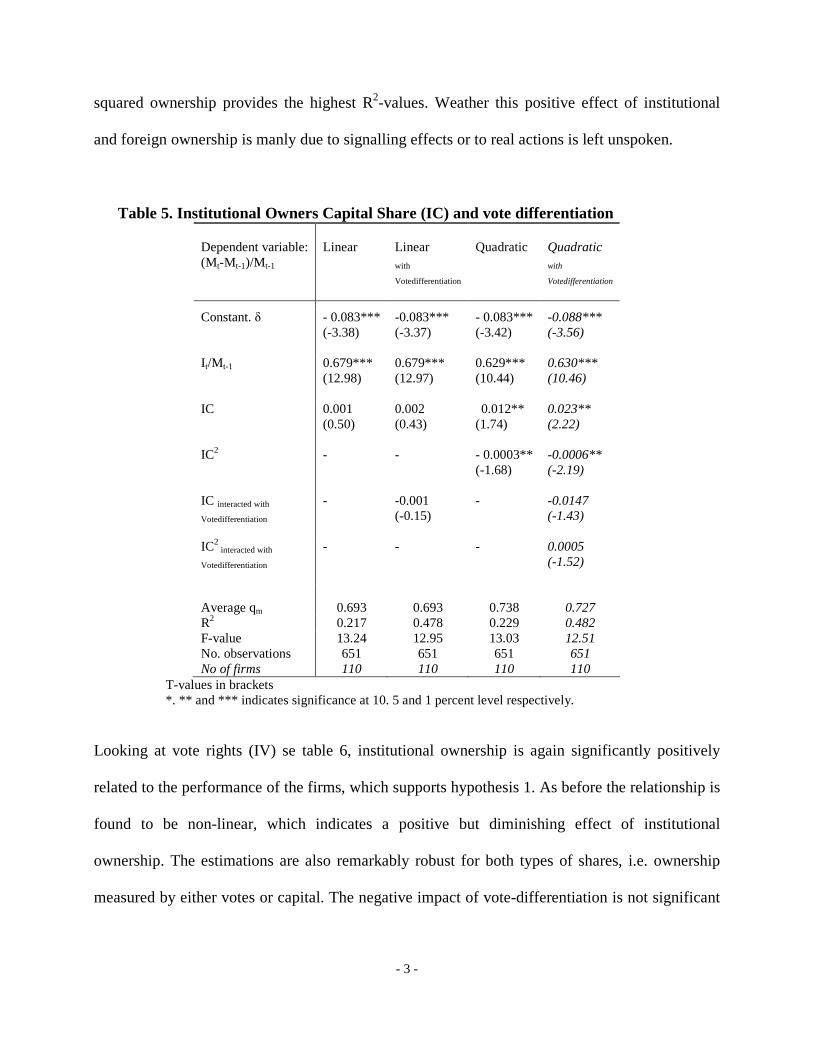
- 3 -
squared ownership provides the highest R2-values. Weather this positive effect of institutional
and foreign ownership is manly due to signalling effects or to real actions is left unspoken.
Table 5. Institutional Owners Capital Share (IC) and vote differentiation Dependent variable: (Mt-Mt-1)/Mt-1
Linear
Linear with
Votedifferentiation
Quadratic
Quadratic with
Votedifferentiation
Constant. δ
- 0.083*** (-3.38)
-0.083*** (-3.37)
- 0.083*** (-3.42)
-0.088*** (-3.56)
It/Mt-1
0.679*** (12.98)
0.679*** (12.97)
0.629*** (10.44)
0.630*** (10.46)
IC
0.001 (0.50)
0.002 (0.43)
0.012** (1.74)
0.023** (2.22)
IC2
- - - 0.0003** (-1.68)
-0.0006** (-2.19)
IC interacted with
Votedifferentiation
- -0.001 (-0.15)
- -0.0147 (-1.43)
IC2 interacted with
Votedifferentiation
- - - 0.0005 (-1.52)
Average qm 0.693 0.693 0.738 0.727 R2 0.217 0.478 0.229 0.482 F-value 13.24 12.95 13.03 12.51 No. observations 651 651 651 651 No of firms 110 110 110 110
T-values in brackets *. ** and *** indicates significance at 10. 5 and 1 percent level respectively.
Looking at vote rights (IV) se table 6, institutional ownership is again significantly positively
related to the performance of the firms, which supports hypothesis 1. As before the relationship is
found to be non-linear, which indicates a positive but diminishing effect of institutional
ownership. The estimations are also remarkably robust for both types of shares, i.e. ownership
measured by either votes or capital. The negative impact of vote-differentiation is not significant
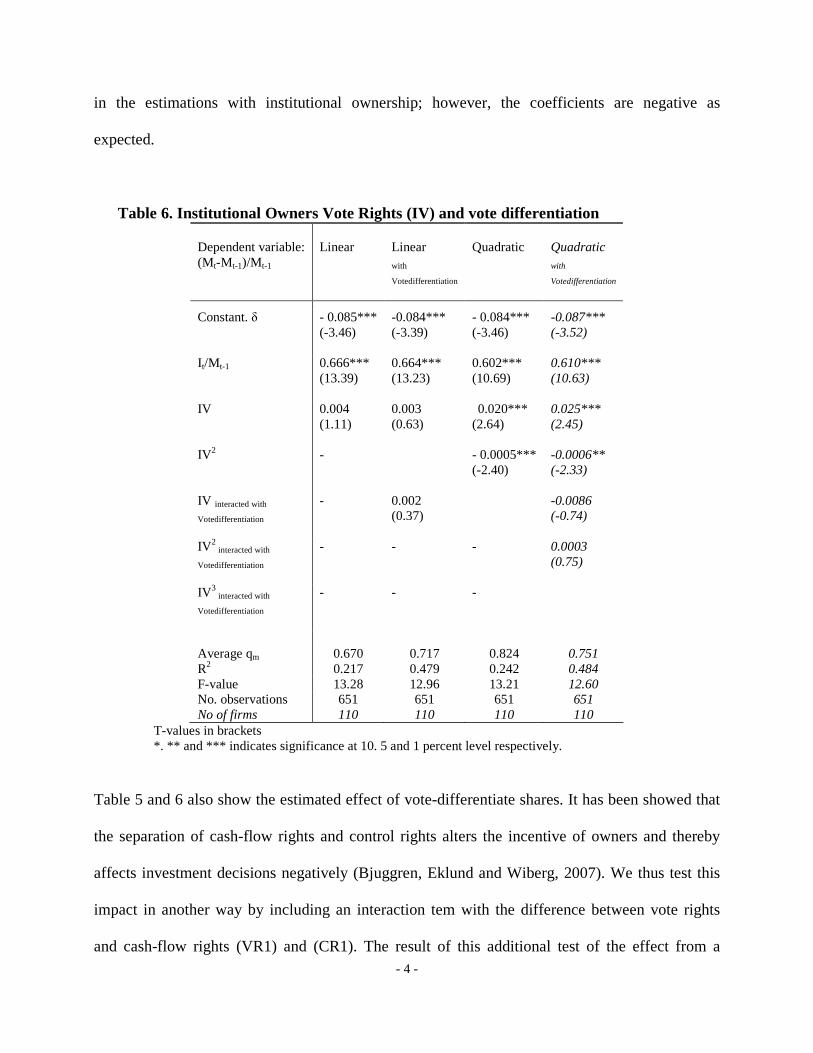
- 4 -
in the estimations with institutional ownership; however, the coefficients are negative as
expected.
Table 6. Institutional Owners Vote Rights (IV) and vote differentiation Dependent variable: (Mt-Mt-1)/Mt-1
Linear
Linear with
Votedifferentiation
Quadratic
Quadratic with
Votedifferentiation
Constant. δ
- 0.085*** (-3.46)
-0.084*** (-3.39)
- 0.084*** (-3.46)
-0.087*** (-3.52)
It/Mt-1
0.666*** (13.39)
0.664*** (13.23)
0.602*** (10.69)
0.610*** (10.63)
IV
0.004 (1.11)
0.003 (0.63)
0.020*** (2.64)
0.025*** (2.45)
IV 2
- - 0.0005*** (-2.40)
-0.0006** (-2.33)
IV interacted with
Votedifferentiation
- 0.002 (0.37)
-0.0086 (-0.74)
IV 2 interacted with
Votedifferentiation
- - - 0.0003 (0.75)
IV 3 interacted with
Votedifferentiation
- - -
Average qm 0.670 0.717 0.824 0.751 R2 0.217 0.479 0.242 0.484 F-value 13.28 12.96 13.21 12.60 No. observations 651 651 651 651 No of firms 110 110 110 110
T-values in brackets *. ** and *** indicates significance at 10. 5 and 1 percent level respectively.
Table 5 and 6 also show the estimated effect of vote-differentiate shares. It has been showed that
the separation of cash-flow rights and control rights alters the incentive of owners and thereby
affects investment decisions negatively (Bjuggren, Eklund and Wiberg, 2007). We thus test this
impact in another way by including an interaction tem with the difference between vote rights
and cash-flow rights (VR1) and (CR1). The result of this additional test of the effect from a
- 5 -
separation of control and cash-flow rights support earlier findings, as firms with vote
differentiated shares has a lower investment performance (H3).
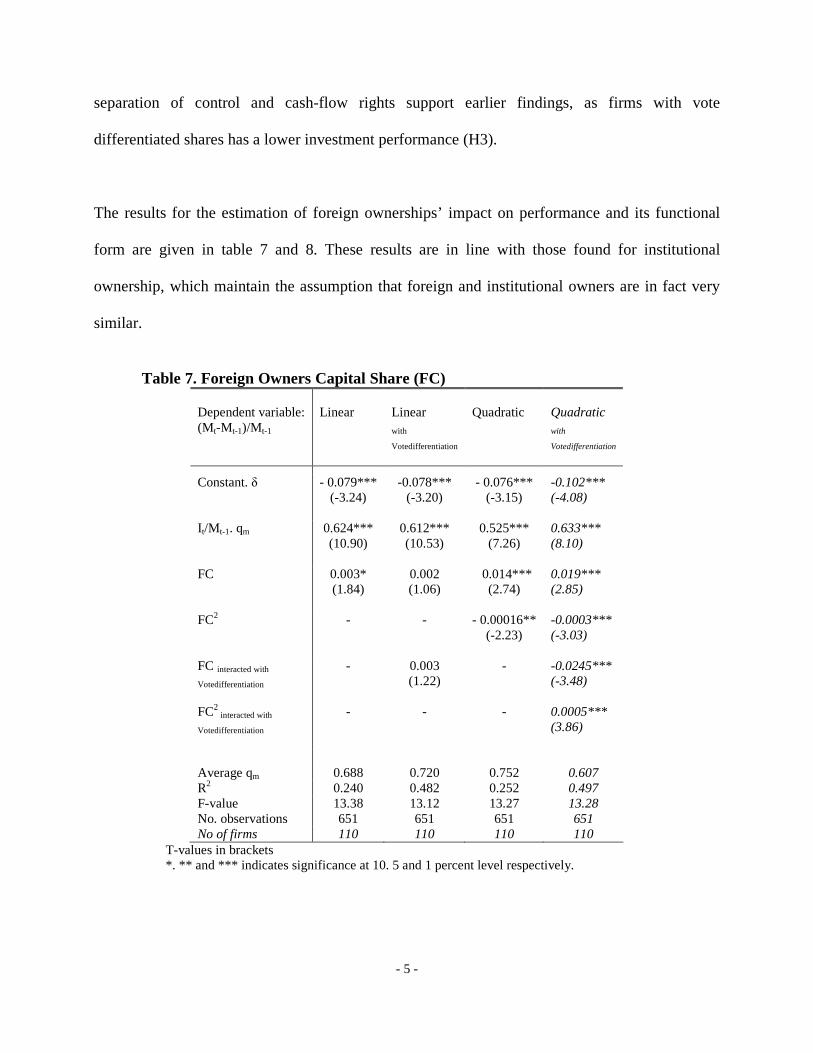
The results for the estimation of foreign ownerships’ impact on performance and its functional
form are given in table 7 and 8. These results are in line with those found for institutional
ownership, which maintain the assumption that foreign and institutional owners are in fact very
similar.
Table 7. Foreign Owners Capital Share (FC)
Dependent variable: (Mt-Mt-1)/Mt-1
Linear
Linear with
Votedifferentiation
Quadratic
Quadratic with
Votedifferentiation
Constant. δ
- 0.079*** (-3.24)
-0.078*** (-3.20)
- 0.076*** (-3.15)
-0.102*** (-4.08)
It/Mt-1. qm
0.624*** (10.90)
0.612*** (10.53)
0.525*** (7.26)
0.633*** (8.10)
FC
0.003* (1.84)
0.002 (1.06)
0.014*** (2.74)
0.019*** (2.85)
FC2
- - - 0.00016** (-2.23)
-0.0003*** (-3.03)
FC interacted with
Votedifferentiation
- 0.003 (1.22)
- -0.0245*** (-3.48)
FC2 interacted with
Votedifferentiation
- - - 0.0005*** (3.86)
Average qm 0.688 0.720 0.752 0.607 R2 0.240 0.482 0.252 0.497 F-value 13.38 13.12 13.27 13.28 No. observations 651 651 651 651 No of firms 110 110 110 110
T-values in brackets *. ** and *** indicates significance at 10. 5 and 1 percent level respectively.
- 6 -
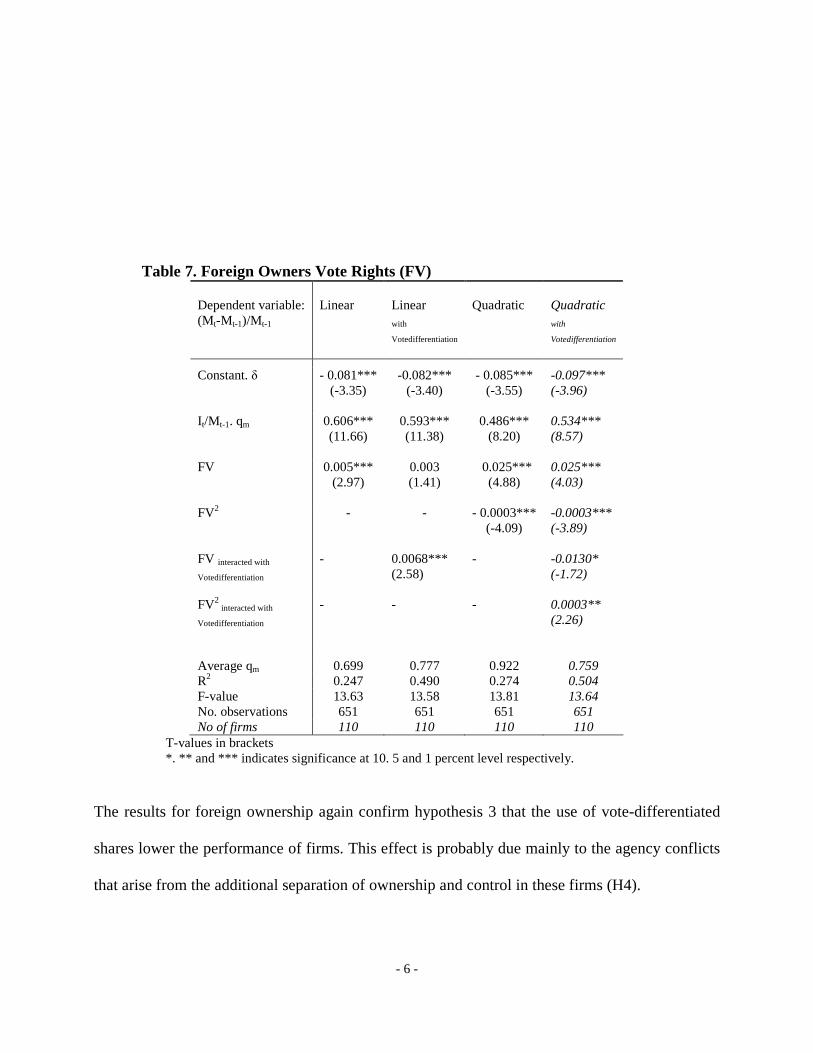
Table 7. Foreign Owners Vote Rights (FV) Dependent variable: (Mt-Mt-1)/Mt-1
Linear
Linear with
Votedifferentiation
Quadratic
Quadratic with
Votedifferentiation
Constant. δ
- 0.081*** (-3.35)
-0.082*** (-3.40)
- 0.085*** (-3.55)
-0.097*** (-3.96)
It/Mt-1. qm
0.606*** (11.66)
0.593*** (11.38)
0.486*** (8.20)
0.534*** (8.57)
FV
0.005*** (2.97)
0.003 (1.41)
0.025*** (4.88)
0.025*** (4.03)
FV2
- - - 0.0003*** (-4.09)
-0.0003*** (-3.89)
FV interacted with
Votedifferentiation
- 0.0068*** (2.58)
- -0.0130* (-1.72)
FV2 interacted with
Votedifferentiation
- - - 0.0003** (2.26)
Average qm 0.699 0.777 0.922 0.759 R2 0.247 0.490 0.274 0.504 F-value 13.63 13.58 13.81 13.64 No. observations 651 651 651 651 No of firms 110 110 110 110
T-values in brackets *. ** and *** indicates significance at 10. 5 and 1 percent level respectively.
The results for foreign ownership again confirm hypothesis 3 that the use of vote-differentiated
shares lower the performance of firms. This effect is probably due mainly to the agency conflicts
that arise from the additional separation of ownership and control in these firms (H4).
- 7 -
In all cases we have also tested for cubic specifications for the regressions. These were however
insignificant and thus not reported. The results in all four tables are in fact remarkably stable with
respect to the structural form of the model. The average firm with an institutional vote-share of
on average around ten percent (ICaverage=10.65), without vote-differentiated, has a marginal q of
0.808. This indicates a somewhat inferior investment performance and a return on investments
below the cost of capital. The effect of institutional ownership in terms of votes is however
positive, which confirms hypothesis 1 and 2. With the same institutional ownership but with vote-
differentiation there is a negative effect related to the use of vote-differentiated shares. The
average firms’ marginal-q with vote-differentiation is thus 0.751, noticeably below 0.808 and
also below 1, which means over-investment vis-à-vis the shareholders, and a return on
investments below the cost of capital. This result consequently support the proposed inferior
investment performance associated with the increasing agency problems, due to entrenchment of
ownership as expected from hypothesis 3 and 4.
- 8 -
7. Conclusions
We argue that the agency-costs associated with control instruments such as vote differentiated
shares, on average, are sufficiently high to incur a stock market valuation discount on
investments. Conversely, institutional owners, often associated with low control incentives, seem
to be out weight by the disciplining effect that these influential investors have on the management
and performance of the firms. In part, some of these effects are most likely related to a kind of
signalling effect about the quality and performance of the firms chosen for investment, by the
institutions. Furthermore we find that the increasing institutional ownership has had a positive
(non-liner) impact on firm performance. The same positive effect is found for foreign ownership.
This result in turn is supported by the fact that the overwhelming majority of foreign investors on
the Swedish stock market are by definition institutions. Ownership concentration and control that
is attained trough use of dual-class shares which separates cash-flow rights and control rights
have a negative impact on performance in all estimations. This has important policy implications
since founding families and entrepreneurs often resort to these mechanisms in order to remain in
control.
- 9 -
References Angblad, J. Berglöf, E. Högfelt, P. and Svancar H., (2001), Ownership and Control in Sweden: Strong Owners, weak Minorities, and Social Control, The Control of Corporate Europé, Oxford University Press, Oxford. Berle, A. and Means, G., (1932), The Moderna Corporation and Private Property, New York: Macmillan. Berle, A., (1960), Power without Property, London, Sidgwick & Jackson. Bjuggren, P-O., Eklund, J. E. and Wiberg, D., (2007), Ownership, Control and Firm Performance, Davis, P., and Steil, B., (2001), Institutional Investors, The MIT Press, Cambridge MA. Goergen, M., and Renneboog, L., (2001), Strong Managers and Passive Institutional Investors in the UK, The Control of Corporate Europe, Oxford University Press, Oxford. Gompers, P. A. and Metrick, A., (2001), Institutional Investors and Equity Prices, Quarterly Journal of Economics, 116:229-259. Gugler, K., Mueller, D. and Yurtuglu, B., (2002), Corporate Governance, Capital Market Discipline and Returns on Investment, mimeo, University of Vienna.
Henrekson, M. and Jakobsson, U., (2006), Den Svenska Modellen för Företagsägande och
Företagskontroll vid Skiljevägen. Policy Paper nr 1, Institutet för Näringslivsforskning.
Hirschman, A. O., (1970), Exit, Vocie and Loyalty, Cambridge; Cambridge University Press.
Högfeldt, P., (2004), The history and Politics of Corporate Ownership in Sweden, NBER
Working Paper series 10641.
Jensen, M. C. and Meckling, W. H., (1976), Theory of the Firm: managerial Behaviour, Agency Costs and Ownership Structure. Journal of Financial Economics, 3:305-60. La Porta, R., Lopez-de Silanes, F. and Shleifer, A., (1999), Corporate Ownership Aound the World, Jornal of Finance, 54.
- 10 -
Levin S.M. and Levin S.L., (1982), Ownership and control of large industrial firms: some new evidence. Review of Business and Economic Research 14: 3749. Li, K., Ortiz-Molina, H. and Zhao, X., (2006), Do Institutional Investors Care About Shareholder Rights? Evidence form Institutional Investment in Dual-Class Firms, Working Paper, SSRN, December McConnell, J.J. and Servaes, H., (1990), “Additional evidence on Eguity Ownership and corporate Value”, Journal of Fiancial Economics 27(2): 595-612. McEachern, W., (1975), Managerial Control and Performance, Lexington, MA:Heath. Mueller, D. C. and Reardon, E., (1993), “Rates of Return on Corporate Investment,” Southern Economic Journal, 60 (2), 430-453. Mueller, D., (2003), The Corporation, London, Routledge. Morck, R., Schlifer A. and Vishny, R., (1988), Management ownership and market valuation, an empirical analysis, Journal of Financial Economics, 20. Nickel, S., Nicolitsas, D. and Dryden, N., (1997), “What Makes Firms Perform Well?”, European Economic Review 41(3): 783-796. Shleifer, R and Vishny, R. W., (1997), A Survey of Corporate Governance, Journal of Finance, 52/2. Thomsen, S. and Pedersen, T., (2000), “Ownership Structure and Performance in the Largest European Companies”, Strategic Management Journal, 21:689-705.