Embed Size (px)
Citation preview
CESIS Electronic Working Paper Series
Paper No. 25
Capital Structure Determinants An Empirical Study of Swedish Companies 1
Han-Suck Song
(INFRA)
JANUARI 2005
The Royal Institute of technology Centre of Excellence for Science and Innovation Studies
http://www.infra.kth.se/cesis Corresponding author: [email protected]
1 Status of the paper: The Paper has been presented at the International PhD Workshop “Innovation, Entrepreneurship and Growth” at the Royal Institute of Technology (KTH) Stockholm, November 19-20.

Capital Structure Determinants An Empirical Study of Swedish Companies
Han-Suck Song
Januari, 2005
Abstract
This paper analysis the explanatory power of some of the theories that have been proposed in the
literature to explain variations in capital structures across firms. In particular, this study
investigates capital structure determinants of Swedish firms based on a panel data set from 1992
to 2000 comprising about 6000 companies. Swedish firms are on average very highly leveraged,
and furthermore, short-term debt comprises a considerable part of Swedish firms’ total debt. An
analysis of determinants of leverage based on total debt ratios may mask significant differences
in the determinants of long and short-term forms of debt. Therefore, this paper studies
determinants of total debt ratios as well as determinants of short-term and long-term debt ratios.
The results indicate that most of the determinants of capital structure suggested by capital
structure theories appear to be relevant for Swedish firms. But we also find significant differences
in the determinants of long and short-term forms of debt. Due to data limitations, it was not
possible decompose short-term debt and long-term debt into its elements, but the results suggest
that future analysis of capital choice decisions should be based on a more detailed level.
Royal Institute of Technology, Centre of Excellence for Studies in Innovation and Science, Department of
Infrastructure, Drottning Kristinas väg 30B, SE-10044 Stockholm, Sweden, e-mail: [email protected]
1. Introduction This paper analysis the explanatory power of some of the theories that have been proposed in the
literature to explain variations in capital structures across firms. In particular, this study
investigates capital structure determinants of Swedish firms based on a panel data set from 1992
to 2000 comprising about 6000 companies. It will below become obvious that Swedish firms are
on average very highly leveraged. This, in combination with the fact that short-term debt
comprises a very considerable part of firms’ total debt, suggest that an analysis of determinants of
capital structure shall not only be based on total debt ratios, but also based on a decomposition of
total debt ratios into short-term and long-term debt ratios. Hence this study will utilize panel data
regression analysis to empirically examine the impact of different determinants on three leverage
measures: total debt ratio, short-term debt ratio, and long-term debt ratio.
1.1. Background It is argued that the modern theory of capital structure began with the seminal paper of
Modigliani and Miller (1958) (see e.g. Rajan and Zingales, 1995; Harris and Raviv, 1991). What
then was the main message that MM delivered? In brief, the MM proposition states that the value
of a firm is independent from its corporate financing decisions under certain conditions. In fact,
MM pointed out the direction that capital structure theories must take by showing under what
conditions capital structure is irrelevant (Harris and Raviv, 1991).
Titman (2001) lists some fundamental conditions that make the MM proposition hold:
1. no (distortionary) taxes,
2. no transaction costs,
3. no bankruptcy costs,
4. perfect contracting assumptions, and
5. complete and perfect market assumption.
Since the publication of MM’s irrelevance proposition, hundreds of articles on the theory of
capital structure have been carried out in order to find out under what conditions capital structure
does matter. In other words, it is of great interest to investigate if capital structure choices
become relevant once one or more of the key conditions are relaxed.
1.2. Purpose and methodology The purpose of this study is to empirically examine the link between a number of potential capital
structure determinants and debt level for Swedish companies.
Panel data regression analysis is used to investigate the determinants of Swedish firms’ capital
structure. The choice of determinants that may affect capital structure is primarily based on the
capital structure theories presented in section 3 below. While time-dummies are included in the
analysis below, dummies for different industry classifications are not included.
This paper is organized as follows. Section 2 presents a brief overview of some commonly used
leverage measures. Average figures of leverage of Swedish firms based on the data set are
presented in section 3. Section 4 reviews major capital structure determinants suggested by the
theory of finance, and presents summary statistics for those determinants based on the data set.
Section 5 summarizes the econometric approach adopted in this study, while section 6 discusses
the interpretation and significance of the estimates. Finally, section 7 summarizes and concludes
the main findings of this paper.
2. Measures of capital structure/financial leverage Before we discuss different measures of capital structure, a very brief repetition of the term
capital structure and its related terms (financial structure, financial leverage or gearing) is given
here for convenience. The term capital structure refers to the mix of different types of securities
(long-term debt, common stock, preferred stock) issued by a company to finance its assets. A
company is said to be unlevered as long as it has no debt, while a firm with debt in its capital
structure is said to be leveraged. Note that there exist two major leverage terms: operational
leverage and financial leverage. While operational leverage is related to a company’s fixed
operating costs, financial leverage is related to fixed debt costs. Loosely speaking, operating
leverage increases the business (or the operating) risk, while financial leverage increases the
financial risk. Total leverage is then given by a firm’s use of both fixed operating costs and debt
costs, implying that a firm’s total risk equals business risk plus financial risk.2 In this study of
capital structure and its determinants, with leverage, we mean financial leverage, or its synonym
gearing. 2 For a textbook treatment of leverage and risk, see e.g. Brealey and Myers (2003).
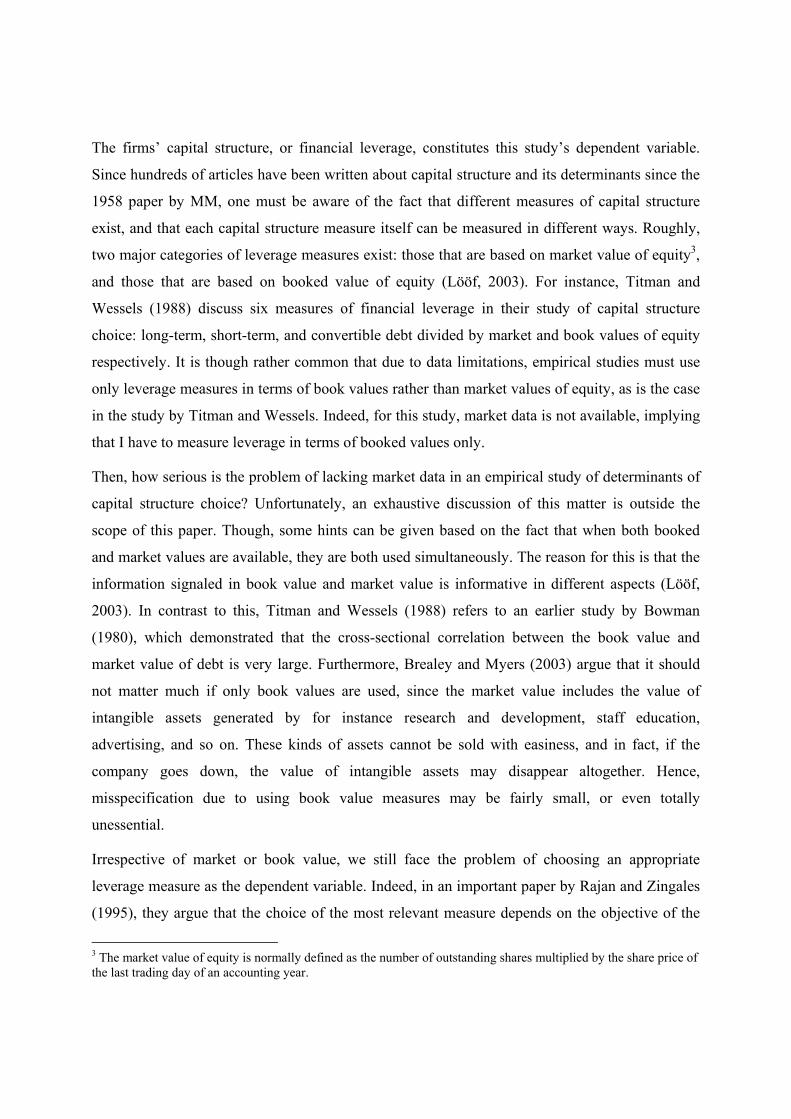
The firms’ capital structure, or financial leverage, constitutes this study’s dependent variable.
Since hundreds of articles have been written about capital structure and its determinants since the
1958 paper by MM, one must be aware of the fact that different measures of capital structure
exist, and that each capital structure measure itself can be measured in different ways. Roughly,
two major categories of leverage measures exist: those that are based on market value of equity3,
and those that are based on booked value of equity (Lööf, 2003). For instance, Titman and
Wessels (1988) discuss six measures of financial leverage in their study of capital structure
choice: long-term, short-term, and convertible debt divided by market and book values of equity
respectively. It is though rather common that due to data limitations, empirical studies must use
only leverage measures in terms of book values rather than market values of equity, as is the case
in the study by Titman and Wessels. Indeed, for this study, market data is not available, implying
that I have to measure leverage in terms of booked values only.
Then, how serious is the problem of lacking market data in an empirical study of determinants of
capital structure choice? Unfortunately, an exhaustive discussion of this matter is outside the
scope of this paper. Though, some hints can be given based on the fact that when both booked
and market values are available, they are both used simultaneously. The reason for this is that the
information signaled in book value and market value is informative in different aspects (Lööf,
2003). In contrast to this, Titman and Wessels (1988) refers to an earlier study by Bowman
(1980), which demonstrated that the cross-sectional correlation between the book value and
market value of debt is very large. Furthermore, Brealey and Myers (2003) argue that it should
not matter much if only book values are used, since the market value includes the value of
intangible assets generated by for instance research and development, staff education,
advertising, and so on. These kinds of assets cannot be sold with easiness, and in fact, if the
company goes down, the value of intangible assets may disappear altogether. Hence,
misspecification due to using book value measures may be fairly small, or even totally
unessential.
Irrespective of market or book value, we still face the problem of choosing an appropriate
leverage measure as the dependent variable. Indeed, in an important paper by Rajan and Zingales
(1995), they argue that the choice of the most relevant measure depends on the objective of the
3 The market value of equity is normally defined as the number of outstanding shares multiplied by the share price of the last trading day of an accounting year.

analysis. Though, they conclude “the effects of past financing decisions is probably best
represented by the ratio of total debt over capital (defined as total debt plus equity)”. Table 1
below lists the different measures of leverage and each measure’s pros and cons, discussed in
Rajan and Zingales (1995). (For a more exhaustive discussion, see the Rajan and Zingales paper.)
To complete the discussion of different leverage measures, we may consider the following
statement by Harris and Raviv (1991, p. 331) when we compare different empirical studies:
The interpretation of the results must be tempered by an awareness of the difficulties involved in measuring both leverage and the explanatory variables of interest. In measuring leverage, one can include or exclude accounts payable, accounts receivable, cash, and other short-term debt. Some studies measure leverage as a ratio of book value of debt to book value of equity, others as book value of debt to market value of equity, still others as debt to market value of equity plus book value of debt. […] In addition to measurement problems, there are the usual problems with interpreting statistical results.
With those words of caution in mind, we now continue with choosing leverage measures for this
study. Indeed, for the objective of this study, following leverage measures will be analyzed in a
litter bit more detail below; the ratio of
• total liabilities over total assets (1), • total debt over total assets (2), and • total debt over capital (4).
The third leverage measure in table 1 above cannot be readily observed, due to limitations in the
data set. The data set used in this paper consists of three variables that make up total liabilities:
total short-term debt, total long-term debt, and untaxed reserves. Hence, in this paper, total debt
equals total liabilities less untaxed reserves.

Table 1. Different measures of leverage and corresponding pros and cons, according to Rajan and Zingales (1995).4
Leverage measure Pros and cons
+ The broadest definition of leverage; proxy for what is left for shareholders in case of liquidation.
1 Total liabilities / Total assets
− Not a good indication of whether the firm is at risk of default in the near future. May overstate leverage since total liabilities includes items like accounts payable, untaxed reserves etc.
+ Does not include liabilities like untaxed reserves or accounts payable (for transaction purposes); more appropriate measure of leverage than (1) above.
2 Total debt / Total assets
− Affected by level of trade credit5 (i.e. unpaid bills; makes up bulk of accounts payable).
+ Not influenced by trade credit. (Net assets = total assets − accounts payable − other liabilities).
3 Total debt / Net assets − Still affected by factors that have nothing to do with financing, e.g. assets held against
pension liabilities.
+ Probably the best representation of past financing decisions (capital = total debt + equity). 4 Total debt /
Capital −
+ Measure of the risk that equity holders will not be able to make fixed payments and will have to give up control. Appropriate measure if investments equal in magnitude to depreciation needed to keep the firm a going concern. 5 EBIT /
Interest expense − Based in assumption that short-term liabilities like accounts payable and short-term
debt will be rolled over. Very sensitive to income fluctuations.
+ Measure of the risk that equity holders will not be able to make fixed payments and will have to give up control. Appropriate if no such investments as in (5) are needed. 6 EBITDA /
Interest expense − Same as for (5).
Note: EBIT = Earnings Before Interest and Taxes. EBITDA = EBIT + Depreciation.
3. Financial leverage of Swedish firms Table 2 below, reports the yearly mean and median figures for the three different leverage
measures mentioned above. Notice that no matter choice of leverage measure, Swedish
companies are very highly leveraged.
4 In addition to the leverage measures depicted in table 1, there exist other leverage measures; for instance, the ratio of total debt to equity, the ratio of only long-term debt to total assets, and so on. 5 The term trade credit may be confusing, since it here and in other papers (e.g. Bevan and Danbolt, 2000) is an item that belongs to short-term debt, and in particular to accounts payable. If trade credit is used for financing purposes rather than for transactions, trade credit should be included in measures of leverage (Rajan and Zingales, 1995). In Brealey and Myers (2003), trade credit is synonymous with accounts receivable, while trade debt is synonymous with accounts payable.
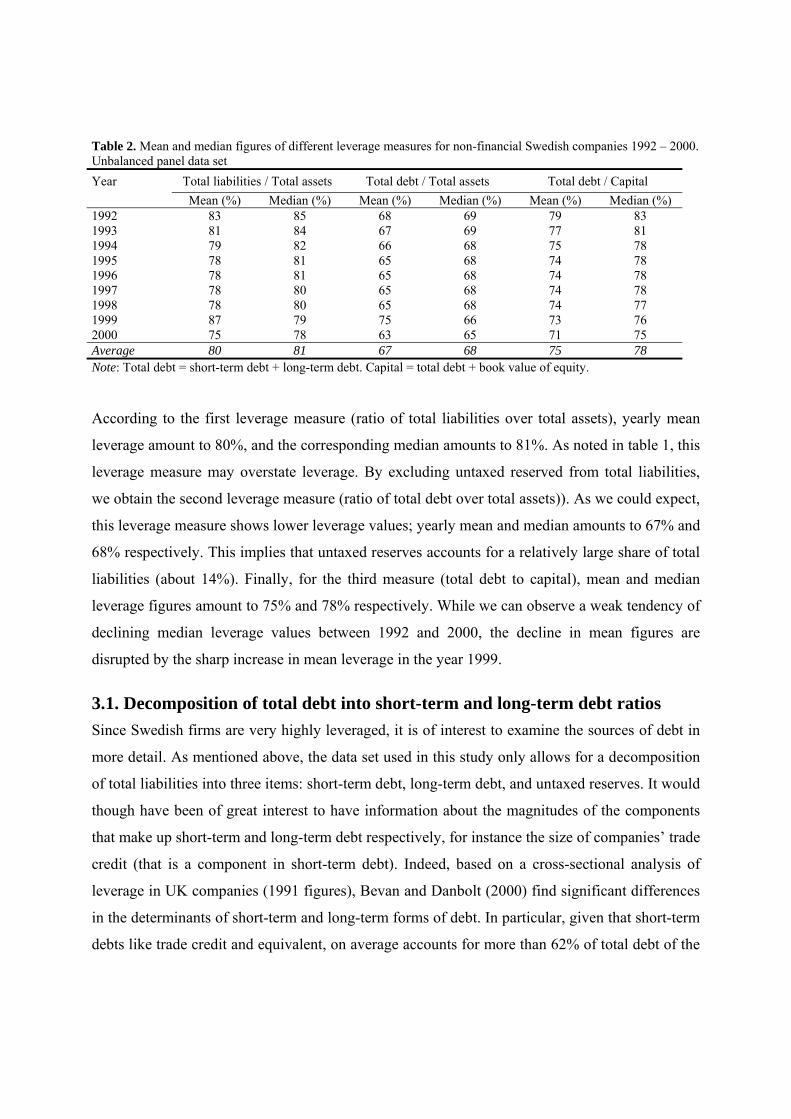
Table 2. Mean and median figures of different leverage measures for non-financial Swedish companies 1992 – 2000. Unbalanced panel data set Year Total liabilities / Total assets Total debt / Total assets Total debt / Capital Mean (%) Median (%) Mean (%) Median (%) Mean (%) Median (%) 1992 83 85 68 69 79 83 1993 81 84 67 69 77 81 1994 79 82 66 68 75 78 1995 78 81 65 68 74 78 1996 78 81 65 68 74 78 1997 78 80 65 68 74 78 1998 78 80 65 68 74 77 1999 87 79 75 66 73 76 2000 75 78 63 65 71 75 Average 80 81 67 68 75 78 Note: Total debt = short-term debt + long-term debt. Capital = total debt + book value of equity.
According to the first leverage measure (ratio of total liabilities over total assets), yearly mean
leverage amount to 80%, and the corresponding median amounts to 81%. As noted in table 1, this
leverage measure may overstate leverage. By excluding untaxed reserved from total liabilities,
we obtain the second leverage measure (ratio of total debt over total assets)). As we could expect,
this leverage measure shows lower leverage values; yearly mean and median amounts to 67% and
68% respectively. This implies that untaxed reserves accounts for a relatively large share of total
liabilities (about 14%). Finally, for the third measure (total debt to capital), mean and median
leverage figures amount to 75% and 78% respectively. While we can observe a weak tendency of
declining median leverage values between 1992 and 2000, the decline in mean figures are
disrupted by the sharp increase in mean leverage in the year 1999.
3.1. Decomposition of total debt into short-term and long-term debt ratios Since Swedish firms are very highly leveraged, it is of interest to examine the sources of debt in
more detail. As mentioned above, the data set used in this study only allows for a decomposition
of total liabilities into three items: short-term debt, long-term debt, and untaxed reserves. It would
though have been of great interest to have information about the magnitudes of the components
that make up short-term and long-term debt respectively, for instance the size of companies’ trade
credit (that is a component in short-term debt). Indeed, based on a cross-sectional analysis of
leverage in UK companies (1991 figures), Bevan and Danbolt (2000) find significant differences
in the determinants of short-term and long-term forms of debt. In particular, given that short-term
debts like trade credit and equivalent, on average accounts for more than 62% of total debt of the
UK companies, the results are particularly sensitive to whether such debt is included in the
leverage measures. Hence in line with their findings, Bevan and Danbolt argue that analysis of
corporate structure is incomplete without a detailed examination of corporate debt.
In another study of capital structure of small and medium sized enterprises (SMEs), Michaelas et.
al. (1999) find that most of the determinants of capital structure (e.g. size, profitability, growth,
and more) seem to be relevant for both short-term and long-term debt ratios. They also find that
time an industry specific effects (i.e. the include time and industry dummies) influence the
maturity structure of debt raised by SMEs. By analyzing the coefficients of the time-dummies
over the years studies (1988 to 1995) in relation to changes in real GDP, Michaelas et. al. find
that short-term debt ratios in SMEs appear to be negatively correlated with changes in economic
growth, while long-term debt ratios exhibit a positive relationship with changes in economic
growth.
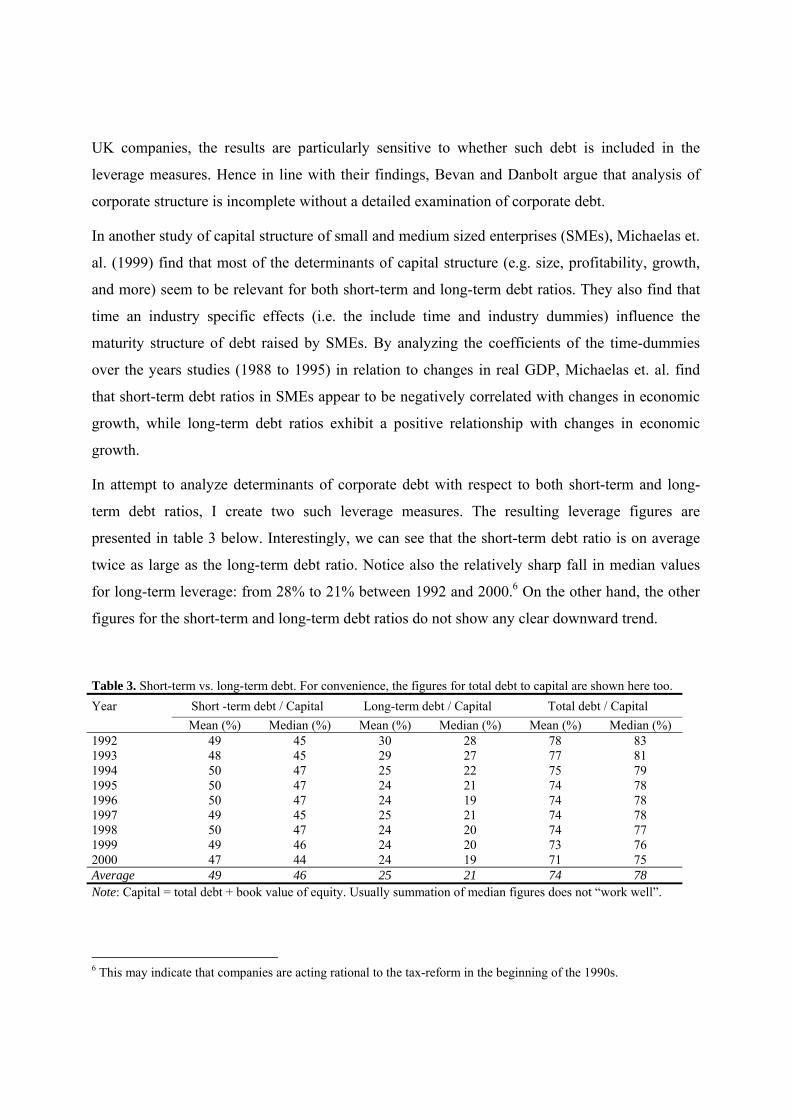
In attempt to analyze determinants of corporate debt with respect to both short-term and long-
term debt ratios, I create two such leverage measures. The resulting leverage figures are
presented in table 3 below. Interestingly, we can see that the short-term debt ratio is on average
twice as large as the long-term debt ratio. Notice also the relatively sharp fall in median values
for long-term leverage: from 28% to 21% between 1992 and 2000.6 On the other hand, the other
figures for the short-term and long-term debt ratios do not show any clear downward trend.
Table 3. Short-term vs. long-term debt. For convenience, the figures for total debt to capital are shown here too. Year Short -term debt / Capital Long-term debt / Capital Total debt / Capital Mean (%) Median (%) Mean (%) Median (%) Mean (%) Median (%) 1992 49 45 30 28 78 83 1993 48 45 29 27 77 81 1994 50 47 25 22 75 79 1995 50 47 24 21 74 78 1996 50 47 24 19 74 78 1997 49 45 25 21 74 78 1998 50 47 24 20 74 77 1999 49 46 24 20 73 76 2000 47 44 24 19 71 75 Average 49 46 25 21 74 78 Note: Capital = total debt + book value of equity. Usually summation of median figures does not “work well”.
6 This may indicate that companies are acting rational to the tax-reform in the beginning of the 1990s.

Inspired by the result of this decomposition of total debt, in combination with the contradictory
findings of the cross-sectional analysis by Bevan and Danbolt (2000) and the panel data analysis
Michaelas et. al. (1999), I will include the two new measures of leverage in the econometric
analysis below.
Without having data on size of trade credit at hand, we may just speculate whether trade credit
makes up a large portion of short-term debt, and why it may be so. Now, suppose that trade credit
and equivalent components constitutes a large share of short-term debt. Following the arguments
in Bevan and Danbolt (2000), we may then suggest that this kind of reliance on trade credit
reflects a rational corporate debt policy, given that other form of borrowing result in higher costs.
Now that we know that short-term debt constitutes a large portion of total debt, it may be
interesting to see if short-term and long-term debt rations vary across firm sizes. Again as usual
in corporate finance, there exist several different definitions of specific factor: number of persons
employed, size of total assets, size of turnover, and more. Furthermore, size can be measured as a
continuous variable or as a categorical variable. In order to present a rough picture of leverage
figures across different firms sizes, I choose to categorize company sizes according to following
scheme: firms with less than 10 employees are defined as small firms; medium sized firms are
companies with 10-100 employees; and finally large a firms are characterized as having more
than 100 employees.7 The resulting figures are presented in table 4 below. What is most
strikingly is the development of short-term debt for small firms. There is a clear downward trend
in medium values from 1993 to 2000: 52 to 20 percent. The same kind of trend can be found for
the mean figures, ignoring the very high mean value for year 1999. On the other hand, debt ratios
appear to stay very stable for both medium and larger size firms.
7 In fact, size measures are defined in rather arbitrary manner. For instance, Van der Wijst (1989) defines small and medium firms as having 1 to 9 and 10 to 99 people employed respectively. But Michaelas et. al. (1999) consider firms with less than 200 employees as small. See Mira (2001) for further references on different firm size classifications.
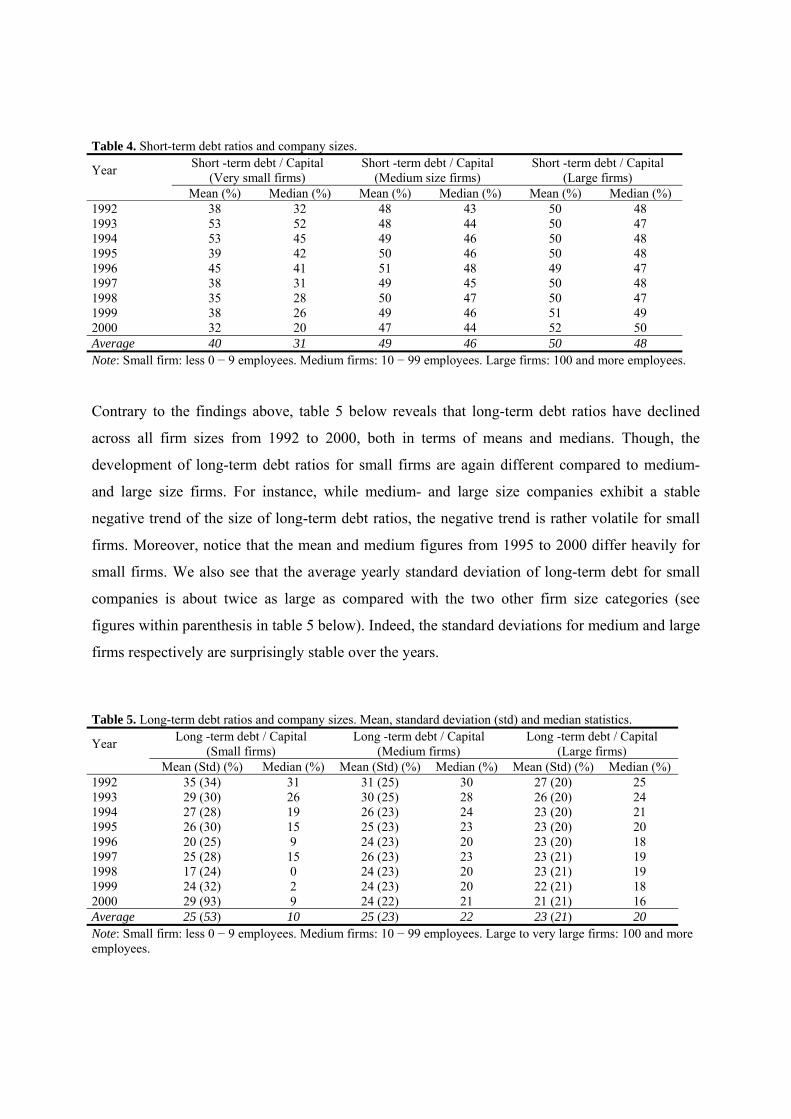
Table 4. Short-term debt ratios and company sizes. Year Short -term debt / Capital
(Very small firms) Short -term debt / Capital
(Medium size firms) Short -term debt / Capital
(Large firms) Mean (%) Median (%) Mean (%) Median (%) Mean (%) Median (%) 1992 38 32 48 43 50 48 1993 53 52 48 44 50 47 1994 53 45 49 46 50 48 1995 39 42 50 46 50 48 1996 45 41 51 48 49 47 1997 38 31 49 45 50 48 1998 35 28 50 47 50 47 1999 38 26 49 46 51 49 2000 32 20 47 44 52 50 Average 40 31 49 46 50 48 Note: Small firm: less 0 − 9 employees. Medium firms: 10 − 99 employees. Large firms: 100 and more employees.
Contrary to the findings above, table 5 below reveals that long-term debt ratios have declined
across all firm sizes from 1992 to 2000, both in terms of means and medians. Though, the
development of long-term debt ratios for small firms are again different compared to medium-
and large size firms. For instance, while medium- and large size companies exhibit a stable
negative trend of the size of long-term debt ratios, the negative trend is rather volatile for small
firms. Moreover, notice that the mean and medium figures from 1995 to 2000 differ heavily for
small firms. We also see that the average yearly standard deviation of long-term debt for small
companies is about twice as large as compared with the two other firm size categories (see
figures within parenthesis in table 5 below). Indeed, the standard deviations for medium and large
firms respectively are surprisingly stable over the years.
Table 5. Long-term debt ratios and company sizes. Mean, standard deviation (std) and median statistics. Year Long -term debt / Capital
(Small firms) Long -term debt / Capital
(Medium firms) Long -term debt / Capital
(Large firms) Mean (Std) (%) Median (%) Mean (Std) (%) Median (%) Mean (Std) (%) Median (%) 1992 35 (34) 31 31 (25) 30 27 (20) 25 1993 29 (30) 26 30 (25) 28 26 (20) 24 1994 27 (28) 19 26 (23) 24 23 (20) 21 1995 26 (30) 15 25 (23) 23 23 (20) 20 1996 20 (25) 9 24 (23) 20 23 (20) 18 1997 25 (28) 15 26 (23) 23 23 (21) 19 1998 17 (24) 0 24 (23) 20 23 (21) 19 1999 24 (32) 2 24 (23) 20 22 (21) 18 2000 29 (93) 9 24 (22) 21 21 (21) 16 Average 25 (53) 10 25 (23) 22 23 (21) 20 Note: Small firm: less 0 − 9 employees. Medium firms: 10 − 99 employees. Large to very large firms: 100 and more employees.

In this study though, we will mainly investigate if there exist differences in the short-term and
long-term debt ratios, rather than analyzing differences between size categories. It is more a task
for future research to analyze the important question of potential differences in capital structure
determinants between small, medium and large companies.
To conclude this section, we now state the three (book-value) leverage measures that will be used
in the econometric analysis below: the ratio of total debt over capital, short-term debt to capital,
and long-term debt to capital.
4. Potential determinants of capital structure In this section, we briefly present factors that different capital structure theories suggest may
affect a company’s financing decision. As was the case with leverage measures, there also exist
problems of finding, defining and measuring the determinants of capital structure. As Harris and
Raviv’s (1991) demonstrate in their review article, the motives and circumstances that could
determine capital structure choices seem nearly uncountable. In this paper though, we will restrict
ourselves to the most commonly used explanatory variables. Furthermore, we will not present
any summary of different theories of capital structure (e.g. the irrelevance theory, static trade-off
theory, signaling- and agency cost models, pecking-order theory, and more).8 Instead, the relation
between a determinant and a specific capital structure theory will in some cases become clear
below.
Then, what are the determinants of capital structure? According to Harris and Raviv (1991), the
consensus is that “leverage increase with fixed assets, non-debt tax shields, investment
opportunities, and firm size, and decreases with volatility, advertising expenditure, the probability
of bankruptcy, profitability, and uniqueness of the product.” Titman and Wessels (1988) state that
asset structure, non-debt tax shields, growth, uniqueness, industry classification, size, earnings
volatility, and profitability are factors that may affect leverage according to different theories of
capital structure. Still, other authors may provide another set of potential determinants of capital
structure. This clearly shows that even if there is a consensus among researchers what factor may
constitute a minimum set of attributes, there is still plenty of room for arguing in favor of 8 For an exhaustive review of capital structure theories and further references, see Harris and Raviv (1991). In the second half of the 1990s, theories based on the impact of legal environment on capital structure have been proposed), see e.g. La Porta et. al (1997).
including other determinants as well. Furthermore, we will below see that there also may exist
disagreements of how a determinant may affect leverage (i.e. whether a it is negatively or
positively correlated with leverage).
In this study, following determinants will be used:
• tangibility (asset structure), • non-debt tax shield, • profitability, • size, • expected growth, • uniqueness, • income variability, • time dummies, • (industry classification dummies, not applied in this study).
A short discussion of each of the determinants used in this paper, their relationship to capital
structure theories, and how they can be measured will be presented below.
Tangibility (asset structure) Ultimately, this relationship is suggested to be based on the conflict between lenders and
shareholders according to agency cost theory models (see e.g. Jensen and Mekling9, 1976;
Williamson, 1988; Harris and Raviv, 1991). Very briefly, this theory states that conflicts between
lenders and shareholders create incentives for shareholders to invest in a suboptimal way.
Therefore, lenders take actions to protect themselves, here by requiring tangible assets as
collateral.
In order to estimate the econometric models below, we use the ratio of fixed assets over total
assets as a measure of tangible assets.
Non-debt tax shield According to Modigliani and Miller (1958), interest tax shields create strong incentives for firms
to increase leverage. But also the size of non-debt related corporate tax shields like tax
deductions for depreciation and investment tax credits may affect leverage. Indeed, DeAngelo
and Masulis (1980) argue that such non-debt tax shields are substitutes for the tax benefits of debt
financing. Therefore, the tax advantage of leverage decreases when other tax deductions like
9 In fact, Jensen and Meckling (1976) identify two types of conflicts: first, conflicts between shareholders and managers, secondly, conflicts between lenders and shareholders according to the discussion above.

depreciation increase (Wanzenried, 2002). Hence, we expect that an increase in non-debt tax
shields will affect leverage negatively.
Titman and Wessels (1988) use the ratio of tax credits over total assets and the ratio of
depreciation over total assets as measures of non-debt tax shield. In this study, we have only data
on depreciation and therefore, the ratio of depreciation over total assets will serve as a measure
for non-debt tax shield.
Profitability The pecking order theory, based on works by Myers and Majluf (1984) suggests that firms have a
pecking-order in the choice of financing their activities. Roughly, this theory states that firms
prefer internal funds rather than external funds. If external finance is required, the first choice is
to issue debt, then possibly with hybrid securities such as convertible bonds, then eventually
equity as a last resort (Brealey and Myers, 1991). This behavior may be due to the costs of
issuing new equity, as a result of asymmetric information or transaction costs. There are
conflicting theoretical predictions on the effects of profitability on leverage (Rajan and Zingales,
1995); while Myers and Majluf (1984) predict a negative relationship according to the pecking-
order theory, Jensen (1986) predicts a positive relationship if the market for corporate control is
effective. However, if it is ineffective, Jensen (1986) predicts a negative relationship between
profitability and leverage. In this paper, we expect that there is a negative correlation between
profitability and leverage, i.e. high profit firms should have a lower leverage.
Here, we use the ratio of earnings before interest and taxes (EBIT) to total assets as a measure
profitability.
Size The relationship between firm size and leverage is also unclear. If the relationship is a proxy for
probability of bankruptcy, then size may be an inverse proxy for the probability of bankruptcy,
since larger firms are more likely to be more diversified and fail less often. Accordingly, larger
firms may issue debt at lower costs than smaller firms. In this case therefore, we can expect size
to be positively related to leverage. However, Fama and Jensen (1983) argue that there may be
less asymmetric information about large firms, since these firms tend to provide more
information to outside investors than smaller firms. This should therefore increase their
preference for equity relative to debt (Rajan and Zingales, 1995). In this study, our expectation on
the effect of size on leverage is ambiguous.

There exist many different measures for size, for instance (the log of) sales, number of people
employed or size of total assets. Here, we use the log of sales and log of number pf people
employed as a measure for size.
Expected growth There exist quite a large uncertainty as regards the growth factor, both regarding its effect on
leverage and how it shall be measured. First, we may expect a positive relationship between
growth and leverage since higher growth opportunities implies a higher demand for funds, and,
ceteris paribus, a greater preference on external financing through the preferred source of debt
according to the pecking-order theory (Rao and Lukose, 200?). On the other hand, Myers (1977)
argues that due to agency problems, firms investing in assets that may generate high growth
opportunities in the future face difficulties in borrowing against such assets. For this reason, we
may now instead expect a negative relationship between growth and leverage. However, as
Michaelas et. al. (1999) and Titman and Wessels (1988) notice, Myers (1977) also points out that
this agency problem is mitigated if the firms issues short-term rather than long-term debt.
Therefore, we may expect that short-term debt to be positively related to growth if growing firms
substitute short-term financing for long-term financing.
A commonly thought proxy for the growth determinant is the so-called market-to-book ratio; the
ratio of the market value of assets over the book value of assets (see e.g. Rajan and Zingales,
1995). According to Myers (1977), high market-to-book ratios are an indicator of investment
opportunities and ultimately of expected growth, since an increase in the market-to-book ratio
may arise from higher expected cash flows.
Other measures of growth include the ratio of capital expenditures over total assets, research and
development over sales, and the percentage change in total assets from the previous to current
year (Titman and Wessels, 1988). Due to the structure of the data set available for this study,
growth will be measured using the last indicator (percentage change in total assets).
Uniqueness Lööf (2003) summarizes the idea due to Titman (1984), that the more unique a firm’s asset is, the
thinner the market for such assets. Accordingly the lower is the expected value recoverable by a
lender in the event of bankruptcy. Hence, we may expect that uniqueness be negatively related to
leverage. Following Titman and Wessels (1988), uniqueness is measured as the ratio of
expenditures on research and development over sales.
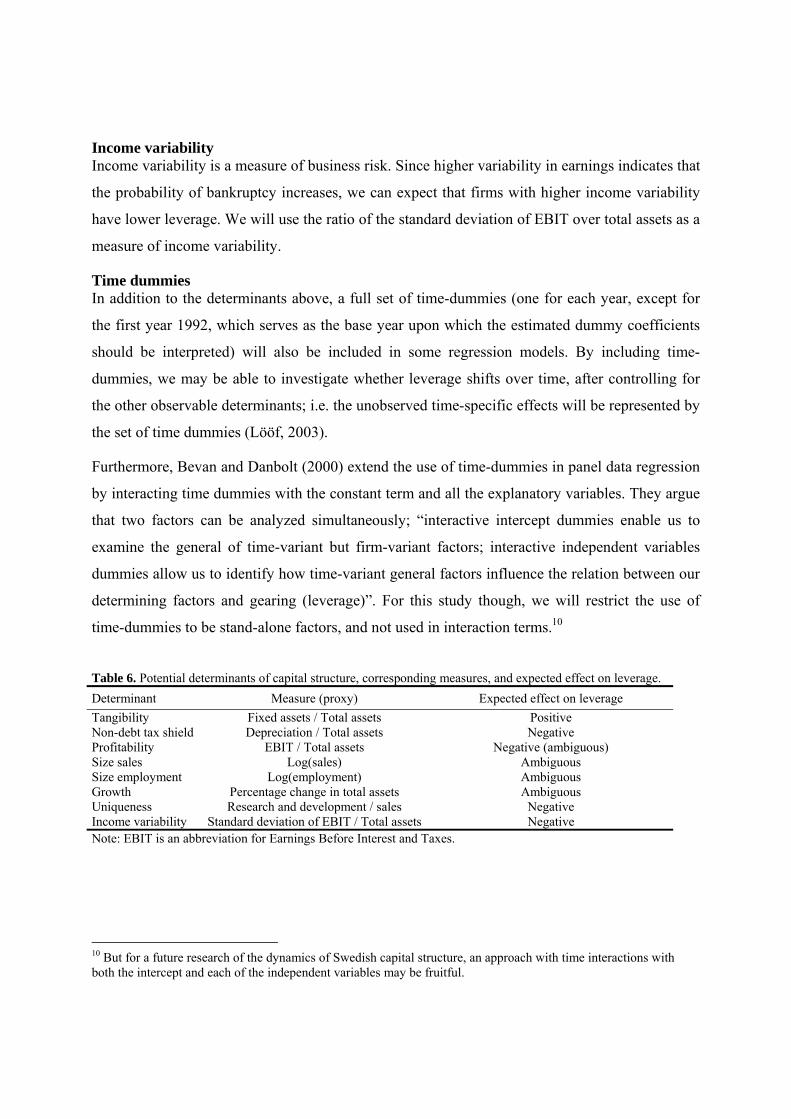
Income variability Income variability is a measure of business risk. Since higher variability in earnings indicates that
the probability of bankruptcy increases, we can expect that firms with higher income variability
have lower leverage. We will use the ratio of the standard deviation of EBIT over total assets as a
measure of income variability.
Time dummies In addition to the determinants above, a full set of time-dummies (one for each year, except for
the first year 1992, which serves as the base year upon which the estimated dummy coefficients
should be interpreted) will also be included in some regression models. By including time-
dummies, we may be able to investigate whether leverage shifts over time, after controlling for
the other observable determinants; i.e. the unobserved time-specific effects will be represented by
the set of time dummies (Lööf, 2003).
Furthermore, Bevan and Danbolt (2000) extend the use of time-dummies in panel data regression
by interacting time dummies with the constant term and all the explanatory variables. They argue
that two factors can be analyzed simultaneously; “interactive intercept dummies enable us to
examine the general of time-variant but firm-variant factors; interactive independent variables
dummies allow us to identify how time-variant general factors influence the relation between our
determining factors and gearing (leverage)”. For this study though, we will restrict the use of
time-dummies to be stand-alone factors, and not used in interaction terms.10
Table 6. Potential determinants of capital structure, corresponding measures, and expected effect on leverage. Determinant Measure (proxy) Expected effect on leverage Tangibility Fixed assets / Total assets Positive Non-debt tax shield Depreciation / Total assets Negative Profitability EBIT / Total assets Negative (ambiguous) Size sales Log(sales) Ambiguous Size employment Log(employment) Ambiguous Growth Percentage change in total assets Ambiguous Uniqueness Research and development / sales Negative Income variability Standard deviation of EBIT / Total assets Negative Note: EBIT is an abbreviation for Earnings Before Interest and Taxes.
10 But for a future research of the dynamics of Swedish capital structure, an approach with time interactions with both the intercept and each of the independent variables may be fruitful.
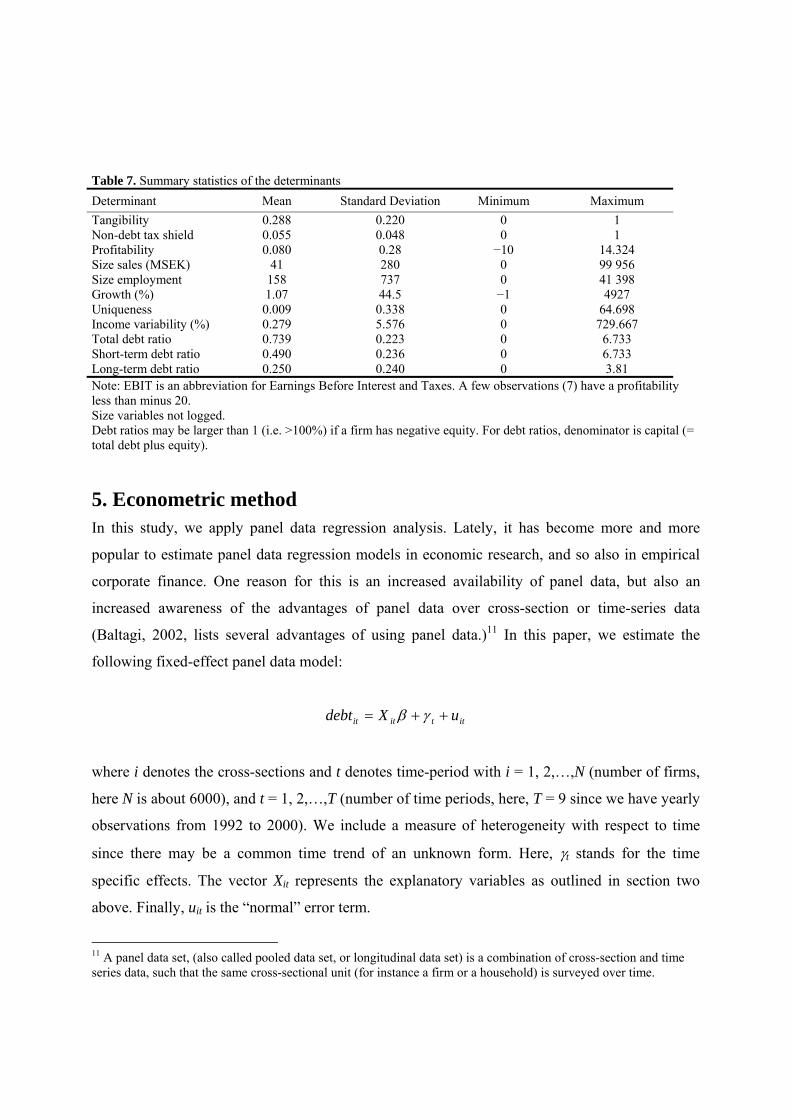
Table 7. Summary statistics of the determinants Determinant Mean Standard Deviation Minimum Maximum Tangibility 0.288 0.220 0 1 Non-debt tax shield 0.055 0.048 0 1 Profitability 0.080 0.28 −10 14.324 Size sales (MSEK) 41 280 0 99 956 Size employment 158 737 0 41 398 Growth (%) 1.07 44.5 −1 4927 Uniqueness 0.009 0.338 0 64.698 Income variability (%) 0.279 5.576 0 729.667 Total debt ratio 0.739 0.223 0 6.733 Short-term debt ratio 0.490 0.236 0 6.733 Long-term debt ratio 0.250 0.240 0 3.81 Note: EBIT is an abbreviation for Earnings Before Interest and Taxes. A few observations (7) have a profitability less than minus 20. Size variables not logged. Debt ratios may be larger than 1 (i.e. >100%) if a firm has negative equity. For debt ratios, denominator is capital (= total debt plus equity).
5. Econometric method In this study, we apply panel data regression analysis. Lately, it has become more and more
popular to estimate panel data regression models in economic research, and so also in empirical
corporate finance. One reason for this is an increased availability of panel data, but also an
increased awareness of the advantages of panel data over cross-section or time-series data
(Baltagi, 2002, lists several advantages of using panel data.)11 In this paper, we estimate the
following fixed-effect panel data model:
ittitit uXdebt ++= γβ
where i denotes the cross-sections and t denotes time-period with i = 1, 2,…,N (number of firms,
here N is about 6000), and t = 1, 2,…,T (number of time periods, here, T = 9 since we have yearly
observations from 1992 to 2000). We include a measure of heterogeneity with respect to time
since there may be a common time trend of an unknown form. Here, γt stands for the time
specific effects. The vector Xit represents the explanatory variables as outlined in section two
above. Finally, uit is the “normal” error term.
11 A panel data set, (also called pooled data set, or longitudinal data set) is a combination of cross-section and time series data, such that the same cross-sectional unit (for instance a firm or a household) is surveyed over time.
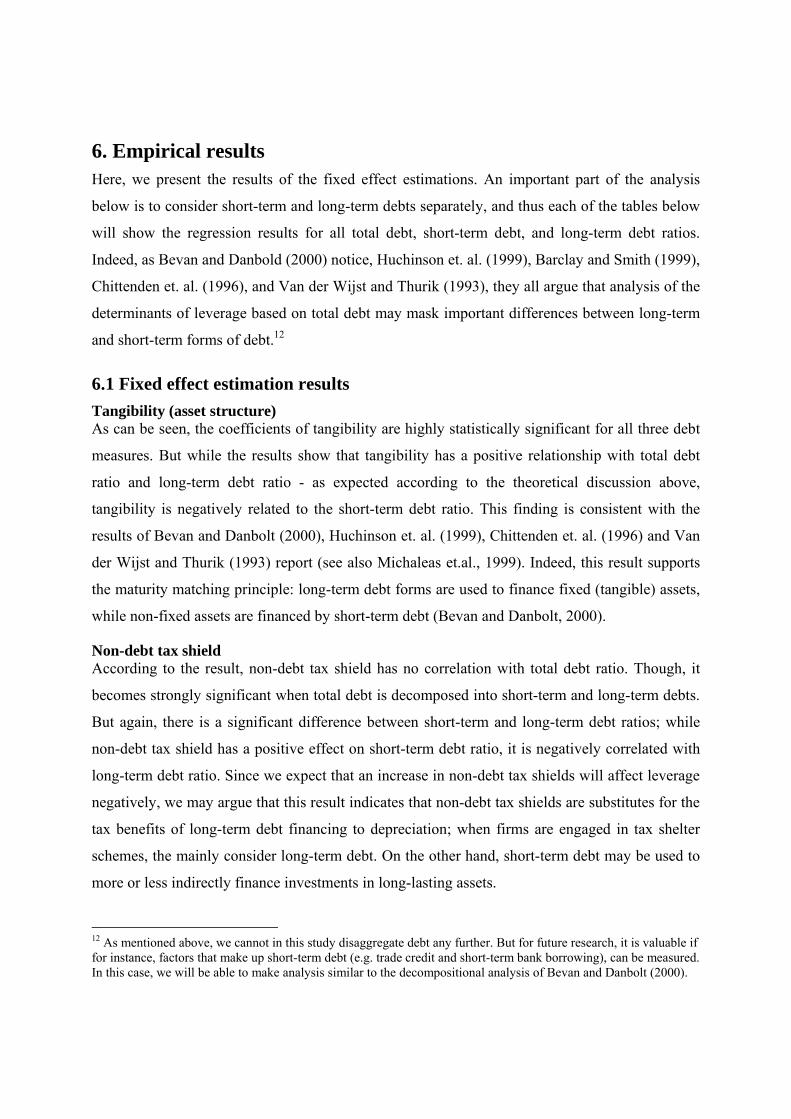
6. Empirical results Here, we present the results of the fixed effect estimations. An important part of the analysis
below is to consider short-term and long-term debts separately, and thus each of the tables below
will show the regression results for all total debt, short-term debt, and long-term debt ratios.
Indeed, as Bevan and Danbold (2000) notice, Huchinson et. al. (1999), Barclay and Smith (1999),
Chittenden et. al. (1996), and Van der Wijst and Thurik (1993), they all argue that analysis of the
determinants of leverage based on total debt may mask important differences between long-term
and short-term forms of debt.12
6.1 Fixed effect estimation results Tangibility (asset structure) As can be seen, the coefficients of tangibility are highly statistically significant for all three debt
measures. But while the results show that tangibility has a positive relationship with total debt
ratio and long-term debt ratio - as expected according to the theoretical discussion above,
tangibility is negatively related to the short-term debt ratio. This finding is consistent with the
results of Bevan and Danbolt (2000), Huchinson et. al. (1999), Chittenden et. al. (1996) and Van
der Wijst and Thurik (1993) report (see also Michaleas et.al., 1999). Indeed, this result supports
the maturity matching principle: long-term debt forms are used to finance fixed (tangible) assets,
while non-fixed assets are financed by short-term debt (Bevan and Danbolt, 2000).
Non-debt tax shield According to the result, non-debt tax shield has no correlation with total debt ratio. Though, it
becomes strongly significant when total debt is decomposed into short-term and long-term debts.
But again, there is a significant difference between short-term and long-term debt ratios; while
non-debt tax shield has a positive effect on short-term debt ratio, it is negatively correlated with
long-term debt ratio. Since we expect that an increase in non-debt tax shields will affect leverage
negatively, we may argue that this result indicates that non-debt tax shields are substitutes for the
tax benefits of long-term debt financing to depreciation; when firms are engaged in tax shelter
schemes, the mainly consider long-term debt. On the other hand, short-term debt may be used to
more or less indirectly finance investments in long-lasting assets.
12 As mentioned above, we cannot in this study disaggregate debt any further. But for future research, it is valuable if for instance, factors that make up short-term debt (e.g. trade credit and short-term bank borrowing), can be measured. In this case, we will be able to make analysis similar to the decompositional analysis of Bevan and Danbolt (2000).

Profitability Profitability is negatively correlated with all three leverage measures, which is in line with the
pecking-order theory; firms prefer using surplus generated by profits to finance investments. This
result may also indicate that firms in general always prefer internal funds rather than external
funds, irrespective of the characteristic of an asset that shall be financed (e.g. tangible or non-
tangible asset).
Size The results reveal that size is a significant determinant of leverage. But while size is positively
related to both total debt and short-term debt ratio, it is negatively correlated with long-term debt
ratio, although, the economic significance is rather small for the latter case.
Even if the data does not allow us to further decompose short-term debt, we may still find the
results of Bevon and Danbolt (2000) interesting. They find that while size is positively correlated
with both trade credit and equivalent and short-term securitized debt, it is negatively correlated
with short-term bank borrowing. This may indicate that small firms are supply constrained, in
that they do not have sufficient credit ranking to allow them to long-term borrowing.13
Expected growth According to the theoretical discussion above, we either expect a positive relationship between
expected growth and leverage, due to higher demand for funds, or, a negative relationship due to
higher costs of financial distress. Though, the results obtained here show that there exists no
relationship between expected growth and leverage that is of economic significance. One
possibly explanation may be that the effects of the two different theories neutralize each other.
Another reason may be that our measure used here, the percentage change in total assets, does not
reflect future growth possibilities wee enough, only past growth. Thus, other more significant
results might be obtained by using another measure for expected growth, for instance market-to-
book ratio, a commonly used proxy for expected growth.
Uniqueness We have again another more or less non-significant result: either statistically, economically or
both. Also Lööf (2003), using Swedish data and same measure for uniqueness as in this study
(ratio of research and development over sales), finds that uniqueness is not a significant factor
that may affect leverage.
13 For this conclusion, Bevan and Danbolt (2000) refer to Bank of England (1988).

Income variability Table 8 reveals that the effect of income variability on debt is approximately zero, but still
statistically significant. According to Lööf (2003), who also obtained similar results, this may be
due to the fact that the time period studied (1991 to 1998; this study 1992 to 2000), coincided
with a period of strong economic recovery and a generally positive trend in revenues.
Time dummies Following Michaelas et. al. (1999), we present the regression coefficients of the time dummies,
which represent unobserved time-specific effects. Table 8 reveals that almost all of the time
dummies are significant (the base year is 1992). While this is in line with the declining total and
long-term debt ratios observed in table 3 above, it is not clear why the time dummy coefficients
are mostly negative even for the short-term debt, which has not decreased during the period
(1992 – 2000). Anyway, the decrease in total and long-term debt ratio may reflect a slow
adjustment to the new tax environment triggered by the radical tax reform in the beginning of
1990, which is revealed by the (mostly) negative coefficients.14
14 On the other hand, Michaelas et. al. (1999) find coefficients estimates to be positive for almost all years.
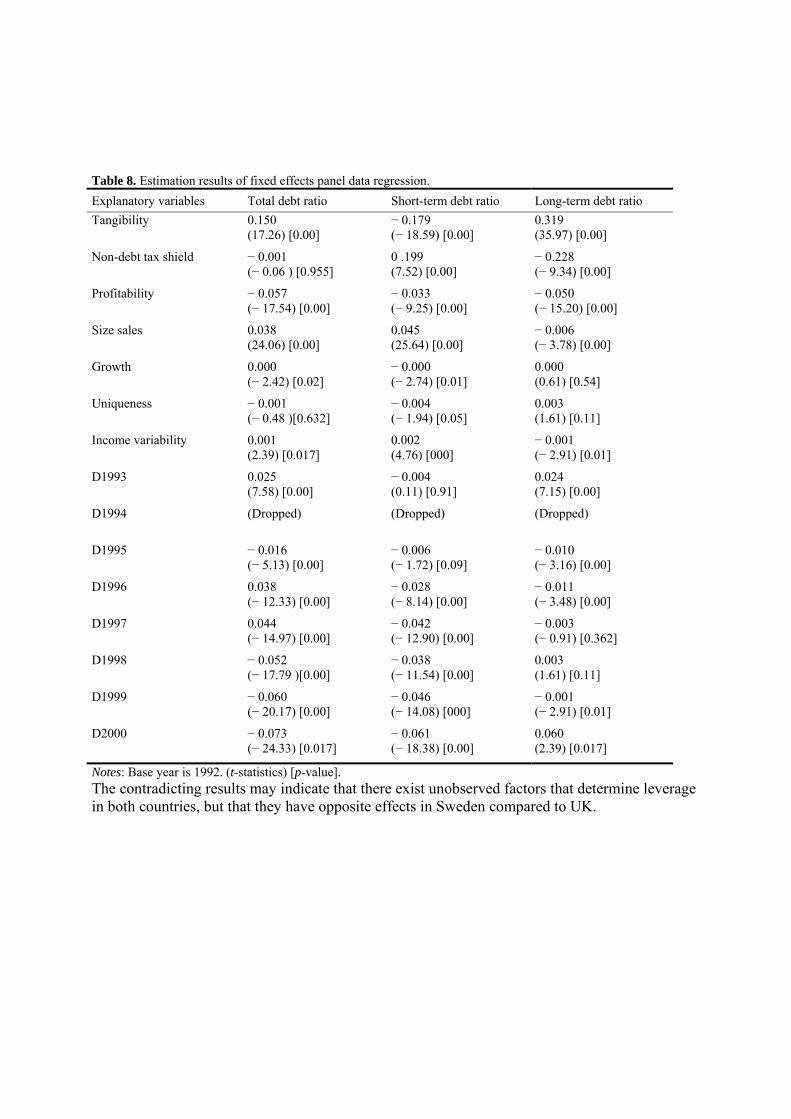
Table 8. Estimation results of fixed effects panel data regression. Explanatory variables Total debt ratio Short-term debt ratio Long-term debt ratio Tangibility 0.150
(17.26) [0.00] − 0.179 (− 18.59) [0.00]
0.319 (35.97) [0.00]
Non-debt tax shield − 0.001 (− 0.06 ) [0.955]
0 .199 (7.52) [0.00]
− 0.228 (− 9.34) [0.00]
Profitability − 0.057 (− 17.54) [0.00]
− 0.033 (− 9.25) [0.00]
− 0.050 (− 15.20) [0.00]
Size sales 0.038 (24.06) [0.00]
0.045 (25.64) [0.00]
− 0.006 (− 3.78) [0.00]
Growth 0.000 (− 2.42) [0.02]
− 0.000 (− 2.74) [0.01]
0.000 (0.61) [0.54]
Uniqueness − 0.001 (− 0.48 )[0.632]
− 0.004 (− 1.94) [0.05]
0.003 (1.61) [0.11]
Income variability 0.001 (2.39) [0.017]
0.002 (4.76) [000]
− 0.001 (− 2.91) [0.01]
D1993 0.025 (7.58) [0.00]
− 0.004 (0.11) [0.91]
0.024 (7.15) [0.00]
D1994 (Dropped)
(Dropped)
(Dropped)
D1995 − 0.016 (− 5.13) [0.00]
− 0.006 (− 1.72) [0.09]
− 0.010 (− 3.16) [0.00]
D1996 0.038 (− 12.33) [0.00]
− 0.028 (− 8.14) [0.00]
− 0.011 (− 3.48) [0.00]
D1997 0.044 (− 14.97) [0.00]
− 0.042 (− 12.90) [0.00]
− 0.003 (− 0.91) [0.362]
D1998 − 0.052 (− 17.79 )[0.00]
− 0.038 (− 11.54) [0.00]
0.003 (1.61) [0.11]
D1999 − 0.060 (− 20.17) [0.00]
− 0.046 (− 14.08) [000]
− 0.001 (− 2.91) [0.01]
D2000 − 0.073 (− 24.33) [0.017]
− 0.061 (− 18.38) [0.00]
0.060 (2.39) [0.017]
Notes: Base year is 1992. (t-statistics) [p-value]. The contradicting results may indicate that there exist unobserved factors that determine leverage in both countries, but that they have opposite effects in Sweden compared to UK.
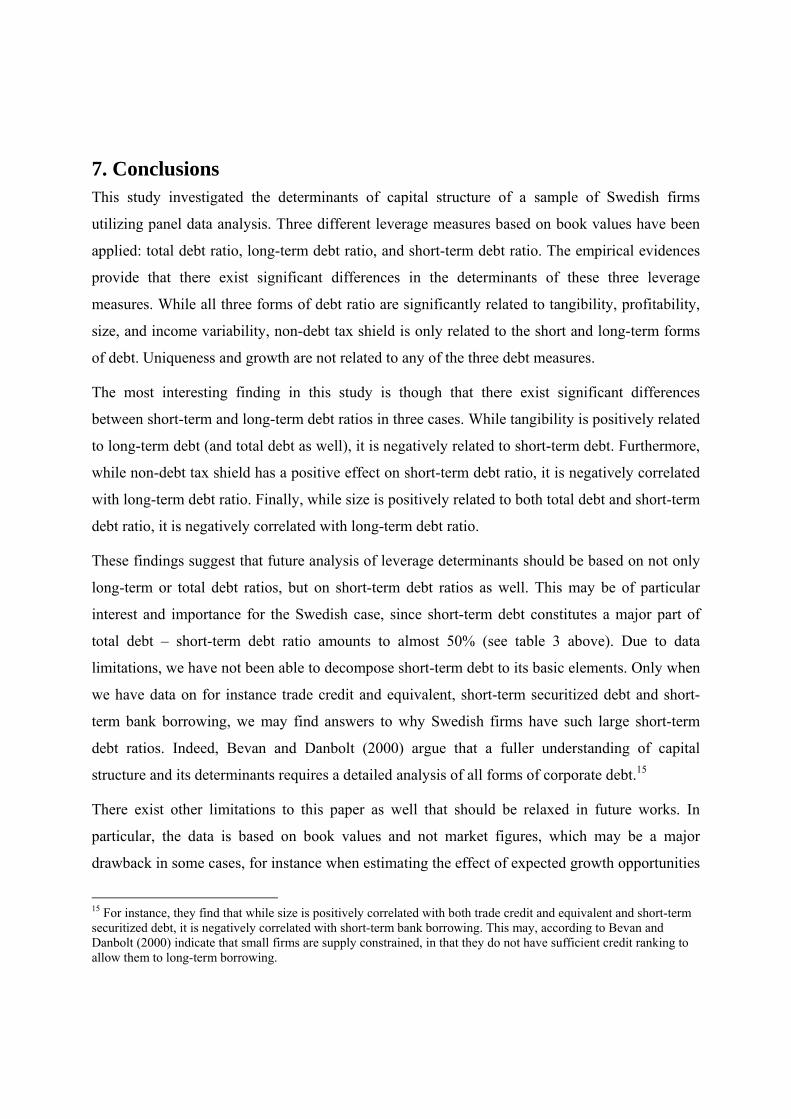
7. Conclusions This study investigated the determinants of capital structure of a sample of Swedish firms
utilizing panel data analysis. Three different leverage measures based on book values have been
applied: total debt ratio, long-term debt ratio, and short-term debt ratio. The empirical evidences
provide that there exist significant differences in the determinants of these three leverage
measures. While all three forms of debt ratio are significantly related to tangibility, profitability,
size, and income variability, non-debt tax shield is only related to the short and long-term forms
of debt. Uniqueness and growth are not related to any of the three debt measures.
The most interesting finding in this study is though that there exist significant differences
between short-term and long-term debt ratios in three cases. While tangibility is positively related
to long-term debt (and total debt as well), it is negatively related to short-term debt. Furthermore,
while non-debt tax shield has a positive effect on short-term debt ratio, it is negatively correlated
with long-term debt ratio. Finally, while size is positively related to both total debt and short-term
debt ratio, it is negatively correlated with long-term debt ratio.
These findings suggest that future analysis of leverage determinants should be based on not only
long-term or total debt ratios, but on short-term debt ratios as well. This may be of particular
interest and importance for the Swedish case, since short-term debt constitutes a major part of
total debt – short-term debt ratio amounts to almost 50% (see table 3 above). Due to data
limitations, we have not been able to decompose short-term debt to its basic elements. Only when
we have data on for instance trade credit and equivalent, short-term securitized debt and short-
term bank borrowing, we may find answers to why Swedish firms have such large short-term
debt ratios. Indeed, Bevan and Danbolt (2000) argue that a fuller understanding of capital
structure and its determinants requires a detailed analysis of all forms of corporate debt.15
There exist other limitations to this paper as well that should be relaxed in future works. In
particular, the data is based on book values and not market figures, which may be a major
drawback in some cases, for instance when estimating the effect of expected growth opportunities
15 For instance, they find that while size is positively correlated with both trade credit and equivalent and short-term securitized debt, it is negatively correlated with short-term bank borrowing. This may, according to Bevan and Danbolt (2000) indicate that small firms are supply constrained, in that they do not have sufficient credit ranking to allow them to long-term borrowing.

on leverage, since stock markets usually capitalize the present value of growth opportunities.
Finally, applying dynamic panel data regression in future research may make it possible to reveal
interesting relationships between short- and long-term leverage, from which important
discussions on the relationship between financial systems, corporate debt structure and growth
may be based upon.
References (to be completed) Bevan, A. A. And Danbolt, J., (2000) Capital structure and its determinants in the United Kingdom: a decompositional analysis, Working Paper, Dept. of Accounting and Finance, University of Glasgow. Bowman, J. (1980)., The Importance of a Market Value Measurement of Debt in Assessing Leverage. Journal of Accounting Research, 18, 242-54. Brealey, R.A. and Myers, S.C., (2003), Principles of Corporate Finance, 7th ed., McGraw Hill. Harris, M., Raviv, A., 1991. The theory of capital structure. Journal of Finance 46 (1), pp. 297-355. Lööf, H., 2004, Dynamic optimal capital structure and technical change, Structural Change and Economic Dynamics, 15(4), pp 449-468. Michaelas, N., Chittenden, F. and Poutziouris, P., (1999), Financial Policy and Capital Structure Choice in U.K. SMEs: Empirical Evidence from Company Panel Data, Small Business Economics, 12: 113 – 130. Modigliani, F. and Miller, M.H. (1958) The Cost of Capital, Corporate Finance, and the Theory of Investment, American Economic Review, 48, 261-297. Myers, S. C., 1984, The Capital Structure Puzzle, Journal of Finance, 39, 575-592. Rajan, R. G., and L. Zingales, 1995, “What do we know about capital structure? Some evidence from international data” Journal of Finance, 50, 1421-1460. Titman, S., 2001, The Modigliani and Miller theorem and market efficiency, Working paper, National Bureau of Economic Research. Titman, S. and Roberto W., 1988, The Determinants of Capital Structure, Journal of Finance, 43(1), 1-19.

Appendix I Random effects estimation
Table A.I below reveals that results are in general identical to those obtained above when FE estimation was applied. Table A.I. Estimation results of random effects panel data regression. Explanatory variables Total debt ratio Short-term debt ratio Long-term debt ratio Tangibility 0.131
(18.09) [0.00] − 0.270 (− 35.02) [0.00]
0.398 (57.51)[0.00]
Non-debt tax shield 0.049 (2.15) [0.03]
0.317 (12.72) [0.00]
− 0.285 (− 12.58) [0.00]
Profitability − 0.054 (− 17.46) [0.00]
− 0.024 (− 6.96) [0.00]
− 0.055 (− 17.67) [0.00]
Size sales 0.019 (15.78) [0.00]
0.021 (16.45) [0.00]
− 0.004 (− 3.83) [0.00]
Growth 0.000 (− 2.11) [0.03]
− 0.000 (− 2.45) [0.01]
0.000 (0.67) [0.51]
Uniqueness − 0.001 (− 0.62) [0.53]
− 0.005 (− 2.10) [0.04]
0.003 (1.60) [0.11]
Income variability 0.000 (0.18) [0.85]
0.001 (2.55) [0.01]
− 0.001 (− 3.12) [0.00]
Time dummies (D1993 to D2000)
Individually and jointly significant. D94 dropped.
Individually significant (not 1993 and 1995) and jointly significant. D94 dropped.
Individually (not 1997) and jointly significant. D94 dropped.
Notes: (t-statistics) [p-value].