Embed Size (px)
Citation preview
ESRI 380 New York St., Redlands, CA 92373-8100, USA • TEL 909-793-2853 • FAX 909-793-5953 • E-MAIL [email protected] • WEB www.esri.com
Challenges for GIS in Emergency Preparedness and Response
An ESRI White Paper • May 2000

Copyright © 2000 Environmental Systems Research Institute, Inc. All rights reserved. Printed in the United States of America. The information contained in this document is the exclusive property of Environmental Systems Research Institute, Inc. This work is protected under United States copyright law and other international copyright treaties and conventions. No part of this work may be reproduced or transmitted in any form or by any means, electronic or mechanical, including photocopying and recording, or by any information storage or retrieval system, except as expressly permitted in writing by Environmental Systems Research Institute, Inc. All requests should be sent to Attention: Contracts Manager, Environmental Systems Research Institute, Inc., 380 New York Street, Redlands, CA 92373-8100, USA. The information contained in this document is subject to change without notice.
U.S. GOVERNMENT RESTRICTED/LIMITED RIGHTS Any software, documentation, and/or data delivered hereunder is subject to the terms of the License Agreement. In no event shall the U.S. Government acquire greater than RESTRICTED/LIMITED RIGHTS. At a minimum, use, duplication, or disclosure by the U.S. Government is subject to restrictions as set forth in FAR §52.227-14 Alternates I, II, and III (JUN 1987); FAR §52.227-19 (JUN 1987) and/or FAR §12.211/12.212 (Commercial Technical Data/Computer Software); and DFARS §252.227-7015 (NOV 1995) (Technical Data) and/or DFARS §227.7202 (Computer Software), as applicable. Contractor/Manufacturer is Environmental Systems Research Institute, Inc., 380 New York Street, Redlands, CA 92373-8100, USA. ESRI, ARC/INFO, ArcCAD, ArcView, BusinessMAP, MapObjects, PC ARC/INFO, SDE, and the ESRI globe logo are trademarks of Environmental Systems Research Institute, Inc., registered in the United States and certain other countries; registration is pending in the European Community. 3D Analyst, ADF, ARC COGO, the ARC COGO logo, ARC GRID, the ARC GRID logo, ArcInfo, the ArcInfo logo, the ARC/INFO logo, AML, ARC NETWORK, the ARC NETWORK logo, ArcNews, ARC TIN, the ARC TIN logo, ArcInfo LIBRARIAN, ArcInfo—Professional GIS, ArcInfo—The World's GIS, ArcAtlas, the ArcAtlas logo, the ArcCAD logo, the ArcCAD WorkBench logo, ArcCatalog, the ArcData logo, the ArcData Online logo, ARCEDIT, the ARCEDIT logo, ArcEurope, ArcExplorer, the ArcExplorer logo, ArcExpress, the ArcExpress logo, ArcFM, the ArcFM logo, the ArcFM Viewer logo, ArcGIS, ArcIMS, the ArcIMS logo, ArcLogistics, the ArcLogistics Route logo, ArcMap, ArcObjects, ArcPad, the ArcPad logo, ARCPLOT, the ARCPLOT logo, ArcPress, the ArcPress logo, the ArcPress for ArcView logo, ArcScan, the ArcScan logo, ArcScene, the ArcScene logo, ArcSchool, ArcSDE, the ArcSDE logo, the ArcSDE CAD Client logo, ArcSdl, ArcStorm, the ArcStorm logo, ArcSurvey, ArcToolbox, ArcTools, the ArcTools logo, ArcUSA, the ArcUSA logo, ArcUser, the ArcView GIS logo, the ArcView 3D Analyst logo, the ArcView Business Analyst logo, the ArcView Data Publisher logo, the ArcView Image Analysis logo, the ArcView Internet Map Server logo, the ArcView Network Analyst logo, the ArcView Spatial Analyst logo, the ArcView StreetMap logo, the ArcView StreetMap 2000 logo, the ArcView Tracking Analyst logo, ArcVoyager, ArcWorld, the ArcWorld logo, Atlas GIS, the Atlas GIS logo, AtlasWare, Avenue, the Avenue logo, the BusinessMAP logo, DAK, the DAK logo, DATABASE INTEGRATOR, DBI Kit, the Digital Chart of the World logo, the ESRI corporate logo, the ESRI Data logo, the ESRI PRESS logo, ESRI—Team GIS, ESRI—The GIS People, FormEdit, Geographic Design System, Geography Matters, GIS Day, the GIS Day logo, GIS by ESRI, GIS for Everyone, GISData Server, InsiteMAP, MapBeans, MapCafé, the MapCafé logo, the MapObjects logo, the MapObjects Internet Map Server logo, ModelBuilder, NetEngine, the NetEngine logo, the PC ARC/INFO logo, PC ARCEDIT, PC ARCPLOT, PC ARCSHELL, PC DATA CONVERSION, PC NETWORK, PC OVERLAY, PC STARTER KIT, PC TABLES, the Production Line Tool Set logo, RouteMAP, the RouteMAP logo, the RouteMAP IMS logo, Spatial Database Engine, the SDE logo, SML, StreetMap, TABLES, The World's Leading Desktop GIS, Water Writes, and Your Personal Geographic Information System are trademarks; and ArcData, ArcOpen, ArcQuest, ArcWatch, ArcWeb, Rent-a-Tech, @esri.com, and www.esri.com are service marks of Environmental Systems Research Institute, Inc. The names of other companies and products herein are trademarks or registered trademarks of their respective trademark owners.
J-8476
ESRI White Paper i
Challenges for GIS in Emergency Preparedness and Response
An ESRI White Paper Contents Page The Application Challenge—Emergency Preparedness and Response. 1 A Paradigm for Geographic Information Science's Contribution to Emergency Preparedness and Response ........................................... 2 Geographic Information Science Contributions to Advance the Discussion ....................................................................................... 2 Natural Disasters That Impact Humans .............................................. 3
Earthquakes ................................................................................. 3 Volcanoes .................................................................................... 4 Tsunamis...................................................................................... 6 Landslides.................................................................................... 6 Fires............................................................................................. 7 Floods.......................................................................................... 8 Tornadoes.................................................................................... 9 Hurricanes ................................................................................... 9
Human-Induced Disasters That Impact Humans and Environs............ 10
Health-Related Epidemics ............................................................ 10 Social Unrest—War ..................................................................... 11 Toxic Spills, Explosions, and Fires (Accidental or Otherwise) ...... 12
Research Challenges .......................................................................... 12 Spatial Data Acquisition and Integration....................................... 12 Distributed Computing................................................................. 14
Challenges for GIS in Emergency Preparedness and Response
J-8476
May 2000 ii
Contents Page
Extensions to Geographic Representations................................... 15 Cognition of Geographic Information........................................... 15 Interoperability of Geographic Information .................................. 16 Scale............................................................................................ 16 Spatial Analysis in a GIS Environment ......................................... 17 The Future of Spatial Information Infrastructure .......................... 18 Uncertainty in Geographic Data and GIS-Based Analyses ............ 18 GIS and Society........................................................................... 18
Linkages to Education Priorities ........................................................ 19 Emerging Technologies for Delivering Geographic Information Science Education...................................................................... 20 Supporting Infrastructure............................................................. 20 Access and Equity........................................................................ 20 Alternative Designs for Curriculum Content and Evaluation ......... 20 Professional GIS Education Programs.......................................... 21 Research-Based Graduate GIS Education .................................... 21 Learning with GIS ....................................................................... 21 Accreditation and Certification..................................................... 21
Policy Implications ............................................................................ 21
Conclusion ........................................................................................ 22
References......................................................................................... 22
Glossary ............................................................................................ 28

J-8476
ESRI White Paper
Challenges for GIS in Emergency Preparedness and Response John Radke, Tom Cova, Michael F. Sheridan, Austin Troy, Lan Mu, Russ Johnson
Understanding geographic information is critical if we are to build and maintain livable communities. Since computing has become almost ubiquitous in planning and managing our communities, it is probable that advances in geographic information science will play a founding role in smarter decision making. This paper examines the challenges that occur between humans and their environment under conditions thought to be hazardous to life and habitat. Emergency preparedness and response are reviewed, and recommended priorities for research, educational, and policy contributions to emergency preparedness and response are documented.
The Application Challenge—Emergency
Preparedness and Response
The emergency preparedness and response application challenge is mainly concerned with the interaction between humans and their environment under conditions thought to be hazardous either to life or habitat. This application challenge is not only multifaceted as its title implies but also covers a wide range of disasters, many with fundamentally different underlying processes (such as earthquakes, hurricanes, and wildfires). Even though the processes that generate the disaster might be fundamentally different, techniques to assess risk, evaluate preparedness, and assist response appear to have much in common and can share and benefit from advances in geographic information science (such as data acquisition and integration; data ownership, access, and liability issues; and interoperability). Natural hazards and most human-generated hazards do not recognize political boundaries, yet policy must be generated in order to mitigate effectively against disaster, manage rescue and response operations, or organize and deliver relief, and this policy is usually administered within politically defined boundaries. Geographic information and the systems within which it is collected and managed have particular utility in modeling and analysis, which transcend political boundaries while providing the necessary structure for assisting the implementation of policy within administrative areas. In a similar vein, while hazards do not often differentiate between land uses, the recovery and the cost and impact on society are often greatly affected by this land use differentiation. In some circumstances, the hazard itself is modified and often magnified by heterogeneous landscapes and land use, such as those found where humans interact with nature. These boundary conditions are difficult to map and virtually impossible to model without the use of concepts, tools, and technologies that are evolving within geographic information science. In order to assess and mitigate risk to human life and

Challenges for GIS in Emergency Preparedness and Response
J-8476
May 2000 2
property, and in order to respond effectively, we must develop predictive and operational models that are embedded within geographic information system (GIS) software. A postdisaster statement might conclude that if we knew then what we know now, we could prevent or at least reduce the risk, damage, and loss and shorten the recovery period. Since GIS and related technologies provide an operational forum for realizing this statement, the effort here begins the process of answering the question, What are the challenges for geographic information science arising from disaster management?
A Paradigm for Geographic Information
Science's Contribution to
Emergency Preparedness and
Response
The contribution of geographic information science to emergency preparedness and response might best be navigated within a paradigm that at the very least might be represented as a three-dimensional grid but will more likely be depicted as a graph with three axes as illustrated in Figure 1. One axis represents the hazards as we commonly refer to them: (1) natural hazards such as earthquakes, volcanoes, tsunamis, landslides, fires, floods, tornadoes, hurricanes, droughts, and freeze; and (2) human-induced hazards such as health-related epidemics, social unrest, war, infrastructure failure and collapse, toxic spills, explosions, and fires (accidental or otherwise). Along a second axis we represent time, which can characterize actions taken such as pre-event (proactive–risk assessed), during the event (reactive–response), and post-event (reactive–recover). The third axis encodes action taken or response sought by the application of geographic information science to assessment, emergency preparedness, and response such as prevention, discovery, planning, mitigation, management, insurance settlement, and policy.
Figure 1 A Paradigm for Geographic Information Science's Contribution to
Emergency Preparedness and Response
Geographic Information Science
Contributions to Advance the
Discussion
Geographic information science and related technologies have already contributed in many areas encoded within the paradigm. There are numerous examples of ongoing projects to predict hazards, assess the risk to human life and property, assist response during an emergency, discover and recover from damage, manage ongoing hazardous conditions, plan and mitigate for future hazards, and impact policy and decision making. To navigate a small sample of these will not only serve to point out where geographic

Challenges for GIS in Emergency Preparedness and Response
J-8476
ESRI White Paper 3
information science is already contributing to emergency preparedness and response, but it will also help us understand the future geographic information challenges for this application area. Although the following list of hazards is not all inclusive, it is an appropriate list to begin the discussion for emergency preparedness and response. In the interests of brevity and breadth of coverage, each hazard is not addressed in great detail, but rather is reviewed for the role geographic information has played, which includes predicting, responding to, managing, and recovering from these disasters. As with any hazard, in order to reduce the loss of life and damage to property, public safety officials, policy decision makers, and the general public must be aware of potentially hazardous conditions well in advance. In many past disasters the general public would have been able to themselves respond in a crisis if they had knowledge of existing conditions. Geographic information science in its research and education initiatives appears to be able to offer concrete support here.
Natural Disasters That Impact
Humans
In most of the cases examined, a major part of the effort relating to natural hazards was a focus on mapping. This is not surprising as most solutions involving GIS are data poor until they become part of an accepted set of procedures. However, the mapping procedures and how information is being displayed appear to have been impacted by the advancing of technologies within geographic information science. Simply encoding where some single variable existed is being replaced by maps depicting combinations of variables and their contribution to and potential for failure in hazardous conditions. The data and information are being made more available to the general public due to advances in and the acceptance of World Wide Web technology. It is likely that advances in Web technology that have greatly impacted emergency preparedness and response mirror the rate and potential impact of advances in geographic information science to this application area. Rather than look too far into the future, we choose to respond to existing conditions as we discuss emergency preparedness and response challenges. In the first section of the paper, we examine the nature of the event and role of geographic information for earthquakes, volcanoes, tsunamis, landslides, fires, floods, tornadoes, hurricanes, epidemics, social unrest, war, toxic spills, explosions, and fires.
Earthquakes Earthquakes can destroy human infrastructure and habitat, killing and impacting large populations, especially in urban areas. Although the 1989 Loma Prieta earthquake was considered by some to be a wake-up call, it certainly reminded others that proactive mitigation efforts pay off as damage and loss of life were minimal for such a large earthquake in such a populated area. Major earthquakes of the recent past, including Adana-Ceyhan, Turkey (1998); Izmit, western Turkey (1999); Taiwan (1999); and Hector Mines–Joshua Tree, California (1999), demonstrate the wide range of human impact that can result from events of similar magnitudes. Earthquakes can affect any area within a broad zone and may pose great risk to human life and infrastructure, depending on settlement distribution and densities, in addition to building materials, engineering standards, and the like. Unlike
Challenges for GIS in Emergency Preparedness and Response
J-8476
May 2000 4
hurricanes and often volcanoes, predicting when an earthquake will happen still eludes us; however, where they will occur is well mapped by existing fault lines. Of the many seismic digital mapping projects that have been undertaken, one of the most notable state projects stems from the 1990 California Seismic Hazards Mapping Act, which requires the California Department of Conservation, Division of Mines and Geology (DOC/DMG) to map seismic hazard zones and identify areas of risk that are subject to potential ground failure. The purpose of these maps is to help cities and counties regulate development in hazardous areas to indicate areas requiring mitigation and to assist in making disclosures for the California Natural Hazard Disclosure Act (AB 1995). These maps show amplified shaking hazards zones, which are defined as areas where historic amplified ground shaking has occurred or local geological and geotechnical conditions indicate a potential for ground shaking to be amplified to a level such that mitigation would be required. They also depict areas of past or potential liquefaction (ground displacements) and past or potential earthquake-induced landslides. Urbanized areas have the highest priority for mapping, and to date DOC/DMG has mapped most parts of Alameda, Los Angeles, Orange, San Francisco, Santa Clara, and Ventura counties at a 1:24,000 scale. There are plans to release and distribute these maps to the public on the Web in a variety of data formats to likely include GIF, PDF, and various other formats that would be compatible with the most popular GIS software. At the federal level, the United States Geological Survey (USGS) has produced the National Seismic Hazard Maps, which were made available on the Web in 1996. These maps, which cover the conterminous United States, depict probabilistic ground motion and spectral response with return times of approximately 500, 1,000 and 2,500 years. The nation is divided into two regions (central east and west) that use separate calculations for attenuation relations. For the western portion, the maps use a grid spacing of 0.1 degrees (for the east it is 0.2°). For grid cells with historic seismic events, seismic hazard is determined based on the number of events greater than the minimum magnitude. For areas with little historic seismicity, "background zones" were created based on discussions at regional workshops (Frankel, 1996). Also, at the federal level, FEMA's predictions (using GIS to assist) brought unprecedented efficiency to the process of speeding relief to victims of natural disaster. After the Northridge earthquake in northern California on January 17, 1994, FEMA said that 560,000 households would be affected; the agency received about 600,000 applications for help. A notable local or regional organization in the area of seismic hazard mapping is the Association of Bay Area Government (ABAG). With the help of the USGS and the National Science Foundation, ABAG has been using GIS technology since 1975 to produce seismic hazard maps for the Bay Area. The maps, which include designations of fault study zones, ground shaking intensity fault traces, and tsunami inundation zones, are easily combined with other data sources, such as the United States Bureau of the Census TIGER street and boundary files, to help local planners in land use decisions and mitigation planning.
Volcanoes Volcanic phenomena can destroy vast areas of productive land and human structures destroying and killing the population of entire cities. Major eruptions of the
Challenges for GIS in Emergency Preparedness and Response
J-8476
ESRI White Paper 5
recent past include Mount St. Helens (1980), El Chichon (1982), Nevado del Ruiz (1985), Unzen (1991), and Pinatubo (1994). Mount Rainier currently has a potential to threaten the cities of Tacoma and Seattle, and Popocatepetl menaces an area near Puebla and Mexico City, home to more than ten million people. Hazardous volcanic phenomena range from passive gas emission and slow effusion of lava to volcanic explosions accompanied by the development of a stratospheric plume with associated dense descending currents of incandescent volcanic ash and rocks that race at high speeds along the surface away from the volcano (nuée ardante). Mass movement of surficial materials takes the form of rock falls and avalanches or even the sudden collapse of large sectors of the volcanic edifice. These phenomena and their associated water-saturated debris flows are extremely dangerous geologic events and have caused tens of thousands of deaths during the past two decades. In many cases the loss of life could have been reduced if public safety officials and the general population were aware of the potential effect of the phenomena on their local environment. The management of hazards related to volcanoes in the United States is administered by the USGS. The eruption of Mount St. Helens, which began in 1980, killed seventy-nine people, and disrupted the area for several years, is the worst case in the United States. Long Valley, California, experienced several crises in the past three decades and is potentially dangerous. Mount Rainier (and other Cascade Range volcanoes) presents a risk to a very large population and infrastructure. Hazard maps at various scales exist for most of the potentially active volcanoes of the United States. In contrast, most dangerous volcanoes in developing countries lack adequate hazard assessment and map coverage. The use of GIS in volcanic hazards studies is very modest. The first papers appeared in the late 1980s, and about two papers per year have been published during this decade. About half of the topics addressed have been mass movements (landslides and debris flows), and the remainder treated general topics. Sophisticated themes, such as distributed computing, visualization, use of large data sets, and interactive modeling and analysis, are lacking. Volcanoes usually present a known source area of threat, in contrast to earthquakes that could affect any area within a broad zone. This makes them particularly appropriate for GIS analysis. In the United States the geologic histories of most volcanoes are sufficiently understood to forecast the types of phenomena to be anticipated. The relative magnitude and frequency of future events are harder to predict. A complicating factor for volcanoes is that the repose time since the previous event may be very long. The inhabitants surrounding the volcano may have a belief that even if there were eruptions in the past, nothing will happen in their lifetime. At any rate, they are willing to take a chance that they will be safe. The last decade of the twentieth century witnessed the development of several forms of computerized models for volcanic eruptions and their associated hazards. Unfortunately, these have not often been linked to interactive GIS systems. Computation, communication, and information technologies during this period advanced at a faster rate than the development, testing, and utilization of controlled scientific models. In general, posters, still images, or video scenes of events at other volcanoes were the main methods used to explain the phenomena to the public safety officials and to illustrate potential
Challenges for GIS in Emergency Preparedness and Response
J-8476
May 2000 6
events at a volcano in crisis to the local inhabitants. Only in a few cases were advanced technologies or computer models used in the development of volcanic hazard maps.
Tsunamis Tsunamis, like earthquakes, are difficult to predict, but their inundation zone along the coastline can be mapped and early warnings can result. A National Tsunami Hazard Mitigation Program was initiated in July 1994 when the Senate Appropriations Committee directed the National Oceanic and Atmospheric Administration (NOAA) to formulate a plan for reducing the tsunami risks to coastal residents. The program is designed to reduce the impact of tsunamis through hazard assessment, warning guidance, and mitigation. The first step in producing Tsunami Inundation Maps is essential to assess the tsunami hazard. The Center for Tsunami Inundation Mapping Efforts (TIME) within the Pacific Marine Environmental Laboratory of NOAA (NOAA R/PMEL) (Bobbitt, 1999) was created for the purpose of development, maintenance, and upgrade of maps that identify areas of potential tsunami flooding. The Pacific Marine Environmental Laboratory maintains large databases related to the research and exploration of hydrothermal vent processes and applies GIS to integrating multidisciplinary data sets to create both a map gallery and an Internet site. The states involved in the PMEL Tsunami Program are Hawaii, California, Oregon, Washington, and Alaska, and they seek to mitigate tsunami hazards by focusing development on improved tsunami inundation maps, hazard assessment tools, and advanced technology to increase the speed and accuracy of tsunami forecasts and warnings (Trudeau, 1998).
Landslides Although landslides can destroy human infrastructure and potentially be deadly, except for a few famous incidents, their impact is generally localized and predictable. The USGS has been extremely active in mapping landslide hazards and in developing new methods and models for assessing and analyzing these hazards. In anticipation of the heavy El Niño rains in 1997–98, scientists from the USGS San Francisco Bay Landslide Team (SFBLT) created landslide hazard maps of the Bay region. Following the rains, the San Francisco Bay Area Region Project and their Landslide Hazards Program, both of the USGS, conducted inventories of landslides in the Bay Area, which were then used to develop digital landslide distribution databases, computer landslide models, and landslide hazard maps. The SFBLT created digital maps that depict areas of potential slides (slumps and translational slides), earth flows (flows of clayey earth), and debris flows (rapidly moving slides). The map layers include topography in shaded relief, road networks, hydrography, mapped distributions of slides and earth flows, rainfall thresholds for debris flows, and likely debris flow areas. Most of the data is mapped at 1:125,000 scale (for local emergency planning) and 1:275,000 scale (for regional planning). These maps are part of an overall strategy to help planners mitigate and respond to disasters (Pikei, 1997). Additionally, the California Department of Conservation (1999) DOC/DMG has been active in mapping landslide hazards in the State. They produce six types of maps that depict landslide hazards. Among them are Landslide Hazard Identification Maps, 1:24,000-scale maps showing landslide features, landslide susceptibility, and debris flow susceptibility. They were produced from 1986 to 1995 under the now-repealed Landslide Hazard Mapping Act. Watershed Maps are 1:24,000-scale maps that include landslide features to assist in timber harvest planning and water quality protection. They were
Challenges for GIS in Emergency Preparedness and Response
J-8476
ESRI White Paper 7
produced in concert with the California Department of Forestry. Four categories of active and dormant landslides are depicted including debris flows, debris slides, translation slides, earth flows, and torrent tracks. These maps cover parts of Mendocino, Humboldt, and Del Norte counties.
Fires In the landscape, fire is frequently a naturally occurring phenomenon and in the long run is often considered more beneficial than hazardous. However, Philadelphia's most famous citizen, Benjamin Franklin, understood the hazards of fire when it intrudes upon human habitat and wrote on the need to regulate urban growth in order to decrease fire and environmental hazards. Although wildfire is often considered a natural hazard, the extent of the hazard can be mitigated with sound land use practices and management. Today, the practice of fire suppression in both rural and urban environments mostly does not follow sound vegetation management plans and has created potential catastrophic conditions for fires. A fire hazard exists to a greater or lesser extent across the North American continent, but nowhere in the United States is the hazard greater than in California. The Mediterranean climate, the rugged topography, a shifting urban–wildland interface, and the recent practice of fire suppression all collaborate to create catastrophic conditions. In the hills east of the San Francisco Bay alone, 5,298 structures have been lost in dozens of fires since 1920, with the majority of them occurring in the last decade (Radke, 1995). Geographic information science plays a critical role in mapping and documenting fire, then subsequently predicting its course, analyzing alternative fire-fighting strategies, and directing tactics and strategies in the field. The California Department of Forestry (CDF) began an intensive program of mapping fire in response to legislation in the early 1980s. This legislation required CDF to map different classifications of fire hazards with State Responsibility Areas (SRAs), or areas of State fire prevention responsibility (i.e., outside of large, incorporated cities). As a result of the catastrophic Oakland Hills fire, the Bates Bill (AB 337) was passed in the California legislature in 1992. This bill required the CDF to work with local fire authorities to map fire hazard severity zones within Local Responsibility Areas (LRAs), generally referring to areas subject to wildfire hazard that are within incorporated city boundaries. These maps are intended for purposes of enforcing roofing and vegetative clearance requirements, in addition to serving as the basis for disclosure statements in real estate transactions under AB 1195. For both types of maps, fire hazard is determined on the basis of fuel loading, fire weather, and slope, among other criteria. Vectorized fire hazard zones were overlaid on USGS topographic maps at 1:24,000, 1:62,500, and 1:100,000 scales (Irby, 1997). Nationwide, the U.S. Forest Service has implemented the Wildland Fire Assessment System (WFAS), based out of the Forest Service's Rocky Mountain Research Station. Unlike CDF's mapping efforts, this is not designed for long-term hazard assessment as much as for short-term fire danger warning. This system constantly generates maps of fire weather and fire danger components of the National Fire Danger Rating System (NFDRS) based on daily observations from 1,500 weather stations throughout the United States. Because each station is merely a sampling point, values between stations are estimated with an inverse distance squared technique using 10-km grids. The Fire Danger Rating Maps that result are based on current and antecedent weather, fuel types, and the state of live and dead fuel moisture. Fuel models to be used generally are decided

Challenges for GIS in Emergency Preparedness and Response
J-8476
May 2000 8
upon by local managers. Weather forecasts are based on data from the National Weather Service. Live fuel moisture is generated from greenness maps, derived on a weekly basis from Normalized Difference Vegetative Index (NDVI) data from satellite imagery. Dead fuel moisture is available on digital maps showing ten-hour, 100-hour, and 1,000-hour fuels. Additionally, drought maps and lower atmosphere stability index maps are used. At the local or neighborhood scale, mapping and modeling topography and fuel load based on vegetation and structures is gaining in popularity due to advances in geographic information technology. The 1991 Oakland Hills fire resulted in a local study integrating fire models and data inputs within a GIS to map potential firestorm risk (Radke, 1995). Although much of this input data was encoded by hand, many more GIS-encoded databases have since become available with Web delivery. This simple advance has not only led to more modeling, it has also stimulated the development and use of new fire models embedded within GIS. FARSITE, a stand-alone fire growth simulation model, is a good example of such a model. It runs within several GIS software programs (ArcInfo™, ArcView® GIS, or GRASS) and is used to simulate wildland fire growth and behavior under complex conditions of terrain, fuels, and weather.
Floods Flood zones can be mapped and floods can be predicted with some degree of accuracy. The widest-scale and most systematic mapping of flood hazards comes from the Federal Emergency Management Agency (FEMA). FEMA produces flood insurance rate maps (FIRMs) for the purposes of determining whether properties lie within the floodway of a river system or the 100-year floodplain. These maps form the basis of FEMA's policy under the 1969 National Flood Insurance Act (and later amendments). These policies call for restriction of development in the floodway and require purchase of flood insurance and/or flood proofing for structures within the 100-year flood zone. FEMA has worked in recent years to make these maps digitally available. As part of a Map Modernization Program, Digital Q3 Flood data was developed by scanning FIRM hard copies and vectorizing flood zones as a thematic overlay including the 100- and 500-year floodplains (i.e., 1 percent and .2 percent annual probability of flooding). Q3 data does not contain all information from the FIRM and is not as accurate. Rather, Q3 data is intended to support regional-scale uses such as planning activities, insurance marketing, and mortgage portfolio reviews. For more precise parcel-based queries or for engineering analysis, the more detailed digital FIRMs (DFIRMs) or paper FIRMs are more appropriate. DFIRMs include all of the information required to create a hard-copy FIRM in digital form. This includes basemap information, graphics, text, shading, and all other geographic data necessary to meet the standards and specifications set for FIRMs. This data provides the basis for the digital line graph (DLG) of flood risks, known as DFIRM-DLG. Another very different application of flood mapping technology was used to help emergency managers in North Carolina to evacuate flood-prone areas prior to Hurricane Fran in 1996. Before this hurricane, the North Carolina Center for Geographic Information and Analysis had used the Sea, Lake, and Overland Surges from Hurricane (SLOSH) model to prepare several Hurricane Storm Surge Inundation Area Maps for coastal areas of the State, showing the historic extent of hurricane storm surge inundation. The model was used to produce maps showing flood extent under conditions
Challenges for GIS in Emergency Preparedness and Response
J-8476
ESRI White Paper 9
of slow- and fast-velocity hurricanes. These flood extents were then overlaid on 1;24,000-scale USGS topographic maps. Based on the SLOSH model, Hurricane Evacuation Restudy Maps were prepared that were used to guide the evacuation of residents from low-lying and coastal areas. These maps were also used by other agencies, such as the Division of Forest Resources, that performed overlays of these maps with forest cover layers to predict the amount of forest damage (Dymon, 1999). The Office of Emergency Services (OES) of California has produced digital flood maps depicting areas at risk from dam failure. These maps are intended to be used by local and State officials in devising emergency procedures under the Emergency Services Act (Section 8589.5 of CA Government Code) and in making natural hazards disclosure statements under the California Natural Hazard Disclosure Act (AB 1195). The inundation maps produced by OES represent the best estimate of where water would flow if a dam failed suddenly and completely under full capacity conditions, recognizing that later downstream land use changes may affect the extent and intensity of inundation. These digital maps were produced by scanning paper blue-line copies of the original maps and are organized by county and are available from the OES Web site as PDF files.
Tornadoes Tornadoes are one of nature's most violent storms. In an average year, 800 tornadoes are reported across the United States, resulting in eighty deaths and over 1,500 injuries, which is the most severe of any country in the world (Edgetech, 1999). These violently rotating columns of air extend from a thunderstorm to the ground and are capable of tremendous destruction with wind speeds of 250 miles per hour or more. Damage paths can be in excess of one mile wide and fifty miles long. Tornado strength is measured on the F-scale, ranging from F0 through F5 for the most powerful storms. Although GIS is employed to map and summarize the events of tornadoes, in a growing number of communities it is used in real time on the front line. On the evening of May 3, 1999, the National Weather Service (NWS) issued a tornado warning for southeastern Sedgwick County, Kansas (DeYoe, 1999). Though not officially part of the emergency response personnel, the Sedgwick County GIS Department (SCGIS) produced more than 300 maps for the Emergency Operations Center (EOC) to get initial locations of damage reports and identify the actual properties. SCGIS provided the EOC with a probable path and damage map and estimated values based on the damage reports received up to that time.
Hurricanes Hurricanes can destroy human infrastructure and habitat, killing and impacting large populations across vast territory. We only have to refer to a few—Agnes (1972), Hugo (1989), Andrew (1992), and Floyd (1999)—to illustrate the damage and loss to society. After the devastation of Hurricane Andrew, FEMA upgraded its pre- and postdisaster planning and response capabilities. The GIS-based system, called the Consequences Assessment Tool Set (CATS), developed by Science Applications International Corporation (SAIC), enables FEMA to predict the effect of impending disasters, such as hurricanes, and quickly mobilize a well-coordinated and directed response (Corbley, 1999 and Kehlet, 1998). This allows FEMA to pinpoint critical evacuation areas as well
Challenges for GIS in Emergency Preparedness and Response
J-8476
May 2000 10
as make accurate damage predictions for phenomena such as storm surge and wind damage that facilitates a quick recovery (Trudeau, 1998). As disaster strikes, CATS, using combined government, business, and demographic databases, produces reports and graphics that provide emergency managers and the national media with timely information. Known damage is reported along with mapped estimates of the extent of damage and affected population. Suitable mobilization sites are identified along with nearby airstrips, empty warehouse space, and information about federal and local sources for disaster relief. When Hurricane Eduardo (1996) was threatening to endanger the U.S. coastline, FEMA identified areas of potential water contamination and quickly moved freshwater supplies to those sites ahead of the storm. In the aftermath of Hurricane Mitch, the USGS's Center for Integration of Natural Disaster Information (CINDI) created a digital atlas containing more than sixty different types of geospatial information. These new maps showed the locations of landslides and floods; damage to roads, bridges, and other infrastructure; precipitation information; and impacts on agricultural lands. The information used to create these maps came from remote sensors as well as existing ancillary databases such as geologic maps, aerial photos, and dozens of other digital and paper sources. The maps, which are available at the CINDI Web site (http://cindi.usgs.gov/), serve as a critical resource for allocating resources in short-term relief efforts, for understanding the disaster's long-term impact on ecosystems, and for planning the region's economic recovery and reconstruction.
Human-Induced Disasters That
Impact Humans and Environs
Unlike many natural hazards, most human-induced hazards could be prevented, reducing or even eliminating loss of life and damage to property. With a better understanding of the underlying forces that induce disasters, we can work toward mitigation and possibly elimination of some of them.
Health-Related Epidemics
Epidemiologists use maps to log locations, encode associations, and study the spread of disease (Clarke et al., 1999). Add to the map the ability to undertake spatial analysis through advances in geographic information tools, and the result is a technology that is well suited to track disease. Studies that quantify lead hazards (Tempalski, 1994), model exposure to electromagnetic fields (Wartenberg, 1992), and monitor air- and water-borne diseases all benefit from the development of technologies in geographic information science. GIS was used to identify and locate environmental risk factors associated with Lyme disease in Baltimore County, Maryland (Glass et al., 1995). Watershed, land use, soil type, geology, and forest distribution data was collected at the residences of Lyme disease patients and combined with data collected at randomly selected addresses to fuel a model detecting the most probable locations where Lyme disease might occur. With GIS it is much easier to combine epidemiology data and ecological data to model and predict disease spread and transmission. This data integration is essential if we hope to mitigate epidemics through better health policy planning. At a national level, GIS has been used to help design a surveillance system for the monitoring and control of malaria in Israel (Wood et al., 1994). The GIS-based

Challenges for GIS in Emergency Preparedness and Response
J-8476
ESRI White Paper 11
surveillance system located breeding sites of Anopheles mosquitoes, imported malaria cases, and population centers in an effort to better respond in the cases of outbreaks. On a global scale, the National Aeronautics and Space Administration (NASA) established the Global Monitoring and Disease Prediction Program at Ames Research Center to identify environmental factors that affect the patterns of disease risk and transmission (Ahearn and De Rooy, 1996). The program developed predictive models of vector population dynamics and disease transmission risk using remotely sensed data and GIS technologies and applied them to malaria surveillance and control (Beck et al., 1994).
Social Unrest—War Although one could argue that war is a good candidate for a health-related epidemic via germ warfare, the use of geographic information technologies by the military has been more proactive than simply monitoring and surveillance. The National Imagery and Mapping Agency (NIMA) (NIMA, 1999b), a major combat support agency of the Department of Defense and a member of the intelligence community, was established in 1996 to provide accurate imagery, imagery intelligence, and geospatial information in support of the nation. For example, during the 1995 Bosnia peace accord, the Defense Mapping Agency (now NIMA) employed technology called Powerscene, developed by Cambridge Research Associates, to recalculate the territorial balance between rival factions as the borders were modified and adjusted based on landscape and political conditions. This interactive process was undertaken at Wright–Patterson Air Force Base in Dayton, Ohio, where orthorectified imagery and digital terrain elevation data was integrated to produce a Terrain Visualization Manuevering Support system (NIMA, 1999a). This system enabled NATO commanders and peace negotiators to tour the 650-mile cease-fire border and any disputed territory without endangering lives on the ground. GIS is also used as a tracking tool for troops in training and combat, and as a planning and negotiation tool for peacemakers. A prototype terrain visualization system was installed at the National Military Command Center in the Pentagon in 1994 to help support national command-level missions such as locating downed aircraft (Scott O'Grady's F-16) and troop withdrawals (from Somalia) (NIMA, 1999b). To serve such technology better, NASA's Shuttle Radar Topography Mission (SRTM) collected vital, high-resolution elevation data during February 2000. The mission, a partnership between NASA and NIMA, will use the SRTM data to generate digital elevation models and three-dimensional pictures of the earth's surface. Besides scientists using the data to study flooding, erosion, landslide hazards, earthquakes, ecological zones, weather forecasts, and climate change, the military will use it to plan and rehearse missions, improve weapon accuracy, and for modeling and simulation purposes. Geographic information technology is also being used for environmental monitoring and cleanup at several Navy installations as part of the Navy's comprehensive, long-term environmental action (CLEAN) program and at the Rocky Flats Nuclear Weapons Complex (Bromley, 1995).

Challenges for GIS in Emergency Preparedness and Response
J-8476
May 2000 12
Toxic Spills, Explosions, and Fires
(Accidental or Otherwise)
Man-made crises are extreme events that can be accidental, such as toxic spills, or premeditated such as bombings by terrorists. No matter what their origin, many of these human-induced disasters could be lessened or even prevented by integrating geographic information technologies. For example, in a case of toxic release, population data, residential locations, wind speed, and direction could populate a model to map the extent of the disaster and suggest evacuation strategies. All crises require an immediate and well-coordinated response where data handling and system interoperability are critical. Besides the political and technical challenges of fusing data from mixed sources, proprietary data formats often impede interoperability. Commonalities, such as coordinate systems and the representation of locations, boundaries, and aerial features, must transcend a broad community of users and tool vendors. Metadata is crucial for identifying and managing the quality of data, while access protocols and retrieval parameters will determine the speed of extracting data from a digital archive or library. During a crisis, such as the Oklahoma City bombing, data access speed is paramount for rescue workers, and advances in robust indexing mechanisms, such as geographic footprints (Goodchild, 1996), will prove invaluable. Although many successful initiatives are already underway at both the local and national levels, they could greatly benefit from advances in geographic information science. The City of Winston–Salem, North Carolina, built an Integrated Network Fire Operations (I.N.F.O.) system that is designed to reduce the time it takes for firefighters to respond to emergency (911) calls and to provide information about the address of an incident to aid firefighters in making better informed decisions and plan the fire fighting effort while en route (Chakraborty and Armstrong, 1996). I.N.F.O. automatically uses the address of an incident to search for any prefire and HazMat planning information that might be available (e.g., building floor plans, hazardous waste information, occupants). FEMA developed HAZUS, a natural hazard loss estimation methodology software program that is useful for earthquake-related mitigation, emergency preparedness, response and recovery planning, and disaster response operations and that is implemented within PC-based GIS software.
Research Challenges The research of hazards illustrates how geographic information is being integrated into solutions and the important role the Web now plays in communication and disseminating information to the public for mitigation, management, and recovery from a disaster. Although much of the information on the Web might be represented as a document, the results are often displayed in map and graphic form, which is clearly the result of applying geographic information technologies to the problem. In some instances, it is clear that geographic information technology has advanced the information from simple data display to output from an advanced modeling effort.
Spatial Data Acquisition and
Integration
Data acquisition and integration may be the single-largest contribution area needed for emergency preparedness and response. Although models can be developed for handling disasters, making them operational on a day-to-day basis means huge investments in data acquisition and integration.
Challenges for GIS in Emergency Preparedness and Response
J-8476
ESRI White Paper 13
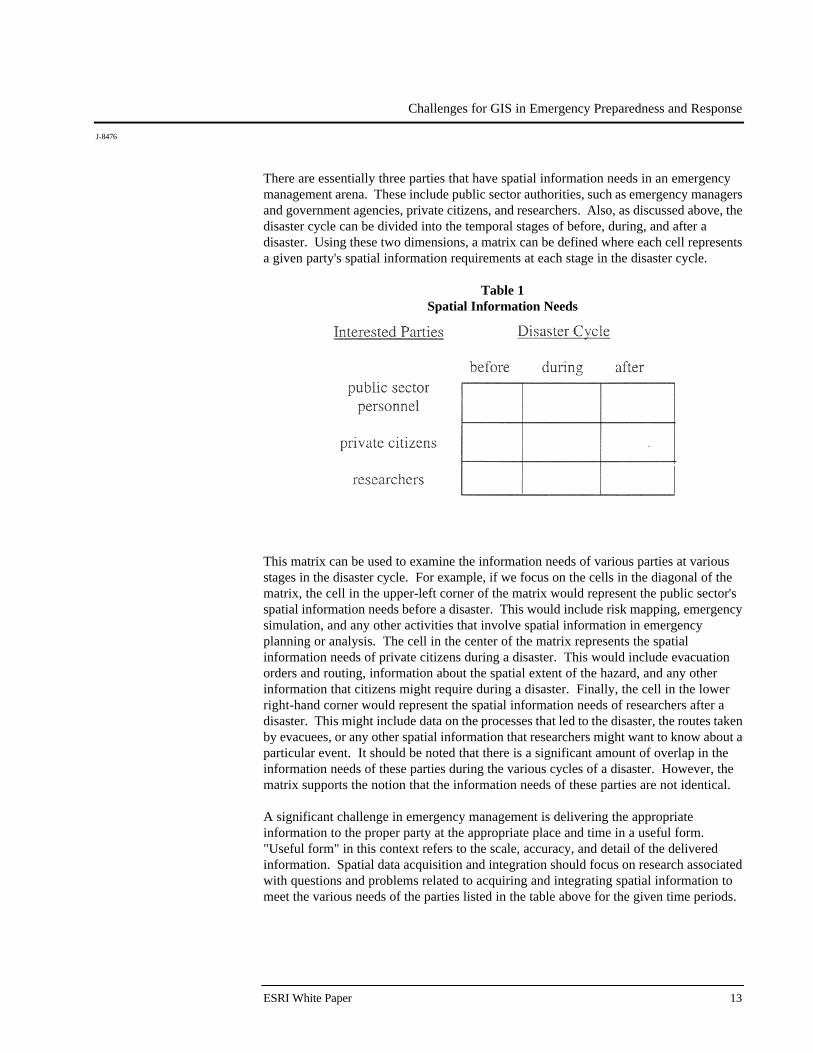
There are essentially three parties that have spatial information needs in an emergency management arena. These include public sector authorities, such as emergency managers and government agencies, private citizens, and researchers. Also, as discussed above, the disaster cycle can be divided into the temporal stages of before, during, and after a disaster. Using these two dimensions, a matrix can be defined where each cell represents a given party's spatial information requirements at each stage in the disaster cycle.
Table 1 Spatial Information Needs
This matrix can be used to examine the information needs of various parties at various stages in the disaster cycle. For example, if we focus on the cells in the diagonal of the matrix, the cell in the upper-left corner of the matrix would represent the public sector's spatial information needs before a disaster. This would include risk mapping, emergency simulation, and any other activities that involve spatial information in emergency planning or analysis. The cell in the center of the matrix represents the spatial information needs of private citizens during a disaster. This would include evacuation orders and routing, information about the spatial extent of the hazard, and any other information that citizens might require during a disaster. Finally, the cell in the lower right-hand corner would represent the spatial information needs of researchers after a disaster. This might include data on the processes that led to the disaster, the routes taken by evacuees, or any other spatial information that researchers might want to know about a particular event. It should be noted that there is a significant amount of overlap in the information needs of these parties during the various cycles of a disaster. However, the matrix supports the notion that the information needs of these parties are not identical. A significant challenge in emergency management is delivering the appropriate information to the proper party at the appropriate place and time in a useful form. "Useful form" in this context refers to the scale, accuracy, and detail of the delivered information. Spatial data acquisition and integration should focus on research associated with questions and problems related to acquiring and integrating spatial information to meet the various needs of the parties listed in the table above for the given time periods.

Challenges for GIS in Emergency Preparedness and Response
J-8476
May 2000 14
As an example, assume that an engine company from county A has been instructed to respond to an emergency call in county B. The problem is to provide the company with the nature of the incident and the needs of the parties in distress, the location of the incident, and, ideally, the best route to the site. This information must be delivered in a timely manner in an appropriate form, where errors in the information may have serious consequences. The fact that the information must also be delivered in a timely manner puts unique demands on any system designed to deliver this information. It implies that there is a time window within which the information must be delivered to have value. The overall research challenge in spatial data acquisition and integration for emergency management can be viewed as one of delivering accurate, appropriate information to all the parties involved in a disaster at the proper stages of the disaster in a timely manner. There are a number of research questions that can be generated from this overarching research challenge. n What information needs to be provided to what parties at what times during an
emergency? n What sources of data are available for meeting these information needs? n What data needs to be collected during an actual emergency? n What problems arise in integrating sources of spatial information with various levels
of accuracy and detail to meet the unique needs of each party at various points in the disaster cycle?
n What amount of uncertainty can various parties tolerate when receiving information
provided to them at various stages in the disaster cycle?
Distributed Computing
Modern computer simulations of complex natural phenomena, such as rapid forest fire growth or development of a volcanic plume, require supercomputer facilities with distributed simultaneous computing on many processors. Linked to geographic information systems, these models for predisaster planning, crisis management, and postdisaster recovery could become extremely valuable mitigation and response tools. Although this level of analysis is not possible today, during a crisis such a system could be highly interactive, allowing real-time communication between parties and aiding in the execution of models that could be viewed remotely. This would allow scientists and civil protection agencies to apply results immediately to the current extremely dangerous conditions. Here the data must be output in various levels of format complexity, allowing images and animation of various scenarios to be viewed by scientists, decision makers, and the general public (with the approval of the appropriate public safety and government officials). It is important that any new data systems be developed on a platform that is widely compatible with those of existing data users. It is also important that these systems be designed to run on thin clients, as in an emergency it is likely portable, wireless computers will be the communication tool in the field.

Challenges for GIS in Emergency Preparedness and Response
J-8476
ESRI White Paper 15
Extensions to Geographic
Representations
A key area to pursue is the dynamic representation of physical and human processes in emergency preparedness and response. Geographic information systems have not traditionally been designed to represent dynamic phenomena, but this is critical in assessing and responding to emergencies. Very little research has been conducted in this area, despite the obvious consequences of making critical decisions with inaccurate or incomplete information. There is a need to improve the representation of risk and human vulnerability. The computational representation of human vulnerability has lagged behind the theoretical advancements in this area. As such, GIS is not representing the depth and richness of the theoretical frameworks, and empirical research on human vulnerability to environmental hazards remains incomplete. Risk and human vulnerability are much more dynamic than the representations that are now being used in GIS. There is a need to be able to rapidly model and summarize alternative scenarios, especially when the future is uncertain (e.g., tornado, hurricane, fire). Before proceeding to extending representations, we must make sure that the representations we have are up to date. There are many cases where the data that emergency managers are relying on is simply out of date. As an example, during the recent tornado season in Oklahoma, the 1997 TIGER files did not have many of the schools included in the database. We need to progress to hazard, risk, and vulnerability classification systems that include multiple hazards. An example of this approach is the Community Vulnerability Assessment Tool for New Hanover County in North Carolina, developed by the NOAA Coastal Services Center. However, most research in this area has focused on single-hazard scenarios (i.e., classifying based on just one hazard). Finally, there is a need to develop representations of past disasters and events, both static and dynamic, including what factors led to a particular disaster, where the event occurred, what development has taken place since the last disaster, and how many hazardous events have occurred at a particular location.
Cognition of Geographic Information
The scientific domain of the cognition of geographic information includes humans, computers, and the earth. Research in this area centers on questions related to human conceptualizations of geographic spaces, computer representations of geographic space, and human perceptions of computer representations of geographic space. During a crisis, the emergency worker has the added pressure of time to deal with, and the representation and depiction of complex spatiotemporal information can easily be overwhelming. Uncertainty increases when decision making is data starved, the process of extracting support information is flawed, or communicating information accurately and effectively is impeded. Mistakes can serve to magnify the crisis or even propagate false hope or false fear, leading to even greater disasters resulting from evacuation. A balance between sufficient information and inducing panic and overreaction is critical. The trend toward digital information foreshadows potential data saturation where emergency workers would be overwhelmed by vast influxes of digital data from a variety of sources such as HazMat, police, transportation, weather, demographics, and social welfare. Automated or robotic processes will be necessary to cull and mine this data into a manageable and worthwhile emergency assist tool. Algorithms will replace humans at the firing line, where geographic information is synthesized for modeling and decision
Challenges for GIS in Emergency Preparedness and Response
J-8476
May 2000 16
making purposes. Getting this right is critical in healing rather than exacerbating disasters. Emergency preparedness is heavily influenced by social decision making processes, which depend in part on how information is understood by and communicated between participants in groups. Improvement in representations, operations, and modeling of spatial data is needed and is very real.
Interoperability of Geographic Information
The technical problem of interoperability arises from the need to share data, algorithms, and models (DAMs). What DAMs need to be shared in emergency management arenas? Institutions must know about DAMs that exist elsewhere before the need to share data arises. International attempts are in progress in the area of sharing geographic information for emergency management purposes. The Global Disaster Information Network (GDIN) is a prominent example. GDIN is an interagency program undertaken at the initiative of Vice President Gore to assist fire and emergency management personnel. GDIN has two proposed components: (1) a national disaster information network and (2) a global system. GDIN will operate on the Internet and possibly Guardnet (National Guard Network) during disasters to broadcast and integrate disaster management information from all sources and provide it rapidly and readily. GDIN will also promote training and communication in the areas of emergency preparedness and mitigation. It is expected to produce many benefits that include saving lives and minimizing costs, enhancing coordination and sharing of compatible capabilities, facilitating the leveraging of existing resources, and assisting in validating and verifying information. To date, completed projects include the State of Florida Hurricane Simulation Exercise and the State of Alaska Information Process Flow Report. In addition, a regional, theme-based disaster information network is being developed to promote collaborative activities between the United States and Canada. The Red River Basin Disaster Information Network was established in response to the 1997 flood-affected portions of North Dakota, Minnesota, and Manitoba. Experience has shown that a top-down approach to data sharing in disaster management is not entirely effective. The problem of interoperability in emergency preparedness and response must be approached by first assessing users' needs such as What geographic information needs to be shared? What information needs to be acquired? What information exists in other agencies, institutions, and companies? Data sharing and interoperability of geographic information must occur under tremendous time constraints in emergency preparedness and response. There are incompatibilities between physically based forecast models and the data stored in geographic databases. This is the data integration, or coupling, problem in all its forms.
Scale Digital elevation model (DEM) resolution is not adequate for many applications in risk mitigation. Until the February 2000 shuttle radar topography mission (SRTM), we had better DEM data for Mars and Venus than for earth, and it may be many years before seafloor and subice surfaces are acquired at similar resolution. Even now, the SRTM data will move more rapidly into the military domain than into civilian use. Present applications use simplified flow models that display results in two dimensions as data files or images. Such small data sets are easy to use on PCs or workstations, and computational nodes for models are widely spaced. For example, standard DEM data sets have thirty meter spacing of nodes, and working files are on the order of megabytes.
Challenges for GIS in Emergency Preparedness and Response
J-8476
ESRI White Paper 17
Although this data makes very large files for ordinary computers, the detail is insufficient for realistic prediction of many natural phenomena for which small differences in topography or other parameters could have a large effect on the spatial pattern of the result. A more suitable grid spacing could be meter scale, and the data sets could be as large as one or two gigabytes. Development of such large data sets on a supercomputer could provide a valuable source that could be distributed for use at various remote GIS sites. Current risk simulation codes work on small areas with large grids and are slow. Future codes should operate on fine grids of data sets that include the entire area of risk surrounding, for example, a volcano. For optimal use the data will be a high-density grid of topographic points (x,y,z data) at a horizontal spacing of ten to thirty meters and at vertical increments of one to ten meters. The areas encompassed by a single network may be as large as 50-km x 50-km grids. Such a large computational grid is too large for a single-processor computer; hence supercomputers are necessary for computation and visualization. Even finer resolution data will be required for cities to model the movement of fire, chemical, or biochemical plumes through complex urban canyons. Currently, such data is being acquired by laser devices and other new technologies.
Spatial Analysis in a GIS Environment
Computer simulations linked to GIS systems could permit analysis of loss of life and disruption of infrastructure that is not possible today with the current set of available tools. Sophisticated visualization systems allow public safety officials, scientists, and the general population to understand the effect of the various phenomena in their areas of interest and to design appropriate mitigation plans. A three-dimensional visualization system could provide an animated illustration of the areas threatened by volcanic phenomena at several scales. Perspective views of the phenomena could be interactively manipulated to include a spectrum of possibilities ranging from individual rivers, streets, and buildings to entire disaster scenes. Overlays of images on topographic grids would create a realistic three-dimensional appearance of the phenomena that will move in real time with data moving in and out of the system dynamically. The GIS interface could allow query and manipulation at various levels and between multiple viewers at different sites. The use of CAVE (Pape et al., 1996) or even holograph technology could create realistic simulations necessary for training and prevention missions as well as for coordinated, distributed simulations for coordination of multiple factors in disaster response. It is important that scientists involved in the GIS analysis can interact in several different ways. Multiple windows on their computer desktops could allow the interaction via the Internet. Such interaction allows them to send explicit equations or mathematical expressions at the time of the crisis. This facility could permit scientists to continuously update parameters and expressions that represent the current scientific state of the lava flow, for example. These changes could then filter through all others areas of the system infrastructure, providing scientists the ability to see the effects immediately. Another window displays a representation of the volcano or area around it, whether it is an actual picture or graphic or some other visual representation. Another window could control some general functionality of the other windows (e.g., automatic refreshing of all information and what files are viewed). At any time a scientist could change this setup.

Challenges for GIS in Emergency Preparedness and Response
J-8476
May 2000 18
If the scientist wants multiple graphic windows and no equation interface, this can be easily done. This type of interface should focus on communicating the nature of the disaster including the magnitude, extent, and uncertainty of the event. A very important element is to ascertain the risk of making a wrong decision.
The Future of Spatial Information
Infrastructure
Emergency managers rely on a system for managing emergencies called an incident control system (ICS). An ICS specifies exactly which party (e.g., police, fire, highway patrol, mayor) is to do what during an emergency and precisely how communication, authority, and many other critical facets of the emergency management process are to take place. It is nationwide at local and state levels. Is there an equivalent institutional protocol, procedure, or approach for agencies to determine exactly who will collect and share geographic information before, during, and after an emergency? A global disaster information network could be central in developing and disseminating model data sharing procedures that address the institutional and technical issues associated with geographic information data sharing in emergency preparedness and response; an "ICS for geographic information," if you will. This might exist in the form of information sources, flows, and ultimately applications. There is also the need to develop foundation data models for sharing geographic information that is multidimensional, multiscale, and multisource in nature.
Uncertainty in Geographic Data and GIS-Based Analyses
As methods and models of GIS analysis become more sophisticated, the quality of data increases in importance. Many data sets undergo temporal adjustments, which add uncertainty to the analysis. For example, using one- or two-day-old data in volcano forecasting at the time of the crisis would lead to a faulty conclusion. The same is true of other disasters where geopolitical or natural conditions change from moment to moment. We must be able to analyze and incorporate such temporal uncertainty in the analysis and forecast that we make. We must be able to quantify the uncertainty in the data (and the analysis) and express this in a satisfactory mode. A major problem exists in how we report uncertainty in GIS. For example, what significance do we place on the lines on various maps and diagrams? How do we address this issue? A case in point would be designing a hazard map for flooding on an alluvial fan where there is no defined channel and the flood has different probabilities of spreading in various directions. Another major problem is the propagation of uncertainty through the data set as we combine several sets of data of different levels of confidence and even potentially different types. Research on this topic should help to resolve this problem.
GIS and Society GIS is the new thing in society, and new things often arrive with added baggage. Questions arise about rates of adoption and participation across society. Is there equity of access? Is there equity of the distribution of the costs and benefits? Access to GIS can simultaneously marginalize and empower different groups in society. The adoption of geographic technologies to emergency preparedness and response can fall prey to this equity of access issue where some groups are kept safe at the expense of those that cannot afford the technology. Risk assessment and subsequent mitigation actions can impact a community and have a wide range of consequences. Incomplete data can lead to unwarranted fears, restrictive

Challenges for GIS in Emergency Preparedness and Response
J-8476
ESRI White Paper 19
and costly regulation, and even serve to affect property values. These can all lead to increases in disaster insurance, bias in the allocation of emergency resources, and the attachment of stigma to a neighborhood. There is a strong need for public participation both in developing the GIS for emergency preparedness and for gaining access to it during a disaster. This participation and ownership has implications for empowerment within community and grassroots groups who are often relied upon during emergency response. Defining potential barriers between GIS technology and different segments of society will aid in delivering critical information during a crisis. Often, information usually considered private becomes invaluable in managing a disaster but its use also raises legal and ethical questions about intrusion into private lives. What role, responsibilities, ethics, and motivations in disseminating geographic information for warning, preparedness, and response does the media play? How are new technologies, such as pagers, handheld devices, and other electronic innovations, affecting equity, vulnerability, and the perception of risk? How are issues like socioeconomics, insurance, race, and other issues related to the application of geographic information in emergency preparedness and response? Much research addressing GIS and society is needed.
Linkages to Education Priorities
The search of hazards to determine application challenges for emergency preparedness and response illustrated the important role the Web now plays in communication and disseminating information to the public. It appears that an informed population is more prone to accept and even embrace mitigation, respond and participate in the management of a hazard or emergency, and be better equipped to assist and appreciate recovery from a disaster. Much of the information on the Web is commonly represented as a document, yet images, maps, and graphics illustrating the results of some analysis are slowly finding their way onto emergency preparedness and response-related Web sites. The most important educational needs or components that surface when one looks at individual hazards, either natural or human induced, focus on issues of certification of specialists to undertake response and settlement, public education and awareness of response during a disaster, the development of a model curriculum to develop geographic information science experts for emergency preparedness and response, and the development of simulators to train rescue workers and settlement specialists. It is clear that only a few people that work within this area will require in-depth education in geographic information science, while most others will benefit by training on installed GIS-related technology. However, training needs to be presented within the context of the profession with appropriate amounts of spatial literacy and integrated with other technologies common to the profession. To best illustrate emergency preparedness and response needs, some discussion is undertaken here.

Challenges for GIS in Emergency Preparedness and Response
J-8476
May 2000 20
Emerging Technologies for
Delivering Geographic
Information Science Education
Technology is playing a central role in education at the college and university levels. In some instances, it serves to lower the cost of education, while in others it enhances and even makes possible some opportunities never before imagined. Distance learning taught by domain experts, Web-based programs, and simulators to create better and cheaper technology, are all served by these emerging technologies. Emerging technologies make it possible to educate more people and are even more effective for training. It is now relatively common to find Web-based training courses in which one can enroll and conveniently become well versed in GIS. However, unlike the rigors of the college classroom, quality, accreditation, and assurance are not clearly defined and regulated. Assessing liability and assuring accountability in a disaster may call for the regulation of emerging technologies as they are applied to education.
Supporting Infrastructure
As training and modeling in GIS become more the status quo for personnel in emergency preparedness and response, demands on technology classrooms and Internet portals will rapidly increase. Who will bear the cost of such infrastructure in the short run, and will this persist and set a trend? Emergency preparedness and response support is recognized during a disaster when many groups step forward to lend a helping hand, but what is being done over the long haul to help mitigate and be prepared if a disaster strikes?
Access and Equity The geographic information science community must ensure access to the technologies and data to disadvantaged groups and impaired individuals so that they may also be effective in emergency preparedness and response in their communities. The first goal of this education priority is to ensure access and determine what is the necessary "spatial literacy" to effectively use GIS. However, in an emergency, access and equity issues quickly shift from "How effective is the trained emergency worker?" to questions such as, "Under what circumstances should rescue workers have access to private information?" and "Under what circumstances may a community breach ownership rights in order to acquire and access data?" In the heat of a disaster, is it impossible to even address some of these issues let alone come up with solutions.
Alternative Designs for Curriculum
Content and Evaluation
Although the basic geographic information science concepts might be the same, as you cross domains specific concepts vary. Likewise, in emergency preparedness and response, the level of geographic information knowledge necessary for emergency workers to carry out their jobs varies. At one end of the spectrum a worker may need to be able to read a map, while at the other end a sophisticated understanding of spatial statistics might be in order. Delivering education under such extreme needs calls for a scalable curriculum to increase the likelihood that GIS will be deployed properly and effectively in the emergency preparedness and response area. Adopting these technologies and employing them in the field to save lives and property do not come easy. The emergency worker must not only have faith in the technology, but must also have confidence in the data. Building this confidence starts with a sound education where the student participates in data collection so that ownership and a stake in the data buys into its use in emergency preparedness and response.
Challenges for GIS in Emergency Preparedness and Response
J-8476
ESRI White Paper 21
Professional GIS Education Programs
The majority of emergency preparedness and response workers need training on how to use the technology to extract information about infrastructure, follow guidelines in assessing risk, navigate and follow procedures during a crisis, and assess damage after a disaster. It is likely the majority of workers in this area will not have been widely exposed to geospatial technologies, and professional training will play a key role in filling this gap.
Research-Based Graduate GIS
Education
To advance the state of any science, researchers must be educated so that they may lead on the frontiers of research and then train and collaborate with those emerging researchers to push those frontiers forward.
Learning with GIS Learning with GIS in emergency preparedness and response employs a curriculum that emphasizes emergency preparedness and response-specific topics and uses geographic information to study them. Since most disasters can be mapped, a GIS can provide a very effective navigation tool for dissecting problems and learning the steps necessary to deliver an effective response. Proactive approaches to disasters lead to practice sessions where geographic information-fueled simulators play out a variety of disaster scenarios. These simulators will play a critical role in educating the emergency preparedness and response community and its response strategies during an emergency.
Accreditation and Certification
Although accreditation and certification may carry with it problems associated with licensing, for emergency preparedness and response workers liability is a serious issue and accreditation and certification are most often embraced. Just as emergency response workers must be certified on their search-and-rescue techniques and technologies, certification on how to properly use geographic information data is a necessary component if quality control and assurance is to be taken seriously.
Policy Implications Both natural and human-generated hazards usually transcend political boundaries that are effective for defining regions used to effectively mitigate against disaster, manage rescue and response operations, or to organize and deliver relief. Since policy is most often generated and administered within politically defined boundaries, we must develop new policies that emulate hazards rather than human administrative structures. Policy and regulation are commonly applied on the landscape as a function of form. For example, brush must be cleared to create a specific size protective buffer zone around homes in an urban–wildland intermix region. Although the specific buffer zone, represented here as a form, can easily be complied to and administered, it is naive and unrealistic to assume the impact of this buffer zone will be uniform over space. Advances in geographic information science will bring about a shift where policy and regulation can become a function of the underlying process rather than relying on an easily administered but limited form-based policy. The greater our confidence in data and models, the more likely policy will be process- rather than form-based. There are three primary policy arenas. n Science policy

Challenges for GIS in Emergency Preparedness and Response
J-8476
May 2000 22
n Information policy (ownership, privacy, access, liability) n Public policy Within these arenas, several questions arise with respect to emergency preparedness and response. n If you have confidence in data and models, can policy then be process based rather
than regulation based?
n Should there be different disaster access policies depending on pre-, during, or postdisaster? Is there a general policy to cover all possibilities? Can one design a policy that is generalized across disasters?
n What information policies result in the most effective use of geographic information in emergency response situations? (For example, comparative studies are necessary where one examines the experiences of city A with city B). Is there a need to distinguish between pre-, during, and post-situations? Is there a need to compare unpredictable versus more predictable events (those that are time dependent)?
Conclusion Research and education in emergency preparedness and response is crucial as we search
for conditions thought to be hazardous to life and habitat, undertake mitigation efforts, respond during emergencies to reduce loss of life and property, and settle and restore a damaged environment. In some instances, we found that early warning systems need to be built, while in other instances we need to change more fundamental elements such as land use and lifestyle. In almost all instances, large databases that contain information on humans, their activities, and their habitat are necessary. We need to ensure that this data is accessible to assess risk, prepare to engage disaster, and aid in effective response and settlement. Although the tools must be engineered to effectively assist emergency workers, we must also ensure privacy of the individual so exploitation cannot occur. The question is whether advances in research and education priorities might contribute to needs within the application of emergency preparedness and response. By identifying and recommending priorities for research, education, and policy contributions to emergency management, a focus for geographic information science for this application challenge can be identified. The interaction between humans and their environment under conditions thought to be hazardous to life and habitat can be facilitated through advances in geographic information science. Through emergency preparedness and response we will be able to realize shifts where policy can be more directly linked to underlying processes rather than simply the form that appears during and as a result of a disaster.
References Ahearn, S.C., and C. De Rooy. 1996. A Temporal Analysis of Tillage Area in Kwara, Nigeria, Using Remote Sensing. International Journal of Remote Sensing. 17(5), 917–929.
Challenges for GIS in Emergency Preparedness and Response
J-8476
ESRI White Paper 23
Applied Environmental Geographic Information Science, Eastbay Hills Vegetation Survey and Fire Hazard Assessment GIS Project. http://www5.ced.berkeley.edu:8005/aegis/home/nfprojects/eastbay/. Association of Bay Area Governments. www.abag.ca.gov. Barnes, S. and A. Peck. 1994. Mapping the Future of Health Care: GIS Applications in Health Care Analysis. Geo Info Systems. 4(4), 31–33. Beck, L.R., M.H. Rodrigues, S.W. Dister, A.D. Rodrigues, E. Rejmankova, A. Ulloa, et al. 1994. Remote Sensing as a Landscape Epidemiologic Tool to Identify Villages at High Risk for Malaria Transmission. The American Journal of Tropical Medicine and Hygiene. (51), 271–80. Beer, T. 1990. The Australian National Bushfire Model Project. Mathematical Computer Modeling. 13(12), 49–56. Bobbitt, A. 1999. VENTS Data and Interactive Maps. http://newport.pmel.noaa.gov/gis/data.html. Braddock M., G. Lapidus, E.R. Cromley, G. Burke, and L. Branco. 1994. Using a Geographic Information System to Understand Child Pedestrian Injury. American Journal of Public Health. 84, 1158–61. Brainard, J., A. Lovett, and J. Parfitt. 1996. Assessing Hazardous Waste Transport Risks Using a GIS. International Journal of Geographical Information Systems. 10(7), 831–849. Brantley, S. R. Volcanoes of the United States. http://pubs.usgs.gov/gip/volcus/titlepage.html. Bromley, M. 1995. A Sampling of PRC's GIS Contracts for the Defense Community. www.esri.com/library/userconf/proc95/to300/p283.html. California Environmental Resources Evaluation Systems (CERESa) Natural Hazard Disclosure Statement. http://ceres.ca.gov/planning/nhd/ (maps used in enforcing AB 1195). California Environmental Resources Evaluation Systems (CERESb) Natural Hazard Disclosure Statement Wildland Fire Areas. http://ceres.ca.gov/planning/nhd/wild_fire.html. California Environmental Resources Evaluation Systems (CERESc) Natural Hazard Disclosure Statement, Wildland Fire Areas (State Responsibility Areas). http://ceres.ca.gov/planning/nhd/fire_sev.html. California Governor's Office of Emergency Services. Important Notice Regarding Posted Maps. www.oes.ca.gov/dim.nsf/web+pages/home.
Challenges for GIS in Emergency Preparedness and Response
J-8476
May 2000 24
Catchpole, E.A., W.R. Catchpole, and R.C. Rothermel. 1993. Fire Behavior Experiments in Mixed Fuel Complexes. International Journal of Wildland Fire. 3(1), 45–57. Center for Tsunami Inundation Mapping Efforts. 1999. http://newport.pmel.noaa.gov/time/home.html. Chakraborty, J., and M.P. Armstrong. 1996. Using Geographic Plume Analysis to Assess City of Winston–Salem Integrated Network Fire Operations Project. www.ci.winston-salem.nc.us/fire/infoproj. Chou, Y.H. 1992. Management of Wildfires with a Geographical Information System. International Journal of Geographical Information Systems. 6(2), 123–140. Clarke, K.C., S.L. McLafferty, and J.T. Barbara. 1996. On Epidemiology and Geographic Information Systems: A Review and Discussion of Future Directions. Emerging Infectious Diseases. 2(2), 85–92. www.cdc.gov/ncidod/EID/vol2no2/clarke.htm. Community Vulnerability Assessment Tool. http://www.csc.noaa.gov/newsletter/back_issues/novdec99/cvat.html. Community Vulnerability Assessment Tool, New Hanover County, North Carolina. http://www.modernag.com/Common/currentissues/Dec99/nancy.htm. Community Vulnerability to Hazardous Accidents. Computers, Environment, and Urban Systems. 19(5–6), 341–356. Corbley, K.P. 1999. Fleeing from Floyd: Internet GIS in the Eye of the Storm. Geo Info Systems. 9(10), 28–35. Coverage Description. ftp://ftp.ca.gov/pub/gis/nhdf/wildland.txt. Department of Conservation. 1999. Landslide Maps Available from the California Department of Conservation's Division of Mines and Geology. www.consrv.ca.gov/dmg/geohaz/ls_maps.htm. Department of Conservation, Seismic Hazards Evaluation and Zoning Program. www.consrv.ca.gov/dmg/shezp. DeYoe, C.D. 1999. ArcView GIS Worked Extensively During Storm Emergency Response, GIS on the Front Lines. ArcNews Online. www.esri.com/news/arcnews/fall99articles/28-gisonfront.html. Dymon, U. 1999. Effectiveness of Geographic Information Systems (GIS) Applications in Flood Management During and After Hurricane Fran. Quick Response Report #114. University of Colorado at Boulder, Natural Hazards Center. www.colorado.edu/UCB/Research/IBS/hazards/qr/qr114.html.

Challenges for GIS in Emergency Preparedness and Response
J-8476
ESRI White Paper 25
Edgetech America, Inc. 1999. Tornado Hits (1950–1996). www.edgetech-us.com/Map/MapTornado.htm. Federal Emergency Management Agency, Map Service Center. www.fema.gov/msc. Federal Emergency Management Agency. Natural Hazard Loss Estimation Methodology (HAZUS). www.fema.gov/hazus/index.htm. Fire Area Simulator (FARSITE). http://farsite.org. Frankel, A. 1996. National Seismic-Hazard Maps: Documentation. USGS Open-File Report. 96–532. Glass G.E., B.S. Schwartz, J.M. III Morgan, D.T. Johnson, P.M. Noy, and E. Israel. 1995. Environmental Risk Factors for Lyme Disease Identified with Geographic Information Systems. American Journal of Public Health. 85(7), 944–948. The Global Disaster Information Network. www.state.gov/www/issues/relief/gdin.html. Goodchild, M.F. 1996. Directions in GIS. Proceedings, Third International Conference/Workshop on Integrating GIS and Environmental Modeling, Santa Fe, New Mexico (Santa Barbara, CA: National Center for Geographic Information and Analysis), January 21–26, 1996. www.ncgia.ucsb.edu/conf/SANTA_FE_CD-ROM/sf_papers/ goodchild_michael/good.html. Hinton, C. 1997. North Carolina City Saves Time, Lives, and Money with Award-Winning GIS. Weathering Natural Hazards with Information Technology. 7(9), 35–37. Irby, B. 1997. "Hazard zoning." California's I Zone: Urban–Wildland Fire Prevention and Mitigation. Slaughter, R. (Ed.). California Department of Forestry, State of California. 46–55. Kehlet, R. 1998. FEMA Speeds Up Disaster Relief with GIS. ArcNews. Spring 1998. www.esri.com/news/arcnews/spring98articles/22-fema_speedsup.html. Kessel, S.R. 1990. Australian geographical information and modeling system for natural area management. International Journal of Geographical Information Systems. 4(3), 333–362. Marquez, L.O., and S. Maheepala. 1996. An Object-Oriented Approach to the Integrated Planning of Urban Development and Utility Services. Computers, Environment, and Urban Systems. 20(4–5), 303–312. McRae, R.H.D. 1990. Use of Digital Terrain Data for Calculating Fire Rates of Spread with the Preplan Computer System. Mathematical Computer Modeling. 13(12), 37–48. Mount St. Helens National Monument. http://volcano.und.nodak.edu/vwdocs/msh/msh.html.

Challenges for GIS in Emergency Preparedness and Response
J-8476
May 2000 26
National Hurricane Center. www.nhc.noaa.gov/. National Imagery and Mapping Agency. 1999a. Terrain Visualization Fact Sheet. http://164.214.2.59:80/general/factsheets/pwrscn.html. National Imagery and Mapping Agency. 1999b. The Shuttle Radar Topography Mission. www.nima.mil. National Oceanic and Atmospheric Administration. www.outlook.noaa.gov/tornadoes/. NOAA Coastal Services Center. www.csc.noaa.gov/. Pape, D., C. Cruz–Neira, and M. Czernuszenko. 1996. CAVE User's Guide. www.evl.uic.edu/pape/CAVE/prog/CAVEGuide.html#description. Pikei, R. 1997. Index to Detailed Maps of Landslide in the San Francisco Bay Region. USGS Open-File Report. 97-745-D. Popocatepetl Volcano, Central Mexico. www.geo.mtu.edu/volcanoes/popocatepetl/. Preparedness, Training, and Exercises Committee Meeting, National Emergency Management Association Conference. 1999. www.fema.gov/pte/gosspch79.htm. Radke, J. 1995. Modeling Urban/Wildland Interface Fire Hazards Within a Geographic Information System. Geographic Information Sciences. 1(1), 1–14. Richards, F.O., Jr. 1993. Use of Geographic Information Systems in Control Programs for Onchocerciasis in Guatemala. Bulletin of the Pan American Health Organization. 27(1), 52–55. San Francisco Bay Landslide Mapping Team. 1997. Introduction to the San Francisco Bay Region, California, Landslide Folio. USGS Open File Report. 97–745-A. Sheridan, M.F. Dr. Sheridan's Home Page. www.eng.buffalo.edu/~mfs/. Shu-Quiang, W., and D.J. Unwin. 1992. Modelling Landslide Distribution on Loess Soils in China: an Investigation. International Journal of Geographical Information Systems. 6(5), 391–405. Sitar, N., and K. Bijan. 1999. Landsliding in Native Ground: A GIS Application to Seismic Slope Stability. The Geological Society of America Cordilleran Section, University of California Berkeley, California. June 2–4, 1999. 31(6). www2.ced.berkeley.edu:8002/. Tempalski B.J. 1994. The Case of Guinea Worm: GIS as a Tool for the Analysis of Disease Control Policy. Geo Info Systems. 4(4), 32–8.
Challenges for GIS in Emergency Preparedness and Response
J-8476
ESRI White Paper 27
Trudeau, M. 1998. Weathering Natural Hazards with Information Technology. Geo Info Systems. 8(10), 10. Tsunami Research Program. www.pmel.noaa.gov/tsunami. USDA Forest Service, Rocky Mountain Research Station, Fire Sciences Laboratory, Fire Behavior Research Work Unit, Missoula, Montana, Wildland Fire Assessment System. www.fs.fed.us/land/wfas. University Consortium for Geographic Information Science Research Priorities. www.ncgia.ucsb.edu/other/ucgis/CAGIS.html. United States Fire Administration Hazardous Materials Guide for First Responders. www.usfa.fema.gov/hazmat/. U.S. Department of Interior. Fact Sheet: DOI Science Helping Honduras Recover from Hurricane. U.S. Department of Interior News. http://cindi.usgs.gov/events/mitch/DOInews.html. U.S. Geological Survey (USGSa). Earthquake Hazards and Preparedness. http://quake.wr.usgs.gov/hazprep/#Hazards. U.S. Geological Survey (USGSb). Landslide Research by the San Francisco Bay Region Project. http://sfgeo.wr.usgs.gov/sfbay/slides.html. U.S. Geological Survey (USGSc). San Francisco Bay Region Landslides Folio Home Page. http://wrgis.wr.usgs.gov/open-file/of97-745. Wadge, G. 1988. The potential of GIS modeling of gravity flows and slope instabilities. International Journal of Geographical Information Systems. 2(2), 143–152. Wartenberg D. 1992. Screening for Lead Exposure Using a Geographic Information System. Environmental Research. 59(2), 310–317. Wartenberg D., M. Greenberg, and R. Lathrop. 1993. Identification and Characterization of Populations Living near High-voltage Transmission Lines: a Pilot Study. Environmental Health Perspectives. 101, 626–632. Wood B.L., L.R. Beck, S.W. Dister, and M.A. Spanner. 1994. Global Monitoring and Disease Prediction Program. Sistema Terra. 3(1), 42. Yeh, A.G., and M.H. Chow. 1996. An Integrated GIS and Location–Allocation Approach to Public Facilities Planning—An Example of Open Space Planning. Computers, Environment, and Urban Systems. 20(4–5), 339–350. Young, W., and D. Bowyer. 1996. Modeling the Environmental Impact of Changes in Urban Structure. Computers, Environment, and Urban Systems. 20(4–5), 313–326.
Challenges for GIS in Emergency Preparedness and Response
J-8476
May 2000 28
Glossary
Disaster Disasters are characterized by the scope of an emergency. An emergency becomes a disaster when it exceeds the capability of the local resources to manage it. Disasters often result in great damage, loss, or destruction.
Emergency An emergency is a deviation from planned or expected behavior or course of events that endangers or adversely affects people, property, or the environment.
Hazard Hazard refers generally to physical characteristics that may cause an emergency (for example, earthquake faults, active volcanoes, flood zones, and highly flammable brush fields are all hazards).
Risk Risk is the potential or likelihood of an emergency to occur. For example, the risk of damage to a structure from an earthquake is high if it is built upon, or adjacent to, an active earthquake fault. The risk of damage to a structure where no earthquake faults exist is low.

ESRI–Minneapolis651-454-0600ESRI–Olympia
360-754-4727ESRI–Philadelphia610-337-8380
ESRI–California909-793-2853ext. 1-1906
ESRI–Denver303-449-7779
ESRI–San Antonio210-499-1044
ESRI–Charlotte704-541-9810
ESRI–Washington, D.C.703-506-9515
Regional Offices
ESRI380 New York StreetRedlands, California
92373-8100, USATelephone: 909-793-2853
Fax: 909-793-5953
For more information call
ESRI or your local reseller at
(1-800-GIS-XPRT)
Send e-mail inquiries to
Visit ESRI’s Web page at
www.esri.com
Corporate
1-800-447-9778
ESRI–St. Louis636-949-6620
Printed in USAPlace ESRI business partner or distributor address here.
No. GS-35F-5086H
For more than 30 years ESRI has been helping people manage and analyze geographic information. ESRI offers aframework for implementing GIS in any organization with a seamless link from personal GIS on the desktop to enterprisewide
GIS client/server and data management systems. ESRI GIS solutions are flexible and can be customized to meet theneeds of our users. ESRI is a full-service GIS company, ready to help you begin, grow, and build success with GIS.
International Offices
Australia61-89-242-1005
Belgium/Luxembourg32-2-460-7480
Canada416-441-6035
France33-1-46-23-6060
Germany and Switzerland49-8166-677-041-1-360-2460
Hong Kong852-2730-6883
Hungary361-428-8040
India91-11-620-3802
Italy3906-406-96-1
Korea82-2-571-3161
Netherlands31-10-217-0700
Poland48-22-825-9836
Romania40-1-231-13-81
Singapore/Malaysia/Indonesia65-742-8622
Spain34-91-559-4375
Outside the United States,
contact your local ESRI distributor.
For the number of your distributor,
call ESRI at 909-793-2853,
ext. 1-1235,
or visit our Web site at
www.esri.com/international
Sweden46-23-84090
Thailand66-2-678-0707
United Kingdom44-1296-745-500
Venezuela58-2-285-1134
ESRI–Boston978-777-4543