Embed Size (px)
Citation preview
Challenges of the current European
Energy Policy
Challenges of the current European
Energy Policy
Rafael Miranda CEO of Endesa
President of Eurelectric
Athens, 22th of May of 2008
Rafael Miranda CEO of Endesa
President of Eurelectric
Athens, 22th of May of 2008
2
The global energy scenario will face profound change
The global energy scenario will face profound change
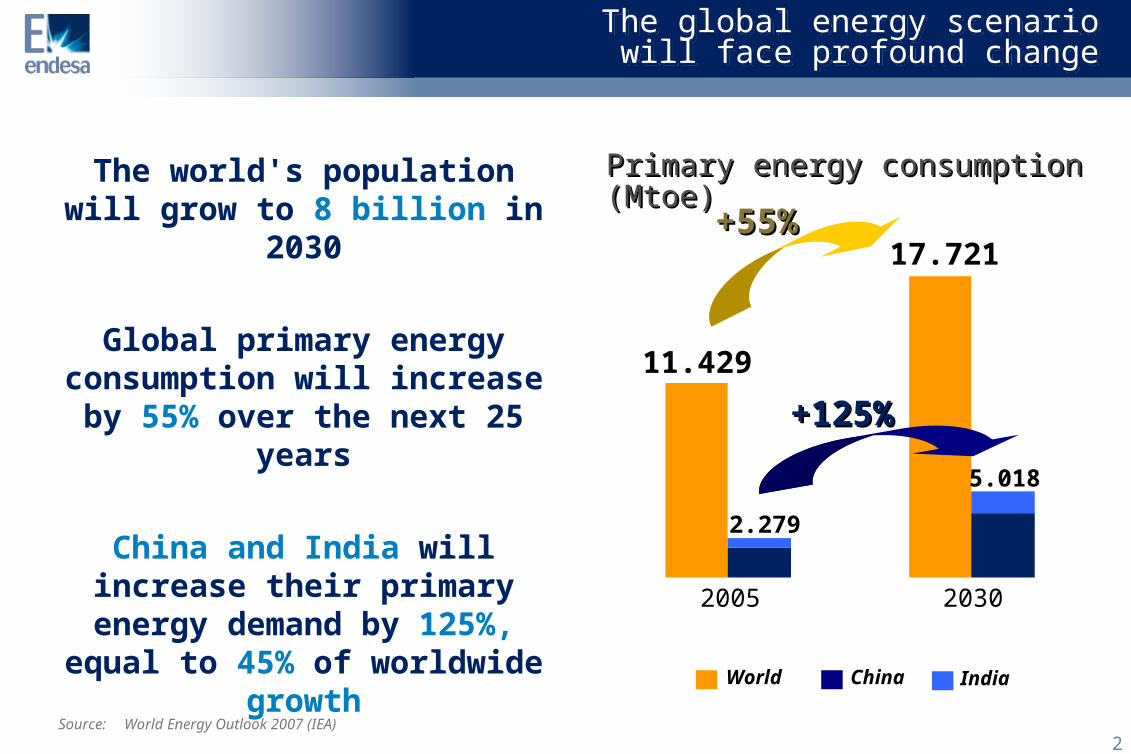
The world's population will grow to 8 billion in 2030
Global primary energy consumption will increase by 55% over the next 25
years
China and India will increase their primary
energy demand by 125%, equal to 45% of worldwide
growth
Source: World Energy Outlook 2007 (IEA)
World China
Primary energy consumption Primary energy consumption (Mtoe)(Mtoe)
India
2005 2030
+55%+55%
11.429
17.721
2.279
5.018
+125%+125%
3
The energy industry will need a huge investment effort in the future
The energy industry will need a huge investment effort in the future
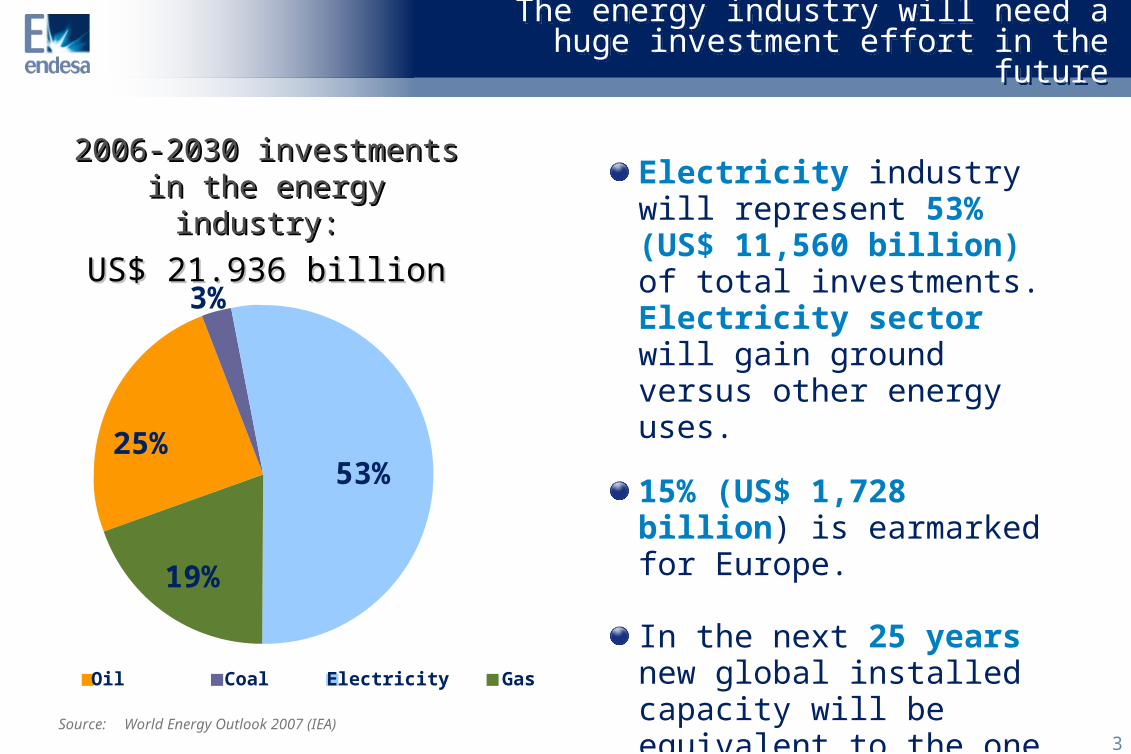
Electricity industry will represent 53% (US$ 11,560 billion) of total investments. Electricity sector will gain ground versus other energy uses.
15% (US$ 1,728 billion) is earmarked for Europe.
In the next 25 years new global installed capacity will be equivalent to the one commissioned on the last 125 years.
Source: World Energy Outlook 2007 (IEA)
53%
19%
3%
25%
Oil Coal Electricity Gas
2006-2030 investments 2006-2030 investments in the energy industry: in the energy industry:
US$ 21.936 billionUS$ 21.936 billion
4
The combat on climate change will be a relevant driver in the energy industry
The combat on climate change will be a relevant driver in the energy industry
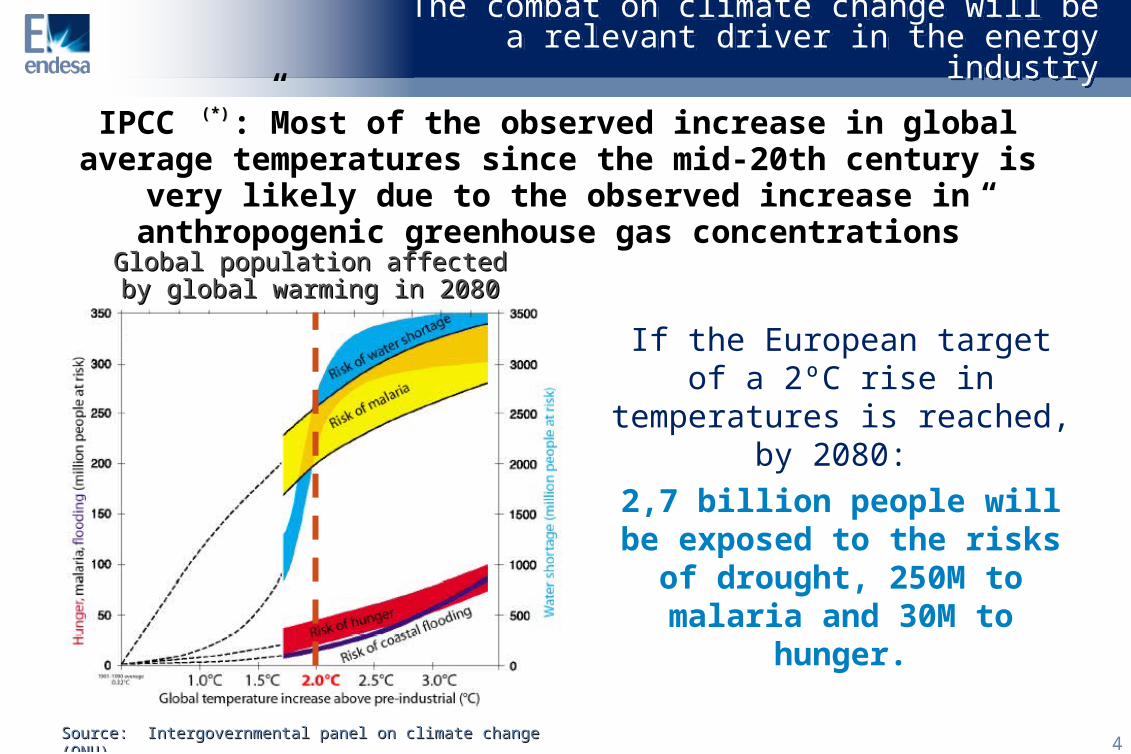
If the European target of a 2ºC rise in temperatures is
reached, by 2080: 2,7 billion people will be exposed to the risks of
drought, 250M to malaria and 30M to hunger.
IPCC :”Most of the observed increase in global average temperatures since the mid-20th century is very likely
due to the observed increase in anthropogenic greenhouse gas concentrations”
Source: Source: Intergovernmental panel on climate change (ONU)Intergovernmental panel on climate change (ONU)
Global population affected by Global population affected by global warming in 2080global warming in 2080
(*)(*)
5
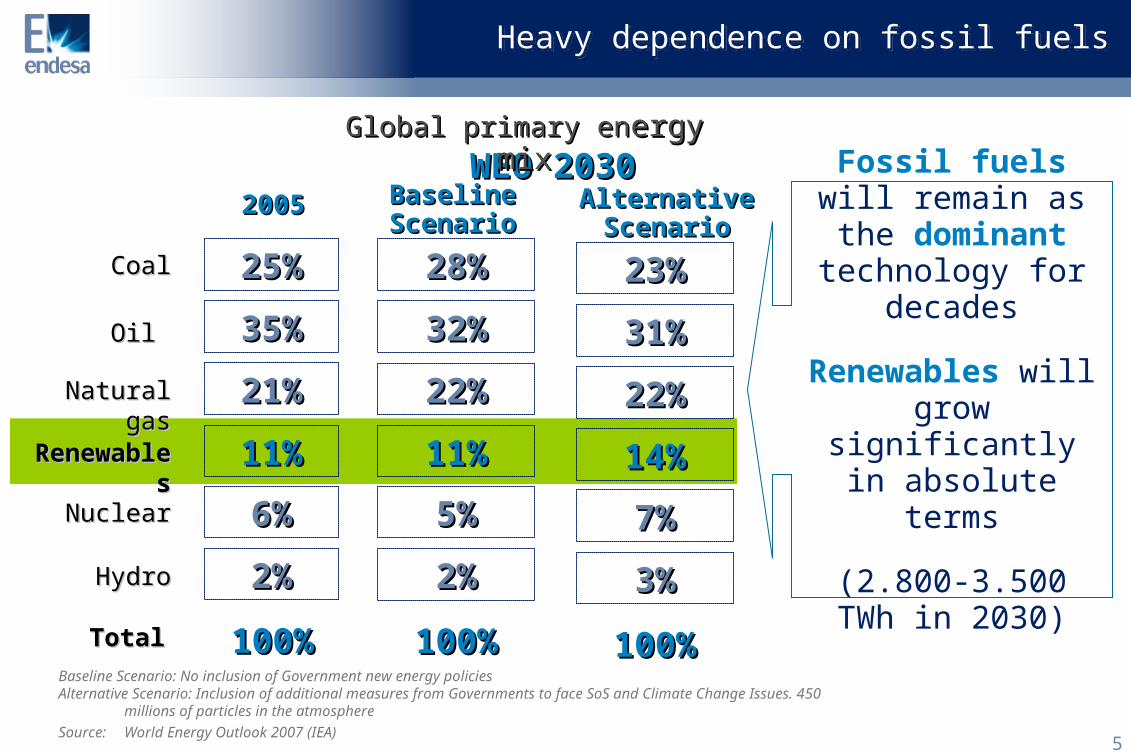
35%35%
25%25%
2%2%
21%21%
6%6%
TotalTotal 100%100%
32%32%
28%28%
2%2%
22%22%
5%5%
100%100%
Heavy dependence on fossil fuelsHeavy dependence on fossil fuels
20052005WEO 2030 WEO 2030
Fossil fuels will remain as the
dominant technology for
decades
Renewables will grow significantly in absolute terms
(2.800-3.500 TWh in 2030)
11%11% 11%11%RenewablRenewableses
Oil Oil
CoalCoal
HydroHydro
Natural gasNatural gas
NuclearNuclear
Global primary enGlobal primary energy ergy mixmix
Source: World Energy Outlook 2007 (IEA)
Baseline Scenario: No inclusion of Government new energy policiesAlternative Scenario: Inclusion of additional measures from Governments to face SoS and Climate Change Issues. 450
millions of particles in the atmosphere
Baseline Baseline ScenarioScenario
31%31%
23%23%
3%3%
22%22%
7%7%
100%100%
14%14%
Alternative Alternative ScenarioScenario
6
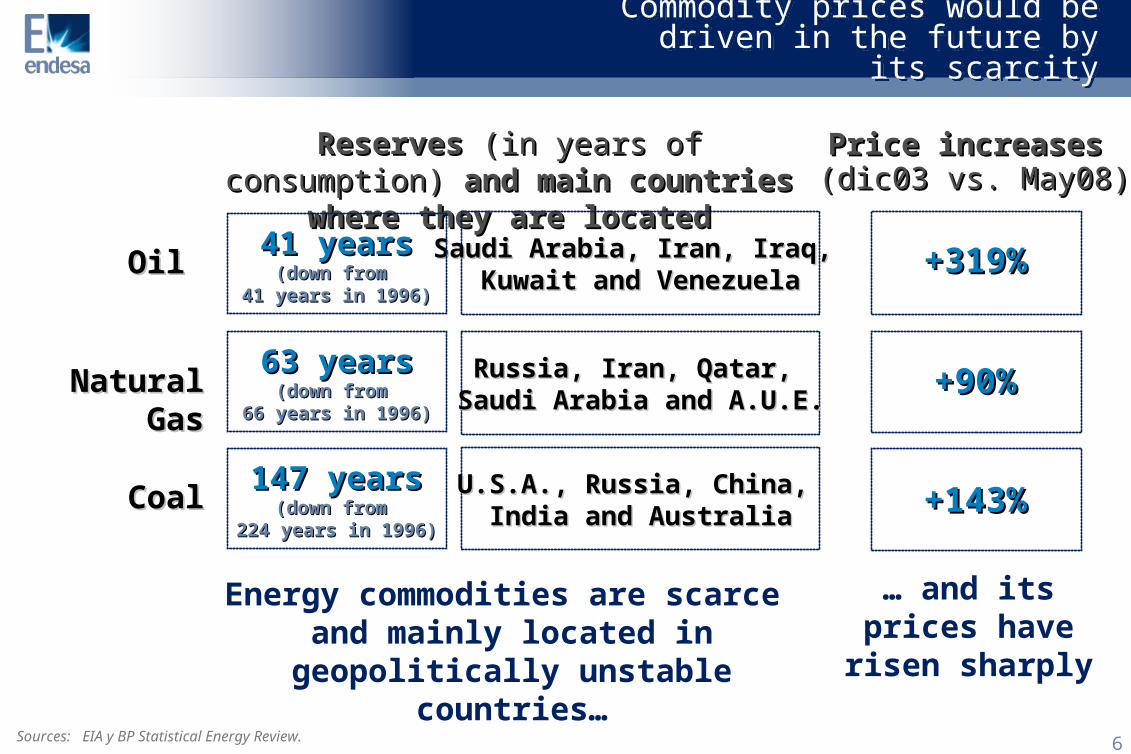
Commodity prices would be driven in the future by its
scarcity
Commodity prices would be driven in the future by its
scarcity
Sources: EIA y BP Statistical Energy Review.
Reserves Reserves (in years of consumption)(in years of consumption) and main countries where they and main countries where they
are locatedare locatedSaudi Arabia, Iran, Iraq, Saudi Arabia, Iran, Iraq, Kuwait and VenezuelaKuwait and Venezuela
Russia, Iran, Qatar, Russia, Iran, Qatar, Saudi Arabia and A.U.E.Saudi Arabia and A.U.E.
U.S.A., Russia, China, U.S.A., Russia, China, India and AustraliaIndia and Australia
… and its prices have
risen sharply
+319%+319%
+143+143%%
+90%+90%
Price increasesPrice increases (dic03 vs. May08)(dic03 vs. May08)
Oil Oil
Natural Natural GasGas
CoalCoal
Energy commodities are scarce and mainly located in
geopolitically unstable countries…
41 years41 years(down from (down from
41 years in 1996)41 years in 1996)
63 years63 years(down from (down from
66 years in 1996)66 years in 1996)
147 years147 years(down from (down from
224 years in 1996)224 years in 1996)
7
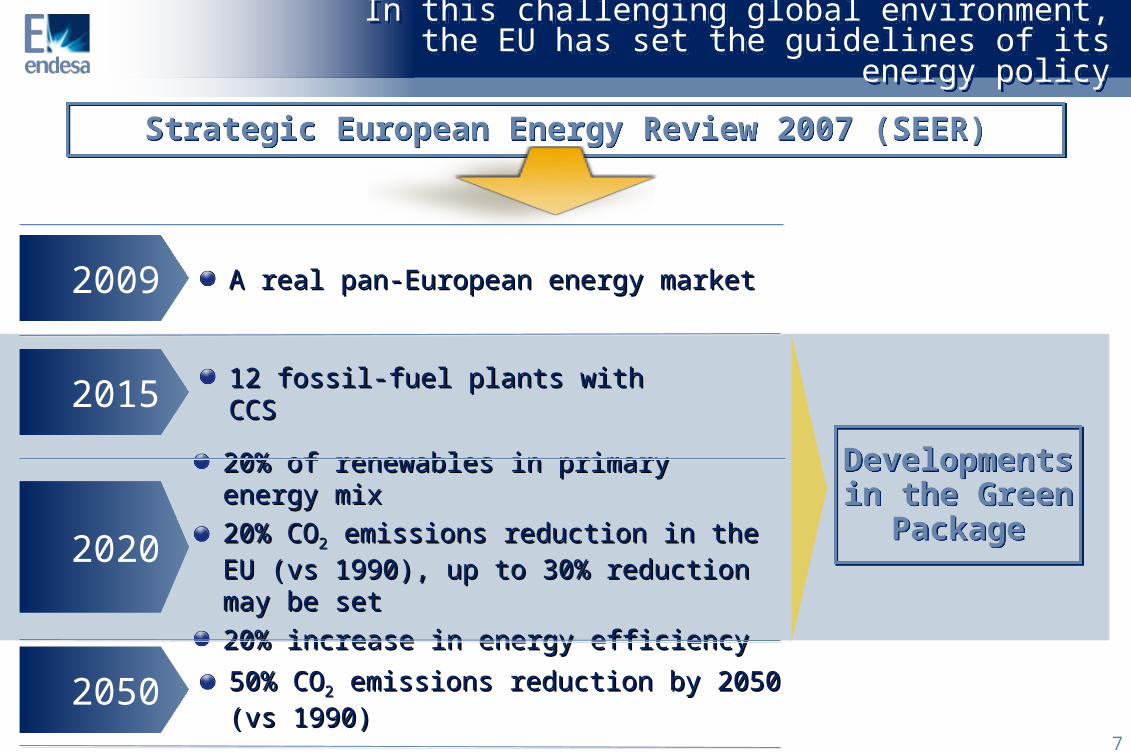
20% of renewables in primary energy 20% of renewables in primary energy mixmix
20% CO20% CO22 emissions reduction in the EU emissions reduction in the EU (vs 1990), up to 30% reduction may be (vs 1990), up to 30% reduction may be setset
20% increase in energy efficiency20% increase in energy efficiency
In this challenging global environment, the EU has set the guidelines of its energy policy
In this challenging global environment, the EU has set the guidelines of its energy policy
12 fossil-fuel plants with CCS12 fossil-fuel plants with CCS
50% CO50% CO22 emissions reduction by 2050 (vs emissions reduction by 2050 (vs 1990)1990)
A real pan-European energy market A real pan-European energy market
Strategic European Energy Review 2007 (SEER)Strategic European Energy Review 2007 (SEER)
2009
2015
2020
2050
Developments in the Green
Package
Developments in the Green
Package
8
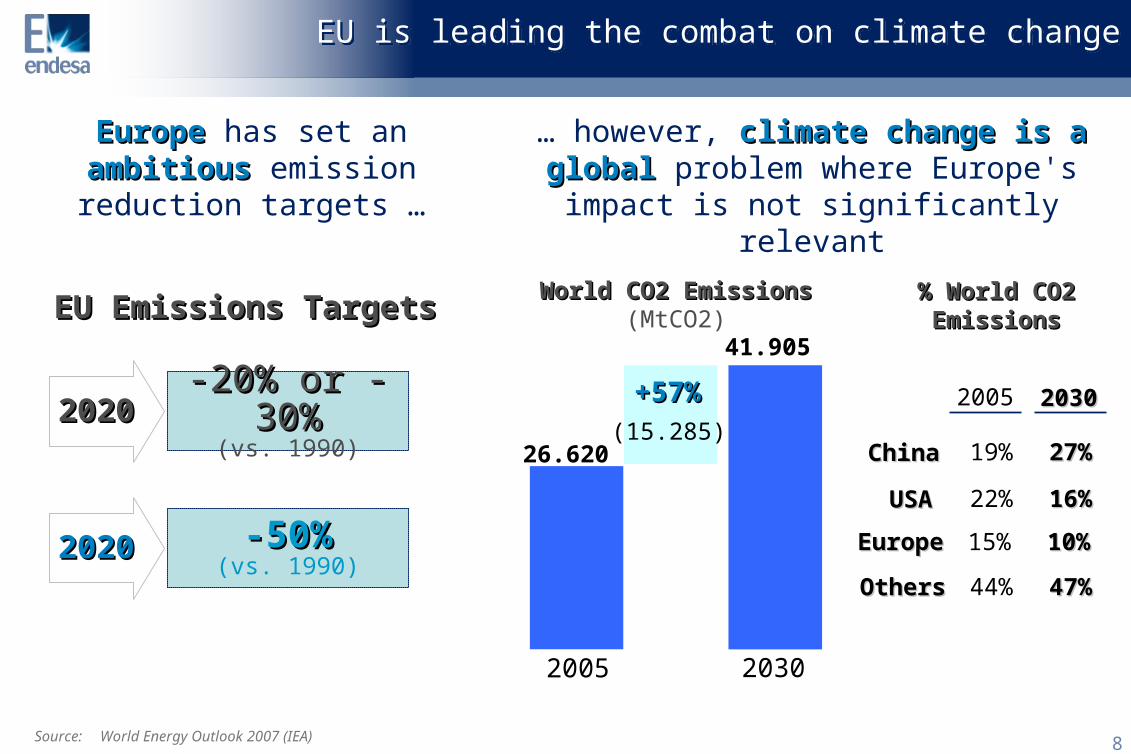
… however, climate change is a climate change is a globalglobal problem where Europe's
impact is not significantly relevant
EU is leading the combat on climate changeEU is leading the combat on climate change
Source: World Energy Outlook 2007 (IEA)
World CO2 Emissions World CO2 Emissions (MtCO2)EU Emissions TargetsEU Emissions Targets % World CO2 % World CO2
EmissionsEmissions
20220200
-20% or --20% or -30%30%
(vs. 1990)
20220200
-50%-50%(vs. 1990)
EuropeEurope has set an ambitiousambitious emission reduction targets …
2005
26.620
2030
41.905
(15.285)
+57%+57%
ChinaChina
OthersOthers
2005 20320300
44% 47%47%
EuropeEurope 15% 10%10%
19% 27%27%
USAUSA 22% 16%16%
9
The EU is clearly committed to achieve its emission target through a further development of
renewables
The EU is clearly committed to achieve its emission target through a further development of
renewables
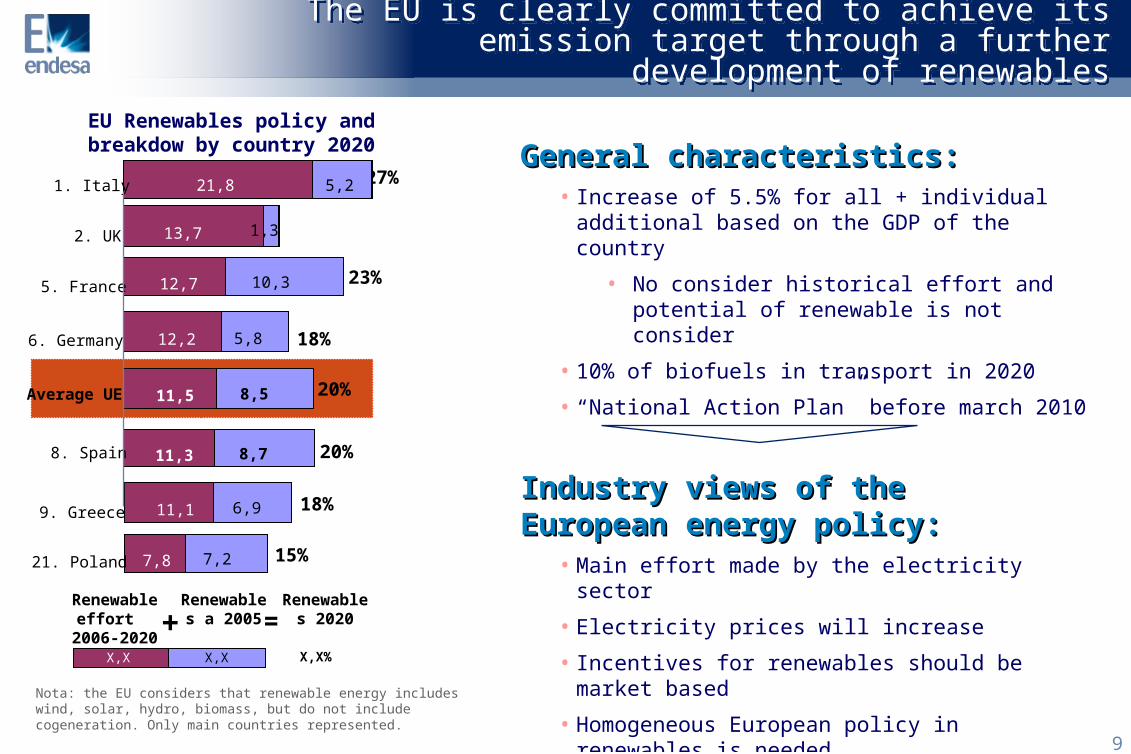
General characteristics:General characteristics:• Increase of 5.5% for all + individual additional
based on the GDP of the country
• No consider historical effort and potential of renewable is not consider
• 10% of biofuels in transport in 2020
• “National Action Plan” before march 2010
EU Renewables policy and breakdow by country 2020
X,X X,X X,X%
Renewables a 2005
Renewable effort
2006-2020
Renewables 2020+ =
Nota: the EU considers that renewable energy includes wind, solar, hydro, biomass, but do not include cogeneration. Only main countries represented.
27%
15%
18%
20%
18%
23%
20%
15%
11,1
11,3
11,5
12,2
12,7
13,7
21,8
6,9
8,7
8,5
5,8
10,3
5,2
1,3
9. Greece
8. Spain
Average UE
6. Germany
5. France
2. UK
1. Italy
7,8 7,221. Poland
Industry views of the Industry views of the European energy policy:European energy policy:
• Main effort made by the electricity sector
• Electricity prices will increase
• Incentives for renewables should be market based
• Homogeneous European policy in renewables is needed.
10
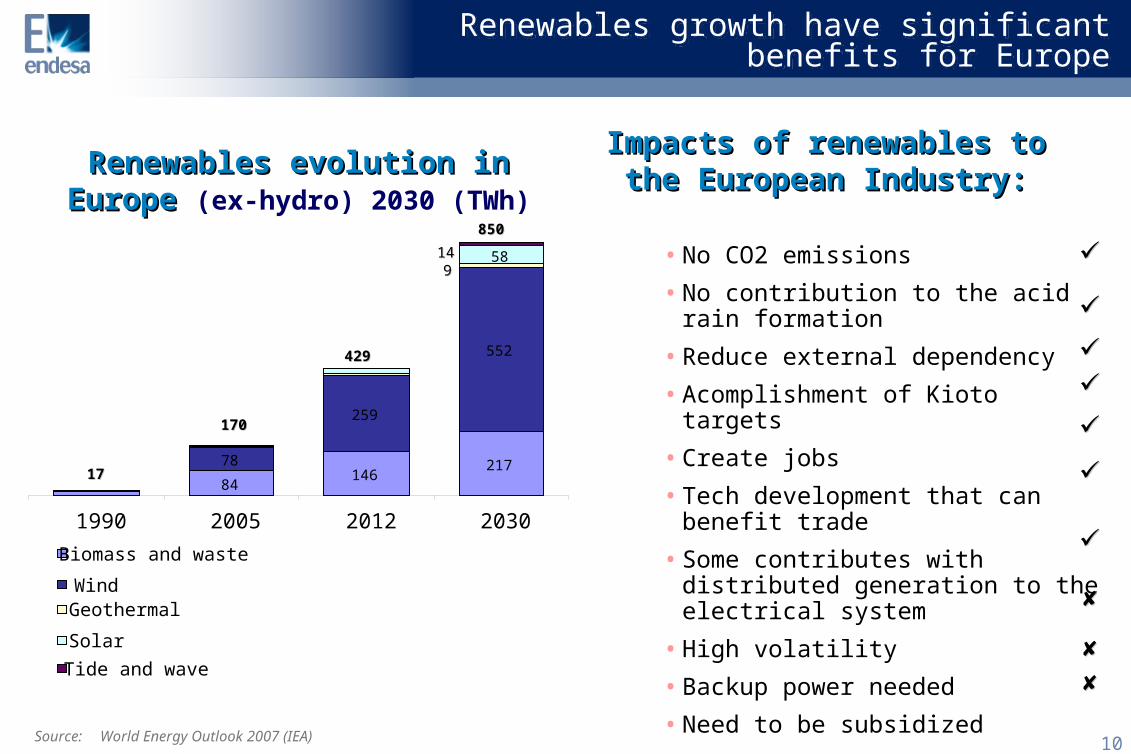
Renewables growth have significant benefits for Europe
Renewables growth have significant benefits for Europe
Renewables evolution in Renewables evolution in Europe Europe (ex-hydro) 2030 (TWh)
Impacts of renewables to Impacts of renewables to the European Industry:the European Industry:
99
1717
170170
429429
850850
1414
14684
217
259
78
552
58
1990 2005 2012 2030
Biomass and waste
WindGeothermal
Solar
Tide and wave
•No CO2 emissions
•No contribution to the acid rain formation
•Reduce external dependency
•Acomplishment of Kioto targets
•Create jobs
•Tech development that can benefit trade
•Some contributes with distributed generation to the electrical system
•High volatility
•Backup power needed
•Need to be subsidizedSource: World Energy Outlook 2007 (IEA)
11
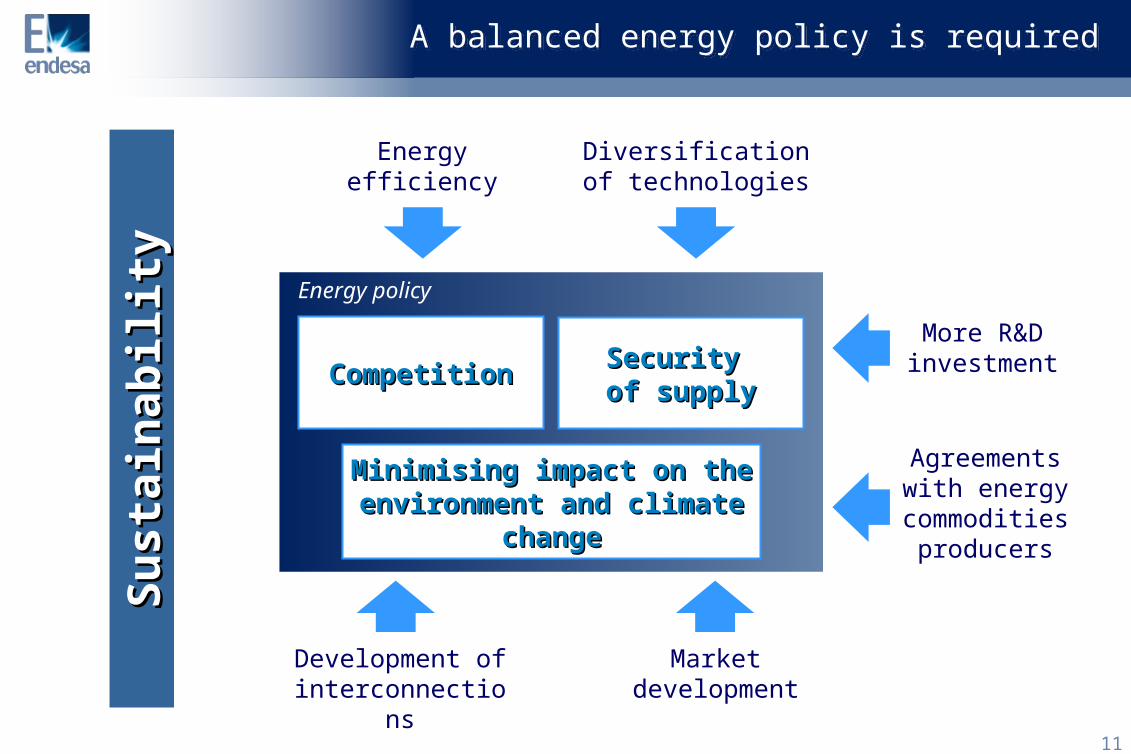
A balanced energy policy is requiredA balanced energy policy is required
Energy efficiency
Diversification of technologies
Agreements with energy commodities
producers
More R&D investment
Development of interconnections
Market development
Su
sta
inab
ilit
yS
usta
inab
ilit
y
Security Security of supplyof supplyCompetitionCompetition
Minimising impact on the Minimising impact on the environment and climate environment and climate
changechange
Energy policy
12
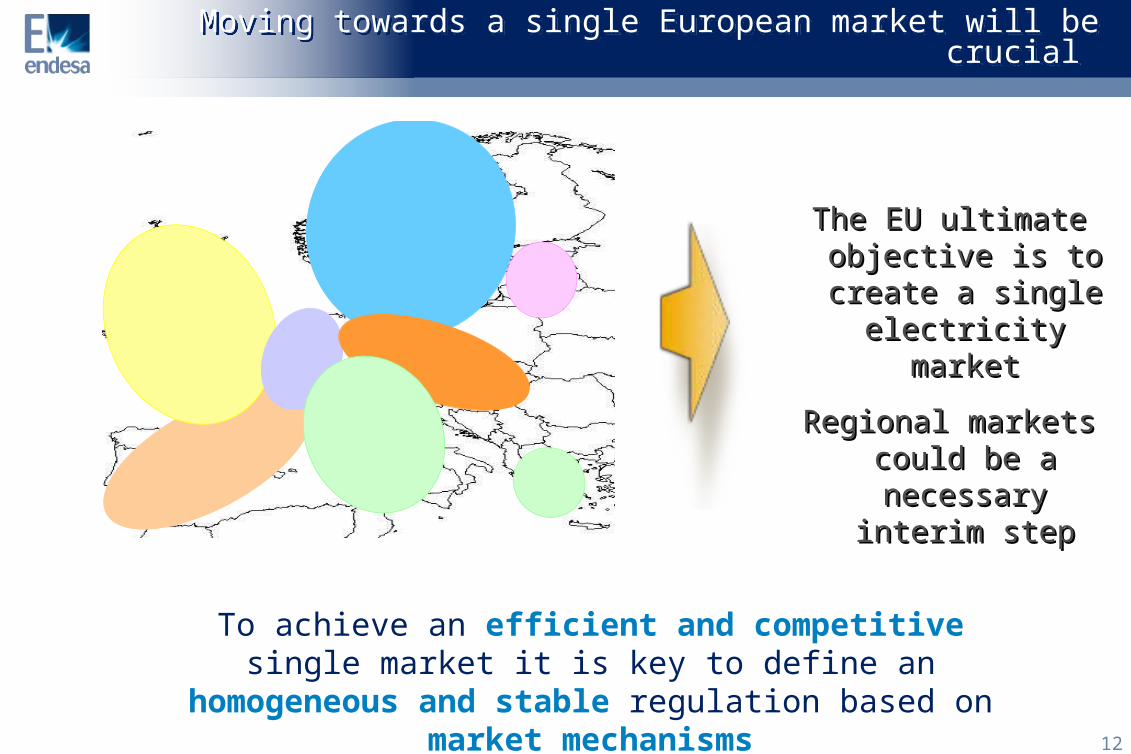
Moving towards a single European market will be crucial Moving towards a single European market will be crucial
The EU ultimate The EU ultimate objective is to objective is to create a single create a single
electricity marketelectricity market
Regional markets Regional markets could be a could be a
necessary interim necessary interim stepstep
To achieve an efficient and competitive single market it is key to define an homogeneous and
stable regulation based on market mechanisms
CENTRAL WESTNORTHERNUK & IRELANDSOUTH WESTCENTRAL SOUTHCENTRAL EASTBALTIC
CENTRAL WESTNORTHERNUK & IRELANDSOUTH WESTCENTRAL SOUTHCENTRAL EASTBALTIC
13
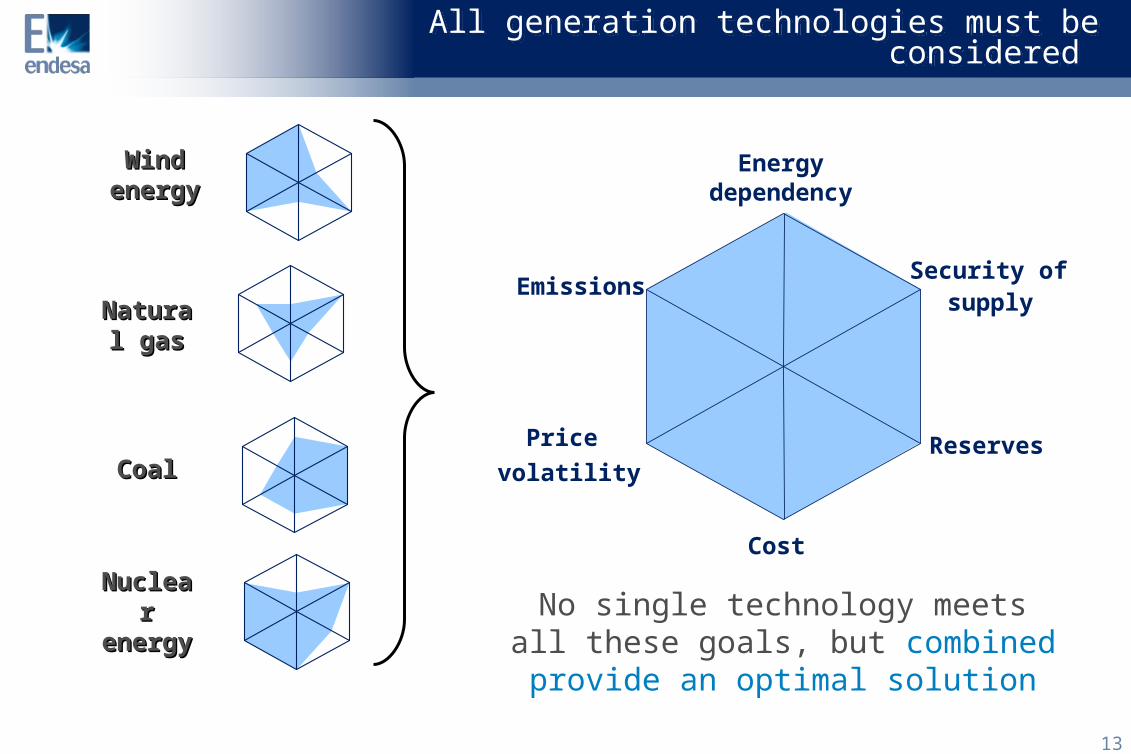
All generation technologies must be considered
All generation technologies must be considered
NaturNatural gasal gas
CoalCoal
NucleNuclear ar
energenergyy
Wind Wind energenerg
yy
No single technology meets all these goals, but combined provide an optimal solution
Energydependency
Security ofsupply
Reserves
Cost
Price
volatility
Emissions
14
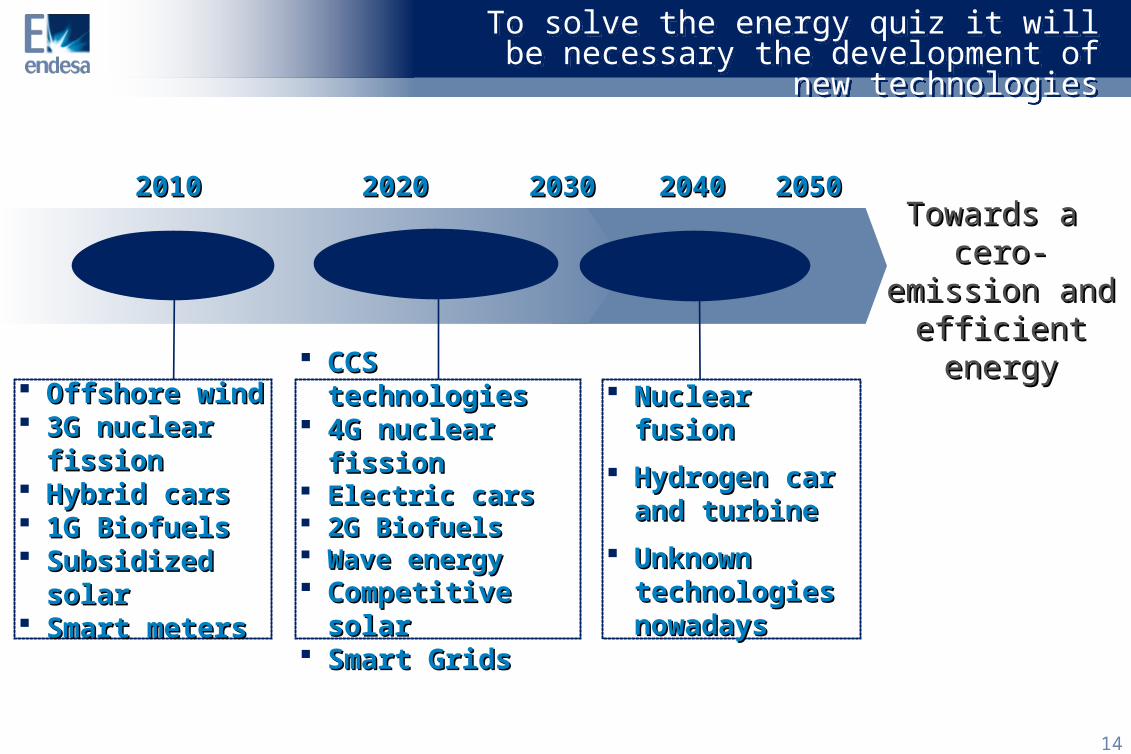
To solve the energy quiz it will be necessary the development of new
technologies
To solve the energy quiz it will be necessary the development of new
technologies
20102010 2050205020202020 20302030 20402040
CCS CCS technologiestechnologies
4G nuclear 4G nuclear fissionfission
Electric carsElectric cars 2G Biofuels2G Biofuels Wave energyWave energy Competitive Competitive
solarsolar Smart GridsSmart Grids
Nuclear Nuclear fusion fusion
Hydrogen car Hydrogen car and turbineand turbine
Unknown Unknown technologies technologies nowadaysnowadays
Offshore windOffshore wind 3G nuclear 3G nuclear
fissionfission Hybrid carsHybrid cars 1G Biofuels1G Biofuels Subsidized Subsidized
solarsolar Smart metersSmart meters
Towards a Towards a cero-emission cero-emission and efficient and efficient
energyenergy
15
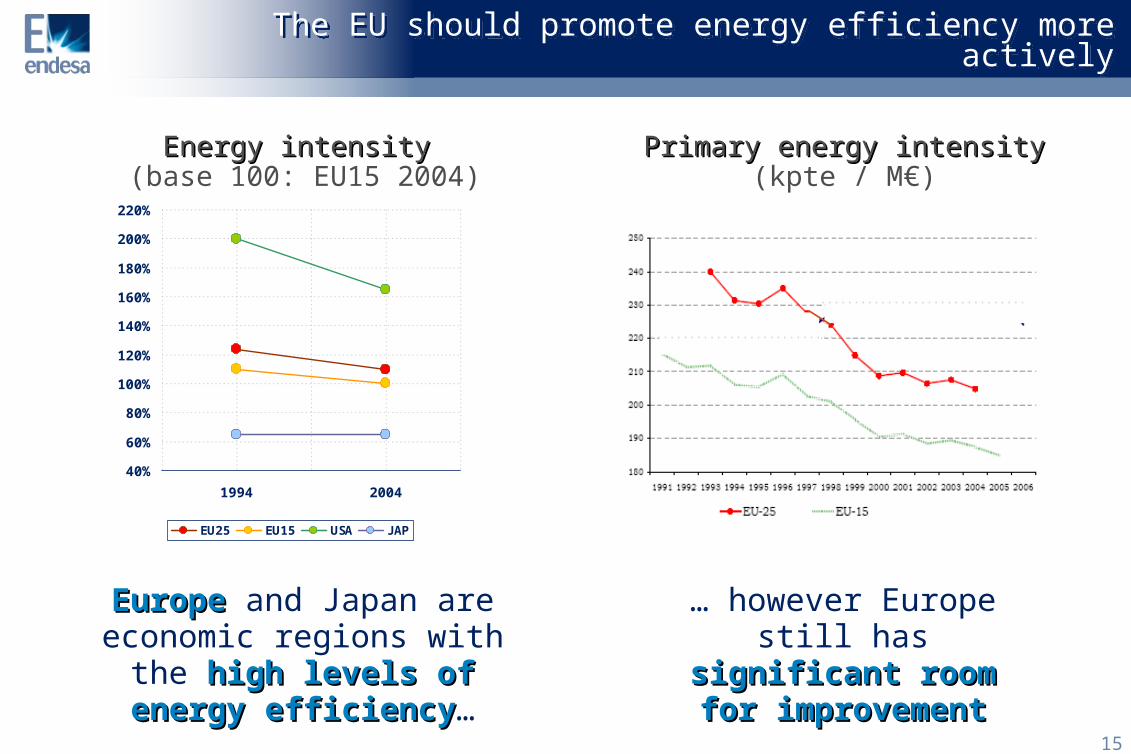
The EU should promote energy efficiency more activelyThe EU should promote energy efficiency more actively
… however Europe still has significant room significant room
for improvementfor improvement
40%
60%
80%
100%
120%
140%
160%
180%
200%
220%
1994 2004
EU25 EU15 USA J AP
Europe Europe and Japan are economic regions with the
high levels of energy high levels of energy efficiencyefficiency…
Energy intensity Energy intensity (base 100: EU15 2004)
Primary energy intensityPrimary energy intensity(kpte / M€)
16
Summary Summary
The European Union is leading the combat on leading the combat on climate changeclimate change. A critical levers will be the development of renewables
Renewables have significant benefitsRenewables have significant benefits for both the European electricity system and the European economy, with some “cons” that must be offset
Europe should not leave aside the other main drivers of a balanced energy policy: Security of Supply and Competitiveness

Rafael Miranda CEO of Endesa
President of Eurelectric
Athens, 22th of May of 2008
Rafael Miranda CEO of Endesa
President of Eurelectric
Athens, 22th of May of 2008
Challenges of the current European
Energy Policy
Challenges of the current European
Energy Policy


![Shossler Eurelectric(Compatibility Mode]](https://img.pdfslide.net/doc/110x75/577ce0b31a28ab9e78b3e149/shossler-eurelectriccompatibility-mode.jpg)
