Embed Size (px)
Citation preview
PRIMARY RESEARCH PAPER
Changes in microphytobenthos fluorescence over a tidalcycle: implications for sampling designs
E. Maggi • A. C. Jackson • T. Tolhurst •
A. J. Underwood • M. G. Chapman
Received: 16 February 2012 / Revised: 11 May 2012 / Accepted: 19 August 2012
� Springer Science+Business Media B.V. 2012
Abstract Intertidal microphytobenthos (MPB) are
important primary producers and provide food for
herbivores in soft sediments and on rocky shores.
Methods of measuring MPB biomass that do not
depend on the time of collection relative to the time of
day or tidal conditions are important in any studies that
need to compare temporal or spatial variation, effects
of abiotic factors or activity of grazers. Pulse ampli-
tude modulated (PAM) fluorometry is often used to
estimate biomass of MPB because it is a rapid, non-
destructive method, but it is not known how measures
of fluorescence are altered by changing conditions
during a period of low tide. We investigated this
experimentally using in situ changes in minimal
fluorescence (Fo15) on a rocky shore and on an estuarine
mudflat around Sydney (Australia), during low tides.
On rocky shores, the time when samples are taken
during low tide had little direct influence on measures
of fluorescence as long as the substratum is dry.
Wetness from wave-splash, seepage from rock pools,
run-off, rainfall, etc., had large consequences for any
comparisons. On soft sediments, fluorescence was
decreased if the sediment dried out, as happens during
low-spring tides on particularly hot and dry days.
Surface water affected the response of PAM and
therefore measurements used to estimate MPB,
emphasising the need for care to ensure that represen-
tative sampling is done during low tide.
Keywords Microphytobenthos � Biomass �Sampling � Surface water � Low tide � Pulse amplitude
modulated fluorometry � Australia
Introduction
Intertidal microphytobenthos (MPB) are important
primary producers in soft sediments (Yallop et al.,
1994; MacIntyre & Cullen, 1996; Underwood et al.,
2005) and on rocky shores (Castenholz, 1961; Nicotri,
1977; Magalhaes et al., 2003). They contribute to
carbon budgets (Sullivan & Moncrieff, 1988; Under-
wood & Kromkamp, 1999), can stabilize sediments
(Tolhurst & Chapman, 2007) and provide food for
Handling editor: Stuart Jenkins
E. Maggi (&)
Dipartimento di Biologia, Universita di Pisa, CoNISMa,
Pisa, Italy
e-mail: [email protected]
A. C. Jackson
Environmental Research Institute, North Highland
College, University of the Highlands and Islands, Ormlie
Road, Thurso, Caithness KW14 7EE, UK
T. Tolhurst
School of Environmental Sciences, University of East
Anglia, Norwich NR4 7TJ, UK
A. J. Underwood � M. G. Chapman
Centre for Research on Ecological Impacts of Coastal
Cities, Marine Ecology Laboratories A11, University of
Sydney, Sydney, NSW 2006, Australia
123
Hydrobiologia
DOI 10.1007/s10750-012-1291-x
herbivores (Castenholz, 1961; Hawkins et al., 1992).
Spatially, amounts of intertidal MPB vary consider-
ably at scales from millimetres (Blanchard, 1990;
Hutchinson et al., 2006; Jackson et al., 2009) to
kilometres (Jenkins et al., 2001; Thompson et al.,
2005), with a lot of the variation at the smallest scales
measured (e.g. Saburova et al., 1995; Chapman &
Tolhurst, 2007). Measures of temporal variation on
rocky shores have mostly been about changes at large
temporal scales (e.g. monthly, seasonal or inter-annual
variability; Underwood, 1984a; Jenkins et al., 2001;
Thompson et al., 2005; Jackson et al., 2010), with no
studies of short-temporal variation in MPB (e.g. diel or
tidal variation). Such large-scale comparisons would,
however, be compromised if measures of intertidal
MBP abundance are affected by temporal variation
throughout periods of low tide. When such variation is
not considered, large-scale, seasonal or inter-annual
comparisons would be confounded (e.g. Jenkins et al.,
2001).
Many intertidal micro-algae in soft sediments have
diel and/or tidal migratory behaviour and complex
periodicities controlled by availability of light and
timing of emersion (Round & Palmer, 1966; Serodio
et al. 1997; Perkins et al., 2003). Although Lamonta-
gne et al. (1989) suggested that migration by MPB on
rocky substrata is unlikely, some species of diatoms
are endolithic and migrate in the rock (Houpt, 1994).
Migratory patterns (usually upward migration during
periods of emersion during daylight hours; Round &
Palmer, 1966; MacIntyre et al., 1996) have been also
observed primarily in muddy estuaries which are often
dominated by diatoms (e.g. Blanchard et al., 2001;
Tolhurst et al., 2003). Composition of MPB assem-
blages does, however, vary globally. For example, in
south-east Australia, rocky shores are often dominated
by cyanobacteria (Jackson et al., 2010) and estuaries
may have patches of filamentous green algae (Chap-
man & Tolhurst, 2004, 2007), which are not migra-
tory. Dominance by these algae in mangrove forests
may explain Tolhurst & Chapman’s (2005) results that
there was little effect of time of low tide or time during
a tidal cycle on concentrations of chlorophyll.
Intertidal systems have emersed and submersed
conditions twice daily. Changes in environmental
conditions associated with the tide (e.g. temperature,
light, water-content, abrasion, etc.) can be stressful to
MPB (Joint et al., 1982; Helmuth et al., 2002; Perkins
et al., 2003; Easley et al., 2005). Although many
studies have shown spatial and temporal variations in
chlorophyll (e.g. Blanchard, 1990; Thompson et al.,
2004) and photosynthetic activity (e.g. measured by
PAM fluorescence; Jesus et al., 2005; Serodio et al.,
2005; Tolhurst et al., 2006), the reasons for these
variations are not always clear. They are, however,
potentially confounded by variations in the timing of
sampling relative to the state of the tide. For example,
physiological and physical factors that vary during
emersion/submersion (Serodio et al., 1997; Perkins
et al., 2001; Cohn et al., 2003; Roncarati et al., 2008;
Coelho et al., 2009) affect these measurements and the
timing of sampling is not consistent across sites or
larger time-scales. If there is substantial variation from
one time to another during the period since the tide
fell, it is important to standardise the timing of
sampling or to sample at several defined times
throughout low tide to be able to compare data from
one time or place to another. Otherwise, any difference
from time to time (e.g. season to season) may simply
reflect differences at different stages of the low-tidal
cycle. Despite this requirement, most studies of large-
scale temporal patterns in MPB biomass have simply
reported that sampling was done ‘during low tide’,
without any further information on the timing relative
to the state of the tide. Thus, we do not currently know
how representative any of these measures of MPB are.
Knowing whether, where and when measurements of
MPB biomass change during a tidal cycle is therefore
essential for planning sampling that is to be compa-
rable across studies or across large spatial or temporal
scales.
Methods for sampling and quantifying MPB
involve technical difficulties and are time-consuming,
particularly on hard substrata (Underwood, 1984b;
Hill & Hawkins, 1990; Nagarkar & Williams, 1999).
Therefore, rapid, non-destructive methods, such as
field spectrometry (Murphy et al., 2005a), digital
infra-red photography (Murphy et al., 2004; Murphy
et al., 2006) and pulse amplitude modulated (PAM)
fluorometry (Serodio et al. 1997; Honeywill et al.,
2002; Consalvey et al., 2005; Jesus et al., 2005), have
been developed. PAM is a rapid and widely used
method, also suitable in systems (such as Mediterra-
nean or Baltic microtidal habitats) where the presence
of water (e.g. from wave-splash, seepage from rock
pools, run-off, etc.) can prevent the use of alternative
non-destructive methods for estimates of MPB abun-
dance. Values of Fo15 (minimal fluorescence after
Hydrobiologia
123
15 min dark adaptation) have been positively corre-
lated with amounts of chlorophyll a and biomass of
MPB (Serodio et al., 1997; Honeywill et al., 2002).
We used PAM fluorometry to investigate in situ
changes in minimal fluorescence (Fo15) on a rocky
shore and on an estuarine mudflat during periods of
emersion, to test the hypothesis that fluorescence
would vary throughout the period between the fall and
the subsequent rise of water during a low tide. We
predicted more change (if any) in the sediments, where
motile micro-algae were more likely to be present and
could more easily migrate vertically compared to the
rocky shore. A decrease in fluorescence on the rocky
shore was observed as the tide fell and an increase
when it rose (see ‘Results’ section). We proposed the
explanation that changes in Fo15 were caused by
surficial water. This was examined experimentally.
On the mudflat, fluorescence decreased during emer-
sion, so we tested whether this was due to water in the
surface of the sediment via experiments in which
water was either added during low tide or was
removed by draining the sediments.
Materials and methods
Studies were done on a rocky shore in the Cape Banks
Scientific Marine Research Area, Botany Bay (here-
after CB; 33�5905400S; 151�1403900E) and on two
estuarine mudflats at Tambourine Bay (hereafter TB;
33�4904100S; 151�09000E) and Fig Tree Bridge (hereaf-
ter FTB; 33�4904400S; 151�0804400E) in Sydney
Harbour, NSW. In these areas, tides are semidiurnal
with a maximal range of *2 m. At Cape Banks, rocky
epilithic assemblages were dominated by cyanobac-
teria; in addition, spectral signatures were never
similar to assemblages of diatoms (Jackson et al.,
2010). During a study of chlorophyll distribution on
the Fig Tree Bridge and Tambourine Bay mudflats in
Sydney harbour (Murphy et al., 2005b), the shape of
the spectra and the peak at green wavelengths
indicated that MPB assemblages were dominated by
green algae (mostly filamentous green algae, which
were distributed on the surface of and in between
grains of sediment in the upper few millimetres of the
sediment surface) (R. Murphy, pers. comm.). The
upper millimetres of the sediment surface has a grain
size \63 lm (corresponding to mud) of 24% at
Tambourine Bay and 29% at Fig Tree Bridge.
Rocky shore
At CB, two randomly selected sites (stretches of
*10 m, about 200 m apart) at each of two heights on
the shore were used. The first (‘Mid’, about 1.6 m
above Chart Datum) was approximately in the middle
of the vertical distribution of an intertidal assemblage
of species dominated by grazing molluscs (Under-
wood, 1980), the most common of which were the
limpet Cellana tramoserica (Sowerby) and the snails
Bembicium nanum (Lamark) and Nerita atramentosa
(Reeve). The second height (‘Low’, about 1.4 m
above Chart Datum) was where there were more
macro-algae, mostly the encrusting red Hildenbrandia
rubra (Sommerfelt) Meneghini and brown Ralfsia
verrucosa (Areschoug) Areschoug algae. At each site
and height, four patches (30 9 25 cm) were scrubbed
with hydrochloric acid in November 2006 to remove
all organisms so that measurements of fluorescence
from epilithic MPB were not confused by encrusting
macro-algae (Underwood, 1984b). The cleared space
was rapidly recolonised by MPB (Murphy et al., 2006)
and at 6 months, the reflectance spectra indicated that
patches were still colonised by cyanobacteria and
possibly some diatoms (R. Murphy, pers. comm.) with
no macro-algae.
Observational study
On March 28th 2007, three replicate measures of
fluorescence were taken in each of three ‘Mid’ patches
at one site. Patches were sampled every 5 min, starting
when the rock was exposed by the ebbing tide and
finishing when the patches were wetted by the rising
tide. Care was taken to ensure that the same areas of a
patch were not sampled twice.
Experimental addition of water
An experiment to test the effect of surficial water on
fluorescence were done on April 13th and then
repeated on May 14th, 2007. At each site and height,
two patches were randomly allocated to each of
Control and ?Water treatments. Control treatments
were allowed to dry naturally, and ?Water treatments
were kept wet throughout low tide by adding seawater
from a tank via a perforated rubber hose. Water flow
was maintained at a rate that ensured the entire patch
was covered by a thin film of water. Fluorescence
Hydrobiologia
123
(n = 3) was measured in each patch six times: just
before emersion (B; approximately 1 h before emer-
sion), early during emersion (E; approximately
5–10 min after emersion), twice in the middle of
emersion (M1 and M2; approximately 1–1.30 and
2–2.30 h after emersion, respectively) just before the
patches were wetted by the rising tide (L; approxi-
mately 3–3.30 h after emersion) and finally just after
the rising tide covered the patches (A; approximately
5–10 min after water covered the plot; Table 1). The
precise timing of sampling differed among patches,
due to sampling constraints and differences in eleva-
tion (hence differences in the times of emersion and
submersion).
Mudflat
Observational study
Changes in fluorescence during emersion were first
measured on an intertidal mudflat at TB on March
15th, 2007. Replicate measurements (about 50 cm
apart; n = 168) were taken every 2–5 min at the same
height along a 40-m stretch of shore, starting just after
the tide receded and finishing before the water covered
the substratum. The same areas were not sampled
twice.
Experimental addition of water
The first experiment to test the effect of presence of
water on fluorescence was done on May 15th, 2007, in
similar habitat at FTB. In each of two sites (40 m long,
5 m apart), 42 areas of sediment (150 mm in diameter)
were selected at the same height. These were ran-
domly allocated to Control and ?Water treatments.
Controls were allowed to dry naturally, and ?Water
treatments were kept wet throughout the low tide, by
retaining water in surrounding plastic rings (150 mm
in diameter, 200 mm high) pushed 100 mm into the
mud before the tide ebbed. These were replenished
with water as required. Previous experiments had
demonstrated that the rings themselves did not affect
the fluorescence of algae [mean Fo15 in unmanipulated
sediment = 429 (±SE 26, n = 3); mean Fo15 in
sediment inside plastic rings = 416 (±SE 30,
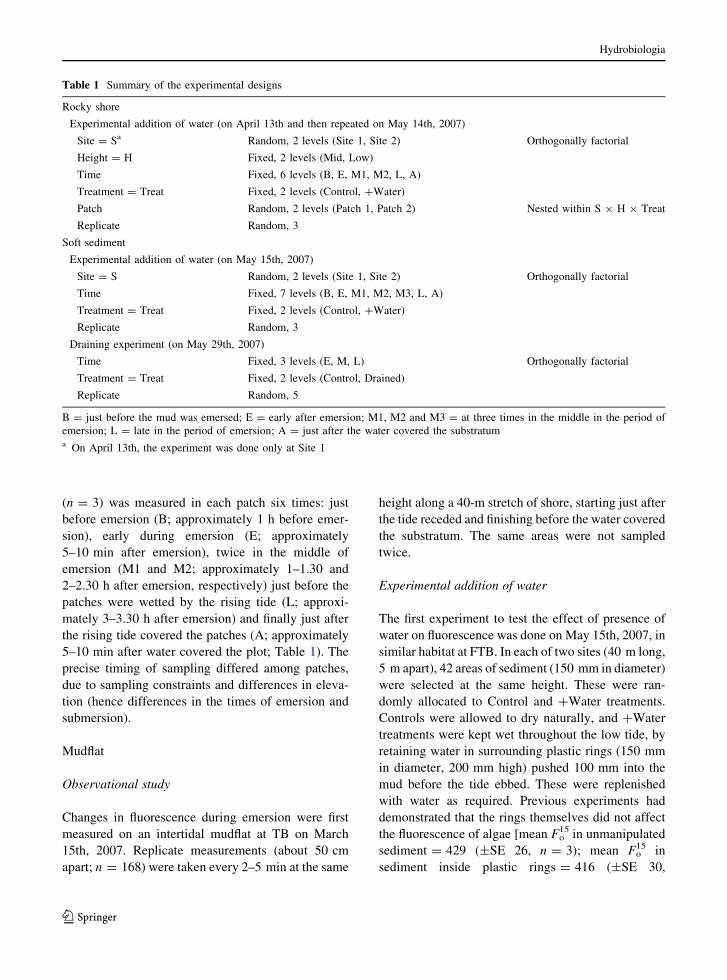
Table 1 Summary of the experimental designs
Rocky shore
Experimental addition of water (on April 13th and then repeated on May 14th, 2007)
Site = Sa Random, 2 levels (Site 1, Site 2) Orthogonally factorial
Height = H Fixed, 2 levels (Mid, Low)
Time Fixed, 6 levels (B, E, M1, M2, L, A)
Treatment = Treat Fixed, 2 levels (Control, ?Water)
Patch Random, 2 levels (Patch 1, Patch 2) Nested within S 9 H 9 Treat
Replicate Random, 3
Soft sediment
Experimental addition of water (on May 15th, 2007)
Site = S Random, 2 levels (Site 1, Site 2) Orthogonally factorial
Time Fixed, 7 levels (B, E, M1, M2, M3, L, A)
Treatment = Treat Fixed, 2 levels (Control, ?Water)
Replicate Random, 3
Draining experiment (on May 29th, 2007)
Time Fixed, 3 levels (E, M, L) Orthogonally factorial
Treatment = Treat Fixed, 2 levels (Control, Drained)
Replicate Random, 5
B = just before the mud was emersed; E = early after emersion; M1, M2 and M3 = at three times in the middle in the period of
emersion; L = late in the period of emersion; A = just after the water covered the substratuma On April 13th, the experiment was done only at Site 1
Hydrobiologia
123
n = 3)]. Times were: just before the mud was emersed
(B; approximately 5–10 min before emersion), early
(E; approximately 10–20 min after emersion), at
three times in the middle (M1, M2 and M3; approx-
imately 1, 2 and 3 h after emersion, respectively), late
(L; approximately 4 h after emersion) during the
period of emersion and finally just after the water
covered the mud again (A; approximately 10 min after
being covered). The fluorescence for each area was
calculated from the mean of three measurements in
each plot (Table 1).
Experimental draining
An experiment to investigate the effect of desiccation
of sediment on fluorescence was done on May 29th,
2007, at one of the two sites at FTB. There were two
treatments: 15 cores of sediment (7 cm in diameter,
5 cm deep) were drained during a low tide (Drained)
and 15 cores were left as Controls. The drained cores
were removed from the mudflat at the start of low tide
and placed on a rigid mesh sheet raised above the
substratum. The sediment was coherent, and the cores
did not disintegrate. The surfaces of the cores were not
touched during this procedure. This treatment let the
sediment drain faster than the Control cores which
were left in situ. At each of three times [Early (E;
approximately 15 min after emersion), Mid (M;
approximately 1.3 h after emersion) and Late (L;
approximately 3 h after emersion)], fluorescence was
measured in five randomly chosen cores of each
treatment (Table 1).
Measurement of fluorescence
Algae were dark-adapted for 15 min (Kromkamp
et al., 1998; Honeywill et al., 2002) and minimal
fluorescence (Fo15) measured with a PAM fluorometer
(Diving PAM, Walz, Germany; used settings:
MI = 12, G = 9). The probe was kept at 4 mm above
the substratum and measured an area of approximately
24 mm2. The zero offset (measurement of background
signal without a sample) was done by pointing the
fibre-optic cable at the sky away from the sun. Where
two fluorometers were used concurrently on the rocky
shore, they were cross-calibrated using measurements
of fluorescence standards to ensure comparability of
data between devices. Correlations were linear and
strong (e.g. r = 0.99, d.f. = 8, P \ 0.001).
Results
Rocky shore
Observational study
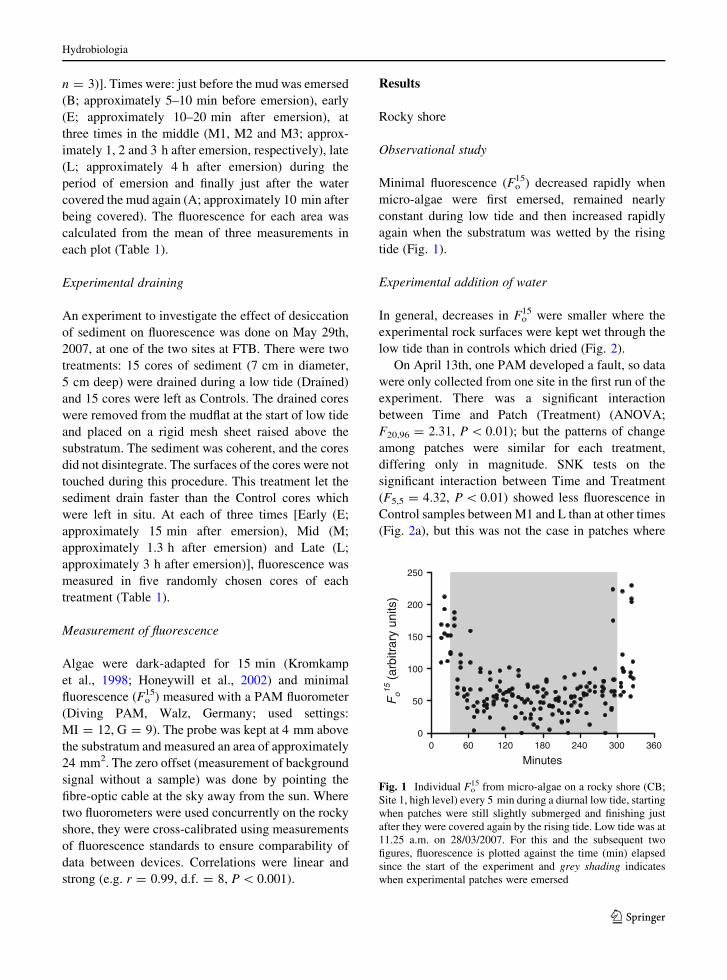
Minimal fluorescence (Fo15) decreased rapidly when
micro-algae were first emersed, remained nearly
constant during low tide and then increased rapidly
again when the substratum was wetted by the rising
tide (Fig. 1).
Experimental addition of water
In general, decreases in Fo15 were smaller where the
experimental rock surfaces were kept wet through the
low tide than in controls which dried (Fig. 2).
On April 13th, one PAM developed a fault, so data
were only collected from one site in the first run of the
experiment. There was a significant interaction
between Time and Patch (Treatment) (ANOVA;
F20,96 = 2.31, P \ 0.01); but the patterns of change
among patches were similar for each treatment,
differing only in magnitude. SNK tests on the
significant interaction between Time and Treatment
(F5,5 = 4.32, P \ 0.01) showed less fluorescence in
Control samples between M1 and L than at other times
(Fig. 2a), but this was not the case in patches where
Minutes0 60 120 180 240 300 360
Fo15
(arb
itrar
y un
its)
0
50
100
150
200
250
Fig. 1 Individual Fo15 from micro-algae on a rocky shore (CB;
Site 1, high level) every 5 min during a diurnal low tide, starting
when patches were still slightly submerged and finishing just
after they were covered again by the rising tide. Low tide was at
11.25 a.m. on 28/03/2007. For this and the subsequent two
figures, fluorescence is plotted against the time (min) elapsed
since the start of the experiment and grey shading indicates
when experimental patches were emersed
Hydrobiologia
123
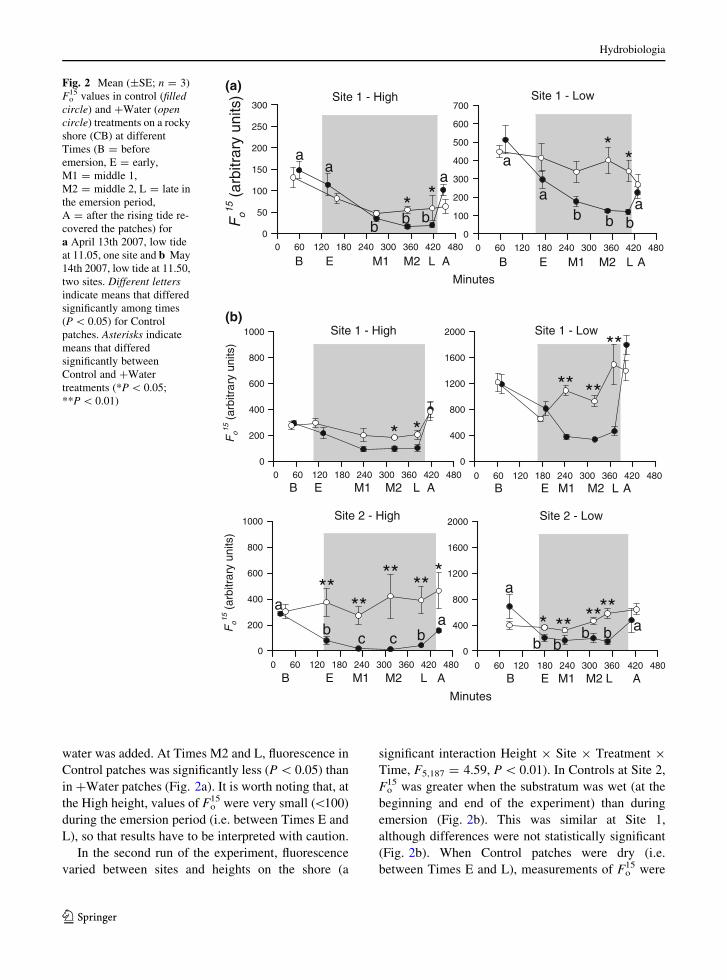
water was added. At Times M2 and L, fluorescence in
Control patches was significantly less (P \ 0.05) than
in ?Water patches (Fig. 2a). It is worth noting that, at
the High height, values of Fo15 were very small (\100)
during the emersion period (i.e. between Times E and
L), so that results have to be interpreted with caution.
In the second run of the experiment, fluorescence
varied between sites and heights on the shore (a
significant interaction Height 9 Site 9 Treatment 9
Time, F5,187 = 4.59, P \ 0.01). In Controls at Site 2,
Fo15 was greater when the substratum was wet (at the
beginning and end of the experiment) than during
emersion (Fig. 2b). This was similar at Site 1,
although differences were not statistically significant
(Fig. 2b). When Control patches were dry (i.e.
between Times E and L), measurements of Fo15 were
Minutes
(a)
B E M1 M2 L A
Fo15
(arb
itrar
y un
its)
0
50
100
150
200
250
300Site 1 - High
aa
a
b b b**
B E M1 M2 L A0 60 120 180 240 300 360 420 480
0
100
200
300
400
500
600
700Site 1 - Low
a
aa
b b b
**
Site 1 - LowSite 1 - High
Site 2 - High Site 2 - Low
Fo15
(arb
itrar
y un
its)
* ** ****
B E M1 M2 L A B E M1 M2 L A
B E M1 M2 L A B E M1 M2 L A
a
ab b
b b
Minutes
0
400
800
1200
1600
2000
* *Fo15
(arb
itrar
y un
its)
0
200
400
600
800
1000
(b)
** **
**
0
400
800
1200
1600
2000
****
** ***
a
b ba
c c0
200
400
600
800
1000
0 60 120 180 240 300 360 420 480
0 60 120 180 240 300 360 420 4800 60 120 180 240 300 360 420 480
0 60 120 180 240 300 360 420 4800 60 120 180 240 300 360 420 480
Fig. 2 Mean (±SE; n = 3)
Fo15 values in control (filled
circle) and ?Water (opencircle) treatments on a rocky
shore (CB) at different
Times (B = before
emersion, E = early,
M1 = middle 1,
M2 = middle 2, L = late in
the emersion period,
A = after the rising tide re-
covered the patches) for
a April 13th 2007, low tide
at 11.05, one site and b May
14th 2007, low tide at 11.50,
two sites. Different lettersindicate means that differed
significantly among times
(P \ 0.05) for Control
patches. Asterisks indicate
means that differed
significantly between
Control and ?Water
treatments (*P \ 0.05;
**P \ 0.01)
Hydrobiologia
123
generally larger in the ?Water treatment than in the
Controls. In 13 of the 16 comparisons (2 Heights, 2
Sites and 4 Times [E, M1, M2, L]), Fo15 was
significantly greater in ?Water than in Controls (at
P \ 0.05 in SNK tests). The probability of 13 of 16
cases in the same direction is small (P \ 0.05,
Binomial test).
In some analyses, variances were heterogeneous
among samples, but results were considered interpret-
able because of the large number of degrees of
freedom in the analyses (Underwood, 1997). At the
last time of sampling (A) on the rocky shore, some
dark adaptation chambers were washed away by large
waves. To maintain a balanced design, missing data
were replaced by the mean value obtained from the
remaining replicates in the same treatment; the
number of degrees of freedom was correspondingly
reduced (Underwood, 1997).
Mudflats
Observational study
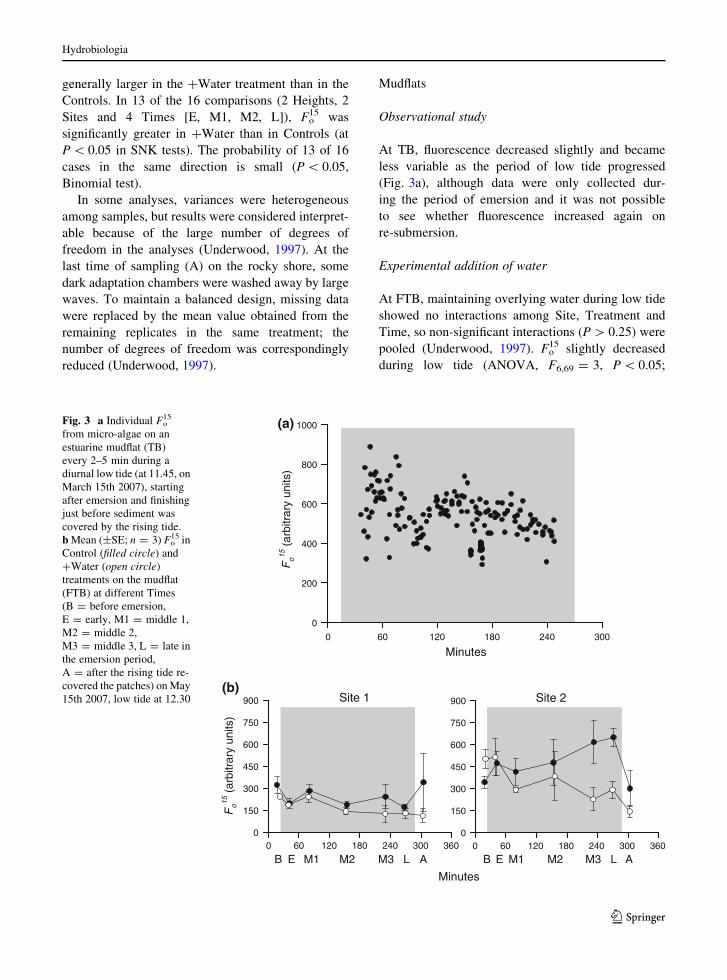
At TB, fluorescence decreased slightly and became
less variable as the period of low tide progressed
(Fig. 3a), although data were only collected dur-
ing the period of emersion and it was not possible
to see whether fluorescence increased again on
re-submersion.
Experimental addition of water
At FTB, maintaining overlying water during low tide
showed no interactions among Site, Treatment and
Time, so non-significant interactions (P [ 0.25) were
pooled (Underwood, 1997). Fo15 slightly decreased
during low tide (ANOVA, F6,69 = 3, P \ 0.05;
(a)
Minutes0 60 120 180 240 300
Fo15
(arb
itrar
y un
its)
0
200
400
600
800
1000
Minutes
B E M1 M2 L AM3
(b)
B E M1 M2 L AM3
Site 1
Fo15
(arb
itrar
y un
its)
0
150
300
450
600
750
900 Site 2
0 60 120 180 240 300 3600
150
300
450
600
750
900
0 60 120 180 240 300 360
Fig. 3 a Individual Fo15
from micro-algae on an
estuarine mudflat (TB)
every 2–5 min during a
diurnal low tide (at 11.45, on
March 15th 2007), starting
after emersion and finishing
just before sediment was
covered by the rising tide.
b Mean (±SE; n = 3) Fo15 in
Control (filled circle) and
?Water (open circle)
treatments on the mudflat
(FTB) at different Times
(B = before emersion,
E = early, M1 = middle 1,
M2 = middle 2,
M3 = middle 3, L = late in
the emersion period,
A = after the rising tide re-
covered the patches) on May
15th 2007, low tide at 12.30
Hydrobiologia
123
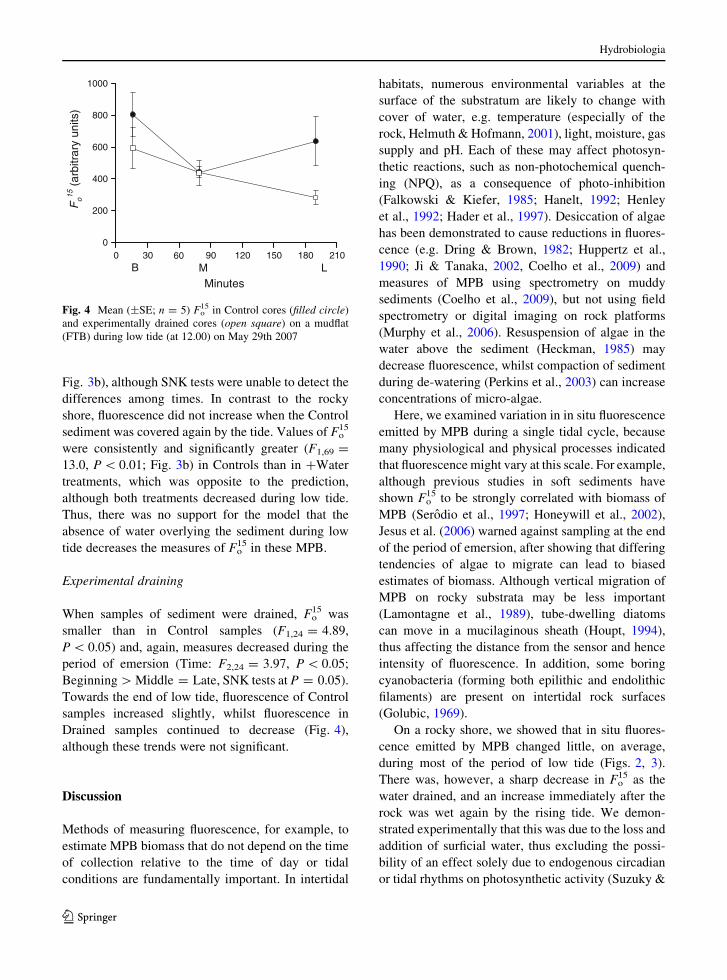
Fig. 3b), although SNK tests were unable to detect the
differences among times. In contrast to the rocky
shore, fluorescence did not increase when the Control
sediment was covered again by the tide. Values of Fo15
were consistently and significantly greater (F1,69 =
13.0, P \ 0.01; Fig. 3b) in Controls than in ?Water
treatments, which was opposite to the prediction,
although both treatments decreased during low tide.
Thus, there was no support for the model that the
absence of water overlying the sediment during low
tide decreases the measures of Fo15 in these MPB.
Experimental draining
When samples of sediment were drained, Fo15 was
smaller than in Control samples (F1,24 = 4.89,
P \ 0.05) and, again, measures decreased during the
period of emersion (Time: F2,24 = 3.97, P \ 0.05;
Beginning [ Middle = Late, SNK tests at P = 0.05).
Towards the end of low tide, fluorescence of Control
samples increased slightly, whilst fluorescence in
Drained samples continued to decrease (Fig. 4),
although these trends were not significant.
Discussion
Methods of measuring fluorescence, for example, to
estimate MPB biomass that do not depend on the time
of collection relative to the time of day or tidal
conditions are fundamentally important. In intertidal
habitats, numerous environmental variables at the
surface of the substratum are likely to change with
cover of water, e.g. temperature (especially of the
rock, Helmuth & Hofmann, 2001), light, moisture, gas
supply and pH. Each of these may affect photosyn-
thetic reactions, such as non-photochemical quench-
ing (NPQ), as a consequence of photo-inhibition
(Falkowski & Kiefer, 1985; Hanelt, 1992; Henley
et al., 1992; Hader et al., 1997). Desiccation of algae
has been demonstrated to cause reductions in fluores-
cence (e.g. Dring & Brown, 1982; Huppertz et al.,
1990; Ji & Tanaka, 2002, Coelho et al., 2009) and
measures of MPB using spectrometry on muddy
sediments (Coelho et al., 2009), but not using field
spectrometry or digital imaging on rock platforms
(Murphy et al., 2006). Resuspension of algae in the
water above the sediment (Heckman, 1985) may
decrease fluorescence, whilst compaction of sediment
during de-watering (Perkins et al., 2003) can increase
concentrations of micro-algae.
Here, we examined variation in in situ fluorescence
emitted by MPB during a single tidal cycle, because
many physiological and physical processes indicated
that fluorescence might vary at this scale. For example,
although previous studies in soft sediments have
shown Fo15 to be strongly correlated with biomass of
MPB (Serodio et al., 1997; Honeywill et al., 2002),
Jesus et al. (2006) warned against sampling at the end
of the period of emersion, after showing that differing
tendencies of algae to migrate can lead to biased
estimates of biomass. Although vertical migration of
MPB on rocky substrata may be less important
(Lamontagne et al., 1989), tube-dwelling diatoms
can move in a mucilaginous sheath (Houpt, 1994),
thus affecting the distance from the sensor and hence
intensity of fluorescence. In addition, some boring
cyanobacteria (forming both epilithic and endolithic
filaments) are present on intertidal rock surfaces
(Golubic, 1969).
On a rocky shore, we showed that in situ fluores-
cence emitted by MPB changed little, on average,
during most of the period of low tide (Figs. 2, 3).
There was, however, a sharp decrease in Fo15 as the
water drained, and an increase immediately after the
rock was wet again by the rising tide. We demon-
strated experimentally that this was due to the loss and
addition of surficial water, thus excluding the possi-
bility of an effect solely due to endogenous circadian
or tidal rhythms on photosynthetic activity (Suzuky &
Minutes
0 30 60 90 120 150 180 210
Fo15
(arb
itrar
y un
its)
0
200
400
600
800
1000
B M L
Fig. 4 Mean (±SE; n = 5) Fo15 in Control cores (filled circle)
and experimentally drained cores (open square) on a mudflat
(FTB) during low tide (at 12.00) on May 29th 2007
Hydrobiologia
123
Johnson, 2001). In fact, although changes in abiotic
factors (e.g. desiccation, pH, gas supply), vertical
migration and/or NPQ processes could possibly
decrease Fo15 values during the period of emersion in
Control patches, in most of the cases, the presence of
water reduced this effect. In addition, it is worth
stressing that our rocky MPB assemblages were
strongly dominated by cyanobacteria (Jackson et al.,
2010), which are known to modulate excessive light
harvesting processes mostly through state transitions
(Campbell et al., 1998). Although NPQ processes in
these organisms can be activated by high levels of blue
light (see the review by Bailey & Grossman, 2008),
this was not the case for our study, as the Diving PAM
excited fluorescence by pulse modulated red light.
Last, but not least, it is important to note that the
observed increases in Fo15 values in Control patches,
from just before to just after the water covered them
(Fig. 2a and b, see Late and After times), are unlikely
to be due to decreases in PAR (photosynthetically
active radiation) values. In fact, in both runs of the
experiment, the difference in time between the two
measurements was about half an hour (and measure-
ments were taken approximately between 2 and 3
p.m.), which is a very short period of time in
comparison to the total length of the dry period, which
encompassed about 4 h (approximately between 10
a.m. and 2.30 p.m.), during which MPB experienced
greater changes in PAR values.
On rocky shores, the time of sampling during low
tide may have little influence on measures of fluores-
cence as long as the substratum is dry. Wetness (e.g.
from wave-splash, seepage from rock pools, run-off,
rainfall, etc.) may have large consequences for any
comparisons. For example, comparisons of MPB
biomass at different heights on a shore or between
sheltered and exposed sites may be confounded if low
shore or wave-exposed sites are consistently wetter
than high shore or sheltered sites. We are, however,
not aware of studies using PAM on rocky shores that
have considered surface moisture when sampling,
although Murphy et al. (2006) demonstrated clearly
that surface films of moisture do not affect measures of
MPB biomass using field spectrometry or digital
imaging. This suggests that surface water does not
affect the behaviour of the algae (i.e. NPQ processes or
vertical migration) on rock surfaces, but seems to
affect directly the measures made by the PAM, i.e. the
relationship between MPB biomass and Fo15. Recent
measurements on a Mediterranean temperate rocky
shore showed that the relationship between biomass of
MPB (estimated as lg chl a/cm2) and Fo5 varied on wet
versus dry sandstone rock surfaces (equations from
Maggi et al., unpublished data; wet surface: MPB
biomass = 0.004 � Fo5 ? 0.26; dry surface: MPB
biomass = 0.013 � Fo5 ? 0.32).
On soft sediments, changes in the fluorescence
during low tide differed from those on the rocky shore.
Here fluorescence slightly decreased during emersion;
it is worth noting, however, that this result was mainly
in the ‘?Water’ treatment. Although this is in contrast
to some studies (Serodio & Catarino, 2000; Jesus et al.,
2005; Tolhurst et al., 2006), which showed increases
in fluorescence during low tide, the lack of changes in
Control plots during low tide agrees with past
experiments at the same location (Tolhurst & Chap-
man, 2005). Other authors (Easley et al., 2005)
showed that diatoms in a sandy beach did not always
migrate vertically during low tide. Here, we cannot
exclude an interactive effect between vertical migra-
tion of algae and NPQ processes (Falkowski & Kiefer,
1985). Upward migration in Controls during the
period of low tide was, however, very unlikely at
these sites, due to a relative scarcity of migratory
micro-algae (Chapman & Tolhurst, 2004, 2007). As a
consequence, we should expect only a possible
decrease in Fo15 values, due to NPQ processes, only
in the Control in comparison to the ?Water plots (if
the presence of some centimetres of water in ?Water
treatments protected MPB from NPQ processes) or in
both Control and ?Water plots (if the presence of
water did not protect MPB). None of the two
alternatives were in accordance with our results. The
addition of water may have slightly decreased Fo15
values because of resuspension of MPB (Heckman,
1985). Easley et al. (2005) proposed that this would
happen with the arrival of water as the tide rose. More
interestingly, experimental draining of the sediment
decreased Fo15 relative to sediment in situ. This pattern
was observed at approximately the same time (around
1.30–2 pm) as the M2 time of the previous experi-
ment, when no changes in Fo15 values were observed.
Thus, although not excluding the occurrence of NPQ
processes in this habitat, this result clearly shows that
the absence of moisture can decrease fluorescence in
soft sediments if the sediment dries out, e.g. during
exceptionally low spring tides on particularly hot and
dry days. This is in accordance with the negative effect
Hydrobiologia
123
of desiccation on measures of fluorescence found by
Coelho et al. (2009) in a laboratory study. This would
cause a similar pattern to that shown on the rocky
shore and also suggests that positive effects of
compaction of sediment on fluorescence values are
weak or non-existent in this estuary. Data from the
same location used here showed a good correlation
between MPB biomass and Fo15 at two sites during the
middle of low tide (with r2 values of 0.6 and 0.7,
unpublished data). This means that, as on a rocky
shore, moisture content of the sediment can affect the
relationship between biomass and Fo15. The relation-
ship varied not only from the middle to the end of the
period of low tide (which could be due, again, both to
NPQ processes and drainage), but also between sites
(which probably differ in the amount of moisture of
the sediment, despite their apparent similarity). Thus,
on soft sediments, the time during the low tide period
when one samples using PAM may provide different
results depending on the amount of drainage. This
varies a lot from place to place on a mudflat,
depending on compaction of the sediment, the mix
of grain-sizes and small micro-topographic features
caused by environmental conditions or actions of
biota.
Conclusions
The two studies described here emphasized the need to
sample representatively when using PAM (e.g. to
estimate MPB biomass) during low tide. On rocky
shores and in soft sediments, it is important to consider
the wetness of the substratum. If this cannot be kept
consistent across larger temporal scales, it may be
important to stratify sampling to incorporate wet and
dry patches of habitat or to collect enough samples at
each time to ensure that samples are representative of
the range of conditions at each time. The latter method
would then allow comparisons at different states of the
tidal cycle. On rocky shores, the timing of sampling
during low tide did not seem to affect the results as
long as the substratum was dry. As a consequence, in
conditions where the presence of water (e.g. from
wave-splash, seepage from rock pools, run-off, etc.)
cannot be avoided, the rock surface should be
dampened manually, to guarantee that measurements
are comparable. Timing of sampling during emersion
appears to be more important in sediments than on
rock, although this can vary among habitats. In this
case, it is probably more difficult to ensure a compa-
rable moisture of the sediment both among sites and
times during low tide, without altering other charac-
teristics of the sediment (such as micro-topography,
compaction of sediment, micro-spatial variability of
MPB). In this case, stratification of sampling and
increasing the number of samples at each time during
low tide is probably the only way to ensure represen-
tativeness of sampling.
In conclusion, when using PAM methodology to
estimate MPB biomass, it will be necessary to
demonstrate that the time since emersion does not
affect the results obtained, rather than simply assume
that it does not. All of this indicates that as much
thought needs to go into considering small temporal
scales of sampling on PAM measurements as has gone
into considering small-scale spatial variation. Further
investigations are needed to clarify the physiological
and/or physical changes occurring inside the MPB
cells and/or in the first millimetres of the substratum
(rock, mud or sand), which are causing a change in the
relationship between fluorescence and MPB biomass
in the presence of different amounts of water.
Acknowledgments E.M. was supported by an Italian
fellowship from CoNISMa; the entire study was supported by
funds from the Australian Research Council through the Centre
for Research on Ecological Impacts of Coastal Cities and ARC
Discovery Projects to A.J.U. and to M.G.C. and T.T. We thank
Paul Devlin and Mark Ellis for assistance in the field and
Richard Murphy for information on the MPB communities.
References
Bailey, S. & A. Grossman, 2008. Photoprotection in cyano-
bacteria: regulation of light harvesting. Photochemistry
and Photobiology 84: 1410–1420.
Blanchard, G. F., 1990. Overlapping microscale dispersion
patterns of meiofauna and microphytobenthos. Marine
Ecology Progress Series 68: 101–111.
Blanchard, G. F., J. M. Guarini, F. Orvain & P. G. Sauriau, 2001.
Dynamic behaviour of benthic microalgal biomass in
intertidal mudflats. Journal of Experimental Marine Biol-
ogy and Ecology 264: 85–100.
Campbell, D., V. Hurry, A. K. Clarke, P. Gustafsson & G.
Oquist, 1998. Chlorophyll fluorescence analysis of
cyanobacterial photosynthesis and acclimation. Microbi-
ology and Molecular Biology Reviews 62: 667–683.
Castenholz, R., 1961. Effect of grazing on marine littoral diatom
populations. Ecology 42: 783–794.
Chapman, M. G. & T. J. Tolhurst, 2004. The relationship
between invertebrate assemblage and bio-dependant
Hydrobiologia
123
properties of sediment in urbanized temperate mangrove
forests. Journal of Experimental Marine Biology and
Ecology 304: 51–73.
Chapman, M. G. & T. J. Tolhurst, 2007. Relationships between
benthic macrofauna and biogeochemical properties of
sediment at different spatial scales and among different
habitats in mangrove forests. Journal of Experimental
Marine Biology and Ecology 343: 96–109.
Coelho, H., S. Vieira & J. Serodio, 2009. Effects of desiccation
on the photosynthetic activity of intertidal microphyto-
benthos biofilms as studied by optical methods. Journal of
Experimental Marine Biology and Ecology 381: 98–104.
Cohn, S. A., J. F. Farrell, J. D. Munro, R. L. Ragland, R.
E. Weitzell & B. L. Wibisono, 2003. The effect of tem-
perature and mixed species composition on diatom motility
and adhesion. Diatom Research 18: 225–243.
Consalvey, M., R. G. Perkins, G. J. C. Underwood &
D. M. Paterson, 2005. Photosynthesis and fluorescence: a
beginner’s guide for benthic diatomists. Diatom Research
20: 1–22.
Dring, M. J. & F. A. Brown, 1982. Photosynthesis of intertidal
brown algae during and after periods of emersion: a
renewed search for physiological causes of zonation.
Marine Ecology Progress Series 8: 301–308.
Easley, J. T., S. N. Hymel & C. J. Plante, 2005. Temporal pat-
terns of benthic microalgal migration on a semi-protected
beach. Estuarine Coastal and Shelf Science 64: 486–496.
Falkowski, P. & D. A. Kiefer, 1985. Chlorophyll-a fluorescence
in phytoplankton – relationship to photosynthesis and
biomass. Journal of Plankton Research 7: 715–731.
Golubic, S., 1969. Distribution, taxonomy, and boring pat-
terns of marine endolithic algae. American Zoologist 9:
747–751.
Hader, D.-P., H. Herrmann, J. Schafer & R. Santas, 1997.
Photosynthetic fluorescence induction and oxygen pro-
duction in two Mediterranean Cladophora species mea-
sured on site. Aquatic Botany 56: 253–264.
Hanelt, D., 1992. Photoinhibition of photosynthesis in marine
macrophytes of the South China Sea. Marine Ecology
Progress Series 82: 199–206.
Hawkins, S. J., R. G. Hartnoll, J. M. Kain & T. A. Norton, 1992.
Plant–animal interactions on hard substrata in the North-
east Atlantic. In John, D. M., S. J. Hawkins & J. H. Price
(eds), Plant–Animal Interactions in the Marine Benthos.
Oxford University Press, Oxford: 1–32.
Heckman, C., 1985. The development of vertical migration
patterns in the sediments of estuaries as a strategy for algae
to resist drift with tidal currents. Internationale Revue der
gesamten Hydrobiologie und Hydrographie 70: 151–164.
Helmuth, B. S. T. & G. E. Hofmann, 2001. Microhabitats,
thermal heterogeneity, and patterns of physiological stress
in the rocky intertidal zone. Biological Bulletin 201:
374–384.
Helmuth, B., C. D. G. Harley, P. M. Halpin, M. O’Donnell, G.
E. Hofmann & C. A. Blanchette, 2002. Climate change and
latitudinal patterns of intertidal thermal stress. Science
298: 1015–1017.
Henley, W. J., S. T. Lindley, G. Levavasseur, C. B. Osmond & J.
Ramus, 1992. Photosynthetic response of Ulva rotundatato light and temperature during emersion on an intertidal
sand flat. Oecologia 89: 516–523.
Hill, A. S. & S. J. Hawkins, 1990. An investigation of methods for
sampling microbial films on rocky shores. Journal of the Marine
Biological Association of the United Kingdom 70: 77–88.
Honeywill, C., D. M. Paterson & S. E. Hagerthey, 2002.
Determination of microphytobenthic biomass using pulse-
amplitude modulated minimum fluorescence. European
Journal of Phycology 37: 485–492.
Houpt, P. M., 1994. Marine tube-dwelling diatoms and their
occurrence in the Netherlands. Netherland Journal of
Aquatic Ecology. 28: 77–84.
Huppertz, K., D. Hanelt & W. Nultsch, 1990. Photoinhibition of
photosynthesis in the marine brown alga Fucus serratus as
studied in field experiments. Marine Ecology Progress
Series 66: 175–182.
Hutchinson, N. S., J. C. Nagarkar, J. C. Aitchison & G.
A. Williams, 2006. Microspatial variation in marine bio-
film abundance on intertidal rock surfaces. Marine Ecology
Progress Series 42: 187–197.
Jackson, A. C., R. J. Murphy & A. J. Underwood, 2009. Patiriellaexigua: grazing by a starfish in an overgrazed intertidal
system. Marine Ecology Progress Series 376: 153–163.
Jackson, A. C., A. J. Underwood, R. J. Murphy & G. A. Skilleter,
2010. Latitudinal and environmental patterns in abundance
and composition of epilithic microphytobenthos. Marine
Ecology Progress Series 417: 27–38.
Jenkins, S. R., F. Arenas, J. Arrontes, J. Bussel, J. Castro, R.
A. Coleman, S. J. Hawkins, S. Kay, B. Martinez, M.
F. Roberts, S. Sousa, R. C. Thompson & R. G. Hartnoll,
2001. European-scale analysis of seasonal variability in
limpet grazing activity and microalgal abundance. Marine
Ecology Progress Series 211: 193–203.
Jesus, B., V. Brotas, M. Marani & D. M. Paterson, 2005. Spatial
dynamic of microphytobenthos determined by PAM fluo-
rescence. Estuarine Coastal and Shelf Science 65: 30–42.
Jesus, B., R. G. Perkins, M. Consalvey, V. Brotas & D. M. Pat-
erson, 2006. Effects of vertical migrations by benthic
micro-algae on fluorescence measurements of photophy-
siology. Marine Ecology Progress Series 315: 55–66.
Ji, Y. & J. Tanaka, 2002. Effect of desiccation on the photo-
synthesis of seaweeds from the intertidal zone in Honshu,
Japan. Phycological Research 50: 145–153.
Joint, I. R., J. M. Gee & R. M. Warwick, 1982. Determination of
fine-scale vertical distribution of microbes and meiofauna
in an intertidal sediment. Marine Biology 72: 157–162.
Kromkamp, J., C. Barranguet & J. Peene, 1998. Determination
of microphytobenthos PSII quantum efficiency and pho-
tosynthetic activity by means of variable chlorophyll
fluorescence. Marine Ecology Progress Series 162: 45–55.
Lamontagne, I., A. Cardinal & L. Fortier, 1989. Environmental
forcing versus endogenous control of photosynthesis in
intertidal epilithic micro-algae. Marine Ecology Progress
Series 51: 177–187.
MacIntyre, H. L. & J. J. Cullen, 1996. Primary production by
suspended and benthic micro-algae in a turbid estuary:
time-scales of variability in San Antonio Bay, Texas.
Marine Ecology Progress Series 145: 245–268.
MacIntyre, H. L., R. J. Geider & D. C. Miller, 1996. Micro-
phytobenthos: the ecological role of the ‘‘Secret Garden’’
of unvegetated, shallow-water marine habitats. I. Distribu-
tion, abundance and primary production. Estuaries 19:
186–201.
Hydrobiologia
123
Magalhaes, C. M., A. A. Bordalo & W. J. Wiebe, 2003. Inter-
tidal biomass on rocky substratum can play a major role in
estuarine carbon and nutrient dynamics. Marine Ecology
Progress Series 258: 275–281.
Murphy, R. J., T. Tolhurst, M. G. Chapman & A. J. Underwood,
2004. Estimation of surface chlorophyll on an exposed
mudflat using digital colour-infrared (CIR) photography.
Estuarine Coastal and Shelf Science 59: 625–638.
Murphy, R. J., A. J. Underwood, M. H. Pinkerton & P. Range,
2005a. Field spectrometry: new methods to investigate
epilithic micro-algae on rocky shores. Journal of Experi-
mental Marine Biology and Ecology 325: 111–124.
Murphy, R. J., T. J. Tolhurst, M. G. Chapman & A. J. Under-
wood, 2005b. Estimation of surface chlorophyll-a on an
emersed mudflat using field spectrometry: accuracy of
ratios and derivative-based approaches. International
Journal of Remote Sensing 26: 1835–1859.
Murphy, R. J., A. J. Underwood & M. H. Pinkerton, 2006.
Quantitative imaging to measure photosynthetic biomass
on an intertidal rock-platform. Marine Ecology Progress
Series 312: 45–55.
Nagarkar, S. & G. A. Williams, 1999. Spatial and temporal vari-
ation of cyanobacteria-dominated epilithic communities on a
tropical shore in Hong Kong. Phycologia 38: 385–393.
Nicotri, M. E., 1977. Grazing effects of 4 marine intertidal
herbivores on microflora. Ecology 58: 1020–1032.
Perkins, R. G., G. J. C. Underwood, V. Brotas, G. C. Snow, B.
Jesus & L. Ribeiro, 2001. Responses of microphytobenthos
to light: primary production and carbohydrate allocation
over an emersion period. Marine Ecology Progress Series
223: 101–112.
Perkins, R. G., C. Honeywill, M. Consalvey, A. J. Austin,
T. J. Tolhurst & D. M. Paterson, 2003. Changes in
microphytobenthic chlorophyll a and EPS resulting from
sediment compaction due to de-watering: opposing pat-
terns in concentration and content. Continental Shelf
Research 23: 575–586.
Roncarati, F., J. W. Rijstenbil & R. Pistocchi, 2008. Photosyn-
thetic performance, oxidative damage and antioxidants in
Cylindrotheca closterium in response to high irradiance,
UVB radiation and salinity. Marine Biology 153: 965–973.
Round, F. E. & J. D. Palmer, 1966. Persistent, vertical migration
rhythms in benthic microflora. II. Field and laboratory
studies on diatoms from the banks of the river Avon.
Journal of the Marine Biological Association of United
Kingdom 46: 191–214.
Saburova, M. A., I. G. Polikarpov & I. V. Burkovsky, 1995.
Spatial structure of an intertidal microphytobenthic com-
munity as related to different spatial scales. Marine Ecol-
ogy Progress Series 129: 229–239.
Serodio, J. & F. Catarino, 2000. Modelling the primary pro-
ductivity of intertidal microphytobenthos: time scales of
variability and effects of migratory rhythms. Marine
Ecology Progress Series 192: 13–30.
Serodio, J., J. Marques da Silva & F. Catarino, 1997. Nonde-
structive tracing of migratory rhythms of intertidal benthic
micro-algae using in vivo chlorophyll a fluorescence.
Journal of Phycology 33: 542–553.
Serodio, J., S. Vieira, S. Cruz & F. Barroso, 2005. Short-term var-
iability in the photosynthetic activity of microphytobenthos as
detected by measuring rapid light curves using variable fluo-
rescence. Marine Biology 146: 903–914.
Sullivan, M. J. & C. A. Moncrieff, 1988. A multivariate analysis
of diatom community structure and distribution in a
Mississippi salt marsh. Botanica Marina 31: 93–99.
Suzuky, L. & C. H. Johnson, 2001. Algae know the time of the
day: circadian and photoperiodic programs. Journal of
Phycology 37: 933–942.
Thompson, R. C., T. A. Norton & S. J. Hawkins, 2004. Physical
stress and biological control regulate the producer–con-
sumer balance in intertidal biofilms. Ecology 85:
1372–1382.
Thompson, R. C., P. S. Moschella, S. R. Jenkins, T. A. Norton &
S. J. Hawkins, 2005. Differences in photosynthetic marine
biofilms between sheltered and moderately exposed rocky
shores. Marine Ecology Progress Series 296: 53–63.
Tolhurst, T. J. & M. G. Chapman, 2005. Spatial and temporal
variation in the sediment properties of an intertidal man-
grove forest: implications for sampling. Journal of Exper-
imental Marine Biology and Ecology 317: 213–222.
Tolhurst, T. J. & M. G. Chapman, 2007. Patterns in biogeo-
chemical properties of sediments and benthic animals
among different habitats in mangrove forests. Austral
Ecology 32: 775–788.
Tolhurst, T. J., B. Jesus, V. Brotas & D. M. Paterson, 2003.
Diatom migration and sediment armouring – an example
from the Tagus Estuary, Portugal. Hydrobiologia 503:
183–193.
Tolhurst, T. J., E. C. Defew, R. G. Perkins, A. Sharples & D.
M. Paterson, 2006. The effects of tidally-driven temporal
variation on measuring intertidal cohesive sediment ero-
sion threshold. Aquatic Ecology 40: 521–531.
Underwood, A. J., 1980. The effects of grazing by gastropods,
and physical factors on the upper limits of distribution of
intertidal macroalgae. Oecologia 46: 201–213.
Underwood, A. J., 1984a. The vertical-distribution and seasonal
abundance of intertidal micro-algae on a rocky shore in
New South Wales. Journal of Experimental Marine Biol-
ogy and Ecology 78: 199–220.
Underwood, A. J., 1984b. Vertical and seasonal patterns in
competition for micro-algae between intertidal gastropods.
Oecologia 64: 211–222.
Underwood, A. J., 1997. Ecological Experiments: Their Logical
Design and Interpretation Using Analysis of Variance.
Cambridge University Press, Cambridge.
Underwood, G. C. J. & J. Kromkamp, 1999. Primary production
by phytoplankton and microphytobenthos in estuaries.
Advances in Ecological Research 29: 93–153.
Underwood, G. C. J., R. G. Perkins, M. C. Consalvey, A. R. M.
Hanlon, K. Oxborough, N. R. Baker & D. M. Paterson,
2005. Patterns of microphytobenthic primary productivity:
species-specific variation in migratory rhythms and pho-
tosynthetic efficiency in mixed-species biofilms. Limnol-
ogy and Oceanography 50: 755–767.
Yallop, M. L., B. D. Winder, D. M. Paterson & L. J. Stal, 1994.
Comparative structure, primary production and biogenic
stabilization of cohesive and non-cohesive marine sedi-
ments inhabited by microphytobenthos. Estuarine Coastal
and Shelf Science 39: 565–582.
Hydrobiologia
123