Embed Size (px)
Citation preview


Changes in mobility can relate to molecular states in large dense core vesicles
Dissertation zur Erlangung des Grades
des Doktors der Naturwissenschaften der Medizinisches Fakultät
der Universität des Saarlandes
vorgelegt von Shahira Nofal Ibrahim El Sayed
M.Sc., Pharmacist
Homburg 2007
Tag der mündlichen Prüfung: 1.Gutachter: Prof. Dr. Jens Rettig 2.Gutachter: Prof. Dr. Joachim Deitmer

Acknowledgment
I would like to thank my supervisor Prof. Dr. Jens Rettig who supported me and my work with advice and discussions and who had enough confidence in me to have me work on this special project. I am also very grateful for all the help that Dr. Ute Becherer gave me from begining to end. She has taught me all I know about fluorescence and I hope that she will continue to advise me on my future ventures. I would like to thank Dr. Detlef Hof for his extreme patience and for providing us with the tracking programs and analyzing methods that were used in this work and for realising all our wishes regarding computer programs. I also thank Dr. Ulf Matti for providing me with all the viral compounds used in this project and for helping me in many other ways. I am thankful for Dr. David Stevens’ help and support. He helped with very stimulating and lively discussions and for critical reading of this manuscript. I also thank Dr. Claudia Schirra, Dr. Kailai Duan and Mathias Pasche for their support in various situations and for making life easier. I would also like to thank Reiko Trautmann, Manuela Schneider, Carolin Bick, Ulrike Klemstein and Katrin Sandmeier for their support. Without them, this project would have gone on endlessly. My deepest thanks go to all those who helped with the smallest advice. Last but not least, I thank my husband Sameh for his support and extreme patience, my father, Nofal Ibrahim, for putting me on the highway to science; my mother, Nabiha Mahmoud, for absorbing all my stress even overseas and of course my angel, Shorouk, for making life look funny even when it wasn’t.

I hereby certify that the present work was solely performed using the methods
described therein. Any external information or data was cited in its respective place.
This work has not been published anywhere in its present form and is the means to
attain an academic grade.
Homburg, 9-10-2007 Shahira Nofal

Table of contents
List of contents List of contents IZusammenfassung III Abbreviations V 1. Introduction 1
1.1. Secretion: an essential process 1 1.2. Chromaffin cells: A model of regulated exocytosis. 2 1.3. Molecular changes prior to membrane fusion in chromaffin cells 4 1.4. Proteins involved in exocytosis 7 1.5. Proteins involved in docking 11 1.6. Proteins involved in priming 12 1.7. Total internal reflection fluorescence microscopy (TIRFM) 14 1.8. Aim of the work 17
2. Materials and Methods 19 2.1 Materials 19
2.1.1 Reagents 19 2.1.2 Enzymes 21 2.1.3 Plasmids 21 2.1.4 Media and solutions 21
2.1.4.1 Solutions for chromaffin cell preparation 21 2.1.4.2 Solutions for BHK cell culture/virus generation and activation 22 2.1.4.3 Solutions for TIRFM experiments 24 2.1.4.4 Solutions for whole-cell patch experiments 24
2.2 Methods 25 2.2.1 Bovine chromaffin cell preparation 25 2.2.2 Protocol for electroporation 26 2.2.3 Protocol for virus generation, activation and infection 26
2.2.3.1 Cultivation of BHK21 cells 26 2.2.3.2 Preparation of viral RNA 27
2.2.3.2.1 Linearization of DNA 27 2.2.3.2.2 In-vitro transcription 28 2.2.3.2.3 Quantification of RNA amount by electrophoresis 28
2.2.3.3 Electroporation of BHK21 cells with RNA 29 2.2.3.3.1 Virus titer test 29
2.2.3.4 Infection of bovine chromaffin cells 30
I

Table of contents
2.2.4 TIRFM 30 2.2.4.1 Setup 30 2.2.4.2 Experimental protocols 31
2.2.5 Analysis of movies 32 2.2.6 Analysis of caging diameter 35 2.2.7 Statistical analysis 38
3. Results 39 3.1 Effect of PMA on bovine chromaffin cells 39
3.1.1 Effect on secretion 39 3.1.2 Mobility of vesicles in cells treated with PMA 41
3.2 Determination of limits of mobility 44 3.2.1 PMA treatment increases the number of nearly immobile vesicles 47
3.3 Overexpresssion of Munc13-1 alone and fused with NPY-mRFP. 49 3.4 Effect of Munc13-1 on secretion from chromaffin cells 50
3.4.1 Munc13-1 increases secretory events observed in TIRFM 50 3.4.2 Munc13-1 overexpression increases the number of immobile vesicles 53
3.5 Overexpression of tetanus toxin light chain increases the mobility of vesicles 56
4. Discussion 60 4.1 The caging diameter: a novel method to analyze motion 60 4.2 Secreted vesicles motion is different 62 4.3 Priming leads to a reduction in the LDCV mobility 63 4.4 Mobility of LDCVs increases when priming is prevented 66 4.5 Perspectives 67
5. Summary 69 6. Literature 71 Curriculum Vitae 79 Publications 80
II

Zusammenfassung
Zusammenfassung Die Fusion von Vesikeln mit der präsynaptischen Membran ist der letzte Schritt bei
der Ausschüttung von Neurotransmittern und vielen weiteren Signalmolekülen. Vor
dem eigentlichen Fusionsereignis durchlaufen die synaptischen Vesikel mehrere
Reifungsprozesse, wobei die freien Vesikel erst an der Membran verankert (Docking)
und dann für die Fusion vorbereitet werden (Priming).
Exozytose lässt sich mit Hilfe von elektrophysiologischen Messungen sehr gut
untersuchen, dabei ist der Fusionsschritt direkt messbar, während für das Docking
und Priming bislang nur indirekte Rückschlüsse aus den Messungen möglich sind.
Totalreflexionsfluoreszenz-Mikroskopie (TIRFM) ermöglicht die Echtzeitvisualisierung
von fluoreszenten Partikeln mit einem großen Signal-Rausch-Verhältnis, weshalb
sich TIRFM für die direkte Untersuchung des Verhaltens von fluoreszenzmarkierten
Vesikeln direkt vor dem Fusionsschritt eignet.
In der vorliegenden Studie wurden „large dense-core vesicles“ (LDCVs) in bovinen
chromaffinen Zellen durch Überexpression von fluoreszenten Fusionsproteinen
markiert und die Bewegungen der Vesikel über die Zeit mittels TIRFM beobachtet.
Die Bewegungen der LDCVs wurden mit der in dieser Arbeit vorgestellten „caging
diameter“ Analyse untersucht, welche eine Quantifizierung der dynamischen
Änderungen des Bewegungsverhaltens von Vesikeln erlaubt. Dabei wurden
verschiedene Typen von Bewegungsformen identifiziert und die Vesikel
entsprechend in a) unbewegliche Vesikel, b) beschränkt bewegliche Vesikel, c)
beschränkt bewegliche und unbewegliche Vesikel, d) Vesikel mit gerichteter
Bewegung und e) Vesikel mit gemischten Bewegungsmustern klassifiziert.
Aus früheren Untersuchungen war bekannt, dass die Vesikel in chromaffinen Zellen
beim Erreichen der Plasmamembran dort immobilisieren und diese immobilen
Vesikel bevorzugt sekretiert werden. Als zugrundeliegender molekularer
Mechanismus wurde angenommen, dass während des Primingschrittes der SNARE-
Komplex zwischen Vesikel und Plasmamembran ausgebildet und das Vesikel
dadurch an der Plasmamembran verankert wird. Aus dieser Modellvorstellung ergibt
sich, dass Priming zu einer Immobilisierung der Vesikel führen sollte. In dieser Arbeit
wurden daher den als unbeweglich klassifizierten Vesikeln der geprimte Zustand und
den beschränkt beweglichen Vesikeln der gedockte ungeprimte Zustand zugeordnet.
Zur Überprüfung dieser Einordnung wurde das Priming durch Behandlung der
III

Zusammenfassung
bovinen chromaffinen Zellen mit Phorbolester oder durch Überexpression des
Primingfaktors Munc13-1 erhöht und die Veränderung der Vesikelbeweglichkeit
analysiert. Dabei wurde festgestellt, dass der Anteil an unbeweglichen Vesikeln im
Vergleich zu Kontrollzellen erhöht ist. Da Phorbolester-Behandlung sowie Munc13-1-
Überexpression lediglich die Zahl der geprimten Vesikel erhöhen und nur eine
Zunahme der Anzahl unbeweglicher Vesikel beobachtet wurde, lässt sich daraus
schließen, dass es sich bei den unbeweglichen Vesikeln tatsächlich um geprimte
Vesikel handelt. Es ist daher davon auszugehen, dass es sich bei den gedockten,
ungeprimten Vesikeln um die beobachteten beschränkt beweglichen Vesikel handelt,
während Vesikel mit gerichteter Bewegung den weder gedockten noch geprimten
Vesikeln des „depot pools“ zugeordnet werden können.
Zur weiteren Überprüfung dieser Hypothese wurde die Ausbildung des SNARE-
Komplexes und damit das Priming von Vesikeln durch Überexpression der leichten
Kette von Tetanusneurotoxin verhindert und die Auswirkung auf die Beweglichkeit
der Vesikel untersucht. Die leichte Kette von Tetanusneurotoxin ist der enzymatisch
aktive Teil, welcher das SNARE-Protein Synaptobrevin proteolytisch spaltet und
dadurch die Ausbildung des SNARE-Komplexes zwischen Vesikel und
Plasmamembran verhindert. Die Analyse der Vesikelbeweglichkeit zeigte eine
Erhöhung der Beweglichkeit. Der Anteil an unbeweglichen Vesikeln war verringert,
ebenso der Zeitanteil, welchen Vesikel im immobilen Zustand verbrachten. Dagegen
war die Verweildauer der Vesikel im beschränkt beweglichen Zustand erhöht. Dies
bestätigt die Hypothese, dass das Priming von Vesikeln mit einer Verringerung der
Vesikelbeweglichkeit durch die Ausbildung des SNARE-Komplexes einhergeht.
IV

Abbreviations
Abbreviations
α-SNAP α-Soluble NSF Attachment Protein ATP Adenosine Triphosphate BCC Bovine Chromaffin Cells BHK Syrian Hamster Kidney BoNT Botulinum Toxin BSA Bovine Serum Albumin BPB Bromophenolblue C. elegans Caenorhabditis elegans C Caged CA Catecholamines CD Caging Diameter CAPS Calcium-dependent activator protein for secretion cAMP cyclic adenosine monophosphate dATP Deoxyriboadenosine Triphosphate DNA Deoxyribonuleotide DAG Diacyl Glycerol DEPC Diethylpyrocarbonate
DMSO Dimethylsulphoxide
D Directed DTT 1,4-Dithiotheritol DMEM Dulbecco’s Modified Eagle’s Medium EM Electron microscope ER Endoplasmic Reticulum ECL Enhanced chemoluminescence EDTA Ethylene Diamine Tetra-Acetic Acid FFT Fast Fourrier Transform FCS Fetal Calf Serum Fig Figure GA Golgi Apparatus GFP Green Fluorescent Protein HC Heavy Chain HEPES 4-(2-hydroxyethyl)-1-piperazineethanesulfonic acid I Immobile IC Immobile-Caged
V

Abbreviations
IRES Internal Ribosome Entry Site LDCV Large dense-core vesicle LC Light Chain MSD Mean Square Displacement M Mixed mRFP monomeric Red Fluorescent Protein MHD Munc Homology Domain MOPS 4-Morpholinepropanesulfonic acid NGS Normal Goat Serum NSF N-ethylmaleimide sensitive factor PMA Phorbol-12-myristate-13-acetate PBS Phosphate Buffered Saline PM Plasma Membrane PCR Polymerase Chain Reaction PV Polyvirus PKA Protein kinase A PKC Protein kinase C RRP Readily Releasable Pool RNA Ribonucleic acid RNase Ribonucliease RT Room Temperature SEM Standard Error of Mean SCV Small Clear Vesicle SFV Semliki Forest Virus SM Sec1/Munc18 family SNAP-25 Synaptosome Associated Protein of 25 kD SNARE Soluble NSF Attachment Protein Receptor TeNt Tetanus Toxin TIRFM Total Internal Reflection Fluorescence Microscopy UPP Unprimed Pool VAMP Vesicle Associated Membrane Protein
VI

1. Introduction
1. Introduction
1.1. Secretion: an essential process
The human brain is an organ which stores, computes, integrates and
transmits information to all parts of the body. The information travels from one
neuron to another across the synapse when neurotransmitter molecules are
released from the presynaptic terminal by a process called exocytosis.
Exocytosis is the fusion of intracellular transport vesicles with the plasma
membrane resulting in either the release of their content extracellularly
(regulated exocytosis) or their addition to the plasma membrane (constitutive
exocytosis). Constitutive exocytosis allows addition of integral plasma
proteins to the plasma membrane for the maintenance of the membrane’s
function. Regulated exocytosis allows controlled release of membrane-
impermeable substances. The best known form of regulated exocytosis is the
release of neurotransmitters at the synaptic cleft via fusion of synaptic
vesicles with the plasma membrane (PM) of the neuron. Regulated
exocytosis of neurotransmitters occurs in response to a local increase of the
calcium concentration resulting from an action potential; this process occurs
in less than 1 ms. Neurotransmitters in the synaptic cleft then bind to specific
receptors on the postsynaptic neuron to elicit specific responses.
Neurotransmitters are contained in synaptic vesicles that are called small
clear vesicles (SCVs). Another type of vesicle exists which is called the large
dense core vesicle (LDCV). Neurons can contain both SCVs and LDCVs (De
Potter et al. 1997). Some endocrine and neuroendocrine cells contain LDCVs
which secrete their content into the intracellular space by regulated
exocytosis. Pancreatic β-cells secrete insulin via LDCVs into the bloodstream
via LDCVs to control several metabolic processes including glucose level in
the blood. Another type of cell showing regulated exocytosis is the
neuroendocrine chromaffin cell in the adrenal medulla which releases
adrenaline and noradrenaline, via LDCVs, into the blood in response to stress
or danger situations (fight or flight). These are only a few examples of cells
that possess a mechanism for regulated exocytosis. Due to the variety of cells
1

1. Introduction
possessing regulated exocytosis and the importance of this process to
maintain normal biological functions, it is imperative to understand the
mechanisms underlying exocytosis.
1.2. Chromaffin cells: A model of regulated exocytosis.
Neurons consist of a cell body, an axon and one or more dendrites. The distal
end of the nerve forms a synapse with the adjacent cell, where a 50 nm wide
synaptic cleft separates the presynaptic terminal from the target cell. Neurons
have a membrane potential of about -80 mV. When an action potential is
initiated, voltage-dependent Na+-channels open and Na+ flows into the cell,
depolarizing the cell. The action potential propagates in the direction of the
nerve terminal and when it reaches it, the depolarization causes voltage-
gated Ca2+-channels to open. The resulting increase of intracellular Ca2+
concentration causes vesicles to fuse with the plasma membrane and release
their neurotransmitter molecules into the synaptic cleft. These molecules
diffuse to the postsynaptic membrane and bind to specific receptor molecules
present on the postsynaptic cell, thereby eliciting a specific response
(Siegelbaum et al. 1991). (Siegelbaum and Kandel 1991).
For studying presynaptic function and neurotransmission, the neuron itself is
the appropriate cell and the most often used method to study
neurotransmission is to measure postsynaptic responses. However, this is an
indirect method and has shortcomings. First, the number of receptors on the
postsynaptic membrane is limited, thus when neurotransmitter saturates
these receptors, additional neurotransmitters released will not be observed in
the postsynaptic response. Second, the response measured at the
postsynaptic side arrives several milliseconds after the actual fast release of
the neurotransmitters. In order to circumvent these problems, a method to
measure directly release of neurotransmitters is required. However,
presynaptic terminals in mammalian synapses are usually quite small and
very difficult to access with electrodes or other probes. Several solutions have
been devised to circumvent this problem: the study of giant synapses such as
the lamprey giant reticulospinal synapse (Low et al. 1999), the goldfish retinal
2
1. Introduction
bipolar neurons (Heidelberger et al. 1994), the glutamatergic calyx of Held
giant synapse in the brainstem (Borst et al. 1995) and the ribbon-type
synapses of inner hair cells (Beutner et al. 2001). Another solution was
offered by Rosenmund and Stevens (1996). They prepared a neuronal culture
in which single neurons grow and form synapses with themselves (autaptic
culture). In this way both excitatory and inhibitory synapses can be studied
practically from all regions of the brain. Another problem to overcome is the
difficulty of measuring and controlling presynaptic Ca2+ concentrations in most
neurons . Therefore another system has
been extensively used: the adrenal chromaffin cell (Voets et al. 2000; Rettig
et al. 2002). Regulated exocytosis can be measured with different methods
with high time resolution in chromaffin cells and the experimental conditions
can be controlled to a great extent.
(Schneggenburger and Neher 2000)
Neurons and chromaffin cells originate from the same precursor cells during
embryonic development. These precursor cells differentiate into neurons if
they are induced by fibroblast growth factor and nerve growth factor. When
they are induced by glucocorticoids they differentiate into chromaffin cells
(Cole et al. 1995). Chromaffin cells migrate from the neural crest to the
adrenal medulla during embryonic development. The adrenal medulla
represents the inner part of the adrenal glands (a pair of endocrine organs
situated cranially to the kidneys). The adrenal glands secrete steroid
hormones (mineralocorticoids, glucocorticoids as well as androgens) from
their cortices and catecholamines (CA) from the medulla, into the blood
stream. Dopamine, adrenaline and noradrenaline are called catecholamines
because they all contain a catechol (hydroxyl benzene) and an amino group.
These molecules are also synthesized in the brain and are used for
neurotransmission in neurons. Chromaffin cells can be separated into
adrenaline secreting and noradrenaline secreting cells. Additionally, there
seems to be evidence for a third type which secretes both adrenaline and
noradrenaline (Cahill et al. 1996). The adrenal medulla is a part of the
sympathetic nervous system. The stimulus for CA release from chromaffin
cells originates from sympathetic nerve endings which release acetylcholine.
Acetycholine, an important neurotransmitter of the peripheral nervous system,
3

1. Introduction
causes membrane depolarization and results in the opening of voltage-gated
Ca2+ channels. The resulting Ca2+ influx triggers exocytosis.
Chromaffin cells share common features with neurons such as the capability
to generate action potentials, the presence of fast synchronized transmitter
release -although the release time constant was found to be 150-1000 ms
(Kasai 1999)- and expression of the major proteins involved in exocytosis
(Kits et al. 2000) . However, the anatomy of the chromaffin cell is
different from that of the neuron. Chromaffin cells are spherical (Fig. 1) and
do not exhibit specific zones for vesicle release (active zones) such as those
present in neurons. Also, some proteins that are essential for exocytosis in
neurons are absent in chromaffin cells such as Munc13-1 (which will be
mentioned in a later chapter). Nevertheless, studies of the proteins involved in
regulated exocytosis in the chromaffin cell have allowed a better
understanding of the molecular mechanisms underlying exocytosis.
(Kits and Mansvelder 2000)
Fig 1: EM of a chromaffin cell: it contains 20.000 to 30.000 vesicles that store adrenaline or noradrenaline. The vesicles darken and become electron dense when treated with several chromium salts whereby their names: large dense core vesicles.
1.3. Molecular changes prior to membrane fusion in chromaffin cells
Before a vesicle fuses with the plasma membrane, it has to undergo a
number of molecular changes (Fig. 2). Vesicles originate in the endoplasmic
reticulum (ER) and mature in the Golgi apparatus (GA). They are then loaded
with neurotransmitters via transporters already present in the vesicle
membrane such as vesicular amine transporter. At this point the vesicle
resides in the depot pool. The depot pool is represented by vesicles that are
in the cytoplasm, 300 nm away from the PM as visualized by electron
microscopy (EM).
4

1. Introduction
Vesicles leave the depot pool, approach the PM and become “docked”.
Docked vesicles are located close to the PM (from 0 to 300 nm from the PM
as seen in EM). Docking was shown to be a reversible process in neurons
and neuroendocrine cells (Oheim et al. 1998; Zenisek et al. 2000). After
docking, vesicles must undergo a maturation step called “priming”, which
renders them fusion competent. As for docking, priming was shown to be a
reversible process (Rettig et al. 2002) . (Rettig and Neher 2002)
After a local increase of [Ca2+]i, the primed vesicle fuses with the PM and its
content is released in the extracellular space. Much later the membranes of
the vesicles which fused with the PM are taken up via endocytosis and the
vesicle can either be recycled via several endosomes and finally to the GAor
is directly reloaded with neurotransmitters during the kiss and run mechanism
(Artalejo et al. 2002).
Extracellular space
Fig. 2: Secretory vesicle cycle, steps leading to exocytosis. The vesicles are budded from the GA (7), loaded with neurotransmitters (8) then docked to the plasma membrane (1) and primed (2). Upon increase of Ca2+ concentration, exocytosis occurs (3). The vesicle is then endocytosed (4), acidified and translocated at a later time to the Golgi apparatus via endosomes to reenter the cycle (5). (Modified from www.uniklinik-saarland.de/physiologie/.)
The sizes of the depot and docked pools have been determined using EM.
The docked pool consists of both primed and unprimed vesicles. The size of
the primed pool and the kinetics regulating it were determined using
membrane capacitance measurements. The PM has electrical properties
similar to that of a capacitor. Thus, changes in the capacitance of the cell
5
1. Introduction
reflect the changes in the membrane’s surface area. Upon exocytosis, the
vesicle membrane is incorporated into the PM, increasing the area of the PM,
resulting in an increase in capacitance.
A
[Ca2+
](µm
) C
m(p
F)
B
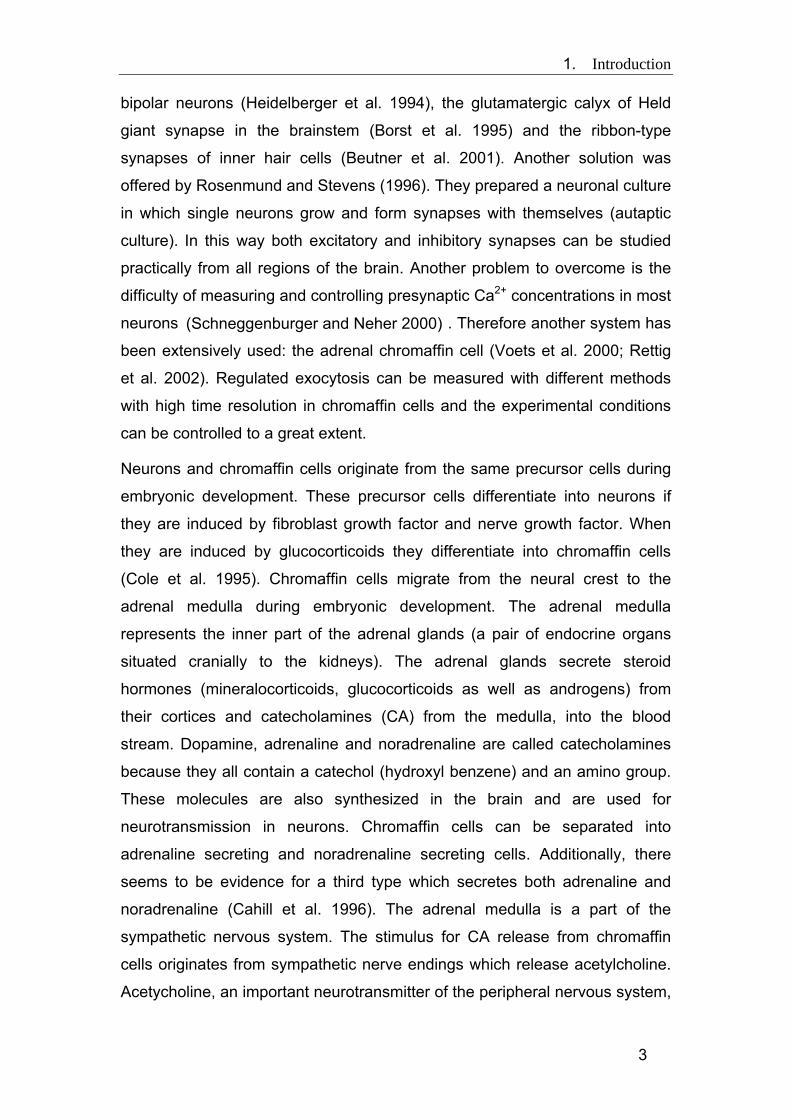
Fig. 3: (A) The response to a step elevation of [Ca2+]i from 300 nM to 20 µM consists of a triphasic capacitance increase. Membrane capacitance increases in proportion to the number of vesicles that fuse with the plasma membrane. The different components of capacitance response reflect the different pools of vesicles as assigned by the color code. (B) The depot pool contains about 2.000 vesicles. 850 vesicles are morphologically docked and subdivided into the UPP (about 650 vesicles) and the SRP and RRP (Rettig and Neher 2002).
In chromaffin cells, increasing intracellular [Ca2+] using flash photolysis of
caged Ca2+ lead to an increase in the capacitance of the cell that can be
divided into three components (Fig. 3A).
6

1. Introduction
The first two components called together “exocytotic burst” can each be fit
with one time constant, the first “fast burst” corresponding to the rate of
release of a readily releasable pool (RRP, yellow in Fig. 3) and the second
“slow burst” corresponding to the rate of release of a more slowly releasable
pool (SRP, green). These two pools correspond to the primed pool. The third
and much slower sustained component represents the release of vesicles
coming from the docked but unprimed pool (UPP, red) that undergo priming
and then fuse. The kinetics of docking and priming (or undocking and
unpriming) were calculated from capacitance recording. k0 and k-0 represent
the rates of docking and undocking, respectively. k1 and k-1 are the rates of
priming and unpriming and k2/k-2 are the rates of turnover between the RRP
and SRP.
To date, no method has been developed to obtain direct information about
docking and priming kinetics. Therefore, a technique that allows the real-time
visualization of the vesicles would be the method of choice to observe the
different molecular states of the vesicle over time.
The different processes leading to exocytosis are a result of different
molecular events, such as phosphorylation of ATP, Ca2+-binding and
conformational changes in the SNARE complex. Various proteins enhance or
inhibit the different steps leading to exocytosis (translocation of vesicles,
docking, and priming); these will be described in the next chapter.
1.4. Proteins involved in exocytosis
For exocytosis to occur, the lipid bilayers of the vesicle and the plasma
membrane have to fuse. Therefore the repulsive forces of the opposing polar
headgroups need to be overcome (Oberhauser et al. 1992). These forces
may be overcome by fusion-mediating proteins. Many proteins involved in
membrane fusion have been identified and have been found to consist of
groups of conserved proteins (Jahn et al. 2003). Nevertheless, the
mechanisms underlying the function of many of these proteins are still
unknown. The main players in exocytosis are the SNARE proteins.
7

1. Introduction
SNARE proteins are a large protein superfamily consisting of more than 60
members which contain domains that are highly conserved from yeast to
mammals (Pelham 1999). The primary role of SNARE proteins is to mediate
fusion of cellular transport vesicles with the PM or with a target compartment
(such as a lysosome). SNAREs can be divided into two categories: vesicle- or
v-SNAREs, which are incorporated into the membranes of transport vesicles
during budding, and target- or t-SNAREs, which are located in the
membranes of target compartments. Recent classification however takes
account the structural features of the SNARE proteins and divides them into
R-SNAREs and Q-SNAREs respectively (Chen and Scheller 2001). Both
classifications (v/t and Q/R) are widely used. SNAREs are small, abundant
and mostly plasma membrane-bound proteins. Although they vary
considerably in structure and size, all share a segment in their cytosolic
domain called a SNARE motif that consists of 60-70 amino acids that are
capable of reversible assembly into tight, four-helix bundles called "trans"-
SNARE complexes. The best-studied SNAREs are the neuronal SNAREs.
These SNAREs are the targets of bacterial neurotoxins responsible for
botulism and tetanus. In neurons, the readily-formed metastable "trans"
complexes are composed of three SNAREs: syntaxin 1 and SNAP-25
resident in cell membrane (t-SNAREs) and synaptobrevin (a v-SNARE; also
referred to as vesicle-associated membrane protein or VAMP) anchored in
the vesicular membrane. Syntaxin and synaptobrevin are anchored in their
respective membranes by their C-terminal domains, whereas SNAP-25 is
tethered to the PM via several cysteine-linked palmitoyl chains (Washbourne
et al. 2001).
8
1. Introduction
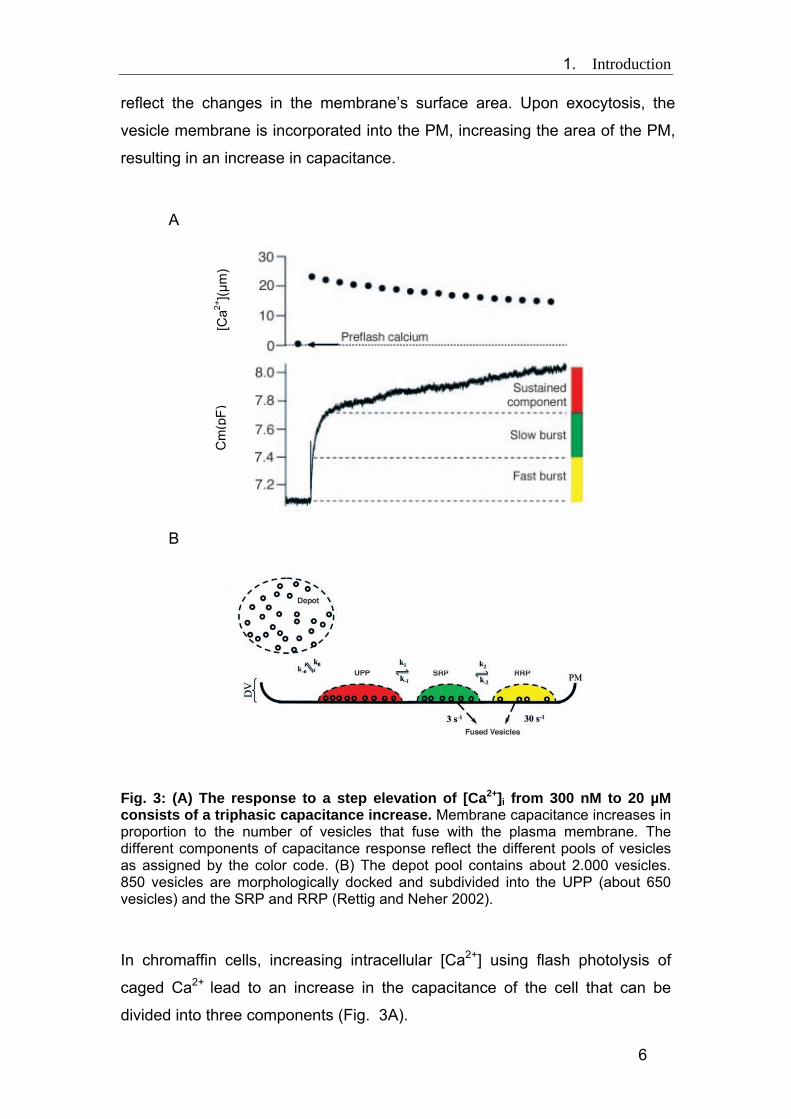
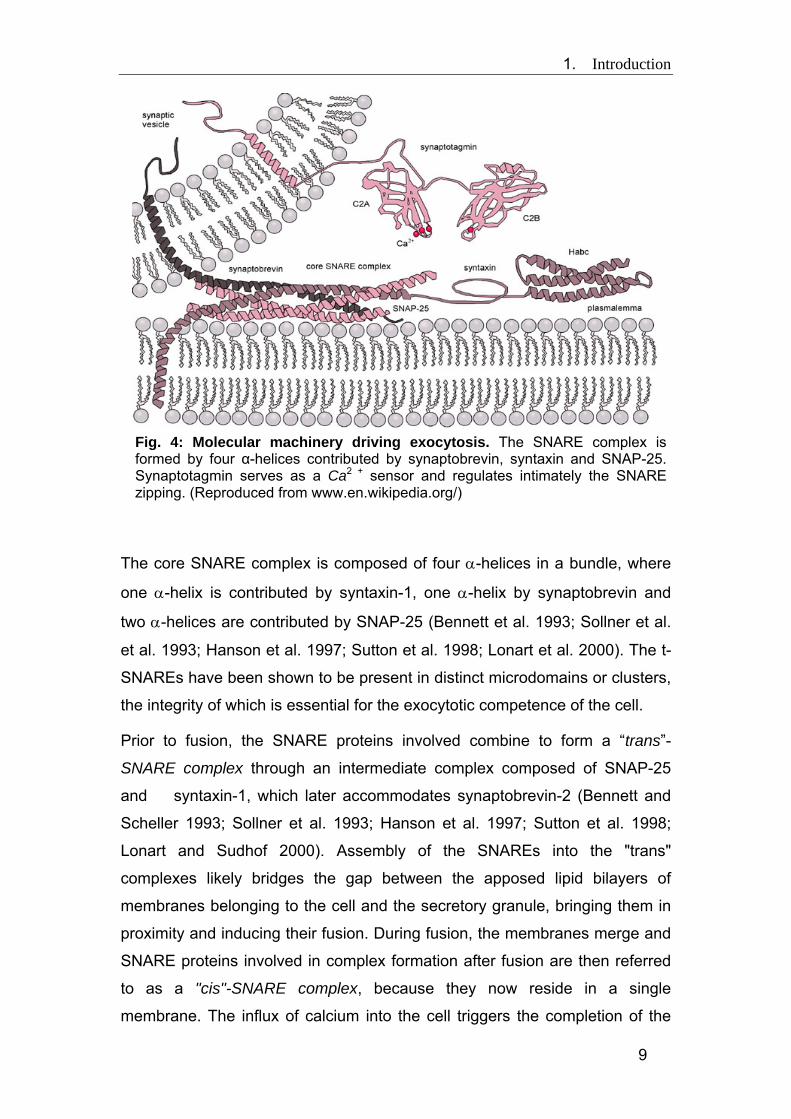
Fig. 4: Molecular machinery driving exocytosis. The SNARE complex is formed by four α-helices contributed by synaptobrevin, syntaxin and SNAP-25. Synaptotagmin serves as a Ca2 + sensor and regulates intimately the SNARE zipping. (Reproduced from www.en.wikipedia.org/)
The core SNARE complex is composed of four α-helices in a bundle, where
one α-helix is contributed by syntaxin-1, one α-helix by synaptobrevin and
two α-helices are contributed by SNAP-25 (Bennett et al. 1993; Sollner et al.
et al. 1993; Hanson et al. 1997; Sutton et al. 1998; Lonart et al. 2000). The t-
SNAREs have been shown to be present in distinct microdomains or clusters,
the integrity of which is essential for the exocytotic competence of the cell.
Prior to fusion, the SNARE proteins involved combine to form a “trans”-
SNARE complex through an intermediate complex composed of SNAP-25
and syntaxin-1, which later accommodates synaptobrevin-2 (Bennett and
Scheller 1993; Sollner et al. 1993; Hanson et al. 1997; Sutton et al. 1998;
Lonart and Sudhof 2000). Assembly of the SNAREs into the "trans"
complexes likely bridges the gap between the apposed lipid bilayers of
membranes belonging to the cell and the secretory granule, bringing them in
proximity and inducing their fusion. During fusion, the membranes merge and
SNARE proteins involved in complex formation after fusion are then referred
to as a "cis"-SNARE complex, because they now reside in a single
membrane. The influx of calcium into the cell triggers the completion of the
9

1. Introduction
assembly reaction, which is thought to be mediated by an interaction between
the putative calcium sensor, synaptotagmin, with membrane lipids and/or the
partially assembled SNARE complex. According to the "zipper" hypothesis
(Hanson et al. 1997; Hay and Scheller 1998), complex assembly starts at the
N-terminal parts of SNARE motifs and proceeds towards the C-termini that
anchor interacting proteins in membranes. The disassembly of the SNARE
complex is catalysed by NSF and α-SNAPs to recycle the SNAREs for
another round of fusion. Before fusion, the trans- complex is proposed to
change from a loose into a tight state (Xu et al. 1999). This would be
consistent with the presence of SRP, reflecting the loose state, from which
the vesicles are able to fuse at lower rates. The tight state would support the
fast exocytosis from the RRP (Xu et al. 1999). ; Rettig and Neher 2002)
As mentioned above the neuronal SNARE proteins are highly sensitive to
clostridial neurotoxins. These neurotoxins share common features: they
weigh 150-kD and are made up of two parts, a 100-kD heavy chain (HC) and
a 50-kD light chain (LC). The HC mainly serves as the delivery system for the
LC component. The LC is the protease component of the toxin and cleaves a
specific SNARE protein when it is not in the SNARE complex. Botulinum toxin
(BoNt) is produced by the bacterium Clostridium botulinum and has seven
serologically distinct toxin types from A to G. BoNt/A and E cleave SNAP-25,
BoNt/C cleaves syntaxin while BoNt/B, D, F and G cleave synaptobrevin (Fig.
5). This blocks exocytosis of neurotransmitters and leads to total paralysis
(Breidenbach et al. 2005). (Breidenbach and Brunger 2005).
Tetanus toxin (TeNT) is produced by the vegetative spore of Clostridium
tetani in anaerobic conditions. The LC cleaves synaptobrevin I and II and
cellubrevin (Schiavo et al. 2000). This cleavage prevents synaptobrevin from
forming the SNARE complex and exocytosis is blocked (Schiavo et al. 2000).
10

1. Introduction
Fig. 5: Clostridial neurotoxins. Each toxin specifically cleaves a SNARE protein (Sutton et al. 1998).
1.5. Proteins involved in docking
Membrane capacitance measurements cannot give information about
docking, thus not much is known about the proteins that mediate this step.
Additionally, some proteins seem to have more than one function (docking
and priming) or even opposite ones (priming and unpriming). One of these
proteins is Munc18-1.
Munc18-1 is a member of the sec1/Munc18 (SM) family. It is expressed at
synapses and binds to the N-terminal Habc domain of syntaxin1 outside the
SNARE motif, thereby stabilizing the closed conformation of syntaxin1 and
preventing its interaction with VAMP and SNAP-25 (Dulubova et al. 1999).
Thus if Munc18-1 were deleted, secretion would increase. Yet, the opposite
was observed in chromaffin cells (Voets et al. 2001). It was then suggested
that Munc18-1 has a chaperone function by stabilizing syntaxin at the PM
(Toonen et al. 2005).
However, it is unclear how the interaction of Munc18-1 with syntaxin mediates
docking. Hence, other interaction partners might be involved such as Mint and
DOC2 (Brose et al. 2000; Schutz et al. 2005). These interactions seem to be
important for docking.
The Rab3-RIM complex may also mediate docking. It was shown that
overexpression of Rab3s in PC12 cells led to an increase in the number of
docked vesicles (Martelli et al. 2000) whereas its depletion led to a reduction
in secretion (Schluter et al. 2004; Schluter et al. 2006). Similarly, a RIM-1
11

1. Introduction
knockout leads to a decrease in the number of docked vesicles (Schoch et al.
2002; Calakos et al. 2004). Finally, it is possible that docking is coordinated
by other proteins such as bassoon and piccolo (Garner et al. 2000).
1.6. Proteins involved in priming
Several factors affect priming whether by increasing the rates of priming (k1
and/or k2, fig. 3) or by decreasing the rates of unpriming (k-1 and/or k-2, fig. 3).
The complexins, a family consisting of two isoforms, complexin I and II,
modulate the priming rate. Genetic deletion of complexin I and II greatly
decreased release efficiency. Release in hippocampal neurons could be
rescued by increasing the extracellular Ca2+ concentration (Reim et al. et al.
2001). This result was also obtained in mast cells following siRNA knockdown
of complexin II (Tadokoro et al. 2005). In contrast, it has been found that
overexpression of complexin in chromaffin cells led to a reduction in secretion
and to a faster time course of single secretion events (Archer et al. 2002). So
it might be possible that complexin plays also a role in fusion pore opening.
Hence, this protein seems to have more than one function and
electrophysiological methods have not allowed the determination of its
precise function.
Protein kinase A (PKA) was shown to promote priming by decreasing k-1.
When the intracellular Ca2+ concentration increases, the production of cyclic
adenosine monophosphate (cAMP) increases which in turn activates PKA. It
was shown that constitutive PKA activity results in the phosphorylation of
SNAP-25, a process necessary for the maintenance of a large number of
vesicles in the primed pool (Nagy et al. 2004).
Protein kinase C (PKC) was shown to decrease k-1 thus promoting priming. It
is activated by an increase in the intracellular Ca2+ concentration, since Ca2+
binds to PKC’s C2 domains. Also, diacyl glycerol (DAG, a secondary
messenger) and phorbol esters such as phorbol myristate acetate, that
imitate DAG in its action, activate PKC (Newton 1997). Both DAG and phorbol
esters bind to the C1 domain of PKC and lead to its translocation to the
plasma membrane. PKC may act through phosphorylation of SNAP-25 at Ser
187 (Nagy et al. 2002).
12

1. Introduction
The Munc13’s are a family of proteins consisting of Munc13-1, -2, -3 and -4.
Munc13’s appear to be required for priming (Aravamudan et al. 1999;
Augustin et al. 1999; Richmond et al. 1999; Brose et al. 2000). They are the
mammalian homologues of unc-13, a large family of proteins originally found
in C. elegans (Brenner 1974). Munc13’s structure is highly conserved.
C2 C2C2C1 MHD1 MHD21
64 567 616 683 768 1106 1248 1357 1526 1571 1665
1735
Fig. 6: Munc 13-1 Domain structure. For detailed explanation, see text.
They contain two “Munc Homology Domains” (MHD), a C1-domain and two
(Munc13-1, -2 and -3) or three (Munc13-4) C2-domains. The latter function as
Ca2+/phospholipids-binding domains. The C1-domain is functionally very
similar to the C2-domain of PKC which is the DAG binding domain (Betz et al.
1998; Ashery et al. 1999; Rhee et al. 2002). Like PKC, Munc13’s are
displaced to the plasma membrane after binding DAG and its synthetic
analogues, the phorbol esters. Munc13-1 is thought to function by interacting
with syntaxin1. This interaction appears to displace Munc18 from the
N terminus of syntaxin1 and thus allows syntaxin1 to interact with SNAP25
and synaptobrevin. Then core complex assembly can occur (Brose et al.
2000). Recently, it has been shown that point mutations in the MHDs and in
the C-terminal region of the C2-domain binding regions to syntaxin1, reduce
the function of Munc13 (Madison et al. 2005; Stevens et al. 2005). The
Munc13 isoforms also contain a calmodulin binding site. The formation of a
calmodulin/Munc13 complex may allow a Ca2+ sensing/effector which allows
modulation of synaptic vesicle priming and synaptic efficacy in response to a
change of [Ca2+]i (Junge et al. 2004). For example, during sustained synaptic
activity -thus high [Ca2+]i-, Munc13’s efficacy in keeping syntaxin 1 in its open
conformation may be enhanced through its binding to calmodulin. Hence, the
Calmodulin/Munc13 complex could be one molecular target of Ca2+ action
during sustained synaptic activity and thus mediate short term plasticity
(Junge et al. 2000), which is dependent on residual [Ca2+]i (Zucker 1999).
13

1. Introduction
In chromaffin cells, overexpression of Munc13-1 nearly tripled the amount of
secretion and significantly increased the size of the primed pool (Ashery et al.
2000). However, Munc13-1 was not detected in chromaffin cells (Ashery et al.
2000) and the amount of secretion from chromaffin cells of Munc13 triple-
knockout mice was similar to that of wild type mice (Stevens and Rettig,
unpublished results). Therefore, it is unclear if Munc13-1 plays a role in
priming LDCVs in chromaffin cells (the role of Munc13-4 for example needs to
be elucidated) or if other priming factors are responsible for priming in
chromaffin cells. Calcium-dependent activator protein for secretion (CAPS)
was also considered to be a priming factor (Wassenberg and Martin 2002).
However, it has recently been shown that CAPS is involved in the loading of
these vesicles with neurotransmitters (Speidel et al. 2005). Another possibility
would be that priming is a constitutive process in chromaffin cells.
On the other hand, in neurons, Munc13-1 is considered the priming factor par
excellence. It was indeed shown by Augustin et al. (1999) that in Munc13-1
knock-out mice, there was a 90% reduction of readily releasable vesicles and
evoked transmitter release in excitatory neurons releasing glutamate.
1.7. Total internal reflection fluorescence microscopy (TIRFM)
Although a large number of agents that affect priming are now known, no
method has allowed the direct observation of the priming event or the
differentiation between docked and primed vesicles.
Several imaging techniques were developed in recent years to visualize
dynamic changes occurring in living cells. TIRFM is one of them. It relies on
the fact that light travels differently in two media with different refractive
indices.
When the light hits the interface between two different media it is refracted
into the second medium at an angle that is different from the incident angle
according to Snell’s law: n1sinθ1=n2sinθ2, where n1 and n2 are the refractive
indices of the two media and θ1 and θ2 are the angles of incidence and
refraction respectively (Fig. 7A). When the incident angle reaches a critical
14

1. Introduction
angle, light is totally refracted in the interface. The critical angle depends on
the ratio between the refractive indices: θc=sin-1(n2/n1) (Fig. 7A). Beyond this
angle all light is reflected. However, some light escapes this reflection and
extends in the z direction thus creating a thin electromagnetic field. The
strength of this field, also called evanescent field, decreases exponentially
with increasing penetration depth and extends only a few hundred
nanometers into the second medium (having the lower refractive index) (Fig.
7B).
A
n1
B
Fig. 7: Principle of TIRFM. (A) Only granules close to the evanescent wave (blue strip) light up. For more details, see text. (B) Intensity (Iz/Io) decays exponentially with increasing penetration depth (dp).
The main advantage of TIRFM over epifluorescence and confocal microscopy
is the illumination of only a thin section of the specimen whereas the rest of
the specimen is not illuminated. Due to this, no background fluorescence is
observed and we can obtain pictures of labeled particles with a very high
signal-to-noise ratio (Almers et al. 2001; Axelrod et al. 2001; Oheim et al.
15

1. Introduction
2001; Toomre et al. 2001). Also, this decreases the danger of
photobleaching. TIRFM is also a relatively inexpensive and low energy
consuming technique compared to two-photon microscopy. This method has
been used for example to qualify the types of movements made by particles,
to visualize exocytosis in real-time recordings and recently to visualize single
protein molecules. Therefore TIRFM seems to be the method of choice to
visualize fluorescent vesicles as they undergo the different molecular
changes (docking, priming, fusion).
16

1. Introduction
1.8. Aim of the work
The molecular changes leading to fusion are processes that are still
investigated by many. As mentioned above the number of vesicles in the
primed pool was determined by measuring the capacitance increase in the
exocytotic burst and calculating how many vesicles this increase corresponds
to. Also the rates of docking and priming were determined by using fits to the
different components of the triphasic capacitance increase. Still, membrane
capacitance measurements do not give direct information on priming and
docking, thus it is necessary to develop a method that allows the real-time
observation of these processes. TIRFM should be the method of choice to
visualize LDCVs as they undergo changes from one molecular state to the
other.
Several groups have been able to identify different types of movements of
vesicles. Oheim (2001) showed that vesicles could be immobile, restricted in
motion or could have a directed motion.
Furthermore, studies (Steyer et al. 1997; Oheim et al. 1999) have shown that
as vesicles docked to the PM, their mobility was reduced, as compared to
their mobility when they were further away from the PM. This is consistent
with the "zipper" hypothesis (Hanson et al. 1997; Hay and Scheller 1998),
which states that SNARE complex assembly results in the attachment of the
vesicle to t- SNAREs via v-SNAREs which anchors the vesicle to the PM
(Fig. 8). Yet no serious attempt has been made to assign these different types
of motion to the distinct molecular states.
Fig. 8: Zipper hypothesis. The vesicle docks on the PM then undergoes the first priming steps when the SNARE comples starts to form. Upon full priming and zipping of the SNARE proteins, the vesicle is tightly attached to the PM and ready to fuse. Upon local increase in [Ca2+]i, exocytosis occurs (modified from Chen and Scheller 2001).
17
1. Introduction
We propose a model where, as the SNARE is assembled during priming, the
vesicle becomes tightly attached to the PM and therefore is not able to move
freely.
To verify this hypothesis, I specifically promoted priming using two
independent methods:
1- Treating bovine chromaffin cells with phorbol myristate acetate (PMA)
which was found to increase the pool of primed vesicles without affecting the
size of docked vesicles (Gillis et al. 1996; Smith et al. 1998).
2- Overexpression of Munc13-1 which was found to triple the secretion in
chromaffin cells by increasing the size of the RRP without affecting the size of
docked but unprimed vesicles (Ashery et al. 2000).
To confirm our observations about priming, I used a virus containing TeNT-
LC-GFP to prevent the priming reaction and I expected to observe an
opposite effect to that observed in the primed cells.
To visualize the LDCVs, I stained bovine chromaffin cells with neuropeptide Y
fused with the monomeric red fluorescent protein (NPY-mRFP). NPY was
found to be specifically targeted to LDCVs (Nagai et al. 2002). To track the
vesicles, we used a homemade tracking program and a new method of
analysis was devised to allow the observation of the dynamic changes that
the vesicle is undergoing over time as opposed to the analysis of the Mean
Square Displacement, which allows only an overall description of the mobility.
I also ascertained that exocytosis measured by TIRFM is similar to exocytosis
measured by membrane capacitance recordings.
Using these different protocols of priming and unpriming, my aim is to
distinguish between docked and primed vesicles using their mobilities as a
tool of differentiation.
18

Materials and methods
2. Materials and Methods
2.1 Materials
2.1.1 Reagents
Acetic acid Roth
Agarose for DNA electrophoresis Roth
Agarose for RNA electrophoresis Sigma
Albumin Sigma
2-Amino-2-(hydroxymethyl-)-1,3-propantriol (Tris) Roth
Aprotinin Sigma
L-aspartic acid Sigma
Bovine serum albumin (BSA) Sigma
Bromphenolblue (BPB), sodium salt Serva
Cesium hydroxide Sigma
Chloroform Fluka
dATP Roth
dCTP Roth
dGTP Roth
DMEM (Cat no. 31966-021) Invitrogen
Dithiotreitol (DTT) Sigma
D-Glucose Merck
Diethylpyrocarbonate (DEPC) Sigma
DNase Roche
ECL reagent GEhealthcare
19

Materials and methods
EDTA Sigma
Ethanol Roth
Ethidium bromide Invitrogen
Fetal calf serum (FCS) Invitrogen
Formaldehyde 37% Sigma
Formamide Sigma
Glutamic acid Sigma
Glycerol Sigma
H2O Sigma
ITS-X Invitrogen
L-cysteine Sigma
4-Morpholinepropanesulfonic acid (MOPS) Sigma
Mounting medium Vectashield
Normal goat serum (NGS) Invitrogen
NE-buffer 10x Biolabs
N-(2-Hydroxyethyl)-1 piperazine-N’-(ethanesulfonic acid)
(HEPES) Sigma
Nitrocellulose membrane (0.2 μm pore size) Roth
OptiMemI Invitrogen
PBS Invitrogen
10x PCR Buffer Sigma
Penicilline/Streptomycine Invitrogen
Phenol for DNA purification Sigma
Phenol for RNA purification Roth
Phorbol 12-myristate 13-acetate (PMA) Sigma
2-Propanol Roth
RNase Inhibitor Roche
20

Materials and methods
Skimmed milk powder Naturaflor®
Tetrodotoxin Sigma
Triton® X-100 Serva
Trypsin-EDTA 10x Invitrogen
Trypsin Inhibitor Sigma
Tryptosephosphate Invitrogen
Whatman-3 MM-paper Whatman
Xylen cyanol FF Sigma
All other chemicals were ordered from Merck
2.1.2 Enzymes
Chymotrypsin Sigma
Collagenase CLS Biochrom AG
Proteinase K Qiagen
RedTaq-Polymerase Sigma
Trypsin Invitrogen
SpeI Biolabs
SP6-RNA-Polymerase Roche
2.1.3 Plasmids
The plasmids pSFV1 and pSFV1-PV-IRES were provided by U. Matti (Department of
Physiology, Saarland university, Homburg, Germany).
2.1.4 Media and solutions
2.1.4.1 Solutions for chromaffin cell preparation
Locke’s
154 mM NaCl
5.6 mM KCl
21

Materials and methods
0.85 mM NaH2PO4 x H2O
2.15 mM Na2HPO4 x H2O
10 mM glucose
pH 7.4 ; ≈ 312 mosm
Collagenase solution
290 U/ml locke’s solution.
Inactivating solution
10% FCS in locke’s solution.
Medium
for two 6-well plates:
30 ml DMEM
300 μl ITS-X
120 μl Pen./Strep.
→ freshly prepared; 37°C, 9% CO2
2.1.4.2 Solutions for BHK cell culture/virus generation and activation
OptiMemI + 2,5%FCS
Tryptosephosphate 100 ml
HEPES 1M 20 ml
FCS 25 ml
Pen. / Strep. 1 ml
filled up with OptiMemI to 1000 ml
→ sterile/ 4°C
22
Materials and methods
OptiMemI + 5%FCS
Tryptosephosphat 15 ml
HEPES 1M 3 ml
FCS 7,5 ml
Pen / Strep 150 µl
filled up with OptiMemI to 150 ml
→ sterile/ 4°C
OptiMemI without FCS, + 0,2% BSA
OptiMemI 44ml
Tryptosephosphat 5ml
HEPES 1M 1ml
Pen / Strep 50µl
BSA 0,1g
→ sterile/ 4°C
Aprotinin
6 mg/ ml in HBS (aliquots, -20°C)
Chymotrypsin
2 mg/ ml in HBS (aliquots;-20°C)
Trypsin/ EDTA 10x
diluted 1:10 in PBS
DEPC-H2O 0.1 %
1ml DEPC
in 1l ddH2O
23

Materials and methods
5x Mops
3,28 g Sodium acetate
20,6 g MOPS
diluted in 800 ml DEPC-H2O; pH 7.0 + 10 ml 0.5 M EDTA pH 8.0
filled up with DEPC-H2O to 1000 ml → sterile filtered;stored in the dark Loading buffer for RNA gel:
10 ml 5 x MOPS (1x)
8,5 ml 37%-Formaldehyde (6,5%)
25 ml Formamide (50%)
2,5 ml Glycerol (5%)
10 µl 0.5M EDTA pH8 (0,1mM)
0,0125 g BPB (0,025%)
2,75 ml H2O
→ aliquots ; -20°C
2.1.4.3 Solutions for TIRFM experiments
Ringer: 140 mM NaCl, 2.4 mM KCl, 2 mM CaCl2, 1 mM MgCl2, 10 mM Glucose, 10
mM HEPES (pH 7.3)
High K+: 52.4 mM NaCl, 90 mM KCl, 3 mM CaCl2, 10 mM Glucose, 10mM HEPES
(pH 7.3)
2.1.4.4 Solutions for whole-cell patch experiments
Extracellular solution:
146 mM NaCl, 2.4 mM KCl, 10 mM HEPES, 1.2 mM MgCl2, 2.5 mM CaCl2, 10 mM
Glucose and 10 mM NaHCO3 (pH 7.4).
24

Materials and methods
Pipette solution:
160 mM L-aspartic acid, 1 mM MgCl2, 2 mM MgATP, 0.3 mM Na2GTP, 10mM
HEPES (pH 7.2).
2.2 Methods
2.2.1 Bovine chromaffin cell preparation
The adrenal glands were obtained from a slaughterhouse and cleaned of all
connective tissue with scissors. The glands were perfused with 10 ml Locke’s
solution through the adrenal vein and put in a shaking water bath for 10 min. This
step was repeated 4-6 times until all the blood was washed out of the glands. I then
proceeded with the digestion of the glands with Locke’s solution containing 290 U/ml
collagenase. Each gland was perfused with 10 ml enzyme solution and put in a
shaking water bath for 14 min; this step was repeated with the gland positioned on its
opposite side. The digestion was then stopped by perfusing the glands with 10 ml
10% FCS, then the glands were cut in two halves to expose the medulla. The
medulla was carefully removed with a forceps and transferred to a Petri dish
containing a few milliliters of Locke’s solution. The medulla was then cleaned of any
traces of blood vessels or impurities. The medulla was shredded with scissors and
then transferred to a 50 ml falcon tube and completed to 20 ml with Locke’s solution.
The tissue was gently shaken for 1 min and centrifuged at 700 rpm for 2 min, after
which the supernatant was discarded and the tissue was resuspended in Locke’s
solution, and then dispersed by passing through a nylon mesh. Locke’s solution was
added to bringing the resulting cell suspension to a final volume of 20 ml. The cell
suspension was then centrifuged at 700 rpm for 7 min. After each centrifugation, the
resultant supernatant was discarded and the pellet was resuspended in 10 ml of
Locke’s solution and transferred to a 15 ml falcon tube. The tube was centrifuged 3-4
times at 600 rpm for 5 min and one last time at 300 rpm for 5 min. Each time, the
supernatant was discarded and the resultant pellet was resuspended in an
appropriate amount of modified DMEM medium. The cells were counted and diluted
25

Materials and methods
so that they could be plated at a density of 3x10⁵ cells/ml in modified DMEM medium,
kept at 37oC, 9% CO2 and used 3-5 days after plating.
2.2.2 Protocol for electroporation
For one electroporation, 800 µl of cells in DMEM solution (2.5x10⁶ cells/ml) were
incubated with 20 µg of DNA for 3 min on ice. The cells were then transferred in 0.4
cm Gene Pulser cuvettes and electroporated with the Gene Pulser II (Biorad) with the
following specifications: 230 V and 1000 µF. The cuvette was then kept on ice for 2
min and the cells were allowed to recover in a water bath (37oC) for 10 min. The cells
were then carefully transferred into 15 ml falcon tube and centrifuged at 400 rpm for
2 min. The supernatant was discarded and the cells were resuspended in 1.5 ml
DMEM solution then plated on 6 well plates.
2.2.3 Protocol for virus generation, activation and infection
For virus infection I used a Semliki forest virus (SFV) which is an alpha virus from the
family togaviridae and is a useful tool in heterologous protein production (DiCiommo
and Bremner 1998). This virus has been found to successfully infect chromaffin cells
(Ashery et al. 1999). The SFV genome is of positive polarity, i.e. it functions directly
as mRNA, and infectious particles can be obtained by in-vitro transcription of a full-
length cDNA copy of the genome. Advantages of this system are the efficient RNA
replication, the relatively late onset of cytopathogenic effects and the broad host
range of the SFV. In this work, a modified version of the pSFV1 plasmid containing
an internal ribosome entry site from polyvirus was used. This pSFV1-PV-IRES
plasmid contains a unique BamHI and BssHII site upstream of the PV-IRES and a
unique NruI site downstream. Genes cloned into this plasmid also need a Kozak
sequence and start codon.
Electroporation was used when a high density of marked vesicles was needed while
virus infection was used to yield a low density of stained vesicles for the tracking
experiments. Cells were electroporated with NPY-mRFP.
2.2.3.1 Cultivation of BHK21 cells
The BHK-21 cell line (c-13, ATCC™ccL-10) containing Syrian hamster kidney cell
type cells was used for SFV production. BHK cells were cultivated in Opti-MemI with
26

Materials and methods
2.5% FCS in 75 cm2 cell culture flasks. 80-90 % confluent cells were split routinely
using trypsin/EDTA. For splitting, the growth medium was aspirated and the cells
were washed once with OptiMemI. Then 6 ml trypsin/EDTA was added and incubated
for ≈ 1 minute until cells were detached from the bottom. Cells were triturated with the
10 ml pipette for separation. The suspension was put into a falcon tube with stop
medium (OptiMemI+ 5% FCS) and centrifuged 3 min at 1300 rpm. Cells were washed
with 10 ml OptiMemI and centrifuged (3 min, 1300 rpm) twice. Then they were
counted and the desired cell number was cultivated in a new cell culture flask (37°C,
5% CO2). For long term storage cells were harvested in a cryoprotectant medium
containing DMSO in the cryovials and were frozen in liquid nitrogen.
2.2.3.2 Preparation of viral RNA
The pSFV1 vector contains three unique cloning sites (BamHI, BssHII and NruI).
DNA fragments cloned in these sites must encode their own Kozak sequence and an
AUG translation initiation site. The cDNA coding for NPY-mRFP (Tsuboi et al.
2003) including a Kozak consensus sequence was subcloned into the BamHI-BssHII
site of the pSFV1 polylinker or in the pSFV1-PV-IRES. The cDNA coding for Munc13-
1-eGFP (Ashery et al. 2000) and the cDNA coding for TeNt-LC-eGFP (Borisovska et
al. 2005), both including a Kozak sequence, were subcloned each into the NruI site
of the pSFV1-PV-IRES. Viral RNA was prepared by in-vitro transcription of plasmids
pSFV1 coding for SFV non-structural and pSFV-helper2 coding for structural
proteins. Following linearization with SpeI, DNA was transcribed in-vitro using the
Capscribe SP6 kit (Roche) according to the manual.
2.2.3.2.1 Linearization of DNA
Linearization was carried out at singular SpeI sites downstream of the polyA tail
encoded on pSFV1 and pSFV1-PV-IRES. A total volume of 25 μl containing 3 μg
DNA, 2.5 μl NE-buffer, 2.5 μl BSA 10%, 1.5 μl SpeI and the calculated volume of
Sigma H2O was incubated at 37°C for 1.5 hours. To verify complete linearization, 1 μl
of the DNA diluted in 2 μl 6xSLB (Loading buffer) and 9 μl Sigma H2O was run on a
1% Agarose gel. Reference was 4% λ-DNA Marker (4 μl Marker+ 2 μl 6xSLB+9 μl
Sigma H2O). Electrophoresis was carried out at 80 Volts for 60 minutes. DNA was
visualized by UV illumination (312 nm) on the gel documentation system (Phase,
Lübeck, Germany).
27

Materials and methods
2.2.3.2.2 In-vitro transcription
Linearized DNA was purified by extraction with phenol-chloroform and ethanol
precipitation. The remaining 24 μl of the restriction digest were vortexed with 176 μl
Sigma H2O, 200 μl phenol and 2 drops (≈ 12 μl) of chloroform. The supernatant was
removed after centrifugation (10 min, 14000 rpm) and the residual phenol present in
the supernatant was extracted by 200 μl chloroform. After another centrifugation step
(5 min, 14000 rpm) the DNA was recovered from the supernatant by precipitation at –
20°C (or 2 hours at –80°C) with 500 μl ethanol (100%, cold) in the presence of 20 μl
3M Sodium Acetate. The DNA was pelleted by centrifugation at 14000 rpm for 15-30
min, washed with 500 μl 70% ethanol and redissolved in 13 μl of RNase-free water
after drying in the dessicator at RT. For transcription, the DNA was mixed with 8 μl
Cap scribe buffer, 1 μl RNase inhibitor, 2 μl SP6, 16μl Sigma H2O and incubated for
2 hours at 37°C. Afterwards the DNA template was digested by mixing the
transcription reaction with 36 μl RNase-free water and 4 μl DNase within 20 minutes
at 37°C. The product was purified by extraction with phenol and chloroform as
described above for DNA (here phenol for RNA isolation: Aqua Roti phenol pH 4.5-
5). Following precipitation the sample was centrifuged 15-30 min at 14000 rpm, 4°C
and the pellet was washed twice with cold 70% ethanol, vortexed and centrifuged
(14000 rpm, 10min, 4°C). The pelleted RNA was collected, desiccated and dissolved
in 20 μl RNase-free water.
2.2.3.2.3 Quantification of RNA amount by electrophoresis
Agarose gels were prepared by dissolving 0.4 g agarose in 20 ml DEPC-H2O,
heating in a microwave oven, adding 5.3 ml of 5x MOPS buffer and 4.7 ml of 37%
Formaldehyde. 1 μl RNA sample was mixed with 9 μl loading buffer (20 μl RNA
buffer+5 μl ethidiumbromide). 3 μl RNA Ladder was diluted in 8 μl loading buffer.
Both samples were denatured by incubation for 10 minutes at 65° to eliminate
secondary structures of the RNA. After loading them on the gel electrophoresis was
performed for 10 min at 80 Volts and then 85 min at 100 Volts. The gel was analyzed
with the phase gel documentation system and the amount of RNA was estimated by
comparison with the intensity of marker bands to make appropriate aliquots.
28

Materials and methods
2.2.3.3 Electroporation of BHK21 cells with RNA
BHK21 cells that were 80-90% confluent were washed once with 10 ml Opti-MemI,
trypsinyzed and dissociated. The cell suspension was put in a 15 ml Falcon tube with
OptiMemI+5% FCS. Then the cells were centrifuged (1300 rpm, 20°C, 3 min) and
washed with OptiMemI three times. After another centrifugation step they were
counted in a counting chamber. The cells were again centrifuged (1300 rpm, 20°C, 3
min) and resuspended in an appropriate amount of medium to get 1x10⁷ cells/ml.
From this suspension 8 μl per well were seeded in a 6-well plate and incubated
(37°C, 5%) for the determination of virus titer the next day. The electroporation was
performed with 10 μg RNA and 10 μg helper2 RNA in 400 μl of BHK21 cell
suspension in a Gene Pulser cuvette. The zero value was obtained with medium only
in the cuvette. The conditions for the Gene Pulser II (Biorad) were adjusted to 360
Volts and 0.075 μF and the sample was pulsed twice. The content of the cuvette was
transferred to prewarmed OptiMemI with 2.5% FCS in a cell culture flask and
incubated at 31°C, 5% CO2 for 24 hours. During this time the virions are released in
the culture medium. Following this incubation, the supernatant was collected and
centrifuged to remove debris. Aliquots of 450 μl supernatant containing virus were
snap-frozen in liquid nitrogen and stored at 80°C.
2.2.3.3.1 Virus titer test
The resulting virus has to be activated by the enzymatic activity of a protease. After
activation by chymotrypsin, packaged SFV1 particles are fully capable of a single
cycle of infection. For virus activation, 450 μl OptiMemI with 0.2% BSA was added to
450 μl virus content and incubated with 100 μl chymotrypsin for 40 minutes at RT.
Then the reaction was stopped by incubation with aprotinin for 10 min. Dilutions of
activated virus in medium (0.2% BSA) were made (1:20; 1:200) and, after washing
the wells with 3 ml medium, 1ml of the dilutions was added to each well. After 90
minutes incubation (37°C, 5% CO2) the virus containing supernatant was replaced
by OptiMemI with 2.5% FCS. Cells were incubated on (37°C, 5% CO2) and the virus
titer was calculated.
The virus construct is coupled to m-RFP to determine the number of infected cells by
fluorescence. The red cells were counted using an epi-fluorescence microscope
(Nikon TS-100F) with a mercury lamp (model name: C-SHG) and a HQ-filter set for
enhanced GFP (AHF, Tübingen, Germany).
29

Materials and methods
The titer was calculated with the formula:
number of infected cells x factor for magnification x dilution x dilution factor 2.4
The dilution factor is calculated from the addition of the different solutions, i.e.
volume of virus, medium, chymotrypsin and aprotinin divided by virus volume.
2.2.3.4 Infection of bovine chromaffin cells
For overexpression experiments with pSFV1-NPY-mRFP-IRES-Munc13-1-eGFP
chromaffin cells were infected with 300 μl virus solution (prepared as in 2.2.3.2) and
incubated for 12-15 hours (37°C, 9%CO2). The control cells with pSFV1-NPY-mRFP
and cells infected with pSFV1-NPY-mRFP-IRES-TeNT-eGFP (100 μl/well) were
incubated for 8-12 hours. These times were chosen so that the cells had
approximately the same expression level. The control was taken to see whether the
virus construct without protein had any effect on the measurements.
2.2.4 TIRFM
2.2.4.1 Setup
The setup used for the Munc13-1 experiments and the PMA experiments consisted
of an inverted Olympus IX 70 microscope, a solid state laser system (85YCA010,
Melles Griot, Carlsbad, CA, USA) emitting at 561 nm coupled through a single light
guide with a monochromator (Visichrome, Visitron systems GmBH, Pucheim,
Germany), a TILL-TIRF condenser (T.I.L.L. Photonics, Gräfeling, Germany) and an
Acousto Optical Tunable Filter (AOTF)-nC (AA opto-electronic, St-Rémy-les-
Chevreuses, France). The excitation/emission wavelengths were selected with a dual
band FITC/Texas red set (# 51006, AHF Analysentechnik AG, Tübingen, Germany).
The setup was equipped with a Micromax 512 BFT camera (Princeton Instruments
Inc., Trenton, NJ, USA) controlled by Metamorph (Visitron, Puchheim, Germany). A
100x/1.45 NA TIRF oil-immersion objective (Olympus, Hamburg, Germany) was used
for the PMA experiments (Pixel size here was 130 nm), while a 60x/1,45 NA TIRF oil-
immersion objective (Olympus, Hamburg, Germany) was used along with the 1.5x
magnification for the Munc 13-1 experiments (The pixel size was 144 nm).
The setup used for the TeNt experiments consisted of an inverted Zeiss Axiovert 200
microscope (Carl Zeiss, Göttingen, Germany), a 100x/1.45 NA oil-immersion
objective (The pixel size was 150 nm) (Carl Zeiss, Göttingen, Germany), a solid state
30

Materials and methods
laser system (85YCA010, Melles Griot, Carlsbad, CA, USA) emitting at 561 nm, a
TILL-TIRF condenser (T.I.L.L. Photonics, Gräfeling, Germany). The
excitation/emission wavelengths were selected with a dual band filter set (# 20
488020-0000, Carl Zeiss, Göttingen, Germany). The setup was equipped with an
Ixon CCD camera (DV 887, Andor Technology LTD, Belfast, Ireland), controlled by a
homemade program in LabView.
2.2.4.2 Experimental protocols
A. PMA experiments
Cells were plated as described in section 2.2.1 and incubated for 48 hours to allow
good adhesion of the cells on the coverslips. Cells were infected with pSFV1-NPY-
mRFP. Cells were recorded for 2 min at rest with 10 Hz acquisition rate in stream
mode (which is the mode where the camera can acquire images in the fastest way)
and 100 ms exposure time. Then the cells were incubated for 2 min in 250 nM PMA
and then washed with ringer solution for 50 s. Another movie was recorded of the
same cell for 2 min followed by a 10 s depolarization with high K+ solution. Only the
cells that exhibited secretion were analyzed.
To test whether TIRFM gives qualitatively similar results to those shown in
membrane capacitance recordings, I performed depolarization experiments on cells
electroporated with NPY-mRFP that contain a high density of stained vesicles. Cells
were recorded for 1 min then depolarized with high K+ for 20 s then incubated for 2
min in ethanol (control) or in 250 nM PMA. Cells were washed with Ringer’s solution
for 1 min then depolarized a second time with high K+. The number of secreted
vesicles at each depolarization was counted.
B. Munc 13-1 experiments
Cells were plated as described in section 2.2.1 and incubated for 48 hours to allow
good adhesion of the cells on the coverslips. The control cells were then infected as
described in section 2.2.3.4 with pSFV1-NPY-mRFP-IRES-Munc 13-1-eGFP to
overexpress Munc13-1 and with pSFV1-NPY-mRFP as control. For both conditions,
3 min movies were acquired in timelapse mode with 5 Hz acquisition rate. The cells
were continuously perfused with Ringer’s solution. After 2 min of recording, the
Ringer’s solution was interrupted and high K+ solution was applied to the cell for 20 s.
Secretion was determined as the disappearance of a vesicle in an interval of only
31

Materials and methods
one frame. The count of the number of vesicle per frame was done by a routine in
Metamorph after background subtraction.
To verify whether co-expression of NPY and Munc13-1 yielded the same increase in
secretion as when Munc13-1 was overexpressed alone we measured the increase in
capacitance of cells infected with both viruses after depolarization (NPY-mRFP-
IRES-Munc13-1-eGFP and pSFV1-Munc13-1-eGFP previously used by Ashery et al.
2000). The measurements were done using an EPC-9 patch clamp amplifier (HEKA,
Lambrecht, Germany). The train of depolarizations consisted of 7 depolarizations
from -70 mV to 0 mV with 100 ms duration separated by a 100 ms interval during
which a sine wave protocol was applied in order to measure capacitance. The
measurements were further analysed in IGOR (WaveMetrics, Portland, USA).
Electrophysiological experiments were performed with the help of U. Becherer.
C. TeNt expermints
Control cells were infected with pSFV1-NPY-mRFP-IRES-TeNt-eGFP to overexpress
TeNt and with pSFV1-NPY-mRFP as control. Cells were recorded for 2 min with an
acquisition rate of 10 Hz and an exposure time of 90 ms. Cells were continuously
perfused with Ringer’s solution.
A few cells overexpressing TeNt were tested for secretion using whole cell patch
capacitance measurements as described above.
Electrophysiological experiments were performed with the help of M. Pasche.
All experiments were performed at room temperature.
2.2.5 Analysis of movies
The movies acquired were processed using a program developed in house (Dr. Hof)
using LabView.
A. Vesicle detection:
Every frame of the stack was first high-pass filtered using a Fast Fourier
Transform (FFT), i.e. regions with low spatial frequency are darkened while
regions with higher spatial frequencies are left unchanged. Thus, so-called long-
scale objects like haze are removed and contrast is enhanced (Fig. 9)
32

Materials and methods
Fig. 9: Frame before FFT-high pass Frame after FFT-high pass filtering filtering
Then every frame is “thresholded”: Pixels whose grey level lies within a lower and
upper limit were assigned the value 1, while all other pixels were assigned the
value 0, thus creating a binary frame (Fig. 10). Only those particles whose pixel
number is within a defined range (e.g. 3-15 pixels large) are selected as vesicles.
The exact position of a vesicle is defined by its centre of mass, while its
brightness is determined using the intensity of the original frame.
Fig. 10: Actual frame Binary frame
33

Materials and methods
B. Trajectory determination:
When vesicle detection is completed for all frames of the movie, the tracking
algorithm is started. The following procedure is carried out for all frames in the
stack, beginning with frame 0 and vesicle 0:
For vesicle n in frame 0, new positions in frame 1 are determined. A radius of 3
pixels is determined; if a vesicle in frame 1 falls within this radius of the position
of vesicle n in frame 0, then the vesicle is identified as vesicle n and its position
is added to the trajectory (the sum of all positions occupied by the vesicle). If the
new position does not fall within the radius of the position in frame 0, the track is
terminated e.g. in fig. 11, in the four first frames the positions are in close
proximity thus these positions are assigned to only one vesicle. However, the
position in the last frame is at a greater distance, thus this position is assigned
to another vesicle.
We analyzed trajectories only if vesicles were visible for at least three
consecutive frames. When two trajectories overlap and it is no longer possible
to distinguish between them, we assign the resulting track to one of the vesicles
and the other vesicle is no longer tracked. And of course, trajectories belonging
to certain vesicles are no longer available for other vesicles.
Fig. 11: Tracking of a vesicle.
Frame 0 Frame 1 Frame 2 Frame 3 Frame 4
Sometimes the program looses track of a vesicle for a number of frames due to
an intensity decrease below threshold level, resulting in two or more trajectories
describing the fate of a single vesicle; yet that the vesicle is still visible by eye.
To overcome this problem, a merging routine is provided which merge the two
components of this trajectory provided that the track was lost only during a few
frames.
34

Materials and methods
A. Resulting files:
In the end of the tracking procedure three files are obtained:
One containing the xy position and the fluorescence of the vesicles vs. time and
frame number.
One containing the lateral, axial and 3D velocities of the vesicles.
One containing the MSD vs. Δt values of the vesicles tracks.
2.2.6 Analysis of caging diameter
After obtaining the xy positions of the vesicles, this information was processed in
IGOR as follows:
Y (µ
m)
4
4
8
8
12
12
16
16X (µm)
20
00
Fig. 12: The xy positions of the vesicles of a single cell were plotted: Each color represents the trajectory of one vesicle
The caging diameter (CD) is determined: the CD is the maximum distance measured
between two positions occupied by the vesicle in a sliding time window of 6 s. The
routine starts from the 1st position occupied by a vesicle and measures the distance
between this position and all consecutive positions in a window of 6 s. The largest
distance measured is taken as CD for this position (Fig. 13). Then the program
moves to the 2nd position of the vesicle and repeats the previous steps. This routine
is repeated up to the end of the trajectory of the vesicle. Due to the fact that our time
window is 6 s, vesicles that are visible for less than 6 s are not taken into
consideration in the analysis of the CDs.
35

Materials and methods
Fig. 13: positions occupied by a vesicle within 6 s starting from the red and ending at the dark blue, red line represents the CD.
Last position
1st
position
When all the CDs are calculated from all the vesicles in a cell they are concatenated
in a plot of CD versus time (Fig. 14).
0.0
0.2
0.4
0.6
0.8
1.0
1.2
1.4
0 1200
0.4
t (s)
Cag
ing
diam
eter
(µm
)
Fig. 14: CD vs. time. Every color represents the CD of one vesicle over time. Inset shows the CD of one vesicle over the 2 min of recording.
A histogram of the CDs is then derived from the previous plot and then a cumulative
histogram is plotted (Fig. 15)
Fig. 15: Size distribution of CD. A, Histogram of CD. B, Cumulative histogram of the CD.
Other parameters are derived from the analysis of the CD and will be discussed in
the results.
36

Materials and methods
This method of analysis enables us to actually see the changes of mobility over time,
thus it might allow the visualization of the dynamic changes occurring during the
lifetime of the vesicle. In contrast, the analysis of the Mean Square Displacement
(MSD) (Qian et al. 1991) cannot show the changes in mobility occurring during the
lifetime of the vesicle; it only gives an overall description of the mobility of the vesicle
as if it had only one type of mobility. In Fig. 16, part of a trajectory of a vesicle is
illustrated. The green circles represent the positions occupied by the vesicle starting
from light to dark green; the blue line represents the distances taken to calculate the
MSD for the first increment which in this example is 100 ms. The red and black lines
represent the distances taken to calculate the MSD for the second and third
increment respectively.
Fig.16: trajectory of a vesicle used to calculate the MSD.
Then the MSD vs. Δt is plotted and the curvature of the MSD gives an indication as
to the nature of the motion studied. If the curve saturates (increases then reaches a
plateau) then the vesicle is moving within a cage or restricted space. The diffusion
coefficient is then derived from the plot and if the coefficient is low then the vesicle is
considered immobile otherwise it is considered caged. If the curvature of the MSD
plot increases exponentially then the vesicle is considered to have a directed motion.
If the curvature is linear, then the vesicle is considered to have a random motion. In
some cases, the analysis of the MSD gives an accurate interpretation of the motion
of the vesicle but in other cases it does not.
For example, Fig. 17A shows the trajectory of a vesicle that was immobile in the red
area then entered a phase where it had a directed motion (green area) then the
vesicle was moving in a restricted area (blue area). This is just a very general
description.
37

Materials and methods
1.6
Time (s)
Cag
ing
diam
eter
(µm
)
0 10 20 30 40 500.00.10.2
0.30.40.50.60.70.80.9
600
Δ t (s)
0
2
4
(10
nm
)5
2M
SD
3
1
108642
0.2
0.4
0.6
0.8
1.2
1.4
1.6Y
(µm
)
0.0 0.2 0.4 0.6 0.8 1.0 1.2 1.40.0
1.0
X (µm)
A B C
Fig. 17: Comparison between the analysis of the MSD and the CD. A, XY position of an exemplary vesicle. B, MSD vs. Δt of the trajectory of the vesicle. C, CD vs. time of the trajectory of the vesicle.
The MSD of this track was calculated and plotted (Fig. 17B). Since this vesicle shows
a multitude of different motions, the expected curvature would be a linear increase
with time increment to be interpreted as random walk. But a curve showing an
exponential increase with the time increment is obtained, denoting directed motion.
This is not the case but the short period of time where the vesicle has a directed
motion (green area) dominates the overall motion of the vesicle and this is the reason
the MSD gives a false result. The plot of the caging diameter on the contrary shows
that the vesicle had a low caging diameter in the beginning of the trajectory (average
CD=120 nm) (Fig. 17C). Then the vesicle entered the phase of directed motion and
the CD showed a great increase to 0.8 µm. In the end, when the vesicle was moving
in a restricted area, the CD was around 342 nm. So the analysis of the CD gives an
accurate description of the vesicle’s motion over time.
2.2.7 Statistical analysis
Statistical analysis was performed in SigmaStat using Student t-test analysis paired
or independent.
For comparison of data that was found to have a skewed distribution, the Mann-
Whitney test was used.
For comparison of cumulative distributions, the Kolmogoroff-Smirnoff test was used.
38

Results
3. Results
3.1 Effect of PMA on bovine chromaffin cells
3.1.1 Effect on secretion
In previous studies (Gillis et al. 1996; Smith et al. 1998), PMA was found to
significantly increase secretion as determined using membrane capacitance
measurements. We have used PMA to enhance priming and have used TIRFM to
detect release of vesicles. This experiment was performed to show that TIRFM gives
qualitatively similar results to those observed in membrane capacitance
measurements. Bovine chromaffin cells (BCC) were electroporated with NPY-mRFP
to obtain a high density of stained vesicles (1 vesicle/µm2). Test cells were recorded
for 2 min at 10 Hz and then depolarized for 20 s with 90 mM KCl solution to
determine a baseline for secretory activity. The cells were then incubated for 2 min in
250 nM PMA; washed for 1 min with Ringer’s solution, then depolarized a second
time. Control cells were treated similarly except that they were incubated with ethanol
(final concentration 3%) instead of PMA as ethanol was the solvent of the PMA
solution. The number of vesicles per frame in control and test cells was not different
nor was the number of vesicles per frame after PMA treatment different from that
before PMA treatment (Fig. 18A). This shows that PMA has no effect on docking as
demonstrated previously (Gillis et al. 1996; Smith et al. 1998). Vesicles were
considered to be secreted when they disappeared suddenly within one interval (100
ms). The numbers of secreted vesicles was normalized to the number of vesicles per
frame prior to the depolarization, so that the fraction of vesicles secreted could be
compared. To compare the secretion events, I compared the ratios of the 2nd over the
1st secretion of the PMA treated cells with that of the control cells e.g. if the number
of vesicles/frame=10 before depolarization and 11 afterwards, and the number of
secretory events at the 1st stimulation is 3 and 2 at the 2nd then the ratio is
=2:11/3:10.
The distribution of the secretion events was not bell shaped but skewed to the left, so
a non-parametric test was used (Mann-Whitney) to compare the ratios (Fig. 18B).
39

Results
A B
C
Fig. 18: Effect of PMA on the number of docked and secreted vesicles. A, the number of vesicles/frame before and after HK application was not changed after PMA treatment. B, number of secretions normalised to the number of vesicles/frame before each stimulation. Error bars represent SEM. *, p<0.05. C, the ratios between the second and the first secretion were calculated and the medians were compared using a Mann-whitney test. Secretion was tripled after PMA treatment.
This test compares the medians and not the averages as is the case in normal
student T test. In Fig. 18B, the solid line represents the means and the dashed line
represents the medians, error bars represent 75% percentiles and the black circles
represent values that are outside of the 75% confidence interval. Using this test,
secretion after PMA treatment was found to be three times higher than secretion in
control cells. Thus, TIRFM gives qualitatively similar results to those obtained using
membrane capacitance recordings.
When TIRFM can give us correct information about the fusion step, it could also give
us direct information about processes that occur prior to fusion. We propose to
monitor the changes in mobility that occur during priming. We expect to be able to
show that priming leads to a certain type of motion.
40

Results
3.1.2 Mobility of vesicles in cells treated with PMA
As PMA specifically promotes priming and as our hypothesis is that priming -which
probably corresponds to SNARE complex formation- leads to a reduction in the
mobility of LDCVs, I devised the following experimental protocol (Fig. 19) to test this
hypothesis. Using this protocol, I could compare the mobility of LDCVs before and
after priming with PMA in the same cell. Thus the cell acts as its own control which
allows the reduction of variability between cells and also allows us to use paired
Student t test.
BCC were infected with pSFV1-NPY-mRFP for 10 hrs before the start of the
experiment.
Movie(2min, 10Hz)
Movie(2min, 10Hz)
PMA(2min)
Wash(30-50sec)
Fig. 19: Experimental protocol
Vesicles were tracked as described in the methods section and the caging diameter
was determined. Fig. 20A depicts the trajectories of LDCVs of a representative cell
before (control) and after PMA application. It is easily seen that most large range
movements of LDCVs disappeared after PMA application. The CD analysis of the
LDCVs movement shows that before PMA application most LDCVs moved over a
large distance while only few vesicles were immobile (Fig. 20B, right panel). Indeed,
many LDCVs had, at least transiently, CDs exceeding 400 nm, which means that
within 6 s the LDCVs had a displacement greater than 400 nm. Moreover, only a
small fraction of vesicles were immobile since few LDCVs had CDs near 100 nm.
After application of PMA, the mobility of LDCVs was dramatically changed (Fig. 20B,
left panel). Indeed, many vesicles were nearly immobile displaying CDs of about
100 nm and only few moved over large distances as the CDs of most LDCVs stayed
below 400 nm. The histogram of the CDs of this exemplary cell (Fig 20C) shows a
large increase in the incidence of CDs having low values after PMA treatment. To
illustrate this finding in a simple manner, the normalized cumulative histogram of the
CDs of all LDCVs of this exemplary cell is plotted and shows a large leftward shift
indicating that vesicles lost mobility after PMA application as compared to control
conditions (before PMA application, Fig. 20D). The 50% value of the normalized
cumulative histogram revealed a leftward shift of 156 nm for this exemplary cell.
41

Results
A
B
DC
Fig. 20: Analysis of CD in an exemplary cell. A, XY position of the vesicles in the cell before and after PMA treatment, each color represents the trajectory of a vesicle. Note that large tracks such as the dark blue one are rare after PMA treatment. B, CD over time of the vesicles illustrated in A, inset represents the CD of one vesicle over the 2 min recording time. C, histogram of the CD of the cell before (control, black) and after PMA treatment (red), note the higher incidence of CD with lower values after PMA treatment. D, normalised cumulative histogram of CD of the cell before and after PMA treatment, note the large shift to the left after PMA treatment.
42

Results
Twenty one cells were analyzed the same way and the cumulative histograms of the
CDs were plotted. For simplification two plots are represented in Fig. 21A. Note that
there was a large variability between cells; some had large left shifts while some had
almost none. To obtain a value of the reduction in the CD after PMA treatment an
average histogram for the 21 cells was plotted before and after PMA treatment.
A
B C
Fig. 21: PMA reduces the mobility of LDCVs. A, normalised cumulative histograms of CDs of vesicles from 21 cells before (dashed lines) and after (solid lines) PMA treatment; each color represents the histogram of one cell. B, normalised cumulative histogram of 21 cells showing a large shift to the left after PMA treatment (N=21, n=417) compared to control (N=21, n=461). C, CD at 50% is significantly reduced after PMA treatment. Error bars represent SEM; **, p<0.01
43

Results
The cumulative histogram of the caging diameters (Fig. 21B) shows a significant shift
to the left after PMA treatment (N=21, n=417) in comparison to those observed in
control cells (N=21, n=461). This shift to lower caging diameters after PMA treatment
indicates that the mobility of the vesicles is reduced. On analyzing the distributions
with the Kolmogoroff-Smirnoff test, the difference was found to be significant
(p=0.05). The CD after PMA treatment at 50 % of the distribution was also found to
be significantly different from that of control (Fig. 20C, p=0.01) and the decrease was
of 24%.
These results demonstrate that PMA treatment results in a reduction in the mobility of
vesicles.
But we could still not distinguish between primed and unprimed vesicles. To do this,
we analysed the mobility of secreted vesicles which are primed prior to fusion and
the mobility of vesicles that did not fuse with the PM and are not necessarily primed.
3.2 Determination of limits of mobility
Our working hypothesis is that as the SNARE complex is formed during priming and
that this complex anchors vesicles tightly to the PM, rendering vesicles immobile. To
determine what immobility is in terms of CD, we decided to analyse the mobility of
beads (175 nm in diameter) which were fixed on coverslips. We recorded them for 2
min at 10 Hz. The light intensity was adjusted so that their fluorescence intensity was
comparable to that of vesicles. After analyzing the CD of the beads, I found that fixed
beads had a CD lesser than 100 nm (median=56 nm) (Fig. 22A).
We then analyzed the mobility and the CD of 10 secreted vesicles in the last 15 s of
their lifetime. We expected that the distribution of the CD would be similar as that of
beads and that the average CD would be comparable with that of fixed beads.
However, the histogram of the CD of secreted vesicles had multiple peaks which we
have fit using the fit routines of Igor. The individual Gaussian curves are represented
as dashed curves in Fig. 22B and C. The first Gaussian had a peak value of 60 nm
thus comparable with the median CD of the fixed beads, so we considered this to be
jitter inherent in the experimental setup. This peak accounted for 25% of the CDs.
The second Gaussian had a peak value of 101 nm and accounted for 58% of the
CDs, the third Gaussian had a peak value of 220 nm and accounted for 10% of the
CDs while the fourth Gaussian had a peak value of 520 nm and accounted for 7% of
44

Results
the CDs. Since this distribution included only secreted vesicles, they must have been
primed. Since the first peak appears to be experimental jitter, it is likely that primed
vesicles belong to the remaining population with the lowest mobility. This is the
second peak which is also the most prominent peak (Fig. 22B). The last 2 Gaussians
could represent short periods of time where the vesicles unprimed prior to fusion.
To strengthen this conclusion, we analyzed the movement of vesicles that were not
secreted (n=15), thus were less likely to have been primed (Fig. 22C). The
distribution of the CDs could also be fit with 4 Gaussians with the same peak values
as those obtained for the secreted vesicles. The first and fourth Gaussians
accounted for 30% and 6% of the CD distribution respectively which is similar to the
values obtained for the secreted vesicles. As the first Gaussian represents the
inherent movement of our recording system, it affects all vesicles equally. The fourth
Gaussian represents vesicles with very large movements possibly having a directed
type of motion. The integral values of the second and third peaks were different. The
integral of the second Gaussian was decreased from 58% to 19%, a third of the
value for secreted vesicles. The third Gaussian’s integral value was increased by a
factor of 4.5 from 10% to 45% as compared to secreted vesicles. Since the vesicles
in Fig. 21B were primed and the vesicles in Fig. 22C were docked but not necessarily
primed, we deduced that primed vesicles are represented by the second Gaussian
having a peak at CD=101 nm and that docked but unprimed vesicles are represented
by the third Gaussian and have a peak at CD=220 nm. So we conclude that primed
vesicles were nearly immobile, docked vesicles were caged vesicles or vesicles
having a restricted motion and vesicles in the depot pool were vesicles having a
directed motion. Since PMA increases the primed pool and decreases mobility, we
have tested whether PMA increases the incidence of vesicles exhibiting a CD near
101 nm while reducing that with higher mobilities.
To distinguish nearly immobile from caged vesicles, we used the intersection point
between the second and third Gaussian (170 nm, Fig. 22B) and to distinguish caged
vesicles from vesicles with directed motion, we used the intersection point between
the third and the fourth Gaussian (403 nm).
45

Results
Fig. 22: Size distribution of CD of beads, secreted, and non-secreted vesicles. A, Histogram of CD of beads with a peak value of 56 nm. B, Histogram of CD of secreted vesicles (n=10) with peak values and integral values of 60 (25%), 101 (58%), 220 (10%) and 520 nm (7%). C, Histogram of CD of non secreted vesicles (n=15) with peak values similar to those in B and integral values of 30%, 19%, 45% and 6%.
As can be seen in Fig. 22B and C, vesicle mobility is not a constant, but can rather
change over time. This is to be expected since the transition from the docked state to
the primed state is reversible. Therefore, we have followed mobility (CD) over time to
determine how vesicle mobility changes. We have, based on these results, defined
different types of mobility.
I C D IC M
Fig. 23: Classification of vesicles. I, Immobile vesicle: CD < 169 nm for 75% of the time. C, Caged vesicle: 169 nm < CD < 403 nm for 75 % of the time. D, Vesicle with directed motion: CD > 403 nm for 75% of the time. IC, Immobile-caged vesicle: CD oscillating between the I and the C states. M, Vesicle with mixed motion: CD constantly oscillating between the three states.
We considered vesicles as nearly immobile (I) when their CD was below 170 nm for
75% of the time. Vesicles were considered caged (C) when their CD was between
46

Results
170 nm and 403 nm for 75% of the time. Vesicles had a directed motion (D) when
their CD was larger than 403 nm for 75% of the time. Immobile-caged vesicles (IC)
were those that spent 75% of the time below 403 nm but whose CD was oscillating
between the nearly immobile state and the caged state. Finally, vesicles were
considered to have a mixed motion (M) when their CD was constantly oscillating
between the three mobility states (Fig. 23).
3.2.1 PMA treatment increases the number of nearly immobile vesicles
I used the previously determined limits to classify vesicles from cells treated with
PMA. I expected to observe an increase in the fraction of nearly immobile vesicles
after PMA treatment.
The LDCVs of the cells treated with PMA were tracked at rest (before depolarization
with the high K+ solution). The CDs were analyzed and the vesicles classified using
the limits determined in the previous section.
A B
Fig. 24: A, Fraction of vesicles in each type of motion, I=immobile, C=caged, IC=immobile-caged, D=directed motion, M=mixed. The fraction of nearly immobile vesicles significantly increased while the fraction of vesicles with mixed motion was reduced. B, Fraction of time spent in each type of motion. The fraction of time spent in the nearly immobile state was significantly increased and the fraction of time spent in the restricted and directed state was significantly reduced. Error bars represent SEM; *, p<0.05; **, p<0.01; ***, p<0.005; paired student test.
47

Results
After treatment with 250 nM PMA, the fraction of immobile vesicles increased
significantly (N=21, n=417) by 19% (p=0.0049) as compared to control cells (N=21,
n=461, Fig. 24A). As mentioned before, since priming is believed to be the
association of vesicles into SNARE complexes, we hypothesize that priming should
lead to immobilization of vesicles.
This result confirms our prediction that priming leads to immobility. This supports the
idea that primed vesicles are represented by immobile vesicles. In addition, the
fraction of vesicles with mixed behavior was significantly decreased by 45%
(p=0.002) indicating that when priming was promoted, the mobility of the vesicles
was more targeted to definite types of motion (Fig 24A).
Note that the advantage of this experiment was the fact that the cell acted as its own
control, thus paired student t-test was used for the statistical analysis and although
the SEM bars was large, the changes were still significant.
The fraction of time spent in each type of motion corresponded well with the changes
in the numbers of vesicles displaying the different types of mobility. The fraction of
time spent in the immobile state was significantly increased (N=21, n=461, p=0.002)
and vesicles spent significantly less time in the caged state (N=21, n=461, p=0.016)
and in directed motion (N=21, n=461, p=0.007) (Fig. 24B). This indicates that tracked
vesicles spend more time in the immobile than in the caged state.
As stated in the methods, our tracking protocol enables us to obtain information on
the velocities of the vesicles and their dwell time (the time they remain visible). Table
1 lists the parameters of the tracked vesicles.
The number of tracked vesicles and the number of vesicles per frame were
unchanged after PMA treatment indicating that PMA has no effect on docking. Also
no effect was observed on the velocity indicating that the increase of the fraction of
immobile vesicles was not a result of a reduced velocity. The dwell time of the
vesicles was not altered after PMA treatment. Visitors are the vesicles that were
tracked but were visible for less than 6 s, thus their CD was not analyzed.
48

Results
Table 1: Characteristics of tracked vesicles:
Control PMA
Number of tracked vesicles 947 848
Vesicles/cell 45.1 ± 5.5 40.4 ± 5.2
Vesicles/frame 11.5 ± 1.0 11.4 ± 1.0
Dwell time (s) 23.1 ± 1.8 27.6 ±3.4
Average velocity (nm.s-1) 331.0 ± 20.0 340.2 ± 23.9
Number of visitors 486 431
Visitors/cell 20.0 ± 3.0 20.0 ± 3.7
N = 21, n = 1795.
3.3 Overexpresssion of Munc13-1 alone and fused with NPY-mRFP.
To check our hypothesis with an independent method, I promoted priming by
overexpressing Munc13-1 in BCCs. In previous studies using overexpression of
Munc13-1, the protein was fused with eGFP in a pSFV1 plasmid (Ashery et al. 2000).
Here I use pSFV1-NPY-mRFP-IRES-Munc13-1-eGFP. To determine whether
overexpression of Munc13-1 using this expression vector gives comparable results to
those reported by Ashery et al. (2000), I compared the effect of overexpression of
Munc13-1 in BCCs. The secretion in overexpressing cells was compared to that in
wild type control cells. Cells were measured in the whole cell configuration at room
temperature.
49

Results
Fig. 25: Expression of Munc13-1 alone and co-expression of NPY and Munc13-1. The black trace represents secretion from control cells after atrain of depolarizations. The blue trace represents secretion from Munc13-1 overexpressing cells; secretion was tripled compared to control cells. The red trace represents secretion from cells co-expressing Munc13-1 and NPY. There was no difference between the red and blue traces. Control, n=8; Munc13-1, n=10; Munc13-1+NPY, n=6.
Co-expression of NPY and Munc13-1 yielded a strong increase in capacitance
(843.0±221.8 fF, n=6) in comparison to control cells (252.7±57.4 fF, n=8) (Fig. 25).
Expression of Munc13-1 alone resulted in an increase in capacitance that is
comparable with that of the co-expression of NPY and Munc13-1 (1041.0±239.8 fF,
n=10). This shows that the pSFV1-NPY-mRFP-IRES-Munc13-1-eGFP virus is
effective in enhancing secretion and thus suitable as a tool to enhance priming. So I
used BCC overexpressing Munc13-1 to monitor exocytosis and mobility of vesicles
from these cells.
3.4 Effect of Munc13-1 on secretion from chromaffin cells
3.4.1 Munc13-1 increases secretory events observed in TIRFM
The present experiment was performed to confirm that secretion observed using
TIRFM is similar to that recorded using membrane capacitance measurements.
BCC were infected with the pSFV1-NPY-mRFP virus for control and with the pSFV1-
NPY-mRFP-IRES-Munc13-1-eGFP virus for 12-15 hrs, then a movie was recorded of
the cells at rest for 2 min with a frequency of 5 Hz. The cells were then depolarized
for 20 s with a high K+ solution. The total number of vesicles and the number of
vesicles per frame were determined using Metamorph. The total number of vesicles
and the number of vesicles per frame were similar in control and test cells indicating
that Munc13-1 has no effect on docking as stated before (Ashery et al. 2000)
(Fig. 26A and B, Table 2).
50

Results
Fig. 26: Munc13-1 has no effect on docking. A, number of vesicles/frame; the number of visible vesicles per frame was similar in Munc13-1 overexpressing cells and in control ones. B, total number of vesicles; the total number of vesicles was similar in Munc13-1 overexpressing cells and in control ones. Control (n=28), Munc13-1 (n=33). Error bars represent SEM.
When a vesicle was visible in one frame then disappeared in the next frame, this was
considered a secretory event (after 200 ms). The number of secretory events was
then normalized to the number of vesicles per frame. Secretory events were counted
over the period of the 20 s of stimulation. The number of secretions was increased by
32% but the difference was not significant (Fig. 27A).
A B
Fig. 27: Secretion in Munc13-1 overexpressing cells. A, Number of secretions normalized to the number of vesicles/frame; Control, n=28; Munc13-1, n=33. The number of secretions in Munc13-1 overexpressing cells increased but was not significant compared to control cells due to the large variability between cells and the long duration of the stimulation protocol (20 s). B, Distribution of secretion over time, bin=2 s. The distribution of secretion from Munc13-1 overexpressing cells shows a peak at 5 s then a gradual decrease (black bars), while the disrtribution of secretion in control cells is continuous over the time of stimulation (white bars). Error bars represent SEM.
51

Results
Ashery et al. (2000) have reported an approximately three fold increase in secretion.
We observe a similar effect of Munc13-1 overexpression on depolarization induced
secretion (Fig. 25). Thus, our results with potassium stimulation indicates a weaker
than expected effect of Munc13-1 on secretion observed in TIRFM. This may be due
to the relatively long duration of the potassium stimulation. We have examined the
time course of secretion in the experiment described in Fig. 27A and found that a
strong enhancement of secretion was present in Munc13-1 overexpressing cells in
the first 10 s of stimulation (Fig. 27B). This probably shows that the vesicles that are
released first are already primed, which also shows that Munc13-1 increases the
primed pool as already shown in previous studies (Ashery et al. 2000). So I
determined the normalized number of secretory events in the first 10 s of secretion
only (Fig. 28). The secretion was tripled in Munc13-1 overexpressing cells (n=33)
(p<0.005) in comparison to control cells (n=28). Note that the numbers of secreted
vesicles are low because some cells did not secrete in the first 10 s of depolarization
thus they were given a value of zero and taken into account in the calculation; also,
in virus infected cells, the density of stained vesicles is low (0.1 vesicle/µm2) and we
obtain cells that secrete only one vesicle per depolarization. From these data, I
conclude that Munc13-1 specifically promotes priming since docking was unaffected.
We also confirm that TIRFM gives similar results to those obtained by membrane
capacitance recordings.
Fig. 28: Secretion in the first 10 s of depolarization. Munc13-1 overexpression triples the number of exocytosed vesicles in the 1st 10 s of depolarization compared to control. Control, n=28; Munc13-1, n=33. Error bars represent SEM; ***, p<0.005.
52

Results
3.4.2 Munc13-1 overexpression increases the number of immobile vesicles
Since Munc13-1 specifically promotes priming, I decided to test whether
overexpression of Munc13-1 has similar effects on mobility as PMA treatment. The
cells used in the previous section were used, their LDCVs tracked at rest, and the
CDs were analyzed.
A
B C
Fig. 29: Munc13-1 overexpression reduces the mobility of vesicles. A, normalised cumulative histograms of 24 control cells (black) and 31 Munc13-1 overexpressing cells (red). B, CD histogram shows a shift to the left in Munc13-1 overexpressing cells; Control N=24, n=686; Munc13-1 N=31, n=695. The difference between the two distributions is significant. C, Shift of the CD at 50%; the decrease is of 40 nm. Error bars represent SEM; ***, p<0.005.
53
Results
The cumulative histograms of 24 control cells and 31 Munc13-1 overexpressing cells
were plotted (Fig. 29A, right and left). These cells cannot be compaired in a paired
manner like the PMA treated cells were. It is even more complicated to obtain
information from such plots. Therefore, the average cumulative histograms of
Munc13-1 overexpressing cells and control ones were plotted (Fig. 29B). The
cumulative histogram of the CD of vesicles from Munc13-1 overexpressing cells was
shifted to the left as was the case with PMA treated cells (Fig. 29B), so the CD was
smaller in Munc13-1 overexpressing cells (N=31, n=695) in comparison to control
cells (N=24, n=686).
The difference between the two distributions was found to be significant (p=0.05,
Kolmogoroff-Smirnoff test. Fig. 29B) and the decrease of CD at 50% was of 40 nm
and was significant compared to control (p=0.0001) (Fig. 29C).
Then the vesicles were classified according to their mobility. In spite of the variability
between cells, the fraction of nearly immobile vesicles was significantly increased
(68%, p=0.006) in Munc13-1 overexpressing cells as compared to control cells
(Fig. 30A). On the other hand, the number of caged vesicles was significantly
reduced by 46.8% (p=0.001), while the number of immobile-caged vesicles did not
change. Notably, the number of docked vesicles (sum of nearly immobile, caged and
immobile-caged vesicles) was not significantly changed after Munc13-1
overexpression (control, 84.1±6%; Munc13-1, 89.6±10%) indicating that Munc13-1
has no effect on docking as shown in previous studies. The number of vesicles
having directed motion and mixed behavior did not change.
The time the vesicles spend in the immobile state was significantly increased by 33%
(p=0.0002) in Munc13-1 overexpressing cells compared to control cells (Fig. 30B).
The time the vesicles spend in the caged state was significantly reduced by 37%
(p=0.0002). The time they spend in directed motion was significantly reduced by 43%
(p=0.005) but these vesicles represent less than 5% of the vesicles in both control
and Munc13-1 overexpressing cells.
54

Results
Fig. 30: Munc13-1 overexpression increases the number of nearly immobile vesicles. A, fraction of vesicles in each type of motion. The fraction of nearly immobile vesicles was significantly increased while that of caged vesicles was significantly reduced. B, Fraction of time spent in each type of motion; Control, N=24, n=686; Munc13-1, N=31, n=695. The fraction of time spent in the immobile state was significantly increased while the fraction of time spent in the two remaining state was significantly reduced. Error bars represent SEM; **, p<0.01; ***, p<0.005.
Table 2: Parameters of LDCVs in Munc13-1 overexpressing cells:
Control Munc13-1
Number of tracked vesicles 1313 1267
Vesicles/cell 54.7 ± 6.2 36.5 ± 4.9
Vesicles/frame 9.4 ± 1.0 8.7 ± 1.0
Dwell time (s) 22.5 ± 1.7 17.8 ± 2.0
Average velocity (nm.s-1) 318.8 ± 31.6 256.6 ± 25.5
Number of visitors 627 572
Visitors/cell 26.1 ± 3.7 20.1 ± 2.8
Control: N = 24, n = 1313; Munc13-1: N = 31, n = 1267.
55

Results
As was the case in PMA treated cells, the parameters of tracked vesicles were
unchanged in Munc13-1 overexpressing cells as listed in table 2.
Our previous results obtained from PMA treated cells and the present results from
Munc13-1 overexpressing cells show that enhancing priming leads to immobilization
of vesicles. This has reinforced our hypothesis that when the vesicles undergo
priming when the SNARE complex probably forms, the vesicle becomes attached to
the PM and is then not able to move freely.
To challenge our hypothesis, we verified our results by preventing priming. We thus
expect to see an opposite effect on mobility to that observed when priming was
promoted.
3.5 Overexpression of tetanus toxin light chain increases the mobility of vesicles
To verify our previous conclusions, I have blocked SNARE complex formation which
should prevent priming and result in increased mobility of vesicles. I used a virus
containing both NPY-mRFP to visualize the vesicles and eGFP-TeNt-LC (the light
chain of tetanus toxin) which cleaves synaptobrevin and prevents it from forming
SNARE complexes.
Fig. 31: Secretion in TeNt-LC overexpressing cells: TeNt-LC overexpressing cells (n=4) show a complete block of exocytosis compared to control cells (n=6).
56

Results
BCC were infected with pSFV1-NPY-mRFP for control cells and with pSFV1-NPY-
mRFP-IRES-TeNt-LC-eGFP for 10-12 hrs. To demonstrate that the virus containing
the TeNt-LC blocks exocytosis, I performed membrane capacitance recordings on
control cells and cells expressing tetanus toxin. Cells expressing TeNt-LC showed a
complete block of exocytosis in comparison to control cells (Fig. 31).
Vesicles from control cells and from cells overexpressing TeNt-LC were tracked and
their CDs was analyzed. The cumulative histograms of the CDs of 22 TeNt-LC
expressing cells and 25 control ones were represented in two plots for clarity (Fig. 32
A). It was impossible to obtain a definit information from these plots.
A
B C
Fig. 32: Overexpression of TeNt-LC increases the mobility of vesicles. A, normalised cumulative histograms of 22 TeNt-LC expressing cells (green) and 25 control cells (black). B, Cumulative histogram of CDs showing a shift to the right in TeNt-LC overexpressing cells (N=22, n=453) compared to control cells (N=25, n=553). C, Shift of CD at 50% showing a significant increase in TeNt overexpressing cells. Error bars represent SEM; *, p<0.05.
57
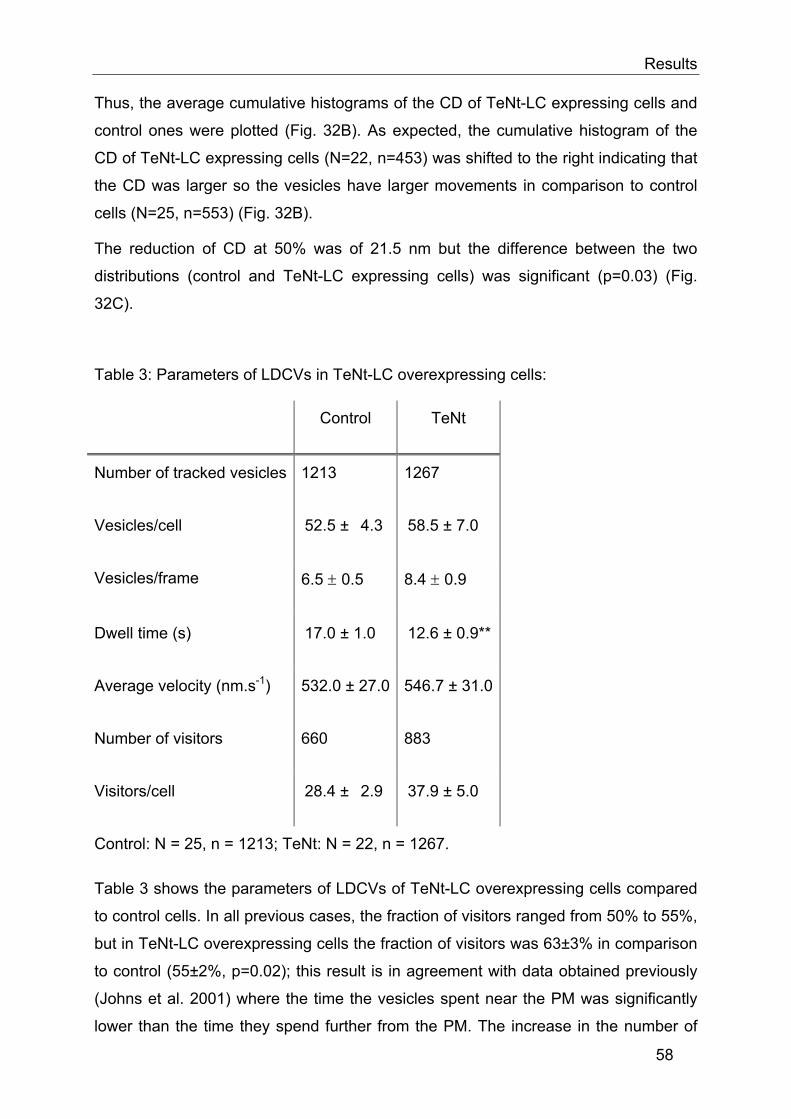
Results
Thus, the average cumulative histograms of the CD of TeNt-LC expressing cells and
control ones were plotted (Fig. 32B). As expected, the cumulative histogram of the
CD of TeNt-LC expressing cells (N=22, n=453) was shifted to the right indicating that
the CD was larger so the vesicles have larger movements in comparison to control
cells (N=25, n=553) (Fig. 32B).
The reduction of CD at 50% was of 21.5 nm but the difference between the two
distributions (control and TeNt-LC expressing cells) was significant (p=0.03) (Fig.
32C).
Table 3: Parameters of LDCVs in TeNt-LC overexpressing cells:
Control TeNt
Number of tracked vesicles 1213 1267
Vesicles/cell 52.5 ± 4.3 58.5 ± 7.0
Vesicles/frame 6.5 ± 0.5 8.4 ± 0.9
Dwell time (s) 17.0 ± 1.0 12.6 ± 0.9**
Average velocity (nm.s-1) 532.0 ± 27.0 546.7 ± 31.0
Number of visitors 660 883
Visitors/cell 28.4 ± 2.9 37.9 ± 5.0
Control: N = 25, n = 1213; TeNt: N = 22, n = 1267.
Table 3 shows the parameters of LDCVs of TeNt-LC overexpressing cells compared
to control cells. In all previous cases, the fraction of visitors ranged from 50% to 55%,
but in TeNt-LC overexpressing cells the fraction of visitors was 63±3% in comparison
to control (55±2%, p=0.02); this result is in agreement with data obtained previously
(Johns et al. 2001) where the time the vesicles spent near the PM was significantly
lower than the time they spend further from the PM. The increase in the number of
58

Results
visitors in turn affected the dwell time at the footprint of the cell which was
significantly reduced by 26% in TeNt-LC overexpressing cells (p=0.01)
Then the vesicles were classified according to their mobility. The fraction of nearly
immobile vesicles was reduced in TeNt expressing cells while the fraction of
immobile-caged vesicles was increased (Fig. 33A). Although the changes were not
significant, they were the opposite of the changes induced by PMA treatment or
Munc13-1 overexpression.
Fig. 33: TeNt-LC overxpression reduces the number of nearly immobile LDCVs. A, Fraction of vesicles in each type of motion. The fraction of nearly immobile vesicles was reduced but not significantly. B, Fraction of time spent in each type of motion; control, N=25, n=553; TeNt-LC, N=22, n=453. The fraction of time spent in the immobile state was significantly reduced and the fraction of time spent in the caged state was significantly increased. Error bars represent SEM; *, p<0.05.
The fraction of time the LDCVs spend in the immobile state was significantly reduced
(p=0.04) in cells overexpressing TeNt-LC compared to control cells. On the other
hand, LDCVs spend significantly more time in the caged state in TeNt-LC
overexpressing cells (p=0.04) compared to control cells. These results are also the
opposite to those obtained when cells were overexpressing Mun13-1 or treated with
PMA (Fig. 33B).
These results support our hypothesis in which we state that nearly immobile vesicles
represent primed vesicles and that caged vesicles represent docked but unprimed
vesicles.
59

Discussion
4. Discussion
In the present study, we asked the question whether primed vesicles had a different
mobility than docked but unprimed vesicles. It has been previously shown that as
they approach the PM, vesicles lose mobility and that immobilized vesicles are
preferentially secreted. So, are primed vesicles immobile? To answer this question,
we have devised a new method of analysis which allows us to monitor changes in
mobility over time.
We have verified that the results acquired using TIRFM to measure secretion are
qualitatively similar to those obtained using membrane capacitance recordings. This
confirms the complementary role of TIRFM in measuring secretion, in addition to its
irreplaceable role in monitoring presecretion events such as docking and priming.
4.1 The caging diameter: a novel method to analyze motion
We have devised a new method of analyzing the mobility of LDCVs in chromaffin
cells which we call “caging diameter analysis”. The caging diameter is the maximal
distance traveled by a vesicle in a sliding time window of six seconds. This method
allowed us to obtain a CD for each position occupied by the vesicle over the time of
observation. We were able to observe immediately changes in CD of vesicles in a
cell towards a higher or lower CD (higher or lower mobility).
We were also able to distinguish between three different mobility states: Nearly
immobile vesicles (I), caged vesicles (C) and vesicles with directed motion (D). In
addition, we showed that, with this method, we could recognize two transitional
states for vesicles: Immobile-caged vesicles (IC) and vesicles that have a mixture of
the three main types of mobility states (M). The three main mobility states were
recognized in previous studies (Burke et al. 1997; Steyer et al. 1999; Oheim et al.
2000; Johns et al. 2001). In these studies, the analysis of the LDCVs motion was
made by calculating the MSD, which gave the diffusion coefficient and the caging
radius of single vesicles or by the change in the fluorescence intensity for analyzing
60

Discussion
the motion in the “z” direction. I have shown in the materials and methods section
that analyzing the movement by calculating the MSD can yield incorrect results since
the MSD calculation does not take into account the dynamic changes that could
occur over time. This leads to false interpretations of the actual movement of the
vesicle. In addition, one of the disadvantages of MSD analysis is that the accuracy of
MSD values decrease with Δt due to averaging over smaller number of positions.
Oheim et al. (1999) succeeded in observing changes in mobility by plotting the 3 -D
diffusion coefficient over time, yet this method cannot differentiate between an
immobile vesicle and one that has a directed motion for a relatively short period of
time and having a low velocity.
More recently, Huet et al. (2006) have developed a method that seems to accurately
describe the changes in mobility that vesicles undergo. This method depends on the
calculation of three parameters: the diffusion coefficient to detect immobility, MSD
curvature to detect caged motion and asymmetry to detect directed motion. Similar to
our method of CD analysis, Huet et al. (2006) had to choose a time window of
analysis, but this sliding window depended on the type of motion to be analyzed and
thus was different for each case. Our sliding time window was in all cases six
seconds long. This period of time was chosen after meticulous observation of the
tracked vesicles. When we analyzed the CD with shorter time windows, it did not
allow a reliable classification of the trajectory and the data were extremely noisy,
whereas a larger time window did not allow the detection of brief specific motions due
to averaging of the vesicle’s behavior. Also, Huet et al. (2006) had to verify and
manually correct several of their sliding windows, while our method of analyzing the
CD is fully automatic and human interference is minimal.
In the present work, I chose to ignore the motion in the “z” direction due to the error
in determining the evanescent wave’s depth and because the fluorescence intensity
was different from one vesicle to the other.
61

Discussion
4.2 Secreted vesicles motion is different
By analyzing the CD of secreted and non secreted vesicles, I was able to show that
secreted vesicles had a different mobility than that of non secreted ones.
Analyzing the size distribution of CDs, I found that there were four populations of
CDs with different means and fractions of incidence. The first one with a mean of
56 nm represented the jitter inherent to our experimental system. The second
population had a mean of 101 nm in both secreted and non secreted vesicles, but the
incidence of this population was three times larger in secreted vesicles compared to
non-secreted ones. This prompted us to think that this large population of CDs which
is reduced in size when analyzing the mobility of non-secreted vesicles represented
the mobility of primed vesicles (since the vesicles analyzed were exocytosed, they
must have been primed prior to fusion). The third population had a mean of 220 nm
and its incidence was four and a half times larger in non-secreted vesicles than in
secreted ones. We thus assumed that this population of CDs represented the docked
but not necessarily primed vesicles. The fourth population had a mean of 520 nm and
its incidence was similar in secreted and non-secreted vesicles (less than 7%). This
population represented the vesicles with large movements.
The CD corresponds to double the caging radius i.e. a CD of 101 nm would
correspond to a caging radius of 50.5 nm. Our caging radii may differ slightly from
those obtained by others (Oheim et al. 2000; Huet et al. 2006). This may be due the
difference in the inherent jitter of the different experimental setups. The inherent jitter
of our system was tested using beads fixed to the coverslip. The system jitter was
tested (Oheim et al. 2000; Huet et al. 2006) and was found to be different from our
calculated jitter value. This may be due to the difference in equipment, cameras, pixel
size and signal to noise ratio. Oheim et al. (2000) uses a system that has a very low
signal compared to ours and uses an image intensifier to correct for the low signal.
This may affect the inherent jitter of the system and thereafter the values for caging
radii obtained.
Our concern at this point was to verify whether the different molecular states
corresponded to certain types of movements. To answer this question, we classified
motion according to the size distribution of the CDs and we delimited each type of
motion.
62
Discussion
The first limit was set as the intersection point of the two populations of CDs which
was 169 nm to differentiate nearly immobile vesicles (I) from caged ones (C). With
the same reasoning we set 403 nm, the intersection point between the caged
vesicles and those having a directed motion (D), as the CD that distinguishes these
two populations.
Now that the method of analysis of the movement was established and that we found
a notable difference in mobility between secreted thus primed vesicles and those that
were not secreted, it remained to be proven that primed vesicles are indeed nearly
immobile.
4.3 Priming leads to a reduction in the LDCV mobility
I enhanced priming using two independent methods: treatment with PMA and
overexpression of Munc13-1. The cells used in both cases were recorded at rest.
The cells were depolarized only at the end of the experiment to ascertain their
viability and to monitor exocytosis. Also, I did not interfere with the [Ca2+]i of the cells
thus only enhanced priming affected the LDCVs mobility.
In PMA treated cells, there was a notable reduction in mobility after priming. This was
seen as a reduction in the CD at 50% of PMA treated cells by 24% compared to
control cells. To check which type of motion was affected, I classified the vesicles
into the different mobility types (I, C, IC, D, M).
Docked vesicles are defined as those vesicles residing close to the PM (within 300
nm of the PM). These include both primed and unprimed vesicles. If our assumptions
are correct and primed vesicles are nearly immobile while docked but unprimed ones
are caged then the sum of immobile, caged, and immobile-caged vesicles represents
the docked vesicles. After treatment with PMA this fraction of vesicles (I+C+IC) was
unchanged compared to control which means that docking was not affected by PMA
as observed previously (Gillis et al. 1996; Smith et al. 1997). In contrast, the fraction
of immobile vesicles was increased by 19% compared to control whereas the fraction
of caged and immobile caged vesicles was not markedly changed. This indicated that
primed vesicles are indeed nearly immobile since PMA increases only the primed
pool. If that is correct then the fraction of nearly immobile vesicles (primed vesicles)
should be five times smaller than the fraction of caged vesicles (docked but unprimed
vesicles, UPP) as shown previously by Ashery et al. 2000. Yet, I find that immobile
63
Discussion
vesicles represented 45% of the total number of vesicles while caged vesicles
represented only 8% in control condition. This would mean that the number of primed
vesicles is 6 times larger than that of docked but unprimed vesicles (UPP). This
discrepancy can be explained by the transfection method that I used to label the
vesicles with NPY-mRFP. The transfection by means of the semliki virus system
yields cells with a low density of stained vesicles (0.1 vesicle/µm-2) which facilitates
tracking. However, this method of transfection allows the staining of only the newly
generated vesicles which were shown to be preferentially secreted thus primed
(Duncan et al. 2003). Hence, it is likely that this method of transfection allows us to
see a greater fraction of primed vesicles than docked ones. The fraction of vesicles
with mixed behavior decreased by 45% compared to control, probably meaning that
the probability that a vesicle transitions between different states decreases and that
vesicles tend to remain longer in distinct molecular states (primed or docked). In
agreement with the changes observed in the fractions of immobile and caged
vesicles, the fraction of time spent in the immobile state was increased by 20%
compared to control and the fraction of time spent in caged and directed motion was
decreased after PMA treatment.
I then used a second independent method to enhance priming by overexpressing
Munc13-1. Munc13-1 was found to increase the RRP size without affecting the UPP
(Ashery et al. 2000). Overexpression of Munc13-1 caused a reduction in the CD by
28%, thus priming via Munc13-1 causes a reduction in the mobility of vesicles. As
was the case with PMA treated cells, the number of immobile, caged and immobile-
caged vesicles was unchanged in Munc13-1 overexpressing cells confirming
previous findings that Munc13-1 does not affect docking. The fraction of immobile
vesicles was increased by 68% in Munc13-1 overexpressing cells compared to
control cells, while the fraction of caged vesicles was reduced by 48%. As Munc13-1
specifically promotes priming, then the increase in nearly immobile vesicles is due to
the increase of the primed pool. Consistent with these results, the fraction of time
spent in the nearly immobile state was increased by 33% and that spent in the caged
state was decreased by 37%. The changes observed in Munc13-1 overexpressing
cells were more marked than those observed in PMA treated cells. This could be
because PMA is applied to the cell by perfusion and acts through second
messengers while Munc13-1 is expressed in the cells and its action is direct. Thus,
the effects observed in Munc13-1 overexpressing cells are larger compared to the
64

Discussion
effects observed in PMA treated cells even though the analysis of the latter was done
pair wise.
Taken together, the previous findings show that priming by PMA incubation or
Munc13-1 overexpression increase the fraction of immobile vesicles while leaving the
sum of the fractions of immobile, caged and immobile caged unchanged (Fig. 34).
This strongly reinforces our hypothesis that primed vesicles are nearly immobile and
that docked but unprimed ones are caged. This is also consistent with the results
previously obtained (Steyer et al. 1997; Oheim et al. 1998; Johns et al. 2001)
showing that immobilized vesicles were preferentially secreted. In these studies, the
axial mobility (perpendicular to the PM) was analyzed rather than the lateral mobility
(parallel to the PM). They found that as the vesicle approaches the PM its mobility
diminished 4-fold. This suggests that a system or a matrix restricts the mobility of the
vesicle at the PM. This matrix could either consist of the actin filaments or of the
SNARE complex which is supposed to initiate priming. It has been shown that actin
polymerization or depolymerization does not affect exocytosis from already
immobilized vesicles (Oheim et al. 2000). More recently, it was shown that the actin
skeleton provides a system to transport the vesicles from the cytoplasm to the
subplasmalemmal areas and may play a role in bringing the vesicles to the docking
sites (Giner et al. et al. 2005). But it has not been shown to play a role in the priming
process. Therefore SNARE complex formation could be the second possible
explanation for the immobilization of primed vesicles at the PM.
Fig. 34: The different molecular states have different mobilities. The primed pool is represented by the nearly immobile pool (I); the docked but unprimed pool (UPP) is represented by the caged pool (C); the depot pool is represented by the vesicles having a directed motion (D).
65

Discussion
4.4 Mobility of LDCVs increases when priming is prevented
In order to confirm our hypothesis, I expressed the light chain of tetanus toxin in
chromaffin cells. This toxin prevents synaptobrevin from interacting with syntaxin and
SNAP-25 to form the SNARE complex. And since priming is thought to correspond to
the SNARE complex formation, then preventing its formation should prevent priming.
In this way, the fraction of nearly immobile vesicles should decrease and not
increase. As expected, the CD at 50% of vesicles of cells expressing TeNt-LC was
increased by 21.5% compared to control and although the increase was small it was
significant. The fraction of nearly immobile vesicles was decreased by 30% in cells
expressing TeNt-LC compared to control cells but this decreased was not significant.
Yet the fraction of time spent in the nearly immobile state was significantly decreased
by 15% and the fraction of time spent in the caged state was increased by 23%.
We expected that the changes in mobility would be large, but this was not the case.
One reason could be that some vesicles were primed before tetanus toxin was
expressed, and the formed SNARE complex did not allow the toxin to cleave
synaptobrevin. We performed membrane capacitance recordings and found that cells
expressing tetanus toxin showed no secretion, invalidating this. Another reason for
the small changes in mobility could be that synaptotagmin, a vesicular protein, binds
to the t-SNAREs in a constitutive manner before synaptobrevin does (Rickman et al.
2006). This forms a ternary SNARE complex (not including synaptobrevin) that
tethers the vesicle to the PM and thus can mimic priming. This SNARE complex does
not function as a fusogenic complex and is not Ca2+ dependent. It may rather be a
preliminary process for the quick formation of the fusogenic SNARE complex. Thus
the tethering function of synaptobrevin in the priming process could be replaced by
that of synaptotagmin. However, although the changes were not spectacular, they
were opposite to the changes observed when priming was enhanced. Again, this
reinforced our hypothesis that primed vesicles correspond to nearly immobile
vesicles. Our findings agree with those of Toonen et al. (2006) who found that
expression of BoNt/C has a large effect on the axial mobility (perpendicular to the
PM) of LDCVs whereas expression of TeNt-LC had a minor effect and the mobility of
LDCVs was not increased.
66

Discussion
I also found that there was a significant increase in the number of visitors (vesicles
visible for less than 6 s) in TeNt-LC expressing cells compared to control cells. This
was consistent with the increase in the fraction of time spent in directed motion and
probably means that the equilibrium between the depot pool and the docked pool is
disturbed in favor of the depot pool. So either docking is prevented or the undocking
process is enhanced (Fig. 34). This finding agreed with that of Johns et al. (2001)
where cleavage of synaptobrevin using tetanus toxin reduced the time the vesicles
spend near the PM.
Finally, our method of analysis has shown that analyzing the lateral movement
(parallel to the PM) is a good means to study priming since expressing tetanus toxin
yielded visible changes in lateral mobility compared to the analysis of axial mobility
where there was no visible effect of tetanus toxin (Toonen et al. 2006).
4.5 Perspectives
I have shown that the analysis of the caging diameter is a reliable tool to study the
mobility of vesicles and that changes in mobility can be interpreted as changes in the
molecular processes occurring prior to exocytosis. This can allow the investigation of
numerous questions about docking and priming.
1- An important point that can be addressed is the calculation of the different rates of
priming and docking. As mentioned in the introduction, the rate of priming was
calculated using membrane capacitance recordings and the docking rate was
obtained by simulation. Since we can distinguish clearly when a vesicle is in the
primed pool or in the UPP, it should be possible -after optimization of the software- to
calculate these rates in a more direct manner.
2- The analysis of the caging diameter can be a means to clarify the roles of proteins
that showed conflicting effects such as complexinI and II. Genetic deletion of
complexin I and II greatly decreased release efficiency (Reim et al. 2001).
In contrast, it has been found that overexpression of complexin in chromaffin cells
led to a reduction in secretion (Archer et al. 2002). So it might be possible that
complexin plays also a role in fusion pore opening.
67

Discussion
3- In future studies, faster acquisition rates of recordings will be needed to be able to
view subfractions of motion if they exist. This would help to elucidate the dilemma
between studies stating that vesicles prior to exocytosis have a higher mobility
(Allersma et al. 2006) where a recording frequency of 14 Hz was used whereas we
and others (Steyer et al. 1999; Oheim et al. 2000; Johns et al. 2001) find that prior to
exocytosis the vesicles are nearly immobile.
4- Besides its undisputed effect on fusion, calcium has also several effects on the
processes occurring prior to fusion; TIRFM and analysis of the motion of LDCVs can
elucidate these different effects by applying different concentrations of calcium
through a patch pipette and observing the effect on motion. This approach could also
be used to examine the role of ATP in presecretion events.
5- The role of Botulinum toxin B could also be studied since this toxin cleaves both
synaptobrevin and synaptotagmin. This will probably prevent formation of any ternary
SNARE complex whether fusogenic or not. What could be expected from such an
experiment would be a great increase in the mobility of LDCVs and an absence of
nearly immobile vesicles. The changes observed here should be greater than those
observed when tetanus toxin was used.
6- Finally, it has recently been shown that using TIRFM, the observation of single
molecules of proteins is possible (Mashanova et al. 2003; Xiao et al. 2006). Thus it
could be possible to monitor these molecules from the place of their formation to the
site of their interaction over time.
68
Summary
5. Summary
The fusion of vesicles with the presynaptic membrane represents the final event in
the release of neurotransmitters and many other signalling molecules. Prior to fusion,
synaptic vesicles undergo a series of maturation events leading to docking and
priming.
Conventional electrophysiological studies have extensively studied the fusion step
and provided important insights into the docking and priming processes. Up to now,
no method has delivered direct information about the processes occurring prior to
fusion. Total internal reflection fluorescence microscopy allows the real-time
visualization of fluorescent particles with a very high signal to noise ratio. The use of
TIRFM to observe the behaviour of fluorescently marked vesicles allows us to study
the processes occurring prior to fusion with greatly enhanced fidelity.
In the present study, we visualize fluorescent large dense-core vesicles in bovine
chromaffin cells using TIRFM to observe their movements over time. We analyze the
motion of LDCVs using a novel technique we called the “caging diameter” analysis
that permits us to observe the dynamic changes in mobility occurring over time.
Using this method, we have been able to recognize vesicles with different types
motion: a) nearly immobile vesicles, b) caged vesicles, c) immobile-caged vesicles,
d) vesicles with directed motion and e) vesicles with mixed types of motion.
It has previously been shown in chromaffin cells that as the vesicles approach the
plasma membrane, they tend to immobilize and that immobilized vesicles
preferentially fuse with the plasma membrane. It has also been proposed that priming
is the step in which the SNARE complex is formed and that this complex tightly
tethers the vesicles to the plasma membrane. This suggested that priming should
lead to immobilization of vesicles. We have tentatively assigned the behaviour we
termed “nearly immobile” to primed vesicles and the “caged” behaviour to the docked
but unprimed state. To verify this hypothesis, we used a pharmacological approach
to enhance priming. We treated cells with either a phorbol ester or we have
overexpressed Munc13-1 in bovine chromaffin cells; these two methods are known to
enhance priming by increasing the size of the primed pool without affecting the
69

Summary
docked but unprimed pool. Using these treatments, we found that the percentage of
nearly immobile vesicles was increased. As PMA and Munc13-1 increase only the
primed pool and as only the fraction of nearly immobile vesicles was increased, we
conclude that primed vesicles are nearly immobile. With similar reasoning, we
conclude that docked but unprimed vesicles are indeed caged vesicles and that
vesicles with directed motion are neither primed nor docked and thus belong to the
depot pool.
To challenge our hypothesis, we have prevented priming by expressing the light
chain of tetanus toxin in bovine chromaffin cells. This toxin cleaves synaptobrevin
and prevents it from participating in the SNARE complex formation. We found that
the mobility of LDCVs was increased. The fraction of nearly immobile vesicles was
decreased as well as the fraction of time spent in the immobile state. The fraction of
time spent in the caged state was increased. Although the changes were not
spectacular, they were the opposite from the changes observed when priming was
enhanced. This confirms our hypothesis that priming corresponds to immobilization
of vesicles and agrees well with the previous findings that immobilized vesicles
preferentially fuse with the plasma membrane.
70
Literature
6. Literature
Allersma, M., Bittner, MA, Axelrod, D and Holz, RW (2006). "Motion Matters: Secretory Granule Motion Adjacent to the Plasma Membrane and Exocytosis." Mol Biol Cell 17: 2424–2438. Almers, W. (2001). "Fusion needs more than SNAREs." Nature 409(6820): 567-8. Aravamudan, B., Fergestad, T., Davis, W.S., Rodesch, C.K., and Broadie, K. (1999). "Drosophila UNC-13 is essential for synaptic transmission." Nat Neurosci 2: 965-971. Archer, D. A., Graham, M.E., and Burgoyne, R.D. (2002). "Complexin regulates the closure of the fusion pore during regulated vesicle exocytosis." J Biol Chem 277: 18249-18252. Artalejo, C. R., Elhamdani,A., and Palfrey, H. C. (2002). "Sustained stimulation shifts the mechanism of endocytosis from dynamin-1-dependent rapid endocytosis to clathrin- and dynamin-2-mediated slow endocytosis in chromaffin cells." PNAS 99(9): 6358–6363. Ashery, U., Betz, A, Xu, T, Brose, N, and Rettig, J. (1999). "An efficient method for infection of adrenal chromaffin cells using the Semliki Forest virus gene expression system." Eur J Cell Biol 78: 525-532. Ashery, U., Varoqueaux, F, Voets, T, Betz, A, Thakur, P, Koch, H, Neher, E, Brose, N, and Rettig, J (2000). "Munc13-1 acts as a priming factor for large dense-core vesicles in bovine chromaffin cells." EMBO J 19: 3586-3596. Augustin, I., C. Rosenmund, T. C. Sudhof and N. Brose (). (1999). "Munc13-1 is essential for fusion competence of glutamatergic synaptic vesicles." Nature 400(6743): 457-61. Axelrod, D. (2001). "Total internal reflection fluorescence microscopy in cell biology." Traffic 2(11): 764-74. Bennett, M. K., and Scheller, R. H. (1993). "The molecular machinery for secretion is conserved from yeast to neurons." Proc. Natl. Acad. Sci. 90: 2559-2563.
71

Literature
Betz, A., Ashery, U., Rickmann, M., Augustin, I., Neher, E., Sudhof, T.C., Rettig, J., and Brose, N. (1998). "Munc13-1 is a presynaptic phorbol ester receptor that enhances neurotransmitter release." Neuron 21: 123-136. Beutner, D. a. T. M. (2001). "The presynaptic function of mouse cochlear inner hair cells during development of hearing." J Neurosci 21(13): 4593-9. Borst, J. G., F. Helmchen and B. Sakmann (1995). "Pre- and postsynaptic whole-cell recordings in the medial nucleus of the trapezoid body of the rat." J Physiol 489(( Pt 3)): 825-40. Breidenbach, M. A., and Brunger, A.T. (2005). "New insights into clostridial neurotoxin–SNARE interactions." TRENDS in Molecular Medicine 11(8): 377-381. Brose, N., C. Rosenmund and J. Rettig (2000). "Regulation of transmitter release by Unc-13 and its homologues." Curr Opin Neurobiol 10(3): 303-11. Burke, N., Han, W, Li, D, Takimoto, K, Watkins, SC, and Levitan, ES. (1997). "Neuronal peptide release is limited by secretory granule mobility." Neuron 19: 1095-1102. Cahill, A. L., Eertmoed, A. L.,. Mangoura, D., and Perlman, R. L. (1996). "Differential regulation of phenylethanolamine N-methyltransferase expression in two distinct subpopulations of bovine chromaffin cells." J Neurochem 67(3): 1217-24. Calakos, N., Schoch, S., Sudhof, T.C., and Malenka, R.C. (2004). "Multiple roles for the active zone protein RIM1alpha in late stages of neurotransmitter release." Neuron 42: 889-896. Cole, T. J., . Blendy, J. A, Monaghan, A. P., Krieglstein, K., Schmid, W., Aguzzi, A. , Fantuzzi, G., Hummler, E., Unsicker, K., and Schutz, G. (1995). "Targeted disruption of the glucocorticoid receptor gene blocks adrenergic chromaffin cell development and severely retards lung maturation." Genes Dev 9(13): 1608-21. De Potter, W. P., Partoens, P., Schoups A., Llona I., and Coen E.P. (1997). "Noradrenergic neurons release both noradrenaline and neuropeptides from a single pool: the large dense cored vesicles." Synapse 24: 44-55. Dulubova, I., Sugita, S., Hill, S., Hosaka, M., Fernandez, I., Südhof, T.C., and Rizo, J. (1999). "A conformational switch in syntaxin during exocytosis: role of Munc18." EMBO J 18: 4372-4382.
72

Literature
Duncan, R., Greaves, J, Wiegand, UK, Matskevich, I, Bodammer, G, Apps, DK, Shipston, MJ, and Chow, RH (2003). "Functional and spatial segregation of secretory vesicle pools according to vesicle age." Nature 422: 176-180. Garner, C. C., Kindler,S., and Gundelfinger, E. D. (). "" (): . (2000). "Molecular determinants of presynaptic active zones." Curr Opin Neurobiol 10(3): 321-327. Gillis, K., Mossner, R, and Neher, E. (1996). "Protein kinase C enhances exocytosis from chromaffin cells by increasing the size of the readily releasable pool of secretory granules." Neuron 16: 1209-1220. Giner, D., Ñeco, P., Francés, M.M.,López, I., and ViniegraS. and a. L. M. Gutiérrez (2005). "Real-time dynamics of the F-actin cytoskeleton during secretion from chromaffin cells." Journal of Cell Science 118: 2871-2880. Hanson, P. I., Heuser, J.E., and Jahn, R. (1997). "Neurotransmitter release: four years of SNARE complexes." Curr Opin Neurobiol 7: 310-315. Hay, J., and Scheller, RH. (1998). "SNAREs and NSF in targeted membrane fusion." Curr Opin Cell Biol 9: 505-512. Heidelberger, R., Heinemann, C., Neher, E., and Matthews, G. (1994). "Calcium dependence of the rate of exocytosis in a synaptic terminal." Nature 371(6497): 513-5. Huet, S., Karatekin, E, Tran, VS, Fanget, I, Cribier, S, and Henry, JP (2006). "Analysis of transient behavior in complex trajectories: application to secretory vesicle dynamics." Biophys J(Epub ahead of print). Jahn, R., Lang, T., and Sudhof, T. C. (2003). "Membrane fusion." Cell 112(4): 519-33. Johns, L., Levitan, ES, Shelden, EA, Holz, RW, and Axelrod, D (2001). "Restriction of secretory granule motion near the plasma membrane of chromaffin cells." J Cell Biol 153: 177-190. Junge, H. J., Rhee, J.S., Jahn, O., Varoqueaux, F., Spiess, J., Waxham, M.N., Rosenmund, C., and Brose, N. (2004). "Calmodulin and Munc13 form a Ca2+ sensor/effector complex that controls short-term synaptic plasticity." Cell 118: 389-401.
73

Literature
Kits, K. S., and Mansvelder, H. D. (2000). "Regulation of exocytosis in neuroendocrine cells: spatial organization of channels and vesicles, stimulus-secretion coupling, calcium buffers and modulation." Brain Res Brain Res Rev 33(1): 78-94. Lonart, G., and Sudhof, T. C. (2000). "Assembly of SNARE core complexes prior to neurotransmitter release sets the readily releasable pool of synaptic vesicles." J. Biol. Chem. 275: 27703-27707. Low, P., Norlin, T. , Risinger, C., Larhammar, D., Pieribone, V. A., Shupliakov, O., and Brodin, L. (1999). "Inhibition of neurotransmitter release in the lamprey reticulospinal synapse by antibody-mediated disruption of SNAP-25 function." Eur J Cell Biol 78(11): 787-93. Madison, J. M., Nurrish, S., and Kaplan, J.M. (2005). "Unc-13 interaction with syntaxin is required for synaptic transmission." Curr Biol 15: 2236-2242. Martelli, A. M., Baldini, G., Tabellini, G., Koticha, D., Bareggi, R., and Baldini, G. (2000). "Rab3A and Rab3D control the total granule number and the fraction of granules docked at the plasma membrane in PC12 cells." Traffic 1: 976-986. Mashanova, G. I., Taconb, D., Knighta, A. E., Peckhamb, M., and Molloy, J. E. (2003). "Visualizing single molecules inside living cells using total internal reflection fluorescence microscopy." Methods 29(2): 142-152. Nagai, T., Ibata, K., Park, E. S. , Kubota, M., Mikoshiba, K., and Miyawaki, A. (). (2002). "A variant of yellow fluorescent protein with fast and efficient maturation for cell-biological applications." Nat Biotechnol 20(1): 87-90. Nagy, G., Matti, U., Nehring, R.B., Binz, T., Rettig, J., Neher, E., and Sorensen, J.B. : (2002). "Protein kinase C-dependent phosphorylation of synaptosome-associated protein of 25 kDa at Ser187 potentiates vesicle recruitment." J Neurosci 22: 9278-9286. Nagy, G., Reim, K., Matti, U., Brose, N., Binz, T., Rettig, J., Neher, E., and Sorensen, J.B. (2004). " Regulation of releasable vesicle pool sizes by protein kinase A-dependent phosphorylation of SNAP-25." Neuron 41: 417-429. Oberhauser, A. F., Monck, J. R., and Fernandez, J. M. (1992). "Events leading to the opening and closing of the exocytotic fusion pore have markedly different temperature dependencies. Kinetic analysis of single fusion events in patch-clamped mouse mast cells." Biophys J 61(3): 800-9.
74

Literature
Oheim, M. (2001). "Imaging transmitter release. I. Peeking at the steps preceding membrane fusion." Lasers Med Sci 16(3): 149-158. Oheim, M., and Stuhmer, W (2000). "Tracking chromaffin granules on their way through the actin cortex." Eur Biophys J 29: 67-89. Oheim, M., Loerke, D, Stuhmer, W, and Chow, RH. (1998). "The last few milliseconds in the life of a secretory granule. Docking, dynamics and fusion visualized by total internal reflection fluorescence microscopy (TIRFM)." Eur Biophys J 27: 83-98. Oheim, M., Loerke,D., Stühmer, W., and Chow, R. H. (1999). "Multiple stimulation-dependent processes regulate the size of the releasable pool of vesicles." Eur Biophys J 28: 91-101. Qian, H., Sheetz, MP., and Elson, EL. (1991). "Single particle tracking. Analysis of diffusion and flow in two-dimensional systems." Biophys J 60: 910-921. Reim, K., Mansour, M.,Varoqueaux, F.,McMahon, H.T., Südhof, T.C., Brose, N., and C. and Rosenmund (2001). "Complexins Regulate a Late Step in Ca21-Dependent Neurotransmitter Release." Cell 104: 71-81. Rettig, J., and Neher, E (2002). "Emerging roles of presynaptic proteins in Ca++-triggered exocytosis." Science 298: 781-785. Rhee, J. S., Betz, A., Pyott, S., Reim, K., Varoqueaux, F., Augustin, I., Hesse, D., Sudhof, T.C., Takahashi, M., Rosenmund, C., and Brose, N. (2002). "Beta phorbol ester- and diacylglycerol-induced augmentation of transmitter release is mediated by Munc13s and not by PKCs." Cell 108: 121-133. Richmond, J. E., Davis, W.S., and Jorgensen, E.M. (1999). "Unc-13 is required for synaptic vesicle fusion in C. elegans." Nat Neurosci 2: 959-964. Rickman, C., , Jime´nez, J.L., Graham, M., E. , Archer, D.A., Soloviev, M., Burgoyne, R.D., and Davletov, B. (2006). "Conserved Prefusion Protein Assembly in Regulated Exocytosis." Mol Biol Cell 17: 283–294. Schiavo, G., Matteoli, M, and Montecucco, C (2000). "Neurotoxins Affecting Neuroexocytosis." PHYSIOLOGICAL REVIEWS 80(2): 717-766.
75

Literature
Schluter, O. M., Basu, J., Sudhof, T.C., and Rosenmund, C. (2006). "Rab3 superprimes synaptic vesicles for release: implications for short-term synaptic plasticity." J Neurosci 26: 1239-1246. Schluter, O. M., Schmitz, F., Jahn, R., Rosenmund, C., and Sudhof, T.C. (2004). "A complete genetic analysis of neuronal Rab3 function." J Neurosci 24: 6629-6637. Schoch, S., Castillo, P.E., Jo, T., Mukherjee, K., Geppert, M., Wang, Y., Schmitz, F., Malenka, R.C., and Sudhof, T.C. (2002). "RIM1alpha forms a protein scaffold for regulating neurotransmitter release at the active zone." Nature 415: 321-326. Schutz, D., Zilly, F., Lang, T., Jahn, R., and Bruns, D. (2005). "A dual function for Munc-18 in exocytosis of PC12 cells." Eur J Neurosci 21: 2419-2432. Siegelbaum, S. A., and Kandel, E. R. (1991). "Learning-related synaptic plasticity: LTP and LTD." Curr Opin Neurobiol 1(1): 113-20. Smith, C., and Neher, E. (1997). "Multiple forms of endocytosis in bovine adrenal chromaffin cells." J Cell Biol 139(4): 885-94. Smith, C., Moser, T, Xu, T, and Neher, E. (1998). "Cytosolic Ca2+ acts by two separate pathways to modulate the supply of release-competent vesicles in chromaffin cells." Neuron 20: 1243-1253. Sollner, T., Whiteheart, S. W., Brunner, M., Erdjument-Bromage, H., Geromanos, S., and P. Tempst, and Rothman, J. E. (1993). "SNAP receptors implicated in vesicle targeting and fusion." Nature 362: 318-324. Speidel, D., Bruederle, C.E., Enk, C., Voets, T., Varoqueaux, F., Reim, K., Becherer, U., Fornai, F., Ruggieri, S., Holighaus, Y., Weihe, E., Bruns, D., Brose, N., and Rettig, J. (2005). "CAPS1 regulates catecholamine loading of large dense-core vesicles." Neuron 46: 75-88. Stevens, D. R., Wu, Z.X., Matti, U., Junge, H.J., Schirra, C., Becherer, U., Wojcik, S.M., Brose, N., and Rettig, J. (2005). "Identification of the minimal protein domain required for priming activity of Munc13-1." Curr Biol 15: 2243-2248. Steyer, J., and Almers, W (1999). "Tracking single secretory granules in live chromaffin cells by evanescent-field fluorescence microscopy." Biophys J 76: 2262-2271.
76

Literature
Steyer, J. A., Horstmann, H., and ALMERS, W. (1997). "Transport, docking and exocytosis of single secretory granules in live chromaffin cells." Nature 388: 474-478. Sutton, R. B., Fasshauer, D., Jahn, R., and Brunger, A. T. (1998). "Crystal structure of a SNARE complex involved in synaptic exocytosis at 2.4 A resolution." Nature 395: 347-353. Tadokoro, S., Nakanishi, M., and Hirashima, N. (2005). "Complexin II facilitates exocytotic release in mast cells by enhancing Ca2+ sensitivity of the fusion process." J Cell Sci 118: 2239-2246. Toomre, D., and Manstein, D. J. (2001). "Lighting up the cell surface with evanescent wave microscopy." Trends Cell Biol 11(7): 298-303. Toonen, R., de Vries, KJ, Zalm, R, Südhof, TC, and Verhage, M (2005). "Munc18-1 stabilizes syntaxin 1, but is not essential for syntaxin 1 targeting and SNARE complex formation. ." J Neurochem 93: 1393-1400. Toonen, R., Kochubey, O, de Wit, H, Gulyas-Kovacs, A, Konijnenburg, B, Sorensen, JB, Klingauf, J, and Verhage, M (2006). "Dissecting docking and tethering of secretory vesicles at the target membrane." EMBO J 25: 3725-3737. Voets, T. (2000). "Dissection of three Ca2+-dependent steps leading to secretion in chromaffin cells from mouse adrenal slices." Neuron 28(2): 537-45. Voets, T., Toonen, RF, Brian, EC, de Wit, H, Moser, T, Rettig, J, Südhof, TC, Neher, E, and Verhage, M (2001). "Munc18-1 promotes large dense-core vesicle docking." Neuron 31: 581-591. Washbourne, P., Cansono, V, Graham, ME, Burgoyne, RD, and Wilson, MC. (2001). "The cysteines of SNAP-25 are required for SNARE complex disassembly and exocytosis, not for membrane targeting." Biochem J 357: 625–634. Xiao, M., Phong, A., Ha, C., Chan, T., Cai, D., Leung, L., Wan, E., Kistler, A.L., DeRisi, J.L., Selvin, P.R., and Kwok, P. (2006). "Rapid DNA mapping by fluorescent single molecule detection." Nucleic Acids Research 0(0): 1-12. Xu, T., Rammner, B., Margittai, M., Artalejo, A. R., Neher, E., and Jahn, R. (1999). "Inhibition of SNARE complex assembly differentially affects kinetic components of exocytosis." Cell 99(7): 713-22.
77

Literature
Zenisek, D., Steyer, JA, and Almers, W (2000). "Transport, capture and exocytosis of single synaptic vesicles at active zones." Nature 406: 849-854.
78

Curriculum Vitae Personal data: Name: Shahira Nofal Ibrahim El Sayed Date of birth: 1-12-1974 Place of birth: Burundi Adress: Gerhart-Hauptmann str. 24, 67663 Kaiserslautern Marital status: married Nationality: Egyptian Education: 2003 Master of science in Pharmacology from the Faculty of
Pharmacy, University of Cairo, Egypt 2000 Premaster degree in Pharmacology from Faculty of Pharmacy,
University of Cairo, Egypt 1997 Bachelor of Science in Pharmaceutical sciences (very good)
from the Faculty of Pharmacy, University of Cairo, Egypt 1992 Baccalaureat degree, scientific section (good) from the Lycee
Francais Saint-Louis in Stockholm, Sweden Research work: December 1997-April 2003 Research assistant in the Department of Acute
Toxicology in the National Organization of Drug Control And Research, Cairo, Egypt
December 2003-present Research work for the PhD in the Department of Prof. Dr. Jens Rettig in the institute of PhysiologyGeb. 59 the University of Saarland, Homburg, Germany
79

Publications
Shahira Nofal*, Ute Becherer*, Detlef Hof, Ulf Matti and Jens Rettig
Primed vesicles can be distinguished from docked vesicles by analyzing their
mobility.
Journal of Neuroscience, article accepted.
*=equal contribution
Shahira Nofal, Ute Becherer, Detlef Hof, Ulf Matti and Jens Rettig
Real-time visualization of priming reaction of large dense-core vesicles
5th Forum of European Neuroscience, Vienna, Austria, 2006.
80