Embed Size (px)
Citation preview
Changes in oil marketing in the EEC post-1992; the outlook for the UK heating oils market
Gilbert Jenkins and Chris Peacock THE PURPOSE of this paper is to discuss some of the broader issues for heating oils in the European Economic Community. This will necessarily in- clude consideration of the fuels competing with oil and with the world supply and demand for energy. The supply of heating oils and their pricing will be dependent not only on the EEC oil refining system, but also on imported products.
The second part of the paper concentrates on the United Kingdom mar- ket for heating oils and the competition they face from other fuels. When dealing with the UK market, we shall examine how the markets for heating oils have responded to price changes.
A. The markets for heating oils in EEC countries Western Europe consumes about 17 per cent of the non-Communist
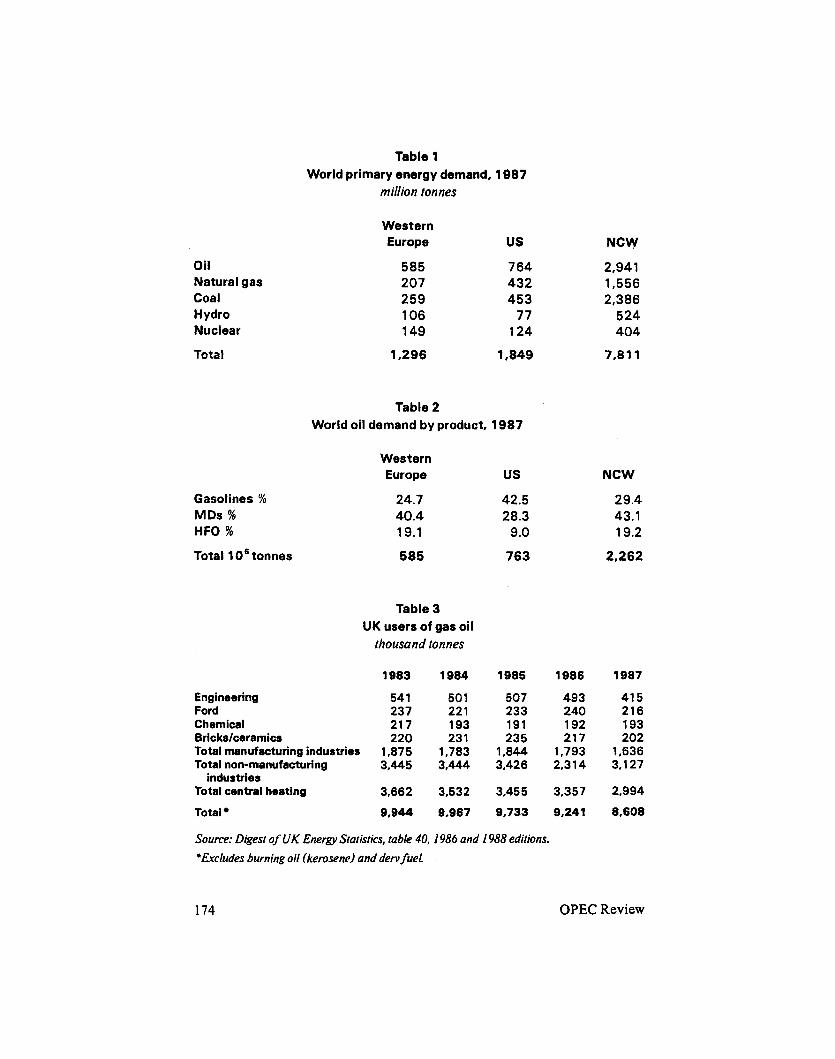
world's (NCW) energy, with a good balance between the energy sources (table 1). Trade in oil products is relatively free in some countries, with, for example, EEC refineries supplying Scandinavia; but it is restricted in others. About 40 per cent of NCW oil demand is supplied as middle distillates, of which about half is for heating fuels (table 2). A further 20 per cent is re- quired as heavy fuel oil (HFO), which is consumed partly for electricity gen- eration and partly in heavy industry.
From table 3, it will be seen that UK consumption is only 8.6 million tonnes of gas oil, which amounts to about four per cent of the gas oil con- sumption in Europe. Furthermore, taking the trade figures between Europe and the rest of the world, shown in table 4, UK consumption is not large. What this means is that the price of gas oil in a free European market will be determined by events outside the UK.
Even the weather, for example, could influence gas oil consumption and hence gas oil prices to a much greater extent than small variations in demand. In each winter quarter in Europe, about 50 mt of gas oil is used for space heating. A really cold quarter would cause consumption to rise to 60 rnt and similarly a mild winter quarter would depress consumption to 40 mt.
The authors are fiom Chem Systems International Lrd, London, UK. This paper was pre- sented at rhe seminar '1 992 - The iinplications for UK energy supplies and prices ", organ- ized by Petroleum Times and Energy Idorrat ion Centre in London on 24 November 1988.
Summer 1989 165
When we examine the consumption of industrial and heating gas oil in the UK over the last five years, we see that there has been a steady decline (table 3).
Total manufacturing industry consumption has fallen from 1.875 mt to 1.636 mt. But, in the food, chemicals, bricks and ceramics sectors, there has been no significant trend; there is relatively little of this remaining market which can be readily taken by natural gas. With the non-manufacturing in- dustry sector and the central heating sector, there is much more scope for natural gas to take this market. British Gas can decide the rate at which it wishes to expand its network and on the discounts it wishes to offer new cus- tomers to attract them away from oil. Therefore, small changes in the taxa- tion on gas oil will not be expected to influence the level of gas oil consump- tion in the UK; the actions of British Gas will.
The major oil-marketing companies Discipline in the market allows only a small proportion of the market to
be supplied by independent price-cutters. Many. customers have contracts with the oil companies and require an assured supply with good service, and are not attracted to spot deals from suppliers which may ‘job’ in and out of the market.
Among the established companies, there will not be a response to triv- ial approaches from customers who are known to be on contract to another company, i.e. low prices will not be quoted which would merely invite a competition clause in an existing contract.
For heating oils, large consumers near oil-refining facilities are always likdly to obtain the cheapest oil. A small consumer in a remote location could possibly have only one available supplier and that consumer will always pay a relatively high price.
Just as some of British Coal’s high-cost coal production has protected markets due to substantial short-haul sea and land transport costs, so some markets for gas oil and heavy fuel oil are protected by transport costs. Trans- port costs fall as the quantity of oil moved increases, but then large storage facilities are required.
The major oil companies have substantial market shares to protect; Shell, Esso and BP each have about 20 per cent of the total UK market of non-derv gas oil and for residual fuel oil sales outside the electricity gener- ation sector. The major oil companies, along with those with lesser but sig- nificant market shares, will protect their markets. For large customers who see a Rotterdam-based price as outstandingly attractive, i t is quite possible that the major oil companies could sell on this basis. The option has always been open for large consumers to buy oil products at international market prices.
166 OPEC Review
These facts partly explain why there are substantial differences in oil product prices between, for example, Ireland and Holland. Government regu- lations (controls relating to Ireland’s one refinery) and competition between the marketing companies are also major factors.
Of considerable importance to the oil companies are the relative quan- tities of oil sold. The weighted proceeds from the market or the gross product worth calculated according to the companies’ sales, is the key parameter relating to the profitability of operations. If the oil company has balanced refining and marketing operations, a refinery with a substantial yield shift capability supplying a large proportion of light and middle distillates is always likely to be more profitable than one with the refining and marketing geared to a relatively black barrel, i.e. large residual fuel oil sales.
B. The Rotterdam spot market and oil product price structures
1. Introduction The situation which develops post-1992 could be compared with that
which developed with the rise of the Rotterdam spot market in the 1960s. Rotterdam prices have a substantial influence on oil product pricing in Europe. But the existence of a wholesale spot market with transparent prices does not make those prices available to all consumers. Only large consumers can buy barge tots (5,000 tonnes) and cargo lots (2S,OOO tonnes), transport them and store them. In some countries, independent oil companies can buy from Rotterdam and sell to end-users, but there are some restrictions and risks and it is necessary for the independent operators to make a profit. Some who sell to end-consumers will buy at Rotterdam only if they can construct a back-to-back deal, i.e. match the buyer and seller and take a guaranteed profit margin for fixing the deal.
The quantity of oil products supplied via the Rotterdam and Genoa markets is about 5 - 10 per cent of European demand. Several price-reporting services and the involvement of the major oil companies in these spot mar- kets ensures that the pricing is relatively transparent, and indeed the EEC has verified this.
2. Product price structure The data included in tables 4, 5 and 6 are concerned with oil product
prices structures in the various EEC countries. The main feature is that both oil product prices and price ratios change from one country to another. This was true in 1975 (table 5 ) and also in 1979 and 1988 (tables 6 and 7). Throughout this period, West Germany, with a relatively free oil market and much influenced by Rotterdam, has had the lowest prices.
Summer 1989 167
The substantial price differences which exist between automotive gas oil and heating gas oil, the products being of identical hydrocarbon composition, requires explanation.
The logic of rationing prices to that of the cheapest residual fuel oil available is that the ratios provide a rough guide to profitability. A straight- run heavy fuel oil prepared from the average EEC crude oil (34.50 API, 1.3 per cent sulphur) is a suitable feedstock for a refinery with conversion capacity.
The products are sold in different markets. Gas oil (derv fuel), when purchased at a filling station, is sold in lots of about 10-200 litres. When gas oil is delivered for central heating, it is delivered in lots of 1,000-10,000 litres. Industrial consumers of gas'oil buy in larger load sizes.
Governments interfere with the markets. For example, by one means or another, they may seek to reduce the price of AGO relative to motor gaso- line to encourage the use of diesel-engined vehicles. This may be achieved both by influencing the pricing structure of the oil product and by regulating taxes.
3. Basic influences on Rotterdam prices Oil product prices are influenced by the prices of the following:
Crude oil Freight Refining Distribution (including small lot surcharges) Competition between oil-marketing companies Oil product price ratios, volatility and stocks Taxes
The prices of crude oil, freight and refining are set very much by the world scene. Distribution, competition and taxes tend to be local. All product price ratios, volatility and stocks are partly Local and partly international.
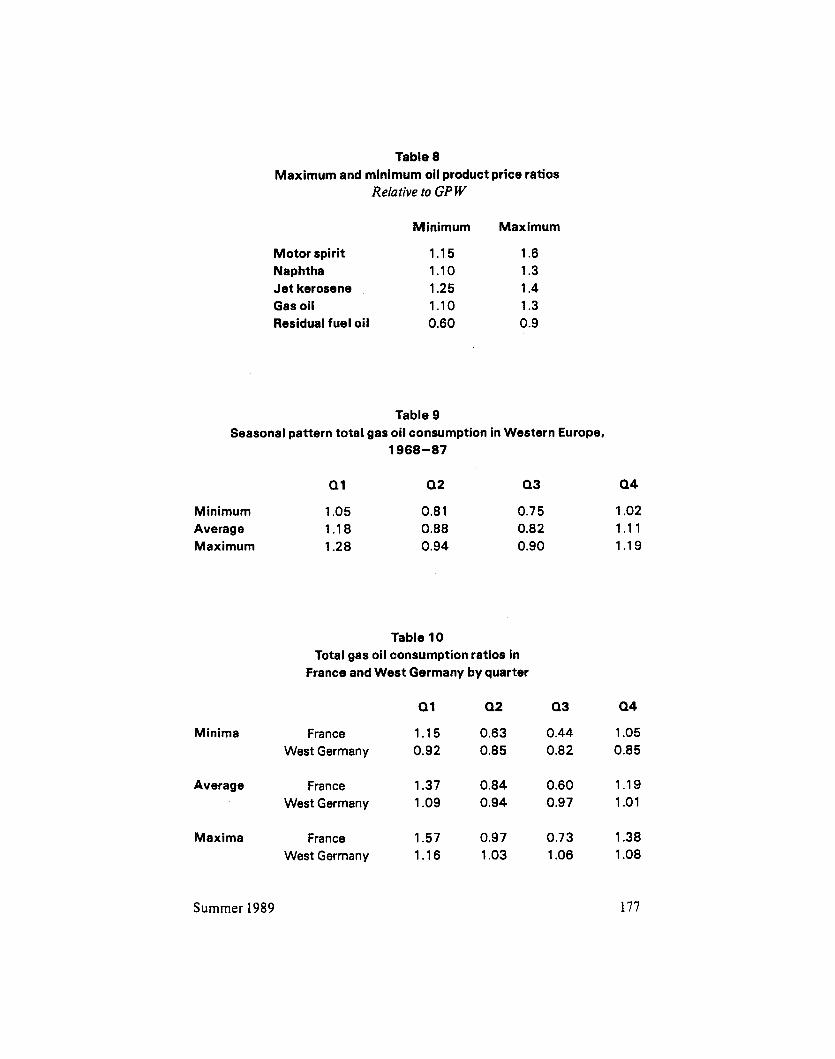
A t any level of the crude oil price, oil product prices can vary, as shown in table 8. In this table, the oil product prices are expressed as a proportion of the gross product worth (GPW), The GPW used was:
GPW = O.1OPMS + 0.03RMS + 0.07LDF + 0.03 jet kerosene
+ 0.30 gas oil + 0.41 HFO 3S%S
This GPW is representative of the products obtained from a topping refinery running a high sulphur crude oil. As crude oil prices, ocean freight rates and
168 OPEC Review
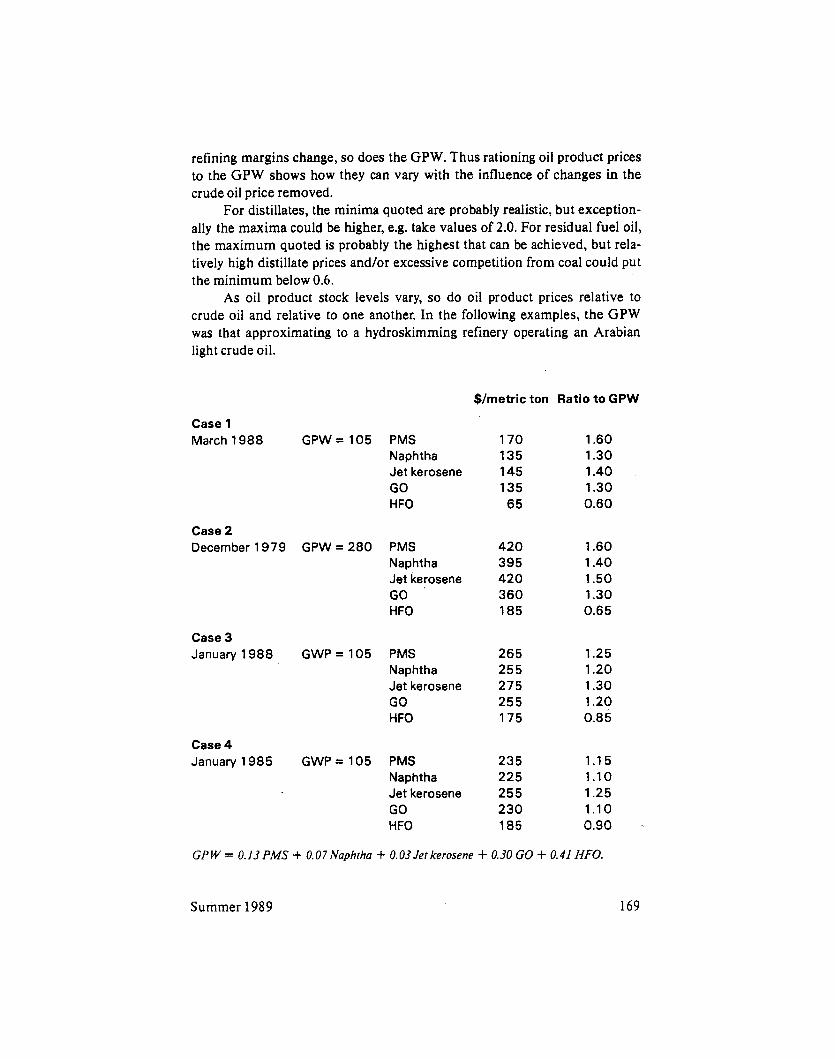
refining margins change, so does the GPW. Thus rationing oil product prices to the GPW shows how they can vary with the influence of changes in the crude oil price removed.
For distillates, the minima quoted are probably realistic, but exception- ally the maxima could be higher, e.g. take values of 2.0. For residual fuel oil, the maximum quoted is probably the highest that can be achieved, but rela- tively high distillate prices and/or excessive competition from coal could put the minimum below 0.6.
As oil product stock levels vary, so do oil product prices relative to crude oil and relative to one another. In the following examples, the GPW was that approximating to a hydroskimming refinery operating an Arabian light crude oil.
$/metric ton Ratio to GPW
Case 1 March 1988
Case 2 December 1979
Case 3 January 1988
Case 4 January 1985
GPW= 105 PMS Naphtha Jet kerosene GO HFO
GPW=280 PMS Naphtha Jet kerosene GO HFO
GWP= 105 PMS Naphtha Jet kerosene GO HFO
GWP=105 PMS Naphtha Jet kerosene GO HFO
170 1.60 135 1.30 145 1.40 135 1.30 65 0.60
420 1.60 395 1.40 420 1.50 360 1.30 185 0.65
26 5 1.25 25 5 1.20 275 1.30 25 5 1.20 175 0.85
23 5 1.15 225 1.10 255 1.25 230 1.10 185 0.90 -
GPW = 0.13PMS + 0.07Naphtha + 0.03Jerkerosene + 0.30 GO + 0.41 HFO.
Summer 1989 169
Part of the reason for changes in oil product price structures is due to the seasonality of demand and its unpredictable variations. Over the last 20 years, the seasonal pattern for gas oil consumption in Western Europe has been as shown in table 9. The reason for the marked seasonal pattern in gas oil consumption is that approximately half the gas oil consumed in Western Europe is used for space heating. The numbers in table 9 reflect the level of consumption relative to an annual average rate of 1.00. Multiplying the fac- tors by 25 provides the percentage of gas oil consumed in each quarter.
The pattern is not consistent from one country to another. When a com- parison is made between the quarterly consumption patterns of gas oil in France and West Germany, there are substantial differences. The main expla- nation for these is the considerable incentive for West German consumers to buy at relatively low prices during off-peak months.
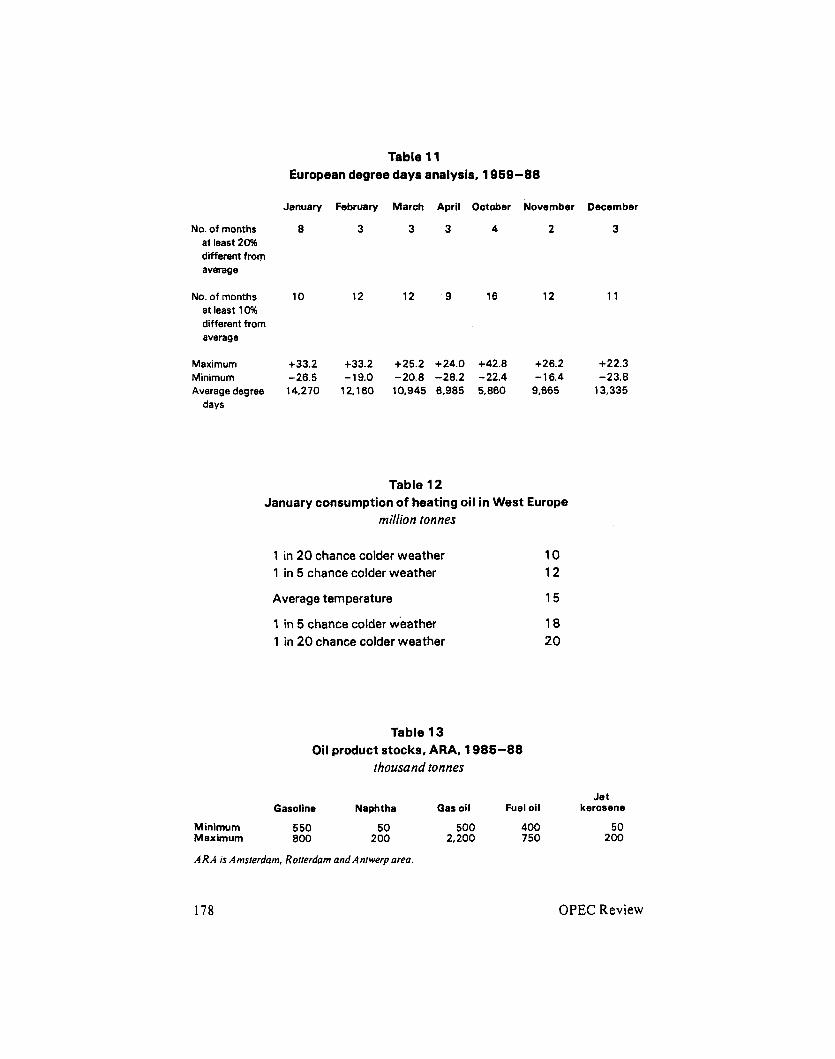
As the weather varies, so will the consumption of heating fuels. The vari- ation to be expected in Europe is shown in table 11, and what this weather va- riation means,in terms of heating gas oil consumption, is shown in table 12.
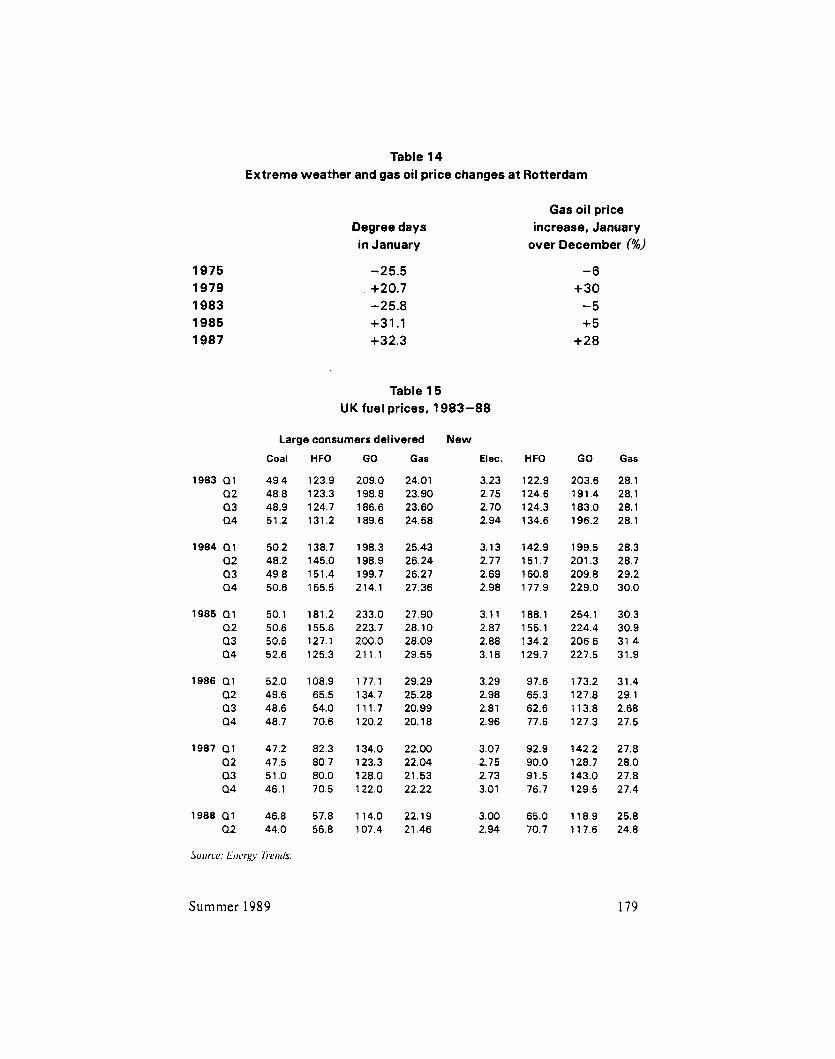
As the consumption of gas oil varies in an unpredictable way, so does the stock level (table 13). As gas oil stocks vary as a result of weather changes or for other reasons,so do prices at Rotterdam (table 14).
Monthly average prices may conceal volatility in the market. For example, in January 1987, gas oil prices rose sharply to a peak in the middle of the month, and then fell away as milder weather set in.
C. Pricing of heating fuels in the UK, 1983-88 While the UK markets for heating fuels tend to be fairly static in terms
of quantities of energy supplied, energy prices for oil products are certainly not static. In the UK, oil prices are basically set by the world primary energy balance and the price of crude oil in international trade. The prices of oil prod- ucts relative to each other vary with oil product stocks and with competition in the oil market.
Thus UK HFO prices were steady near the €125/tonne level in 1983, but rose to fl80/tonne in early 1985, with the miners’ strike a considerable influence in removing competition from the market as well as increasing demand. The summer of 1986 saw an international crude oil price war and UK HFO prices came down to €54/tonne. In 1987, they were f80/tonne, before falling to the €55/tonne level in 1988. Gas oil prices were at the f200/tonne level in the period 1983-85, but have been near fllO/tonne in some recent periods.
In contrast, coal has been relatively steady, at around f80/tonne oil equivalent throughout the period 1983 -88, with UK coal markets relatively insulated from competition from both coal and heavy fuel oil at world inter- national trade prices.
170 OPEC Review
On the whole, UK coal and electricity prices have been exceptionally steady compared with international energy prices. The data are included in table 15 and illustrated in figures 1-7 (Appendix 1) . Two of the main points which may be seen from the data in table 15 are how dynamic oil and gas pric- ing has been and how the miners’ strike enabled the prices of oil and gas to be lifted to very high levels.
UK coal and natural gas policies The UK’s primary energy balance is shown in table 16. The energy
economy may be regarded as well-balanced between the three major fuels. UK coal is high-cost production and, at the present level of production,
it is necessary to protect the industry. If protection was removed, about 50 mt of production might prove to be uneconomic in the face of low-priced heavy fuel oil and low-priced coal in world trade. For such policy issues, changes in taxation levels of oil are second-order effects. Of the coal consumption shown in table 17, half the coal for the electricity sector and most of the sup- plies to the industry and domestic sectors could be replaced by heavy fuel oil, imported coal and some natural gas.
Natural gas marketing in the UK has benefited from a monopolistic position. British Gas prices (table 18) have been relatively steady over the last five years, while UK gas oil prices have fallen, along with crude oil prices (table 19). British Gas has increased its sales in the last two years, even with- out reducing gas prices. It appears unlikely that the customer base which Brit- ish Gas has established (table 20) could be significantly eroded by a low oil price, other than in the industrial sector. Elsewhere in Europe, gas prices were reduced in 1987, following the reduction in oil prices (table 21).
The European gas position has been covered by Andrew Bainbridge in his paper ‘Implications for gas’, but it is important to emphasize here the relative inelasticity of the natural gas and remaining heating oil markets in the UK.
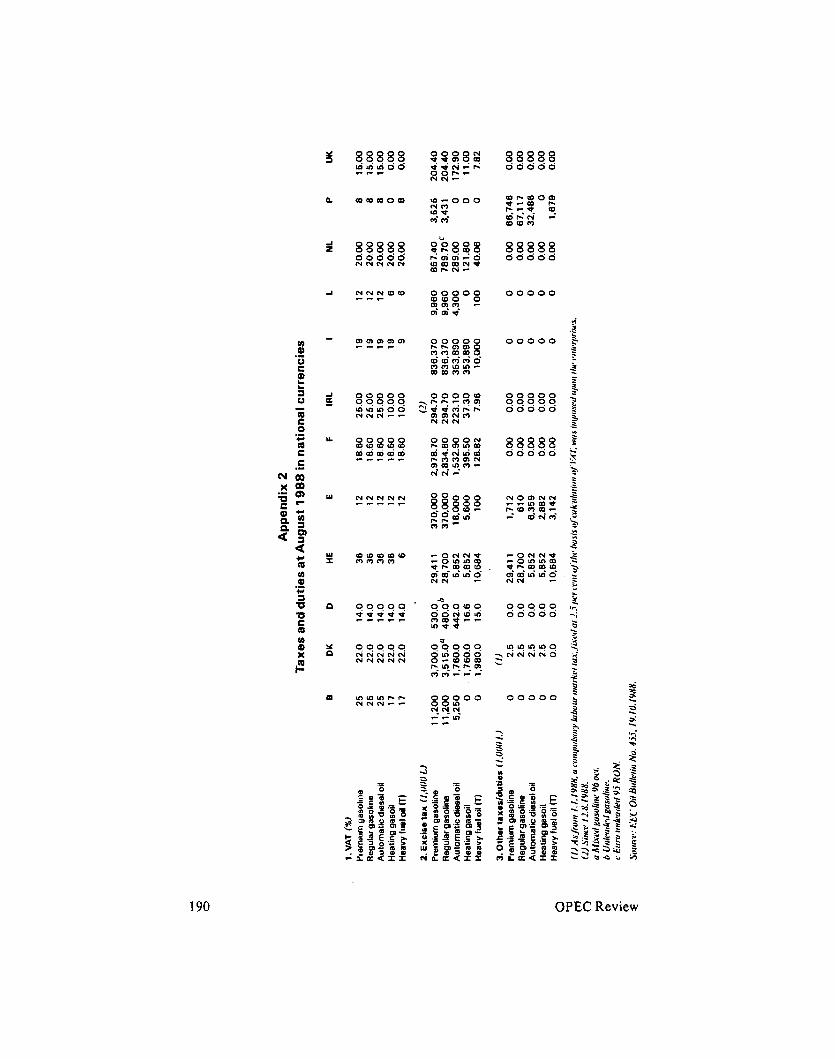
D. Conclusions 1. With heating oils, tax changes currently proposed should not significantly affect the UK market for gas oils and residual fuel oils. Harmonization of taxes as now proposed will influence the current average UK price of gas oil by only about ten per cent and the price of heavy fuel oil by only about five per cent.
2. There have been substantial changes in the price of heating oils in the UK, with very little disruption of market shares either between fuels or oil companies. The proposed changes to the total price of heating oils are
Summer 1989 171
unlikely to affect the UK market significantly. In rough terms, the tax changes influence UK heating oil prices by about the same amount as a change in the international crude oil price of $l/barrel. The oil markets have certainly learned to live with price changes of this magnitude.
3. Market discipline by the oil companies marketing in the UK is likely to remain good. Oil product prices will respond to some extent to changes in the Rotterdam market, but margins are likely to remain high through most periods. It would not be in the consumers’ interests to see vicious price wars emerging in 1992 and after. Price wars kill off competition and subsequently consumers could well pay undesirably high prices. Controlled competition, but without the weaker suppliers being eliminated, is in the consumers’ long- term interests.
4. Competition from outside the UK will come from the relative surplus of gas oil and residual fuel oil in international trade. But their relative cheapness, compared with the UK oil companies’ selling prices, will continue to vary over time.
The major oil companies are unlikely to indulge in cross-border trading and disturb neighbouring markets. It makes no sense to establish an ofice in Paris, with part of its objective to sell oil in the UK in competition with the UK-managed marketing company.
5 . It seems unlikely that relatively minor changes in taxation will reduce the profitability of the oil companies in their product-marketing activities. Oil product profitability is determined mainly by factors such as the levels of capacity utilization in refining and distribution and by competition between the oil companies. Competition tends to be localized and is most severe in areas where excess capacity is concentrated.
6. EEC efforts to maintain adequate levels of oil stocks and refining and distribution facilities are likely to have more influence on prices than the har- monization of oil product taxation. If tax harmonization is merely a prelude to measures such as placing natural gas pipelines on a common carrier status and facilitating trade in electricity between European countries, then further competitive elements will be introduced into the heating fuels markets which could change the balance between fuels.
7. A reduction in the protection afforded to all sectors of the energy industry will be helpful in reducing consumer prices. Security of supply arguments should not be allowed to provide excuses for excessive protectionism.
172 OPEC Review
There are cases for protecting one sector or another of the industry in most EEC countries. The irony of the situation is that the countries in which the energy industry is most protected, with the consequential high prices, are those which are most in need of low energy prices to boost their economies. There are two reasons relating to the oil sector why, for example, Portuguese consumers pay a high price for their oil products. The first is that control of the refinery system is vested in Petrogal, the state oil company. The second is that the Portuguese market is controlled by the State, with only three foreign companies (Mobil, Shell and BP) being allocated about 30 per cent of the gas oil market. Allocation of market shares, as is done by Portugal, does not merely reduce competition in the market-place; it eliminates it.
8. Steps taken by the EEC to protect the environment could well have a more significant effect on energy costs to some consumers than those brought about by the harmonization of taxes.
9. The overall conclusion is that, while the main component of' energy prices in the EEC is set by the price of energy in international trade, actions to harmonize taxes taken by the EEC may prove to be second-order effects, bu t nevertheless are desirable in the long term.
References
1. Proposal Jor a coiincil directive on the approximatioti oj' [lie rules oJ' excise duty on mineral oifs, Cotn(82) 327JinaU2, 21 August 1987.
A jirst step towards the internal energy market, P(88) 22, 27 Augiist 1988.
The interrialenergy market, Cotn(88) 2MJinal ,2 May 1988.
A first step towards the internal energy market, Energy in Europe 11/88, p. 13, 14.
Review oJmeniber states'energVpolicj Eiiergy in Europe 11/8X, p, 15- 18.
2.
3.
4.
5.
Summer 1989 173
Oil Natural gas Coal Hydro Nuclear
Total
Gasolines % MDs % HFO %
Total 10' tonnes
Table 1 World primary energy demand, 1 9 8 7
million tonnes
Western Europe us
585 7 64 207 432 259 453 106 77 149 124
1,296 1.849
Table 2 World oil demand by product, 1 9 8 7
Engineering Ford Chemical Bricks/ceramics Total manufacturing industries Total non-manufacturing
Total central heating
Total
industries
Western Europe
24.7 40.4 19.1
585
Table 3 UK users of gas oil
thousand tonnes
1983 1984
54 1 50 1 237 22 1 21 7 193 220 23 1
1,875 1,783 3,445 3,444
3,662 3,532
9,944 9.967
us 42.5 28.3
9 .o 763
1985
507 233 191 235
1,844 3,426
3,45 5
9,733
Source: Digest of UK Energy Statistics, table 40, 1986 and 1988 editions.
*Excludes burning oil (kerosene) and derv fuel.
NCW
2,941 1,556 2,386
5 24 404
7.81 1
N C W
29.4 43.1 19.2
2,262
1986 1987
493 41 5 240 216 192 193 21 7 202
1,793 1,636 2,314 3,127
3.357 2,994
9.241 8,608
174 OPEC Review
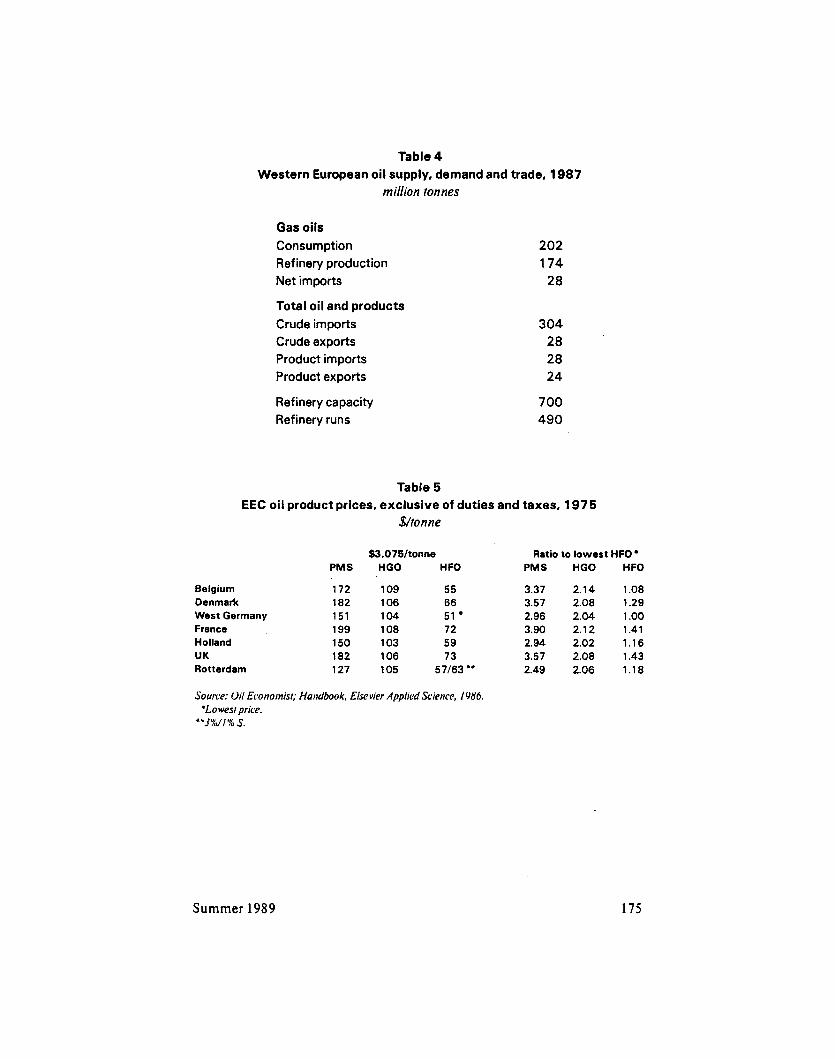
Table 4 Western European oil supply, demand and trade, 1987
million tonnes
Gas oils Consumption Refinery production Net imports
Total oil and products Crude imports Crude exports Product imports Product exports
Refinery capacity Refinery runs
202 174 28
304 28 28 24
700 490
Table 5 EEC oil product prices, exclusive of duties and taxes, 1975
$/tonne
$3.075/tonne Ratio to lowest HFO PMS HGO H FO PMS HGO HFO
Belgium 172 109 55 3.37 2.14 1.08 Denmark 182 106 66 3.57 2.08 1.29 West Germany 151 104 51 2.96 2.04 1.00 France 19s 108 72 3.90 2.12 1.41 Holland 150 103 59 2.94 2.02 1.16
Rotterdam 127 105 5 7/63 ** 2.49 2.06 1.18 UK 182 106 73 3.57 2.08 1.43
Source: Oil Economisr; Handbook. Elsevier Applied Science, 1986.
**Y%il% s. ‘Lo west price.
Summer 1989 175
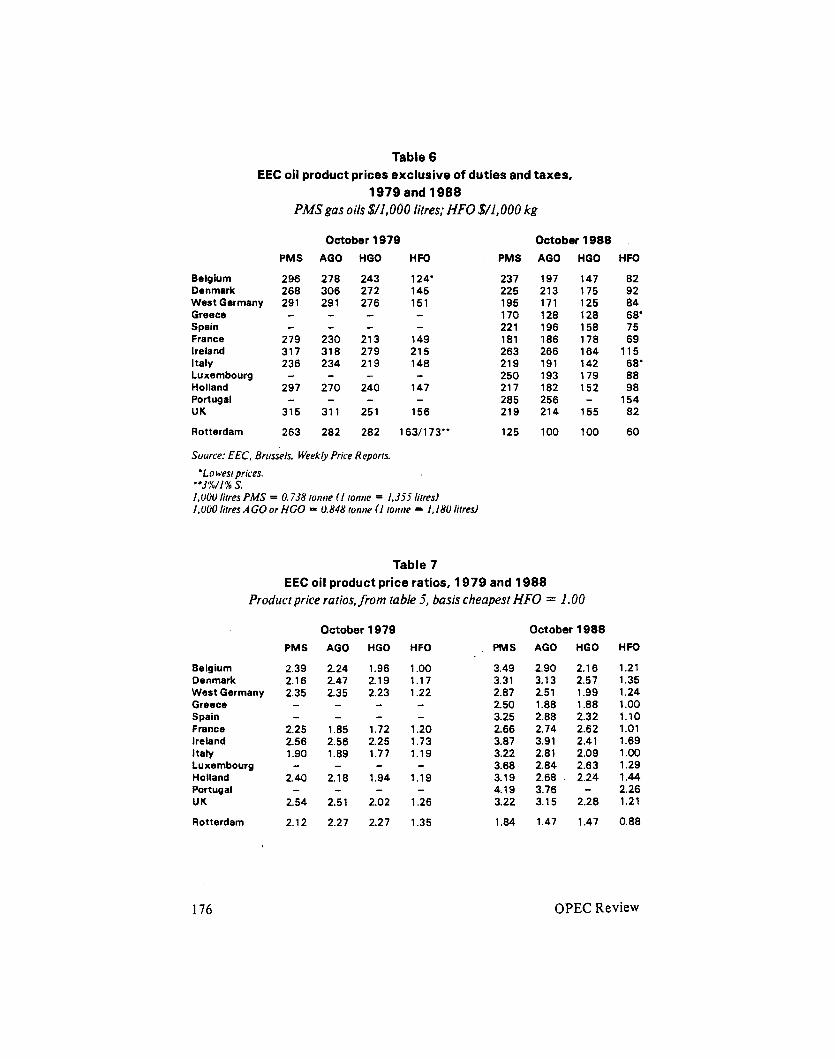
Table 6 EEC oil product prices exclusive of duties and taxes,
1979 and 1988 PMSgas oils $/l,060 litres; HFO $/1,000 kg
October 1979 PMS AGO HGO HFO
Belgium 296 278 243 124' Denmark 268 306 272 145 WestGermany 291 291 276 151 Greece - - - - Spain - - - - France 279 230 213 149 Ireland 317 318 279 215 Italy 236 234 219 148 Luxembourg - - - - Holland 297 270 240 147 Portugal - - - - UK 315 311 251 156
Rotterdam 263 282 282 1631173"
Source: EEC, Brussels. Weekly Price Reports.
" '3WI k s. 1,000 litres PMS = 0.738 tonne ( I tonne = IJj i litresl 1.000 litres AGO or HGO = 0.848 tonne (I tonne = 1.180 litres)
'Lo west prices.
PMS
237 225 195 170 22 1 181 263 21 9 250 21 7 285 21 9
125
October 1988 AGO HGO HFO
197 147 82 213 175 92
128 128 68' 196 158 75 186 178 69 266 164 115 191 142 68' 193 179 88 182 152 98 256 - 154 214 155 82
100 100 60
171 125 a4
Table 7 EEC oil product price ratios, 1979 and 1988
Product price ratios, from table S, basis cheapest HFO = 1.00
October 1979 October 1988 PMS AGO HGO HFO PMS AGO HGO HFO
Belgium 2.39 2.24 Denmark 2.16 2.47 West Germany 2.35 2.35 Greece - - Spain - - France 2.25 1.85 Ireland 2.56 2.56 Italy 1.90 1.89 Luxembourg - - Holland 2.40 2.18 Portugal - - UK 2.54 2.51
1.96 1.00 2.19 1.17 2.23 1.22 - - - - 1.72 1.20 2.25 1.73 1.77 1.19
1.94 1.19
2.02 1.26
- - - -
Rotterdam 2.12 2.27 2.27 1.35
3.49 2.90 2.16 1.21 3.31 3.13 2.57 1.35 2.87 2.51 1.99 1.24 2.50 1.88 1.88 1.00 3.25 2.88 2.32 1.10 2.66 2.74 2.62 1.01 3.87 3.91 2.41 1.69 3.22 2.81 2.09 1.00 3.68 2.84 2.63 1.29 3.19 2.68 2.24 1.44 4.19 3.76 - 2.26 3.22 3.15 2.28 1.21
1.84 1.47 1.47 0.88
176 OPEC Review
Q1 Q2 Q3
Minimum 1.05 0.8 1 0.75 Average 1.18 0.88 0.82 Maximum 1.28 0.94 0.90
Table 10 Total gas oil consumption ratios in
France and West Germany by quarter
Q1 0 2 Q3
Q4
1.02 1.1 1 1.19
Q4
1.05 0.85
Table 8 Maximum and minimum oil product price ratios
Relative to GP W
Motor spirit Naphtha Jet kerosene Gas oil Residual fuel oil
Minimum Maximum
1.15 1.6 1.10 1.3 1.25 1.4 1.10 1.3 0.60 0.9
Table 9 Seasonal pattern total gas oil consumption in Western Europe,
1968-87
Minima France 1.15 0.63 0.44 West Germany 0.92 0.85 0.82
Average France 1.37 0.84 0.60 West Germany 1.09 0.94 0.97
Maxima France 1.57 0.97 0.73 West Germany 1.16 1.03 1.06
1.19 1.01
1.38 1.08
Summer 1989 177
No. of months at least 20% different from average
No. of months at least 10% different from average
Maximum Minimum Average degree
days
Table 11 European degree days analysis, 1959-88
January February March April October November December
8 3 3 3 4 2 3
10 12 12 9 16 12 1 1
+33.2 +33.2 +25.2 +24.0 +42.8 +26.2 +22.3 -26.5 -19.0 -20.8 -28.2 -22.4 -16.4 -23.8 14,270 12.160 10,945 6.985 5,860 9,665 13,335
Table 12 January consumption of heating oil in West Europe
million tonnes
1 in 20 chance colder weather 10 1 in 5 chance colder weather 12
Average temperature 15
1 in 5 chance colder weather 18 1 in 2 0 chance colder weather 20
Table 13 Oil product stocks, ARA, 1985-88
thousand tonnes
Jet Gasoline Naphtha Gas oil Fuel oil kerosene
Minimum 550 50 500 400 50 Maximum 800 200 2.200 750 200
ARA is Amsrerdam, Rotterdam and Antwerp area.
178 OPEC Review
1975 1979 1983 1985 1987
1983 01 Q2 Q3 04
1984 Q 1 Q2 a3 04
1985 Q l Q2 Q3 Q4
1986 01 Q2 Q3 Q4
1987 Q1 a2 Q3 Q4
1988 01 Q2
Table 14 Extreme weather and gas oil price changes at Rotterdam
Degree days in January
+20.7 -25.5
-25.8 +31.1 +32.3
Table 15 UK fuel prices, 1983-88
Large consumers delivered
Coal
49.4 48.8 48.9 51.2
50.2 48.2 49.8 50.6
50.1 50.6 50.6 52.6
52.0 49.6 48.6 48.7
47.2 47.5 51.0 46.1
46.8 44.0
HFO
123.9 123.3 124.7 131.2
138.7 145.0 151.4 165.5
181.2 155.6 127.1 125.3
108.9 65.5 54.0 70.6
82.3 80.7 80.0 70.5
57.8 56.8
GO
209.0 1 98.8 1 86.6 1 89.6
1 98.3 198.9 199.7 214.1
233.0 223.7 200.0 211.1
177.1 1 34.7 1 1 1.7 120.2
134.0 123.3 128.0 122.0
114.0 107.4
Gas
24.01 23.90 23.60 24.58
25.43 26.24 26.27 27.36
27.90 28.10 28.09 29.55
29.29 25.28 20.99 20.18
22.00 22.04 21.53 22.22
22.19 21.46
New
Elec.
3.23 2.75 2.70 2.94
3.13 2.77 2.69 2.98
3.1 1 2.87 2.88 3.18
3.29 2.98 2.81 2.96
3.07 2.75 2.73 3.01
3.00 2.94
Gas oil price increase, January
over December (%)
H FO
122.9 124.6 124.3 134.6
142.9 151.7 160.8 177.9
1 88.1 155.1 134.2 129.7
97.6 65.3 62.6 77.6
92.9 90.0 91.5 76.7
65.0 70.7
-6 +30 -5 +5
+28
GO Gas
203.6 28.1 191.4 28.1 183.0 28.1 196.2 28.1
199.5 28.3 201.3 28.7 209.8 29.2 229.0 30.0
254.1 30.3 224.4 30.9 206.6 31.4 227.5 31.9
173.2 31.4 127.8 29.1 113.8 2.68 127.3 27.5
142.2 27.8 128.7 28.0 143.0 27.8 129.5 27.4
118.9 25.8 1 1 7.6 24.8
SoI1,z.e: L,rergy 7ie,,cls.
Summer 1989 179
Table 16 UK primary energy balance, 1983-87
1983 1984 1986 la86
Coal 35.6 25.3 32.2 33.9 Oil 33.9 43.3 35.2 33.6 Natural gas 23.9 24.5 25.2 24.9 Nuclear electricity 5.8 6.2 6.8 6.4 Hydro electricity 0.0 0.7 0.6 0.7 Electricity imports 0.0 0.0 0.0 0.0
1987 % W'tce
34.4 116.2 32.3 109.3 25.4 85.9
5.9 19.0 0.6 2.1 1.4 4.7
Source: Digest of UK Energy Statistics, 19618,
Table 17 UK coal consumption
Electricity sector Coke ovens Industry Domestic
Total inland
1983 1984 1985 1986 1987
81.6 53.4 73.9 82.6 86.2 10.4 8.2 11.1 11.1 10.9 7.2 6.0 7.5 8.2 8.0 7.9 6.4 8.6 8.5 7.2
111.5 77.3 105.4 114.2 115.9
Table 18 British gas prices, 1982-83 and 1986-87
1982-83 1986-87
Domestic pre-payment 46.7 51.5 Domestic credit 37.5 42.8 Industrial 23.3 23.9 Commercial 32.0 35.8 Government 30.8 34.8 Average 32.1 36.3
180 OPEC Review
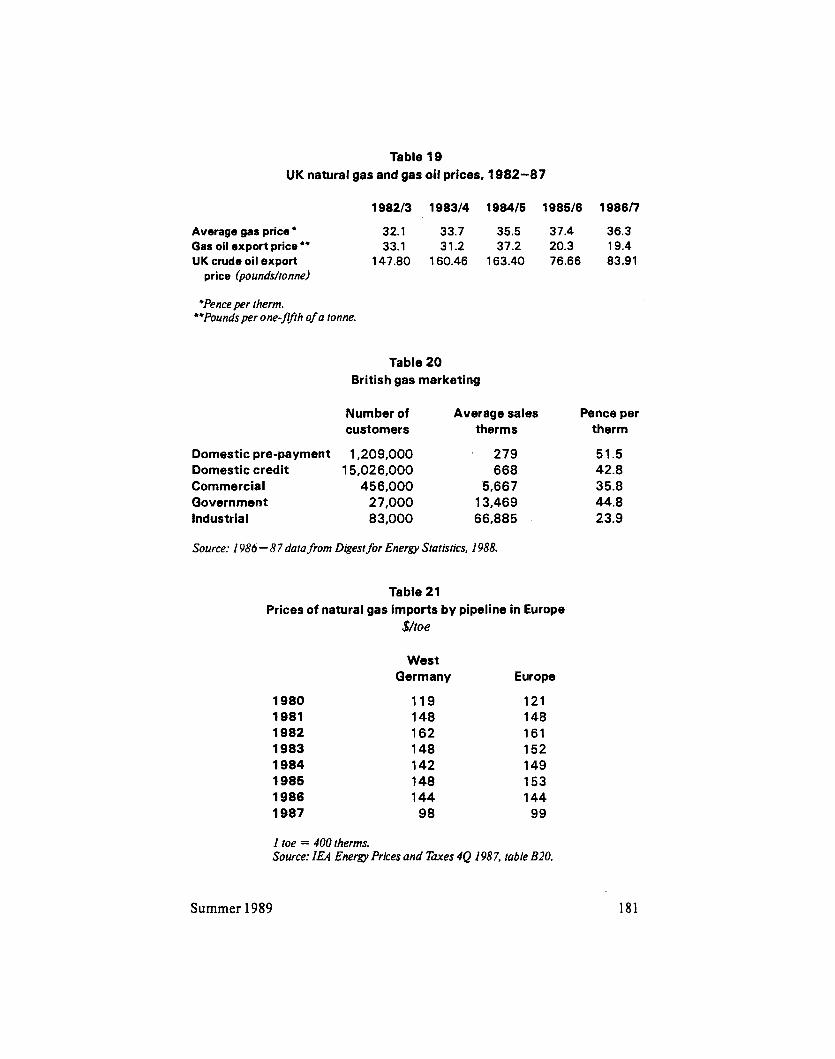
Table 19 UK natural gas and gas oil prices, 1982-87
1 90213 1 98314 198415 198516 190617
Average gas price * 32.1 33.7 35.5 37.4 36.3
UK crude oil export 147.80 160.46 163.40 76.66 83.91 Gas oil export price ** 33.1 31.2 37.2 20.3 19.4
price (poundshonne)
'Pence per therm. **Pounds per one-Jfth of a tonne.
Table 20 British gas marketing
Number of Average sales Pence per customers therms therm
Domestic pre-payment 1,209,000 ' 279 51.5 Domestic credit 15,026,000 668 42.8 Commercial 456,000 5,667 35.8 Government 27,000 13,469 44.8 Industrial 83,000 66,885 23.9
Source: I986 - 8 7 data from Digest for Energv Statistics, I988.
Table 21 Prices of natural gas imports by pipeline in Europe
$/roe
West Germany Europe
1980 1981 1982 1983 1984 1986 1986 1987
119 148 162 148 142 148 144 98
121 148 161 152 149 153 144 99
I toe = 400 rherms. Source: IEA Energy Prices and Taves 4Q I98 7, table B20.
Summer 1989 181

Summer 1989
Appendix 1 UK fuel prices, 1983-88
183
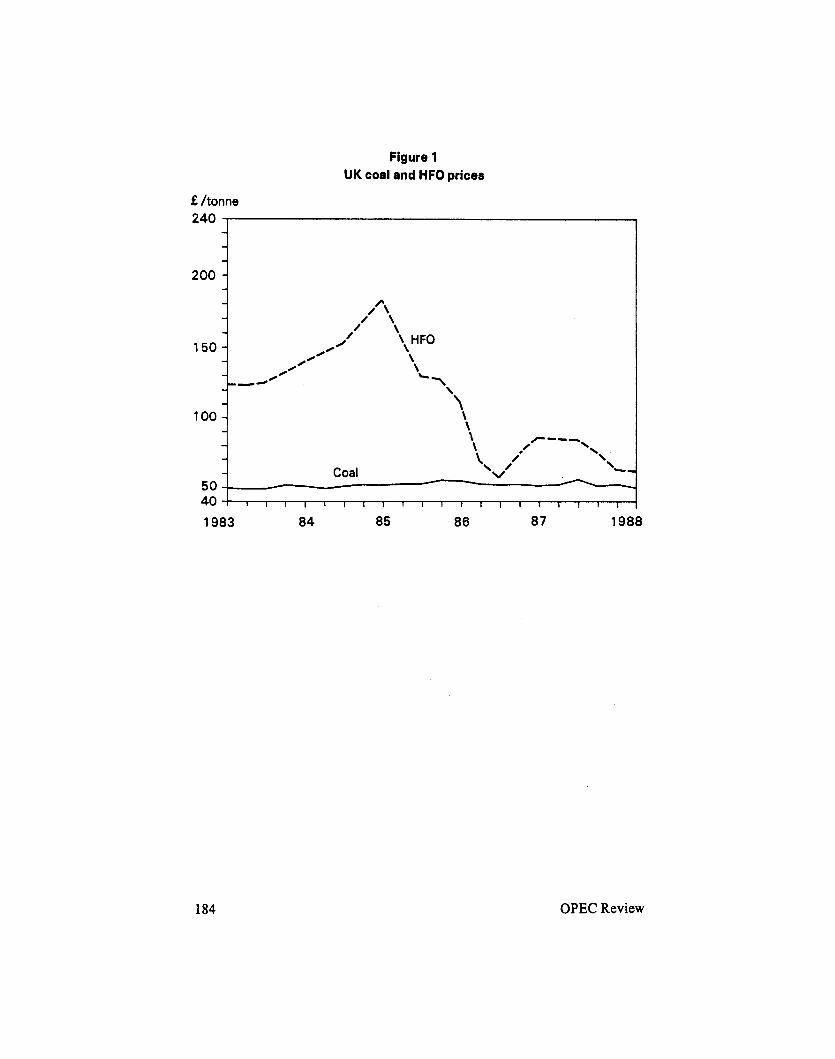
Figure 1 UK coal and HFO prices
E /tonne
4 0 ! , 1 1 1 1 1 1 1 1 1 1 1 1 1 1 1 1 1 1 1
1983 84 85 86 87 1988
184 OPEC Review
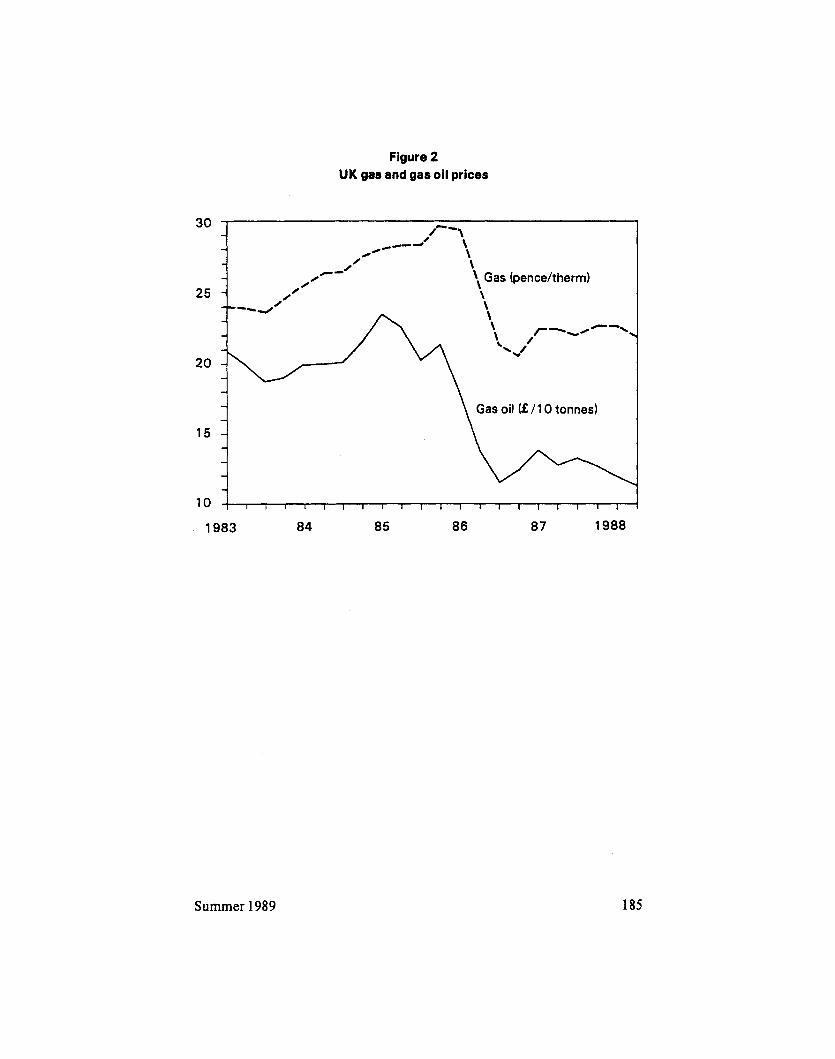
Figure 2 UK gas and gas oil prices
30
25
20
15
1983 84 85 86 87 1988
Summer 1989 185
Figure 3 UK HFO, coal and electricity prices
150
100
50
20
. '*.. HFO (2 /tonne)
1983 84 85 86 87 1988
186 OPEC Review
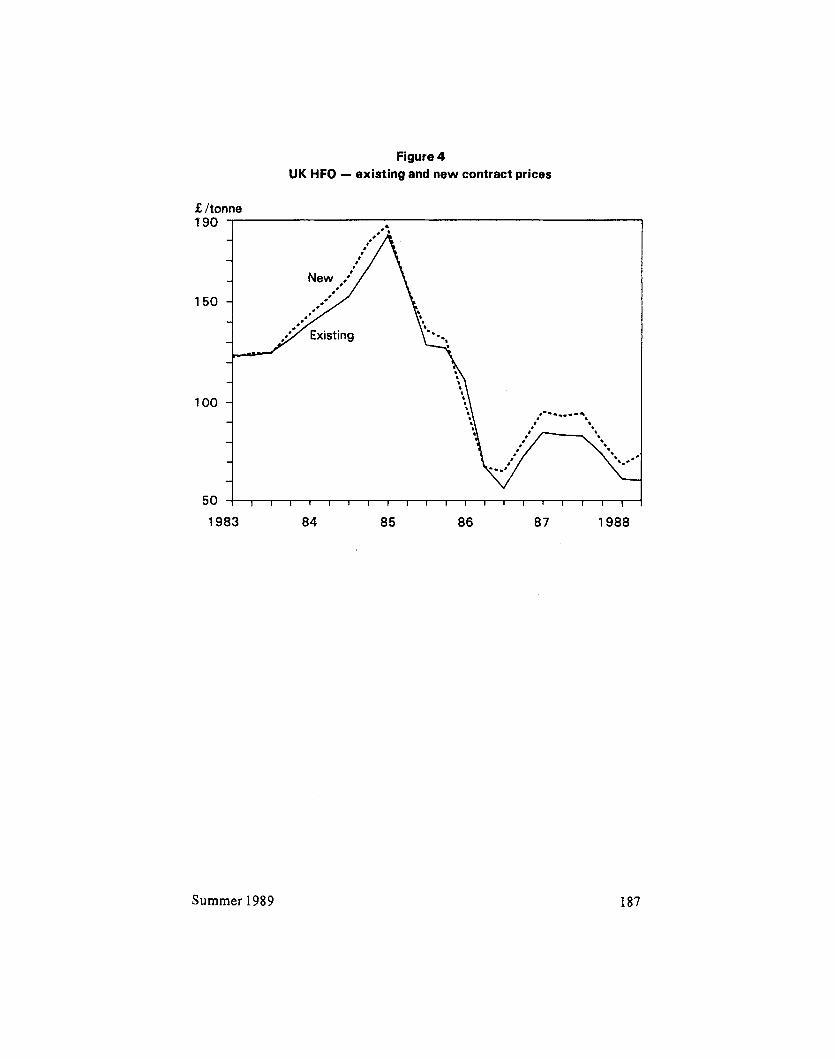
Figure 4 UK HFO - existing and new contract prices
501 1 1 1 1 1 1 1 1 1 1 1 1 1 1 1 1 1 1 1 1
1983 84 85 86 87 1988
Summer 1989 187
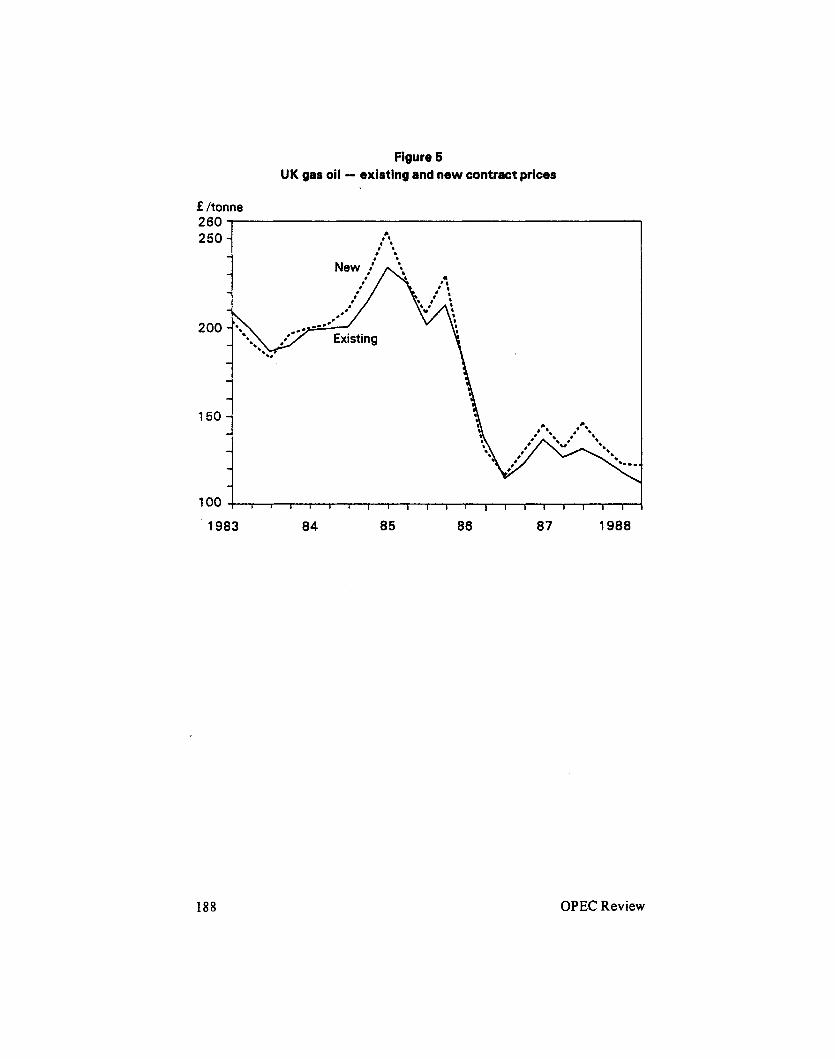
Figure 6 UK gas oil - existing and new contract prices
f /tonne L"" , 250
200
150
100
1983 84 85 86 87 1988
188 OPEC Review
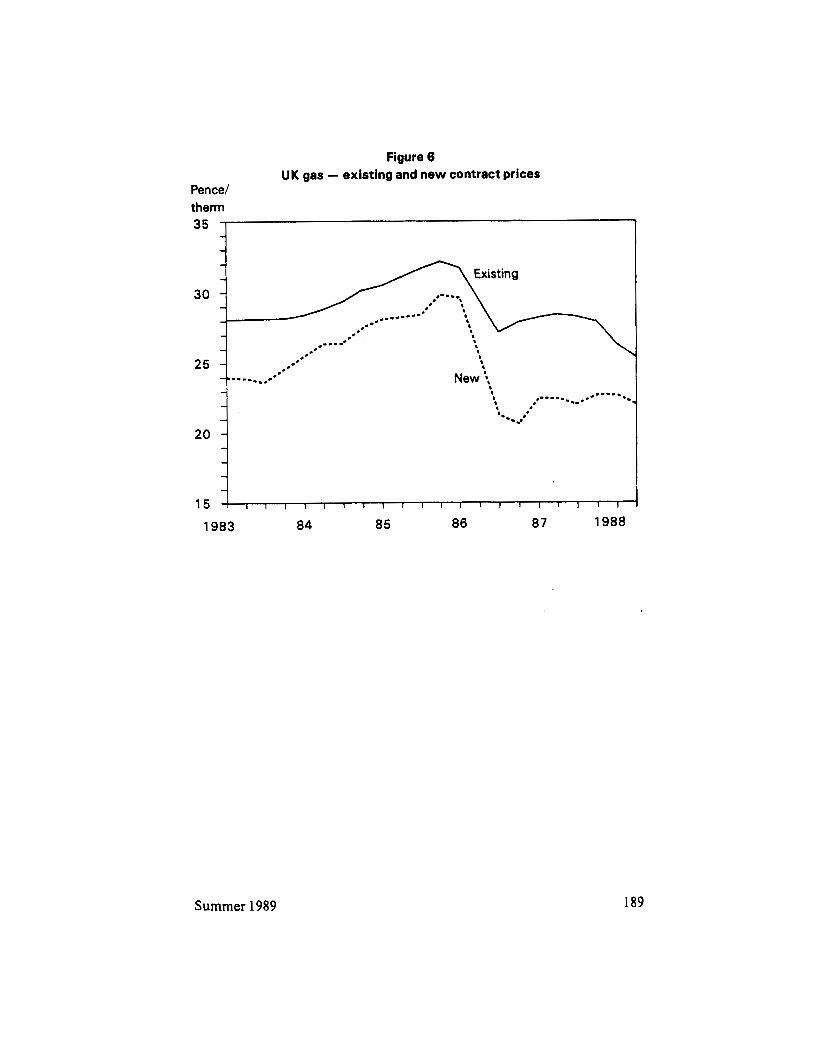
Figure 6 UK gas - existing and new contract prices
Pence/ therm
35 '
2o 15 1983 r 84 85 86 07 1988
Summer 1989 189
1. V
AT
(X)
Pre
miu
m g
asoi
iiie
Reg
ular
gas
ohne
A
utom
atic
dle
sel o
il H
eatin
g ga
soil
Hea
vy fu
el o
il (T
I
B
25
25
25
17
17
2. E
xcis
e ta
n (1
,Itf)U
L)
Pre
miu
m g
asol
ine
1 1.200
Reg
ular
gas
olin
e 1 1.200
Hea
ting
gaso
il 0
Hea
vy fu
el o
il Tr
) 0
Pre
miu
m g
asol
ine
0
Reg
ular
gas
olin
e 0
Aut
omat
ic d
iese
l oil
0
Hea
ting
gaso
il 0
Hea
vy fu
el o
il Tr
) 0
Aut
omat
ic d
iese
l oil
5.250
3. O
ther
taxe
dd
uti
es (I
.UU(
I L
)
0
Ap
pen
dix
2
Tax
es a
nd
du
ties
at A
ug
ust
1988 in
nat
ion
al c
urr
enci
es
DK
D
H
E E
F
IRL
I
22.0
14.0
36
12
18.60
25.00
19
22.0
14.0
36
12
18.60
25.00
19
22.0
14.0
36
12
18.60
25.00
19
22.0
14.0
36
12
18.60
10.00
19
22.0
14.0
6 12
18.60
10.00
9
(2)
3.700.0
530.0
29.41
1 370,000
2.978.70
294.70
836,370
3.515.0" 480.0b 28.700
370,000
2.834.80
294.70
836.370
1.760.0
442.0
5.852
18.000
1.532.90
223.10
353.890
1,760.0
16.6
5.852
5.600
395.50
37.30
353,890
1.980.0
15.0
10.684
100
128.82
7.96
10.000
(1) 2.5
0.0
29.41
1 1.712
0.00
0.00
0
2.5
0.0
28.700
610
0.00
0.00
0
2.5
0.0
5,852
6,359
0.00
0.00
0
2.5
0.0
5.852
2.882
0.00
0.00
0
0.0
0.0
10,684
3.142
0.00
0.00
0
1
12
12
12
6
6
9.960
9.960
4.300 0
100 0
0
0 0 0
NL
P
UK
20.00
8 15.00
20.00
8
15.00
20.00
8
15.00
20.00
0
0.00
20.00
8
0.00
857.40
3,525
204.40
789.70'
3,431
204.40
289.00
0
172.90
121.80
0
11.0
0 40.06
0
7.82
0.00
66.740
0.00
0.00
67.117
0.00
0.00
32.480
0.00
0.00
0
0.00
0.00
1.679
0.00


![RULE:.OF- THUMB Wattage foy Heating Hydraulic Oils/Heater & Cooler Selection Chart.pdf · RULE:.OF- THUMB Wattage foy Heating Hydraulic Oil:]- Watt Will Heat] Gallon 1of in 1Hour](https://img.pdfslide.net/doc/110x75/607439ab4951991aca170f07/ruleof-thumb-wattage-foy-heating-hydraulic-oil-sheater-cooler-selection.jpg)