Embed Size (px)
Citation preview
CLIMATE RESEARCHClim Res
Vol. 36: 29–40, 2008doi: 10.3354/cr00725
Published March 13
1. INTRODUCTION
Windstorms are important atmospheric phenomenathat significantly influence human activity in the BalticSea area. They affect sea transport as well as coastalmanagement. Coastal erosion caused by severe stormsleads to destruction of harbours and sandy beaches.
The relationship between climate change andchanges in storm activity is the subject of much debate.Some studies indicate no significant trends in cycloneactivity and storminess over the Atlantic/Europeansector (WASA Group 1998, Bijl et al. 1999, Gulev et al.2001, Houghton et al. 2001). Other studies demonstrateincreasing winter storminess in northern Europesince the 1960s (Alexandersson et al. 1998, Ulbrich &Christoph 1999, Gulev et al. 2002, Paciorek et al. 2002,Pryor & Barthelmie 2003, Zhang et al. 2004). A north-ward shift of the winter storm track has been observed
during recent decades (Orlanski 1998, Sickmöller et al.2000, McCabe et al. 2001). Consistent with these stud-ies, the number of cyclones passing the Baltic Searegion in winter has increased during the second halfof the 20th century (Sepp et al. 2005).
Changes in other atmospheric parameters have beendetected in Estonia during the same period (Jaagus2006a). Air temperature has increased for Januarythrough May. Increasing precipitation has been ob-served during the cold half of the year, from Octoberuntil March, and also in June. Snow cover duration hasdecreased in Estonia by 17 to 20 d for inland regionsand by 21 to 36 d on the coast between 1951 and 2000.These changes are significantly related to changes inlarge-scale atmospheric circulation, first of all, to anincrease in the intensity of zonal circulation (wester-lies) in winter (Jaagus 2006a). Winter warming is man-ifested in a significant decrease in the number of days
© Inter-Research 2008 · www.int-res.com*Email: [email protected]
Changes in storminess on the western coast ofEstonia in relation to large-scale atmospheric
circulation
Jaak Jaagus1,*, Piia Post2, Oliver Tomingas1
1Department of Geography, University of Tartu, Vanemuise 46, 51014 Tartu, Estonia2Department of Environmental Physics, University of Tartu, Tähe 4, 51014 Tartu, Estonia
ABSTRACT: Intensification of coastal erosion caused by windstorms is an important problem in thecoastal regions of Estonia. The objective of this study was to analyse relationships between stormsobserved at Vilsandi, the westernmost station in Estonia, and large-scale atmospheric circulation.Statistical analyses reveal close correlation between parameters of atmospheric circulation and thenumber of storms. Windstorms are related to intense zonal circulation, i.e. westerlies, while reducedstorminess is associated with meridional circulation. The Arctic Oscillation (AO) index has the high-est correlation (0.68) with the frequency of storms during the winter season (December to February).Even the correlation coefficients for the local zonal circulation index for Estonia do not exceed thisvalue. These results show that large-scale circulation patterns determine circulation on the localscale. Results of the conditional Mann-Kendall test confirm that the increasing trend in winter stormi-ness is induced by a positive trend in the intensity of westerlies, as seen in time series of the AO indexand in the frequency of the circulation form W of Vangengeim and Girs. These changes were mostsubstantial in February.
KEY WORDS: Windstorm · Atmospheric circulation · Baltic Sea · Mann-Kendall test
Resale or republication not permitted without written consent of the publisher
Clim Res 36: 29–40, 2008
with sea ice and an earlier ice break-up along theEstonian coast (Jaagus 2006b).
As a result of these changes, coastal erosion hasbecome much more intense (Orviku et al. 2003). Thenumber of storm days has significantly increased(>50%) at all 3 coastal stations under investigation(Vilsandi, Kihnu, Sõrve) during the second half of the20th century.
The most severe events of coastal erosion occur froma combination of high wind speed, high sea level, andthe lack of sea ice. Climate warming in the Baltic Searegion in winter is directly related to a greater influ-ence of warm air from the North Atlantic, lower pres-sure, and greater cyclonic activity, less snow cover andsea ice (Omstedt et al. 2003, Jaagus 2006a). It leads toincreased storminess and coastal damages.
The latest extreme storm seriously affected theEstonian coast on 9 January 2005 (Suursaar et al.2006). The cyclone was known as Gudrun in theNordic countries and Erwin on the British Isles and inCentral Europe. In Denmark, Scandinavia, Latvia andEstonia, the storm was one of the strongest in the last40 yr, causing massive forest damage, and disruptionof power and phone service. The storm killed at least17 people, including 1 in Estonia. The main propertydamage was a result of strong winds and flooding ofthe coastal areas. The highest storm surge in knownhistory occurred in Pärnu (275 cmabove mean sea level), and probably inmost locations along the West Esto-nian coast as well. Substantial parts ofthe coastal towns Pärnu and Haapsaluwere flooded.
Windstorms are closely related tocyclones and to atmospheric circulationin general. Strong pressure gradientsand storm winds are usually observedin association with deep lows, which aremost frequent in northern Europe dur-ing the period of maximum cyclonicactivity in late autumn and early winter.When anticyclonic conditions prevail,storms are rare.
The objective of the present study wasto analyse relationships between wind-storms, observed at the Vilsandi Station,and the large-scale atmospheric circula-tion. The most important characteristicsinfluencing storminess in Estonia wereselected. To give a better understandingof the variables of atmospheric circula-tion, their correlation maps with sea-levelpressure were presented. Changes instorminess were estimated in relation tochanges in atmospheric circulation.
2. WINDSTORM DATA
Windstorm data were obtained from a catalogue ofstorms over the Island of Vilsandi (Orviku et al. 2003).A storm is defined as an event when a 10 min meanwind speed ≥15 m s–1 is measured during at least 1observation time a day. The windstorm cataloguecontains maximum mean wind speed, wind directionand the duration of storms during the period from 1948to 2004.
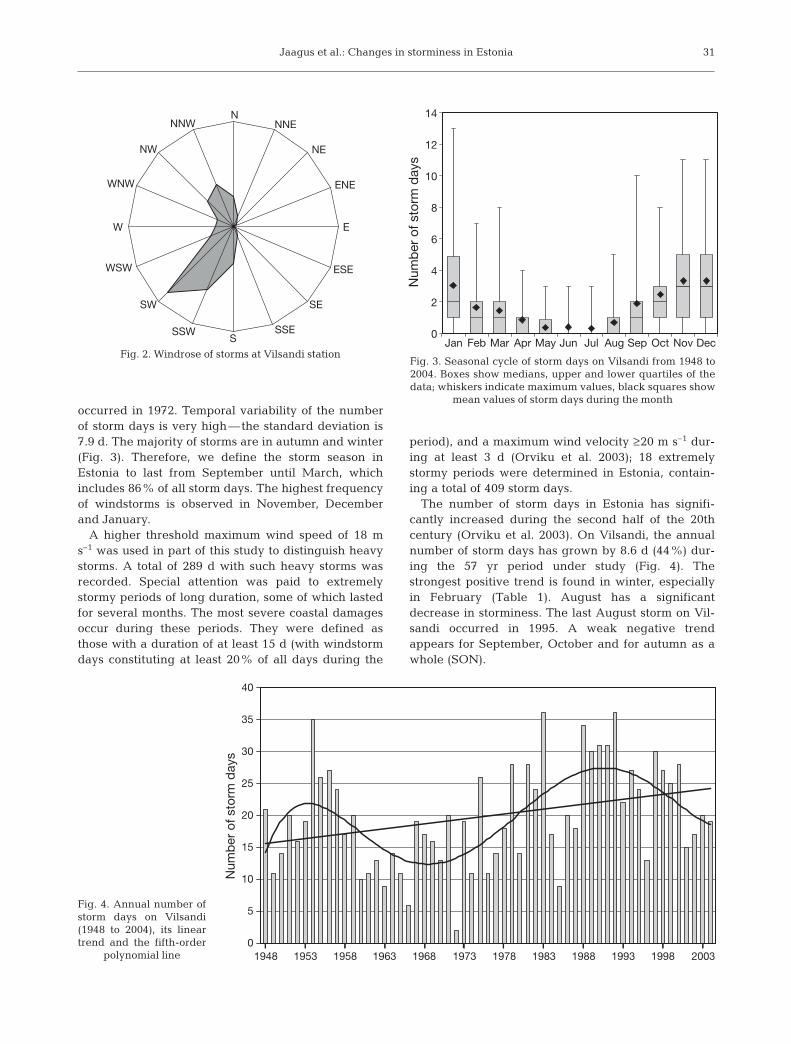
Vilsandi is a small island located close to the centralpart of the Baltic Sea (Fig. 1), near the western coast ofthe island of Saaremaa. It is the westernmost inhabitedplace in Estonia. The highest mean wind speed and themaximum frequency of windstorm days for Estonia arerecorded at this meteorological station (58° 23’ N,21° 49’ E). The site is partly protected by a low forest onthe eastern side and by a lighthouse on the westernside. The windrose compiled using storm events onVilsandi (Fig. 2) demonstrates 2 main directions ofstorm winds: the southwest and northwest, in line withthe results of other studies on wind climate (Soomere2001, Soomere & Keevallik 2001).
A total of 1133 storm days was recorded during 57 yr,giving 19.9 storm days per year on average. The maxi-mum number of storm days at Vilsandi (36) wasobserved in 1992, while the minimum (2 storm days)
30
Fig. 1. Location map of the Vilsandi station (d)
Jaagus et al.: Changes in storminess in Estonia
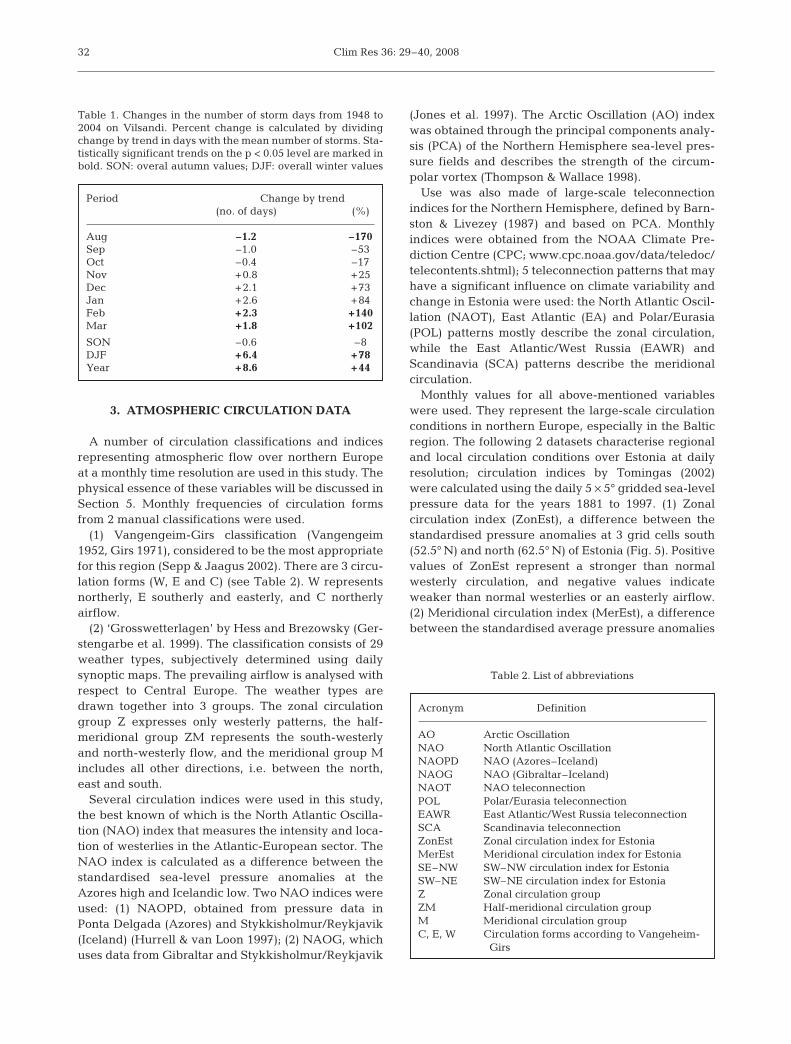
occurred in 1972. Temporal variability of the numberof storm days is very high—the standard deviation is7.9 d. The majority of storms are in autumn and winter(Fig. 3). Therefore, we define the storm season inEstonia to last from September until March, whichincludes 86% of all storm days. The highest frequencyof windstorms is observed in November, Decemberand January.
A higher threshold maximum wind speed of 18 ms–1 was used in part of this study to distinguish heavystorms. A total of 289 d with such heavy storms wasrecorded. Special attention was paid to extremelystormy periods of long duration, some of which lastedfor several months. The most severe coastal damagesoccur during these periods. They were defined asthose with a duration of at least 15 d (with windstormdays constituting at least 20% of all days during the
period), and a maximum wind velocity ≥20 m s–1 dur-ing at least 3 d (Orviku et al. 2003); 18 extremelystormy periods were determined in Estonia, contain-ing a total of 409 storm days.
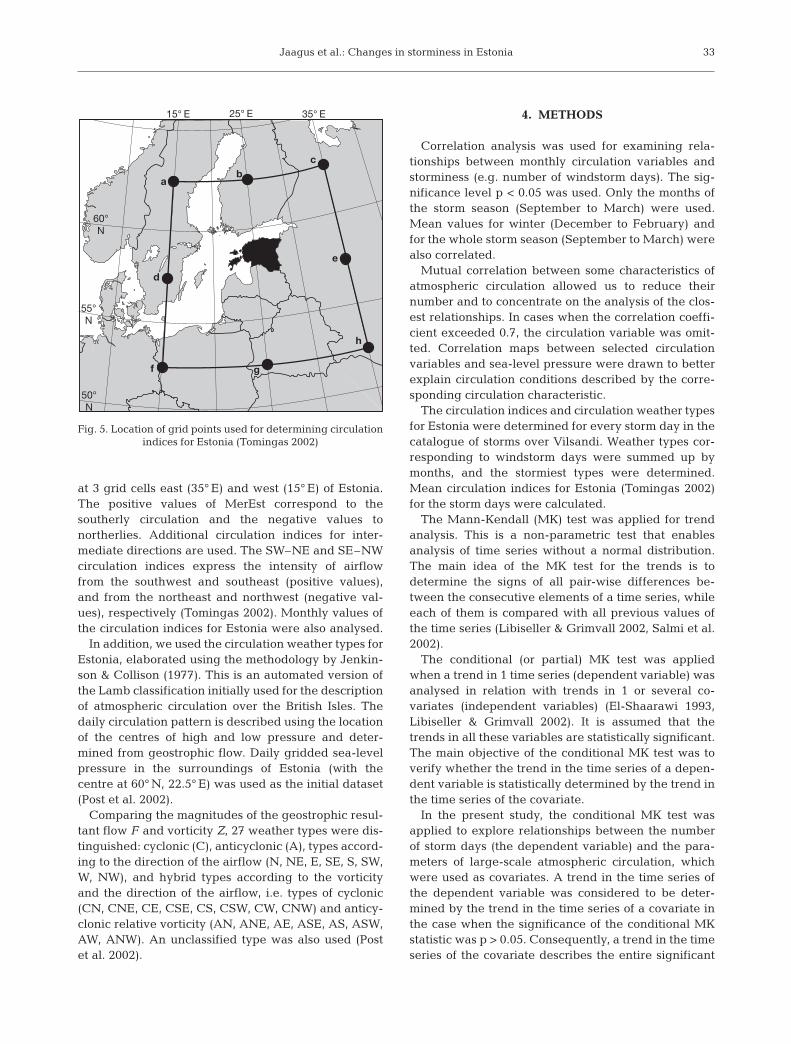
The number of storm days in Estonia has signifi-cantly increased during the second half of the 20thcentury (Orviku et al. 2003). On Vilsandi, the annualnumber of storm days has grown by 8.6 d (44%) dur-ing the 57 yr period under study (Fig. 4). Thestrongest positive trend is found in winter, especiallyin February (Table 1). August has a significantdecrease in storminess. The last August storm on Vil-sandi occurred in 1995. A weak negative trendappears for September, October and for autumn as awhole (SON).
31
NNNE
NE
ENE
E
ESE
SE
SSES
SSW
SW
WSW
W
WNW
NW
NNW
Fig. 2. Windrose of storms at Vilsandi station
14
12
10
8
6
4
2
0Jan Feb Mar Apr May Jun Jul Aug Sep Oct Nov Dec
Num
ber
of s
torm
day
s
Fig. 3. Seasonal cycle of storm days on Vilsandi from 1948 to2004. Boxes show medians, upper and lower quartiles of thedata; whiskers indicate maximum values, black squares show
mean values of storm days during the month
40
35
30
25
20
15
10
5
01948 1953 1958 1963 1968 1973 1978 1983 1988 1993 1998 2003
Num
ber
of s
torm
day
s
Fig. 4. Annual number ofstorm days on Vilsandi(1948 to 2004), its lineartrend and the fifth-order
polynomial line
Clim Res 36: 29–40, 2008
3. ATMOSPHERIC CIRCULATION DATA
A number of circulation classifications and indicesrepresenting atmospheric flow over northern Europeat a monthly time resolution are used in this study. Thephysical essence of these variables will be discussed inSection 5. Monthly frequencies of circulation formsfrom 2 manual classifications were used.
(1) Vangengeim-Girs classification (Vangengeim1952, Girs 1971), considered to be the most appropriatefor this region (Sepp & Jaagus 2002). There are 3 circu-lation forms (W, E and C) (see Table 2). W representsnortherly, E southerly and easterly, and C northerlyairflow.
(2) ‘Grosswetterlagen’ by Hess and Brezowsky (Ger-stengarbe et al. 1999). The classification consists of 29weather types, subjectively determined using dailysynoptic maps. The prevailing airflow is analysed withrespect to Central Europe. The weather types aredrawn together into 3 groups. The zonal circulationgroup Z expresses only westerly patterns, the half-meridional group ZM represents the south-westerlyand north-westerly flow, and the meridional group Mincludes all other directions, i.e. between the north,east and south.
Several circulation indices were used in this study,the best known of which is the North Atlantic Oscilla-tion (NAO) index that measures the intensity and loca-tion of westerlies in the Atlantic-European sector. TheNAO index is calculated as a difference between thestandardised sea-level pressure anomalies at theAzores high and Icelandic low. Two NAO indices wereused: (1) NAOPD, obtained from pressure data inPonta Delgada (Azores) and Stykkisholmur/Reykjavik(Iceland) (Hurrell & van Loon 1997); (2) NAOG, whichuses data from Gibraltar and Stykkisholmur/Reykjavik
(Jones et al. 1997). The Arctic Oscillation (AO) indexwas obtained through the principal components analy-sis (PCA) of the Northern Hemisphere sea-level pres-sure fields and describes the strength of the circum-polar vortex (Thompson & Wallace 1998).
Use was also made of large-scale teleconnectionindices for the Northern Hemisphere, defined by Barn-ston & Livezey (1987) and based on PCA. Monthlyindices were obtained from the NOAA Climate Pre-diction Centre (CPC; www.cpc.noaa.gov/data/teledoc/telecontents.shtml); 5 teleconnection patterns that mayhave a significant influence on climate variability andchange in Estonia were used: the North Atlantic Oscil-lation (NAOT), East Atlantic (EA) and Polar/Eurasia(POL) patterns mostly describe the zonal circulation,while the East Atlantic/West Russia (EAWR) andScandinavia (SCA) patterns describe the meridionalcirculation.
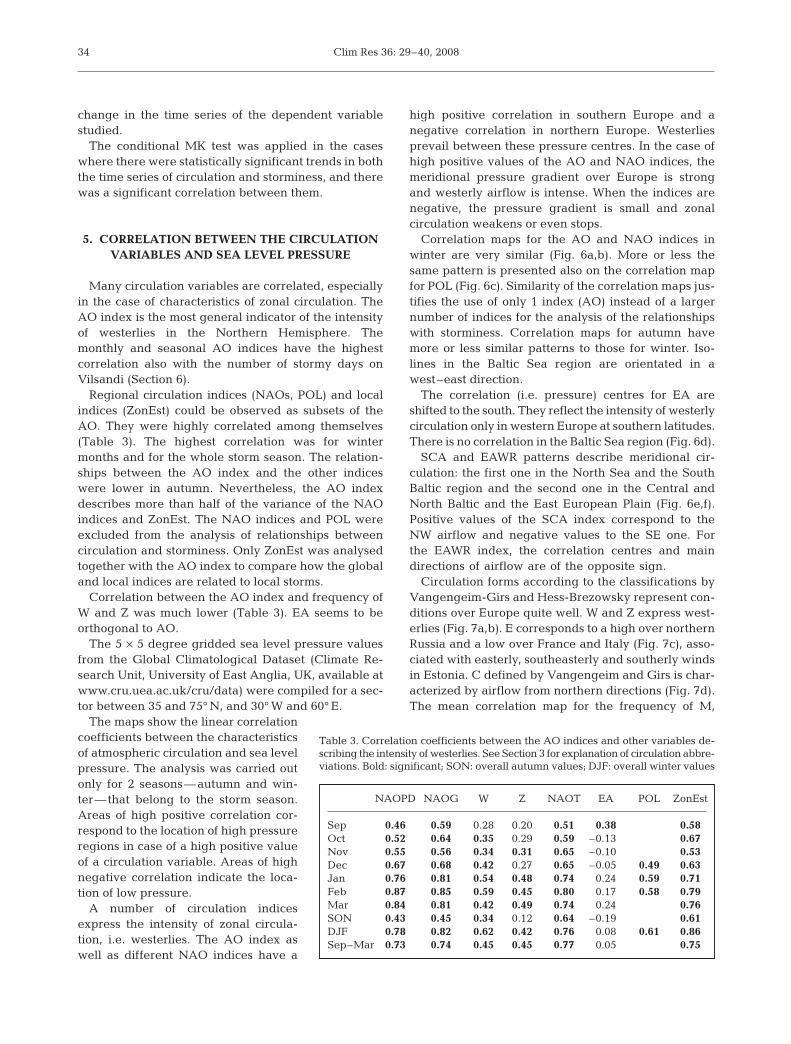
Monthly values for all above-mentioned variableswere used. They represent the large-scale circulationconditions in northern Europe, especially in the Balticregion. The following 2 datasets characterise regionaland local circulation conditions over Estonia at dailyresolution; circulation indices by Tomingas (2002)were calculated using the daily 5 × 5° gridded sea-levelpressure data for the years 1881 to 1997. (1) Zonalcirculation index (ZonEst), a difference between thestandardised pressure anomalies at 3 grid cells south(52.5° N) and north (62.5° N) of Estonia (Fig. 5). Positivevalues of ZonEst represent a stronger than normalwesterly circulation, and negative values indicateweaker than normal westerlies or an easterly airflow.(2) Meridional circulation index (MerEst), a differencebetween the standardised average pressure anomalies
32
Table 2. List of abbreviations
Acronym Definition
AO Arctic OscillationNAO North Atlantic OscillationNAOPD NAO (Azores–Iceland)NAOG NAO (Gibraltar–Iceland)NAOT NAO teleconnectionPOL Polar/Eurasia teleconnectionEAWR East Atlantic/West Russia teleconnectionSCA Scandinavia teleconnectionZonEst Zonal circulation index for EstoniaMerEst Meridional circulation index for EstoniaSE–NW SW–NW circulation index for EstoniaSW–NE SW–NE circulation index for EstoniaZ Zonal circulation groupZM Half-meridional circulation groupM Meridional circulation groupC, E, W Circulation forms according to Vangeheim-
Girs
Table 1. Changes in the number of storm days from 1948 to2004 on Vilsandi. Percent change is calculated by dividingchange by trend in days with the mean number of storms. Sta-tistically significant trends on the p < 0.05 level are marked inbold. SON: overal autumn values; DJF: overall winter values
Period Change by trend(no. of days) (%)
Aug –1.2 –170Sep –1.0 –53Oct –0.4 –17Nov +0.8 +25Dec +2.1 +73Jan +2.6 +84Feb +2.3 +140Mar +1.8 +102
SON –0.6 –8DJF +6.4 +78Year +8.6 +44
Jaagus et al.: Changes in storminess in Estonia
at 3 grid cells east (35° E) and west (15° E) of Estonia.The positive values of MerEst correspond to thesoutherly circulation and the negative values tonortherlies. Additional circulation indices for inter-mediate directions are used. The SW–NE and SE–NWcirculation indices express the intensity of airflowfrom the southwest and southeast (positive values),and from the northeast and northwest (negative val-ues), respectively (Tomingas 2002). Monthly values ofthe circulation indices for Estonia were also analysed.
In addition, we used the circulation weather types forEstonia, elaborated using the methodology by Jenkin-son & Collison (1977). This is an automated version ofthe Lamb classification initially used for the descriptionof atmospheric circulation over the British Isles. Thedaily circulation pattern is described using the locationof the centres of high and low pressure and deter-mined from geostrophic flow. Daily gridded sea-levelpressure in the surroundings of Estonia (with thecentre at 60° N, 22.5° E) was used as the initial dataset(Post et al. 2002).
Comparing the magnitudes of the geostrophic resul-tant flow F and vorticity Z, 27 weather types were dis-tinguished: cyclonic (C), anticyclonic (A), types accord-ing to the direction of the airflow (N, NE, E, SE, S, SW,W, NW), and hybrid types according to the vorticityand the direction of the airflow, i.e. types of cyclonic(CN, CNE, CE, CSE, CS, CSW, CW, CNW) and anticy-clonic relative vorticity (AN, ANE, AE, ASE, AS, ASW,AW, ANW). An unclassified type was also used (Postet al. 2002).
4. METHODS
Correlation analysis was used for examining rela-tionships between monthly circulation variables andstorminess (e.g. number of windstorm days). The sig-nificance level p < 0.05 was used. Only the months ofthe storm season (September to March) were used.Mean values for winter (December to February) andfor the whole storm season (September to March) werealso correlated.
Mutual correlation between some characteristics ofatmospheric circulation allowed us to reduce theirnumber and to concentrate on the analysis of the clos-est relationships. In cases when the correlation coeffi-cient exceeded 0.7, the circulation variable was omit-ted. Correlation maps between selected circulationvariables and sea-level pressure were drawn to betterexplain circulation conditions described by the corre-sponding circulation characteristic.
The circulation indices and circulation weather typesfor Estonia were determined for every storm day in thecatalogue of storms over Vilsandi. Weather types cor-responding to windstorm days were summed up bymonths, and the stormiest types were determined.Mean circulation indices for Estonia (Tomingas 2002)for the storm days were calculated.
The Mann-Kendall (MK) test was applied for trendanalysis. This is a non-parametric test that enablesanalysis of time series without a normal distribution.The main idea of the MK test for the trends is todetermine the signs of all pair-wise differences be-tween the consecutive elements of a time series, whileeach of them is compared with all previous values ofthe time series (Libiseller & Grimvall 2002, Salmi et al.2002).
The conditional (or partial) MK test was appliedwhen a trend in 1 time series (dependent variable) wasanalysed in relation with trends in 1 or several co-variates (independent variables) (El-Shaarawi 1993,Libiseller & Grimvall 2002). It is assumed that thetrends in all these variables are statistically significant.The main objective of the conditional MK test was toverify whether the trend in the time series of a depen-dent variable is statistically determined by the trend inthe time series of the covariate.
In the present study, the conditional MK test wasapplied to explore relationships between the numberof storm days (the dependent variable) and the para-meters of large-scale atmospheric circulation, whichwere used as covariates. A trend in the time series ofthe dependent variable was considered to be deter-mined by the trend in the time series of a covariate inthe case when the significance of the conditional MKstatistic was p > 0.05. Consequently, a trend in the timeseries of the covariate describes the entire significant
33
15° E 35° E25° E
60°N
d
f g
e
h
ab
c
55°N
50°N
Fig. 5. Location of grid points used for determining circulation indices for Estonia (Tomingas 2002)
Clim Res 36: 29–40, 2008
change in the time series of the dependent variablestudied.
The conditional MK test was applied in the caseswhere there were statistically significant trends in boththe time series of circulation and storminess, and therewas a significant correlation between them.
5. CORRELATION BETWEEN THE CIRCULATIONVARIABLES AND SEA LEVEL PRESSURE
Many circulation variables are correlated, especiallyin the case of characteristics of zonal circulation. TheAO index is the most general indicator of the intensityof westerlies in the Northern Hemisphere. Themonthly and seasonal AO indices have the highestcorrelation also with the number of stormy days onVilsandi (Section 6).
Regional circulation indices (NAOs, POL) and localindices (ZonEst) could be observed as subsets of theAO. They were highly correlated among themselves(Table 3). The highest correlation was for wintermonths and for the whole storm season. The relation-ships between the AO index and the other indiceswere lower in autumn. Nevertheless, the AO indexdescribes more than half of the variance of the NAOindices and ZonEst. The NAO indices and POL wereexcluded from the analysis of relationships betweencirculation and storminess. Only ZonEst was analysedtogether with the AO index to compare how the globaland local indices are related to local storms.
Correlation between the AO index and frequency ofW and Z was much lower (Table 3). EA seems to beorthogonal to AO.
The 5 × 5 degree gridded sea level pressure valuesfrom the Global Climatological Dataset (Climate Re-search Unit, University of East Anglia, UK, available atwww.cru.uea.ac.uk/cru/data) were compiled for a sec-tor between 35 and 75° N, and 30° W and 60° E.
The maps show the linear correlationcoefficients between the characteristicsof atmospheric circulation and sea levelpressure. The analysis was carried outonly for 2 seasons—autumn and win-ter—that belong to the storm season.Areas of high positive correlation cor-respond to the location of high pressureregions in case of a high positive valueof a circulation variable. Areas of highnegative correlation indicate the loca-tion of low pressure.
A number of circulation indicesexpress the intensity of zonal circula-tion, i.e. westerlies. The AO index aswell as different NAO indices have a
high positive correlation in southern Europe and anegative correlation in northern Europe. Westerliesprevail between these pressure centres. In the case ofhigh positive values of the AO and NAO indices, themeridional pressure gradient over Europe is strongand westerly airflow is intense. When the indices arenegative, the pressure gradient is small and zonalcirculation weakens or even stops.
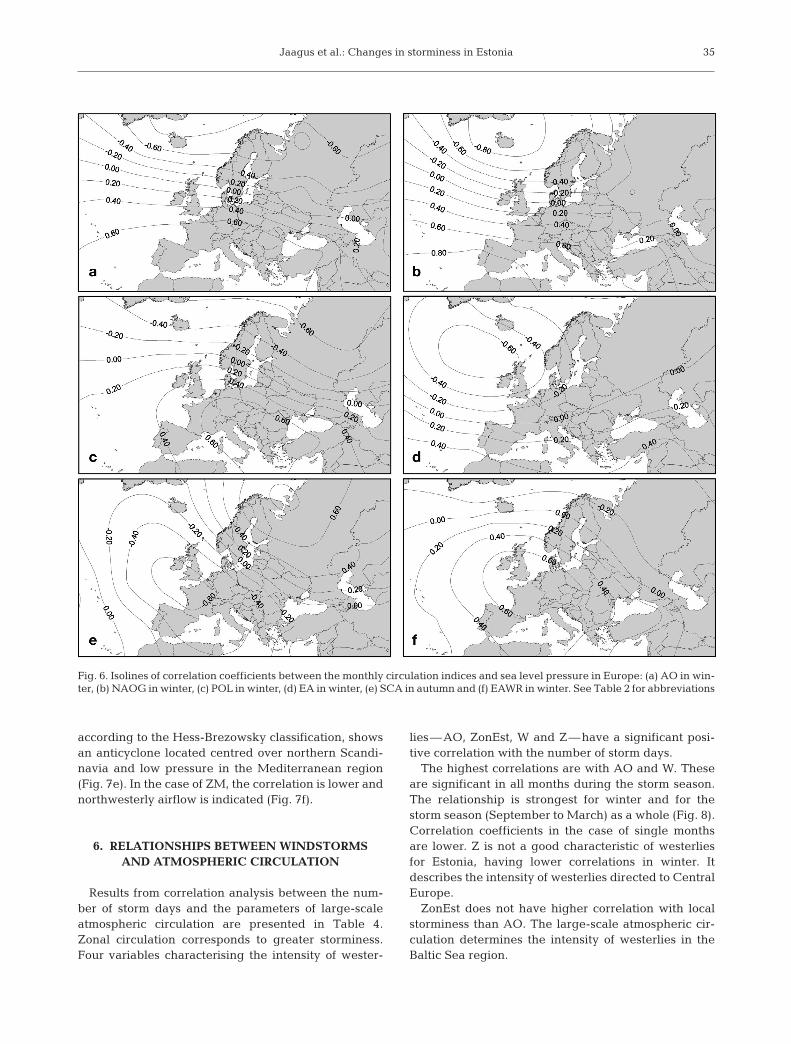
Correlation maps for the AO and NAO indices inwinter are very similar (Fig. 6a,b). More or less thesame pattern is presented also on the correlation mapfor POL (Fig. 6c). Similarity of the correlation maps jus-tifies the use of only 1 index (AO) instead of a largernumber of indices for the analysis of the relationshipswith storminess. Correlation maps for autumn havemore or less similar patterns to those for winter. Iso-lines in the Baltic Sea region are orientated in awest–east direction.
The correlation (i.e. pressure) centres for EA areshifted to the south. They reflect the intensity of westerlycirculation only in western Europe at southern latitudes.There is no correlation in the Baltic Sea region (Fig. 6d).
SCA and EAWR patterns describe meridional cir-culation: the first one in the North Sea and the SouthBaltic region and the second one in the Central andNorth Baltic and the East European Plain (Fig. 6e,f).Positive values of the SCA index correspond to theNW airflow and negative values to the SE one. Forthe EAWR index, the correlation centres and maindirections of airflow are of the opposite sign.
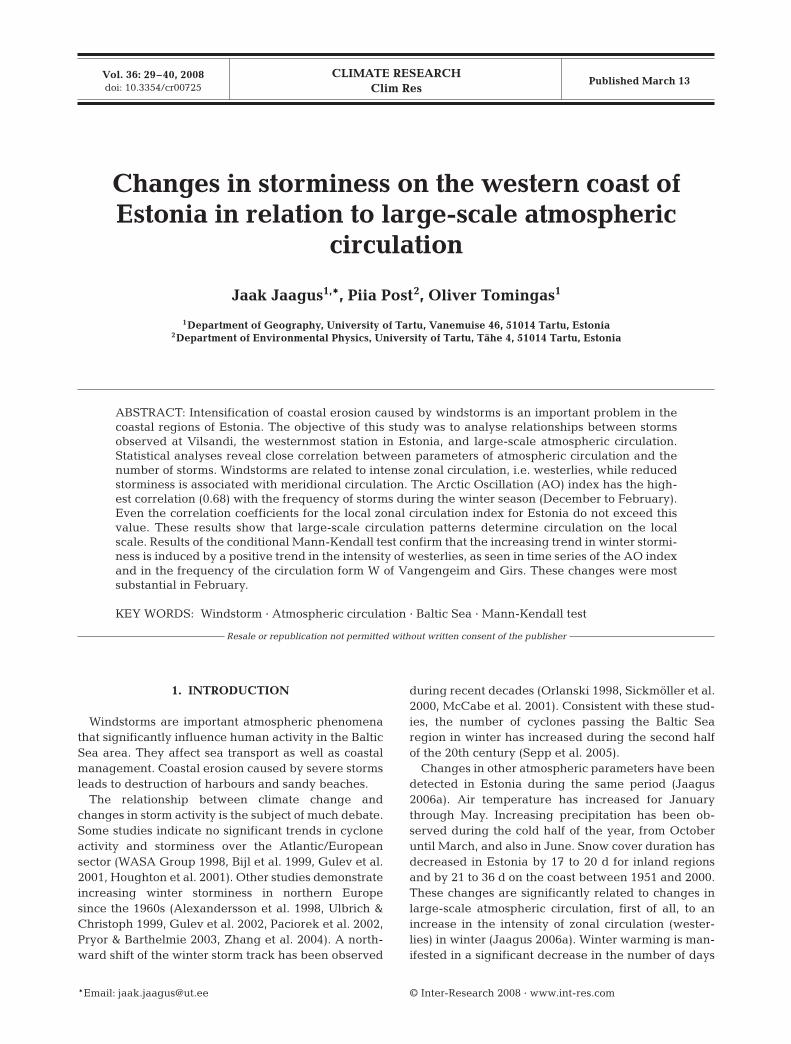
Circulation forms according to the classifications byVangengeim-Girs and Hess-Brezowsky represent con-ditions over Europe quite well. W and Z express west-erlies (Fig. 7a,b). E corresponds to a high over northernRussia and a low over France and Italy (Fig. 7c), asso-ciated with easterly, southeasterly and southerly windsin Estonia. C defined by Vangengeim and Girs is char-acterized by airflow from northern directions (Fig. 7d).The mean correlation map for the frequency of M,
34
Table 3. Correlation coefficients between the AO indices and other variables de-scribing the intensity of westerlies. See Section 3 for explanation of circulation abbre-viations. Bold: significant; SON: overall autumn values; DJF: overall winter values
NAOPD NAOG W Z NAOT EA POL ZonEst
Sep 0.46 0.59 0.28 0.20 0.51 0.38 0.58Oct 0.52 0.64 0.35 0.29 0.59 –0.13– 0.67Nov 0.55 0.56 0.34 0.31 0.65 –0.10– 0.53Dec 0.67 0.68 0.42 0.27 0.65 –0.05– 0.49 0.63Jan 0.76 0.81 0.54 0.48 0.74 0.24 0.59 0.71Feb 0.87 0.85 0.59 0.45 0.80 0.17 0.58 0.79Mar 0.84 0.81 0.42 0.49 0.74 0.24 0.76SON 0.43 0.45 0.34 0.12 0.64 –0.19– 0.61DJF 0.78 0.82 0.62 0.42 0.76 0.08 0.61 0.86Sep–Mar 0.73 0.74 0.45 0.45 0.77 0.05 0.75
Jaagus et al.: Changes in storminess in Estonia
according to the Hess-Brezowsky classification, showsan anticyclone located centred over northern Scandi-navia and low pressure in the Mediterranean region(Fig. 7e). In the case of ZM, the correlation is lower andnorthwesterly airflow is indicated (Fig. 7f).
6. RELATIONSHIPS BETWEEN WINDSTORMSAND ATMOSPHERIC CIRCULATION
Results from correlation analysis between the num-ber of storm days and the parameters of large-scaleatmospheric circulation are presented in Table 4.Zonal circulation corresponds to greater storminess.Four variables characterising the intensity of wester-
lies—AO, ZonEst, W and Z—have a significant posi-tive correlation with the number of storm days.
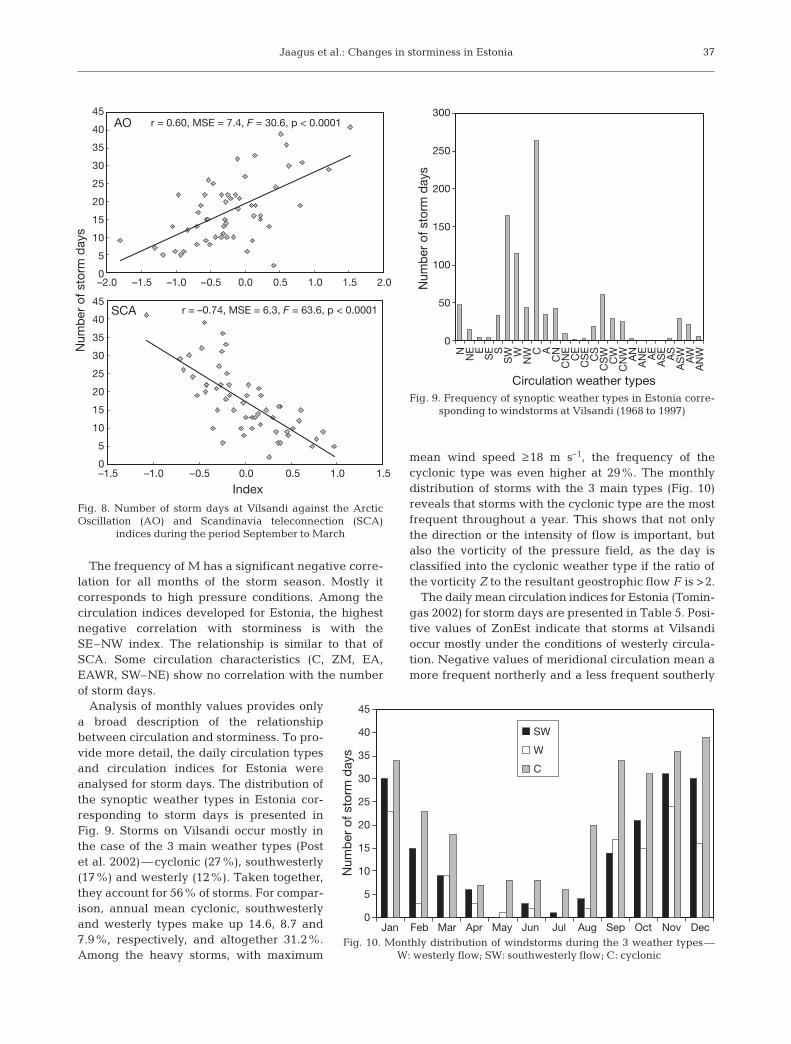
The highest correlations are with AO and W. Theseare significant in all months during the storm season.The relationship is strongest for winter and for thestorm season (September to March) as a whole (Fig. 8).Correlation coefficients in the case of single monthsare lower. Z is not a good characteristic of westerliesfor Estonia, having lower correlations in winter. Itdescribes the intensity of westerlies directed to CentralEurope.
ZonEst does not have higher correlation with localstorminess than AO. The large-scale atmospheric cir-culation determines the intensity of westerlies in theBaltic Sea region.
35
Fig. 6. Isolines of correlation coefficients between the monthly circulation indices and sea level pressure in Europe: (a) AO in win-ter, (b) NAOG in winter, (c) POL in winter, (d) EA in winter, (e) SCA in autumn and (f) EAWR in winter. See Table 2 for abbreviations

Clim Res 36: 29–40, 2008
Meridional circulation is usuallyassociated with few storms. E has astrong negative correlation with stor-miness. A similar and even strongernegative relationship is observed forSCA, which is most outstanding inNovember and October. This patternreflects southeasterly (positive indexvalues) and northwesterly (negativevalues) airflows over the Baltic Sea(Fig. 8). The highly negative correla-tion means that storms on Vilsandiare closely related to northwesterlycirculation.
36
Fig. 7. Isolines of correlation coefficients between the monthly frequencies of the main circulation forms (according to theVangengeim-Girs and Hess-Brezowsky classifications) and sea level pressure in winter: (a) W, (b) Z, (c) E, (d) C, (e) M and (f) ZM.
See Table 2 for abbreviations
Table 4. Correlation coefficients between the number of storm days and monthlyand seasonal circulation variables. Statistically significant values are shown in
bold. See Table 2 for explanation of circulation abbreviations
AO ZonEst W Z E M SCA SE–NW
Sep 0.30 0.27 0.53 0.41 –0.29 –0.33 –0.45 –0.21Oct 0.38 0.47 0.55 0.53 –0.54 –0.48 –0.62 –0.46Nov 0.45 0.60 0.52 0.15 –0.52 –0.42 –0.66 –0.54Dec 0.53 0.41 0.44 0.18 –0.30 –0.49 –0.32 –0.37Jan 0.53 0.55 0.43 0.28 –0.29 –0.40 –0.50 –0.49Feb 0.59 0.51 0.59 0.31 –0.57 –0.41 –0.51 –0.43Mar 0.51 0.57 0.45 0.44 –0.42 –0.50 –0.55 –0.53Sep–Mar 0.60 0.59 0.57 0.46 –0.49 –0.53 –0.74 –0.58Dec–Feb 0.68 0.60 0.59 0.37 –0.48 –0.52 –0.57 –0.56
Jaagus et al.: Changes in storminess in Estonia
The frequency of M has a significant negative corre-lation for all months of the storm season. Mostly itcorresponds to high pressure conditions. Among thecirculation indices developed for Estonia, the highestnegative correlation with storminess is with theSE–NW index. The relationship is similar to that ofSCA. Some circulation characteristics (C, ZM, EA,EAWR, SW–NE) show no correlation with the numberof storm days.
Analysis of monthly values provides onlya broad description of the relationshipbetween circulation and storminess. To pro-vide more detail, the daily circulation typesand circulation indices for Estonia wereanalysed for storm days. The distribution ofthe synoptic weather types in Estonia cor-responding to storm days is presented inFig. 9. Storms on Vilsandi occur mostly inthe case of the 3 main weather types (Postet al. 2002)—cyclonic (27%), southwesterly(17%) and westerly (12%). Taken together,they account for 56% of storms. For compar-ison, annual mean cyclonic, southwesterlyand westerly types make up 14.6, 8.7 and7.9%, respectively, and altogether 31.2%.Among the heavy storms, with maximum
mean wind speed ≥ 18 m s–1, the frequency of thecyclonic type was even higher at 29%. The monthlydistribution of storms with the 3 main types (Fig. 10)reveals that storms with the cyclonic type are the mostfrequent throughout a year. This shows that not onlythe direction or the intensity of flow is important, butalso the vorticity of the pressure field, as the day isclassified into the cyclonic weather type if the ratio ofthe vorticity Z to the resultant geostrophic flow F is >2.
The daily mean circulation indices for Estonia (Tomin-gas 2002) for storm days are presented in Table 5. Posi-tive values of ZonEst indicate that storms at Vilsandioccur mostly under the conditions of westerly circula-tion. Negative values of meridional circulation mean amore frequent northerly and a less frequent southerly
37
45
40
35
30
25
20
15
10
5
0–2.0 –1.5 –1.0 –0.5 0.0 0.5 1.0 1.5 2.0
AO r = 0.60, MSE = 7.4, F = 30.6, p < 0.0001
r = –0.74, MSE = 6.3, F = 63.6, p < 0.0001
Num
ber
of s
torm
day
s
45
40
35
30
25
20
15
10
5
0–1.5 –1.0 –0.5 0.0 0.5 1.0 1.5
SCA
Index
Fig. 8. Number of storm days at Vilsandi against the ArcticOscillation (AO) and Scandinavia teleconnection (SCA)
indices during the period September to March
300
250
200
150
100
50
0
Circulation weather types
Num
ber
of s
torm
day
s
NN
E ES
E SS
W WN
W C AC
NC
NE
CE
CS
EC
SC
SW
CW
CN
W AN
AN
EA
EA
SE
AS
AS
WA
WA
NW
Fig. 9. Frequency of synoptic weather types in Estonia corre-sponding to windstorms at Vilsandi (1968 to 1997)
45
40
35
30
25
20
15
10
5
0
Num
ber
of s
torm
day
s
SW
W
C
Jan Feb Mar Apr May Jun Jul Aug Sep Oct Nov DecFig. 10. Monthly distribution of windstorms during the 3 weather types—
W: westerly flow; SW: southwesterly flow; C: cyclonic
Clim Res 36: 29–40, 2008
circulation. The northwesterly circulation is moreclosely related to storms than the southeasterly airflow.In the windrose of measured windstorms at Vilsandithe most frequent direction was SW (Fig. 2).
To further clarify the relationships between circula-tion and heavy storms, correlations between the circu-lation indices and heavy storms, and storms during theextremely stormy periods were calculated. As a rule,these correlation coefficients are higher than in thecase when all storms are taken into account.
7. TRENDS IN STORMINESS INDUCED BYCIRCULATION CHANGES
A general increase in storminess in Estonia was doc-umented in Orviku et al. 2003. Statistically significantincrease in the number of storm days was detected inannual values (p < 0.05). The univariate MK test alsorevealed significant trends in monthly and seasonalvalues—a positive trend in January, February, March,May, July and winter (December to February), and anegative trend in August. The largest change instorminess during the period from 1948 to 2004occurred in February (p < 0.01).
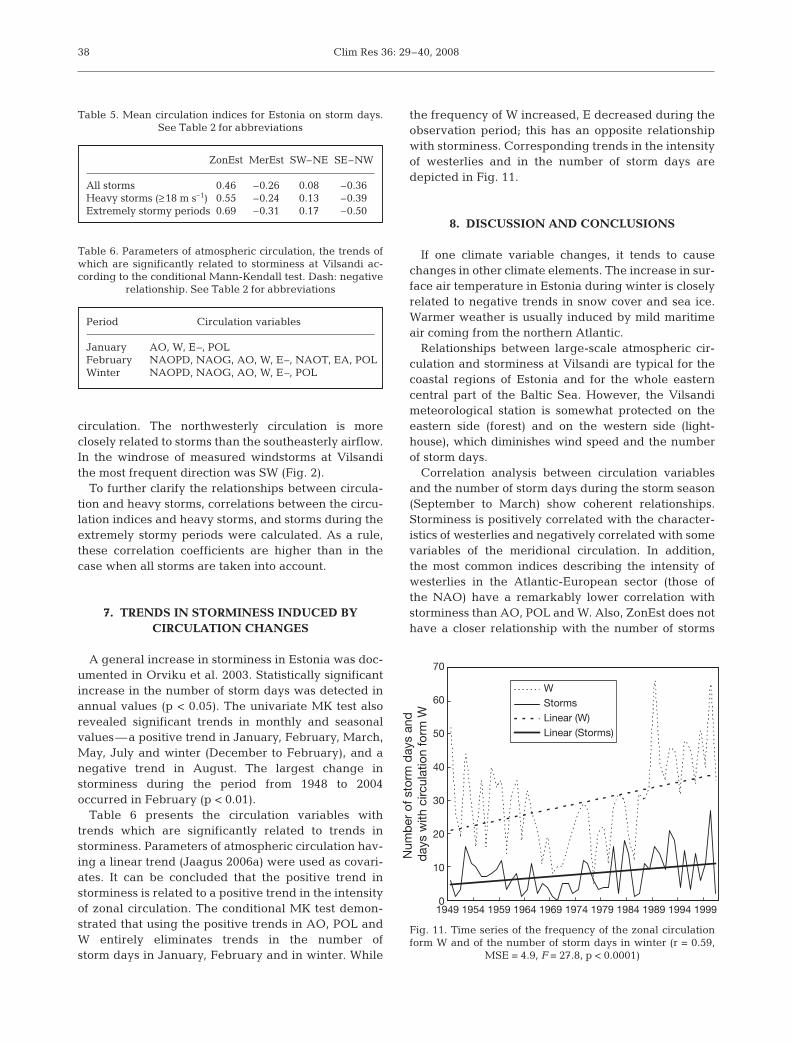
Table 6 presents the circulation variables withtrends which are significantly related to trends instorminess. Parameters of atmospheric circulation hav-ing a linear trend (Jaagus 2006a) were used as covari-ates. It can be concluded that the positive trend instorminess is related to a positive trend in the intensityof zonal circulation. The conditional MK test demon-strated that using the positive trends in AO, POL andW entirely eliminates trends in the number ofstorm days in January, February and in winter. While
the frequency of W increased, E decreased during theobservation period; this has an opposite relationshipwith storminess. Corresponding trends in the intensityof westerlies and in the number of storm days aredepicted in Fig. 11.
8. DISCUSSION AND CONCLUSIONS
If one climate variable changes, it tends to causechanges in other climate elements. The increase in sur-face air temperature in Estonia during winter is closelyrelated to negative trends in snow cover and sea ice.Warmer weather is usually induced by mild maritimeair coming from the northern Atlantic.
Relationships between large-scale atmospheric cir-culation and storminess at Vilsandi are typical for thecoastal regions of Estonia and for the whole easterncentral part of the Baltic Sea. However, the Vilsandimeteorological station is somewhat protected on theeastern side (forest) and on the western side (light-house), which diminishes wind speed and the numberof storm days.
Correlation analysis between circulation variablesand the number of storm days during the storm season(September to March) show coherent relationships.Storminess is positively correlated with the character-istics of westerlies and negatively correlated with somevariables of the meridional circulation. In addition,the most common indices describing the intensity ofwesterlies in the Atlantic-European sector (those ofthe NAO) have a remarkably lower correlation withstorminess than AO, POL and W. Also, ZonEst does nothave a closer relationship with the number of storms
38
70
60
50
40
30
20
10
01949 1954 1959 1964 1969 1974 1979 1984 1989 1994 1999
Num
ber
of s
torm
day
s an
d
day
s w
ith c
ircul
atio
n fo
rm W
WStormsLinear (W)Linear (Storms)
Fig. 11. Time series of the frequency of the zonal circulationform W and of the number of storm days in winter (r = 0.59,
MSE = 4.9, F = 27.8, p < 0.0001)
Table 5. Mean circulation indices for Estonia on storm days. See Table 2 for abbreviations
ZonEst MerEst SW–NE SE–NW
All storms 0.46 –0.26 0.08 –0.36Heavy storms (≥18 m s–1) 0.55 –0.24 0.13 –0.39Extremely stormy periods 0.69 –0.31 0.17 –0.50
Table 6. Parameters of atmospheric circulation, the trends ofwhich are significantly related to storminess at Vilsandi ac-cording to the conditional Mann-Kendall test. Dash: negative
relationship. See Table 2 for abbreviations
Period Circulation variables
January AO, W, E–, POLFebruary NAOPD, NAOG, AO, W, E–, NAOT, EA, POLWinter NAOPD, NAOG, AO, W, E–, POL
Jaagus et al.: Changes in storminess in Estonia
days than AO. Large-scale atmospheric circulationdetermines the regional and local circulation in theBaltic Sea area.
Among different months, the highest correlationswith these circulation types are usually observed inFebruary. Correlation coefficients calculated for longerperiods, for winter (December to February) or for thewhole storm season (September to March), are evenhigher—up to 0.68 for the AO index.
Using 5 yr running average time series of the num-ber of storm days at Vilsandi and of the AO index, thecorrelation coefficient between them increases signifi-cantly. For example, in the case of winter values, it wasinitially 0.68, and after using the filtered series itincreased to 0.78. These data show that decadal vari-ability in storminess is well explained by long-term,low-frequency variability of the AO index.
Similar results were obtained when the daily circula-tion variables designed specifically for the Baltic Searegion and for Estonia were used. More than half of allstorm days occurred in conjunction with 3 circulationweather types—cyclonic, western and southwestern.The daily mean zonal circulation index for Estonia,calculated only for storm days, shows that the strongerthe storms, the higher the intensity of the zonalcirculation.
In cases of zonal circulation, cyclonic weather con-ditions prevail in Estonia. Indices of zonal circulationdescribe the linear airflow. Circulation weather typesused in the present study are valuable, because theyalso describe the vorticity of airflow in cases of cyclonicor anti-cyclonic flows. We have demonstrated that alarge proportion of the windstorms occur along withcyclonic weather types.
A negative correlation exists between storminessand the frequency of some meridional circulation types(E, M, SCA). When these patterns are established,there are few storms. In such cases, Estonia tends to beinfluenced by anti-cyclonic conditions.
Results of the conditional MK test confirm that thepositive trend in winter storminess is associated with apositive trend in the intensity of westerlies, i.e. in timeseries of the AO and in the frequency of W. Thesechanges have been most substantial in February. Theincreased frequency of W is related to a decrease in E.
Acknowledgements. The study is sponsored by the EstonianScience Foundation (Grants No. 5786 and 5763).
LITERATURE CITED
Alexandersson H, Schmith T, Iden K, Tuomenvirta H (1998)Long-term variations of the storm climate over NWEurope. Glob Atmos Ocean Syst 6:97–120
Barnston AG, Livezey RE (1987) Classification, seasonality
and persistence of low-frequency atmospheric circulationpatterns. Mon Weather Rev 115:1083–1126
Bijl W, Flather R, de Ronde JG, Schmith T (1999) Changingstorminess? An analysis of long-term sea level data sets.Clim Res 11:161–172
El-Shaarawi AH (1993) Environmental monitoring, assess-ment and prediction of change. Environmetrics 4:381–398
Gerstengarbe FW, Werner PC, Rüge U (1999) Katalog derGrosswetterlagen Europas (1881–1998) nach Paul Hessund Helmuth Brezowsky, 5. Auflage. Institut für Klima-folgenforschung, Potsdam
Girs AA (1971) Mnogoletnije kolebanija atmosfernoj cirkul-jacii i dolgosrocnyje gidrometeorologiceskije prognozy(Interannual fluctuations of atmospheric circulation andlong-term hydrometeorological forecasts). Gidrometeo-izdat, Leningrad (in Russian)
Gulev SK, Zolina O, Grigoriev S (2001) Extratropical cyclonevariability in the Northern Hemisphere winter from theNCEP/NCAR reanalysis data. Clim Dyn 17:795–809
Gulev SK, Jung T, Ruprecht E (2002) Climatology and inter-annual variability in the intensity of synoptic-scale pro-cesses in the North Atlantic from the NCEP-NCARreanalysis data. J Clim 15:809–828
Houghton JT, Ding Y, Griggs DJ, Noguer M (eds) (2001) Cli-mate change 2001: the scientific basis. Third AssessmentReport, IPCC, Cambridge University Press, Cambridge
Hurrell JW, van Loon H (1997) Decadal variations in climateassociated with the North Atlantic Oscillation. ClimChange 36:301–326
Jaagus J (2006a) Climatic changes in Estonia during the sec-ond half of the 20th century in relationship with changesin large-scale atmospheric circulation. Theor Appl Clima-tol 83:77–88
Jaagus J (2006b) Trends in sea ice conditions on the BalticSea near the Estonian coast during the period 1949/50–2003/04 and their relationships to large-scale atmosphericcirculation. Boreal Environ Res 11:169–183
Jenkinson AF, Collison FP (1977) An initial climatology ofgales over the North Sea. Synoptic Climatology BranchMemo 62, Meteorological Office, Bracknell
Jones PD, Jónsson T, Wheeler D (1997) Extension to the NorthAtlantic Oscillation using early instrumental pressureobservations from Gibraltar and South-West Iceland. Int JClimatol 17:1433–1450
Libiseller C, Grimvall A (2002) Performance of partial Mann-Kendall test for trend detection in the presence ofcovariates. Environmetrics 13:71–84
McCabe GJ, Clark MP, Serreze MC (2001) Trends in North-ern Hemisphere surface cyclone frequency and intensity.J Clim 14:2763–2768
Omstedt A, Pettersen C, Rodhe J, Winsor P (2003) Baltic Seaclimate: 200 yr of data on air temperature, sea level varia-tion, ice cover, and atmospheric circulation. Clim Res25:205–216
Orlanski I (1998) Poleward deflection of storm tracks. J AtmosSci 55:2577–2602
Orviku K, Jaagus J, Kont A, Ratas U, Rivis R (2003) Increasingactivity of coastal processes associated with climate changein Estonia. J Coast Res 19:364–375
Paciorek CJ, Risbey JS, Ventura V, Rosen RD (2002) Multipleindices of Northern Hemisphere cyclone activity, winters1949–1999. J Clim 15:1573–1590
Post P, Truija V, Tuulik J (2002) Circulation weather types andtheir influence on temperature and precipitation in Esto-nia. Boreal Environ Res 7:281–289
Pryor SC, Barthelmie RJ (2003) Long-term trends in near-surface flow over the Baltic. Int J Climatol 23:271–289
39
Clim Res 36: 29–40, 2008
Salmi T, Määttä A, Anttila P, Ruoho-Airola T, Amnell T (2002)Detecting trends of annual values of atmospheric pollu-tants by the Mann-Kendall test and Sen’s slope esti-mates—the EXCEL template application MAKESENS.Publications on air quality 31, Finnish MeteorologicalInstitute, Helsinki
Sepp M, Jaagus J (2002) Frequency of circulation patternsand air temperature variations in Europe. Boreal EnvironRes 7:273–279
Sepp M, Post P, Jaagus J (2005) Long-term changes in thefrequency of cyclones and their trajectories in Central andNorthern Europe. Nord Hydrol 36:297–309
Sickmöller M, Blender R, Fraedrich K (2000) Observed wintercyclone tracks in the Northern Hemisphere in re-analysedECMWF data. QJR Meteorol Soc 126:591–620
Soomere T (2001) Extreme wind speeds and spatially uniformwind events in the Baltic Proper. Proc Estonian Acad SciEng 7:195–211
Soomere T, Keevallik S (2001) Anisotropy of moderate andstrong winds in the Baltic Proper. Proc Estonian Acad SciEng 7:35–49
Suursaar Ü, Kullas T, Otsmann M, Saaremäe I, Kuik J,
Merilain M (2006) Cyclone Gudrun in January 2005 andmodelling its hydrodynamic consequences in the Estoniancoastal waters. Boreal Environ Res 11:143–159
Thompson DW, Wallace JM (1998) The Arctic Oscillationsignature in the wintertime geopotential height and tem-perature fields. Geophys Res Lett 25:1297–1300
Tomingas O (2002) Relationship between atmospheric circu-lation indices and climate variability in Estonia. BorealEnviron Res 7:463–469
Ulbrich U, Christoph M (1999) A shift of the NAO and increas-ing storm track activity over Europe due to anthropogenicgreenhouse gas forcing. Clim Dyn 15:551–559
Vangengeim GJ (1952) Osnovy makrocirkuljacionnogo metodadolgosrocnyh meteorologiceskih prognozov dlja Arktiki(Principles of macro-circulational method of long-termmeteorological forecasts for the Arctics). Trudy AANII34:11–66 (in Russian)
WASA Group (1998) Changing waves and storms in theNortheast Atlantic? Bull Am Meteorol Soc 79:741–760
Zhang X, Walsh JE, Zhang J, Bhatt US, Ikeda M (2004) Clima-tology and interannual variability of Arctic cyclone activ-ity: 1948–2002. J Clim 17:2300–2317
40
Editorial responsibility: Robert Davis,Charlottesville, Virginia, USA
Submitted: March 27, 2006; Accepted: November 16, 2007Proofs received from author(s): February 21, 2008
![Pärnu, Estonia · Pärnu (Estonian pronunciation: [ˈpærˑnu]; German: Pernau) is the fourth-largest city in Estonia. Located in southwestern Estonia on the coast of Pärnu Bay,](https://img.pdfslide.net/doc/110x75/6041a25d4e1f9f19c51ca775/prnu-estonia-prnu-estonian-pronunciation-prnu-german-pernau-is.jpg)