Embed Size (px)
Citation preview

211
Chapter 10: Peri-Urban Case Study 10.1 - Village profile 5870
Of Cebu City’s 22 peri-urban barangay, four have been chosen for this study (Table n° 10.1). Two of these barangay, Cambinocot and Agsungot, are defined as fully alienable and disposable (hereafter A&D) land. In the context of the Philippines, 5875 this classification means they are private lands that can be freely bought and sold without government intervention. This freedom to buy and sell does not, at least in theory, transcend to the level of landuse planning. National, provincial and local ordinances are in place with the potential to limit the type of landuse that can and will 5880 occur on any particular parcel of land. There are also some caveats with regard to government’s lack of intervention in the buying and selling of A&D lands. The laws of agrarian reform may impinge on those attempting to acquire an area of land that exceeds limits as defined by the current laws. This is, however, a theoretical limit as a 5885 number of methods are used by the population to circumvent it. Details concerning this are discussed elsewhere in this book.
The second type of land, after alienable and disposable land,
included in the peri-urban case study, is the so-called forest land 5890 (timberland). These lands are public in that they are, in theory, owned and managed by the State. In the Philippines, nearly 60 percent of the country is classified as public land. These lands support over 24 million people or one-quarter of the country’s population (Li 2002). These state-owned lands are typically sloping, 5895 and in the mountainous interiors of the major islands. As noted, a large number of Filipinos occupy and gain sustenance through cultivation of these marginal lands (Flieger and Cusi 1998). As these so-called forest lands are situated in the urban-rural peripheries of towns and cities, population pressure results in the spill-over of 5900 people to the mountainsides searching for a livelihood from uncultivated public lands.

212
Table n°10.1 – List of 22 barangay in the peri-urban environment of Cebu City 5905
Bar
anga
y
Fully
Tim
ber-
land
All
A&
DPa
rtia
l A
& D
/ T
imbe
r-la
ndR
esid
entia
l %
of a
rea
Agr
icul
tura
l %
of a
rea
Com
mer
cial
%
of a
rea
Indu
stri
al
% o
f are
a
Lusaran .9 99.1 Cambinocot .4 99.6 Paril .3 99.7 Mabini .5 99.5 Agsungot 2.5 97.5 Guba 1.2 98 Adlawon .3 99.7 Taptap .2 99.8 Tagba-o 0 100 Tabunan .23 99.7 Sudlon I 1 62 37 Sudlon II Sinsin .02 98.4 1.5 Buot-taup .6 97.5 1.9 Pamutan .01 99.8 Toong 3 97 Sapangdaku 5 95 Bonbon .3 69.3 .02 30.3 Babag 2.5 97.4 .03 Malubog 12 65 1 22
special Sirao 5.6 93 Pong-ol/ Sibugay
3
89
6
Barangay Tagba-o and Sudlon 1 in the peri-urban
environment of Cebu City are, by classification, forest lands. They are chosen for this study to exemplify the special issues pertaining to 5910 this over-exploited type of land unit and the complications involved in discerning tenurial relationships that have evolved in the area. As

213
a case in point, Tagba-o is defined by government as forest land but is in fact 100 percent agricultural. Sudlon 1, also classified as forest land, is in reality, 62 percent agricultural and 37 percent industrial. 5915
Of relevance also is a description of the topography of the
selected peri-urban barangay which, as already shown in Table n° 10.1 are being used primarily for agriculture despite government’s classification of these lands as alienable and disposable and forest 5920 lands. If slope and elevation are not taken into account, the total base areas of the barangay are: Agsungot, 5,500 hectares; Cambinocot, 8,600 hectares; Sudlon 1, 5,800 hectares; and, Tagba-o, 9,600 hectares. However, if the contour of the land is taken into account, the surface areas of the barangay add up to 5,800, 8,900, 6,400 and 5925 10,800 hectares, respectively.46 Of the four barangay, only Agsungot and Cambinocot have portions with elevation below 200 meters above sea level (5.8 percent and 26.3 percent respectively). The bigger portions of these barangay, however, lie between 200 and 500 meters above sea level (93.2 percent of Agsungot and 73.7 percent 5930 of Cambinocot). Moreover, 82.1 percent of the surface area of Agsungot and 51.8 percent of Cambinocot has a slope of 18 percent or more. In contrast, Sudlon 1 and Tagba-o have lands at much higher elevations: 89.5 percent of Sudlon 1 and 18.5 percent of Tagba-o lie 500 meters or more above sea level. Furthermore, more 5935 than 80 percent of their lands have slopes of 18 percent or greater.
Although the four case study peri-urban barangay are all
within close proximity to Cebu City and are relatively well served by the road network, poverty and underdevelopment are prevalent in 5940 the area. This is evident from the socio-demographic profile of the barangay portrayed below, which sets the tone for subsequent discussions of land tenure and food production critical to this study.
46 See Flieger and Cusi (1998) for a description of the GIS-based methodology for determining the surface area of mountainous areas. The need for assessing the real surface area of mountainous areas is crucial when attempting to settle land disputes using two dimensional maps as those held by government and used for cadastral purposes.

214
10.2 - Demographics 5945
In 2000, the four selected peri-urban barangay in Cebu had populations of 1,464 (Tagba-o), 1,746 (Agsungot), 1,959 (Sudlon 1) and 2,271 (Cambinocot) (Table n° 10.2). Between 1990 and 2000, the population of Sudlon 1 had grown the most (16.7 percent 5950 annually). Cambinocot and Tagba-o had growth rates of 3.15 and 3.12 percent, respectively, while Agsungot had the lowest growth rate of 2.74 percent. As mentioned, Sudlon 1 and Tagba-o are classified by government as forest lands while Cambinocot and Agsungot are A&D lands. It appears, therefore, that land 5955 classification had no bearing on the rate of population growth in these barangay. It is useful to keep in mind, however, that the 1990-2000 growth rates of the four peri-urban barangay exceeded the growth rates of Cebu City and the province of Cebu (1.65 and 2.5 percent, respectively) and even that of the country as a whole (2.3 5960 percent).
In 2000, Sudlon 1 was the most densely populated area of the
four peri-urban barangay (337.8 persons per sq. km.); Agsungot was next (317.5 persons per sq. km.), followed by Cambinocot (264.1 5965 persons per sq. km.). Tagba-o, the largest barangay in terms of land area and the smallest in terms of population was the least densely populated (152.5 persons per sq. km) of the four case study barangay.
5970 A survey by the Office of Population Studies (OPS) of the
University of San Carlos in the 22 peri-urban barangay in 1999 provides additional information about the populations in the case study barangay. In terms of gender composition, it was observed that there were fewer men than women in Cambinocot and Sudlon 1 5975 (Table n° 10.3). Particularly in Sudlon 1, there appears to be an acute shortage of men in the prime working ages (15-39); there were only 75 men per 100 women in this age group. In the other three barangay, men outnumbered women in the prime working ages, and for Tagba-o there were more men than women in practically all age 5980 groups.

215
Table n°10.2 – Population size, growth rate and density of Cebu peri-urban case study barangay.
5985
B
AR
AN
GA
Y
MA
Y 1
990
No.
of
T
otal
hh
lds
p
op.
MA
Y 2
000
No.
of
T
otal
hh
lds
p
op.
GR
OW
TH
RA
TE
1 (1
990-
2000
)
BA
SE
AR
EA
PO
PUL
AT
ION
DE
NSI
TY
2
(200
0)
Agsungot 250 1,327 352 1,746 2.74 5.5 317.5 Cambinocot 332 1,657 483 2,271 3.15 8.6 264.1 Sudlon 1 80 369 403 1,959 16.7 5.8 337.8 Tagba-o 212 1,072 288 1,464 3.12 9.6 152.5 Source: 1990 and 2000 Censuses 1 Growth rates use the exponential function. 2 Population density is number of persons per sq. km.
5990 In terms of age composition, Sudlon 1 had the youngest
population (median age of 16) while Tagba-o had the oldest (median age of 21). 47.6 percent of Sudlon 1’s population is under age 15 compared to the 38.7 percent of Tagba-o’s population in that age category. With a relatively young age structure, it is not surprising 5995 that all four peri-urban barangay display high levels of dependency burden. Most noticeable is Sudlon 1 with a dependency burden of 100, meaning that on average, each person of working age has one ‘dependent’ (person aged 0-14 or 65 and older). In 95 out of 100 cases, the dependent is a person under 15 years of age. For Tagba-o, 6000 the dependency burden is much lower: 75 dependents per 100 individuals of working age and 68 of these dependents are under age 15.
The child-woman ratio is the ratio of the number of children 6005
under five years old to the number of women of reproductive ages (15-49). It serves as a proxy measure for fertility. As Table 10.3 shows, fertility levels were relatively high in the four peri-urban barangay. It was conspicuously high in Sudlon 1 (child-woman ratio of 84 children per 100 women of reproductive age). With the 6010 exception of Cambinocot, the peri-urban case study barangay had

216
child-woman ratios that were higher than those of the province (0.59) and the country (0.54) in 1995.
Table n° 10.3 – Selected demographic characteristics of the Cebu 6015 peri-urban case study barangay
Ags
ungo
t
Cam
bino
cot
Sudl
on 1
Tag
ba-o
Sex ratio All ages Ages 15-39 Ages 40-64
99.5 102.9 93.9
96.4 113.2 78.9
89.5 74.5 100.0
102.3 109.8 104.3
Median age 19 18 16 21 Percent of population: Age under 15 Age 15-64 Age 65 and over
42.1 53.5 4.4
41.0 53.0 6.0
47.6 50.0 2.4
38.7 57.2 4.1
Dependency ratio Youth Old age
86.9 78.6 8.3
88.7 77.4 11.3
100.0 95.2 4.8
74.7 67.5 7.2
Child woman ratio 0.636 0.531 0.839 0.656
There is very limited data on migration in the peri-urban 6020 barangay. The OPS survey revealed that 10.5 percent of the sample households in Cambinocot, 7.7 percent in Sudlon 1, 7.3 percent in Tagba-o and 4.4 percent in Agsungot were households that moved into the barangay only in the last five years. With respect to out-migration, no data are available at the barangay level. Nonetheless 6025 insights can be drawn from data for the entire peri-urban Cebu. Out-migrants in the peri-urban barangay in the last 10 years are characterized as predominantly female (55.1 percent) and 23 years old, on average. The majority left because of marriage (a reason more applicable to the women than to the men) and, to a lesser 6030 extent, because of employment (17.0 percent). Some expressed a general feeling of discontent in the area (12.0 percent). Men

217
preferred to move to another rural barangay (67.7 percent of men compared with 44.8 percent of women), while the women preferred to go to the cities (42.1 percent moved to Metro Cebu and 10.6 6035 percent went to Manila or overseas). This suggests that men could be in search of agricultural opportunities while women are in search of urban employment. Seventy-one percent of out-migrants did not send remittances home; only 13 percent sent remittances to their families on a regular basis. This pattern was the same for both men 6040 and women migrants. It may be inferred, therefore, that out-migration did little to improve the conditions of residents in the peri-urban areas even if it may have improved the condition of the out-migrant himself/herself. 6045 10.3 - Socioeconomic status
Nearly all the households in the peri-urban barangay own the house they live in although few households own the land on which the house is built. The concept of homelessness is not recognized in 6050 the Philippines as it is culturally unacceptable to deny a person a roof over his or her head. But this is often as far as the concept goes, in that land owners may permit people to build a house on their land and these home builders will own the materials from which the house is built, but as noted, not the land on which it sits. 6055 The same is usually true of houses built on public lands in the hinterland. Often people will allow others to build houses on their land simply so that someone can keep watch on the land, or act as a tenant for the landowner. The lack of clear title to the land on which a house is built, in part, helps to explain why many houses are built 6060 of light materials. Sometimes houses must be moved and heavy materials (concrete blocks in particular) cannot be easily shifted.
The provision of water and toilet facilities is also poor in the
peri-urban barangay. Only half of the households in the alienable 6065 and disposable lands of Agsungot and Cambinocot and one-fourth of those in the so-called timberlands of Sudlon 1 and Tagba-o reported having a toilet. A majority of households draw their water from local springs and carry it to the house. Two of the villages studied, Agsungot and Cambinocot, are well connected to the electrical grid 6070 but still only slightly over half the households choose to access electricity. The other villages, Sudlon 1 and Tagba-o, do not enjoy

218
wide distribution of electricity and usage is markedly lower at less that 20 percent of households.
6075 Educational attainment is often used as an indicator of
development. Residents of the more remote villages with low usage of electricity also have significantly lower levels of educational attainment at the elementary and high school levels. However, Tagba-o exceeds the other barangay in educational attainment at the 6080 level of post secondary education. Overall, residents of Agsungot fared better than the rest in terms of education.
The peri-urban households have, on average, at least three
sources of income (Table n° 10.4). Of the four barangay in this 6085 study, Agsungot has the largest average household income. It also has the largest proportion of households earning income from wages (64 percent) as well as the largest average income coming from wages. In addition, nearly half of the households in Agsungot operate a small business. Because of these other non-farm income 6090 sources, Agsungot has the highest average household income among the four peri-urban barangay. Sudlon 1, however, has the largest average income from farming. Tagba-o ranks second, even if it has the largest proportion of households that earn income from farming. While predominantly a farming village, a few households in Tagba-6095 o earn relatively high income from business. However, business is not widespread in the community. 6100

219
Table n° 10.4 – Median household income in the studied peri-urban barangay: 1999
6105
Household Income in past year (1998, in Philippine Peso)
Ags
ungo
t
Cam
bino
cot
Sudl
on 1
Tag
ba-o
From farming Median No. of cases
3,000 46
1,938 60
9,525 40
6,313 46
From livestock Median No. of cases
2,743 27
1,465 35
2,298 23
3,199 26
From business Median No. of cases
18,100 34
13,500 29
9,925 8
27,800 16
From wages Median No. of cases
31,200 44
21,045 42
14,976 22
15,600 22
Total income incl. other sources Median No. of cases
41,107 69
26,540 85
29,027 51
21,105 53
No. of Income Sources (%) 1 2 3 4 5 or more Mean
1.5 15.9 29.0 43.5 10.1 3.4
3.5 8.1 50.0 34.9 3.5 3.3
1.9 13.5 51.9 30.8 1.9 3.2
1.8 20.0 41.8 27.3 9.1 3.2
Total number of observations
69 86 52 55

220
10.4 - Agricultural participation
Despite the low contribution of agriculture to total household 6110 income in the peri-urban barangay in comparison to wages and other income sources, it is evident that agriculture is the prevalent economic activity of households in the case study barangay. On the average 2.5, 2.2, 2.1 and 2.6 working household members in Agsungot, Cambinocot, Sudlon 1 and Tagba-o are working in 6115 agriculture. The prevalence of agriculture as an activity, yet low contribution to total household incomes, signifies just how low productivity is on these hillyland farms. Even among the few female household heads (10 percent), two-thirds are in agriculture. Agsungot stands out in that it has the largest proportion of 6120 households (43 percent) whose heads work outside of agriculture. As shown earlier, residents of this barangay derive a considerable fraction of their income from wage employment and business. Agsungot is located along a good quality transport route that links the village with Cebu City. Of the four peri-urban barangay, the 6125 options for non-agricultural employment are therefore greatest for people in this barangay. The opposite can be said of Tagba-o, a remote barangay poorly connected via transport to the urban environment of Cebu. It is also situated on the far side of a steep valley system and is primarily agricultural in its orientation. Thus, it 6130 has the largest proportion of households whose heads are engaged in agriculture (87.3 percent).
With respect to household composition and the extent of
household members’ participation in agriculture (Collomb’s second 6135 index) (see first chart of Appendix 1), some variability can be observed in the four peri-urban barangay that is consistent with income patterns discussed above. In Agsungot, where a large fraction of household income comes from wages and business, 30.4 percent of the households reported not having any household member working in 6140 agriculture (category 1 of Collomb’s index). Among households engaged in agriculture, the largest group (20.3 percent), consisted of households with young children (under 15 years old) but no old persons (65 and over) and with two persons (a man and a woman, or both men) working in agriculture (category 39 of Collomb’s index). 6145 The same two categories (1 and 39) are prevalent in Cambinocot (20.9 and 17.4 percent, respectively), even if the proportion of

221
households in the first category is significantly smaller. A third category is also evident in Cambinocot (12.8 percent). These are households with only one male member working in agriculture and a 6150 women who is not in the labor force (possibly in reference to the household head and his wife), with one or more children under 15 years of age, and no person aged 65 and over in the household (category 19 of Collomb’s index). In Sudlon 1, this category is the most prevalent (25.0 percent), followed by category 39 (19.2 6155 percent). In Tagba-o, category 39 is the most common (29.1 percent), while a fourth category is likewise noticeable (20.0 percent). This consists of households with more than two people working in agriculture (all men or with at least one woman), with one or more children in the household but no old persons (category 6160 55 of Collomb’s index). The prevalence of this category is indicative of the intensity of agricultural participation of the residents in Tagba-o relative to their counterparts in the other peri-urban barangay.
6165 With agriculture as the predominant activity in the peri-urban
barangay, it is useful to know the farming status of the agricultural workforce in these communities. The data show that 70 percent or more of those working in agriculture in the peri-urban barangay are tenants. Those who own all or part of the land they till barely exceed 6170 20 percent. The remainder consists of hired laborers and unpaid family workers.
10.5 - Landuse, farming patterns and agricultural productivity 6175
As shown, the studied peri-urban barangay vary in demographic, socioeconomic and topographic characteristics. So also do they vary by predominant landuse types. Nonetheless, the dominant grain crop in the area is corn. Cebu Province, wherein Cebu City’s peri-urban environments are located, is one of the most 6180 important corn producing provinces in the country. This is distinctive because the majority of the Philippines is predominantly planted to lowland rice. It is Cebu’s sloping lands and lack of water for sustained wet rice production that has dictated the type of landuse for the province. In three of the four peri-urban barangay 6185 studied, corn is the dominant grain crop. Only in Cambinocot does rice supersede corn. This is because Cambinocot is located in the

222
basin of a watershed and has more flat land (48.2 percent of land sloped at less than 18 percent versus an average of only 15.7 percent for the other three barangay) and of lower elevation, giving it 6190 superior access to surface water resources. In all four barangay, rootcrops are grown as a supplemental food source to the dominant grain crop.
Sudlon 1, Tagba-o and Agsungot all have lands above 500 6195
meters in elevation which is conducive to the cultivation of temperate vegetables and cut flowers primarily for the market (Table n° 10.5). In comparison to grain crops, these are relatively minor products with the exception of mango, a high value crop typically grown in Tagba-o and Sudlon 1 for the export market. 6200
The dominant food crops, corn and rootcrops, are stable in
terms of their area and cultural significance in the local agro-ecosystem. Both have been cultivated for at least 500 years and hence the potential for change in this dominant landuse would 6205 appear limited. The more dynamic sectors are in the areas of fruits, vegetables and cut flowers. All three are relatively new in the peri-urban environment. Mango and cut flowers became more widely incorporated in the farming system in the last 20 years and vegetables in the last 30 to 40 years. The difference between the 6210 traditional and new sectors is the relative stasis in the dominant food crops versus the dynamism in the largely market-oriented products of fruits, vegetables and flowers (Figures n° 10.1; n° 10.2; n° 10.3 and n° 10.4). 6215

223
Table n° 10.5 – Major and minor landuses for selected barangay (CCLUC, 1998)
Barangay Major crop types cultivated Agsungot Corn, vegetables, coconut, bamboo, banana,
fruits Cambinocot Rice, corn, coconut, banana, vegetables,
livestock Sudlon I Corn, mango, vegetables, mango, bamboo,
livestock, fuel wood, charcoal Tagba-o Corn, vegetables, mango, coconut, fruits,
banana, cut flowers, livestock 6220
Figure n° 10.1 – Major landuse in barangay Tagba-o
Source: DENR 2000

224
Figure n° 10.2 – Major landuse in barangay Cambinocot 6225
Source: DENR 2000

225
Figure n° 10.3 – Major landuse in barangay Sudlon I 6230
Source: DENR 2000

226
Figure n° 10.4 – Major landuses in barangay Agsungot 6235
Source: DENR 2000
The overall productivity in Cebu’s peri-urban barangay is
very low by national standards. As noted, the environment consists 6240 of wide areas of steeply sloping lands, an underlying geology composed largely of limestone, very shallow and erosive soils and a corn-based cropping system that is extractive and poorly suited to sloping lands.
6245 The dominant grain crops, corn and rice, have both been
identified as poor producers with a wide margin for improvement

227
(Table n° 10.6). Corn yields on average are only 0.44 metric tonnes per hectare with a potential upper limit for production being 2.55 metric tonnes per hectare (this is still well below the yield potential 6250 of other corn growing provinces such as Leyte which has a current yield of approximately 1.5 metric tonnes per hectare and potential of around 4.0 metric tonnes per hectare). Similarly, rice yields are only 1.45 metric tonnes per hectare with a potential yield of 4.00 metric tonnes per hectare. The key limiting factors for reaching these 6255 potentials are an unreliable water supply, degraded soils, lack of inputs and poor seed stock. Rootcrops and vegetables also suffer from poor production per unit of area. Only mango production has approximated its production targets for unit of area. 6260 Table n° 10.6 – Comparison in 1987 of the potential area and yield of selected agricultural crops, Central Cebu Hillylands (Cebu City,
1987).
Conditions in 1987 Potential Growth
Agr
icul
tura
l cro
ps
Are
a (H
a)
Ave
. yie
ld (m
etri
c to
nnes
/Ha)
Ave
. cro
ppin
g in
tens
ity
Tot
al P
rod’
n (M
.T.)
Are
a (H
a)
Ave
. yie
ld (m
etri
c to
nnes
/Ha)
Ave
. cro
ppin
g in
tens
ity
Tot
al P
rod’
n (M
.T.)
Rainfed paddy rice
290 1.45 1.00 420 352 4.00 1.0 1408
Corn 3947 0.44 1.04 1760 965 2.55 1.04 2559 Rootcrops 413 4.82 1.00 1991 1/ 12.50 1.00 5162 Vegetables 623 2.52 1.25 1962 385 10.50 2.00 8085 Mango/other fruit trees
2085 6.46 - 13469 7868 7.75 - 60977
Coconut 2883 0.78 - 2248 4082 1.40 - 5714 Banana 439 7.10 - 3045 1/ 10.50 - 4505 1/ Rootcrops and bananas are treated as part of the coconut-based cropping system 6265 over the long term. Farming in the peri-urban study barangay was not always for cash (Table n° 10.7). Between one and two thirds of farming households farmed mainly for home consumption. This was 6270

228
especially the case in Cambinocot and, to a lesser extent, in Agsungot. In the public lands of Sudlon 1 and Tagba-o more farmers sold their produce. The reported amount sold was always significantly larger than the reported amount consumed. 6275 Table n° 10.7 – Production as reported by amount of production sold
and consumed by household in pesos
Bar
anga
y
Mea
n
Std.
Dev
.
No.
of
Cas
es
Agsungot Amount sold 2392 6159 83 (A&D) Amount consumed 764 1481 158 Cambinocot Amount sold 3079 8237 76 (A&D) Amount consumed 1008 1588 195 Sudlon 1 Amount sold 6232 9527 81 (Timber land) Amount consumed 1589 2444 130 Tagba-o Amount sold 7980 14475 92 (Timber land) Amount consumed 1965 4480 144
Source: OPS 2000 6280
As explained earlier, farmers may plant on more than one parcel of land to expand production and minimize risks associated with the vagaries of weather and pestilence. In the four studied barangay the number of parcels cultivated per farming household ranged between one and six. The mean number of parcels per farm 6285 was 1.6 in Cambinocot, 1.8 in Agsungot, 1.9 in Tagba-o and 2.0 in Sudlon 1. This shows the number of farm parcels to be slightly greater for those cultivating in the public land than for those in the alienable and disposable barangay (Table n° 10.8). The mean size of the parcels ranged between 4,365 square meters (Sudlon 1) and 6290 9,001 square meters (Tagba-o). However, the larger or smaller-sized parcels were not restricted to either alienable and disposable lands or public lands.
Nearly half (48.1 percent) of all the farms in the studied 6295
barangay were one parcel farms. A further 30.3 percent were two parcel farms and only the remaining 21.6 percent consisted of farms

229
of between three and six parcels (Table n° 10.9). The A&D lands had more one and two parcel farms, while the public lands had more farms with three or more parcels. 6300 Table n° 10.8 – Parcel number and parcel size for studied barangay
in sq.m.
Bar
anga
y
No.
/Siz
e of
Pa
rcel
Mea
n
Std.
Dev
.
No.
of
Cas
es
Agsungot (A & D) No. of parcels 1.8 1.0 97 Size (sq. m.) 6,270.6 9,913.0 97 Cambinocot (A & D) No. of parcels 1.6 0.8 131 Size (sq. m.) 5,219.3 6,094.0 131 Sudlon 1 (Timber land) No. of parcels 2.0 1.1 114 Size (sq. m.) 4,365.1 3,388.1 114 Tagba-o (Timber land) No. of parcels 1.9 1.0 107 Size (sq. m.) 9,001.4 37,136.6 107 Source: DENR 2000 6305 Table n° 10.9 – Number of parcels operated by households in
studied barangay.
No.
of
parc
els
Ags
ungo
t
Cam
bino
cot
Sudl
on 1
Tag
ba-o
Tot
al
1 50 69 47 50 216 2 28 44 33 31 136 3 12 15 21 16 64 4 5 3 10 9 27 5 1 0 2 1 4 6 1 0 1 0 2 Total 97 131 114 107 449
Source: DENR 2000 6310
230
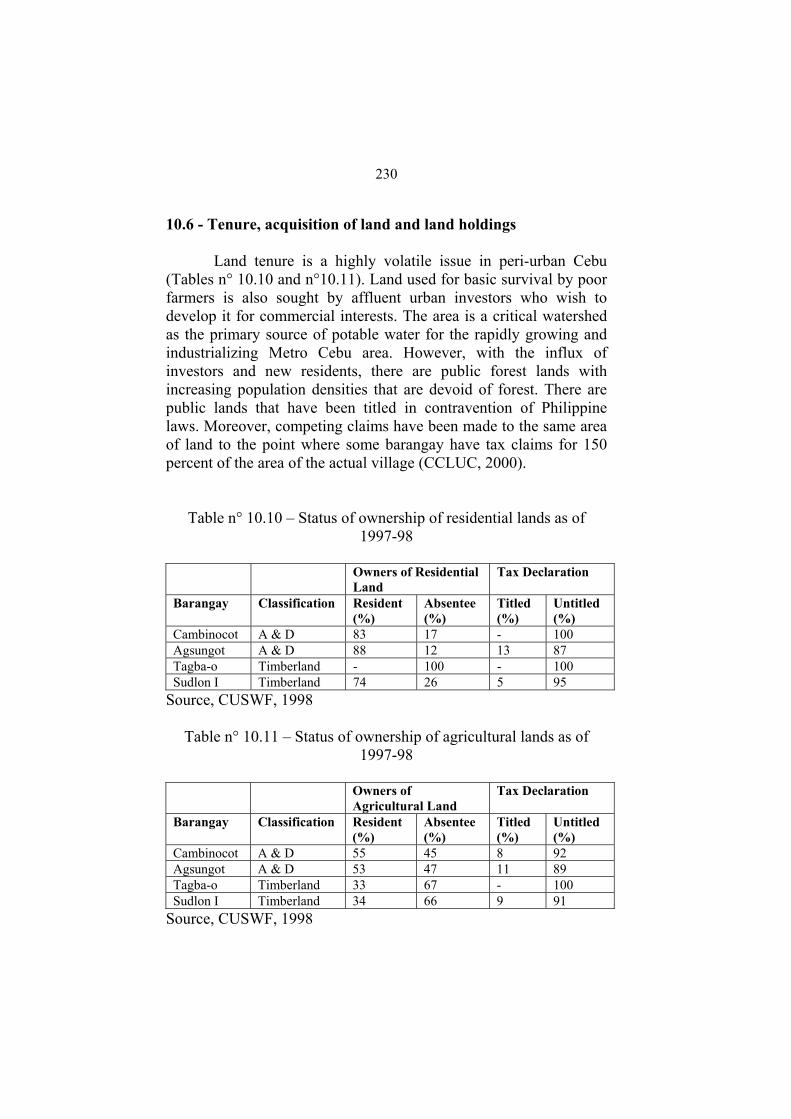
10.6 - Tenure, acquisition of land and land holdings
Land tenure is a highly volatile issue in peri-urban Cebu (Tables n° 10.10 and n°10.11). Land used for basic survival by poor 6315 farmers is also sought by affluent urban investors who wish to develop it for commercial interests. The area is a critical watershed as the primary source of potable water for the rapidly growing and industrializing Metro Cebu area. However, with the influx of investors and new residents, there are public forest lands with 6320 increasing population densities that are devoid of forest. There are public lands that have been titled in contravention of Philippine laws. Moreover, competing claims have been made to the same area of land to the point where some barangay have tax claims for 150 percent of the area of the actual village (CCLUC, 2000). 6325
Table n° 10.10 – Status of ownership of residential lands as of 1997-98
6330 Owners of Residential
Land Tax Declaration
Barangay Classification Resident (%)
Absentee (%)
Titled (%)
Untitled (%)
Cambinocot A & D 83 17 - 100 Agsungot A & D 88 12 13 87 Tagba-o Timberland - 100 - 100 Sudlon I Timberland 74 26 5 95
Source, CUSWF, 1998
Table n° 10.11 – Status of ownership of agricultural lands as of 1997-98
6335 Owners of
Agricultural Land Tax Declaration
Barangay Classification Resident (%)
Absentee (%)
Titled (%)
Untitled (%)
Cambinocot A & D 55 45 8 92 Agsungot A & D 53 47 11 89 Tagba-o Timberland 33 67 - 100 Sudlon I Timberland 34 66 9 91
Source, CUSWF, 1998

231
A survey of the peri-urban barangay of Cebu City was
conducted by the NGO, Cebu Uniting for Sustainable Water Foundation (CUSWF) in the late 1990s. This study explored the 6340 means by which persons acquired titles or tax declarations for land in the city’s peri-urban barangay (Table n° 10.12). It is important to look into the manner by which property is acquired because this has implications for land tenure security. A great majority of land was acquired using tax declarations rather than full titles and these are 6345 extremely stable from year to year. This recording system does, however, mask a very different reality. Land is often distributed to different family members, sold, mortgaged or some other change in control in cultivation occurs. These transactions are never recorded in public records as a cost is involved in doing so. The only time that 6350 a transaction is likely to be recorded is when a sale occurs outside the family or if there is a dispute within the family over allocation of land and the only recourse is to file for a change in tax declaration or title. Therefore, data of this sort while interesting, is actually masking a reality in terms of control of resources that can be vastly 6355 different from what is recorded in the archives. This pertains not just to peri-urban Cebu but to many areas of the country.
Table n° 10.12 – Property acquisition of agricultural lands as of
1997-98 6360
Bar
anga
y
Cla
ssifi
catio
n
GR
1 (%
)
TR
2 (%
)
TL
3 (%
)
TI4 /S
I5 (%)
ST6 /G
T7 (
%)
TN
8 (%
)
No.
of l
ands
Cambinocot A & D 97 - 2 - 1 - 598 Agsungot A & D 92 - 4 3.5 0.5 - 376 Tagba-o Timberland 97 - 1.4 - 1.4 - 147 Sudlon I Timberland 98 - 1.7 0.2 0.2 - 598
Source, CUSWF, 1998 GR1 = General Revision, coded by the City Assessor meaning no changes occurring in the tax declaration except for market value. 6365 Same owner as with the previous tax declaration.
232
TR2 = Transfer of the property to another person but not indicated in the tax declaration whether through sale, inheritance or otherwise. TL3 = Transfer General Revision, coded by the City Assessor meaning no changes occurring in the tax declaration except for 6370 market value but with different owner from the previous tax declaration. TI4 = Transfer of property to another person through inheritance. SI5 = Subdivision and transfer of property to another person through inheritance. 6375 ST6 = Subdivision and transfer of property to another person. GT7 = General revision and transfer of property to another person. TN8 = Transfer of property to another person through donation.
10.7 - How land is held 6380
There are two government-defined forms of land holding supported by the Philippine legal system. However, there are a plethora of other land holding arrangements that apply in nearly all situations. The most formal and legally binding form of land 6385 ownership is full title. In the barangay studied the land area held in this manner is minimal (Tables n° 10.13, n° 10.14, n° 10.15 and n° 10.16). Overall, only 5.88 percent of the land in the four barangay is held by a full title. A full title is defined as land that has been formally surveyed and staked as to its boundaries and its land area 6390 has been formally computed. The majority of the lands in the four peri-urban barangay held under a so-called tax declaration. The area covered by this type of ownership category is 93 percent. The balance of the area is made up of lands held under a special category by the government (schools, roads etc). Tax declarations do denote 6395 the size of the parcel being taxed and the type of landuse occurring. In theory, these tax declarations cannot be used in the court of law when resolving land ownership or boundary disputes. They are, however, the de facto means for defining land ownership as they are in a sense free (there is no charge for the initial survey) as this is 6400 paid for by the State in its desire to define lands for taxation.

233
Table n° 10.13 – Barangay of Cambinocot’s (A & D land) pattern of
property acquisition between 19801-98 6405 (See table n° 10.12 for explanation of acronyms such as GR)
Category 1980-84 1985-89 1990-94 1995-98 GR LO2
Tdec
136 184
161 240
192 267
199 275
TR LO Tdec
3 3
17 18
7 11
0 0
TL/CL3
LO Tdec
0 0
0 0
3 3
10 10
TI/SI LO Tdec
0 0
0 0
2 2
6 9
TN LO Tdec
0 0
0 0
1 1
1 2
ST/GT LO Tdec
0 0
0 0
0 0
3 3
LD4/DC5/ND6
LO Tdec
1 1
4 4
13 14
0 0
UI7 111 37 1 0 Total LO Tdec
140 188
182 262
218 298
219 299
Source, CUSWF, 1998 1 The MICS started in 1989. Data processed by the MICS from Tax 6410 Declarations were those starting from 1980. 2 Land owner. 3 Consolidation and transfer of property to another person through sale. 4 Land declared for the first time. 6415 5 Newly discovered land. 6 Newly declared property. 7 Unavailable information or no recorded previous transactions. This would also men 1980 origin of the property was not established.

234
6420 Table n° 10.14 – Barangay of Agsungot’s (A & D land) pattern of
property acquisition between 19801-98
Category 1980-84 1985-89 1990-94 1995-98 GR LO2
Tdec
181 249
245 344
274 371
274 371
TR LO Tdec
15 16
25 29
19 23
0 0
TL
LO Tdec
0 0
0 0
4 6
15 18
TI/SI LO Tdec
0 0
0 0
0 0
11 14
TN LO Tdec
0 0
0 0
0 0
0 0
ST/GT LO Tdec
0 0
0 0
2 2
3 3
LD3/DC4/ND5
LO Tdec
7 7
8 8
1 1
0 0
UI6 134 25 3 0 Total LO Tdec
203 272
278 381
300 403
303 406
Source, CUSWF, 1998 1 The MICS started in 1989. Data processed by the MICS from Tax 6425 Declarations were those starting from 1980. 2 Land owner. 3 Land declared for the first time. 4 Newly discovered land. 5 Newly declared property. 6430 6 Unavailable information or no recorded previous transactions. This would also men 1980 origin of the property was not established.

235
Table n° 10.15 – Barangay of Sudlon’s (Timber land) pattern of property acquisition between 19801-98
6435 Category 1980-84 1985-89 1990-94 1995-98 GR LO2
Tdec
357 454
439 603
472 619
462 591
TR LO Tdec
20 21
3 3
13 15
0 0
TL
LO Tdec
0 0
0 0
0 0
15 23
TI/SI LO Tdec
0 0
0 0
3 6
7 7
TN LO Tdec
0 0
0 0
0 0
0 0
ST/GT LO Tdec
0 0
0 0
12 13
27 39
LD3/DC4/ND5
LO Tdec
8 9
31 31
0 0
0 0
UI6 176 23 7 0 Total LO Tdec
385 484
473 637
500 653
511 660
Source, CUSWF, 1998 1 The MICS started in 1989. Data processed by the MICS from Tax Declarations were those starting from 1980. 2 Land owner. 6440 3 Land declared for the first time. 4 Newly discovered land. 5 Newly declared property. 6 Unavailable information or no recorded previous transactions. This would also men 1980 origin of the property was not established. 6445
236
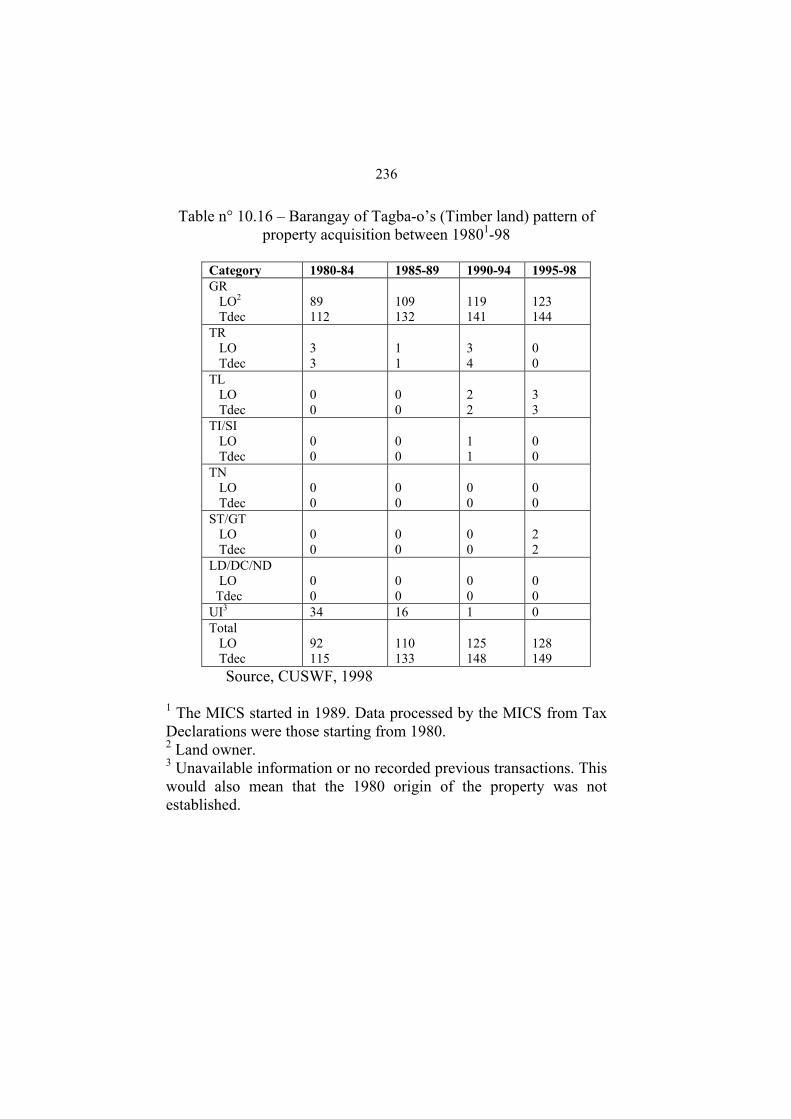
Table n° 10.16 – Barangay of Tagba-o’s (Timber land) pattern of property acquisition between 19801-98
Category 1980-84 1985-89 1990-94 1995-98 GR LO2
Tdec
89 112
109 132
119 141
123 144
TR LO Tdec
3 3
1 1
3 4
0 0
TL
LO Tdec
0 0
0 0
2 2
3 3
TI/SI LO Tdec
0 0
0 0
1 1
0 0
TN LO Tdec
0 0
0 0
0 0
0 0
ST/GT LO Tdec
0 0
0 0
0 0
2 2
LD/DC/ND
LO Tdec
0 0
0 0
0 0
0 0
UI3 34 16 1 0 Total LO Tdec
92 115
110 133
125 148
128 149
Source, CUSWF, 1998 6450 1 The MICS started in 1989. Data processed by the MICS from Tax Declarations were those starting from 1980. 2 Land owner. 3 Unavailable information or no recorded previous transactions. This 6455 would also mean that the 1980 origin of the property was not established.

237
All the data presented in this section were derived from government records. These are typically in the form of tax 6460 declarations for individual parcels of land. As the data show, very few residents or absentee owners possess titles to the land they own, till or occupy. There are six broad categories of landuse identified for tax purposes in the peri-urban environment of Cebu. These are residential, agricultural, special, commercial, industrial and 6465 plantation. Residential lands are those used solely for the purpose of housing. Agricultural lands can be further defined as livestock, poultry, crops or agroforestry. Special landuses include those designated for use by the government and may include education, health facilities, tourism and other undefined and distinctive uses. 6470 Commercial land comprises those areas used for the purpose of trading or merchandising without the facilities for manufacturing or assembly facilities. In contrast, industrial lands do include facilities for manufacturing or assembly. Plantation lands are a special category as they are newly classified in this area as lands that have 6475 been so designated so that compensation can be paid for road construction and widening projects occurring in the area. Compensation is not paid for the land area but for the value of the trees and crops growing on the land.
6480 For the barangay under consideration for this study, the mean
percentage of area devoted to agriculture was 90 percent. The next greatest percentage for landuse (excluding the anomaly of Barangay Sudlon 1) was residential, accounting for one percent of the landuse. Barangay Sudlon 1 was the only barangay with an industrial 6485 component and this accounted for 37 percent of the land area in that barangay. These figures, bar Sudlon 1, are representative of the entire peri-urban environment of the city of Cebu. A total of 22 barangay form the peri-urban environment for the city of Cebu and agricultural is the predominant landuse at 82.7 percent. Industrial 6490 uses cover 10 percent of the area and residential 2 percent. The special category is 5 percent and commercial 0.3 percent. Plantation areas, in this case referring to plantation-style production systems such as the historical situation in the Ormoc case study, are very minor. The latter categories are of minor importance to this study 6495 and are not present in the barangay chosen for more detailed analysis.

238
As would be expected, the areas of titled land in the barangay technically defined as public land was less than in the 6500 alienable and disposable areas (4.5 versus 9.5 percent). However, the mere presence of titled land in an area legally defined as public land speaks strongly to the public perception of these public lands and the legal complications involved in keeping them as such. All the public lands are claimed in this peri-urban setting if not through formal 6505 titling then through tax declarations (95.5 percent for public timberlands and 90.5 percent for alienable and disposable lands).
10.8 - Perceptions regarding land tenure in the peri-urban environment 6510
10.8.1 Urban-based stakeholders
A qualitative study (focus group discussion) of various sectors, perception of the peri-urban barangay of Cebu was 6515 conducted in 1998 (CUSWF, 1998). Four problem areas were noted: environment, legal concerns, tenurial-cultural problems and the economy. Various groups of people were asked to comment on these issues. For the purpose of this study we only draw attention to the comments about tenure and environment (as a proxy for food 6520 security when the comments are clearly related to food production systems).
It was noted by the urban-based stakeholders (persons not
residing in the peri-urban barangay studied) that tenure was 6525 interwoven with legal issues. The urban residents thought that the farmer-tillers living in the protected areas of the peri-urban environment faced the prospect of eviction and dislocation and that this could have serious social repercussions. Some method for easing the social impact needed to be devised well before any action 6530 was considered or implemented. In response to the intertwining legal issues, people expressed dismay at the unclear delineation of boundaries for protected peri-urban environments. They were also concerned that titles had been allocated for protected areas in a manner similar to their issuance in alienable and disposable lands. 6535 Similarly, the dispensation of tax declarations for land in protected areas further complicated a difficult situation. The urban-based

239
NGOs commented on the difficulty of convincing peri-urban farmers to alter their landuse strategies given the lack of training in areas such as alternative livelihood. The NGOs were also concerned 6540 that peri-urban land-owners were selling their land to outside interests. In reference to the economy, many groups expressed concern over the rising population pressure in the peri-urban environment and the uneven economic development (change) now occurring in the greater Cebu metropolitan area. 6545
The peri-urban stakeholders had similar concerns to the
urban-based sector. They were very anxious over their ownership rights to land. Many only hold tax declarations and they fear that they will never be able to receive titles. Those that already own land 6550 outright (whether with title or tax declaration) are fearful that they could eventually lose their land because only tenants who are actual tillers of the land are considered tenured migrants (a target beneficiary group of the Comprehensive Agrarian Reform legislation). Some people were angered and confused by the DENR 6555 issuance of titles to influential people who own land in protected areas and/or timberlands. The perception of those farming in the peri-urban environment is that people worked to secure titles so that they could get compensation or sell their lots outright for a much higher price in the future as the land was titled. 6560
10.9 - Constraints to changes in land tenure
A stakeholder analysis was conducted by the City of Cebu to assess views on possible changes to how land could be held in the 6565 peri-urban environment of the city of Cebu. Eight different groups were given the opportunity to respond to the question of the legal restrictions that might be imposed if a Presidential Proclamation declared their respective barangay as protected watersheds. The comments were commonly expressed in a narrative noting the cases 6570 where one of the focus group members (barangay officials, church workers, women, tenant farmers, land-owner farmers, migrant workers, service sector representatives, and peoples’ organizations) dissents from the widely held view.
6575 It was a widely held view that changes in the way land was
held in the peri-urban environment would have negative

240
consequences. For example, a prohibition through a government declaration would seriously compromise the livelihood prospects of the many farmers in the area and such a declaration would be 6580 perceived negatively as being simply the machinations of powerful Cebu families who wished to grab the land in question. Similarly, any restrictions placed on the use of agro-chemicals in the peri-urban environment would limit mango production and harm the economic viability of that agricultural endeavor. 6585
10.9.1 - On the issue of land tenure in the peri-urban environment of Cebu City
Many residents hold tax declarations rather than titles to the 6590 land and the fear was that they could no longer be converted into a title because of impending watershed laws. They therefore felt insecure as they may be evicted at anytime. This feeling led them to not pay their land taxes as long as the issue of land titling was not resolved. For many, the only avenue they have is the tilling of the 6595 land as they can not sell land that is not titled and move elsewhere. Therefore, if a decision is taken by the government to stop titling some of the lands that fall within the watershed area this will be seen by the occupiers of the land as a way to deprive them of their rights to their land. Many were enraged by the thought that the rich and 6600 influential persons who owned lands with tax declaration in the area had no difficulty in getting their lands titled. A further complication is that landowners who are not holding titles for their land (but do hold tax declarations) refuse to have their lands tilled because they believe that once a Certificate of Stewardship contract (hereafter 6605 CSC) is released, it will be given to their tenants since they are actually tillers of the land. A CSC is a legal arrangement entered into between cultivators of State-owned land and the State. It is a contract whereby landuse and cultivation regimes are restricted to what is considered to be sustainable practices (agroforestry and strict 6610 guidelines on the use of fire) that extends for 25 years. It may be renewed for a further 25 years but this provision has yet to be tested.

241
10.9.2 - On eviction, relocation and compensation 6615
Many tenant farmers fear being evicted from the land they till. They felt that if they are evicted they will not receive any compensation from government. There is also a common feeling that they will not receive the 500 sq. meters of land promised them if they leave to go to a relocation site. In general, the whole policy of 6620 relocation and allocation of lands to those programmed for relocation owing to development in the peri-urban environment is poorly communicated to those potentially most affected. A general feeling of disquiet pertained to the failure of the government to declare other areas as protected watersheds (e.g. Talamban). 6625 Talamban, it was felt, was not included because some rich and influential families have significant landholdings in the area. A general position was that the government failed to provide services to the people in the peri-urban areas and thus the residents did not have a good idea of possibly more environmentally-friendly 6630 alternatives to what is currently occurring. Similarly the DENR was perceived to be myopic in that they only viewed the peri-urban area from an environmental perspective rather than as a landscape inhabited by farmers and their families. Misconceptions of the laws regarding the harvesting of trees resulted in the much reduced 6635 planting of trees that could help rehabilitate the watershed.
10.9.3 - On the proclamations declaring their barangay protected watershed areas 6640
Many wished to have the proclamation declaring their areas as protected watershed lifted to allow for the titling of the lands so that they could then get on with planning for a more sustainable watershed with clear title to the land they tilled. Generally, the DENR was seen to have done a very poor job of defining the 6645 program and the potential impact on the barangay to be included in the proclamation and this reinforced the perception that

242
government policies are contradictory in that they cannot seem to 6650 help both the people living in the peri-urban watersheds and protect the watershed environment at the same time.
10.10 - Women, youth and land reform 6655
As detailed in the qualitative study, few women and young people are demanding access to land for themselves as individuals. Rather, any demands that are made for land are driven by the family unit which traditionally in the Philippines is represented by the male 6660 head of the household. Women’s main interest in land reform is in the provision of adequate resources for the maintenance of the family and then access to information and technology that will assist them in adding value to farm produce to increase farm incomes. The youth are not, in general, focused on having a future in agriculture. 6665 The negative perception of the vocation of agriculture is reinforced by their parents who strive to educate them for a better life outside of agriculture. Legally, the young and women have rights to own and access land. However, these rights are rarely acted upon by individuals. 6670
10.11 - Access to land owned by the State
The residents in the two villages in the peri-urban case study that are established solely on State-owned land have a host of 6675 problems in securing permanent security of land tenure. The prospect of more State land being made available for legal occupation is remote. The peri-urban environment of Cebu is also a critical watershed area from which the majority of the urban areas water resources are sourced. A law is currently under consideration 6680 by Congress which will ‘lock-up’ all remaining state-owned lands in perpetuity and will bring to an end all legal settlement and development activities in such lands.
10.12 - Land tenure security 6685
Security of tenure for the residents of the barangay of peri-urban Cebu is very poor. A set of overlapping land laws and

243
proclamations undermine any security in tenure. There are protected watersheds, national parks, State-owned lands all with separate laws 6690 and interpretations of the rights of persons residing in these areas. New laws and classifications of the peri-urban environment have been recently written for which little to no consultation was made with those living in the areas that have been redefined. Only the affluent and well connected appear to be able to secure legal 6695 ownership of land in these critical areas even though the laws state that they should not hold titles to land in these areas. It is a complex situation and one which will not be resolved easily.
10.13 - Nutritional status in peri-urban Cebu 6700
While the currently studied barangay are underrepresented in the study used to describe malnutrition in the uplands of Cebu, the picture across the peri-urban area (from a sample of 30 barangay) depicts a more serious situation (Table n° 10.17). Of the slightly 6705 more than 43,000 children weighed, 34 percent were classified as malnourished to the first degree, a further 23 percent to the second degree and 4 percent to third degree. A total of 61 percent of children weighed were classified as in some way malnourished (Cebu City, 1988). 6710
A second analysis of nutritional status was concluded in 1998. In the intervening period the classification system for levels of malnutrition were changed. It is unclear if conditions in the studied barangay actually improved or were influenced by different 6715 measures. By 1998 the number of cases of malnutrition in Agsungot was reduced to 19 cases with 12 of these being assisted through a supplemental food program. The situation in Sudlon 1, however, deteriorated with a reported 60 cases of malnutrition for the surveyed population of 107. There was no supplemental feeding 6720 program supporting these children. Comparative data are unavailable for barangay Cambinocot and Tagba-o. In 1998, Cambinocot had a low incidence of malnutrition with just 10 cases from 271 surveyed children aged 0-6 years old. Tagba-o was more critical with 29 cases from its surveyed population of 219. 6725

244
Table n° 10.17 – Nutritional status of children 0-6 years old, peri-
urban, Cebu City, 1987
Bar
anga
y
No.
of c
hild
ren
0-6
year
s
No.
of c
hild
ren
wei
ghed
No.
of 1
st d
egre
e m
alno
uris
hed
No.
of 2
nd d
egre
e m
alno
uris
hed
No.
of 3
rd d
egre
e m
alno
uris
hed
Tot
al m
alno
uris
hed
child
ren
Tot
al c
hild
ren
wei
ghed
Cambinocot 333 0 0 0 0 0 0 Agsungot 279 202 94 13 0 107 72.4 % Tagba-o 169 0 0 0 0 0 0 Sudlon I 391 0 27 15 0 42 0
Source: City of Cebu, 1987 6730
A further study in the peri-urban villages was carried out by
the OPS, the University of San Carlos (Cebu City) and the DENR (1999). They found that 12.6 percent of 6,400 school children were 6735 either severely or moderately stunted. This corresponded with a study (Fifth National Nutrition Survey) the previous year that reported 8.7 percent for the province as a whole. Similarly, 12.8 percent of the same school children were severely or moderately underweight versus only 5.5 percent for the entire province i.e. the 6740 peri-urban barangay appear to have a substantially higher incidence of underweight children.
These time-based studies of malnutrition status are fraught
with difficulties. Climatic conditions and concomitant agricultural 6745 production cycles are critical when assessing nutritional status. The conditions during these two study periods were ‘normal’ in that neither drought nor flood had recently impacted the area. All we can

245
conclude from the available data is that malnutrition is an issue. Anecdotal evidence suggests that it can intensify especially during 6750 periods of drought that do reoccur from time to time. 10.14 - Allocation of land held by the State
It is important at this point to outline some of the salient 6755 points regarding land owned by the State that is occupied by farmers. This is a critical issue in Cebu but as mentioned in Chapter Seven this was also important in Sta. Paz.
The National Integrated Protected Area System (hereafter 6760
NIPAS), is the ‘umbrella’ legislation pertaining to environmental protection in the Philippines. The DENR began implementing the NIPAS Act in 1993, although it originated in 1988, when the Haribon Foundation of the Philippines proposed an “Integrated Protected Areas System” to then President Aquino. The act, 6765 formally enacted in 1992 as the Republic Act (RA) 7586, refers to the classification and administration of all designated protected areas throughout the Philippines. It is designed to maintain essential ecological processes and life-support systems, to preserve genetic diversity, to ensure sustainable use of resources, and to maintain the 6770 protected areas’ natural conditions to the greatest extent possible (PSDN 1999). The system was designed to halt the depletion of forest and marine resources throughout the country, and aims to secure for present and future generations of Filipinos the continued existence of native flora, fauna, and landscapes. It also strives to 6775 provide the basic human needs that are dependent on a healthy environment (Arquiza 1993).
The initial phase of the NIPAS project was the identification
of ten priority sites to be protected, based on information from the 6780 DENR, conservation groups and the academe. This phase began in 1990, and was funded by the World Bank, as was the next seven-year implementation phase (Arquiza 1993). This funding was crucial to the program, as it has been a lack of funds, among other local issues, that has led to the degradation of the Philippines’ 6785 protected areas.

246
The NIPAS program is one of the major implementing strategies for Republic Act 7586, with the first five years of implementation financed by the European Union with increasing 6790 contribution from the Philippine government. The objective of the program is to achieve the following goals for each protected area: • establishment of a Geographic Information System and
integrated database; • execution of socio-economic surveys and consultations; 6795 • preparation of a General Management Plan; • delineation and demarcation of protected area and buffer zone
boundaries and strengthening the capability of protected areas management staff;
• promotion of locally identified alternative economic activities; 6800 • enhancement of the effectiveness and sustainability of the
protected area management and consultation mechanisms foreseen in the NIPAS Act, through the provision of appropriated training and advice of all levels;
• implementation of a public awareness program; and, 6805 • provision of the necessary facilities and technical input (DENR
1999). DENR personnel are responsible for these activities. The DENR is mandated to be the primary government agency responsible for the 6810 conservation, management, development and proper use of the country’s environmental and natural resources (DENR 1999).
Groombridge (1992) notes that the primary objectives of national parks in the Philippines (there are two in the peri-urban 6815 environment of Cebu) are to maintain sample ecosystems in their natural state, preserve ecological diversity through environmental regulation, to conserve genetic resources and maintain watershed/flood control, to provide recreation and tourism service, to protect scenic beauty, and to contribute to rural development. 6820 Generally, natural resource exploitation is prohibited in national parks, meaning that agricultural and pastoral activities, hunting, fishing, lumbering, mining, public works construction, and residential, commercial or industrial occupation are all disallowed (IUCN 1985). 6825

247
By contrast, and significantly, the primary objectives of other protected area designations under the NIPAS Act are unclear, particularly in the context of the role of local populations. Such ambiguity in the stated objectives is pertinent to the areas considered 6830 here. It is clear from the focus group interviews that there is contrasting and contradictory information permeating the peri-urban communities of Cebu and, until a clear message is forthcoming from government, continued distrust and lack of progress will define relationships. 6835
10.15 - Summary
What is evident from the case study in peri-urban Cebu is the complexity of the relationships between those occupying land, those 6840 owning land and the various government agencies that are trying with limited will and ability to influence the direction of change. There is in contrast to Sta. Paz in Matalom a strong sense of urgency in ‘solving’ the tenancy and subsequently the environmental problems in the upland peri-urban environments of Cebu. This is 6845 largely owing to the hydrological relationship these peri-urban environments have with the rapidly growing urban economy of Cebu City with corresponding high population growth rates in the peri-urban uplands of the City (Flieger and Cusi 1998). What is not readily apparent is a coherent vision of how to attain sustainable 6850 tenure conditions and a still hypothetical concomitant ecological renaissance. Movement on this issue is just beginning to take hold through a comprehensive project initiated by many concerned government and NGO partners with a coordinating role being played by the Water Resources Center of the University of San Carlos. 6855