Embed Size (px)
Citation preview
INVESTMENTS | BODIE, KANE, MARCUS
Copyright © 2011 by The McGraw-Hill Companies, Inc. All rights reserved. McGraw-Hill/Irwin
CHAPTER 12
Behavioral Finance and Technical Analysis

INVESTMENTS | BODIE, KANE, MARCUS
12-2
Behavioral Finance
Conventional
Finance
• Prices are correct;
equal to intrinsic
value.
• Resources are
allocated efficiently.
• Consistent with EMH
Behavioral Finance
• What if investors don’t
behave rationally?
INVESTMENTS | BODIE, KANE, MARCUS
12-3
The Behavioral Critique
Two categories of irrationalities:
1. Investors do not always process
information correctly and/or timely.
Result: Incorrect probability distributions
of future returns.
2. Even when given a probability distribution
of returns, investors may make
inconsistent or suboptimal decisions.
Result: They have behavioral biases.
INVESTMENTS | BODIE, KANE, MARCUS
12-4
Errors in Information Processing: Misestimating True Probabilities
1. Forecasting Errors: Too much weight is placed on recent experiences.
2. Overconfidence: Investors overestimate their abilities and the precision of their forecasts.
3. Conservatism: Investors are slow to update their beliefs and under react to new information.
4. Sample Size Neglect and Representativeness: Investors are too quick to infer a pattern or trend from a small sample.

INVESTMENTS | BODIE, KANE, MARCUS
12-5
Behavioral Biases
• Biases result in less than rational
decisions, even with perfect
information.
Examples:
1.Framing (the half glass problem):
– How the risk is described, “risky losses”
vs. “risky gains”, can affect investor
decisions.

INVESTMENTS | BODIE, KANE, MARCUS
12-6
Behavioral Biases
2. Mental Accounting:
• Investors may segregate accounts or
monies and take risks with their gains
that they would not take with their
principal
3. Regret Avoidance:
• Investors blame themselves more when
an unconventional or risky bet turns out
badly
INVESTMENTS | BODIE, KANE, MARCUS
12-7
Behavioral Biases
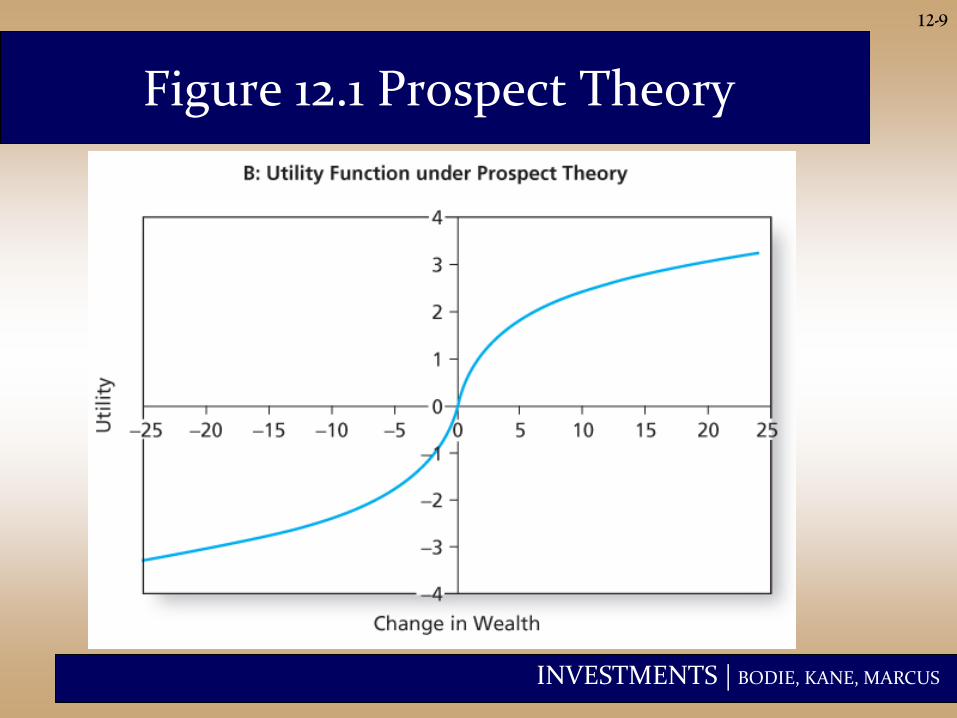
4. Prospect Theory:
– Conventional view: Utility depends on level of
wealth.
– Behavioral view: Utility depends on changes
in current wealth.

INVESTMENTS | BODIE, KANE, MARCUS
12-8
Figure 12.1 Prospect Theory
INVESTMENTS | BODIE, KANE, MARCUS
12-9
Figure 12.1 Prospect Theory
INVESTMENTS | BODIE, KANE, MARCUS
12-10
Limits to Arbitrage
• Behavioral biases would not matter if
rational arbitrageurs could fully exploit
the mistakes of behavioral investors.
• Fundamental Risk:
– “Markets can remain irrational longer
than you can remain solvent.”
– Intrinsic value and market value may
take too long to converge.
INVESTMENTS | BODIE, KANE, MARCUS
12-11
Limits to Arbitrage
• Implementation Costs:
– Transactions costs and restrictions on short
selling can limit arbitrage activity.
• Model Risk:
– What if you have a bad model and the market
value is actually correct?
– What if you have the right model and
everyone else has the wrong one?
INVESTMENTS | BODIE, KANE, MARCUS
12-12
Limits to Arbitrage and the Law of One Price
• Siamese Twin Companies
–Royal Dutch should sell for 1.5
times Shell
–Actual price ratio deviated from
parity ratio for extended periods
–Example of fundamental risk

INVESTMENTS | BODIE, KANE, MARCUS
12-13
Figure 12.2 Pricing of Royal Dutch Relative to Shell (Deviation from Parity)

INVESTMENTS | BODIE, KANE, MARCUS
12-14
Limits to Arbitrage and the Law of One Price
• Equity Carve-outs
– 3Com and Palm: 5% of Palm in IPO; 3Com shareholder: 95%, plus 1.5 shares in 6m
– Structure implied 3Com to be negative, although Asset/Share = $10
– Arbitrage was limited by non availability of Palm shares for shorting
• Closed-End Funds
– May sell at premium or discount to NAV
– Can also be explained by rational return expectations, idiosyncratic nature, sentiment

INVESTMENTS | BODIE, KANE, MARCUS
12-15
Bubbles and Behavioral Economics
Bubbles are easier to spot after
they end:
• Dot-com bubble
• Housing bubble
• Which one is next?
INVESTMENTS | BODIE, KANE, MARCUS
12-16
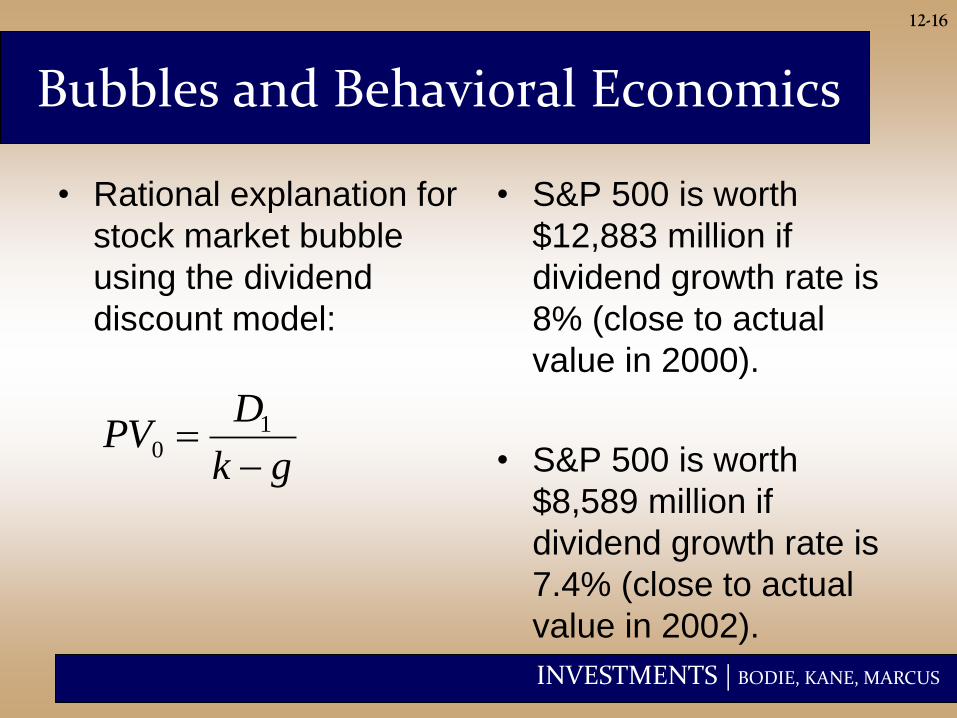
Bubbles and Behavioral Economics
• Rational explanation for
stock market bubble
using the dividend
discount model:
• S&P 500 is worth
$12,883 million if
dividend growth rate is
8% (close to actual
value in 2000).
• S&P 500 is worth
$8,589 million if
dividend growth rate is
7.4% (close to actual
value in 2002).
gk
DPV
1
0
INVESTMENTS | BODIE, KANE, MARCUS
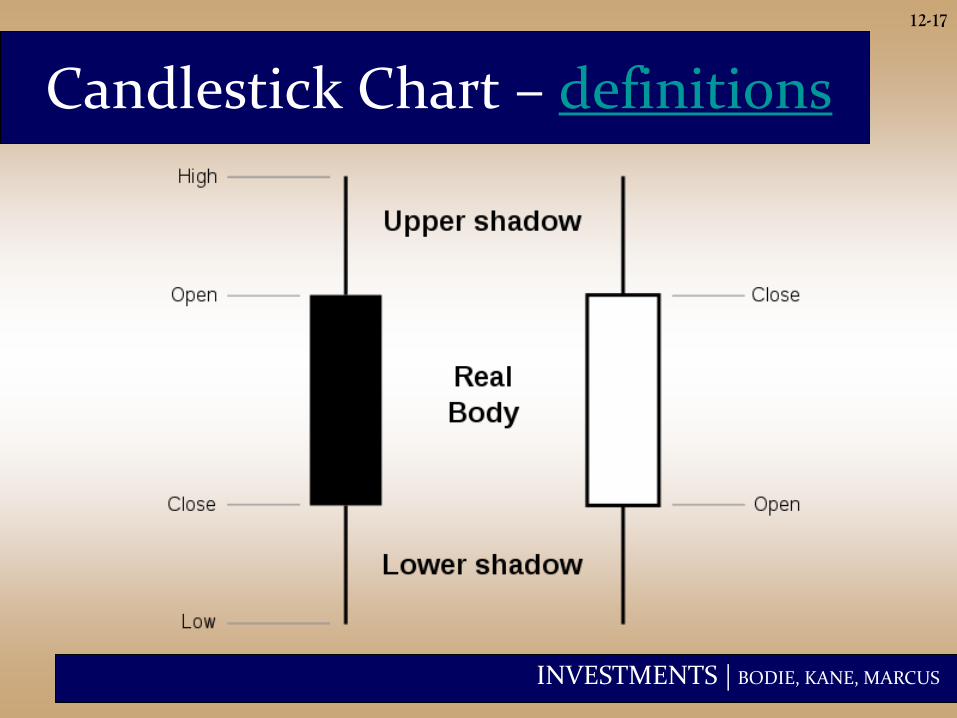
Candlestick Chart – definitions
12-17

INVESTMENTS | BODIE, KANE, MARCUS
Candlestick – Hi-Lo Sequence
12-18
Candlestick does not tell sequence

INVESTMENTS | BODIE, KANE, MARCUS
Candlestick Charts: Types
Trend vs
Consolidation
Marubozu = one
way action
12-19

INVESTMENTS | BODIE, KANE, MARCUS
Candlestick Analysis - Example
12-20
0
5
10
15
20
25
30
1 2 3 4 5 6
day open high low close 1 10 25 6 20 2 20 22 12 15 3 12 12 7 7 4 5 13 3 13 5 10 16 8 16 6 19 28 19 27
INVESTMENTS | BODIE, KANE, MARCUS
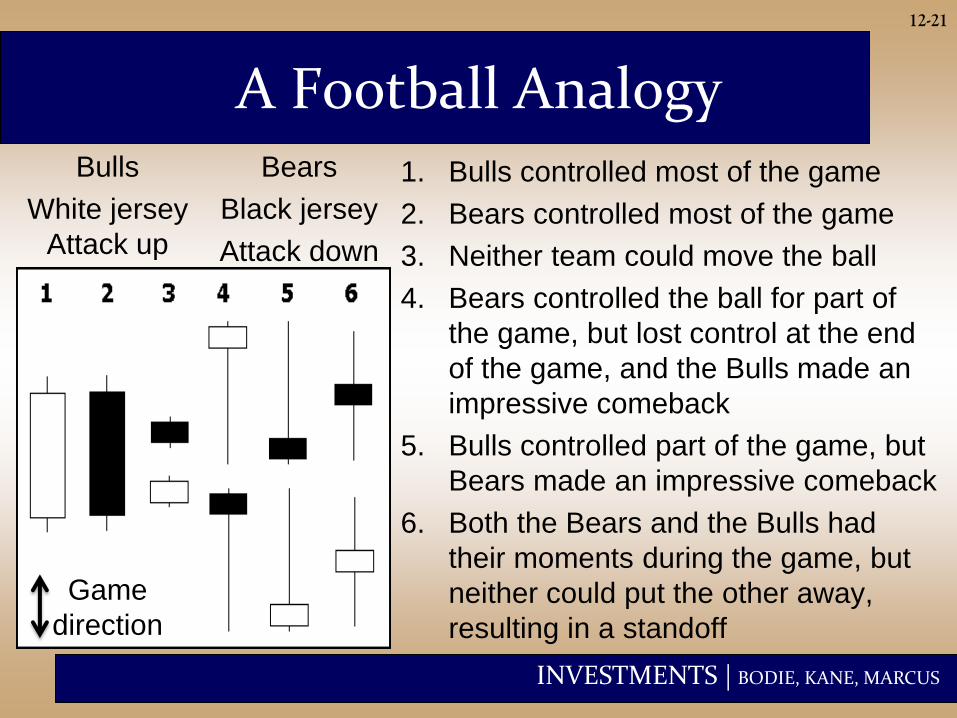
A Football Analogy
1. Bulls controlled most of the game
2. Bears controlled most of the game
3. Neither team could move the ball
4. Bears controlled the ball for part of
the game, but lost control at the end
of the game, and the Bulls made an
impressive comeback
5. Bulls controlled part of the game, but
Bears made an impressive comeback
6. Both the Bears and the Bulls had
their moments during the game, but
neither could put the other away,
resulting in a standoff
12-21
Bulls
White jersey
Attack up
Bears
Black jersey
Attack down
Game
direction
INVESTMENTS | BODIE, KANE, MARCUS
12-22
Technical Analysis and Behavioral Finance
• Technical analysis attempts to exploit
recurring and predictable patterns in
stock prices
– Prices adjust gradually to a new
equilibrium
– Market values and intrinsic values
converge slowly
INVESTMENTS | BODIE, KANE, MARCUS
12-23
Technical Analysis and Behavioral Finance
• Disposition effect: The tendency of
investors to hold on to losing investments.
– Demand for shares depends on price history
– Can lead to momentum in stock prices

INVESTMENTS | BODIE, KANE, MARCUS
12-24
Trends and Corrections: The Search for Momentum
Dow Theory
1.Primary trend : Long-term movement of
prices, lasting from several months to
several years.
2.Secondary or intermediate trend: short-
term deviations of prices from the
underlying trend line and are eliminated by
corrections.
3.Tertiary or minor trends: Daily fluctuations
of little importance.

INVESTMENTS | BODIE, KANE, MARCUS
12-25
Figure 12.3 Dow Theory Trends
INVESTMENTS | BODIE, KANE, MARCUS
12-26
Trends and Corrections: Moving Averages
• The moving average
is the average level of
prices over a given
interval of time.
• Bullish signal: Market
price breaks through
the moving average
line from below. Time
to buy
• Bearish signal: When
prices fall below the
moving average, it is
time to sell.

INVESTMENTS | BODIE, KANE, MARCUS
12-27
Figure 12.5 Moving Average for HPQ
50-day MA HPQ

INVESTMENTS | BODIE, KANE, MARCUS
12-28
Trends and Corrections: Breadth
Breadth: Often
measured as the
spread between
the number of
stocks that
advance and
decline in price.
Example: for
NYSE Breadth=
1604-1434= 170
INVESTMENTS | BODIE, KANE, MARCUS
12-29
Sentiment Indicators: Trin Statistic
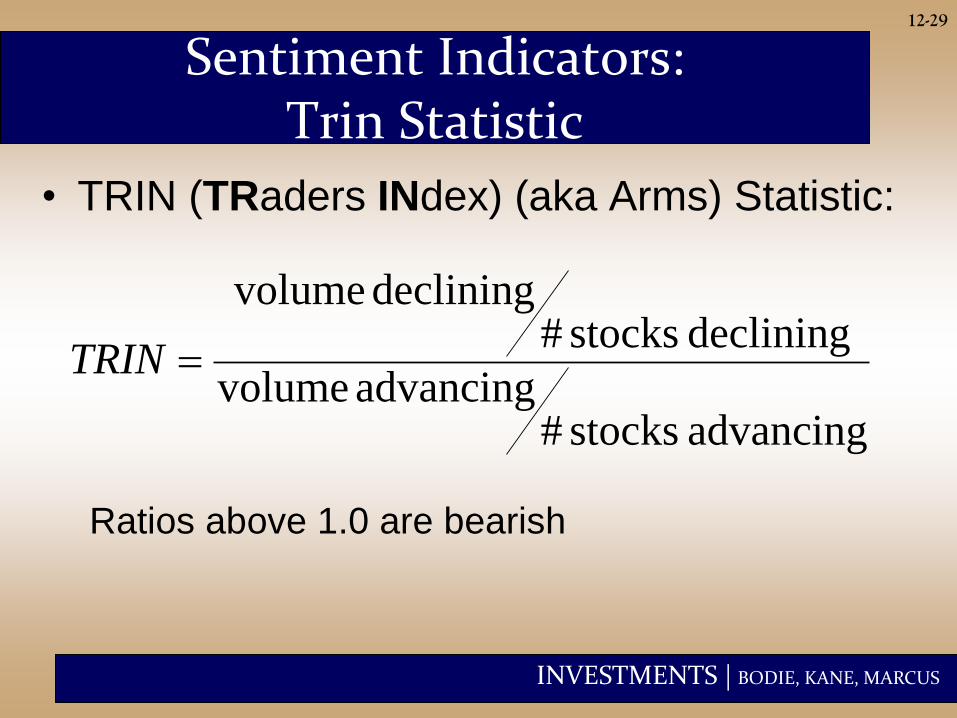
• TRIN (TRaders INdex) (aka Arms) Statistic:
Ratios above 1.0 are bearish
advancing stocks #advancing volume
declining stocks #declining volume
TRIN
INVESTMENTS | BODIE, KANE, MARCUS
12-30
Sentiment Indicators: Confidence Index
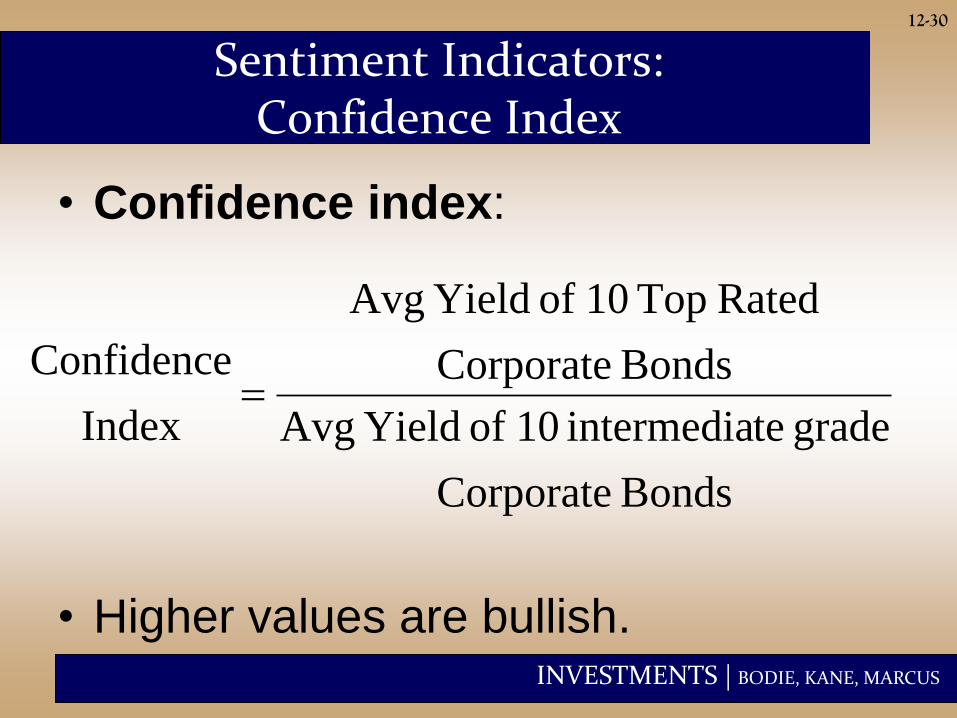
• Confidence index:
• Higher values are bullish.
Bonds Corporate
grade teintermedia 10 of Yield Avg
Bonds Corporate
Rated Top 10 of Yield Avg
Index
Confidence
INVESTMENTS | BODIE, KANE, MARCUS
12-31
Sentiment Indicators: Put/Call Ratio
• Puts are the right to
sell
– A way to bet on falling
prices
• Calls are the right to
buy
– A way to bet on rising
prices
• A rising ratio may
signal investor
pessimism and a
coming market
decline.
• Contrarian investors
see a rising ratio as a
buying opportunity!

INVESTMENTS | BODIE, KANE, MARCUS
12-32
Warning!
• It is possible to perceive patterns that really
don’t exist.
• Figure 12.8A is based on the real data. The
graph in panel B was generated using
“returns” created by a random-number
generator.
• Figure 12.9 shows obvious randomness in
the weekly price changes behind the two
panels in Figure 12.8

INVESTMENTS | BODIE, KANE, MARCUS
12-33
Figure 12.8 Actual and Simulated Levels for Stock Market Prices of 52 Weeks

INVESTMENTS | BODIE, KANE, MARCUS
12-34
Figure 12.9 Actual and Simulated Changes in Stock Prices for 52 Weeks