Embed Size (px)
Citation preview

INVESTMENTS | BODIE, KANE, MARCUS
Copyright © 2011 by The McGraw-Hill Companies, Inc. All rights reserved. McGraw-Hill/Irwin
CHAPTER 8
Index Models
INVESTMENTS | BODIE, KANE, MARCUS
8-2
• Reduces the number of inputs
for diversification
• Easier for security analysts to
specialize
Advantages of the Single Index Model
INVESTMENTS | BODIE, KANE, MARCUS
8-3
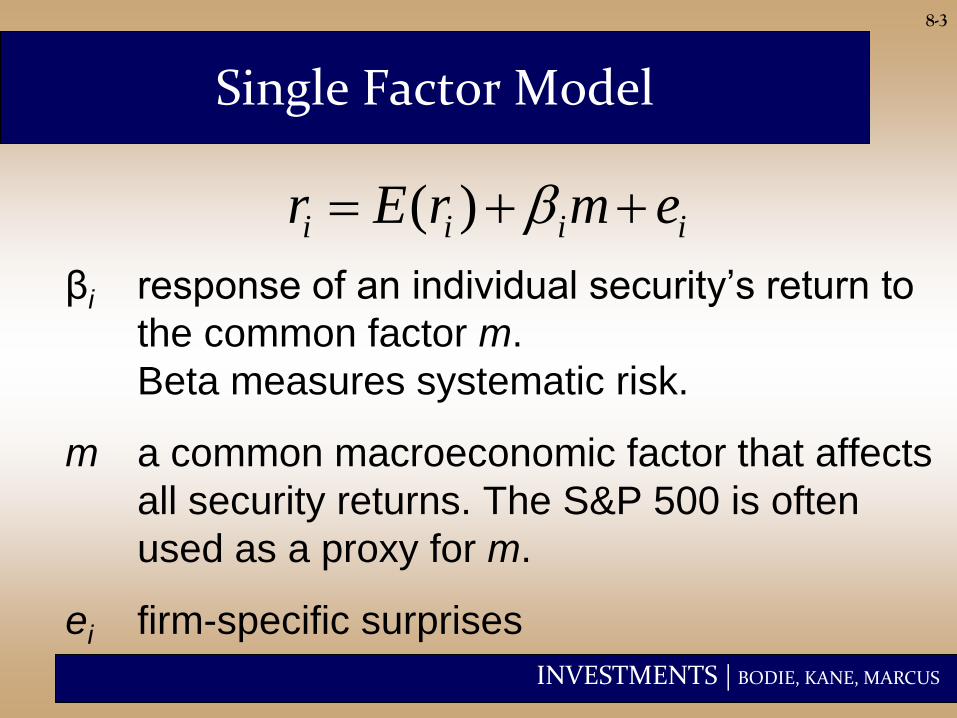
βi response of an individual security’s return to
the common factor m.
Beta measures systematic risk.
m a common macroeconomic factor that affects
all security returns. The S&P 500 is often
used as a proxy for m.
ei firm-specific surprises
Single Factor Model
( )i i i ir E r m e

INVESTMENTS | BODIE, KANE, MARCUS
8-4
Single-Index Model
• Regression Equation:
tetRtR iMiii
Miii RERE
• The expectation of the residual term
ei is zero, so the expected return-
beta relationship is:
INVESTMENTS | BODIE, KANE, MARCUS
8-5
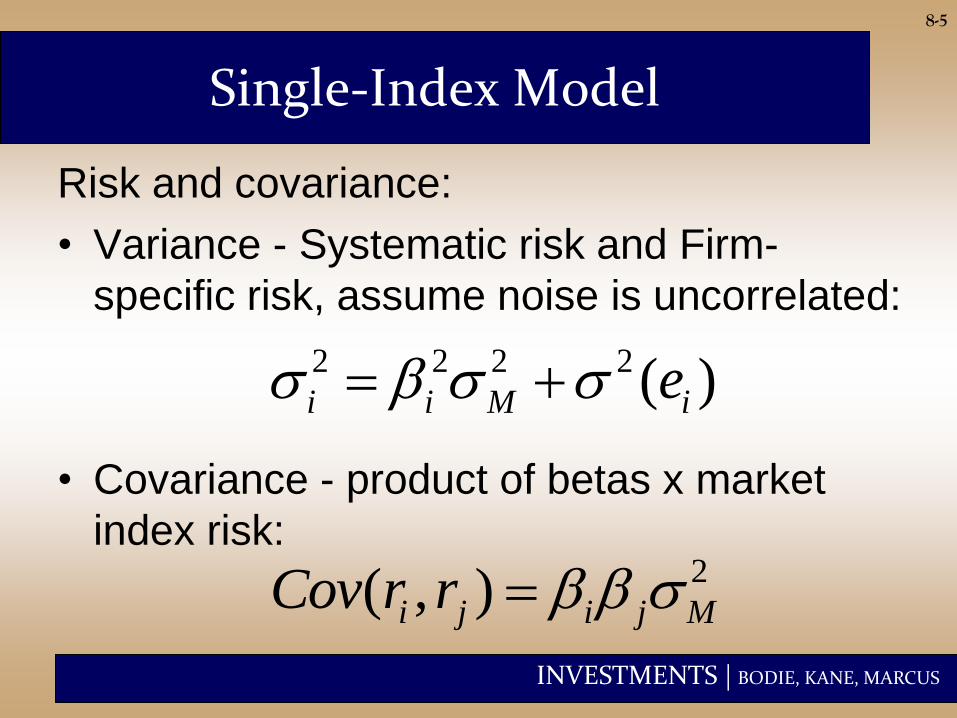
Single-Index Model
Risk and covariance:
• Variance - Systematic risk and Firm-
specific risk, assume noise is uncorrelated:
• Covariance - product of betas x market
index risk:
2 2 2 2 ( )i i M ie
2( , )i j i j MCov r r
INVESTMENTS | BODIE, KANE, MARCUS
8-6
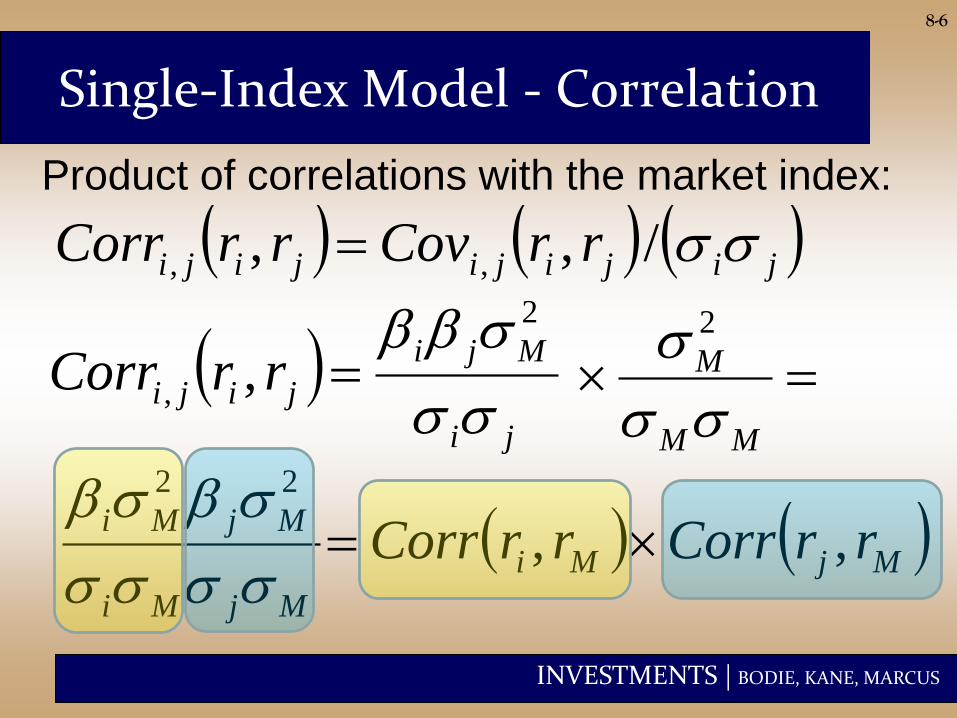
Single-Index Model - Correlation
Product of correlations with the market index:
ji
Mji
jiji rrCorr
2
, ,
MjMi
MjMi
22
MjMi rrCorrrrCorr ,,
MM
M
2
jijijijiji rrCovrrCorr /,, ,,
INVESTMENTS | BODIE, KANE, MARCUS
Questions to test your intuition
• What is the stock’s E(r) if (rM-rf)=0?
• What is the responsiveness of the stock to
market movements relative to rf?
• What is the stock-specific component of
return (not driven by the market)?
• What is the variance attributable to
uncertainty of the market?
• And that attributable to firm-specific events?
8-7

INVESTMENTS | BODIE, KANE, MARCUS
8-8
Index Model and Diversification
• Consider an Equally weighted portfolio and take
the expected return RP as the average:
n
i
iMii
n
i
iP eRn
Rn
R11
11
n
i
in 1
1
n
i
MiRn 1
1
n
i
ien 1
1
PPR MPR Pe
INVESTMENTS | BODIE, KANE, MARCUS
8-9
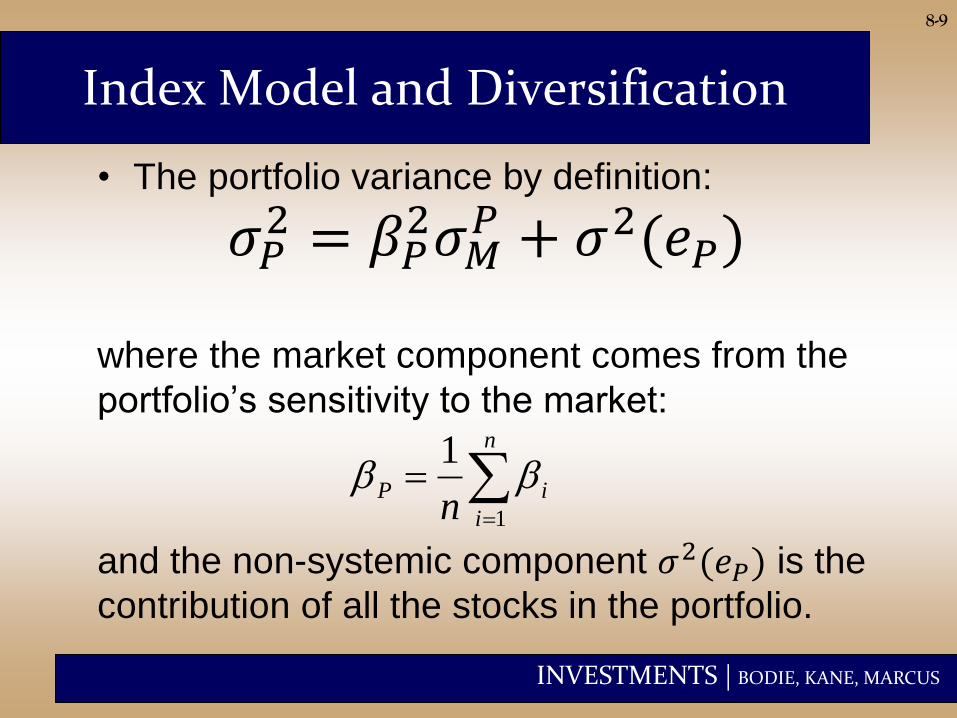
Index Model and Diversification
• The portfolio variance by definition:
𝜎𝑃2 = 𝛽𝑃
2𝜎𝑀𝑃 + 𝜎2(𝑒𝑃)
where the market component comes from the
portfolio’s sensitivity to the market:
and the non-systemic component 𝜎2(𝑒𝑃) is the
contribution of all the stocks in the portfolio.
P
market
MPP e2222
n
i
iPn 1
1

INVESTMENTS | BODIE, KANE, MARCUS
8-10
Index Model and Diversification
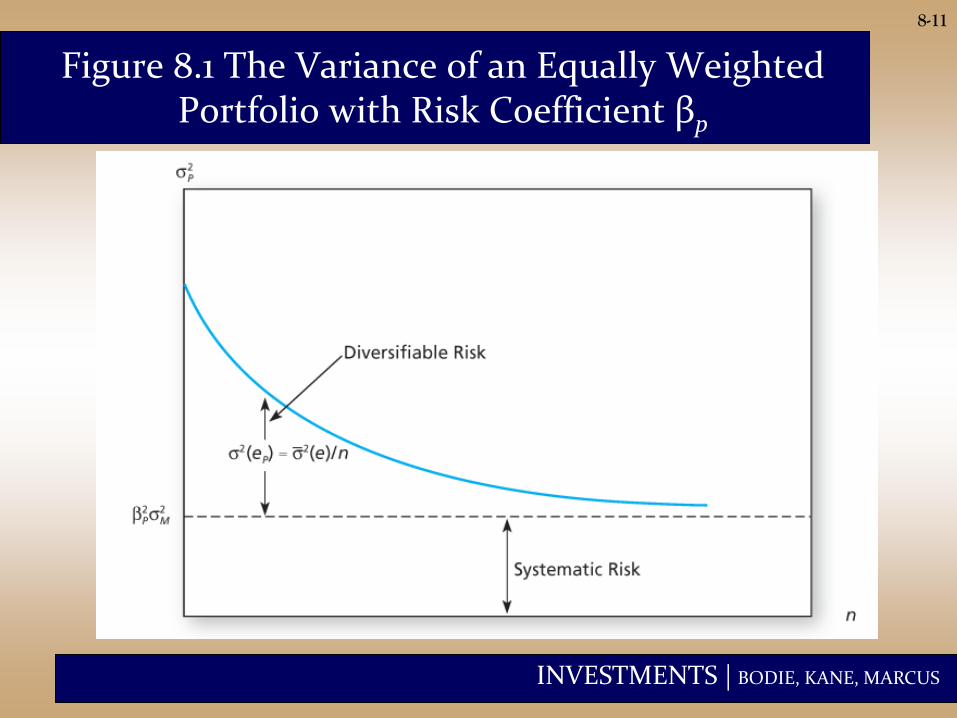
• Variance of the non-systemic component of an
equally weighted portfolio is (we assume all the
stock-specific components are uncorrelated):
• When n gets large, 𝜎2(𝑒𝑃) becomes negligible
and firm specific risk can be diversified away.
en
en
en
i
iP
2
1
2
2
2 11
INVESTMENTS | BODIE, KANE, MARCUS
8-11
Figure 8.1 The Variance of an Equally Weighted Portfolio with Risk Coefficient βp
INVESTMENTS | BODIE, KANE, MARCUS
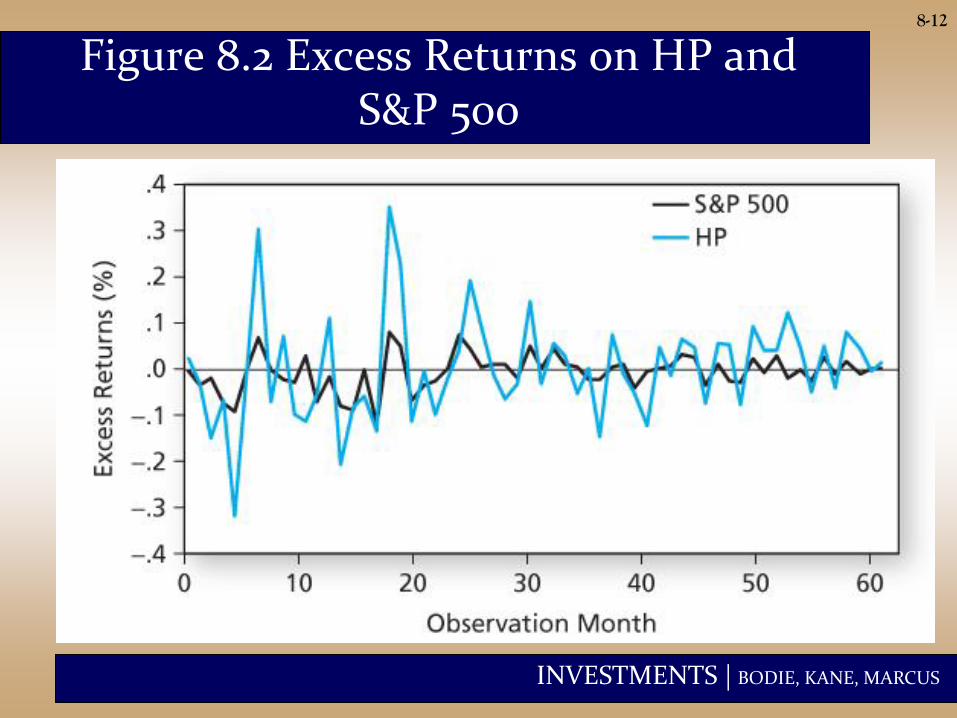
8-12
Figure 8.2 Excess Returns on HP and S&P 500
INVESTMENTS | BODIE, KANE, MARCUS
8-13
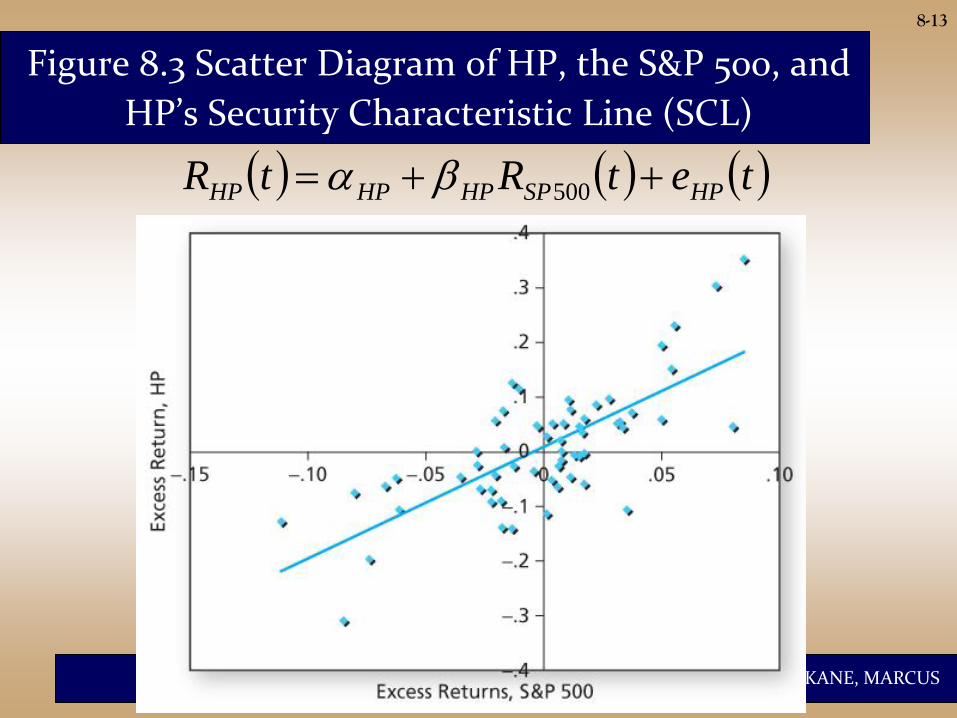
Figure 8.3 Scatter Diagram of HP, the S&P 500, and
HP’s Security Characteristic Line (SCL)
tetRtR HPSPHPHPHP 500
INVESTMENTS | BODIE, KANE, MARCUS
8-14
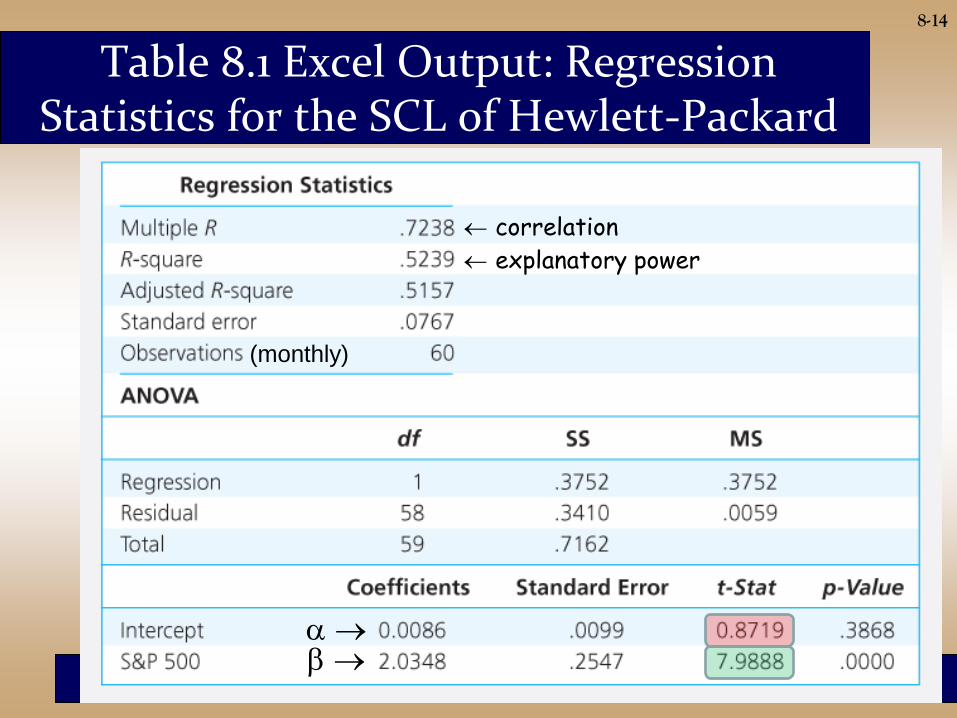
Table 8.1 Excel Output: Regression Statistics for the SCL of Hewlett-Packard
(monthly)
correlation
explanatory power

INVESTMENTS | BODIE, KANE, MARCUS
8-15
Table 8.1 Interpretation
• Correlation of HP with the S&P 500 is 0.7238
• The model explains about 52% of the variation
in HP
• HP’s alpha is 0.86% per month (10.32% p.a.),
but it is not statistically significant
• HP’s beta is 2.0348, but the 95% confidence
interval is +/- ~2 standard errors, which is quite
wide

INVESTMENTS | BODIE, KANE, MARCUS
8-16
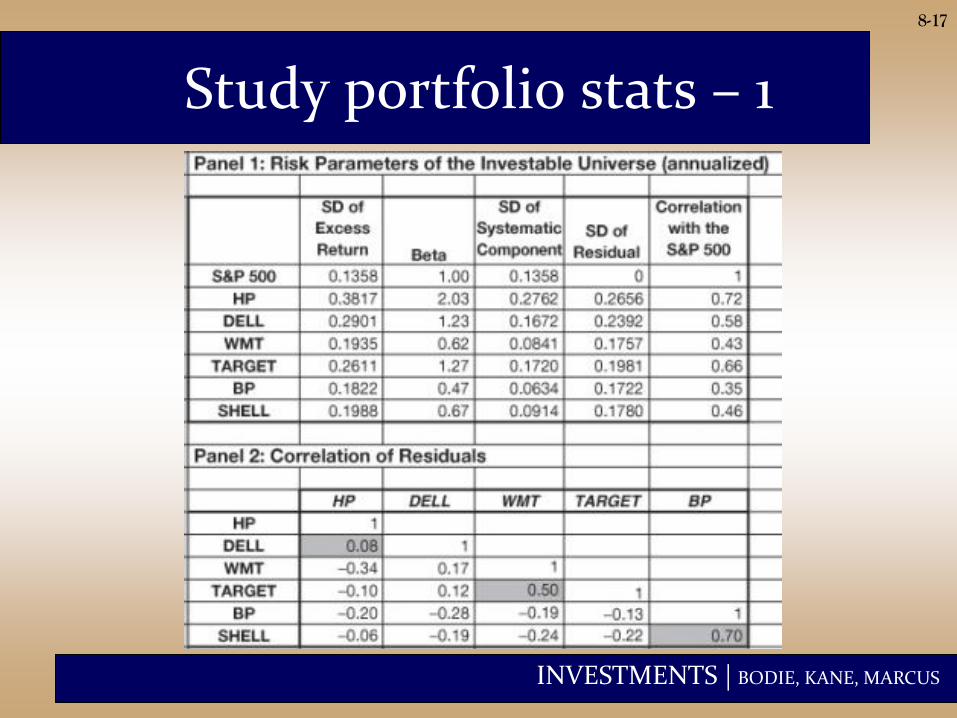
Figure 8.4 Excess Returns on Portfolio Assets
• Study pairs of securities
vs the market to
estimate correlations
• Compute stats to
measure correlations
INVESTMENTS | BODIE, KANE, MARCUS
Study portfolio stats – 1
8-17
INVESTMENTS | BODIE, KANE, MARCUS
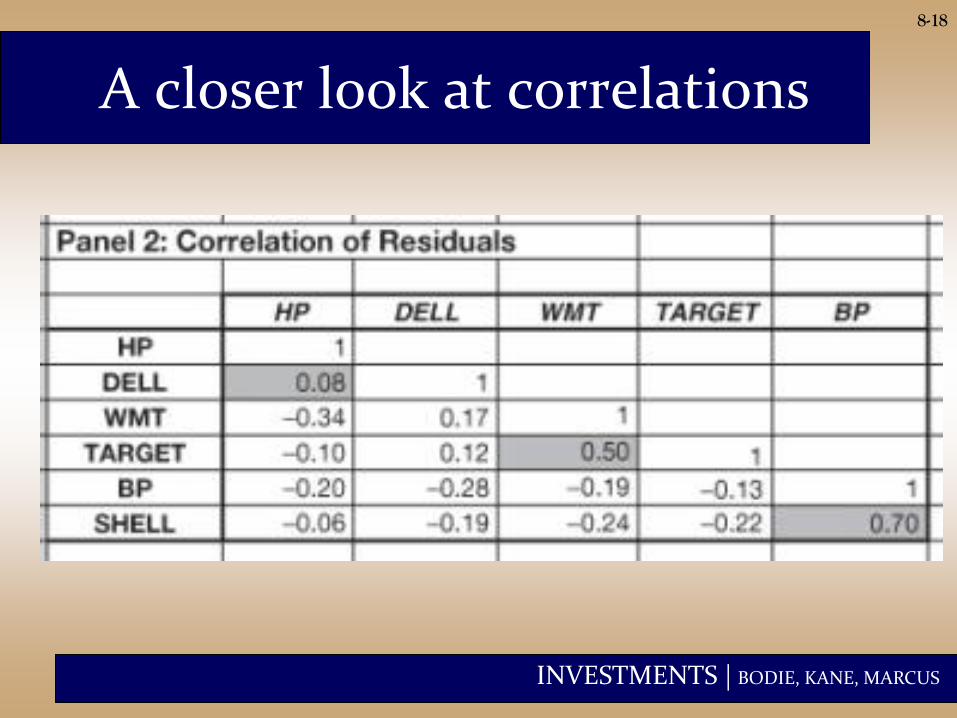
A closer look at correlations
8-18
INVESTMENTS | BODIE, KANE, MARCUS
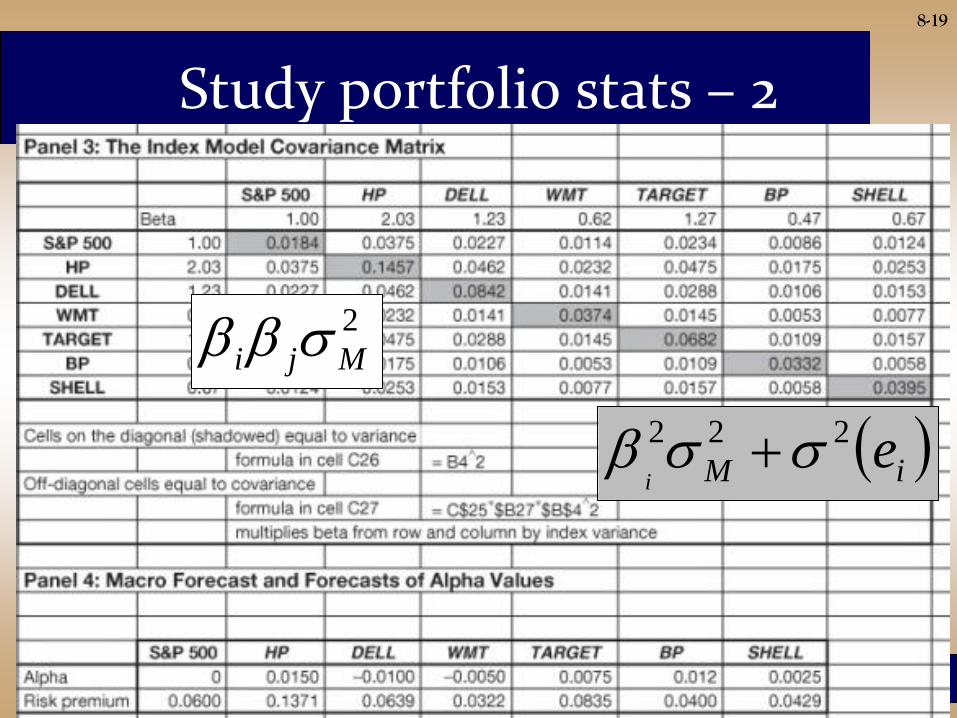
Study portfolio stats – 2
8-19
2
Mji
iM ei
222

INVESTMENTS | BODIE, KANE, MARCUS
Example: build optimal portfolio
8-20
INVESTMENTS | BODIE, KANE, MARCUS
8-21
Alpha and Security Analysis
1. Use Macroeconomic analysis to
estimate risk premium and risk of the
market index (𝑅𝑀, 𝜎𝑀)
2. Use statistical analysis to estimate
the beta coefficients of all securities
and their residual variances 𝜎2(𝑒𝑖)
INVESTMENTS | BODIE, KANE, MARCUS
8-22
Alpha and Security Analysis
3. Use numerical methods to establish
the expected return of each security
independently of security analysis (𝛽)
4. Use security analysis to develop your
own forecast of the expected returns
for each security (𝛼)
INVESTMENTS | BODIE, KANE, MARCUS
8-23
Single-Index Model considerations
• Techniques for estimating 𝛽 are well
known
• Estimating alpha requires a deep
knowledge of the company behind the
stock:
– Positive 𝛼 means overweight in the portfolio
– What do you do if 𝛼 is negative?
INVESTMENTS | BODIE, KANE, MARCUS
7-24
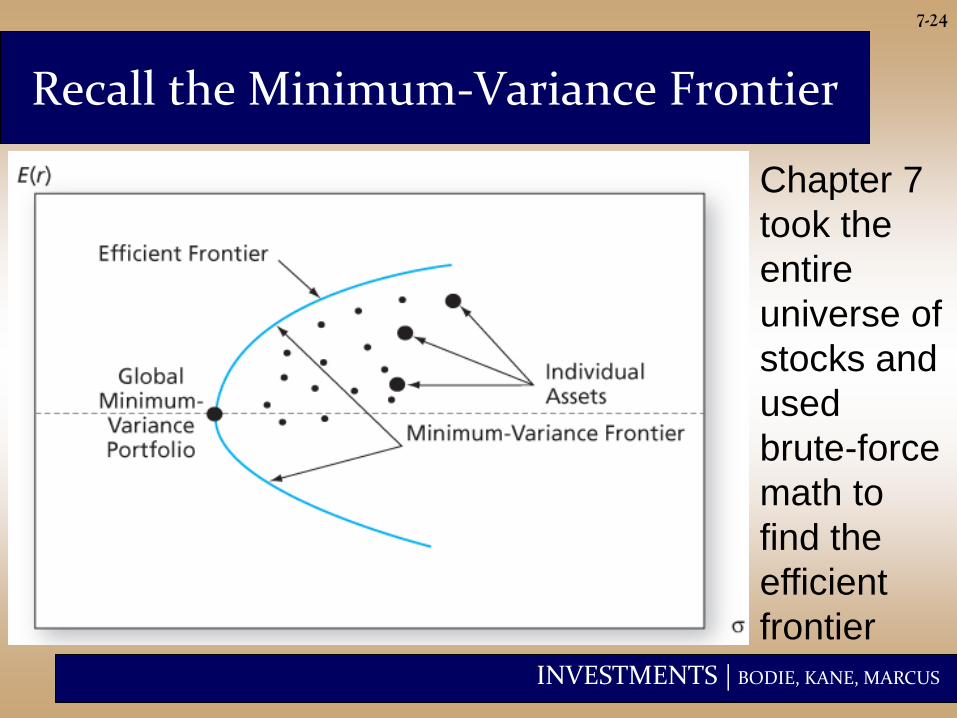
Recall the Minimum-Variance Frontier
Chapter 7
took the
entire
universe of
stocks and
used
brute-force
math to
find the
efficient
frontier
INVESTMENTS | BODIE, KANE, MARCUS
8-25
Single-Index Model – Optimization
• Single-Index model offers a simpler
optimization than the model in chapter 7
as the model is simplified
• Include the market as asset n+1 to
improve diversification. By definition:
– Beta of market index = 1
– Alpha of market index = 0
– emarket_index = 0

INVESTMENTS | BODIE, KANE, MARCUS
8-26
Single-Index Model Input List
• Risk premium on the S&P500 portfolio (𝑅𝑀)
• Estimate of the SD of the S&P500 portfolio (𝜎𝑀)
• n sets of estimates for each stock of:
– Beta coefficient
– Stock residual variances
– Alpha values
INVESTMENTS | BODIE, KANE, MARCUS
8-27
Single-Index Model steps
• Use RM, alphas and betas to construct n+1
expected returns
• Use betas and 𝜎𝑀 to construct the covariance
matrix
• Set up the optimization problem to minimize
portfolio variance, given a return, subject to…
• …constraint that weights add up to one
• You could use excel solver to solve this
problem and build your efficient frontier

INVESTMENTS | BODIE, KANE, MARCUS
8-28
Index Model – Recall 𝛼𝑃 and 𝛽𝑃
Consider a generic portfolio and take the
excess return RP as the average:
n
i
iMiii
n
i
iiP eRwRwR11
n
i
iiw1
n
i
Mii Rw1
n
i
iiew1
PPR MPR Pe

INVESTMENTS | BODIE, KANE, MARCUS
8-29
Optimal Risky Portfolio of the Single-Index Model
Now take the portfolio expected
excess return:
PMPP RERE
n
i
iiM
n
i
ii wREw11
INVESTMENTS | BODIE, KANE, MARCUS
8-30
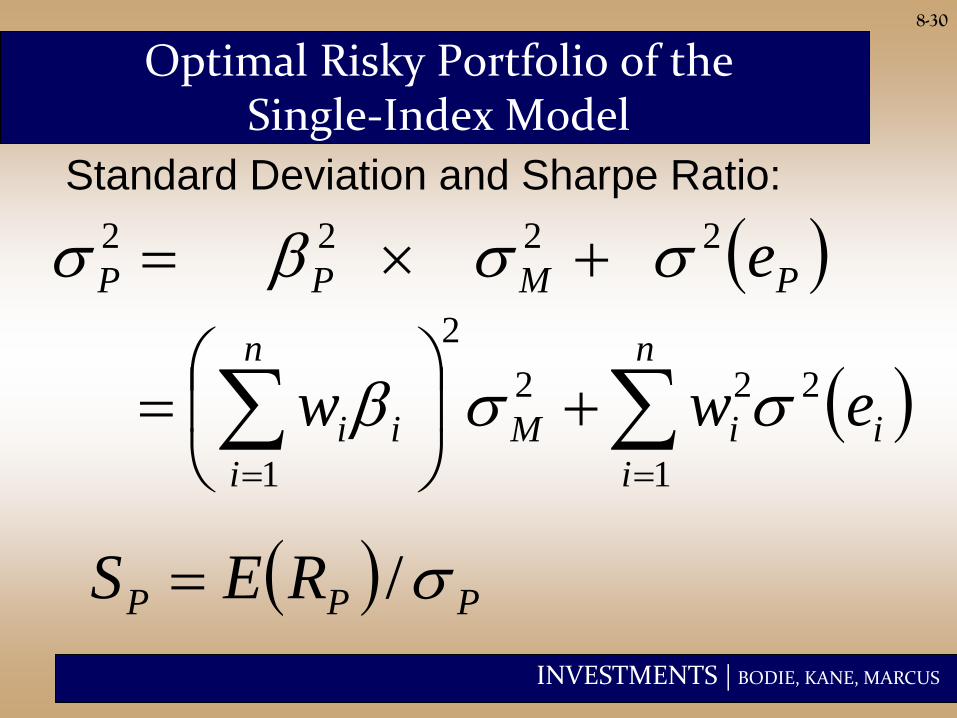
Optimal Risky Portfolio of the Single-Index Model
Standard Deviation and Sharpe Ratio:
PMPP e2222
n
i
iiM
n
i
ii eww1
222
2
1
PPP RES /

INVESTMENTS | BODIE, KANE, MARCUS
8-31
Optimal Risky Portfolio of the Single-Index Model
• No need to use Excel as there is an
analytical solution
• Solution is a combination of:
–Active portfolio (A), with weight wA
–Market-index passive portfolio (M)
INVESTMENTS | BODIE, KANE, MARCUS
8-32
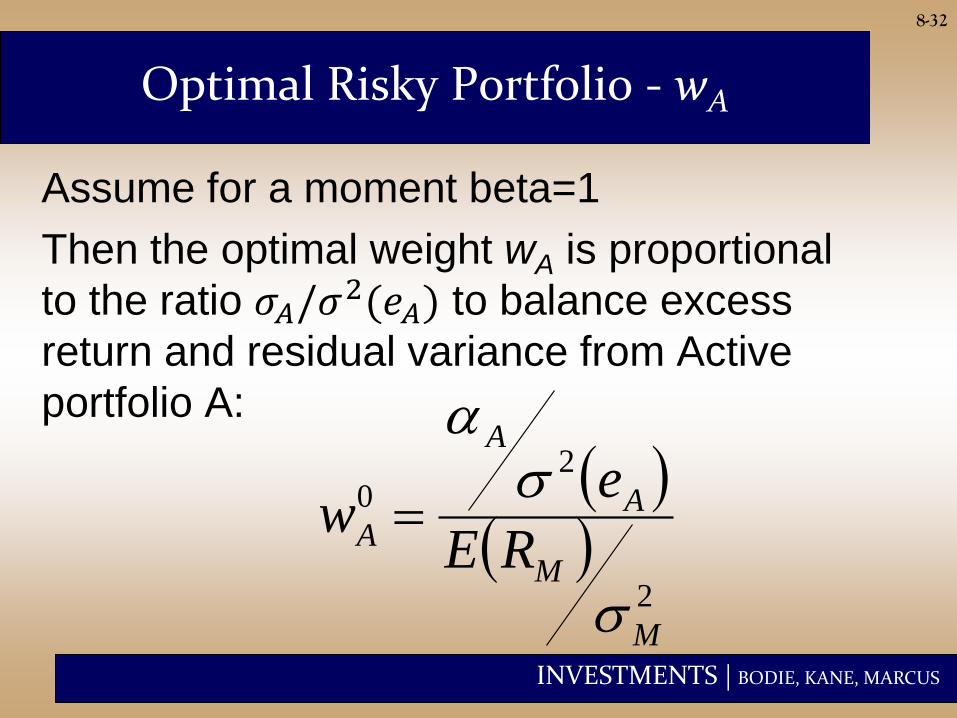
Optimal Risky Portfolio - wA
Assume for a moment beta=1
Then the optimal weight wA is proportional
to the ratio 𝜎𝐴/𝜎2(𝑒𝐴) to balance excess
return and residual variance from Active
portfolio A:
2
20
M
M
A
A
A RE
ew

INVESTMENTS | BODIE, KANE, MARCUS
8-33
Optimal Risky Portfolio of the Single-Index Model
Next, modify of active portfolio weight wA
to optimize, as beta is not necessarily =1:
Notice that when
0
0*
11 AA
AA
w
ww
0* then 1 AAA ww

INVESTMENTS | BODIE, KANE, MARCUS
8-34
The Information Ratio
The Sharpe ratio of an optimally constructed
risky portfolio will exceed that of the index
portfolio (the passive strategy):
2
2 2
( )
A
P MAe
s s
“Information” ratio
INVESTMENTS | BODIE, KANE, MARCUS
8-35
The Information Ratio
• The contribution of the active portfolio
depends on the ratio of its alpha to its
residual standard deviation.
• The information ratio measures the extra
return we can obtain from security
analysis.
INVESTMENTS | BODIE, KANE, MARCUS
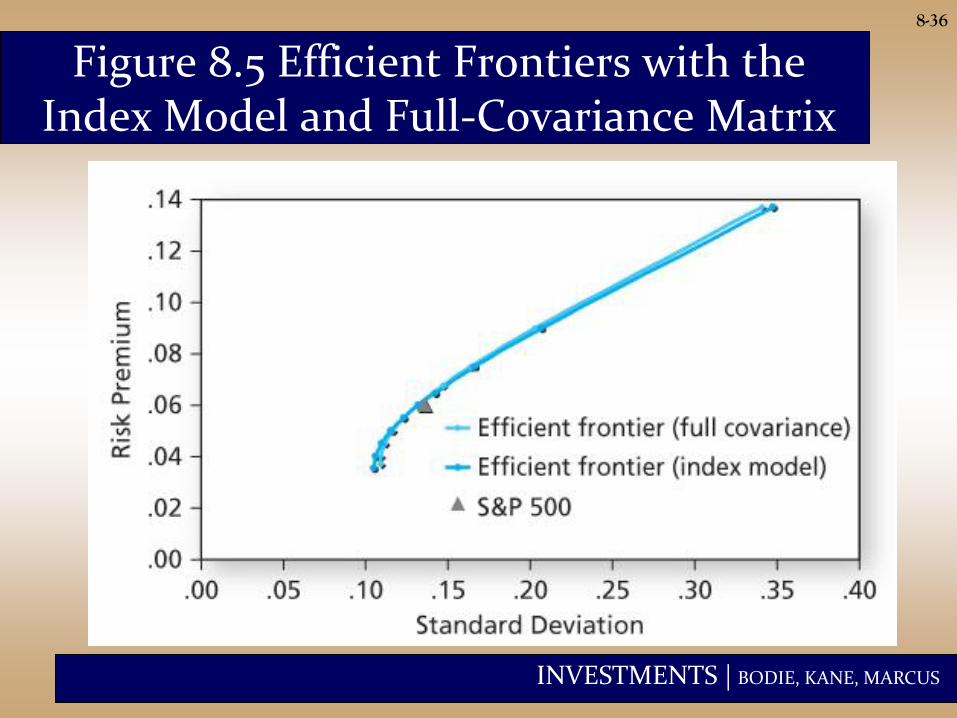
8-36
Figure 8.5 Efficient Frontiers with the Index Model and Full-Covariance Matrix
INVESTMENTS | BODIE, KANE, MARCUS
8-37
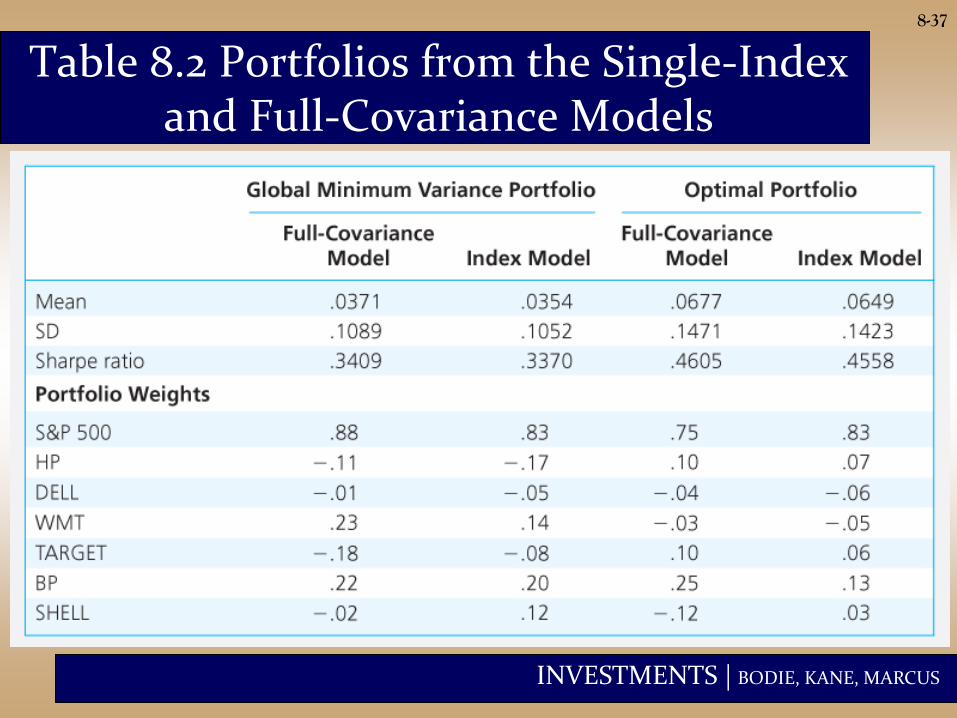
Table 8.2 Portfolios from the Single-Index and Full-Covariance Models
INVESTMENTS | BODIE, KANE, MARCUS
8-38
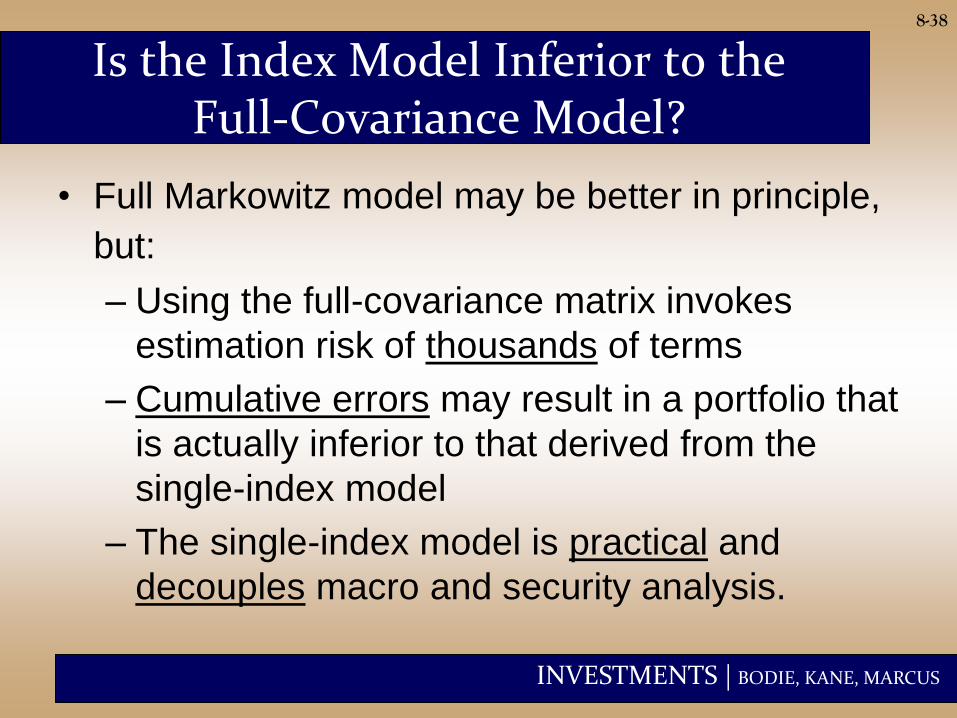
Is the Index Model Inferior to the Full-Covariance Model?
• Full Markowitz model may be better in principle,
but:
– Using the full-covariance matrix invokes
estimation risk of thousands of terms
– Cumulative errors may result in a portfolio that
is actually inferior to that derived from the
single-index model
– The single-index model is practical and
decouples macro and security analysis.
INVESTMENTS | BODIE, KANE, MARCUS
8-39
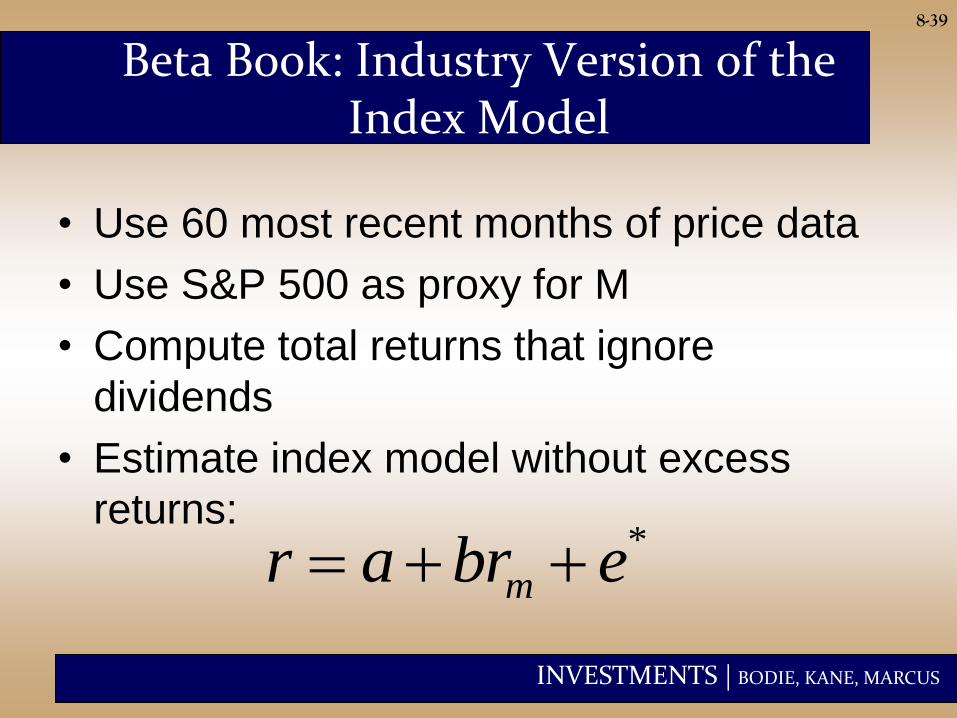
Beta Book: Industry Version of the Index Model
• Use 60 most recent months of price data
• Use S&P 500 as proxy for M
• Compute total returns that ignore
dividends
• Estimate index model without excess
returns: *ebrar m

INVESTMENTS | BODIE, KANE, MARCUS
8-40
Beta Book: Industry Version of the Index Model
• The average beta over all securities is 1. Thus, our best forecast of the beta would be that it is 1.
• Also, firms may become more “typical” as they age, causing their betas to approach 1.
Adjust beta
because:
INVESTMENTS | BODIE, KANE, MARCUS
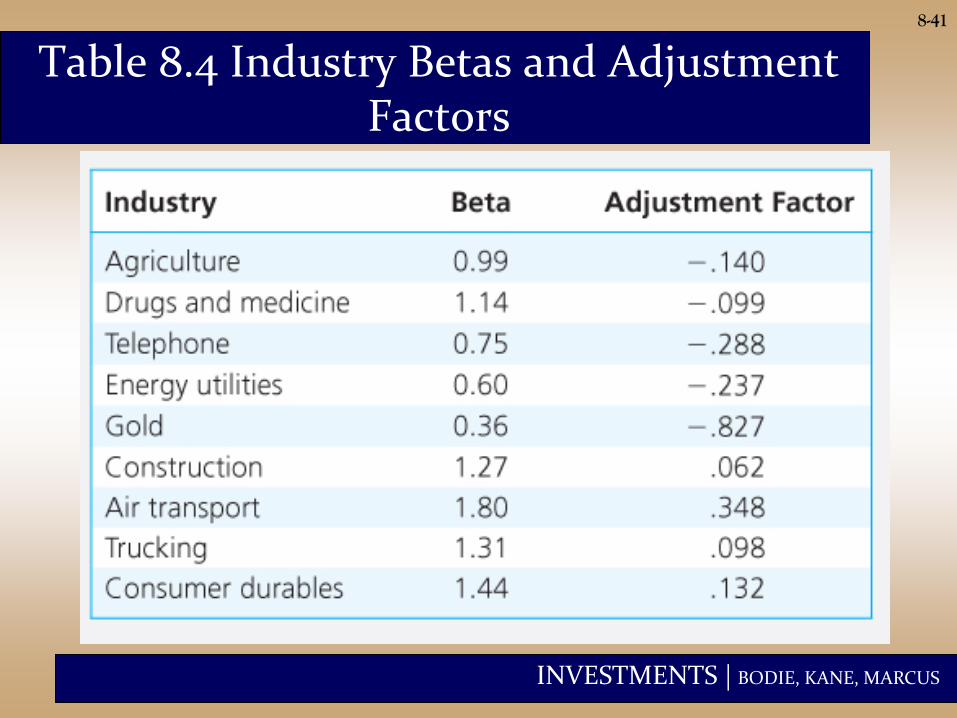
8-41
Table 8.4 Industry Betas and Adjustment Factors