Embed Size (px)
Citation preview
Chapter 22-1
Prepared by
Dan R. Ward
Suzanne P. Ward
University of Louisiana at Lafayette
Chapter 22-2
Chapter 22
Cost-Volume-Profit
Accounting Principles, Ninth Edition
Chapter 22-3
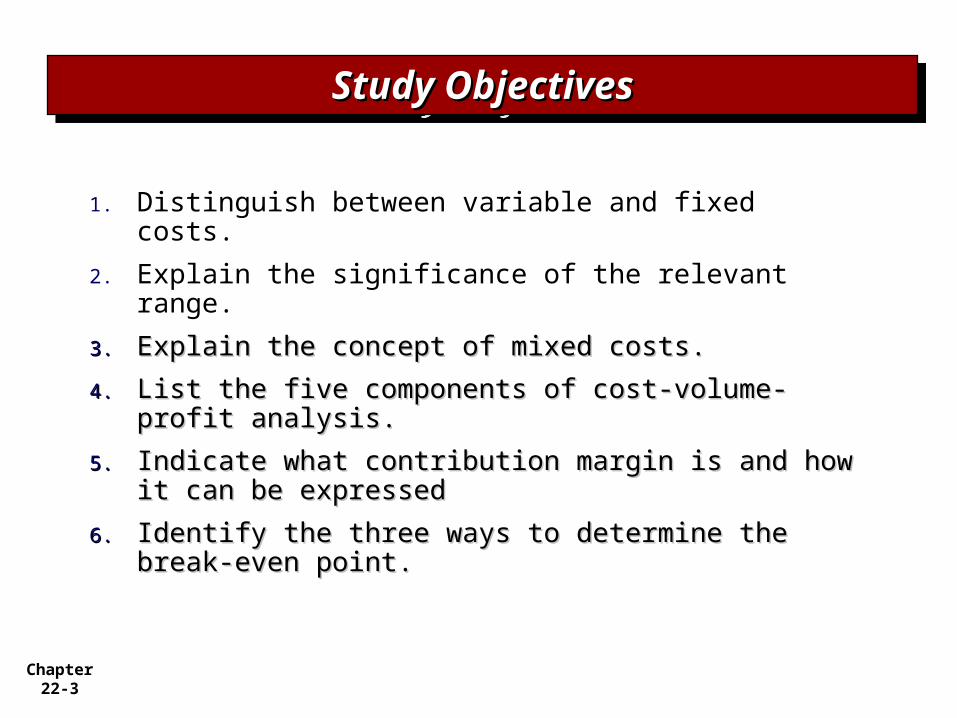
Study ObjectivesStudy ObjectivesStudy ObjectivesStudy Objectives
1. Distinguish between variable and fixed costs.
2. Explain the significance of the relevant range.
3.3. Explain the concept of mixed costs.Explain the concept of mixed costs.
4.4. List the five components of cost-volume-profit List the five components of cost-volume-profit analysis.analysis.
5.5. Indicate what contribution margin is and how Indicate what contribution margin is and how it can be expressedit can be expressed
6.6. Identify the three ways to determine the Identify the three ways to determine the break-even point.break-even point.
Chapter 22-4
7.7. Give the formulas for Give the formulas for determining sales determining sales required to earn target required to earn target net incomenet income
8.8. Define margin of safety, Define margin of safety, and give the formulas and give the formulas for computing it.for computing it.
9.9. Describe the essential Describe the essential features of a cost-features of a cost-volume-profit income volume-profit income statement.statement.
Study ObjectivesStudy ObjectivesStudy ObjectivesStudy Objectives
Chapter 22-5
Preview of ChapterPreview of ChapterPreview of ChapterPreview of Chapter
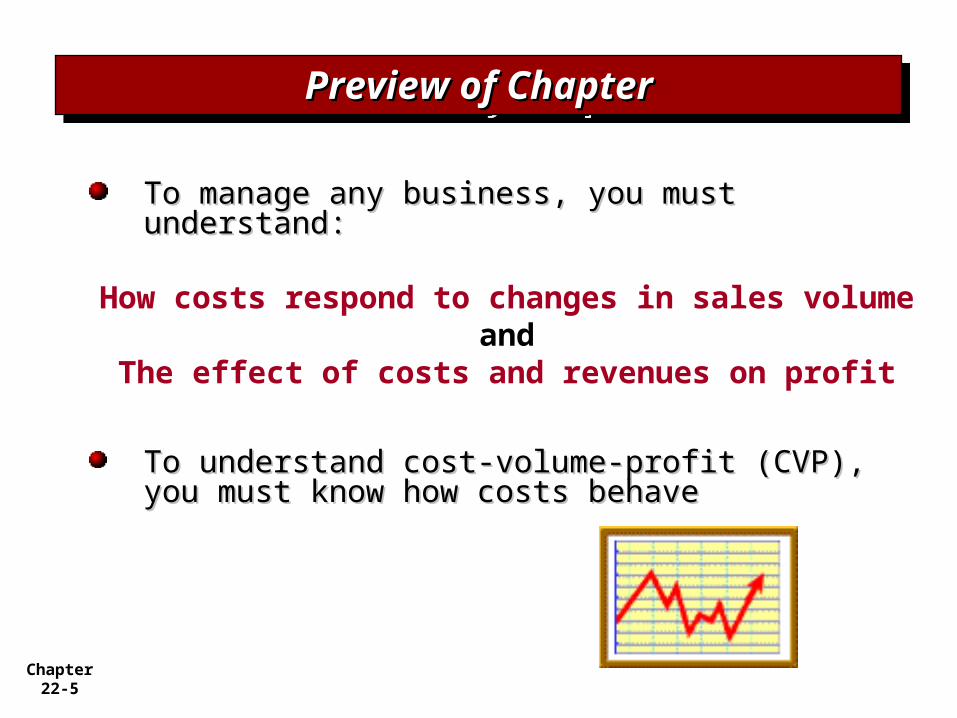
To manage any business, you must understand:To manage any business, you must understand:
How costs respond to changes in sales volumeand
The effect of costs and revenues on profit
To understand cost-volume-profit (CVP), you To understand cost-volume-profit (CVP), you must know how costs behavemust know how costs behave
Chapter 22-6
Variable costsVariable costs
Fixed costsFixed costs
Relevant rangeRelevant range
Mixed costsMixed costs
Identifying Identifying variable and fixed variable and fixed costscosts
Basic componentsBasic components
CVP income CVP income statementstatement
Break-even analysisBreak-even analysis
Target net incomeTarget net income
Margin of safetyMargin of safety
Changes in business Changes in business environmentenvironment
CVP income CVP income statement revisitedstatement revisited
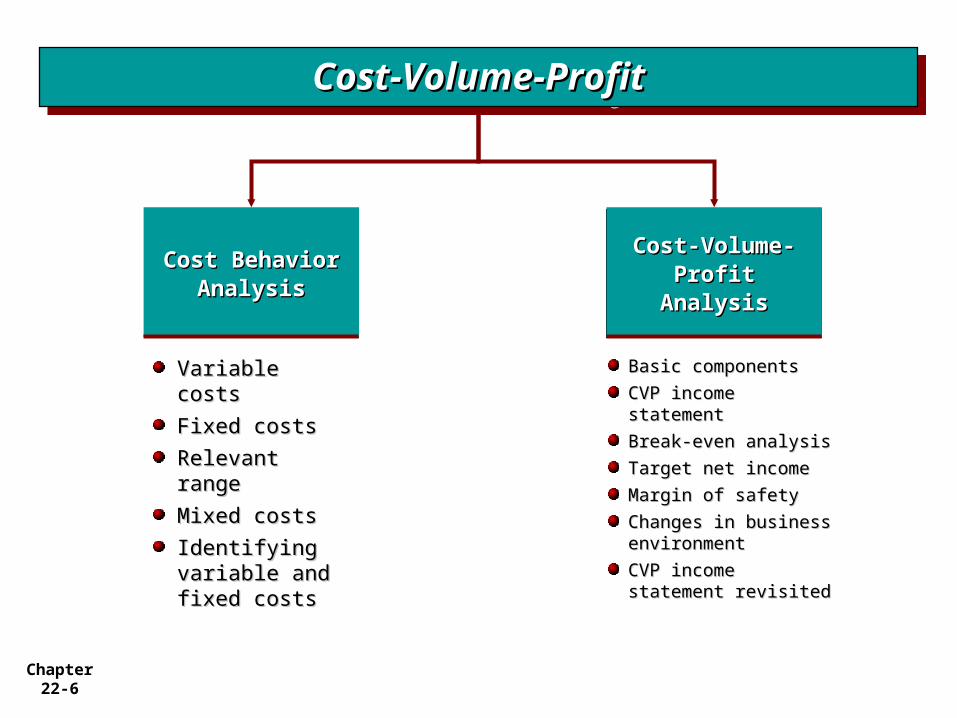
Cost Behavior Cost Behavior AnalysisAnalysis
Cost Behavior Cost Behavior AnalysisAnalysis
Cost-Volume-Cost-Volume-Profit AnalysisProfit AnalysisCost-Volume-Cost-Volume-Profit AnalysisProfit Analysis
Cost-Volume-ProfitCost-Volume-ProfitCost-Volume-ProfitCost-Volume-Profit
Chapter 22-7
Cost Behavior AnalysisCost Behavior AnalysisCost Behavior AnalysisCost Behavior Analysis
Cost Behavior Analysis is Cost Behavior Analysis is
the study of how specific costs the study of how specific costs respond to respond to changes in the level of changes in the level of business activity.business activity.
Some costs change; others remain the sameSome costs change; others remain the same
Helps management plan operations and decide Helps management plan operations and decide between alternative courses of actionbetween alternative courses of action
Applies to all types of businesses and entitiesApplies to all types of businesses and entities
LO 1: Distinguish between variable and fixed costs.LO 1: Distinguish between variable and fixed costs.
Chapter 22-8
Cost Behavior Analysis - continuedCost Behavior Analysis - continuedCost Behavior Analysis - continuedCost Behavior Analysis - continued
Starting point is Starting point is measuring key business activitiesmeasuring key business activities
Activity levels may be expressed in terms of:Activity levels may be expressed in terms of:Sales dollars (in a retail company)Sales dollars (in a retail company)Miles driven (in a trucking company)Miles driven (in a trucking company)Room occupancy (in a hotel)Room occupancy (in a hotel)Dance classes taught (by a dance studio)Dance classes taught (by a dance studio)
Many companies use more Many companies use more than one measurement basethan one measurement base
LO 1: Distinguish between variable and fixed costs.LO 1: Distinguish between variable and fixed costs.
Chapter 22-9
Cost Behavior Analysis - continuedCost Behavior Analysis - continuedCost Behavior Analysis - continuedCost Behavior Analysis - continued
For an activity level to be useful: For an activity level to be useful:
Changes in the level or volume of Changes in the level or volume of activity activity should be correlated with should be correlated with changes in costschanges in costs
The activity level selected is called theThe activity level selected is called theactivity or volume indexactivity or volume index
The activity index:The activity index:Identifies the activity that causes changes in Identifies the activity that causes changes in the behavior of coststhe behavior of costsAllows costs to be classified according to their Allows costs to be classified according to their response to changes in activity as either:response to changes in activity as either:
Variable Costs Fixed Costs Mixed CostsVariable Costs Fixed Costs Mixed Costs
LO 1: Distinguish between variable and fixed costs.LO 1: Distinguish between variable and fixed costs.
Chapter 22-10
Variable CostsVariable CostsVariable CostsVariable Costs
Costs that Costs that vary vary in totalin total directly and directly and proportionately with changes in the activity proportionately with changes in the activity levellevel
Example: If the activity level Example: If the activity level increasesincreases 10 10 percent, total variable costs percent, total variable costs increaseincrease 10 percent 10 percent
Example: If the activity level Example: If the activity level decreasesdecreases by 25 by 25 percent, total variable costs percent, total variable costs decreasedecrease by 25 by 25 percentpercent
Variable costs Variable costs remain constant per unit at remain constant per unit at every level of activity.every level of activity.
LO 1: Distinguish between variable and fixed costs.LO 1: Distinguish between variable and fixed costs.
Chapter 22-11
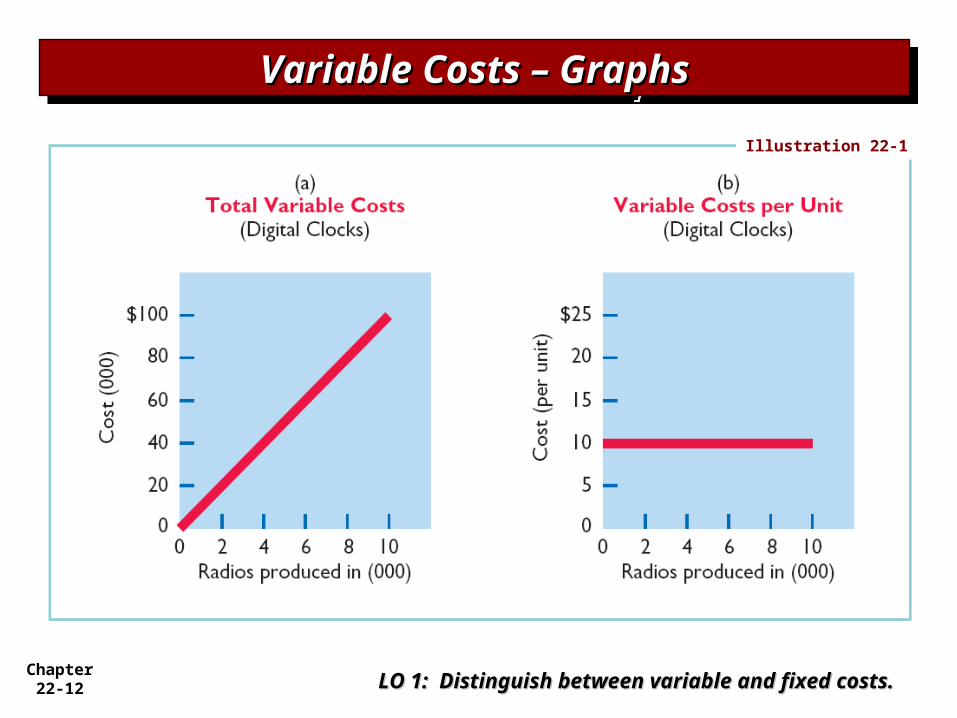
Variable Costs – ExampleVariable Costs – ExampleVariable Costs – ExampleVariable Costs – Example
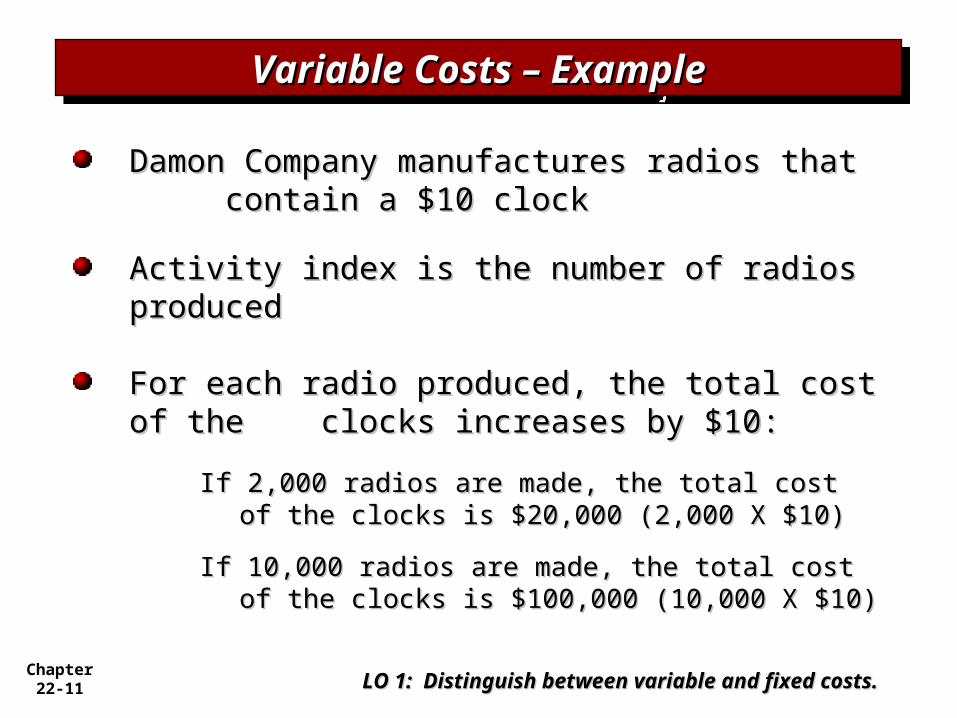
Damon Company manufactures radios that Damon Company manufactures radios that contain a $10 clockcontain a $10 clock
Activity index is the number of radios Activity index is the number of radios producedproduced
For each radio produced, the total cost of the For each radio produced, the total cost of the clocks increases by $10:clocks increases by $10:
If 2,000 radios are made, the total cost of the If 2,000 radios are made, the total cost of the clocks is $20,000 (2,000 X $10)clocks is $20,000 (2,000 X $10)
If 10,000 radios are made, the total cost of the If 10,000 radios are made, the total cost of the clocks is $100,000 (10,000 X $10)clocks is $100,000 (10,000 X $10)
LO 1: Distinguish between variable and fixed costs.LO 1: Distinguish between variable and fixed costs.
Chapter 22-12
Variable Costs – GraphsVariable Costs – GraphsVariable Costs – GraphsVariable Costs – Graphs
LO 1: Distinguish between variable and fixed costs.LO 1: Distinguish between variable and fixed costs.
Illustration 22-1
Chapter 22-13
Fixed CostsFixed CostsFixed CostsFixed Costs
Costs that Costs that remain the same in total regardless of changes in the activity level.regardless of changes in the activity level.
Per unit costPer unit cost variesvaries inversely with activity:with activity:As volume increases,
unit cost declines, and vice versa
Examples include:Examples include:Property taxesProperty taxesInsuranceInsuranceRentRentDepreciation on buildings and equipmentDepreciation on buildings and equipment
LO 1: Distinguish between variable and fixed costs.LO 1: Distinguish between variable and fixed costs.
Chapter 22-14
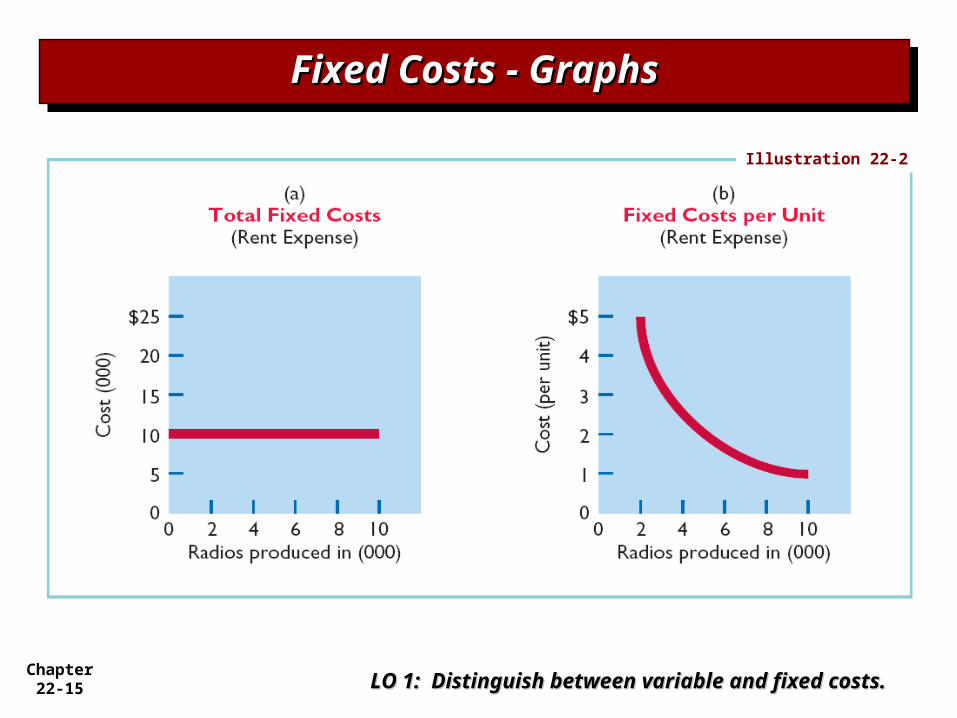
Fixed Costs - ExampleFixed Costs - ExampleFixed Costs - ExampleFixed Costs - Example
Damon Company leases its productive facilities Damon Company leases its productive facilities for $10,000 per monthfor $10,000 per month
Total fixed costs of the facilities remain constant Total fixed costs of the facilities remain constant at all levels of activity - $10,000 per monthat all levels of activity - $10,000 per month
On a On a per unitper unit basis, the cost of rent decreases basis, the cost of rent decreases as as activity increases and vice versaactivity increases and vice versa
At 2,000 radios, the unit cost is At 2,000 radios, the unit cost is $5$5 ($10,000 ($10,000 ÷ 2,000 units)÷ 2,000 units)
At 10,000 radios, the unit cost is At 10,000 radios, the unit cost is $1$1 ($10,000 ($10,000 ÷ 10,000 ÷ 10,000
units)units)LO 1: Distinguish between variable and fixed costs.LO 1: Distinguish between variable and fixed costs.
Chapter 22-15
Fixed Costs - GraphsFixed Costs - GraphsFixed Costs - GraphsFixed Costs - Graphs
LO 1: Distinguish between variable and fixed costs.LO 1: Distinguish between variable and fixed costs.
Illustration 22-2
Chapter 22-16
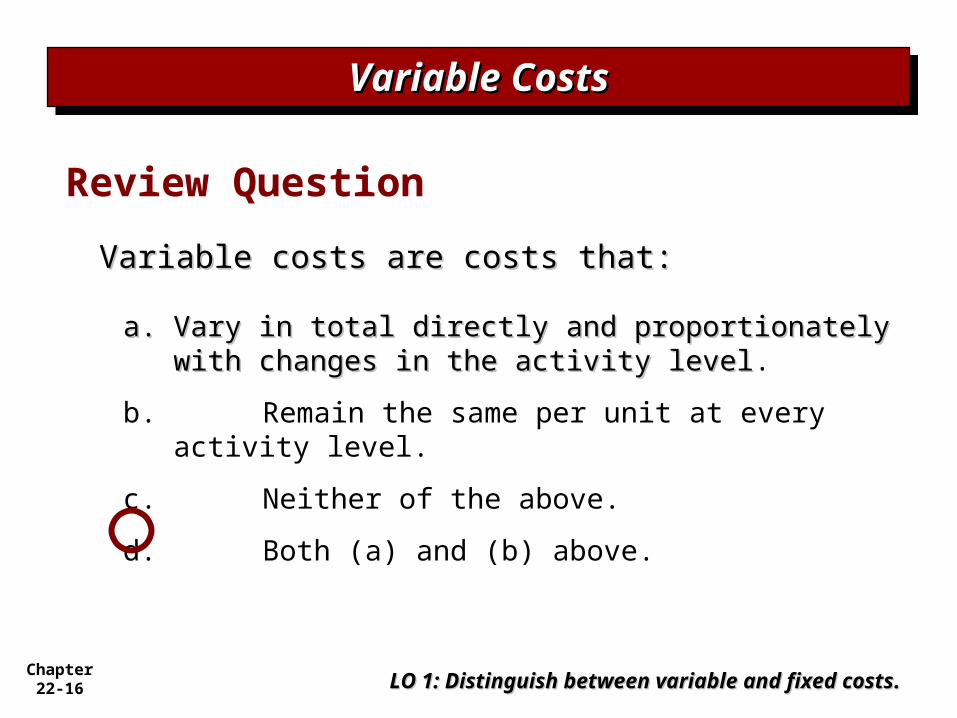
Variable costs are costs that:Variable costs are costs that:
a.a. Vary in total directly and proportionately with Vary in total directly and proportionately with changes in the activity levelchanges in the activity level.
b. Remain the same per unit at every activity level.
c. Neither of the above.
d. Both (a) and (b) above.
Variable CostsVariable CostsVariable CostsVariable Costs
LO 1: LO 1: Distinguish between variable and fixed costsDistinguish between variable and fixed costs..
Review Question
Chapter 22-17
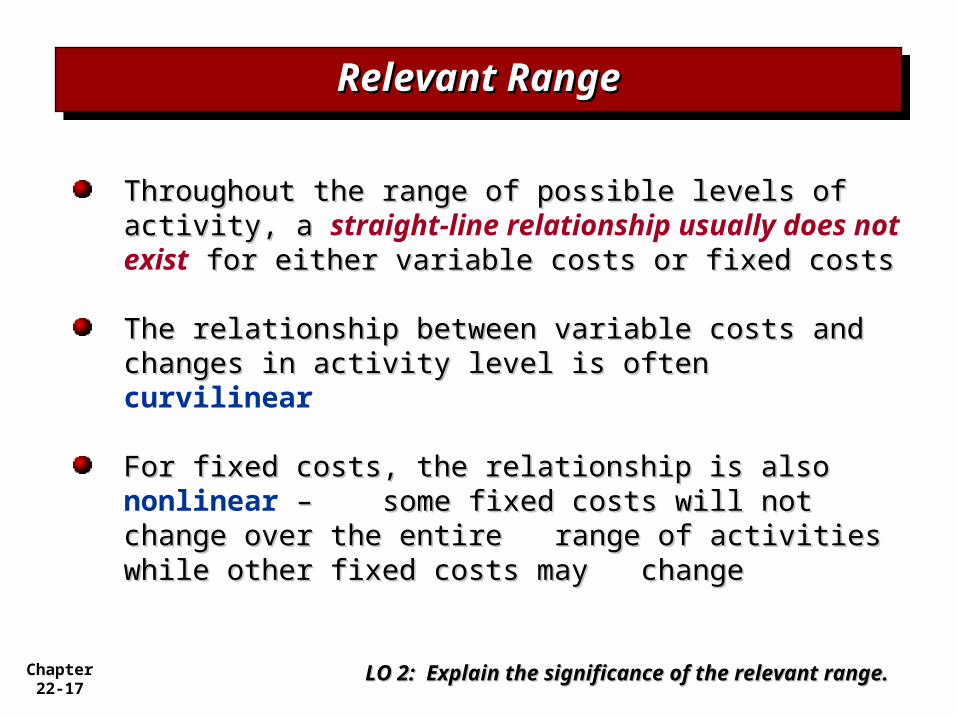
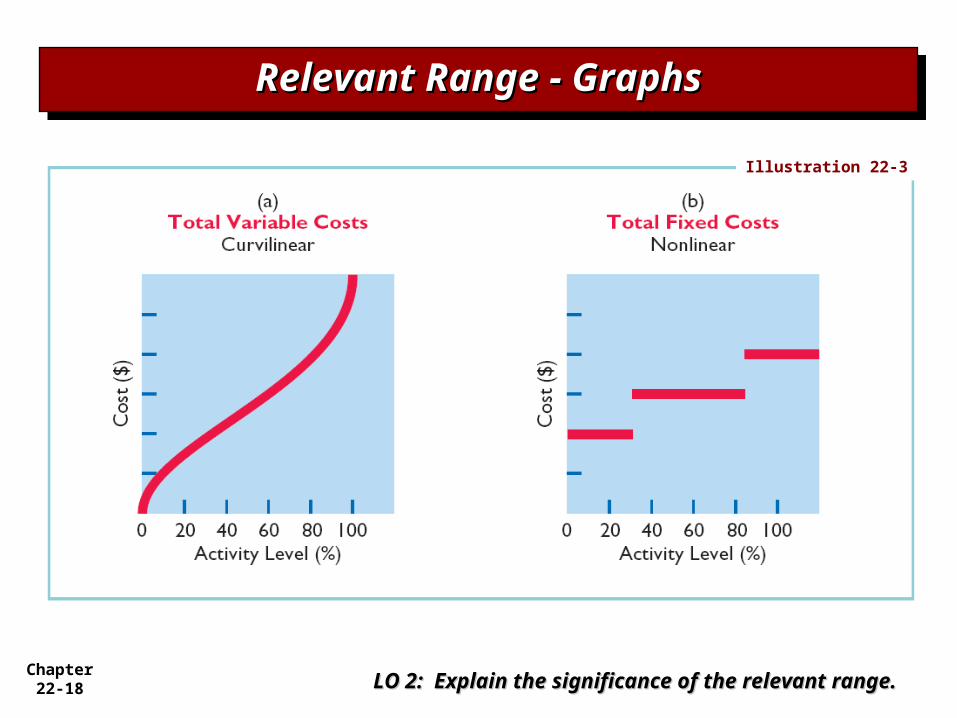
Relevant RangeRelevant RangeRelevant RangeRelevant Range
Throughout the range of possible levels of Throughout the range of possible levels of activity, a activity, a straight-line relationship usually does not exist for either variable costs or fixed for either variable costs or fixed costs costs
The relationship between variable costs and The relationship between variable costs and changes in activity level is often changes in activity level is often curvilinear
For fixed costs, the relationship is also For fixed costs, the relationship is also nonlinear – – some fixed costs will not change over the some fixed costs will not change over the entire entire range of activities while other fixed range of activities while other fixed costs may costs may changechange
LO 2: Explain the significance of the relevant range.LO 2: Explain the significance of the relevant range.
Chapter 22-18
Relevant Range - GraphsRelevant Range - GraphsRelevant Range - GraphsRelevant Range - Graphs
LO 2: Explain the significance of the relevant range.LO 2: Explain the significance of the relevant range.
Illustration 22-3
Chapter 22-19
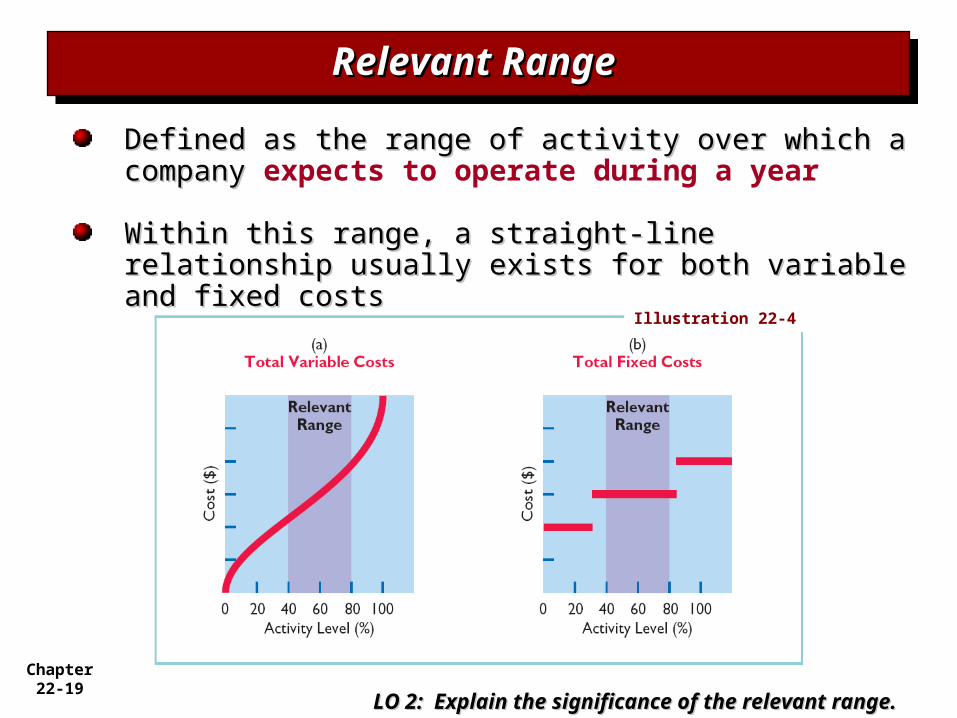
Relevant Range Relevant Range Relevant Range Relevant Range
Defined as the range of activity over which a Defined as the range of activity over which a companycompany expects to operate during a year
Within this range, a straight-line relationshipWithin this range, a straight-line relationship usually exists for both variable and fixed costsusually exists for both variable and fixed costs
LO 2: Explain the significance of the relevant range.LO 2: Explain the significance of the relevant range.
Illustration 22-4
Chapter 22-20
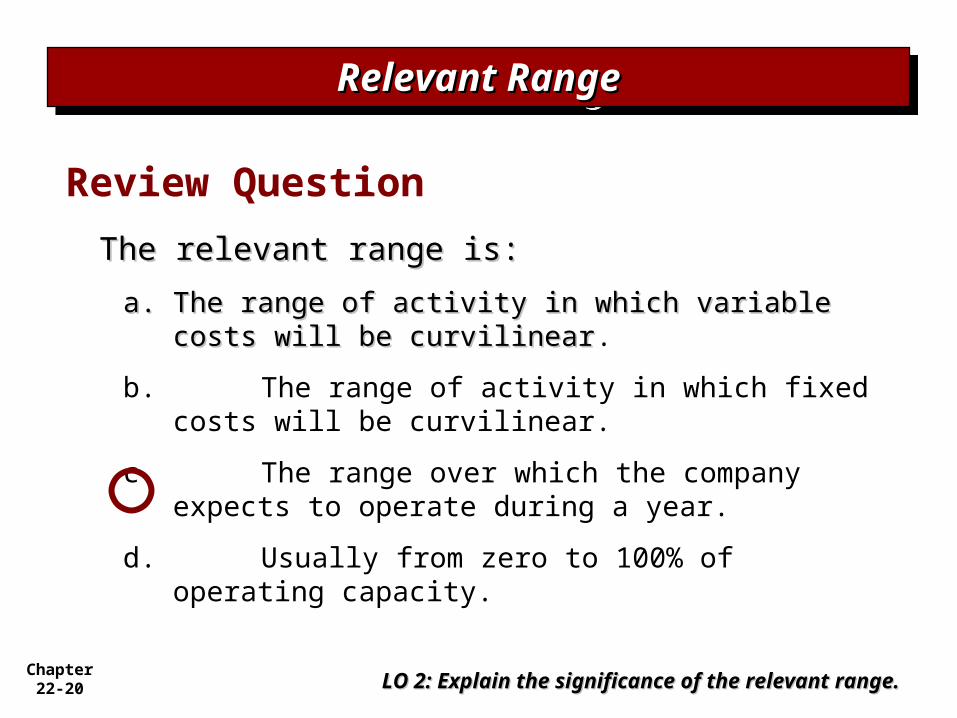
The relevant range is:The relevant range is:
a.a. The range of activity in which variable costs will The range of activity in which variable costs will be curvilinearbe curvilinear.
b. The range of activity in which fixed costs will be curvilinear.
c. The range over which the company expects to operate during a year.
d. Usually from zero to 100% of operating capacity.
Relevant RangeRelevant RangeRelevant RangeRelevant Range
LO 2: Explain the significance of the relevant range.LO 2: Explain the significance of the relevant range.
Review Question
Chapter 22-21
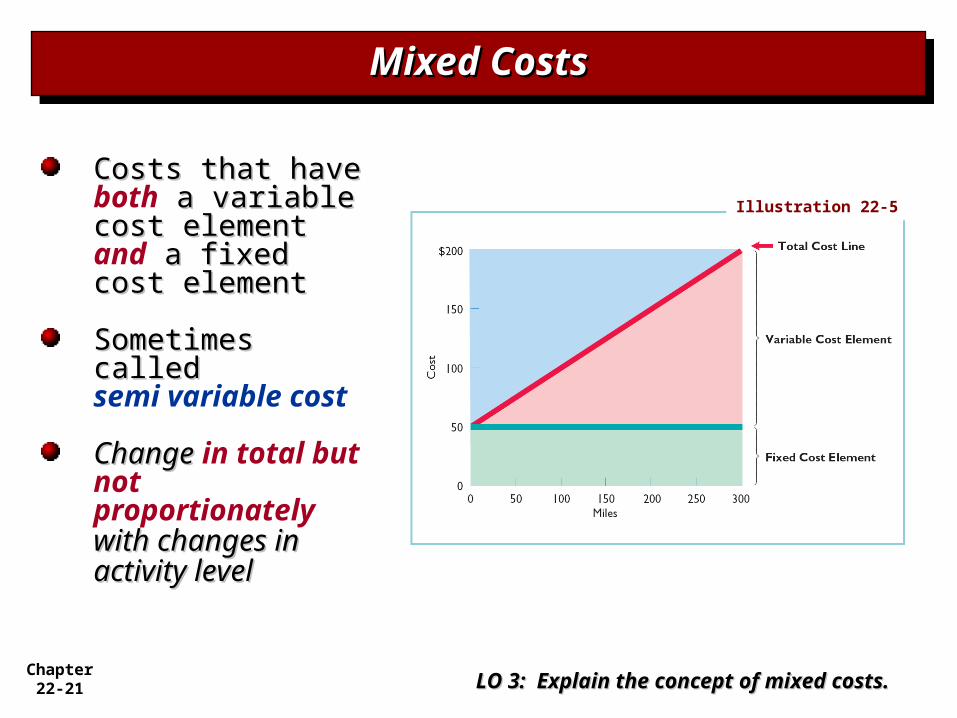
Mixed CostsMixed CostsMixed CostsMixed Costs
Costs that have Costs that have both a variable a variable cost element cost element and a fixed a fixedcost elementcost element
Sometimes Sometimes calledcalledsemi variable cost
Change Change in total but not proportionately with changes inwith changes inactivity levelactivity level
LO 3: Explain the concept of mixed costs.LO 3: Explain the concept of mixed costs.
Illustration 22-5
Chapter 22-22
Mixed Costs: High–Low MethodMixed Costs: High–Low MethodMixed Costs: High–Low MethodMixed Costs: High–Low Method
Mixed costs must be classified into their Mixed costs must be classified into their fixed and and variable elements elements
One approach to separate the costs is called the One approach to separate the costs is called the high-low method
Uses the total costs incurred at both the high and Uses the total costs incurred at both the high and the low levels of activity to classify mixed coststhe low levels of activity to classify mixed costs
The difference in costs between the high and low The difference in costs between the high and low levels levels represents variable costs, since only variable costs change as activity levels changechange
LO 3: Explain the concept of mixed costs.LO 3: Explain the concept of mixed costs.
Chapter 22-23
Mixed Costs: Mixed Costs: Steps in High–Low-Method Steps in High–Low-Method
Mixed Costs: Mixed Costs: Steps in High–Low-Method Steps in High–Low-Method
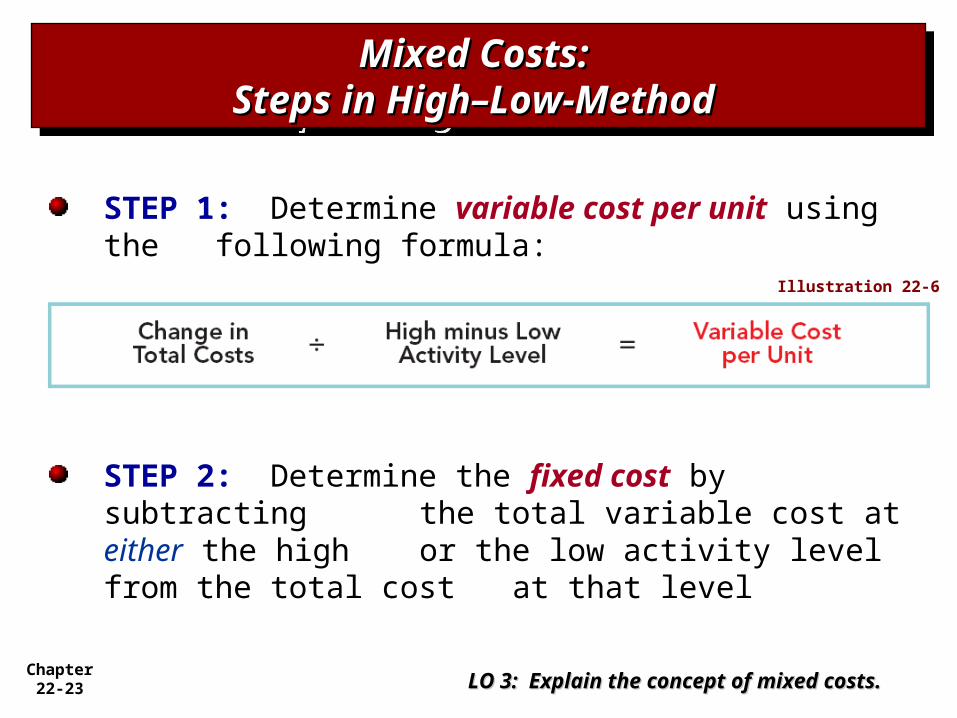
STEP 1: Determine variable cost per unit using the following formula:
STEP 2: Determine the fixed cost by subtracting the total variable cost at either the high or the low activity level from the total cost at that level
LO 3: Explain the concept of mixed costs.LO 3: Explain the concept of mixed costs.
Illustration 22-6
Chapter 22-24
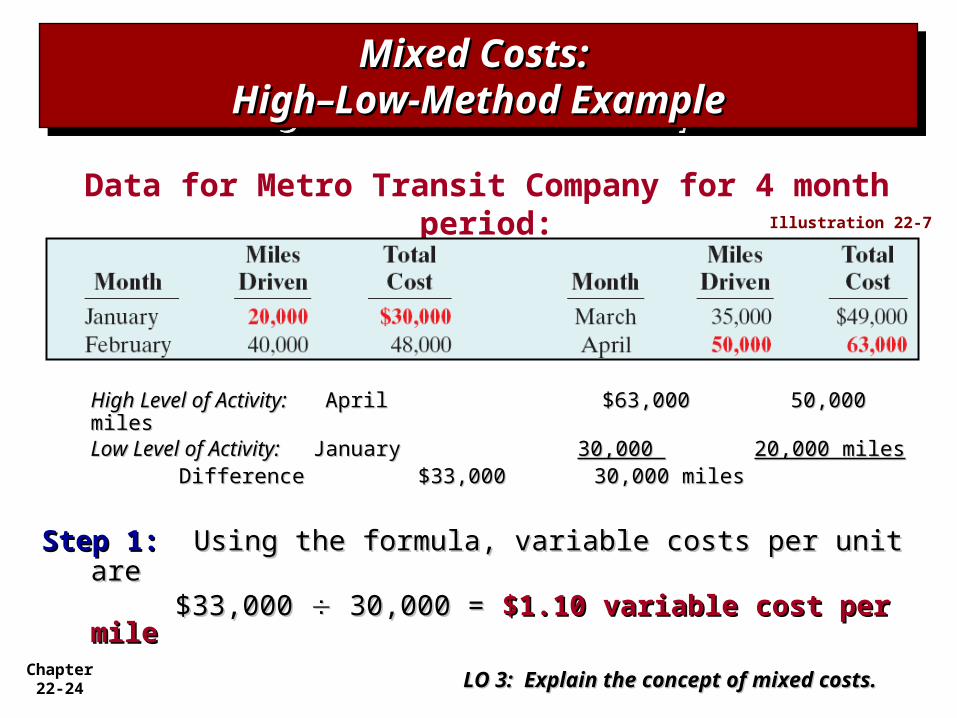
Mixed Costs: Mixed Costs: High–Low-Method ExampleHigh–Low-Method Example
Mixed Costs: Mixed Costs: High–Low-Method ExampleHigh–Low-Method Example
High Level of Activity:High Level of Activity: April $63,000 50,000 milesApril $63,000 50,000 milesLow Level of Activity: Low Level of Activity: January January 30,000 30,000 20,000 miles20,000 miles
Difference $33,000 30,000 Difference $33,000 30,000 milesmiles
Step 1:Step 1: Using the formula, variable costs per unit are Using the formula, variable costs per unit are $33,000 $33,000 30,000 = 30,000 = $1.10 variable cost $1.10 variable cost per mileper mile
Data for Metro Transit Company for 4 month period:
LO 3: Explain the concept of mixed costs.LO 3: Explain the concept of mixed costs.
Illustration 22-7
Chapter 22-25
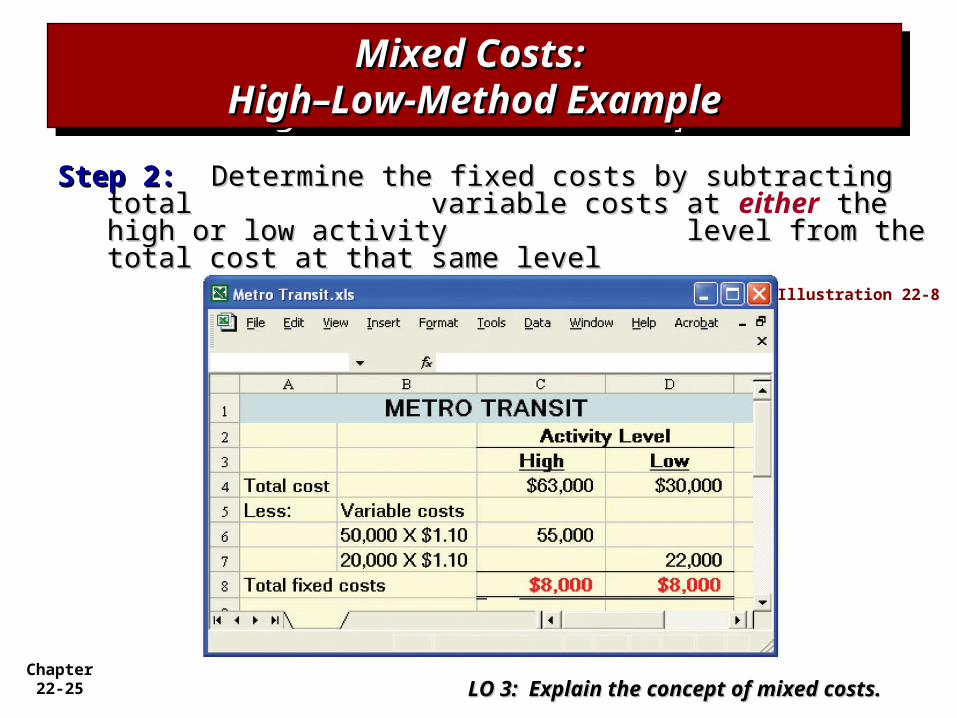
Mixed Costs: Mixed Costs: High–Low-Method ExampleHigh–Low-Method Example
Mixed Costs: Mixed Costs: High–Low-Method ExampleHigh–Low-Method Example
Step 2:Step 2: Determine the fixed costs by subtracting total Determine the fixed costs by subtracting total variable costs at variable costs at either the high or low the high or low
activity activity level from the total cost at that level from the total cost at that same levelsame level
LO 3: Explain the concept of mixed costs.LO 3: Explain the concept of mixed costs.
Illustration 22-8
Chapter 22-26
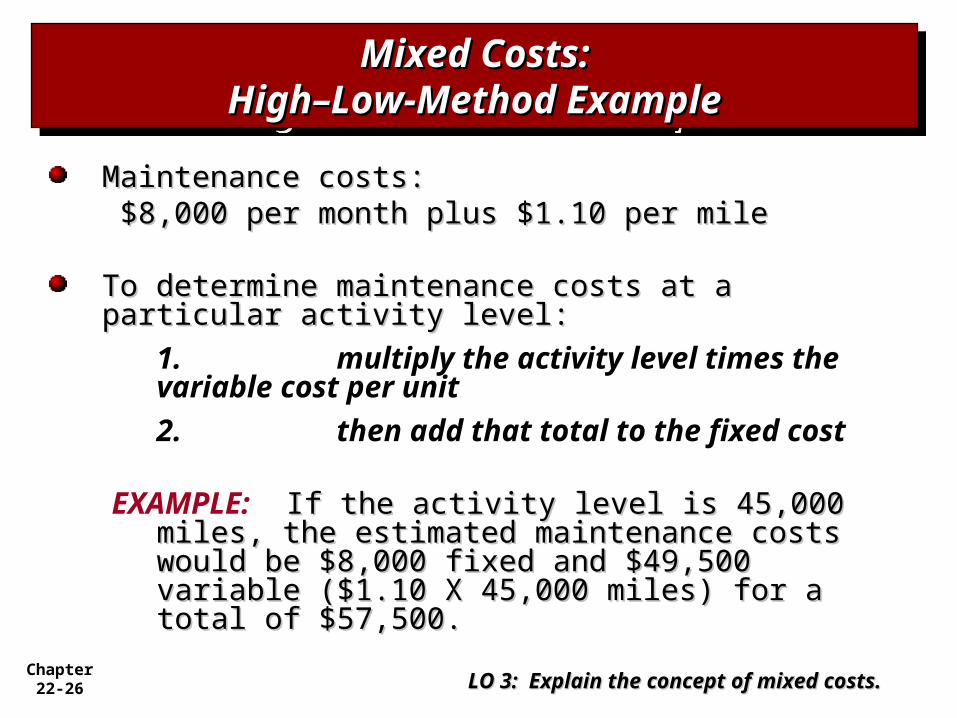
Mixed Costs:Mixed Costs:High–Low-Method ExampleHigh–Low-Method Example
Mixed Costs:Mixed Costs:High–Low-Method ExampleHigh–Low-Method Example
Maintenance costs:Maintenance costs: $8,000 per month plus $1.10 per mile$8,000 per month plus $1.10 per mile
To determine maintenance costs at a particular To determine maintenance costs at a particular activity level:activity level:
1. multiply the activity level times the variable cost per unit
2. then add that total to the fixed cost
EXAMPLE: If the activity level is 45,000 miles, the If the activity level is 45,000 miles, the estimated maintenance costs would be $8,000 estimated maintenance costs would be $8,000 fixed and $49,500 variable ($1.10 X 45,000 fixed and $49,500 variable ($1.10 X 45,000 miles) for a total of $57,500.miles) for a total of $57,500.
LO 3: Explain the concept of mixed costs.LO 3: Explain the concept of mixed costs.
Chapter 22-27
Mixed costs consist of a:Mixed costs consist of a:
a.a. Variable cost element and a fixed cost elementVariable cost element and a fixed cost element.
b. Fixed cost element and a controllable cost element.
c. Relevant cost element and a controllable cost element.
d. Variable cost element and a relevant cost element.
High–Low MethodHigh–Low MethodHigh–Low MethodHigh–Low Method
LO 3: Explain the concept of mixed costs.LO 3: Explain the concept of mixed costs.
Review Question
Chapter 22-28
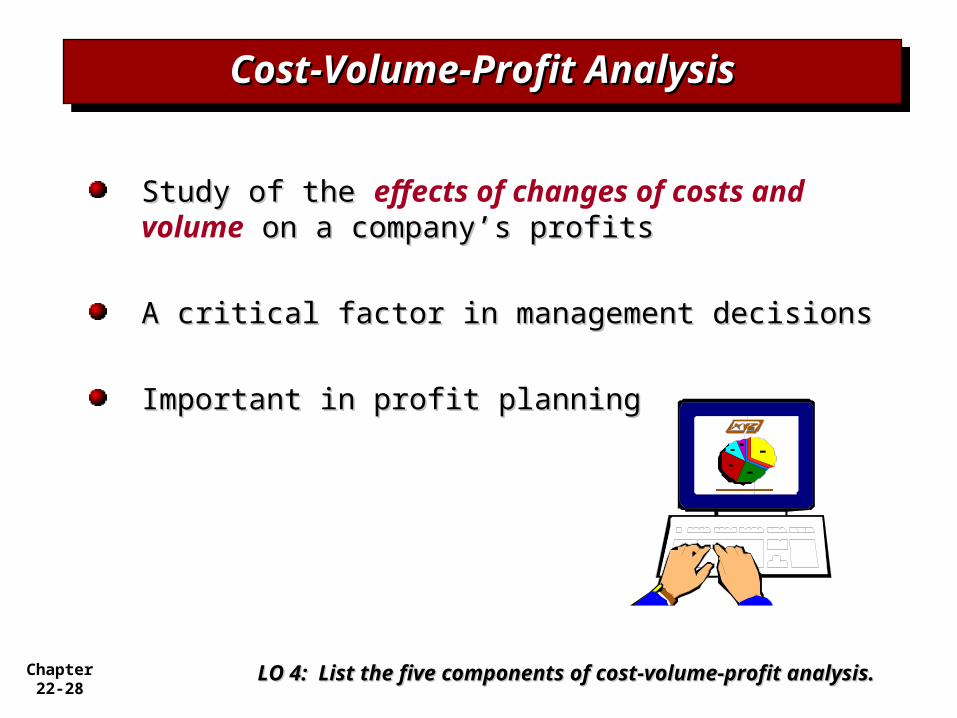
Cost-Volume-Profit AnalysisCost-Volume-Profit AnalysisCost-Volume-Profit AnalysisCost-Volume-Profit Analysis
Study of the Study of the effects of changes of costs and volume on a company’s profits on a company’s profits
A critical factor in management decisionsA critical factor in management decisions
Important in profit planningImportant in profit planning
LO 4: List the five components of cost-volume-profit analysis.LO 4: List the five components of cost-volume-profit analysis.
Chapter 22-29
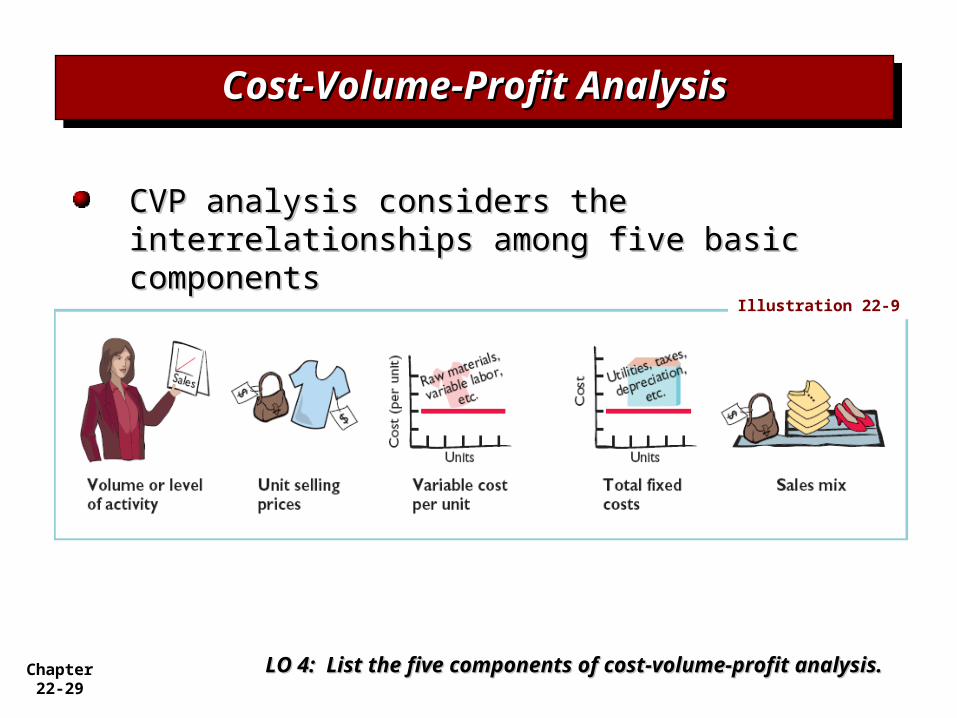
Cost-Volume-Profit AnalysisCost-Volume-Profit AnalysisCost-Volume-Profit AnalysisCost-Volume-Profit Analysis
CVP analysis considers the interrelationships CVP analysis considers the interrelationships among five basic componentsamong five basic components
LO 4: List the five components of cost-volume-profit analysis.LO 4: List the five components of cost-volume-profit analysis.
Illustration 22-9
Chapter 22-30
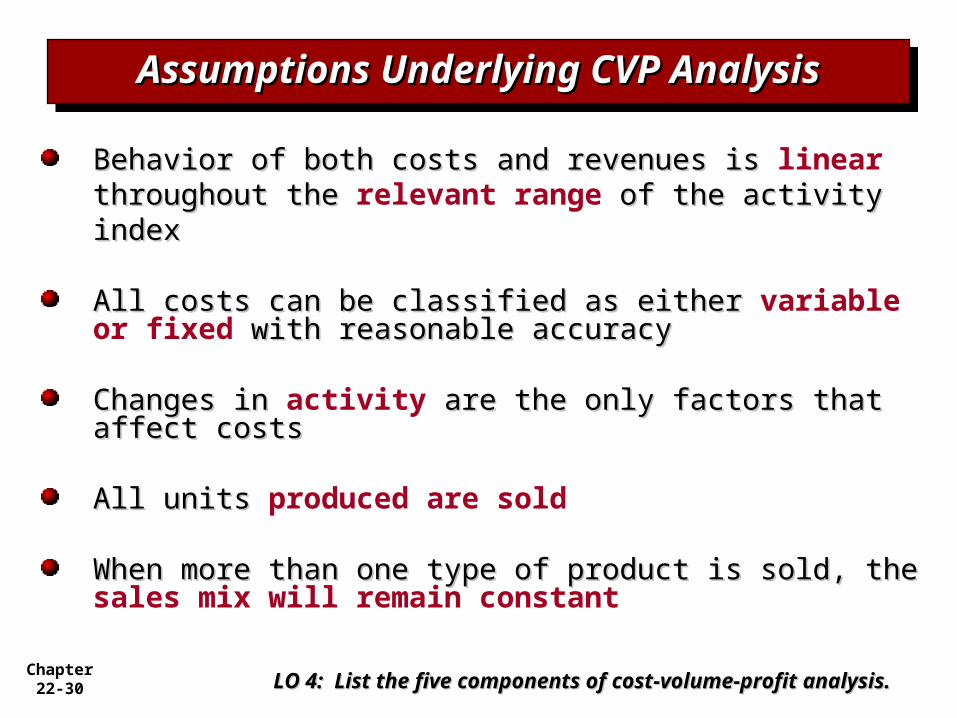
Assumptions Underlying CVP AnalysisAssumptions Underlying CVP AnalysisAssumptions Underlying CVP AnalysisAssumptions Underlying CVP Analysis
Behavior of both costs and revenues is Behavior of both costs and revenues is linear throughout the throughout the relevant range of the activity index of the activity index
All costs can be classified as either All costs can be classified as either variable or fixed with reasonable accuracywith reasonable accuracy
Changes in Changes in activity are the only factors that affect are the only factors that affect costscosts
All units All units produced are sold
When more than one type of product is sold, the When more than one type of product is sold, the sales mix will remain constant
LO 4: List the five components of cost-volume-profit analysis.LO 4: List the five components of cost-volume-profit analysis.
Chapter 22-31
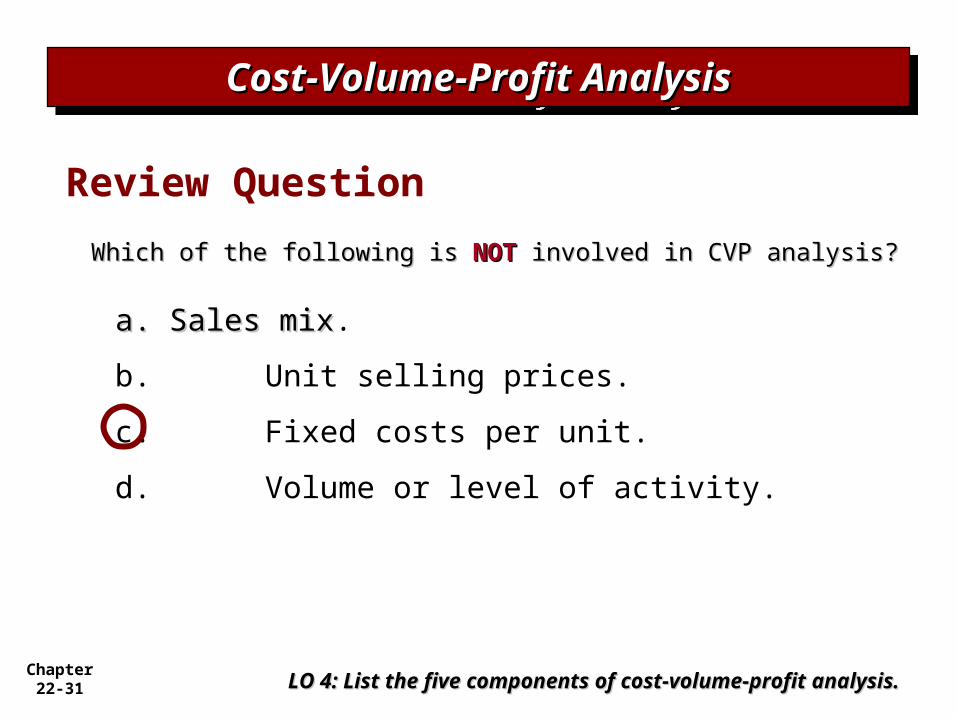
Which of the following is Which of the following is NOTNOT involved in CVP analysis? involved in CVP analysis?
a.a. Sales mixSales mix.
b. Unit selling prices.
c. Fixed costs per unit.
d. Volume or level of activity.
Cost-Volume-Profit AnalysisCost-Volume-Profit AnalysisCost-Volume-Profit AnalysisCost-Volume-Profit Analysis
LO 4: List the five components of cost-volume-profit LO 4: List the five components of cost-volume-profit analysis.analysis.
Review Question
Chapter 22-32
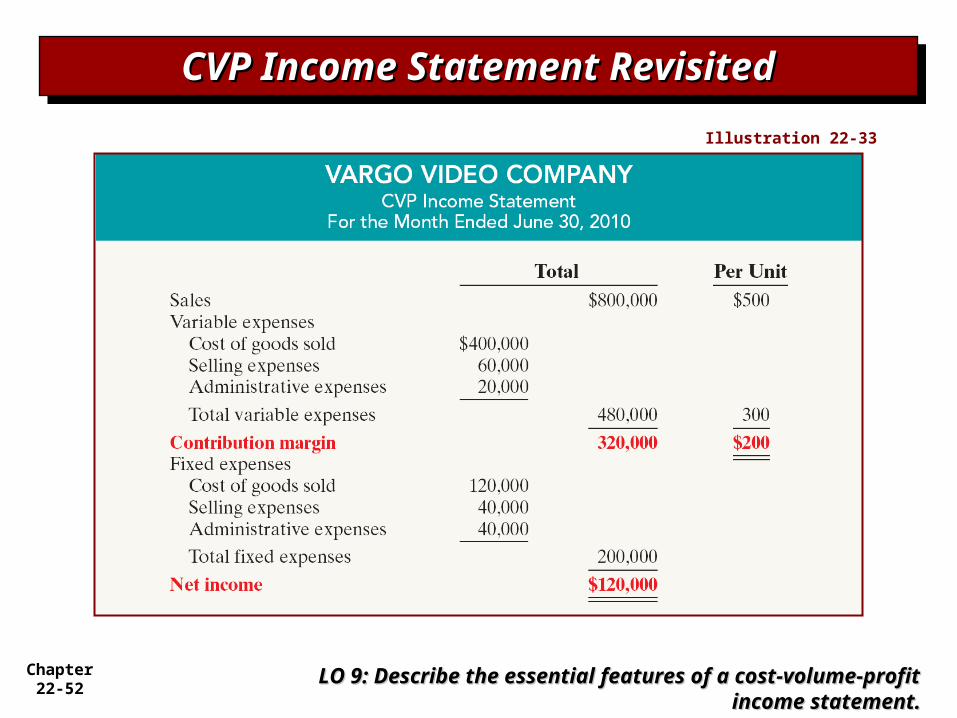
CVP Income StatementCVP Income StatementCVP Income StatementCVP Income Statement
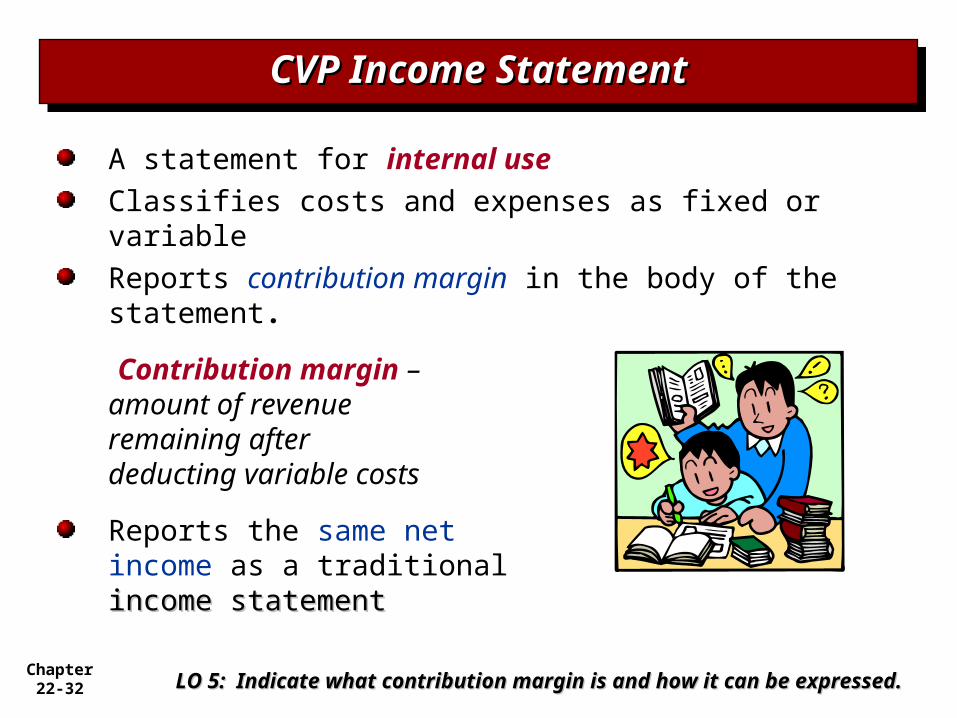
A statement for internal useClassifies costs and expenses as fixed or variable Reports contribution margin in the body of the statement.
Contribution margin –amount of revenue
remaining afterdeducting variable costs
Reports the same netincome as a traditionalincome statementincome statement
LO 5: Indicate what contribution margin is and how it can be expressed.LO 5: Indicate what contribution margin is and how it can be expressed.
Chapter 22-33
CVP Income Statement - ExampleCVP Income Statement - ExampleCVP Income Statement - ExampleCVP Income Statement - Example
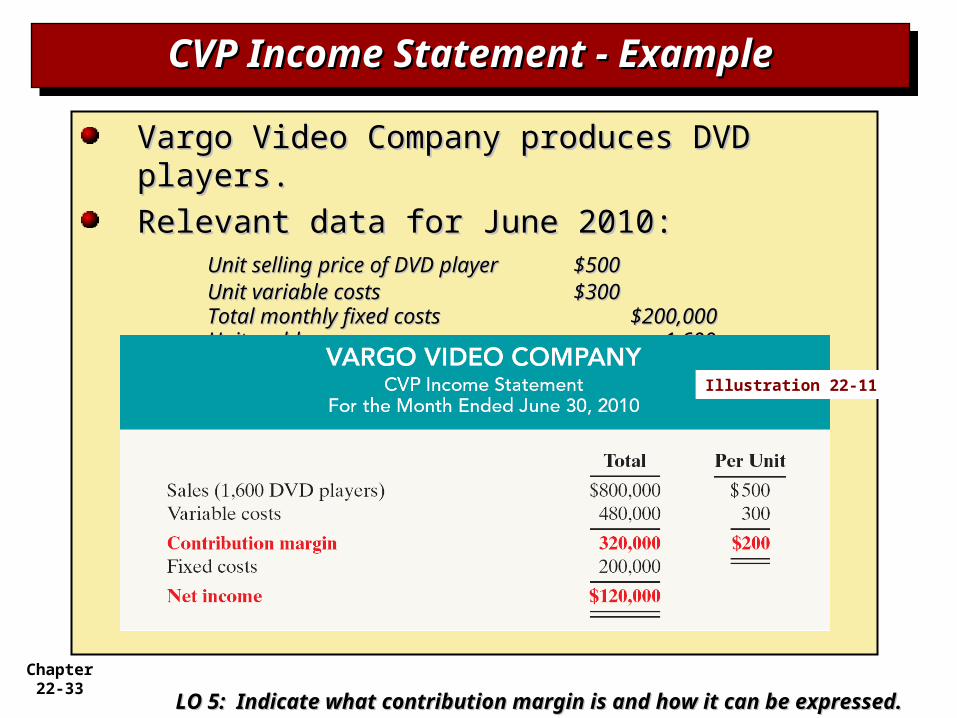
Vargo Video Company produces DVD Vargo Video Company produces DVD players. players.
Relevant data for June 2010: Relevant data for June 2010: Unit selling price of DVD playerUnit selling price of DVD player $500 $500Unit variable costsUnit variable costs $300 $300Total monthly fixed costsTotal monthly fixed costs $200,000$200,000Units soldUnits sold 1,600 1,600
LO 5: Indicate what contribution margin is and how it can be expressed.LO 5: Indicate what contribution margin is and how it can be expressed.
Illustration 22-11
Chapter 22-34
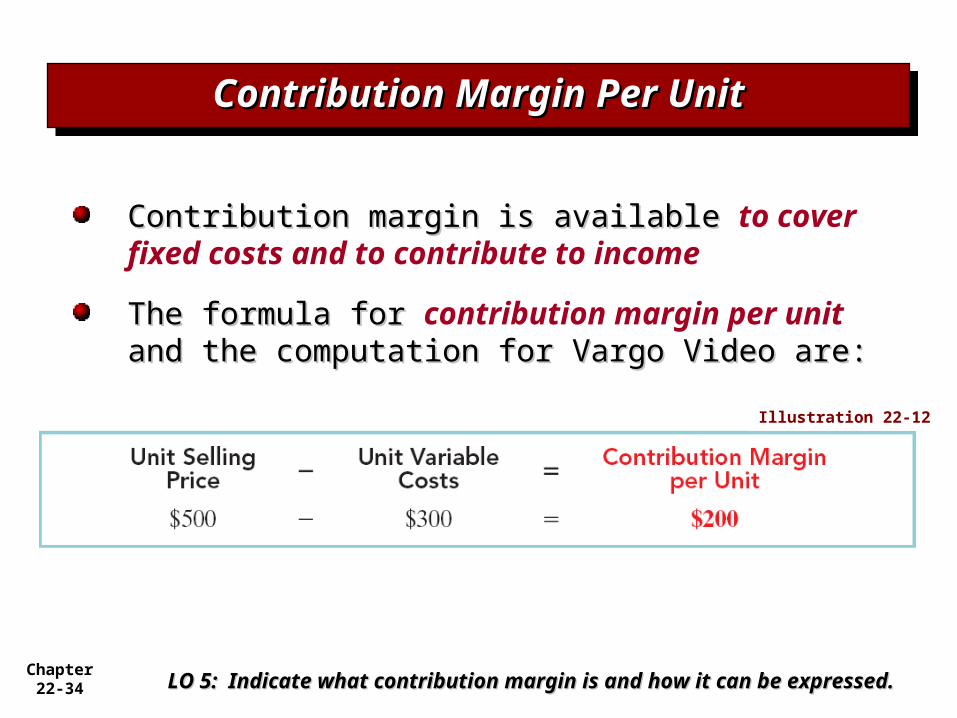
Contribution Margin Per UnitContribution Margin Per UnitContribution Margin Per UnitContribution Margin Per Unit
Contribution margin is availableContribution margin is available to cover fixed costs and to contribute to income
The formula for The formula for contribution margin per unit and the computation for Vargo Video are:and the computation for Vargo Video are:
LO 5: Indicate what contribution margin is and how it can be expressed.LO 5: Indicate what contribution margin is and how it can be expressed.
Illustration 22-12
Chapter 22-35
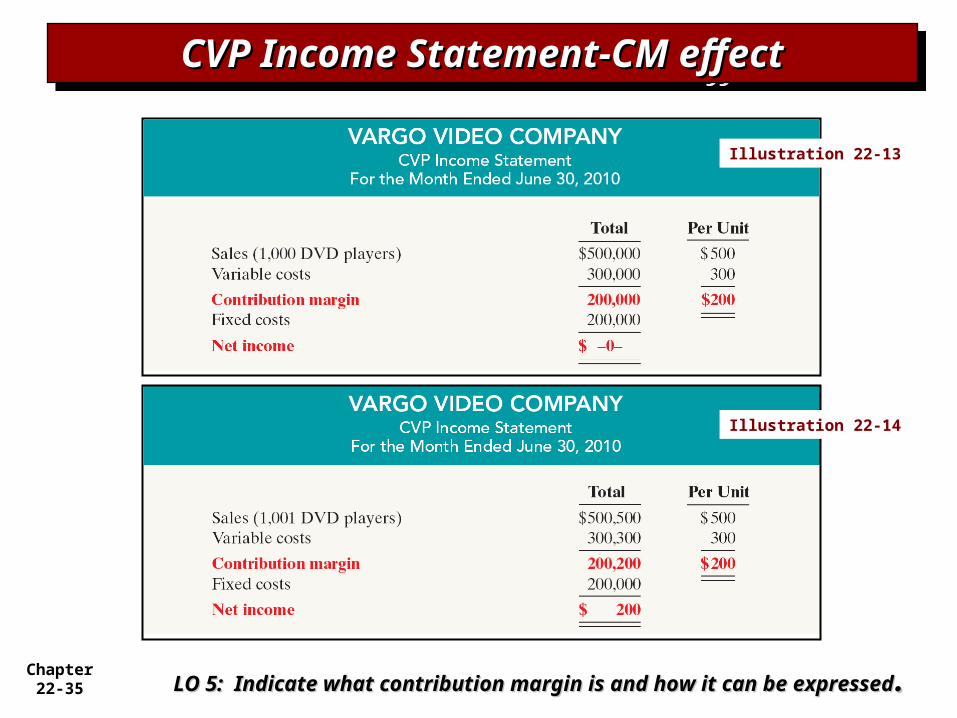
CVP Income Statement-CM effectCVP Income Statement-CM effectCVP Income Statement-CM effectCVP Income Statement-CM effect
LO 5: Indicate what contribution margin is and how it can be expressedLO 5: Indicate what contribution margin is and how it can be expressed ..
Illustration 22-13
Illustration 22-14
Chapter 22-36
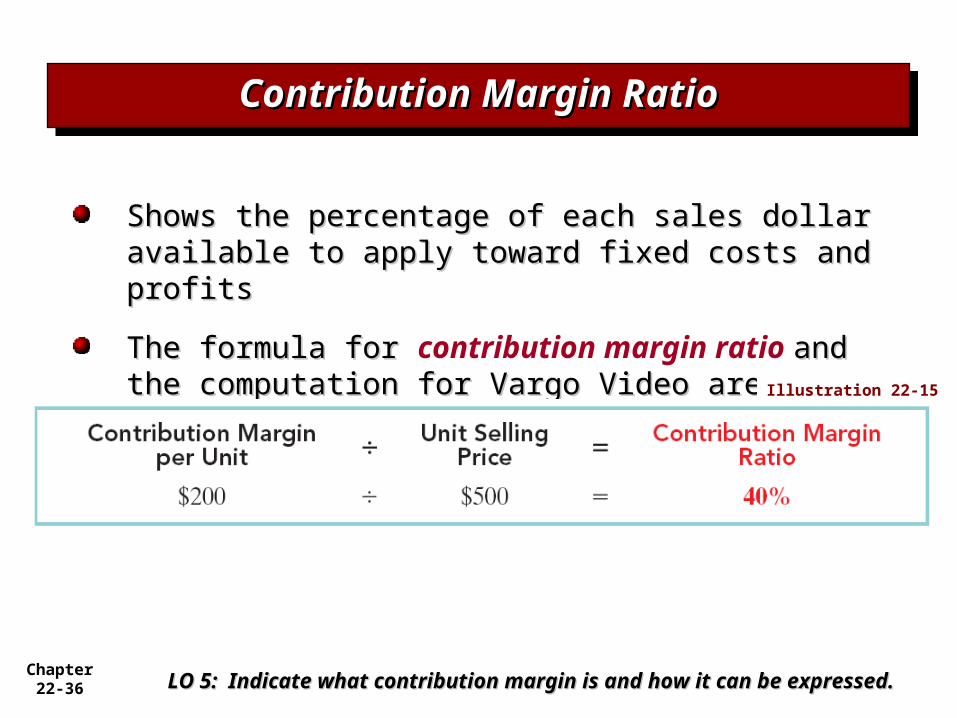
Contribution Margin RatioContribution Margin RatioContribution Margin RatioContribution Margin Ratio
Shows the percentage of each sales dollar Shows the percentage of each sales dollar available to apply toward fixed costs and profitsavailable to apply toward fixed costs and profits
The formula for The formula for contribution margin ratio and the computation for Vargo Video are:and the computation for Vargo Video are:
LO 5: Indicate what contribution margin is and how it can be expressed.LO 5: Indicate what contribution margin is and how it can be expressed.
Illustration 22-15
Chapter 22-37
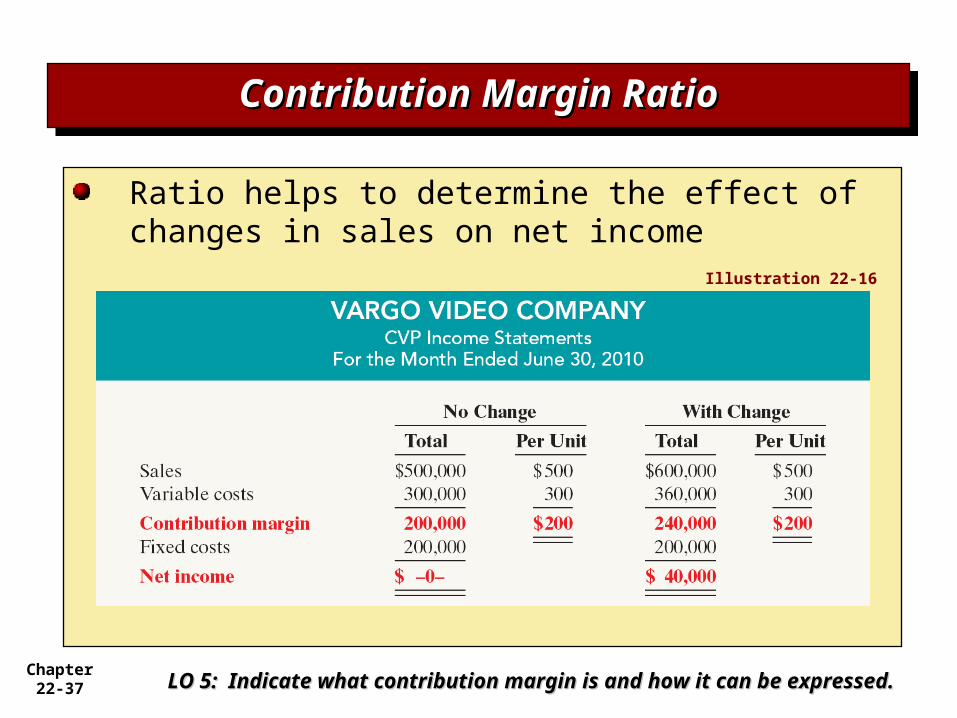
Contribution Margin RatioContribution Margin RatioContribution Margin RatioContribution Margin Ratio
Ratio helps to determine the effect of changes in sales on net income
LO 5: Indicate what contribution margin is and how it can be expressed.LO 5: Indicate what contribution margin is and how it can be expressed.
Illustration 22-16
Chapter 22-38
Contribution margin:Contribution margin:
a.a. Is revenue remaining after deducting variable Is revenue remaining after deducting variable costscosts.
b. May be expressed as contribution margin per unit.
c. Is selling price less cost of goods sold.
d. Both (a) and (b) above.
Contribution Margin Per UnitContribution Margin Per UnitContribution Margin Per UnitContribution Margin Per Unit
LO 5: Indicate what contribution margin is and how it can be LO 5: Indicate what contribution margin is and how it can be expressed.expressed.
Review Question
Chapter 22-39
Break-Even AnalysisBreak-Even AnalysisBreak-Even AnalysisBreak-Even Analysis
Process of finding the Process of finding the break-even point
level of activity at which level of activity at which total revenues equal total costs (both fixed and variable)(both fixed and variable)
Can be computed or derivedCan be computed or derived from a mathematical equation, by using contribution margin, or from a cost-volume profit (CVP) graph
Expressed either in sales units or in sales dollars
LO 6: Identify the three ways to determine the break-even point.LO 6: Identify the three ways to determine the break-even point.
Chapter 22-40
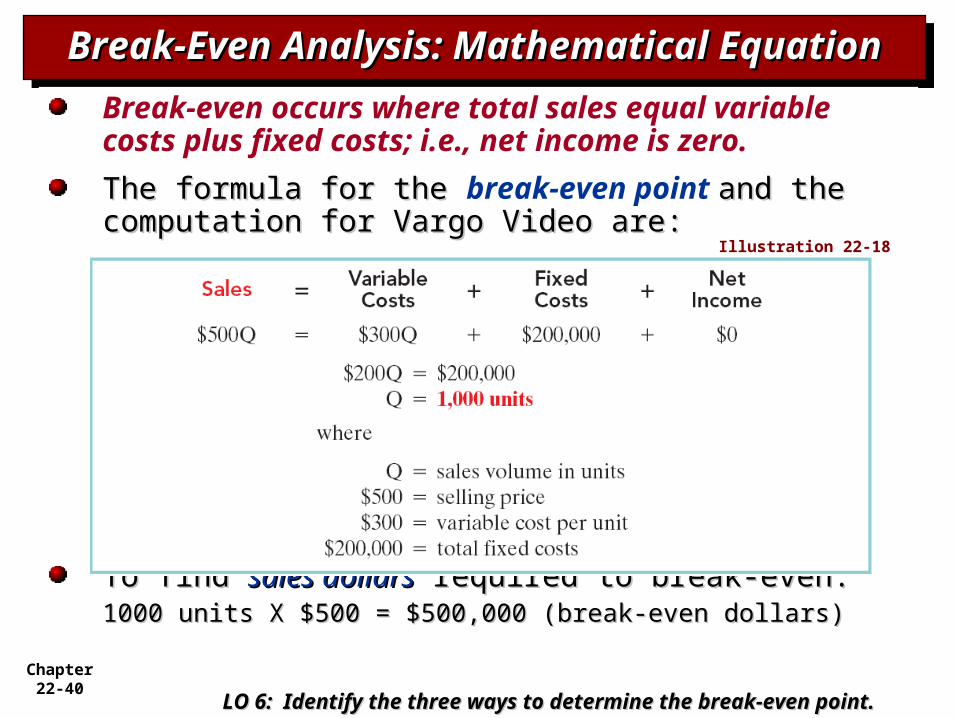
Break-Even Analysis: Mathematical Break-Even Analysis: Mathematical EquationEquation
Break-Even Analysis: Mathematical Break-Even Analysis: Mathematical EquationEquationBreak-even occurs where total sales equal
variable costs plus fixed costs; i.e., net income is zero.
The formula for the The formula for the break-even point and the and the computation for Vargo Video are:computation for Vargo Video are:
To find To find sales dollarssales dollars required to break-even: required to break-even:1000 units X $500 = $500,000 (break-even dollars)1000 units X $500 = $500,000 (break-even dollars)
LO 6: Identify the three ways to determine the break-even point.LO 6: Identify the three ways to determine the break-even point.
Illustration 22-18
Chapter 22-41
Break-Even Analysis:Break-Even Analysis:Contribution Margin TechniqueContribution Margin Technique
Break-Even Analysis:Break-Even Analysis:Contribution Margin TechniqueContribution Margin Technique
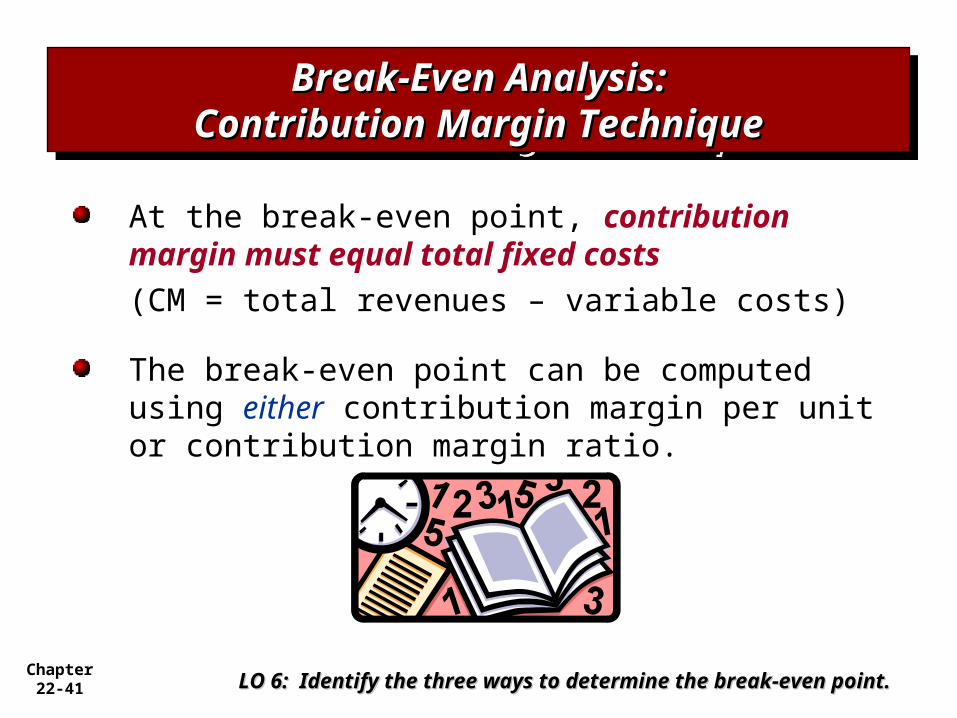
At the break-even point, contribution margin must equal total fixed costs
(CM = total revenues – variable costs)
The break-even point can be computed using either contribution margin per unit or contribution margin ratio.
LO 6: Identify the three ways to determine the break-even point.LO 6: Identify the three ways to determine the break-even point.
Chapter 22-42
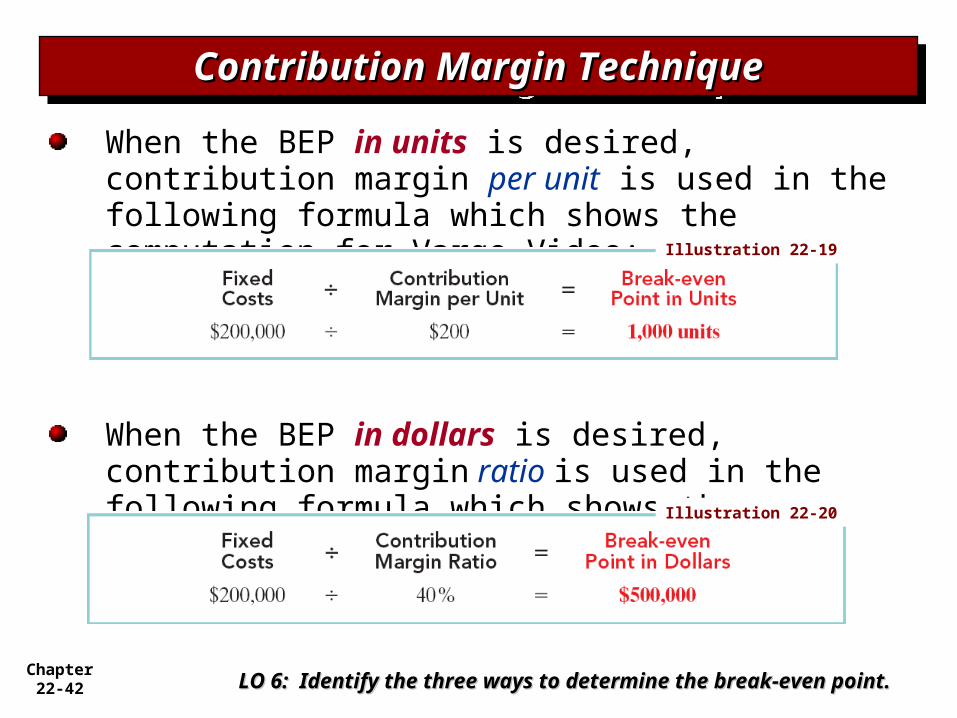
Contribution Margin TechniqueContribution Margin TechniqueContribution Margin TechniqueContribution Margin Technique
When the BEP in units is desired, contribution margin per unit is used in the following formula which shows the computation for Vargo Video:
When the BEP in dollars is desired, contribution margin ratio is used in the following formula which shows the computation for Vargo Video:
LO 6: Identify the three ways to determine the break-even point.LO 6: Identify the three ways to determine the break-even point.
Illustration 22-19
Illustration 22-20
Chapter 22-43
Break-Even Analysis: Graphic Break-Even Analysis: Graphic PresentationPresentation
Break-Even Analysis: Graphic Break-Even Analysis: Graphic PresentationPresentation
A cost-volume profit (CVP) graph shows costs, volume and profits.Used to visually find the break-even point
To construct a CVP graph:To construct a CVP graph:Plot the total sales line starting at the zero activity levelPlot the total fixed cost using a horizontal linePlot the total cost line (starts at the fixed-cost line at zero activityDetermine the break-even point from the intersection of the total cost line and the total sales line
LO 6: Identify the three ways to determine the break-even point.LO 6: Identify the three ways to determine the break-even point.
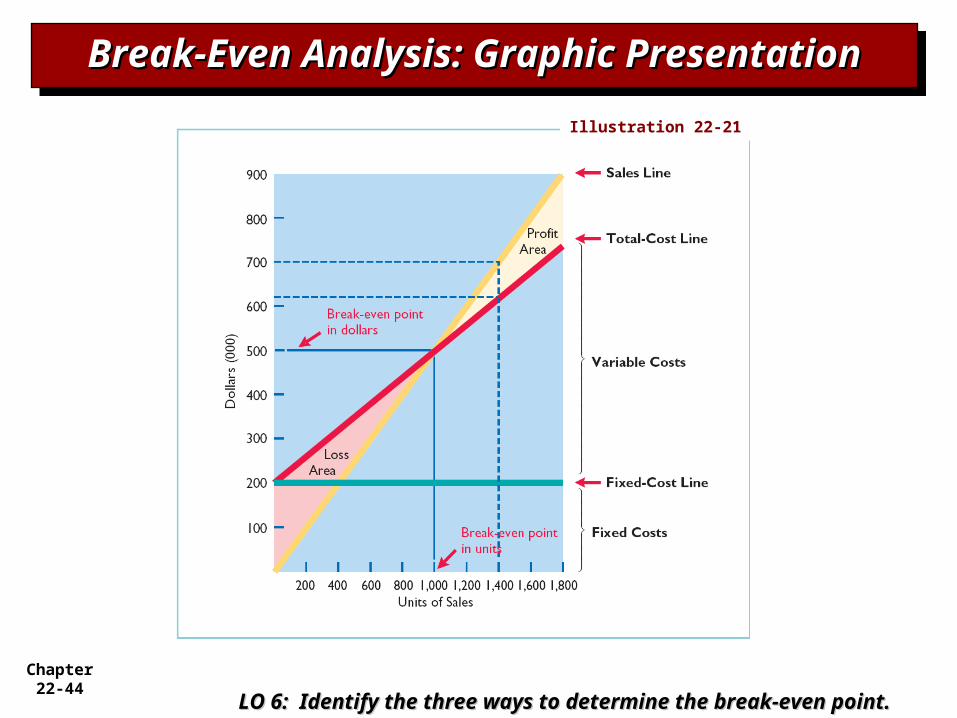
Chapter 22-44
Break-Even Analysis: Graphic Break-Even Analysis: Graphic PresentationPresentation
Break-Even Analysis: Graphic Break-Even Analysis: Graphic PresentationPresentation
LO 6: Identify the three ways to determine the break-even point.LO 6: Identify the three ways to determine the break-even point.
Illustration 22-21
Chapter 22-45
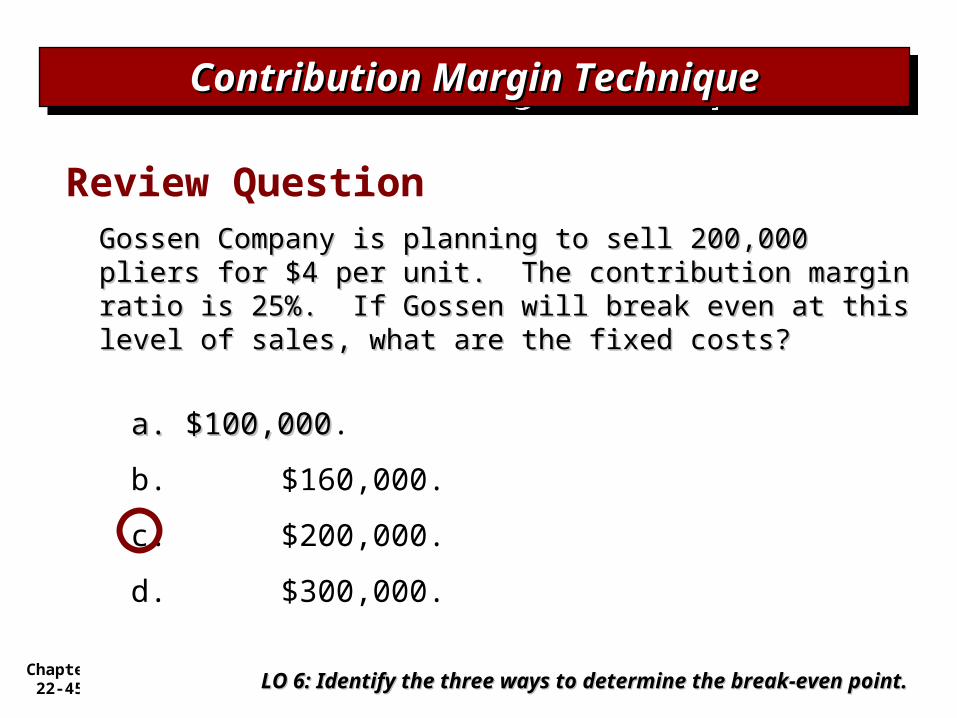
Gossen Company is planning to sell 200,000 pliers Gossen Company is planning to sell 200,000 pliers for $4 per unit. The contribution margin ratio is for $4 per unit. The contribution margin ratio is 25%. If Gossen will break even at this level of 25%. If Gossen will break even at this level of sales, what are the fixed costs?sales, what are the fixed costs?
a.a. $100,000$100,000.
b. $160,000.
c. $200,000.
d. $300,000.
Contribution Margin TechniqueContribution Margin TechniqueContribution Margin TechniqueContribution Margin Technique
LO 6: Identify the three ways to determine the break-even point.LO 6: Identify the three ways to determine the break-even point.
Review Question
Chapter 22-46
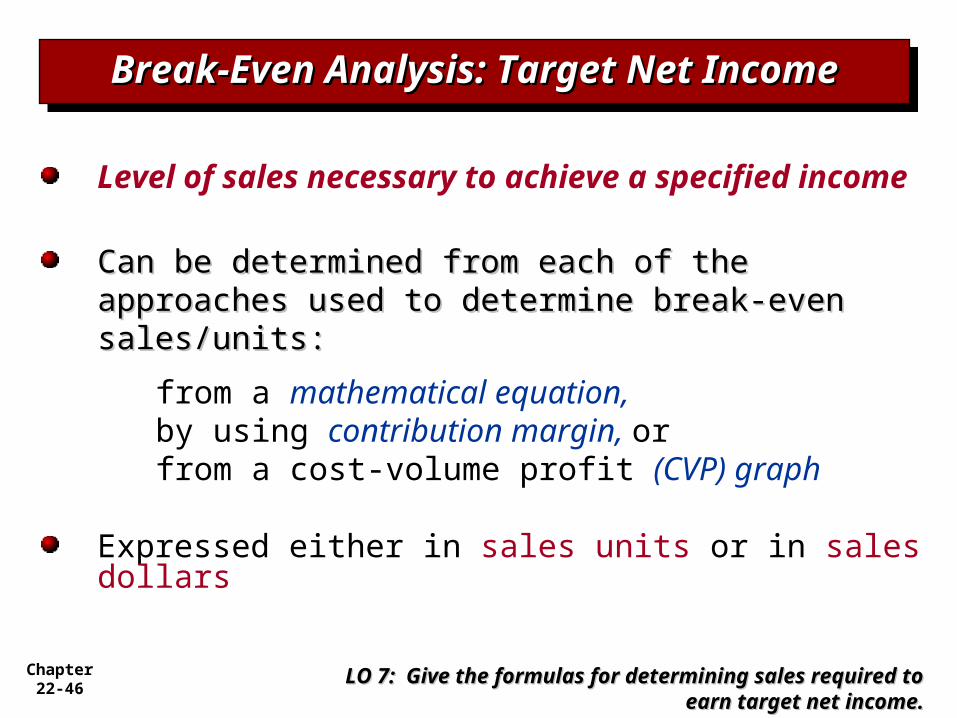
Break-Even Analysis: Target Net Break-Even Analysis: Target Net IncomeIncome
Break-Even Analysis: Target Net Break-Even Analysis: Target Net IncomeIncome
Level of sales necessary to achieve a specified income
Can be determined from each of the approaches Can be determined from each of the approaches used to determine break-even sales/units:used to determine break-even sales/units:
from a mathematical equation,by using contribution margin, orfrom a cost-volume profit (CVP) graph
Expressed either in sales units or in sales dollars
LO 7: Give the formulas for determining sales LO 7: Give the formulas for determining sales required to earn target net income.required to earn target net income.
Chapter 22-47
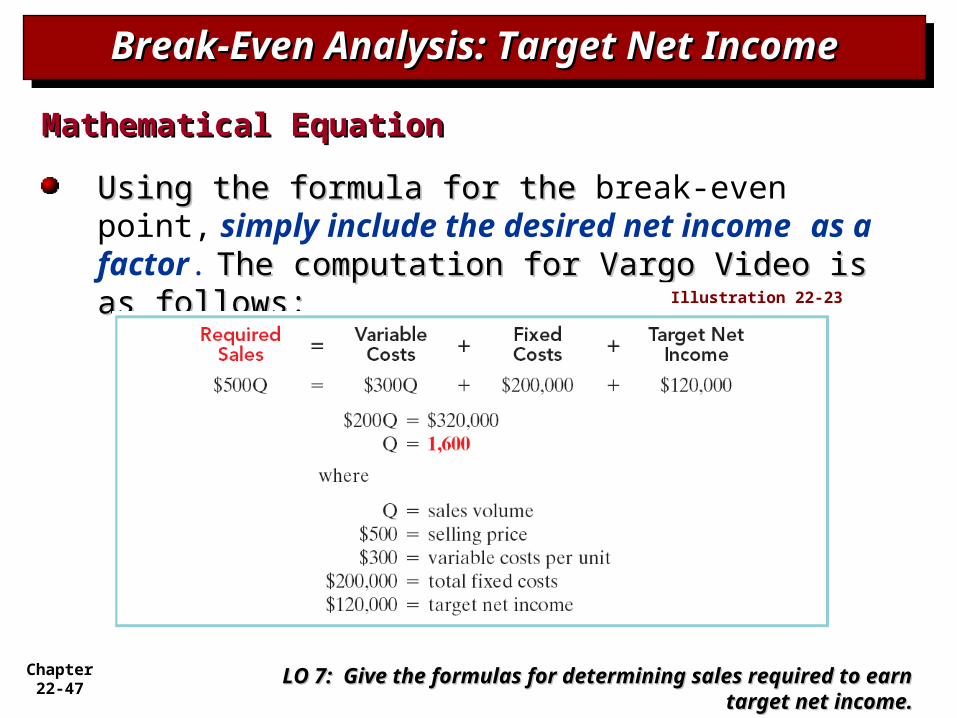
Break-Even Analysis: Target Net IncomeBreak-Even Analysis: Target Net IncomeBreak-Even Analysis: Target Net IncomeBreak-Even Analysis: Target Net Income
Mathematical EquationMathematical Equation
Using the formula for the Using the formula for the break-even point, simply include the desired net income as a factor. The computation for Vargo Video is as The computation for Vargo Video is as follows:follows:
LO 7: Give the formulas for determining sales LO 7: Give the formulas for determining sales required to earn target net income.required to earn target net income.
Illustration 22-23
Chapter 22-48
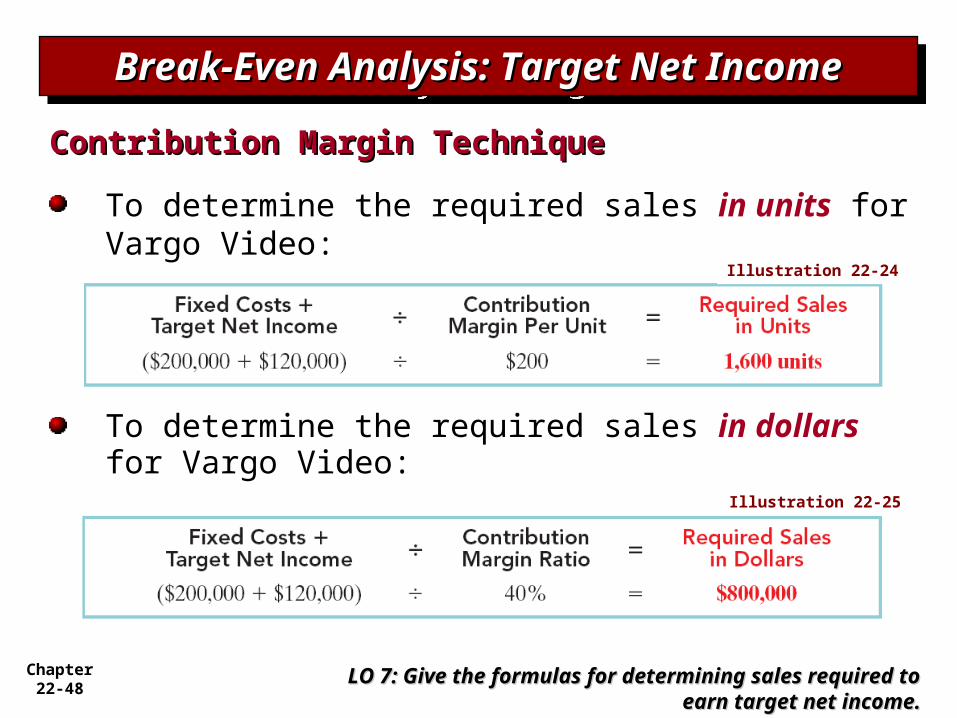
Break-Even Analysis: Target Net Break-Even Analysis: Target Net IncomeIncome
Break-Even Analysis: Target Net Break-Even Analysis: Target Net IncomeIncome
Contribution Margin TechniqueContribution Margin Technique
To determine the required sales in units for Vargo Video:
To determine the required sales in dollars for Vargo Video:
LO 7: Give the formulas for determining sales LO 7: Give the formulas for determining sales required to earn target net income.required to earn target net income.
Illustration 22-24
Illustration 22-25
Chapter 22-49
Target Net IncomeTarget Net IncomeTarget Net IncomeTarget Net Income
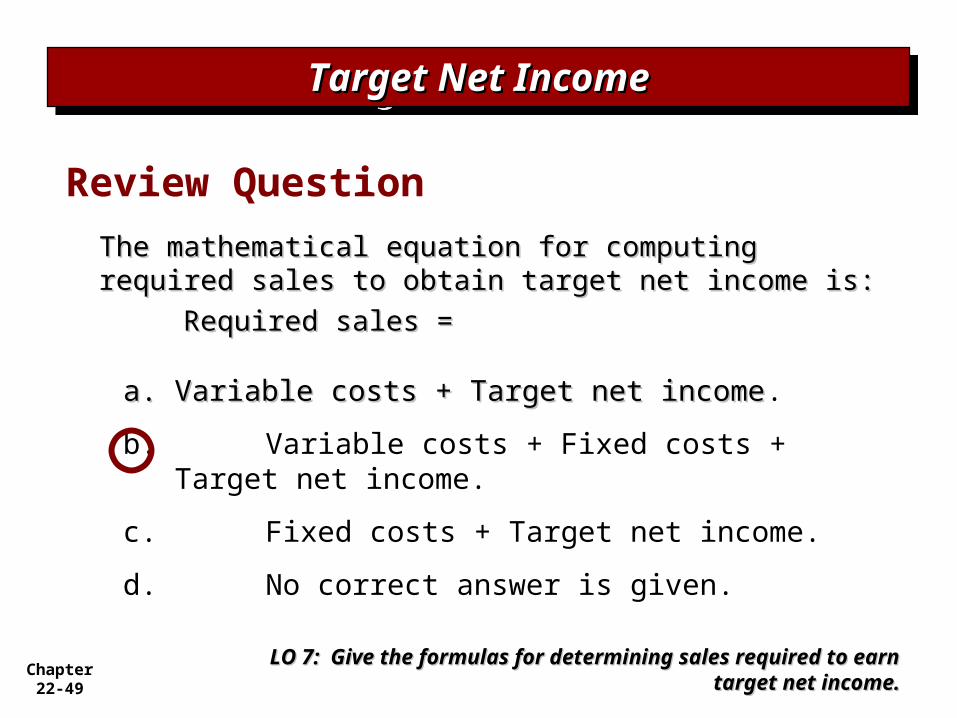
The mathematical equation for computing The mathematical equation for computing required sales to obtain target net income is:required sales to obtain target net income is:
Required sales =Required sales =
a.a. Variable costs + Target net incomeVariable costs + Target net income.
b. Variable costs + Fixed costs + Target net income.
c. Fixed costs + Target net income.
d. No correct answer is given.
LO 7: Give the formulas for determining sales required LO 7: Give the formulas for determining sales required to earn target net income.to earn target net income.
Review Question
Chapter 22-50
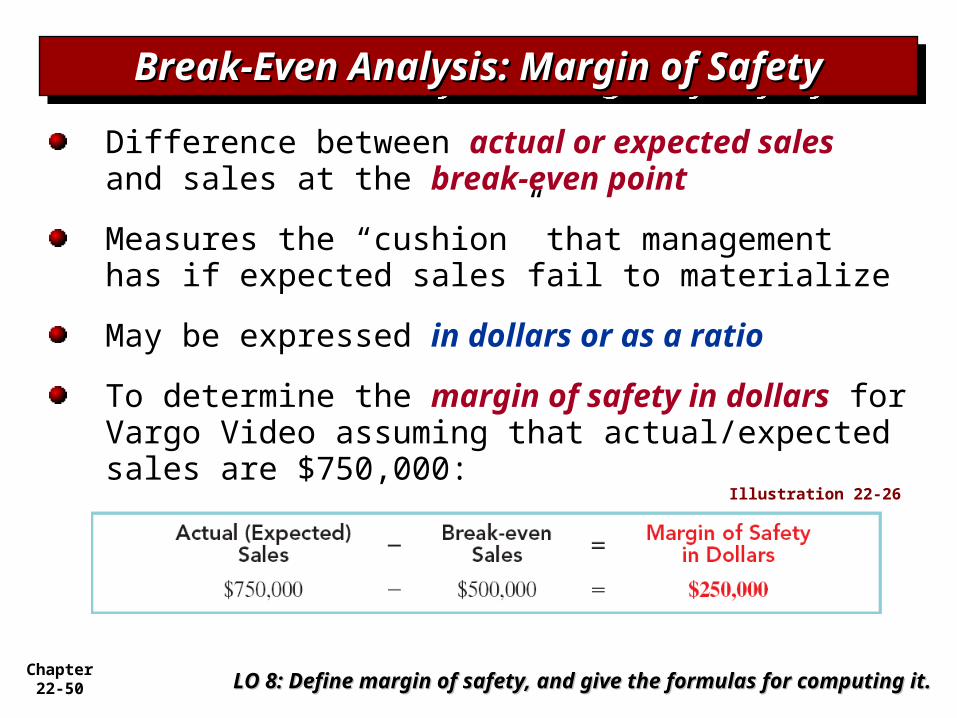
Break-Even Analysis: Margin of SafetyBreak-Even Analysis: Margin of SafetyBreak-Even Analysis: Margin of SafetyBreak-Even Analysis: Margin of Safety
Difference between actual or expected sales and sales at the break-even point
Measures the “cushion” that management has if expected sales fail to materialize
May be expressed in dollars or as a ratio
To determine the margin of safety in dollars for Vargo Video assuming that actual/expected sales are $750,000:
LO 8: Define margin of safety, and give the formulas for LO 8: Define margin of safety, and give the formulas for computing it.computing it.
Illustration 22-26
Chapter 22-51
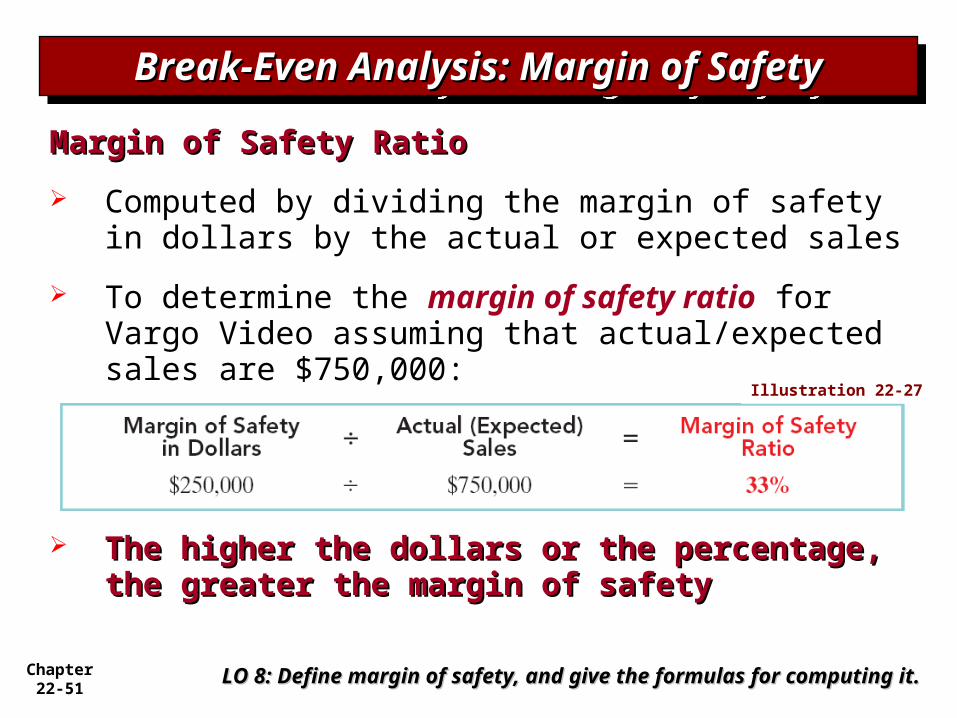
Break-Even Analysis: Margin of SafetyBreak-Even Analysis: Margin of SafetyBreak-Even Analysis: Margin of SafetyBreak-Even Analysis: Margin of Safety
Margin of Safety RatioMargin of Safety Ratio
Computed by dividing the margin of safety in dollars by the actual or expected sales
To determine the margin of safety ratio for Vargo Video assuming that actual/expected sales are $750,000:
The higher the dollars or the percentage, The higher the dollars or the percentage, the greater the margin of safetythe greater the margin of safety
LO 8: Define margin of safety, and give the formulas for LO 8: Define margin of safety, and give the formulas for computing it.computing it.
Illustration 22-27
Chapter 22-52
CVP Income Statement RevisitedCVP Income Statement RevisitedCVP Income Statement RevisitedCVP Income Statement Revisited
LO 9: Describe the essential features of a cost-LO 9: Describe the essential features of a cost-volume-profit income statement.volume-profit income statement.
Illustration 22-33
Chapter 22-53
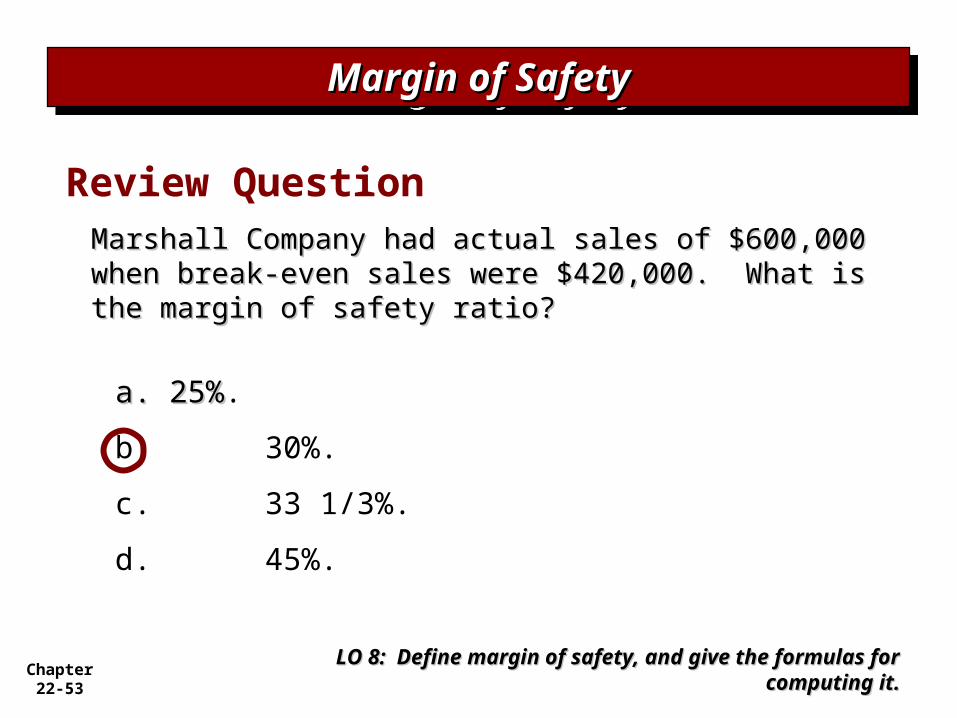
Marshall Company had actual sales of $600,000 Marshall Company had actual sales of $600,000 when break-even sales were $420,000. What is when break-even sales were $420,000. What is the margin of safety ratio?the margin of safety ratio?
a.a. 25%25%.
b. 30%.
c. 33 1/3%.
d. 45%.
Margin of SafetyMargin of SafetyMargin of SafetyMargin of Safety
LO 8: Define margin of safety, and give the formulas LO 8: Define margin of safety, and give the formulas for computing it.for computing it.
Review Question
Chapter 22-54
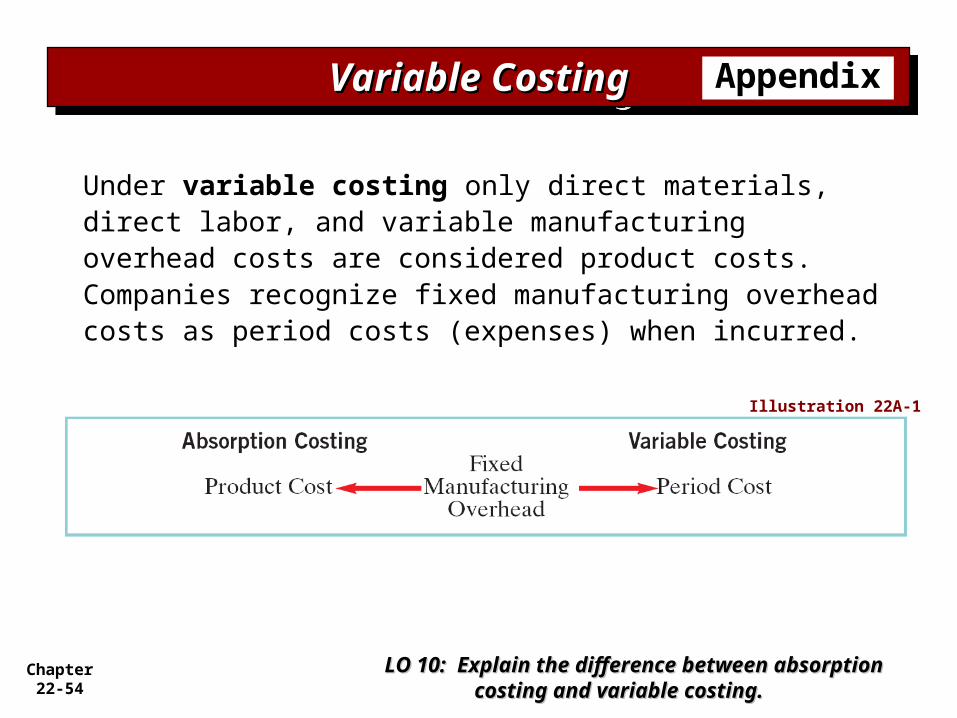
Under variable costing only direct materials, direct labor, and variable manufacturing overhead costs are considered product costs. Companies recognize fixed manufacturing overhead costs as period costs (expenses) when incurred.
Variable CostingVariable CostingVariable CostingVariable Costing
LO 10: Explain the difference between LO 10: Explain the difference between absorption costing and variable absorption costing and variable costing.costing.
Appendix
Illustration 22A-1
Chapter 22-55
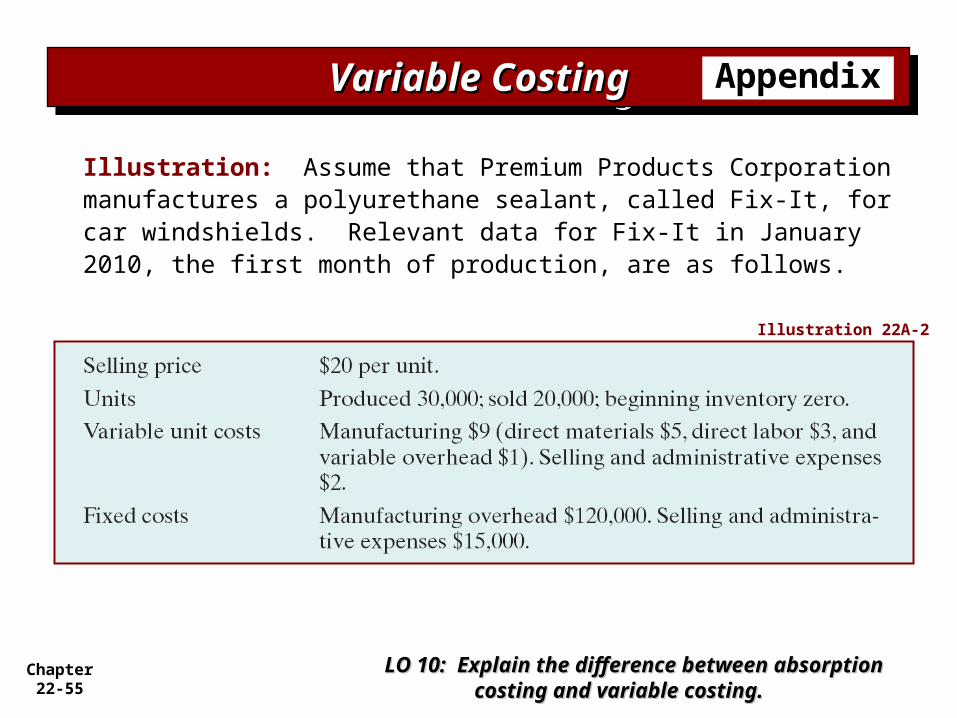
Illustration: Assume that Premium Products Corporation manufactures a polyurethane sealant, called Fix-It, for car windshields. Relevant data for Fix-It in January 2010, the first month of production, are as follows.
Variable CostingVariable CostingVariable CostingVariable Costing
LO 10: Explain the difference between LO 10: Explain the difference between absorption costing and variable absorption costing and variable costing.costing.
Appendix
Illustration 22A-2
Chapter 22-56
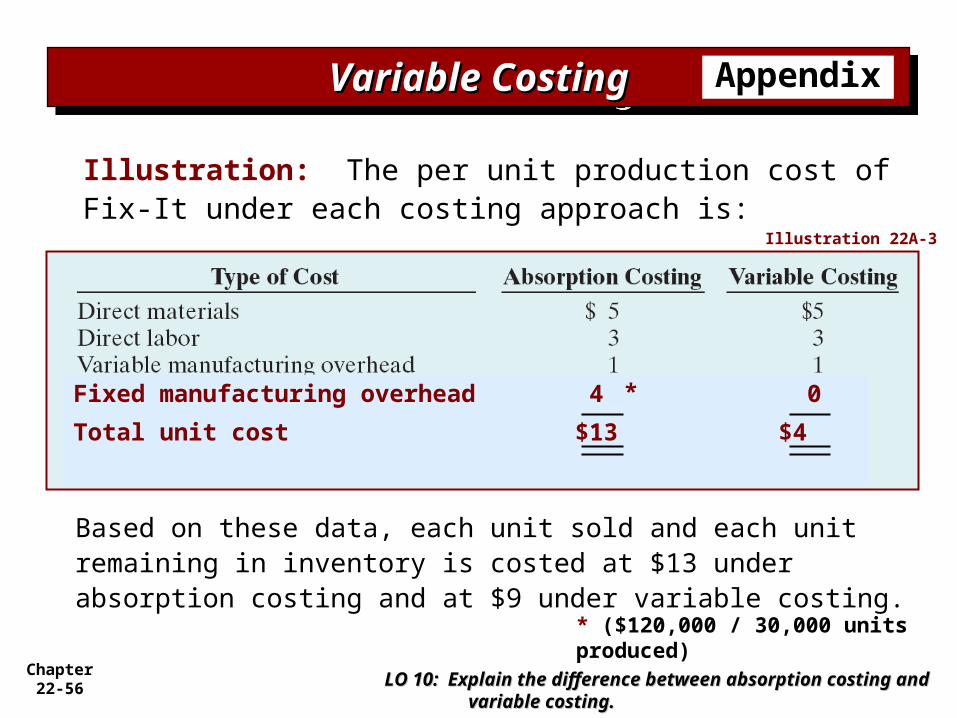
Illustration: The per unit production cost of Fix-It under each costing approach is:
Variable CostingVariable CostingVariable CostingVariable Costing
LO 10: Explain the difference between absorption LO 10: Explain the difference between absorption costing and variable costing.costing and variable costing.
Appendix
Illustration 22A-3
* ($120,000 / 30,000 units produced)
Fixed manufacturing overhead 4 0
Total unit cost $13 $4
*
Based on these data, each unit sold and each unit remaining in inventory is costed at $13 under absorption costing and at $9 under variable costing.
Chapter 22-57
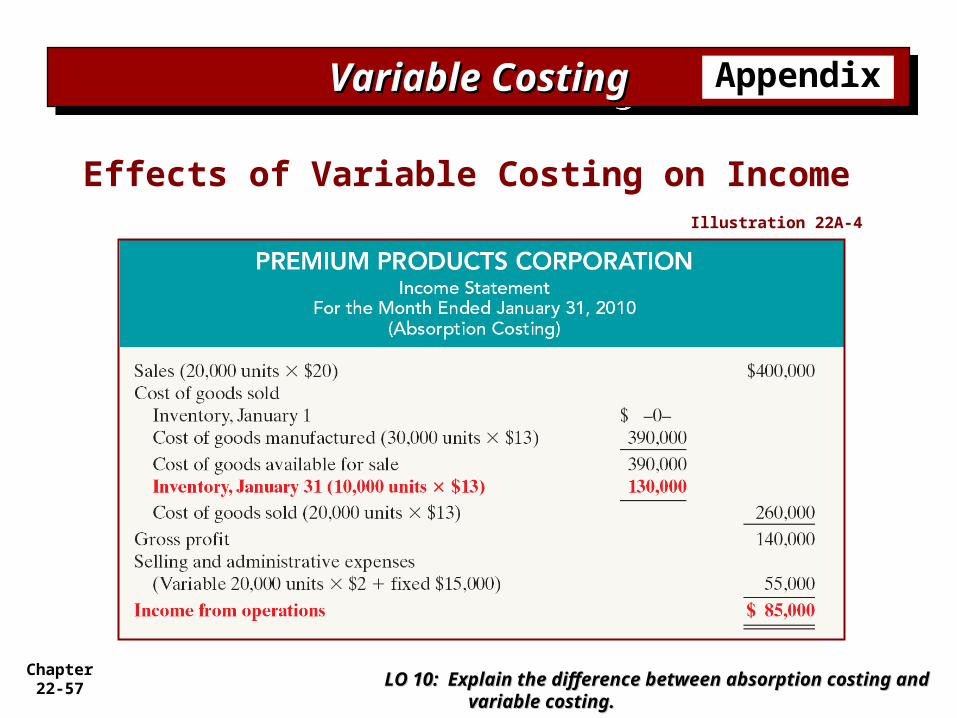
Effects of Variable Costing on Income
Variable CostingVariable CostingVariable CostingVariable Costing
LO 10: Explain the difference between absorption LO 10: Explain the difference between absorption costing and variable costing.costing and variable costing.
Appendix
Illustration 22A-4
Chapter 22-58
Effects of Variable Costing on Income
Variable CostingVariable CostingVariable CostingVariable Costing Appendix
Illustration 22A-5
Chapter 22-59
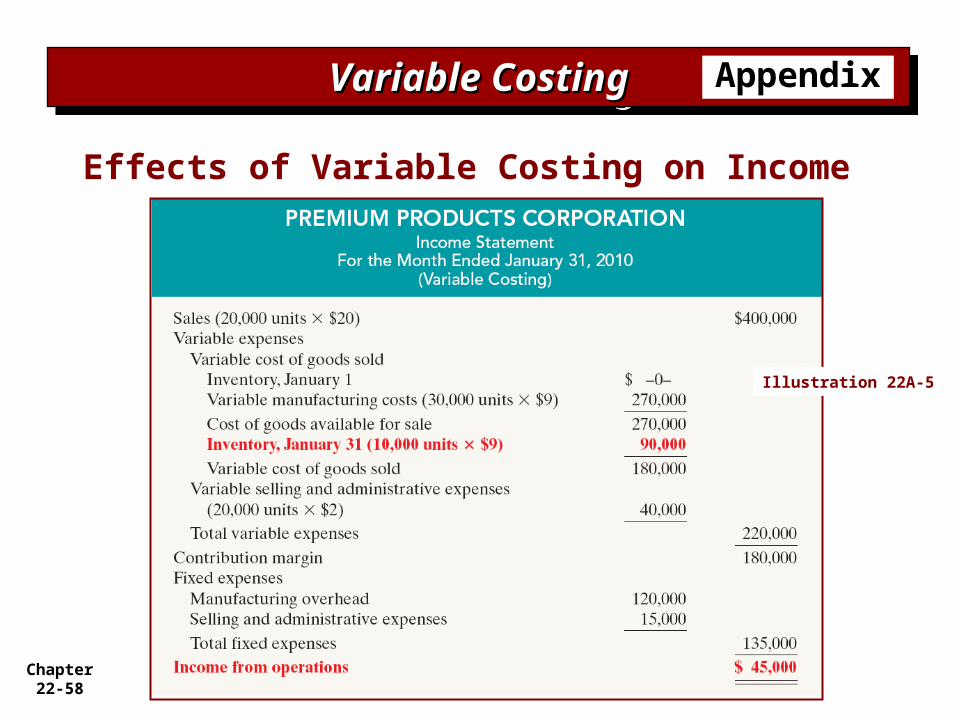
Effects of Variable Costing on Income
Variable CostingVariable CostingVariable CostingVariable Costing Appendix
LO 10: Explain the difference between absorption LO 10: Explain the difference between absorption costing and variable costing.costing and variable costing.
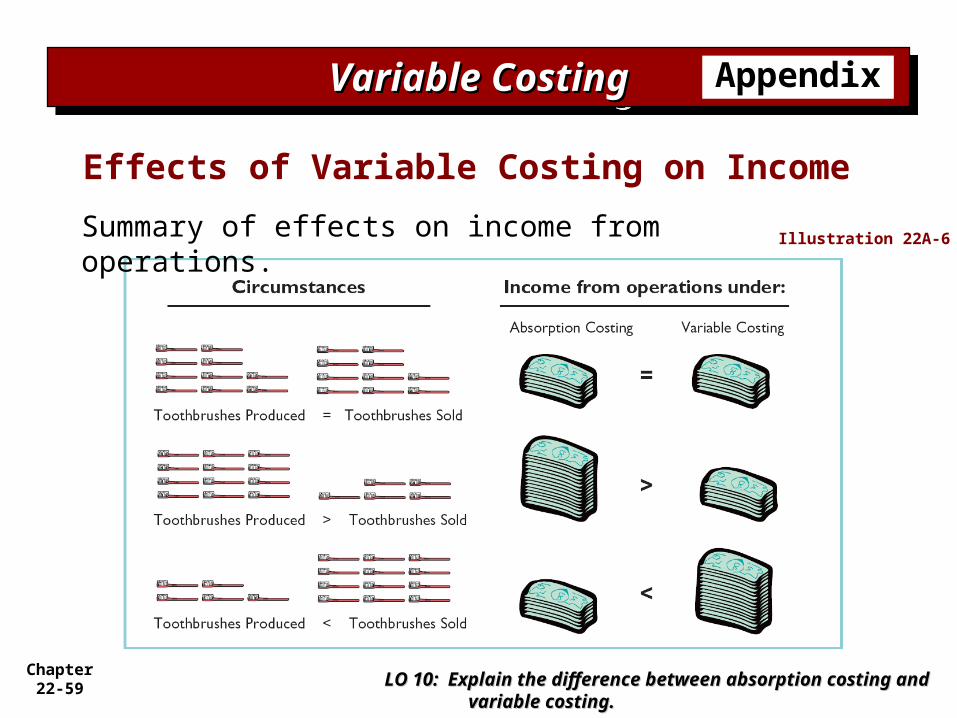
Summary of effects on income from operations.
Illustration 22A-6
Chapter 22-60
Rationale for Variable Costing
Variable CostingVariable CostingVariable CostingVariable Costing Appendix
The purpose of fixed manufacturing costs is to have productive facilities available for use.
The use of variable costing is acceptable only for internal use by management.
Chapter 22-61
Copyright © 2009 John Wiley & Sons, Inc. All rights reserved. Reproduction or translation of this work beyond that permitted in Section 117 of the 1976 United States Copyright Act without the express written permission of the copyright owner is unlawful. Request for further information should be addressed to the Permissions Department, John Wiley & Sons, Inc. The purchaser may make back-up copies for his/her own use only and not for distribution or resale. The Publisher assumes no responsibility for errors, omissions, or damages, caused by the use of these programs or from the use of the information contained herein.
CopyrightCopyrightCopyrightCopyright