Embed Size (px)
Citation preview
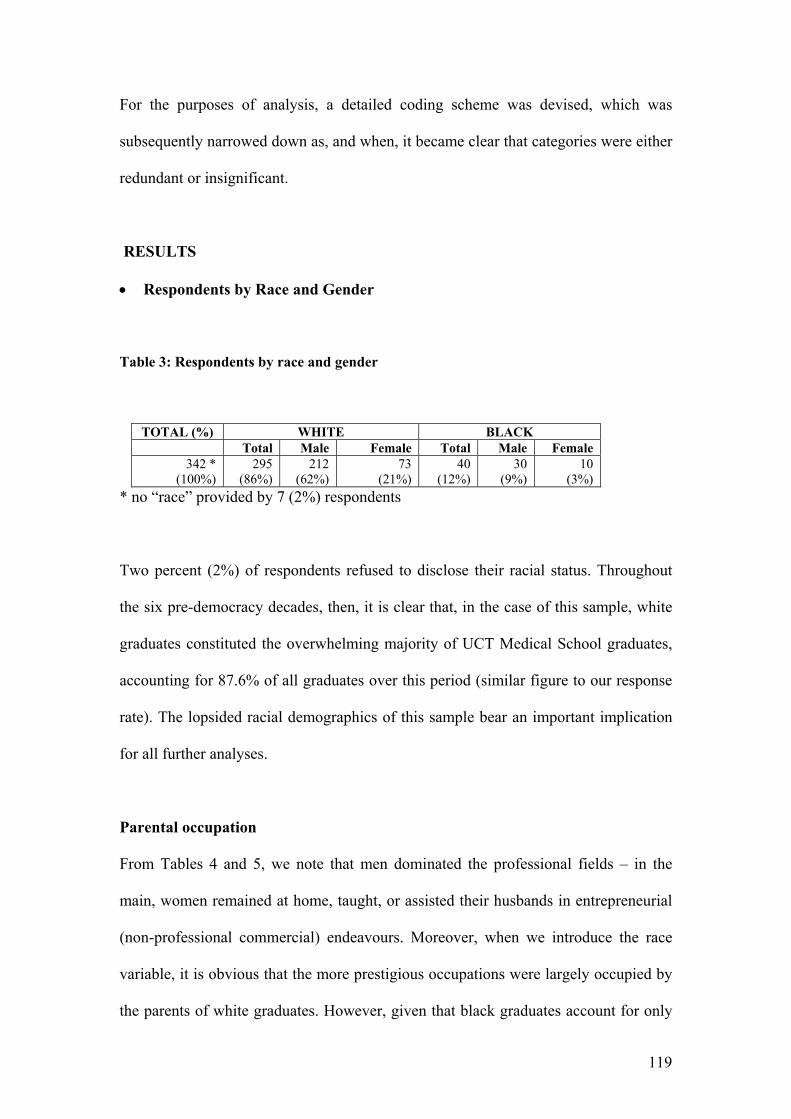
CHAPTER 4: A POSTAL SURVEY OF ALUMNI FROM THE HEALTH
SCIENCES FACULTY, UCT
INTRODUCTION
A questionnaire was drawn up from the themes of the responses of black alumni and
posted to 1607 black and white alumni from the Health Sciences Faculty. Five aspects
of student life were covered, namely demographic data, pre-tertiary preparation, UCT
experiences, institutional restrictions and career trajectories, followed by items
assessing the need for a Faculty assembly for purposes of reconciliation.
METHOD AND MATERIALS
One thousand six hundred and seven (1607) HSF alumni were mailed a copy of the
Questionnaire for Alumni of HSF. Every alumnus in 17 (final-year) classes was
sampled, with ‘successive’ sample classes being separated by an interval of three
years – beginning with the class of 1945, then, the sampled final-year classes were
those of 1948, 1951 and so forth, ending with the class of 1993. The questionnaire
consists of thirty-seven items, with certain of these including contingency questions.
In this regard, items were in the main closed-ended in order to facilitate what is
predominantly a quantitative analysis, although, where further elaboration to answers
was required, open-ended questions were incorporated.
Of the total number of mailed questionnaires, only 342 were completed – this
translates into a response rate of 21%. While the implications of this figure will be
discussed at a later stage, one should bear in mind that, in the research community, it
is generally agreed that a 50% response rate is adequate (Babbie & Mouton, 2001).
118
For the purposes of analysis, a detailed coding scheme was devised, which was
subsequently narrowed down as, and when, it became clear that categories were either
redundant or insignificant.
RESULTS
• Respondents by Race and Gender
Table 3: Respondents by race and gender
TOTAL (%) WHITE BLACK Total Male Female Total Male Female
342 * (100%)
295 (86%)
212 (62%)
73 (21%)
40 (12%)
30 (9%)
10 (3%)
* no “race” provided by 7 (2%) respondents
Two percent (2%) of respondents refused to disclose their racial status. Throughout
the six pre-democracy decades, then, it is clear that, in the case of this sample, white
graduates constituted the overwhelming majority of UCT Medical School graduates,
accounting for 87.6% of all graduates over this period (similar figure to our response
rate). The lopsided racial demographics of this sample bear an important implication
for all further analyses.
Parental occupation
From Tables 4 and 5, we note that men dominated the professional fields – in the
main, women remained at home, taught, or assisted their husbands in entrepreneurial
(non-professional commercial) endeavours. Moreover, when we introduce the race
variable, it is obvious that the more prestigious occupations were largely occupied by
the parents of white graduates. However, given that black graduates account for only
119
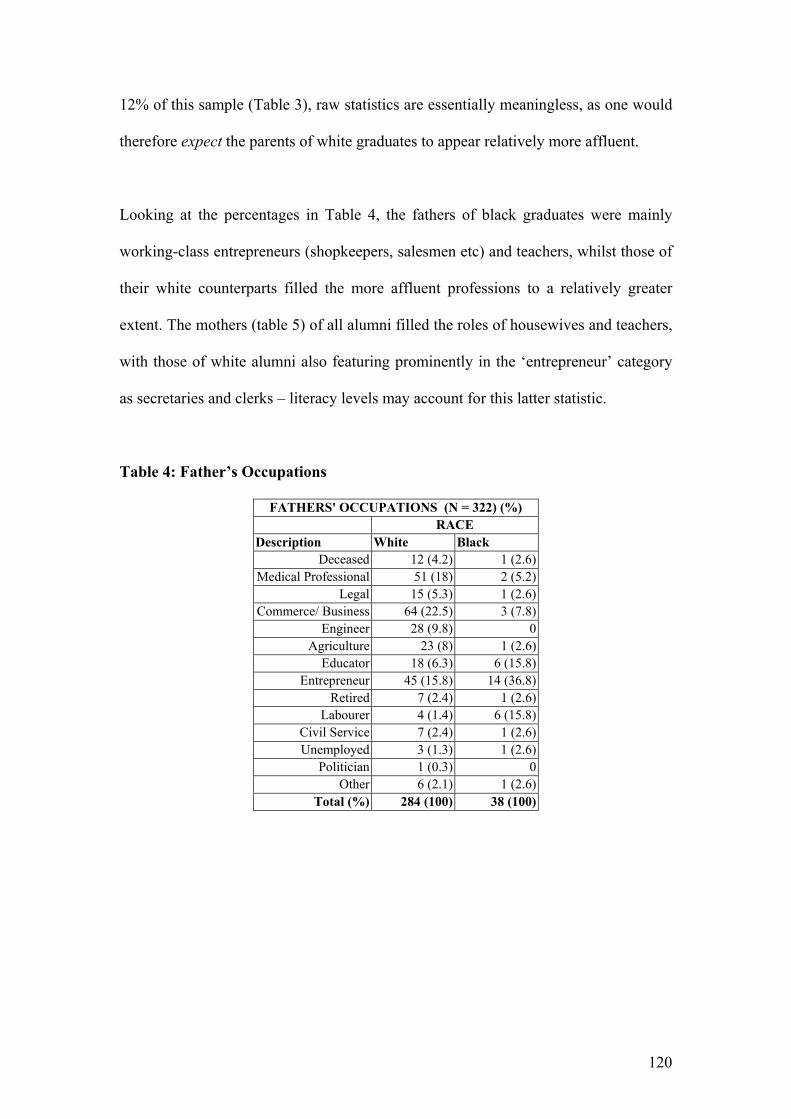
12% of this sample (Table 3), raw statistics are essentially meaningless, as one would
therefore expect the parents of white graduates to appear relatively more affluent.
Looking at the percentages in Table 4, the fathers of black graduates were mainly
working-class entrepreneurs (shopkeepers, salesmen etc) and teachers, whilst those of
their white counterparts filled the more affluent professions to a relatively greater
extent. The mothers (table 5) of all alumni filled the roles of housewives and teachers,
with those of white alumni also featuring prominently in the ‘entrepreneur’ category
as secretaries and clerks – literacy levels may account for this latter statistic.
Table 4: Father’s Occupations
FATHERS' OCCUPATIONS (N = 322) (%) RACE
Description White Black Deceased 12 (4.2) 1 (2.6)
Medical Professional 51 (18) 2 (5.2)Legal 15 (5.3) 1 (2.6)
Commerce/ Business 64 (22.5) 3 (7.8)Engineer 28 (9.8) 0
Agriculture 23 (8) 1 (2.6)Educator 18 (6.3) 6 (15.8)
Entrepreneur 45 (15.8) 14 (36.8)Retired 7 (2.4) 1 (2.6)
Labourer 4 (1.4) 6 (15.8)Civil Service 7 (2.4) 1 (2.6)Unemployed 3 (1.3) 1 (2.6)
Politician 1 (0.3) 0 Other 6 (2.1) 1 (2.6)
Total (%) 284 (100) 38 (100)
120
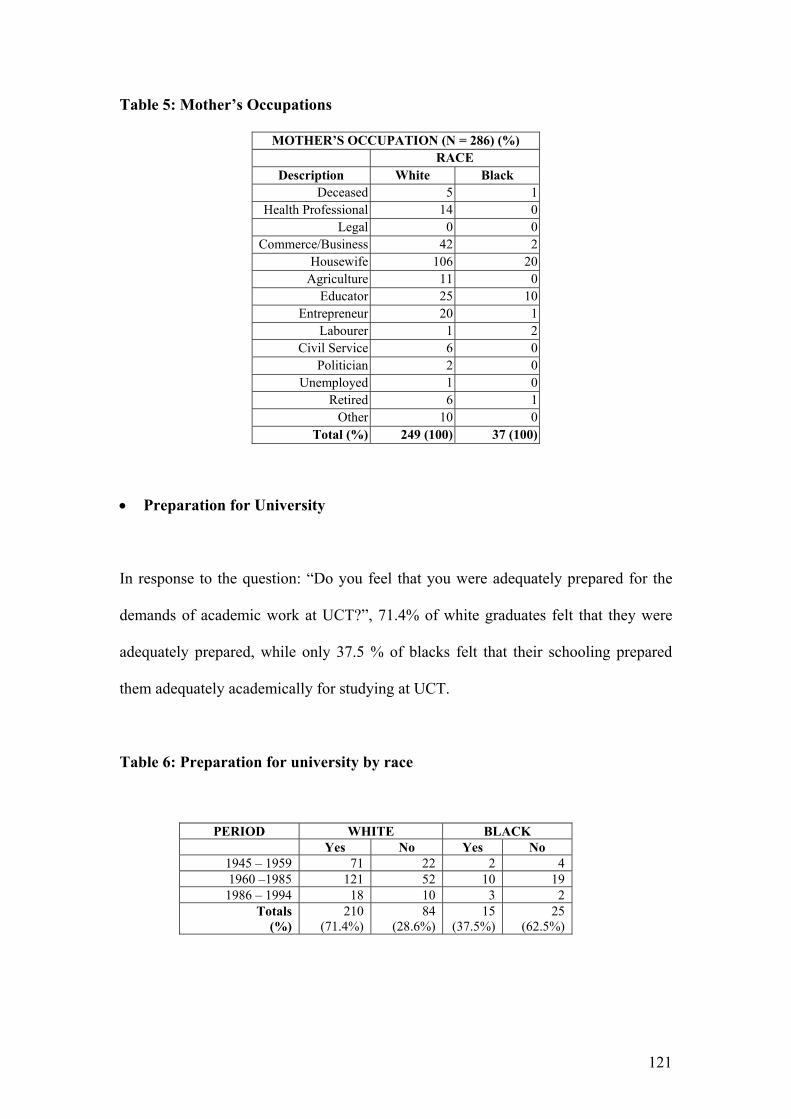
Table 5: Mother’s Occupations
MOTHER’S OCCUPATION (N = 286) (%) RACE
Description White Black Deceased 5 1
Health Professional 14 0Legal 0 0
Commerce/Business 42 2Housewife 106 20
Agriculture 11 0Educator 25 10
Entrepreneur 20 1Labourer 1 2
Civil Service 6 0Politician 2 0
Unemployed 1 0Retired 6 1
Other 10 0Total (%) 249 (100) 37 (100)
• Preparation for University
In response to the question: “Do you feel that you were adequately prepared for the
demands of academic work at UCT?”, 71.4% of white graduates felt that they were
adequately prepared, while only 37.5 % of blacks felt that their schooling prepared
them adequately academically for studying at UCT.
Table 6: Preparation for university by race
PERIOD WHITE BLACK Yes No Yes No
1945 – 1959 71 22 2 4 1960 –1985 121 52 10 19 1986 – 1994 18 10 3 2
Totals (%)
210 (71.4%)
84 (28.6%)
15 (37.5%)
25 (62.5%)
121
The reasons given by black and white respondents for feeling that they were not
adequately prepared academically for studying at UCT were similar in some respects.
The areas where there was agreement were that their schools did not encourage them
to think or work independently neither did they prepare them for the high volume of
work at university. Black and white respondents complained of the inadequate
teaching in Maths and Science at high school and the lack of advice on the choice of
subjects that would have made studying medicine easier. Some respondents (from
both black and white groups) came from Afrikaans backgrounds and this put them at a
disadvantage in an English speaking environment at UCT.
In addition to the above, Black respondents spoke of the deficient schools, the low
standards of education, poor teaching and the lack of facilities at black high schools
(laboratory, library, etc).
Most of the black and white respondents came to UCT because of its proximity to
their homes and the reputation of the medical school. Black respondents also gave
reasons such as “refused to go to UWC” and the “ministerial permit” for studying at
UCT. A few White respondents said that apartheid legislation had prevented them
from studying at Natal University, which was closer to their homes.
• Experiences as a student at UCT
1. Accommodation
Initially only white students were allowed to live in residence at UCT. Up to 1987
black students were not allowed to live in residence. This meant that these students
were obliged to either live at home with their parents or “board” with black families.
122
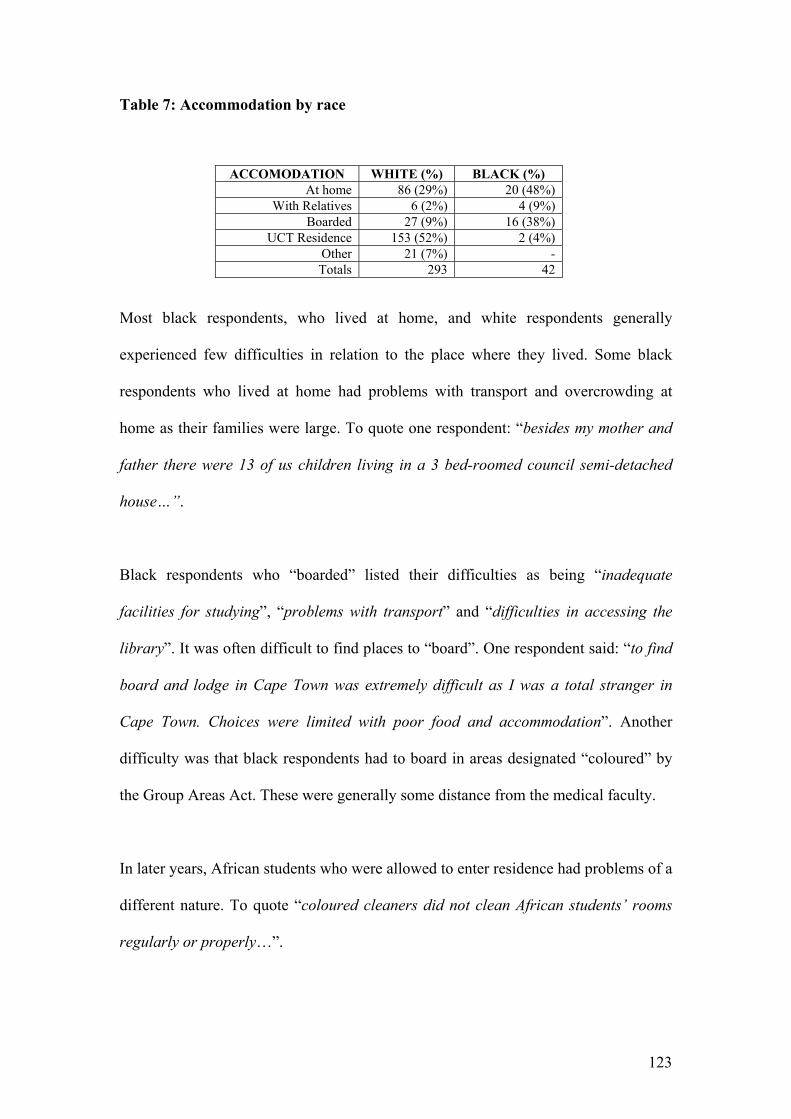
Table 7: Accommodation by race
ACCOMODATION WHITE (%) BLACK (%) At home 86 (29%) 20 (48%)
With Relatives 6 (2%) 4 (9%) Boarded 27 (9%) 16 (38%)
UCT Residence 153 (52%) 2 (4%) Other 21 (7%) - Totals 293 42
Most black respondents, who lived at home, and white respondents generally
experienced few difficulties in relation to the place where they lived. Some black
respondents who lived at home had problems with transport and overcrowding at
home as their families were large. To quote one respondent: “besides my mother and
father there were 13 of us children living in a 3 bed-roomed council semi-detached
house…”.
Black respondents who “boarded” listed their difficulties as being “inadequate
facilities for studying”, “problems with transport” and “difficulties in accessing the
library”. It was often difficult to find places to “board”. One respondent said: “to find
board and lodge in Cape Town was extremely difficult as I was a total stranger in
Cape Town. Choices were limited with poor food and accommodation”. Another
difficulty was that black respondents had to board in areas designated “coloured” by
the Group Areas Act. These were generally some distance from the medical faculty.
In later years, African students who were allowed to enter residence had problems of a
different nature. To quote “coloured cleaners did not clean African students’ rooms
regularly or properly…”.
123
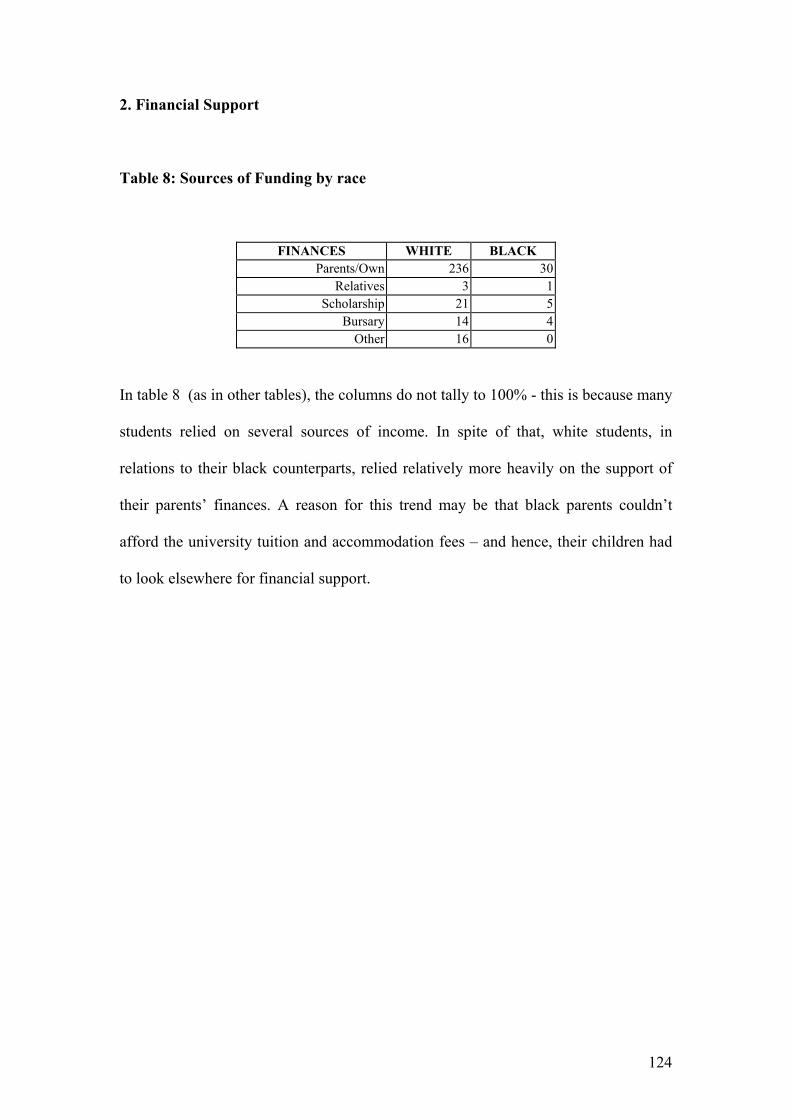
2. Financial Support
Table 8: Sources of Funding by race
FINANCES WHITE BLACK Parents/Own 236 30
Relatives 3 1Scholarship 21 5
Bursary 14 4Other 16 0
In table 8 (as in other tables), the columns do not tally to 100% - this is because many
students relied on several sources of income. In spite of that, white students, in
relations to their black counterparts, relied relatively more heavily on the support of
their parents’ finances. A reason for this trend may be that black parents couldn’t
afford the university tuition and accommodation fees – and hence, their children had
to look elsewhere for financial support.
124
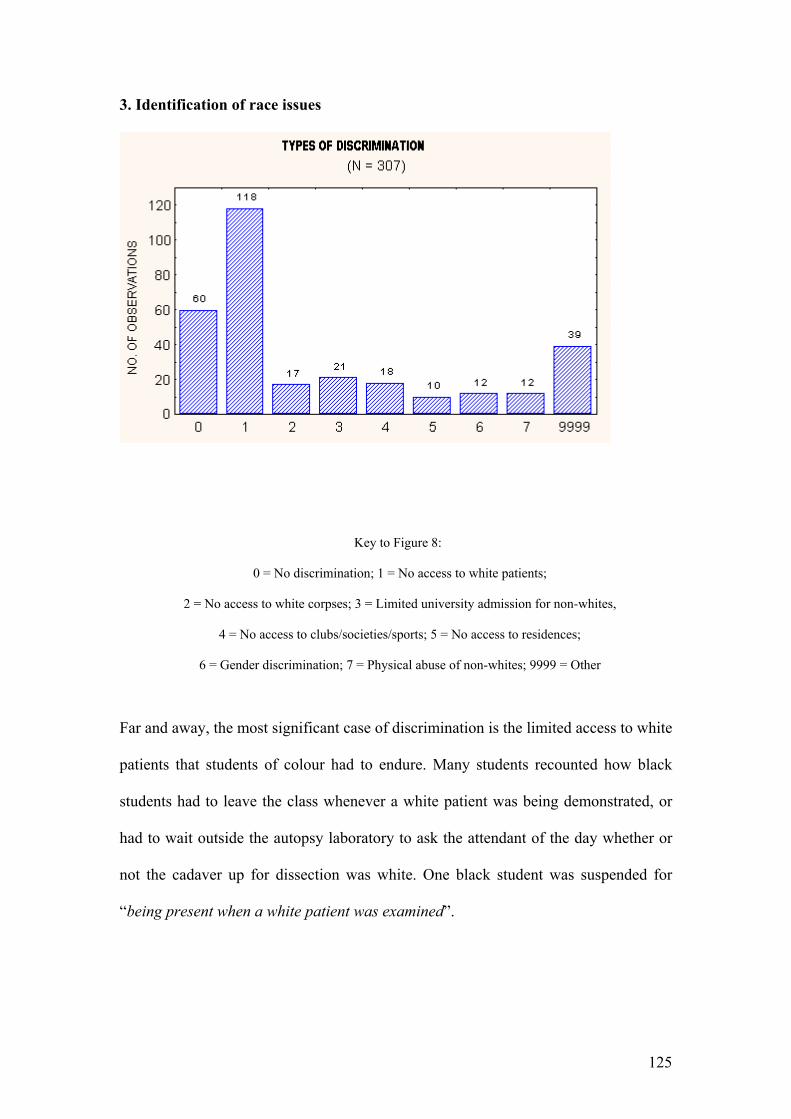
3. Identification of race issues
Key to Figure 8:
0 = No discrimination; 1 = No access to white patients;
2 = No access to white corpses; 3 = Limited university admission for non-whites,
4 = No access to clubs/societies/sports; 5 = No access to residences;
6 = Gender discrimination; 7 = Physical abuse of non-whites; 9999 = Other
Far and away, the most significant case of discrimination is the limited access to white
patients that students of colour had to endure. Many students recounted how black
students had to leave the class whenever a white patient was being demonstrated, or
had to wait outside the autopsy laboratory to ask the attendant of the day whether or
not the cadaver up for dissection was white. One black student was suspended for
“being present when a white patient was examined”.
125
Yet, some white respondents thought that such humiliation of fellow students wasn’t
entirely disadvantageous:
• “Yes – there was the time [when] only white students were allowed to attend
ward rounds in white wards. This became more strict with time – even Chinese
students being excluded. This of course limited patient material, but there was
more ‘material’ in non-white wards.” (white female )
• “Non-white students [were] barred from examining white patients, but as
there was a greater variety of pathology in non-white patients, this may not
have been as bad as it sounds.” (white female)
• “The only discrimination was that black students were restricted to black
wards. But that did not necessarily compromise their training.” (white male)
Approximately one in seven female respondents (compared to one in 258 males), too,
reported incidents of gender discrimination:
• “A gynaecology tutor ask[ed] me why I was in his tutorial and not at home,
barefoot and pregnant.” (white female)
• “In the case of the latter [gender discrimination], the ‘usual’ male arrogance
was present in a few lecturers who either flirted with females or insinuated
that we were taking the place of a male who would offer far more working
years to society.” (white female)
126
• “… rude male registrars making coarse, sexual jokes at the expense of female
students – most ended up in tears.” (white female)
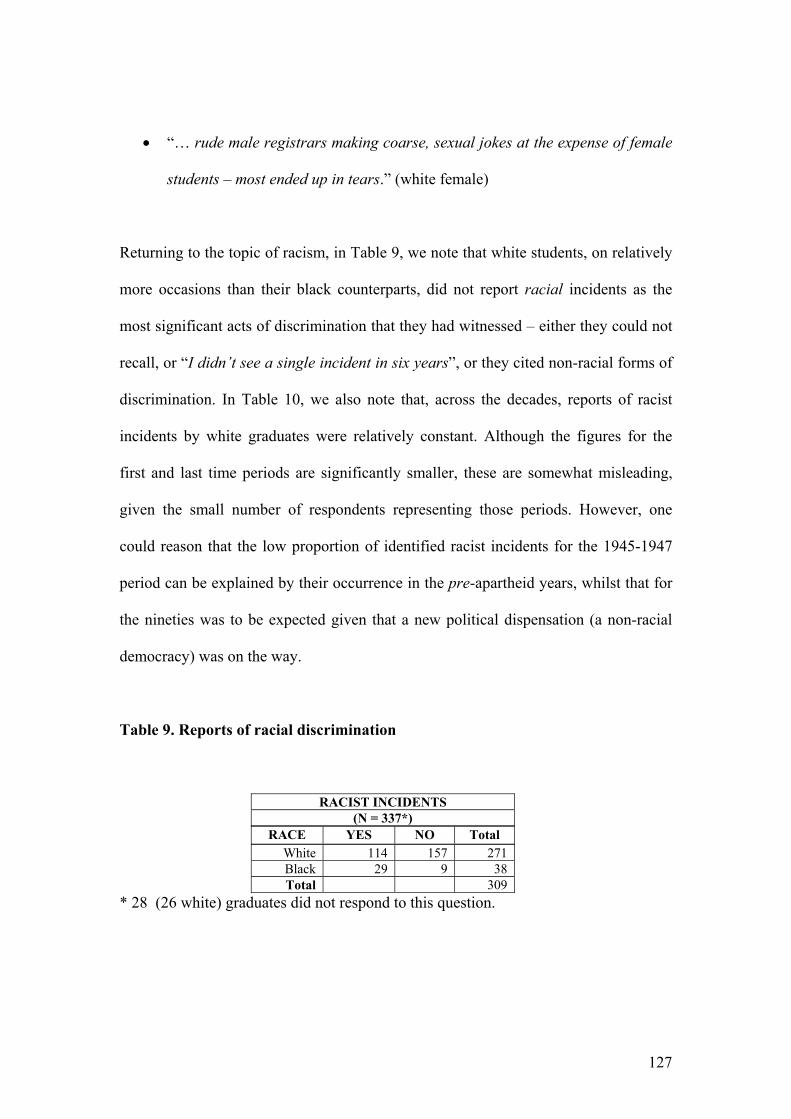
Returning to the topic of racism, in Table 9, we note that white students, on relatively
more occasions than their black counterparts, did not report racial incidents as the
most significant acts of discrimination that they had witnessed – either they could not
recall, or “I didn’t see a single incident in six years”, or they cited non-racial forms of
discrimination. In Table 10, we also note that, across the decades, reports of racist
incidents by white graduates were relatively constant. Although the figures for the
first and last time periods are significantly smaller, these are somewhat misleading,
given the small number of respondents representing those periods. However, one
could reason that the low proportion of identified racist incidents for the 1945-1947
period can be explained by their occurrence in the pre-apartheid years, whilst that for
the nineties was to be expected given that a new political dispensation (a non-racial
democracy) was on the way.
Table 9. Reports of racial discrimination
RACIST INCIDENTS (N = 337*)
RACE YES NO Total White 114 157 271 Black 29 9 38 Total 309
* 28 (26 white) graduates did not respond to this question.
127
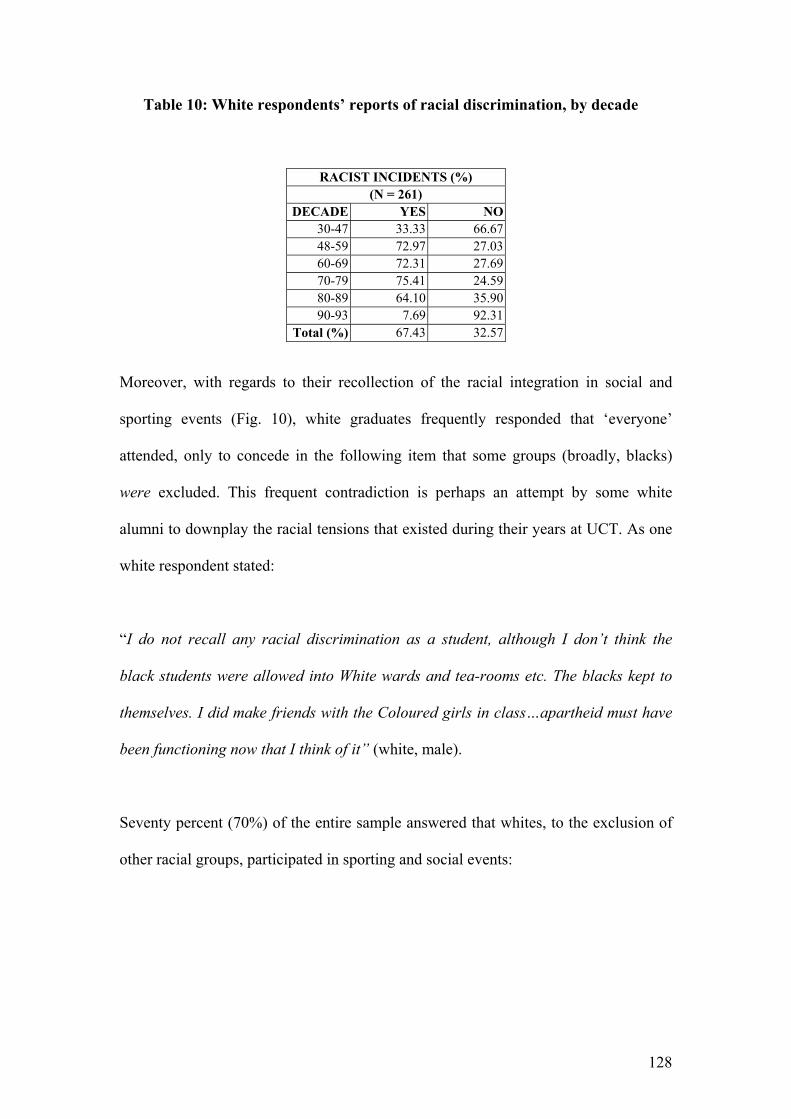
Table 10: White respondents’ reports of racial discrimination, by decade
RACIST INCIDENTS (%) (N = 261)
DECADE YES NO30-47 33.33 66.6748-59 72.97 27.0360-69 72.31 27.6970-79 75.41 24.5980-89 64.10 35.9090-93 7.69 92.31
Total (%) 67.43 32.57
Moreover, with regards to their recollection of the racial integration in social and
sporting events (Fig. 10), white graduates frequently responded that ‘everyone’
attended, only to concede in the following item that some groups (broadly, blacks)
were excluded. This frequent contradiction is perhaps an attempt by some white
alumni to downplay the racial tensions that existed during their years at UCT. As one
white respondent stated:
“I do not recall any racial discrimination as a student, although I don’t think the
black students were allowed into White wards and tea-rooms etc. The blacks kept to
themselves. I did make friends with the Coloured girls in class…apartheid must have
been functioning now that I think of it” (white, male).
Seventy percent (70%) of the entire sample answered that whites, to the exclusion of
other racial groups, participated in sporting and social events:
128
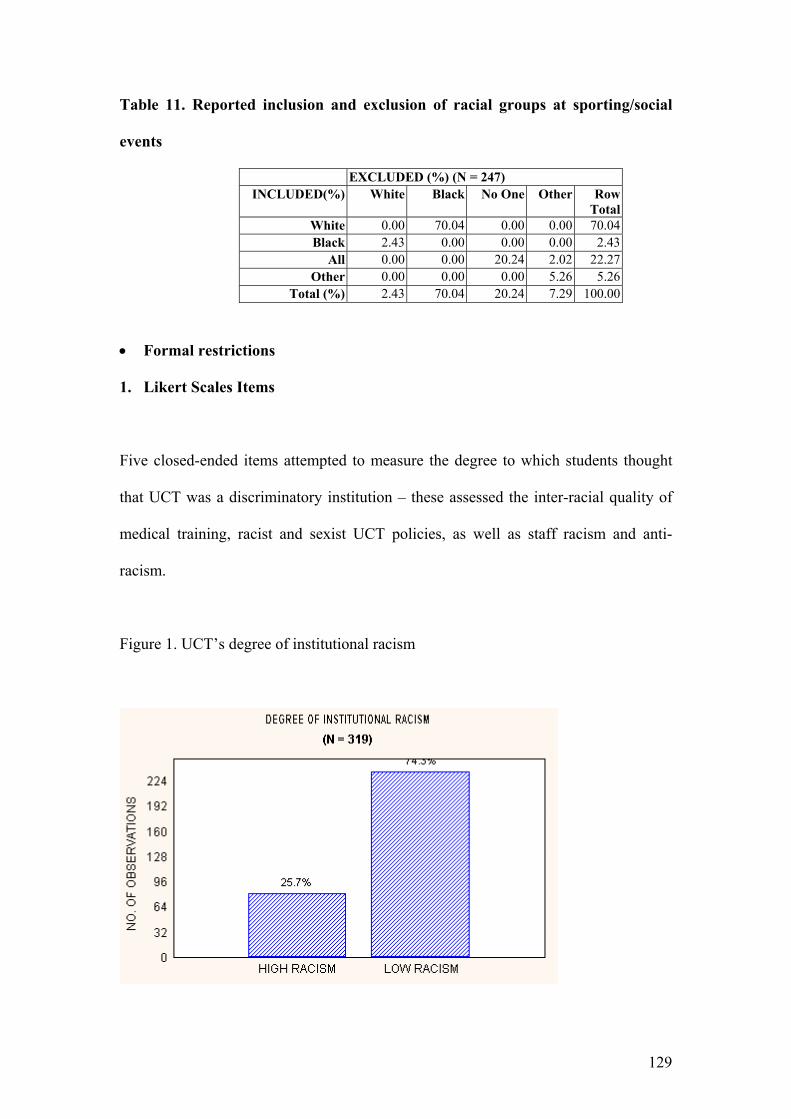
Table 11. Reported inclusion and exclusion of racial groups at sporting/social
events
EXCLUDED (%) (N = 247) INCLUDED(%) White Black No One Other Row
Total White 0.00 70.04 0.00 0.00 70.04 Black 2.43 0.00 0.00 0.00 2.43
All 0.00 0.00 20.24 2.02 22.27 Other 0.00 0.00 0.00 5.26 5.26
Total (%) 2.43 70.04 20.24 7.29 100.00
• Formal restrictions
1. Likert Scales Items
Five closed-ended items attempted to measure the degree to which students thought
that UCT was a discriminatory institution – these assessed the inter-racial quality of
medical training, racist and sexist UCT policies, as well as staff racism and anti-
racism.
Figure 1. UCT’s degree of institutional racism
129
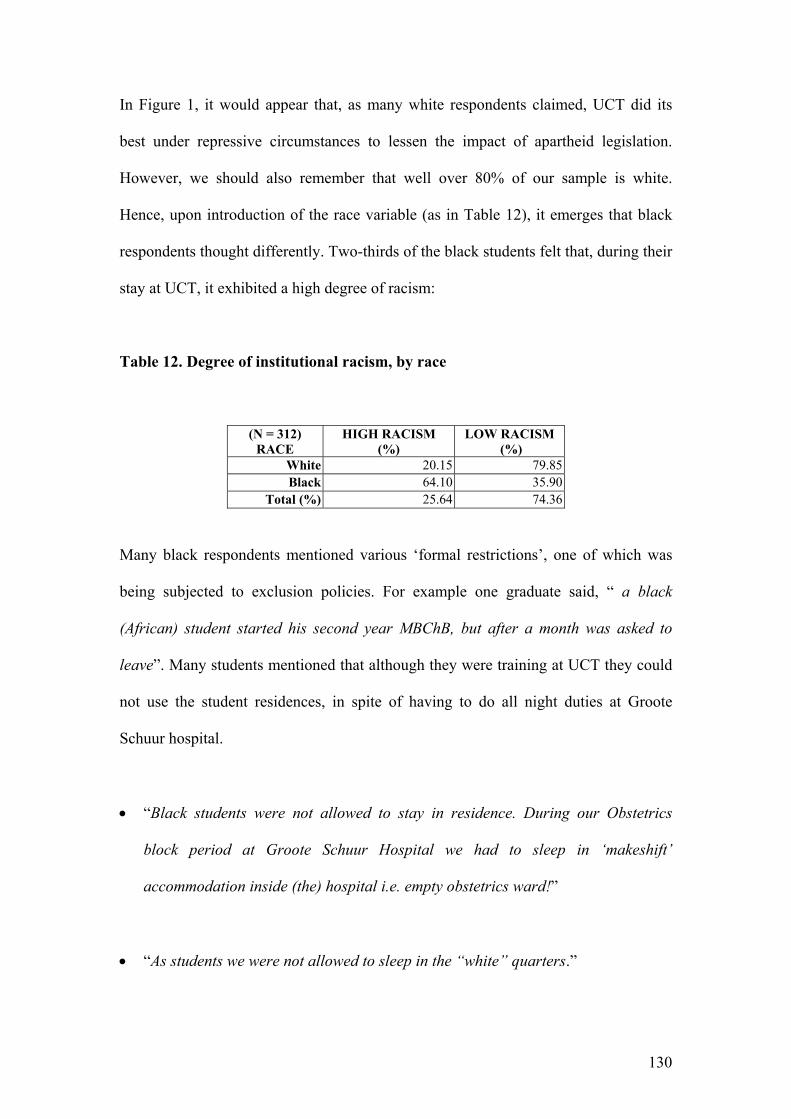
In Figure 1, it would appear that, as many white respondents claimed, UCT did its
best under repressive circumstances to lessen the impact of apartheid legislation.
However, we should also remember that well over 80% of our sample is white.
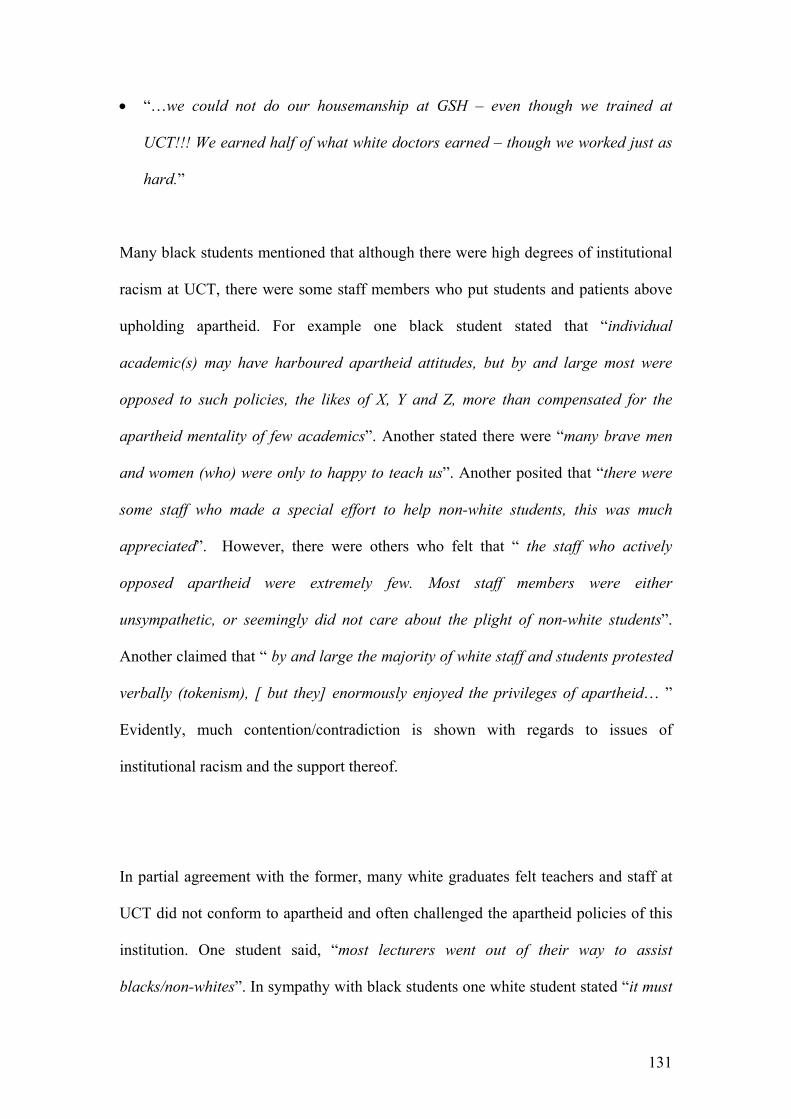
Hence, upon introduction of the race variable (as in Table 12), it emerges that black
respondents thought differently. Two-thirds of the black students felt that, during their
stay at UCT, it exhibited a high degree of racism:
Table 12. Degree of institutional racism, by race
(N = 312) RACE
HIGH RACISM (%)
LOW RACISM (%)
White 20.15 79.85 Black 64.10 35.90
Total (%) 25.64 74.36
Many black respondents mentioned various ‘formal restrictions’, one of which was
being subjected to exclusion policies. For example one graduate said, “ a black
(African) student started his second year MBChB, but after a month was asked to
leave”. Many students mentioned that although they were training at UCT they could
not use the student residences, in spite of having to do all night duties at Groote
Schuur hospital.
• “Black students were not allowed to stay in residence. During our Obstetrics
block period at Groote Schuur Hospital we had to sleep in ‘makeshift’
accommodation inside (the) hospital i.e. empty obstetrics ward!”
• “As students we were not allowed to sleep in the “white” quarters.”
130
• “…we could not do our housemanship at GSH – even though we trained at
UCT!!! We earned half of what white doctors earned – though we worked just as
hard.”
Many black students mentioned that although there were high degrees of institutional
racism at UCT, there were some staff members who put students and patients above
upholding apartheid. For example one black student stated that “individual
academic(s) may have harboured apartheid attitudes, but by and large most were
opposed to such policies, the likes of X, Y and Z, more than compensated for the
apartheid mentality of few academics”. Another stated there were “many brave men
and women (who) were only to happy to teach us”. Another posited that “there were
some staff who made a special effort to help non-white students, this was much
appreciated”. However, there were others who felt that “ the staff who actively
opposed apartheid were extremely few. Most staff members were either
unsympathetic, or seemingly did not care about the plight of non-white students”.
Another claimed that “ by and large the majority of white staff and students protested
verbally (tokenism), [ but they] enormously enjoyed the privileges of apartheid… ”
Evidently, much contention/contradiction is shown with regards to issues of
institutional racism and the support thereof.
In partial agreement with the former, many white graduates felt teachers and staff at
UCT did not conform to apartheid and often challenged the apartheid policies of this
institution. One student said, “most lecturers went out of their way to assist
blacks/non-whites”. In sympathy with black students one white student stated “it must
131
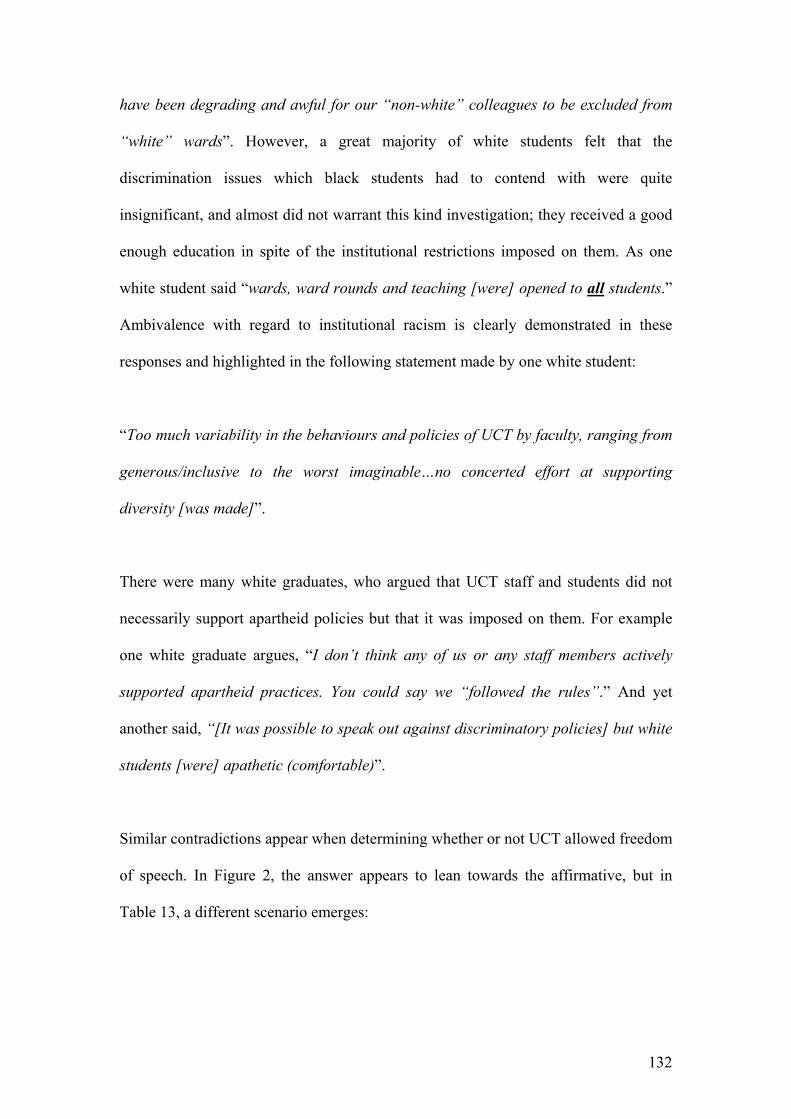
have been degrading and awful for our “non-white” colleagues to be excluded from
“white” wards”. However, a great majority of white students felt that the
discrimination issues which black students had to contend with were quite
insignificant, and almost did not warrant this kind investigation; they received a good
enough education in spite of the institutional restrictions imposed on them. As one
white student said “wards, ward rounds and teaching [were] opened to all students.”
Ambivalence with regard to institutional racism is clearly demonstrated in these
responses and highlighted in the following statement made by one white student:
“Too much variability in the behaviours and policies of UCT by faculty, ranging from
generous/inclusive to the worst imaginable…no concerted effort at supporting
diversity [was made]”.
There were many white graduates, who argued that UCT staff and students did not
necessarily support apartheid policies but that it was imposed on them. For example
one white graduate argues, “I don’t think any of us or any staff members actively
supported apartheid practices. You could say we “followed the rules”.” And yet
another said, “[It was possible to speak out against discriminatory policies] but white
students [were] apathetic (comfortable)”.
Similar contradictions appear when determining whether or not UCT allowed freedom
of speech. In Figure 2, the answer appears to lean towards the affirmative, but in
Table 13, a different scenario emerges:
132
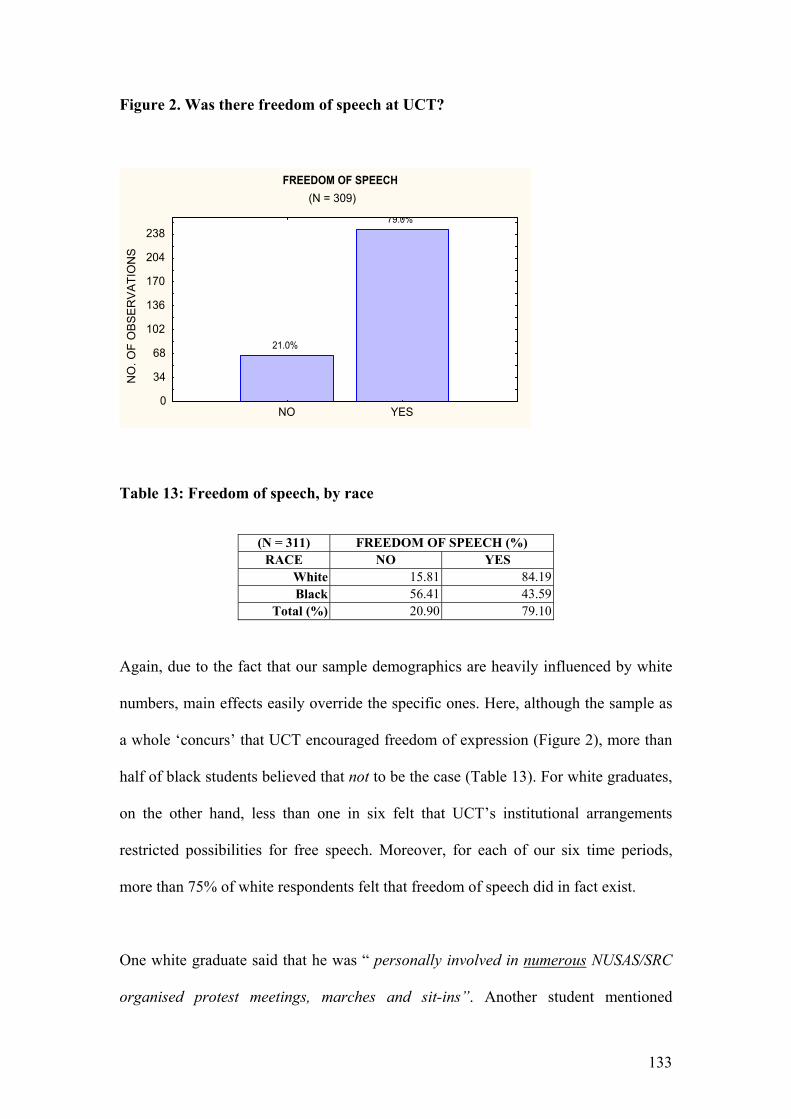
Figure 2. Was there freedom of speech at UCT?
FREEDOM OF SPEECH(N = 309)
NO
. OF
OB
SE
RV
ATI
ON
S
21.0%
79.0%
0
34
68
102
136
170
204
238
NO YES
Table 13: Freedom of speech, by race
(N = 311) FREEDOM OF SPEECH (%) RACE NO YES
White 15.81 84.19Black 56.41 43.59
Total (%) 20.90 79.10
Again, due to the fact that our sample demographics are heavily influenced by white
numbers, main effects easily override the specific ones. Here, although the sample as
a whole ‘concurs’ that UCT encouraged freedom of expression (Figure 2), more than
half of black students believed that not to be the case (Table 13). For white graduates,
on the other hand, less than one in six felt that UCT’s institutional arrangements
restricted possibilities for free speech. Moreover, for each of our six time periods,
more than 75% of white respondents felt that freedom of speech did in fact exist.
One white graduate said that he was “ personally involved in numerous NUSAS/SRC
organised protest meetings, marches and sit-ins”. Another student mentioned
133
(political) meetings and discussions at fellow students’ digs. Others claimed that
although “it was possible…[it] invited the attention of the security police therefore [it
was] unwise”. The fear of police interrogation seemed to be a real threat for many
students who may have wanted to speak out. As one student stated it was not possible
to speak out against discriminatory policies due to the threat of “house arrests,
detention without trial and harassment by security police…”.
One white graduate claims that “most attempts were blocked by “it’s the Law”’.
However, it was evident that one or two persons could and did make a difference in
spite of the law, as well as the risk of losing their livelihoods.
Another graduate mentioned “although most people, if asked, would have denied
supporting apartheid policies and practices, they would not have shouted it from the
rooftops”. Fear of police brutality and government retaliation seemed to have been the
dominant motivation for not speaking out against discrimination at UCT, this applies
to most white graduates as well as to many black graduates.
Gender disparities regarding freedom of expression were detected, with 9% more
women than men (28% versus 19%) feeling that such a freedom was restricted –
however, this difference was not statistically significant (χ2 (1) = 2.98; p > 0.05).
Hence, although possibilities for free speech may have existed, to actually utilise this
freedom is an entirely different matter. Still, in spite of reported activities of the
security police, veiled threats of expulsion and fears of victimisation, many staff
members, particularly the oft-cited Professor Hoffenberg, spoke out against
134
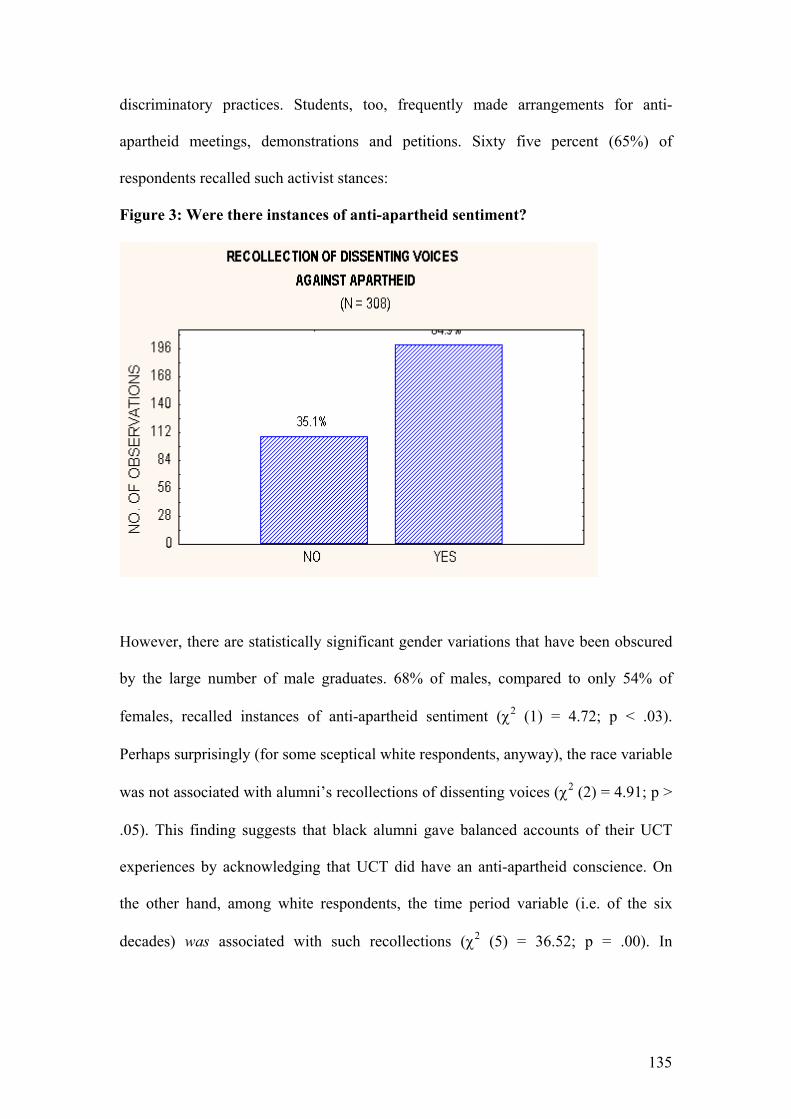
discriminatory practices. Students, too, frequently made arrangements for anti-
apartheid meetings, demonstrations and petitions. Sixty five percent (65%) of
respondents recalled such activist stances:
Figure 3: Were there instances of anti-apartheid sentiment?
However, there are statistically significant gender variations that have been obscured
by the large number of male graduates. 68% of males, compared to only 54% of
females, recalled instances of anti-apartheid sentiment (χ2 (1) = 4.72; p < .03).
Perhaps surprisingly (for some sceptical white respondents, anyway), the race variable
was not associated with alumni’s recollections of dissenting voices (χ2 (2) = 4.91; p >
.05). This finding suggests that black alumni gave balanced accounts of their UCT
experiences by acknowledging that UCT did have an anti-apartheid conscience. On
the other hand, among white respondents, the time period variable (i.e. of the six
decades) was associated with such recollections (χ2 (5) = 36.52; p = .00). In
135
particular, white graduates of the sixties (81%) and seventies (73%) recalled relatively
more instances of opposition to apartheid than those of any other decade.
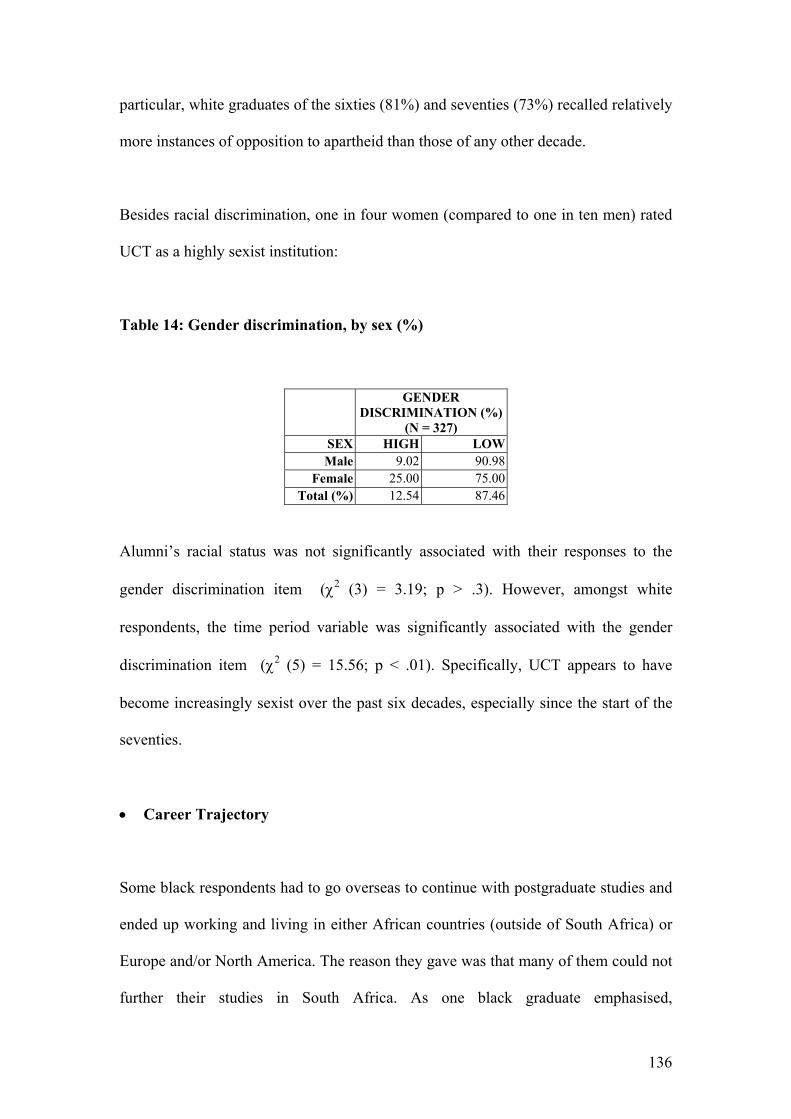
Besides racial discrimination, one in four women (compared to one in ten men) rated
UCT as a highly sexist institution:
Table 14: Gender discrimination, by sex (%)
GENDER DISCRIMINATION (%)
(N = 327) SEX HIGH LOWMale 9.02 90.98
Female 25.00 75.00Total (%) 12.54 87.46
Alumni’s racial status was not significantly associated with their responses to the
gender discrimination item (χ2 (3) = 3.19; p > .3). However, amongst white
respondents, the time period variable was significantly associated with the gender
discrimination item (χ2 (5) = 15.56; p < .01). Specifically, UCT appears to have
become increasingly sexist over the past six decades, especially since the start of the
seventies.
• Career Trajectory
Some black respondents had to go overseas to continue with postgraduate studies and
ended up working and living in either African countries (outside of South Africa) or
Europe and/or North America. The reason they gave was that many of them could not
further their studies in South Africa. As one black graduate emphasised,
136
“APARTHEID drove me away”. Another stated: “[I] was refused training in
paediatrics at UCT and Red Cross Hospital…. [I] trained in UK, returned to UCT in
1976 and sent to Somerset hospital. [I] was allowed to run a clinic at Red Cross
Hospital, but was refused office in ICH building”. Most of the black graduates who
trained at UCT mainly mentioned Somerset Hospital as the place where they were
allowed to do their internship, since they were prevented from doing this training at
Red Cross and Groote Schuur hospital.
Some of those who left South Africa for further studies got married to foreign white
partners and therefore, due to the Mixed Marriages Act, could not return to live in
South Africa with their spouses. For example, “ I came to the UK for postgraduate
study. When I got married in 1950 I could not return to South Africa because of the
Mixed Marriages law”. These were particularly cases from the first two eras, 1945-
1959 and 1960 – 1985, which the current research covers. A few black graduates
ended up working in various hospitals in South Africa, and others working in rural
community clinics, or as general practitioners in communities, which they often grew
up in. An example of this is, “[I work in] Rylands, Cape Flats. The community
required my service as a medical practitioner…[the circumstances, which led me to
be here was] Group Areas act”.
Compared to their black counterparts, it becomes apparent that most white graduates
had much more freedom of choice in terms of continuing their studies in South Africa
at an institution of their own choosing and/or going overseas to do this. Moreover, it
appears as if most white graduates had the option of doing their internship at various
137
South African provincial hospitals including Somerset, Red Cross and Groote Schuur
hospitals, and many currently continue to work at these institutions.
Some white respondents moved to a foreign, usually European or North American,
country. Most of them did so by choice. As one said “I left Africa out of my own free
will”.
It seems as though quite a few white graduates’ reasons for studying overseas were
politically motivated, although the circumstances, which underpinned their decision,
were different as opposed to their fellow black students. As one said “After studying
in UK [I] decided against returning to ZA – 1973- could not see a way forward given
the politico-economic situation in ZA at the time – and feeling powerless in face of
it”.
Another pointed out “ [After graduation I] specialised at Groote Schuur, emigrated
to UK… [I now work in the] UK…[the circumstances which lead me to being here
was the] local socio-political situation (in South Africa).”
138
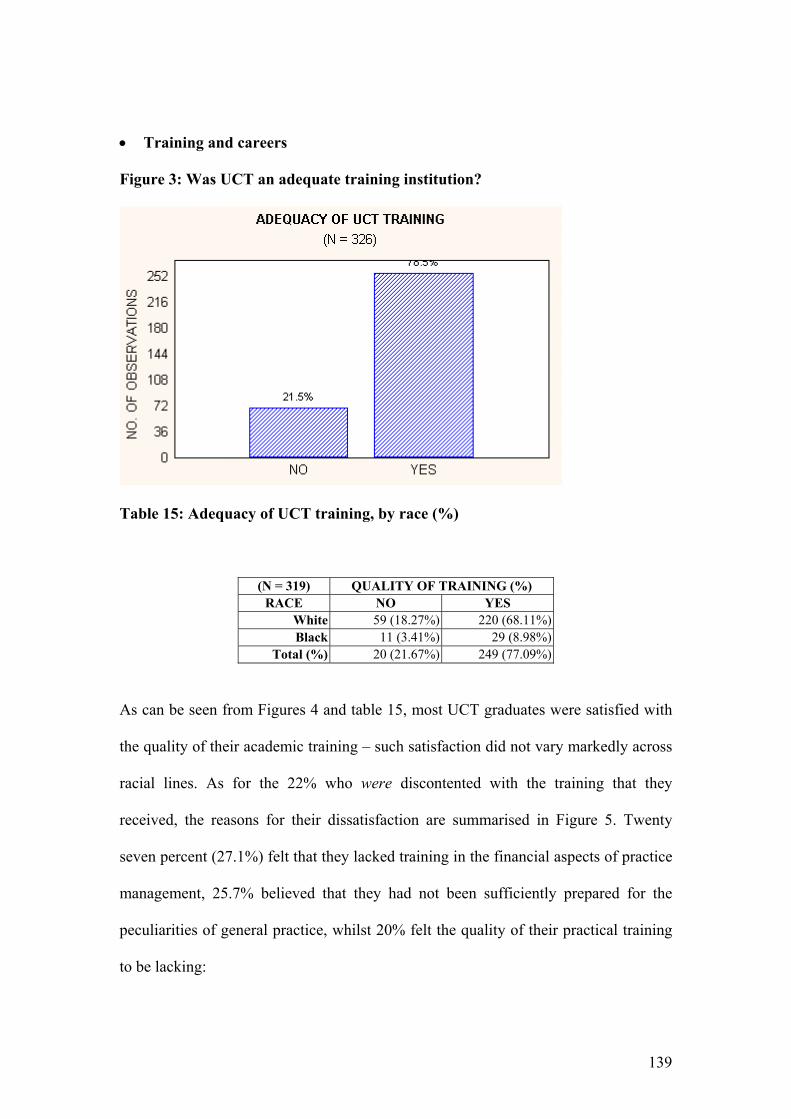
• Training and careers
Figure 3: Was UCT an adequate training institution?
Table 15: Adequacy of UCT training, by race (%)
(N = 319) QUALITY OF TRAINING (%) RACE NO YES
White 59 (18.27%) 220 (68.11%)Black 11 (3.41%) 29 (8.98%)
Total (%) 20 (21.67%) 249 (77.09%)
As can be seen from Figures 4 and table 15, most UCT graduates were satisfied with
the quality of their academic training – such satisfaction did not vary markedly across
racial lines. As for the 22% who were discontented with the training that they
received, the reasons for their dissatisfaction are summarised in Figure 5. Twenty
seven percent (27.1%) felt that they lacked training in the financial aspects of practice
management, 25.7% believed that they had not been sufficiently prepared for the
peculiarities of general practice, whilst 20% felt the quality of their practical training
to be lacking:
139
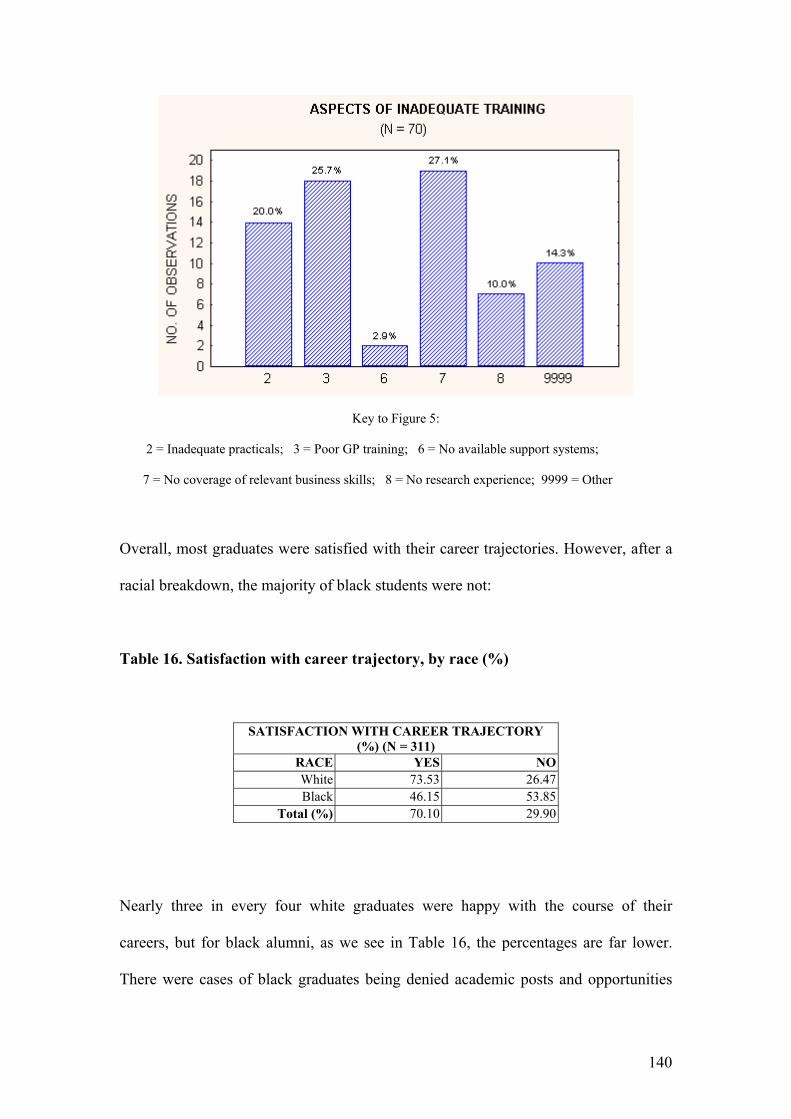
Key to Figure 5:
2 = Inadequate practicals; 3 = Poor GP training; 6 = No available support systems;
7 = No coverage of relevant business skills; 8 = No research experience; 9999 = Other
Overall, most graduates were satisfied with their career trajectories. However, after a
racial breakdown, the majority of black students were not:
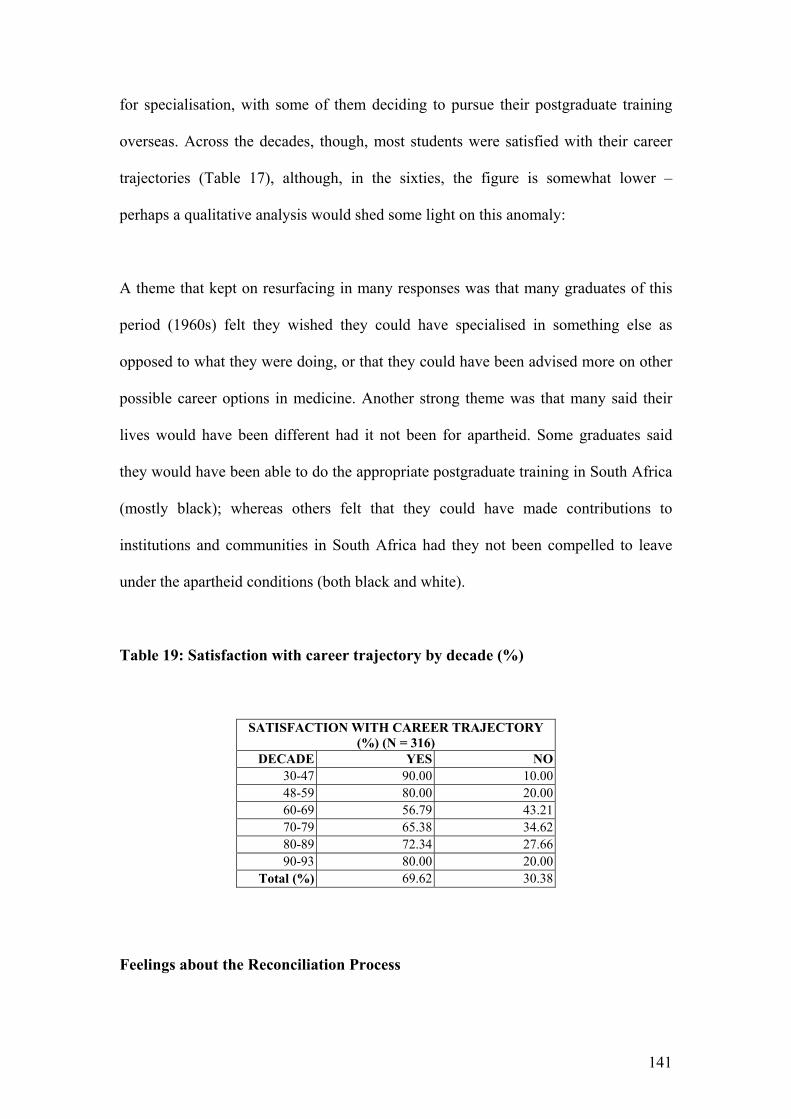
Table 16. Satisfaction with career trajectory, by race (%)
SATISFACTION WITH CAREER TRAJECTORY (%) (N = 311)
RACE YES NOWhite 73.53 26.47Black 46.15 53.85
Total (%) 70.10 29.90
Nearly three in every four white graduates were happy with the course of their
careers, but for black alumni, as we see in Table 16, the percentages are far lower.
There were cases of black graduates being denied academic posts and opportunities
140
for specialisation, with some of them deciding to pursue their postgraduate training
overseas. Across the decades, though, most students were satisfied with their career
trajectories (Table 17), although, in the sixties, the figure is somewhat lower –
perhaps a qualitative analysis would shed some light on this anomaly:
A theme that kept on resurfacing in many responses was that many graduates of this
period (1960s) felt they wished they could have specialised in something else as
opposed to what they were doing, or that they could have been advised more on other
possible career options in medicine. Another strong theme was that many said their
lives would have been different had it not been for apartheid. Some graduates said
they would have been able to do the appropriate postgraduate training in South Africa
(mostly black); whereas others felt that they could have made contributions to
institutions and communities in South Africa had they not been compelled to leave
under the apartheid conditions (both black and white).
Table 19: Satisfaction with career trajectory by decade (%)
SATISFACTION WITH CAREER TRAJECTORY (%) (N = 316)
DECADE YES NO30-47 90.00 10.0048-59 80.00 20.0060-69 56.79 43.2170-79 65.38 34.6280-89 72.34 27.6690-93 80.00 20.00
Total (%) 69.62 30.38
Feelings about the Reconciliation Process
141
White respondents constantly pointed out that the past was precisely that: passe. Some
even considered this project to be a waste of money since UCT was embarking on a
journey of “self-flagellation” and “navel-gazing”. Following is a selection of
comments made by white respondents:
• “There has been enough apologising! I am tired of racism being attributed only to
the whites and apartheid. Racism is at present practised by all societies –
acknowledge it!” (white female)
• “UCT should never be ashamed of itself. Life in SA is bad enough with everybody
else crawling around on their hands and knees.” (white female)
• “… the past is gone. We are all guilty by default of having been there but that has
been declared over and again. Let’s move on. Nelson has done so, why can’t we?
It won’t change what has happened; it just keeps the angst alive.” (white female)
• “It is fatuous to apologise for the wrongdoings of preceding generations.” (white
male)
• “I think one should let the past R.I.P.” (white male)
• “Let us consign this politically correct bullshit to the dustbin where it belongs and
hold our heads high!” (white male)
142
In fact, one (white male) respondent went as far as to label the efforts towards
Reconciliation as being (reverse) racism, that should provoke ‘outrage’ and ‘disgust’:
• “It is heartbreaking to see the University now supporting racism in every facet of
its present workings, let along this pointless piece of public self-flagellation. I
hope that many alumni to whom I have spoken join me in expressing disgust and
outrage at this absurd project.”
But we must also not overlook the sentiments of some white alumni who regard the
reconciliation process in a positive light:
• “Congratulations on initiating a very necessary project.” (white male)
• “Thank you for this opportunity – it brings back many very bad memories.”
(white female)
• “I do believe reconciliation is important, and we all need to work together for a
better future.” (white male)
Interestingly, Chi-square analyses revealed that the responses of white alumni
regarding the need for an official apology were strongly associated with their Likert-
scale ratings of UCT racism (χ2 (2) = 13.04; p < .01). Of those white respondents who
felt that racism was not prominent at UCT, 67% did not see the need for a Faculty
meeting – as for those who rated UCT racism as significant, 58% believed that a
Faculty meeting was in order. In other words, the mere fact that the majority of white
143
graduates do not support the idea of holding a Faculty assembly does not mean that
they are attempting to muffle some or other “racist” history. On the contrary, their
reluctance to support such an assembly is consistent with their opinions regarding the
historical presence of racism at UCT.
For black colleagues, we get a similar sense of the significance of a Faculty assembly,
namely one of urgency yet trepidation. But for others, there is a sense that any attempt
at reparation is an exercise in futility. Moreover, several black graduates share the
sentiments of their white counterparts in commenting that the past is done. Here are
some responses:
• “Thanks for the opportunity to respond in this way. Students of my generation had
a hard time but were responsible, disciplined and committed.” (black male)
• “It is regrettable that action to rectify the wrongs of the apartheid years at UCT is
only being taken now. Many of the medical students who were subjected to the
discriminatory practices are now deceased.” (black male)
• “Many unpleasant memories may be repressed/forgotten. [I am] not sure whether
I want to open that Pandora’s box of emotion and pain.” (black female)
• “It [an assembly] will give graduates an opportunity to publicly recognise… those
who stimulated and gave a helping hand to the underprivileged UCT students.”
(black male)
144
The sense one gets is that black graduates do not view a potential assembly as an
opportunity to parade whatever bitterness they may harbour – it appears that the
significance of a Faculty meeting may rather reside in its ability to close a salient
chapter in the lives of many people. As one black participant phrases it:
• “I do not expect retribution from those who now hold the reins…. Humiliating
those who were not responsible for the acts of the past will serve no purpose, give
no satisfaction, produce no closure. It would only plant bitter seeds of lingering
hate and ultimate[ly] discord. Restitution should embody understanding and
compassion for those who seek redemption and those who were the victims of
racial discord and avarice.” (black male)
Discussion
It is clear that, on average, black students at UCT Medical School experienced great
difficulty and hardship under the apartheid regime. They felt that they were relatively
less prepared for a tertiary education at UCT, and they were denied access to
university residences, social events, white patients and even white cadavers, amongst
other things. For students of colour, UCT was a racist institution, and for some, its
policies impacted negatively on their careers. Still, regardless of race, many students
acknowledged that some staff members were outspoken critics of the apartheid
regime.
Some respondents felt that the wording of certain items in the questionnaire presumed
that UCT was guilty of some or other transgression, and hence, some respondents
145
refused to complete the questionnaire. One respondent even remarked that, since the
Reconciliation Project (i.e. the questionnaire) assumed that UCT had a racist past, it
prevented itself “from having any scientific or historical benefit at all.” Another
respondent indicated his intention not to complete the questionnaire because the
subject was passé and a waste of money, a view he claimed to share with other
medical colleagues, of both “white and non-white skin colour.” It is quite possible,
then, that the particularly low response rate may have had something to do with the
bias that pervades the questionnaire – and certainly, we may have lost potentially
illuminating data in the process.
Nonetheless, the survey provides useful insights into a cross-section of respondents,
and when viewed in the context of the findings of the other chapters, provides a
consistent picture of how the institution could be both racist and have individuals who
opposed racism in its profile.
References:
Babbie, E. & Mouton, J. (2001). The practice of social research. Oxford: Oxford
University Press.
Rust, J. & Golombok, S. (1989). Modern psychometrics. London: Routledge.
146