Embed Size (px)
Citation preview
71
CHAPTER 4: The Moderating Effect of Individual Values on the Relationship between Value Congruence and Outcomes
“It is not hard to make decisions
Once you know what your values are”
- Roy E. Disney-
4.1 Introduction
The first empirical chapter focuses on value congruence in light of individual values. It
extends previous work by examining whether value congruence, as a dimensional
concept, is associated more strongly with work engagement, emotional exhaustion,
affective commitment and productivity than employees’ individual values. In addition,
it examines the moderating effect of these individual values on value congruence. While
the review of the literature revealed that value congruence is associated with employee
behavior and attitudes (Tomlinson, Lewicki, & Ash, 2014), most studies were
undertaken in a single company. It is therefore unclear whether the alignment between
individual and organizational values makes employees equally more engaged, less
exhausted, more committed, and more productive in a multinational operating
environment. The effect of (national) culture has taken a prominent place in recent
studies (Nwadei, 2003; Pickworth, 2005; Hauff, Richter & Tressin 2014; Hon & Leung,
2011; Lertxundi & Landeta, 2011; Webster & White, 2010), showing a significant
effect on value congruence, but on different outcome variables (such as role stressors,
organizational commitment, or intention to leave). Based on the description above, this
chapter presents the results of the analysis in different steps. The first comprises the
correlations between value congruence respectively individual values on work
engagement, emotional exhaustion, affective commitment, and productivity. The second
involves regression analyses of the combined effect of value congruence and individual
values and the interaction effect (moderation) of individual values on the relationship
between value congruence and the outcome variables. Also, an in-depth analysis is
provided to examine whether the moderation effect depends on the value level (low,
mean, high) of the moderator variable ‘individual values’. The third step considers the
influence of national location on the relationship of value congruence, individual values
and outcome variables, as well as the interaction effect of individual values on this
relationship. The research instrument used for this study, details about the sample, the

72
response rate, the data collection procedure and the analytical approach applied were
described previously in Chapter 3.
4.2 Hypotheses
In chapter 2.8 conceptual framework seven hypotheses were formulated on the basis of
an extensive literature review. In this chapter, the first four hypothesizes will be tested:
Hypothesis 1: Value Congruence is positively associated with (a) Work Engagement, (c)
Affective commitment, and (d) Productivity - but negatively with (b) Emotional
exhaustion.
This hypothesis attempt to contribute to the literature by supporting the findings of other
researcher that a high level of engagement shows positive emotions and are
psychologically and physically healthier resulting in increased performance (Bakker,
Schaufeli, Leiter & Taris, 2008). The study done by Halbesleben (2010) provides
evidence that work engagement is negatively related to burnout and correlates strongly
negative with exhaustion. Moreover, the study revealed that engagement is positively
associated with outcomes at work such as organizational commitment, performance,
health, and turnover intention. In support of this Schaufeli (2014) suggests that
individuals who are high on engagement are low on burnout - hence the controversy.
Furthermore, he confirms the findings of Halbesleben by citing several researchers (e.g.
Hakanen et al., 2008a and Boyd et al., 2011), who explored that a high level of
engagement leads to increased organizational commitment. Therefore, there is a
correlation between work engagement, emotional exhaustion, affective commitment and
productivity.
Hypothesis 2: Individual Values are more strongly associated with (a) Work
Engagement, (b) Emotional Exhaustion, (c) Affective Commitment, and (d) Productivity
than Value Congruence.
Individual values are self-rated values representing either guiding principles of one’s
life to satisfy needs (Schwartz, 1992, 1993, 2006) or referring to the guiding principles
of an organization. As such individual values influence people’s behavior attitude and

73
helps to differentiate between what is right from wrong (Hultman & Gellerman, 2002;
Longenecker, 2013; Schwartz & Bilsky, 1987, Schwartz 1992, 1993, 2006). Individual
values on a group level reflect the culture of a particular nation but also the culture of an
organization. As there is no empirical evidence that individual values focusing on
organizational needs are a stronger predictor of outcomes for the individuals and for the
organization compared to value congruence the above hypothesis is proposed.
Moreover, international enterprises employ employees with different value systems and
different team patterns (Wherry, 2012). Collectively, this hypothesis aims to investigate
if an organization demonstrates different shared pattern of values and behaviors which
is then the main predictor to increase the level of work engagement, reduce emotional
exhaustion, increase affective commitment, and productivity.
Hypothesis 3: Value Congruence is still related to (a) Work Engagement, (b) Emotional
Exhaustion, (c) Affective commitment, and (d) Productivity when Individual Values are
taken into account.
Hypothesis 4: The effect of Value Congruence on (a) Work Engagement, (b) Emotional
Exhaustion, (c) Affective Commitment, and (d) Productivity depends on (is moderated
by) the level of Individual Values.
At this point, it was argued that value congruence or individual values are associated
with work engagement, emotional exhaustion, affective commitment or productivity.
Equipped with this research findings, Hypothesis 3 and 4 aims to investigate 1) the joint
effect of value congruence and individual value dimensional on the relationship
between outcome variables 2) the moderating effect of individual value on these
relationships. As such, a moderation effect indicates when enhancing individual value,
the effect of the predictor (value congruence) on outcome variable would increase
simultaneously. The other effect would be when enhancing individual value, the effect
of the predictor on outcome variable would decrease. Lastly when increasing the
moderator (individual value) would reverse the effect of the predictor on outcomes.
Based on this it would explain why work engagement, emotional exhaustion, affective
commitment or productivity is predicted by value congruence.

74
In addition to the defined hypothesis, different exploratory analysis will be applied to
get an answer on the cultural effect, because it has been noticed that the effect of culture
has taken a prominent place in recent studies (Hauff, Richter & Tressin 2014; Hon &
Leung, 2011; Nwadei, 2003; Pickworth, 2005; Lertxundi & Landeta, 2011; Webster &
White, 2010) and the attention of researchers increased to explore the effect of national
culture on HRM practices and the relationship to some outcomes (e.g. Brewster &
Bennett, 2010; Klassen et al., 2012; Lertxundi & Landeta, 2011; Lee & Sukoco, 2010;
Taipale, Selander & Anttila, 2010; Webster & White, 2010). Therefore, this study
explored whether the effect of Value Congruence and Individual Values on (a) Work
Engagement, (b) Emotional Exhaustion, (c) Affective Commitment, and (d) Productivity
varies between national cultures, secondly if for each national culture the effect of
Value Congruence on and (a) Work Engagement, (b) Emotional Exhaustion, (c)
Affective Commitment, and (d) Productivity is moderated by individual values
4.3 Value Congruence, Individual Values and Outcomes
Pearson’s correlation coefficients were obtained to explore associations between
variables and the summary of the correlations is presented in Table 4.
Table 4: Correlation Analysis predicting individual and organizational outcome by value congruence or individual values. Means, and Standard Deviations for all variables
Note. *p < .05. **p < .01. Value Congruence score (reversed) 0 = low congruence, 4 = high congruence. Individual value score 1 = highly unimportant, score 5 = highly important.
Affective Commitment
frequency intensity frequency intensity
Variables M SD
ValueCongruence -.13* -.19** -.11 -.05 .24** .16** .53 .58
n 298 298 300 298 297 297 300
Individual Values -.19** -.21** .24** .30** .30** .22** 4.61 .37
n 299 299 301 299 298 298 301Outcome Variables Emotional Exhaustion _Frequency -.26** -.26** -.29** -.24** 1.17 .70 n 303 Emotional Exhaustion _Intensity -.16** -.09 -.33** -.21** 1.26 .78 n 303 Engagement _Frequency .49** .46** 2.84 .82 n 305 Engagement _Intensity .39** .46** 2.56 .78 n 303 Affective Commitment .47** 3.46 .71 n 302 Productivity 3.86 .51 n 302
Emotional Exhaustion Work Engagement Productivity

75
As mentioned earlier in Chapter 3.7 value congruence was computed as the
average score of the absolute difference between two entities where a low score is
related to high value congruence and a high score to low value congruence. These raw
scores were, however, reversed in chapters 4 and 5 to facilitate interpretation and
discussion. Based on this, it becomes clear why value congruence shows a significant
negative correlation with emotional exhaustion. That is, a lower score, which implies
lower Value Congruence, is associated with a higher emotional exhaustion (r = -.13, p <
.05 and r = -.19, p < .01). Conversely, a higher score, which reflects a higher Value
Congruence, is associated with a higher affective commitment (r =.24, p < .01) and a
higher productivity (r =,16, p < .01). A reverse (but not significant) association was
found between value congruence and work engagement, where a lower score (i.e., lower
value congruence) is associated with a higher engagement (r = -.11, and r = -.05).
The correlations between Individual Values and the four outcome variables
display a significant negative association with emotional exhaustion (r = -.19, p < .01
and r = -.21, p < .01), which implies that participants who score higher on individual
values are also less emotionally exhausted. In addition, a significant positive association
can be observed with engagement, (r =- .24, p < .01 and r = .30, p < .01), affective
commitment, (r = .30, p < .01), and productivity, (r = , 22, p < .01).
These findings can be explained as follows: (1) a higher fit between individual
values and organizational values is associated with a lower emotional exhaustion; and
(2) a higher fit between individual values and organizational values is associated with a
higher commitment and a higher productivity. Moreover, no significant association was
found between value congruence and work engagement. When individual values are
considered, however, a significant association is found between individual values and
all four outcome variables. Whereas the correlation coefficients of individual values are
all higher than their equivalents for value congruence, a test of the difference between
the correlation coefficients (Fisher’s r-to-z transformation) shows that these differences
are not significant.
Further analysis shows a significant and negative association between emotional
exhaustion “frequency” and work engagement (both on “frequency” and “intensity”),
affective commitment and productivity. Work engagement is significantly correlated
with affective commitment and productivity. Thus, more exhausted employees perceive
lower levels of work engagement, loyalty and productivity. More engaged employees
perceive higher levels of commitment and productivity. A finding to be highlighted is

76
that work engagement and affective commitment display a significant and medium
positive correlation with productivity.
In sum, Hypothesis 1 is partially supported as there is a significant association
between value congruence and emotional exhaustion, affective commitment and
productivity, but not with work engagement. Whereas individual values are more
strongly associated with engagement, emotional exhaustion, affective commitment, and
productivity than value congruence, Hypothesis 2 is not supported since the differences
between the correlation coefficients are not significant. Table 5 provides an overview of
the hypotheses tested.
Table 5: Summary Result Hypothesis 1 and 2
Hypothesis Result
H1: Value Congruence is positively associated with (a) Work Engagement, (c) Affective Commitment, and (d) Productivity - but negatively with (b) Emotional Exhaustion.
Partially Supported
H1a. Value Congruence is positively associated with work engagement. H1b.Value Congruence is negatively associated with emotional exhaustion. H1c. Value Congruence is positively associated with affective commitment. H1d. Value Congruence is positively associated with Productivity -
Not supported Supported Supported Supported
H2. Individual Values are more strongly associated with (a) Work Engagement, (b) Emotional Exhaustion, (c) Affective Commitment, and (d) Productivity than Value Congruence.
Not Supported
4.4 Effects of Individual Values on the Relationship between Value Congruence and Outcomes
Regression analysis was used to test whether value congruence correlated with outcome
variables while taking into account the individual values. The aim of this analysis was
to consider the effect of the interaction between individual value and value congruence
on emotional exhaustion, engagement, affective commitment, and productivity. For
each outcome (criterion) variable, a hierarchical regression analysis was conducted with
each analysis consisting of three steps. In the first step of the regression model, value
congruence was added as the only predictor. In the second step, self-rated values
(individual values) were taken into account. In the third step, the interaction term
between value congruence and individual values was added to see if, and to what extent,

77
the effect of value congruence on the outcome variables is moderated by the level of
individual values.
Standard multiple regression procedures only considered the interaction effect as
a whole, but do not specify the effect of one predictor (in this case value congruence)
while the criterion variable depends on a specific value of another predictor (self-rated
values). To combat this problem simple slope analysis was performed with the program
PROCESS (Hayes, 2012). This allows for probing for specific regions of individual
value for which the strength (and/or direction) of the effect of congruence on an
outcome variable changes. This regression analysis typically breaks down the
continuous moderator variable into three new values (mean, one standard deviation
above the mean, and one below the mean). At each of these three values it computes the
size and significance of the effect of the other predictor (value congruence) on to the
outcome variables (emotional exhaustion frequency and intensity, engagement
frequency and intensity, affective commitment, and productivity).
PROCESS also helps to interpret a possible moderation effect by providing
estimated data for the three different situations (which will be used to plot and visualize
the findings).
Since PROCESS makes use of bootstrap samples for estimations, there is no
need to rely on (often violated) assumptions like linearity, normality, and
homoscedasticity. However due to the use of standard regression analyses, initial
assumption checks were performed regarding these assumptions and extreme
(multivariate) outliers (standardized residual larger than 3.30) were removed.
Prior to running all regression analyses, the predictor variables were centered.
Centering a variable entails subtracting the variable’s mean from each subjects value on
that variable. The transformed (centered) variable will have a mean of zero but will still
have the same standard deviation. Centering independent variables is a common
approach and is necessary when an interaction term is included in the model. With
uncentered variable, the value zero for a particular variable is often meaningless when
subjects do not have values around zero. Since the intercept (or constant) in a regression
model is (and should be) interpreted as the predicted value of the outcome variable
when all predictor values are (set to) zero, the intercept is meaningless because it is an
estimate for subjects who do not exist. Multicollinearity can be especially problematic
when interaction terms are included in a model with uncentered variables. Additionally,
a centered score is also more directly interpretable. Here the negative values on a

78
centered variable means that the subject scores below average, while positive values
mean that the participant scores above average. A value of zero indicates that a subject’s
score is exactly average. For people who now score zero, the intercept should be
interpreted as the predicted value. Finally, value congruence was reversed in order to
allow higher (more positive) values to correspond with higher values of congruence (or
a better fit between individual values and perceived organizational values) and lower
(more negative) values to correspond with lower values of congruence, indicating a
relatively poorer fit.
4.4.1 Emotional Exhaustion Frequency A hierarchical linear regression was performed in three steps to evaluate the effects of
value congruence, individual value, and their interaction on emotional exhaustion (See
Table 6, next page).
Value congruence, which was entered in the first step, had a significant negative
effect on emotional exhaustion (b = -.20, t (293) = -3.03, p = .003) and accounted for
3.0 percent of the total variation on emotional exhaustion frequency. This result reveals
that relatively higher congruence between individual values and perceived
organizational values were associated with relatively lower scores on emotional
exhaustion frequency. When looking at the value of the slope (b = -.20), one could
conclude that with each increment or difference of one unit on value congruence a drop
(or difference) of .20 on emotional exhaustion is expected. In the second step,
individual value was added to the model as a predictor. This second model, taking into
account both main effects, was a significant improvement compared to the first model
(R2-Change = .03, F(1,292) = 11.86, p = .001). In this second model, which explained
6.8 percent of the total variation on emotional exhaustion frequency, both value
congruence and individual value had a significant negative effect on emotional
exhaustion frequency (respectively: b = -.17, t (292) = -2.68, p = .008 and b = -.35, t
(292) = -3.44, p = 0.001). This finding indicates that adding individual value as a
second predictor led to a decrease in the effect of value congruence on emotional
exhaustion frequency. The result also shows that individual value contributes stronger
to emotional exhaustion frequency than does value congruence when both predictors are
adding to the equation.

79
Table 6: Hierarchical linear regression of emotional exhaustion frequency onto value congruence, individual value and their interaction.
Note. Value Congruence reversed score 0 = low congruence, score 4 = high congruence. Individual value score 1 = highly unimportant, score 5 = highly important.
As such, employees with higher scores on either value congruence or individual
value are more likely to have lower scores on emotional exhaustion. Employees who
score high on both predictors are expected to have even lower scores on emotional
Predictor b SE B β t p
Step 1
Constant 1.13 .04 30.35 < .001 [1.06,1.21]
Value Congruence (centred) -.20 .06 -.17 -3.03 < .001 [-.32,-.07]
R 2 .03F 9.20Δ R 2 .03ΔF 9.20 < .001
Step 2
Constant 1.13 .04 30.90 < .001 [1.06,1.21]
Value Congruence (centred) -.17 .06 -.15 -2.68 < .001 [-.30,-.05]
Individual Values (centred) -.35 .10 -.20 -3.44 < .001 [-.55,-.15]
R 2 .07F 10.70Δ R 2 .04ΔF 11.86 < .001
Step 3
Constant 1.14 .04 30.90 < .001 [1.06,1.21]
Value Congruence (centred) -.15 .07 -.14 -2.33 .02 [-.28,-.02]
Individual Values (centred) -.35 .10 -.19 -3.42 < .001 [-.55,-.15]
Individual Values (centred) X Value Congruence (centred)
-.25 .18 -.08 -1.39 .17
[-.59,-.10]R 2 .07F 7.80Δ R 2 .00ΔF 1.93 .17
Emotional Exhaustion frequency

80
exhaustion frequency. In the last step of the regression analysis, the interaction term was
included in the model to estimate the moderating effect of individual value on the
relationship between value congruence and emotional exhaustion frequency. This third
model was not an improvement on the second model (R2-Change = .01, F(1,291) =
1.93, p = .17). This suggests that individual value does not moderate the relationship
between value congruence and emotional exhaustion frequency. However, if simple
slope analysis is performed, a different interpretation can be found.
Table 7: Interaction effect of individual value on value congruence and emotional exhaustion frequency
Table 7 depicts the conditional effects of value congruence for the three levels of
individual value. For an average level and a high level of individual value the effect of
value congruence was negative and significant (respectively: b = -. 15, p = .03 and b = -
0. 24, p < .001). In general, it can be concluded that employees with high individual
values and high value congruence display the lowest levels of emotional exhaustion
frequency. This means that value congruence only makes a difference on emotional
exhaustion frequency when scores on individual value are relatively higher.
The figure 5 (see next page) demonstrates that the effect of value congruence on
emotional exhaustion frequency depends on the level of an employee’s individual value.
The negative effect of value congruence becomes especially prominent when someone’s
individual value is higher than the mean value (one standard deviation above average).
More precisely, when individual (self-rated) values are high, employees with differing
value congruence scores are likely to differ more on emotional exhaustion frequency as
compared to employees that have lower scores for individual self-rated value. These
employees, with low individual value scores, will most likely not differ on emotional
Individual Value means b se t p
Low -.37 -.06 .13 -.48 .63 [-.32, .19]
Mean .00 -.15 .07 -2.11 .03 [-.29, -.01
High .36 -.24 .08 -2.82 < .001 [-.56, -.08]
Conditional effect of Value Congruence on Emotional Exhaustion Frequency of the moderator of Individual Value

81
exhaustion frequency even when they do differ on value congruence (since value
congruence makes no difference when individual self-values are low).
Figure 5: Simple Slope analysis of the regression of value congruence on emotional exhaustion frequency for three levels of individual value
4.4.2 Emotional Exhaustion Intensity The first step in next analysis explored how value congruence relates to emotional
exhaustion intensity. Results for the hierarchical linear regression are summarized in
table 8 (see next page). From these results it can be seen that value congruence had a
negative effect on emotional exhaustion intensity (b = -.26, t (292) = -3.67, p < .001)
and accounted for 4.4 percent of the total variation of emotional exhaustion intensity.
This indicates that the higher employees’ values are aligned with organizational values
the less likely they are to be emotionally exhausted. Each increase of one unit on the
value congruence scale is associated with a decrease of .26 on emotional exhaustion
intensity. The second step of the hierarchical regression analysis considered individual
value as a second predictor and is a significant improvement on the first model (R2-
Change = .03, F(1,291) = 8,46, p =.004). This model explained 7.0 percent of the total
variation of emotional exhaustion intensity. This means that when taking individual
value into account as a second predictor the combined influence on emotional

82
exhaustion intensity becomes stronger (b = -.24, t (291) = -3,42, p = .001 and b = -.32, t
(291) = -2.91, p = .004).
Table 8: Hierarchical linear regression of emotional exhaustion intensity onto value congruence, individual value and their interaction.
Note. Value Congruence reversed score 0 = low congruence, score 4 = high congruence. Individual value score 1 = highly unimportant, score 5 = highly important.

83
Step three of the model included the interaction effect to assess whether
individual value moderates the relationship between value congruence and emotional
exhaustion intensity. The addition of the interaction term did not lead to a significantly
improved model compared to step two of the model (R2-Change = .001, F(1,290) = .46,
p = .50). Moreover, the result of the interaction effect between individual value and
value congruence suggests that the effect of value congruence on emotional exhaustion
intensity does not depend on the level of individual value (b = -.14, t (293) = -.68, p =
.50).
Table 9: Interaction effect of individual value on value congruence and emotional exhaustion intensity
In addition, simple slope analysis was performed to assess the possible effects of
value congruence on emotional exhaustion intensity for different values of individual
value. The table 9 displays that people who score average or high on individual value
have a significantly negative relationship between value congruence and emotional
exhaustion (b = -. 22, p < .01 and b = -0. 27, p < .01). Conversely, for the group of
people who score low on individual value the effect of value congruence on emotional
exhaustion intensity is not significant, indicating that individuals score on value
congruence is irrelevant for those who score low on individual value. These results are
demonstrated in figure 6 (see next page).
Individual Value means b se t p
Low -.35 -.17 .11 -1.53 .13 [-.39, .05]
Mean .00 -.22 .07 -3.18 < .001 [-.36, -.08]
High .36 -.27 .08 -3.60 < .001 [-.42, -.12]
Conditional effect of Value Congruence on Emotional Exhaustion Intensity of the moderator of Individual Value

84
Figure 6: Simple Slope analysis of the regression of value congruence on emotional exhaustion intensity for three levels of individual value
4.4.3 Engagement Frequency Table 10 (see next page) presents the summary of the regression result of the effect of
value congruence, individual value, and their interaction on engagement frequency.
Again, hierarchical linear regression was performed in three steps. Value congruence,
entered in the first step, had a non-significant negative effect on engagement frequency
(b = -.15, t (294) = -1.92, p = .06) and accounted for 1.2 percent of the total variation on
engagement frequency. This result implies that there is no relationship between the
alignment of individual values and perceived organizational values, and engagement
frequency.
In the second step, individual value was added to the model as a second
predictor. This second model, taking both main effects into account, was significantly
better compared to the first model (R2-Change = .08, F(1,293) = 26.11, p < .001). With
this second model, which explained 9.3 percent of the total variation on engagement
frequency, value congruence now indicated a significant negative effect on engagement
frequency (b = -.20, t (293) = -2.59, p = .01). Individual value had a significant positive
relationship with engagement frequency (b = .60, t (293) = 5.11, p < .001). This
finding indicates that employees with a high score on individual value are likely to
score high on engagement frequency, but employees who score high on value
congruence are likely to have lowers levels of engagement frequency.

85
Table 10: Hierarchical linear regression of engagement frequency onto value congruence, individual value and their interaction.
Note. Value Congruence reversed score 0 = low congruence, score 4 = high congruence. Individual value score 1 = highly unimportant, score 5 = highly important.
Predictor b SE B β t p
Step 1
Constant 2.87 .05 63.65 < .001[2.78, 2.95]
Value Congruence (centred) -.15 .08 -.11 -1.92 .06
[-.31, 0.00]
R 2 .01
F 3.69
Δ R 2 .01ΔF 3.69 .06
Step 2
Constant 2.87 .04 66.36 < .001[2.78, 2.95]
Value Congruence (centred) -.20 .08 -.15 -2.59 .01[-.35,-.05]
Individual Values (centred) .60 .12 .29 5.11 < .001[.37, .84]
R 2 .09F 15.05Δ R 2 .08ΔF 26.11 < .001
Step 3
Constant 2.88 .04 66.45 < .001[2.79, 2.96]
Value Congruence (centred) -.17 .08 -.12 -2.20 .03[-.32, -.02]
Individual Values (centred) .62 .12 .29 5.25 < .001[.39, .85]
Individual Values (centred) X Value Congruence (centred)
-.41 .21 -.11 -1.99 .05
[-.82,.00]R 2 .10F 11.45Δ R 2 .01
ΔF 3.94 .05
Work Engagement frequency

86
In the last step of analysis, the interaction term was included in the model to
estimate the moderation effect of individual value on the relationship between value
congruence and work engagement frequency. This third model was significantly better
than the second model (R2-Change = .01, F(292) = 3.94, p = .05). This suggests that
individual value moderates the relationship between value congruence and engagement
frequency (b = -.411, t (292) = -1.99, p = .05).
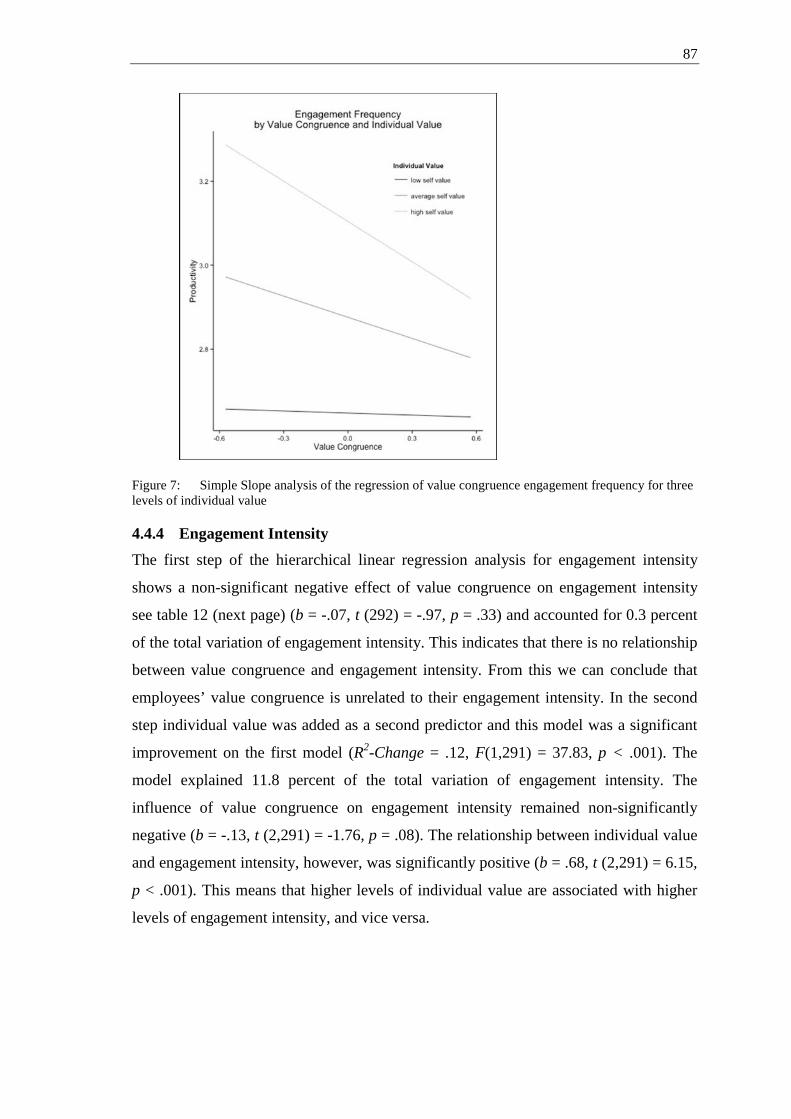
Subsequently a simple slope analysis was run in order to understand the
moderating effect of individual value. The results of this analysis are described in table
11. In general, individual value had a positive effect on work engagement frequency.
However, in this analysis it becomes apparent that only when individual value is high,
value congruence has a negative significant effect on engagement frequency (b = -.32, p
= .01). Figure 7 (next page) illustrates this relationship. Here it becomes clear that when
people have high individual value, only then the level of engagement frequency is
dependent on the level of value congruence. Engagement frequency is lower where
value congruence is higher, and vice versa.
Table 11: Interaction effect of individual value on value congruence and engagement frequency
Individual Value means b se t p
Low -.37 -.02 .13 -.13 .90 [-.27, .24]
Mean .00 -.17 .09 -1.88 .06 [-.34, .01
High .37 -.32 .12 -2.62 .01 [-.56, -.08]
Conditional effect of Value Congruence on Work Engagement frequency of the moderator of Individual Value
87
Figure 7: Simple Slope analysis of the regression of value congruence engagement frequency for three levels of individual value
4.4.4 Engagement Intensity The first step of the hierarchical linear regression analysis for engagement intensity
shows a non-significant negative effect of value congruence on engagement intensity
see table 12 (next page) (b = -.07, t (292) = -.97, p = .33) and accounted for 0.3 percent
of the total variation of engagement intensity. This indicates that there is no relationship
between value congruence and engagement intensity. From this we can conclude that
employees’ value congruence is unrelated to their engagement intensity. In the second
step individual value was added as a second predictor and this model was a significant
improvement on the first model (R2-Change = .12, F(1,291) = 37.83, p < .001). The
model explained 11.8 percent of the total variation of engagement intensity. The
influence of value congruence on engagement intensity remained non-significantly
negative (b = -.13, t (2,291) = -1.76, p = .08). The relationship between individual value
and engagement intensity, however, was significantly positive (b = .68, t (2,291) = 6.15,
p < .001). This means that higher levels of individual value are associated with higher
levels of engagement intensity, and vice versa.

88
Table 12: Hierarchical linear regression of engagement intensity onto value congruence, individual value and their interaction.
Note. Value Congruence reversed score 0 = low congruence, score 4 = high congruence. Individual value score 1 = highly unimportant, score 5 = highly important.
Step three of the analysis includes the interaction effect to explore the
moderation effect of individual value on the relationship between value congruence and
engagement intensity. This third model was not significantly better than the second
Predictor b SE B β t p
Step 1
Constant 2.58 .04 60.05 < .001[2.50,2.67]
Value Congruence (centred) -.07 .08 -.06 -.97 .33
[-.22, .08]
R 2 .00
F 0.93
Δ R 2 .00ΔF 0.93 .33
Step 2
Constant 2.59 .04 63.76 < .001[2.51, 2.67]
Value Congruence (centred) -.13 .07 -.10 -1.76 .08[-.27, .02]
Individual Values (centred) .68 .11 .34 6.15 < .001[.46,.90]
R 2 .12F 19.44Δ R 2 .11ΔF 37.83 < .001
Step 3
Constant 2.59 .04 63.76 < .001[2.51, 2.67]
Value Congruence (centred) -.10 .07 -.08 -1.38 .17[-.24, .04]
Individual Values (centred) .69 .11 .35 6.27 < .001[.48, .91]
Individual Values (centred) X Value Congruence (centred)
-.35 .19 -.10 -1.81 .07
[-.73, .03]R 2 .13F 14.15Δ R 2 .01
ΔF 3.26 .07
Work Engagement intensity

89
model (R2-Change = .01, F(1,290) = 3.26, p = .07). This model indicated that there is no
moderating effect of individual value on the relationship between value congruence and
engagement intensity (b = -.35, t (290) = -1.81, p = .07). This means that the level of
individual value does not influence the relationship between value congruence and
engagement intensity.
However, despite the non-significant interaction effect, simple slope analysis
was performed to investigate the conditional effect of value congruence on engagement
intensity. These results are presented in table 13.
Table 13: Interaction effect of individual value on value congruence and engagement intensity
Here it can be seen that only for individuals who scored high on individual value
a significant negative effect between value congruence and engagement exists (b = -.37,
p < .01). In figure 8 (next page) we can see that, generally, individual value had a
positive effect on engagement intensity. It also becomes clear that the slope (of value
congruence) for people who score high on individual value is negative and steepest.
This means that when people have high individual value only then the level of
engagement intensity is dependent on the level of value congruence. Engagement
intensity is lower where value congruence is higher, and vice versa.
Individual Value means b se t p
Low -.37 .03 .11 .26 .79 [-.19, .25]
Mean .00 -.10 .07 -1.49 .14 [-.23, .03]
High .37 -.23 .08 -2.95 < 0.01 [-.38 -.07]
Conditional effect of Value Congruence on Work Engagement intensity of the moderator of Individual Value

90
Figure 8: Simple Slope analysis of the regression of value congruence on engagement intensity for three levels of individual value
4.4.5 Affective Commitment The results of the hierarchical regression analysis concerning affective commitment are
shown in table 14 (next page). A three-step approach was applied to determine the
effect of value congruence, individual values, and their interaction on affective
commitment. Value congruence was assessed in the first step and had a significant
positive effect on affective commitment (b = .28, t (1,295) = 4.23, p < .01). It accounted
for 5.7 percent of the total variation on affective commitment. This result indicates that
employees who score high on value congruence are also likely to score high on
affective commitment.

91
Table 14: Hierarchical linear regression of affective commitment onto value congruence, individual value and their interaction.
Note. Value Congruence reversed score 0 = low congruence, score 4 = high congruence. Individual value score 1 = highly unimportant, score 5 = highly important.
In the second step individual value was added to the model as a predictor. This
model was a significant improvement on the first model (R2-Change = .07, F(1,294) =

92
25.29, p < .001). The model accounted for 13.2 percent of the total variation on
affective commitment. Both value congruence and individual value were significantly
related to affective commitment (b =.24, t (0294) = 3.70, p < .01 and b = .52, t (294) =
5.03, p < .001, respectively). This indicates that employees with higher scores on both
predictors have more affective commitment than individuals who scored high on only
one predictor. In the last step of the regression analysis, the interaction term was
included in the model to estimate the moderating effect of individual value on the
relationship between value congruence and affective commitment. This third model
was not significantly better than the second model (R2-Change = .00, F(1,293) = .17, p
= .68). This suggests that there was no moderation effect of individual value on the
relationship between value congruence and affective commitment (b = -.07, t (3,293) = -
.41, p = .68). Again, despite the non-significant interaction effect, simple slope analysis
was performed to investigate the conditional effect of value congruence on affective
commitment. The results are provided in table 15 and show that for each level of
individual value, the effect of value congruence on affective commitment was positive
and significant (b = .27, p = .01, b = .25, p < .01, and b = .22, p = .02). This means that
the level of individual value has no effect on the relationship between value congruence
and affective commitment. Figure 9 (next page) shows that all three regression lines
increase at the same rate for changes in value congruence.
Table 15: Interaction effect of individual value on value congruence and affective commitment
Individual Value means b se t p
Low -.35 .27 .11 2.45 .01 [.05, .49]
Mean .00 .25 .07 3.38 < .001 [.11, .39]
High .36 .22 .10 2.26 .02 [.03, .41]
Conditional effect of Value Congruence on Affective Commitment of the moderator of Individual Value
93
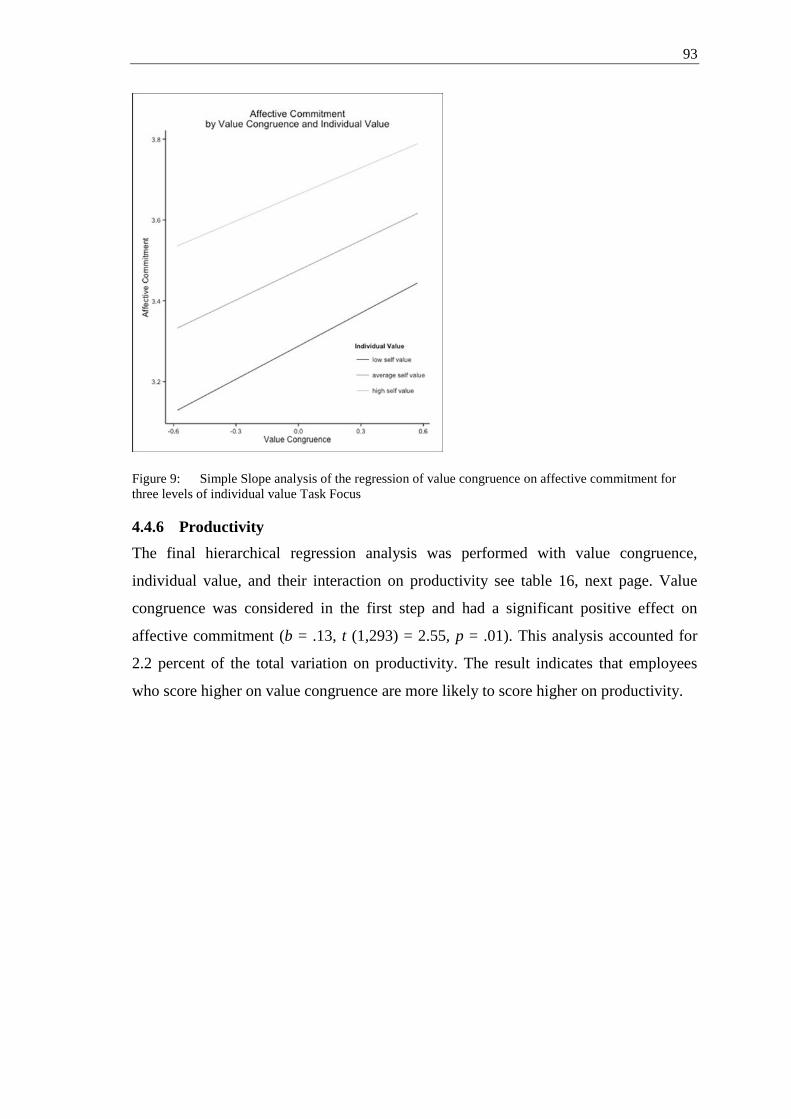
Figure 9: Simple Slope analysis of the regression of value congruence on affective commitment for three levels of individual value Task Focus
4.4.6 Productivity The final hierarchical regression analysis was performed with value congruence,
individual value, and their interaction on productivity see table 16, next page. Value
congruence was considered in the first step and had a significant positive effect on
affective commitment (b = .13, t (1,293) = 2.55, p = .01). This analysis accounted for
2.2 percent of the total variation on productivity. The result indicates that employees
who score higher on value congruence are more likely to score higher on productivity.

94
Table 16: Hierarchical linear regression of productivity onto value congruence, individual value and their interaction.
Note. Value Congruence reversed score 0 = low congruence, score 4 = high congruence. Individual value score 1 = highly unimportant, score 5 = highly important.
Individual value was added as a predictor in the second step of the hierarchical
regression. The addition led a to a significant improvement in the model compared to
Predictor b SE B β t p
Step 1
Constant 3.87 .03 137.20 < .001[3.81, 3.92]
Value Congruence (centred) .13 .05 .15 2.55 .01
[0.03, 0.22]
R 2 .02
F 6.50
Δ R 2 .02ΔF 6.50 .01
Step 2
Constant 3.87 .03 139.62 < .001[3.81, 3.92]
Value Congruence (centred) .11 .05 .13 2.23 .03[0.01, 0.20]
Individual Values (centred) .26 .08 .19 3.39 < .001[0.11, 0.40]
R 2 .06F 9.10
Δ R 2 .04ΔF 11.47 .01
Step 3
Constant 3.86 0.03 138.81 < .001[3.81, 3.92]
Value Congruence (centred) .09 .05 .11 1.91 .06[0, 0.19]
Individual Values (centred) .25 .08 .19 3.29 < .001[ 0.10, 0.40]
Individual Values (centred) X Value Congruence (centred)
.16 .13 .07 1.19 .23
[-0.10, 0.42]R 2 .06F 6.55Δ R 2 .00ΔF 1.42
Productivity

95
the first model (R2-Change = .04, F(1,292) = 11.47, p = .001) and accounted for 5.9
percent for the total variation on productivity. Both value congruence and individual
value had significant positive effect on productivity (b = .11, t (2,292) = 2.23, p = .03
and b = .26, t (2,292) = 3.39, p < .001, respectively). Based on these findings, it can be
concluded that employees who score high on either one of the predictors are more likely
to score high on productivity. Employees who score high on both predictors are more
likely to score even higher on productivity. The interaction term was included in the
model for step three to explore the moderating effect of individual value on the
relationship between value congruence and productivity. This third model was not
significantly better than the second model (R2-Change = .00, F(1,291) = 1.42, p = .23).
This suggests that there is no moderation effect of individual value on the relationship
between value congruence and productivity (b = .16, t (3,291) = 1.19, p = .23).
However, after conducting simple slope analysis a somewhat different picture
emerges. By considering different values for individual value (Table 17), it becomes
clear that only when individual value is high, there is a positive effect of value
congruence on productivity, (b = .15, p = .05). Figure 10 (next page) depicts these
relationships, showing that in general, individual value has a positive effect on
productivity. However, only when employees score high on individual value, value
congruence is related to productivity.
Table 17: Interaction effect of individual value on value congruence and productivity
Individual Value means b se t p
Low -.37 .03 .11 .33 .74 [-.17, .25]
Mean .00 .09 .06 1.52 .13 [-.03, .22]
High .37 .15 .08 1.93 .05 [-.00, .31]
Conditional effect of Value Congruence on Productivity of the moderator of Individual Value

96
Figure 100: Simple Slope analysis of the regression of value congruence on productivity for three levels of individual value
The regression analyses provide some key evidence regarding the relevance of
individual value on value congruence and its association with employee work
engagement, emotional exhaustion, affective commitment, and productivity. Apart from
affective commitment, it became apparent from these analyses that value congruence
was important for predicting outcome variables only when individual value was higher.
Up until here, both value congruence and individual value were being considered as a
whole, however nothing can be said for different aspects of these variables. To explore
how parts of value congruence and individual value were related to the outcome
variables, first a principle component analysis (PCA) was performed to consider
possible sub dimensions within these variables.
In sum, from the results provided in sections 4.4.1 – 4.4.6 it can be concluded
(see Table 18, next page) that Hypothesis 3 is partially supported, and on the basis of
simple slope analysis, Hypothesis 4 is also supported.

97
Table 18: Summary Result Hypothesis 3 and 4
Hypothesis Result H3. Value Congruence is still associated with (a) Work Engagement, (b) Emotional Exhaustion, (c) Affective Commitment, and (d) Productivity, when Individual Values are taken into account.
Partially supported
H3a. Value Congruence is still associated with work engagement when individual values are taken into account .
H3b.Value Congruence is still associated with emotional exhaustion when individual values are taken into account.
H3c. Value Congruence is still associated with affective commitment when individual values are taken into account.
H3d. Value Congruence is still associated with productivity when individual values are taken into account.
Not Supported Supported Supported Supported
H4. The effect of Value Congruence on (a) Work Engagement, (b) Emotional Exhaustion, (c) Affective Commitment, and (d) Productivity depends on (is moderated by) the level of Individual Values.
Supported
H4a. The effect of Value Congruence on Work Engagement depends on (is moderated) by the level on Individual Values.
H4b. The effect of Value Congruence on Emotional Exhaustion depends on (is moderated) by the level on Individual Values.
H4c. The effect of Value Congruence on Affective Commitment depends on (is moderated) by the level on Individual Values.
H4d. The effect of Value Congruence on Productivity depends on (is moderated) by the level on Individual Values
Supported Supported Supported Supported
4.5 Exploring National Culture
4.5.1 Correlation Analysis and Descriptive Statistics by Location Table 19 (page 98) presents the correlations (including mean and standard deviation) of
value congruence respectively individual value with the four outcome variables per
national branch. No general pattern is visible with regard to value congruence. On a
scale of 0-1, the highest mean score (i.e., highest value congruence) with M = .95 was
found from the participants in Germany whereas the participants from China scored the
lowest mean value (i.e., lowest value congruence) with M = .16. When making
decisions or taking actions in the organizations the participants of the different branches
assessed the importance of individual values with less variation. On a scale of 1-5 (1-
highly unimportant, 5-highly important) Brazil reports a mean score of M = 4.75 as the
highest score, and the Czech Republic shows a mean score of M = 4.37 as the lowest
score.

98
Table 19: Correlation Analysis between Value Congruence, Individual Value and Outcome Variables including Means and Standard Deviation of Value Congruence and Individual Value
The correlation analysis displays that value congruence is significant associated
with affective commitment for nearly all nations. For instance, in Germany a significant
medium positive correlation (r = .32, p < .05) was found between value congruence and
affective commitment which indicates that affective commitment increases when value
congruence is higher. A similar conclusion can be drawn for China (r = .36, p < .01),
Italy (r = .47, p < .01) and Poland (r = .80, p < .01), the latter being highly correlated.
Also, significant positive relationships were found between value congruence and work
engagement “frequency” in Italy (r = .47, p < .05) and Poland (r = .65, p < .05). Given
the low number of Polish participants, cautiousness is, however, warranted for this
finding.
The most significant correlations between value congruence and the outcome
variables can be observed for Italy. This finding indicates that the alignment between
Affective Commitment Productivity
Frequency Intensity Frequency Intensity M SD
Germany
Value Congruence -.08 -.29 -.03 .11 .32* .16 .95 .65
Individual Value -.38* -.48** .52** .52** .51** .52** 4.42 .38
Italy
Value Congruence -.45** -.35* .47** .34* 47** .34* .88 .66
Individual Value .00 .05 .33* .38** .24 .23 4.68 .27
UK
Value Congruence -.24 -.29 -.14 -.23 -.17 .40 .30 .28
Individual Value -.25 -.16 .29 .40 .36 .21 4.55 .32
Poland
Value Congruence .12 -.05 .65* .38 .80** .17 .43 .32
Individual Value -.17 -.13 .57 .70* .29 .34 4.65 .31
Czech Republic
Value Congruence -.13 -.16 -.13 -.20 .16 -.11 .66 .51
Individual Value -.12 -.14 .59** .48** .39* .40** 4.37 .44
China
Value Congruence -.03 -.02 .12 .19 .36** .14 .16 .28
Individual Value -.27** -.21* .15 .22* .25* .13 4.72 .34
Brazil
Value Congruence -.16 -.15 -.08 -.02 -.21 .15 .61 .59
Individual Value -,50** -.31 .47** .38* .32 .52** 4.75 .30
Emotional Exhaustion Work Engagement
Note: *p <.05 two tailed,**p < .01 two tailed, Germany (n = 41), Italy (n =52), UK (n = 23), Poland (n = 11), Czech Republic (n = 41, China (n = 101), Brazil (n =30)Value Congruence score (reversed) 0 =low congruence, 4 = high congruence. Individual value score 1 = highly unimportant, score 5 = highly

99
individual values and perceived organizational values is important for the participants in
Italy (i.e., for becoming less emotional exhausted, more engaged, more committed and
more productive). For other locations, such as the UK, the Czech Republic and Brazil,
value congruence seems not to be significantly associated with emotional exhaustion,
work engagement, affective commitment, and productivity.
Individual values play a more prominent role for employees in Germany. For
this location medium/strong significant relationships were found between individual
values and all outcome variables. Individual values are also significantly related to the
level employees feel emotionally exhausted, engaged, committed and productive in
China and Brazil. The branch in the Czech Republic displays a strong and significant
relationship between individual values and work engagement.
4.5.2 Linear Multiple Regression by Location Given that for some nations individual values are associated with emotional exhaustion,
work engagement, affective commitment and productivity, regression analysis was
performed per location to examine whether an interaction effect of individual values
could be found on the relationship between value congruence and the outcome
variables. For each nation (i.e., Brazil, China, Czech Republic, Germany, Italy, Poland,
UK) a two-step hierarchical regression was conducted. In the first step, two predictors
were taken into account, value congruence and self-rated values (individual values). In
the final step, the interaction term between value congruence and self-rated values was
added as a third predictor. The predictive variables were centered to eliminate the
problem of zero value of the predictors. In order not to overload this section with too
many large tables, it was decided to focus on the major findings. The detailed outcomes
of the exploration can be found in Appendices J - O.
Focusing on step two of the hierarchical regression, in which three predictive
variables were included for each dependent variable, it was found that in Brazil (b = -
1.23, p < .001) and Germany (b = -.77, p = .03) individual values had a significant
negative effect on emotional exhaustion frequency (See Appendix J). This negative
effect implies that employees who find individual values more important in decision-
making score lower on emotional exhaustion frequency (vice versa). However, for
employees in Italy more value congruence indicates a decrease in emotional exhaustion

100
frequency (b = -.50, p = .01), See Appendix J, as well as emotional exhaustion
intensity, (b = -.46, p = .03), See Appendix K.
In regard with engagement frequency the results indicate that for the Czech
Republic (b = .78, p < .001), Brazil (b = .69, p = .01) and Germany (b = .88, p = .03) an
increase of individual value is associated with a rise of engagement frequency, See
Appendix L. On the other side, engagement intensity increases if individual values are
more important in Germany (b = .91, p = .01), and Italy (b = 1.23, p = .01), See
Appendix M. Furthermore, individual values were found to be associated with
productivity. In particular for the branches in the Czech Republic (b = .30, p = .05),
Brazil (b = .87, p < .001), and Germany (b = .93, p < .001). This suggest that in these
national branches productivity goes up when the importance of individual values
increases, Appendix O.
Turning to the results of affective commitment it was found that in Germany and
Italy the level of commitment depended on the level of individual values and/or value
congruence. For instance, the commitment of individuals in Germany increases when
the level of individual values (b = .43, p = .01) respectively value congruence (b = 1.27,
p < .001) increases, Appendix N. Other than for employees in Italy. Here commitment
rises only when value congruence (b = .64, p < .001) increases, Appendix N. However,
individual values were found to moderate the relationship between value congruence
and productivity in Italy (b = 1.16, p = .02). In Italy individual values can thus change
the relationship between value congruence and productivity.
Table 20: Summary Result Correlation and Regression
Exploring Hypotheses in a Multinational Context Exploratory Result The effect of Value Congruence and Individual Values on (a) Work Engagement, (b) Emotional Exhaustion, (c) Affective Commitment, and (d) Productivity varies between national branches.
Partially supported, based on Fisher’s r-to-z transformation
For each national branch the effect of Value Congruence on and (a) Work Engagement, (b) Emotional Exhaustion, (c) Affective Commitment, and (d) Productivity is moderated by individual values
Partially supported, based on separate regression analyses
Germany, the effect of Value Congruence on and (a) Work Engagement, (b) Emotional Exhaustion, (c) Affective Commitment, and (d) Productivity is moderated by individual values.
Not supported

101
Italy, the effect of Value Congruence on and (a) Work Engagement, (b) Emotional Exhaustion, (c) Affective Commitment, and (d) Productivity is moderated by individual values.
Supported for the relationship between value congruence and productivity
UK the effect of Value Congruence on and (a) Work Engagement, (b) Emotional Exhaustion, (c) Affective Commitment, and (d) Productivity is moderated by individual values
No supported
Poland the effect of Value Congruence on and (a) Work Engagement, (b) Emotional Exhaustion, (c) Affective Commitment, and (d) Productivity is moderated by individual values.
Not supported
Czech Republic, the effect of Value Congruence on and (a) Work Engagement, (b) Emotional Exhaustion, (c) Affective Commitment, and (d) Productivity is moderated by individual values.
Not supported
China, the effect of Value Congruence on and (a) Work Engagement, (b) Emotional Exhaustion, (c) Affective Commitment, and (d) Productivity is moderated by individual values.
Supported for the relationship between value congruence and affective commitment
Brazil, the effect of Value Congruence on and (a) Work Engagement, (b) Emotional Exhaustion, (c) Affective Commitment, and (d) Productivity is moderated by individual values.
Not supported
4.6 Discussion
Based on the research findings presented in this chapter, this thesis provides support for
previous studies indicating that value congruence is significantly related to positive
organizational and individual level outcomes (e.g., Amos & Weathington, 2008;
Edwards & Cable, 2009; Li, Wang, You, & Gao, 2015; Tomlinson, Lewicki, & Ash,
2014). In particular, the study has found a significant negative relationship between
value congruence and emotional exhaustion, and a significant positive relationship
between value congruence and affective commitment and employee productivity, but
not with work engagement. It is, therefore, possible to provide partial support for
Hypothesis 1.
Given that the results indicate that value congruence and emotional exhaustion
are negatively related, this study reinforces the conclusions of Dylag et al. (2013)
according to which perceived discrepancy between individual values and organizational
values is associated with a higher risk of occupation-related burnout and a lower level
of work engagement. Similarly, this study supports the findings of Bao, Vedina, Moodie
and Dolan (2013) demonstrating that only certain aspects of value incongruence, such

102
as those pertaining to values related to economy, emotions and ethics, are correlated
with burnout prevalence and other negative outcomes, e.g., turnover intentions and
accident propensity. Since the study has found that value congruence is positively
associated with productivity, it is also congruent with the findings of Bao et al. (2013)
according to which value incongruence is correlated with factors associated with items
decreasing productivity, such as workplace accidents. As emotional exhaustion has been
found by prior studies to lie on the psychological continuum between the negative
experience of job-related burnout and the positive experience of workplace engagement
(Maslach & Jackson, 1986), this cross-sectional, cross-national and comprehensive
study contributes to the scholarly literature, since previous panel study findings, such as
those of Maslach and Leiter (2008), suggest that the fairness dimension of value
incongruence is likely to be causally connected to burnout, while value congruence in
respect to its fairness aspect has been found to be leading to employee engagement.
Thus, the indication of this study that value congruence may be negatively related to
burnout, but not necessarily positively associated with work engagement, is in line with
Diener (2000), Maslach, Schaufeli and Leiter (2001), and Taris and Schreurs (2009),
who have found robust support for the hypothesis that emotional exhaustion is
negatively and significantly associated with individual-level organizational
performance. Similarly, this study corroborates the findings of Haines and Saba (2012),
per which a lack of congruence between professional role-related requirements and
individual psychological needs for salient role verification is significantly related to the
emotional exhaustion of company employees. Likewise, this research lends support to
Halbesleben and Bowler’s (2007) study that has found that emotional exhaustion is
significantly associated with organizational citizenship behavior. Moreover, this study
corresponds to extant academic literature, such as the findings of Taris (2006), Wang
(2014), and Wright and Bonett (1997), in consensus with which emotional exhaustion is
significantly associated with in-role employee behavior and individual-level
performance. In contrast to previous findings, this study however suggests that value
congruence is significantly related to various dimensions and characteristics of burnout,
such as emotional exhaustion and its intensity and frequency.
Congruent with previous work (e.g., Elizur & Koslowsky, 2001; Finegan, 2000;
Glazer, Daniel, & Short, 2004; Nwadei, 2003; O’Connell, 2008), the study also finds
support for a positive association between value congruence and organizational
commitment. More specifically, this study supports the findings of Elizur and

103
Koslowsky (2001) that work values, and especially their cognitive aspect, are related to
organizational commitment. Furthermore, this research corroborated the conclusions of
previous studies that various dimensions of job satisfaction are significantly related to
organizational commitment (Azeem, 2010; Meyer & Allen, 1997; Moser (1996). This
cross-cultural study also validates Posner’s (2010) cross-sectional findings, based on a
United States sample of managerial employees, indicating a significant relationship
between value congruence and organizational commitment and work stress.
Noticeable is the significant relationship between value congruence and
productivity, where a greater match between individual and company values positively
affects productivity. Productivity is the outcome of employee performance (Thor,
1991), and performance is the willingness and ability of employees to do the right
things at the right time to perform a specific job (Thommen & Gmür, 2011, Schreyögg
& Sydow, 2009; Stuart-Kotze, 2009; de Waal, 2007). Phillips and Gully (2011) showed
that, in multinational organizations, employees’ performances depend on the behavior
and attitudes of other employees, which provide the directions to the employees to
adjust their behavior and attitudes in order to achieve organizational goals and
objectives. By contrast, assuming employees are being forced by peer pressure to
perform actions in an unethical way to ensure the success of the company, productivity
is likely to decrease (Walumbwa et al., 2011). Accordingly, there is a high risk of
turnover intention if employees see that organizational goals and objectives are being
achieved via unethical behavior (Tourigny, Baba, Han & Wang, 2013). Based on this, it
was found that perceived unethical behavior creates psychological stress for employees
which in turn will decrease productivity (Taris & Schreurs, 2009). As strong
associations between productivity, emotional exhaustion, work engagement, and
affective commitment were found in this study, the findings indicate that the employees
who are more productive also are those who are low on emotional exhaustion, high on
work engagement and high on emotional attachment to the organization. This would
support the theory of happy productive worker (Taris & Schreurs, 2009).
No relationship could be established between value congruence and work
engagement which is different from the findings in the literature. Crawford, Lepine and
Rich (2010) and Li, Wang, You, & Gao (2015) found a positive relationship between
value congruence and work engagement, but conceptualized engagement as a mediator
in the relationship between value congruence and organizational outcomes. Rayton and
Yalabik (2014), who analyzed the determinants of work engagement, found a strong

104
relationship between job satisfaction and work engagement. Hon and Leung (2011) and
Taipale et al. (2011) found such relationship with creativity, innovation, autonomy, and
support. All these factors are items related to job task performance. Our findings may
thus provide support for the work of Bakker (2011) who argues that engagement is not
only influenced by the congruence of values, but also by such elements as job demand,
job requirements, job control, reward, and recognition. That is, organizations that fail to
provide a meaningful and autonomous work environment, employees may respond with
less engagement (Bakker, Albrecht & Leiter, 2011; Mone et al., 2012). Overall this
indicates, work engagement may play more a moderating role between value
congruence and outcome variables, because correlation analysis depict a strong
association with affective commitment and productivity.
The study did not find support for Hypothesis 2. While individual values indeed
are more strongly associated with outcome variables than value congruence, differences
in the correlation coefficients are small and not significant. This study, therefore, does
not support the work of Suar and Khuntia (2010) who found that personal values
decreased unethical practices and increased work behavior more than value congruence.
However, support was found for Hypothesis 3 inasmuch that value congruence is still
related with outcome variables when individual values are taken into account. For this
reason, the height of the level at which the individual values were congruent with the
organizational value was considered, when examining the relationship between value
congruence and engagement, emotional exhaustion, affective commitment, and
productivity. This additional level of analysis provided new insights, and led to the
support of Hypothesis 4: individual values moderate the relationship between value
congruence and outcome variables. If only the result of the multiple hierarchical
regression analysis had been considered no moderating effect of individual values on
the relationship between value congruence and the outcome variables would have been
found. However, by paying more attention to the different levels of individual values,
the simple slope analyses presented a different outcome. Individuals who respectively
scored low, average, or high on self-rated values differed in the way individual value
moderate the relationship between value congruence and the outcome variables.
Specifically, individuals with mean and high individual value scores changed the
magnitude of this relationship significantly.
Our findings show that for employees who scored mean or high on individual
values, individual value moderates the negative effect of value congruence on emotional

105
exhaustion on both dimensions “frequency” and “intensity”. For affective commitment,
the analysis indicates the strongest effect of individual values on the relationship
between value congruence and affective commitment. This result implies, when
individual values are important for employees, value alignment is high and participants
are more emotional attached to the organization independent whether they scored low,
mean or high on individual values. With regard to productivity, the change of direction
between the two variables was limited to individuals who scored high on individual
values. This might indicate that individuals who scored high on individual values were
also high on value congruence and therefore more productive, because they were doing
the right things in order to achieve organizational and personal goals by selecting
effective behavior and actions (Walumbwa et al., 2011). Lastly, a significant and
negative reversed moderating effect was found on the relationship between value
congruence and work engagement, for both the dimensions - “frequency” and
“intensity” – although this effect was limited to individuals who scored high on
individual values. This finding suggests, when employees scored high on individual
values, value congruence leads to disengagement. On the other hand, people who score
low on individual values there is no significant moderating effect on value congruence
and engagement. This might be explained by leaders being pressurized to employ an
ethical leadership style and communicating their moral values openly, while their
perceived moral actions are not keeping with their own words. This would suppress the
values of the individuals who scored high on individual values and create significant
misalignment (Deanne & Belschak, 2012; Sendjaya et al., 2016). Bezrukova et al.
(2012) argued that taking personal interest fit into account might have positive
implications on the level of productivity due to greater alignment between job functions
and the employees’ personal and professional interests. Leiter, Jackson, and
Shaughnessy (2009) further illustrated that personal value fit is the core requirement of
every organization. They referred to values in the context of decision making, autonomy
and freedom, and involvement, which are the main contributors to achieving meaningful
personal goals. According to them, a permanent misfit between workers’ abilities and
job demands results in greater exhaustion at work. Based on this notion, it might
provide a direction to better group values into dimensions to obtain an understanding of
whether value congruence in general reverses the effect on work engagement or specific
value congruence dimensions.

106
The main effects of value congruence and individual values were also explored
per national culture, showing some differences among countries. Value congruence was
found to be more strongly associated with work engagement, emotional exhaustion,
affective commitment, or productivity in countries characterized as collectivistic
cultures, with the exception of Italy which is known as an individualistic culture
(Hofstede, 2001). This may be related to the observation that Italians prefer to work
with people who are feel, think and act in a similar way and can be considered part of
the extended family (Gagliardi & Turner, 1993), which are typical attributes of a
collectivistic culture. Gagliardi and Turner (1993) further posit that in Italy, a person-
based relationship develops when employees behave in harmony, which could be
relevant for explaining why value congruence has such a strong relationship to
emotional exhaustion, work engagement, affective commitment, and productivity. It is
important to mention that there is a significant association between value congruence
and affective commitment for the participants from Germany, Poland and China,
indicating that employees in these nations are more committed to support business goals
and objectives providing that their individual values and perceived organizational
values match. This is not surprising, with regard to people in China because China’s
culture encourages people to have a strong desire for social belonging and to prioritize
collective interests, to aspire to live in harmony with others, and to be part of a larger
social whole (Triandis, 1995; Nisbett, 2003). However, an unexpected result of the
analysis is the strong association of individual values and emotional exhaustion, work
engagement and productivity for the employees from Brazil. Brazil was described by
Triandis (1995) and Hofstede as a collectivist culture. Thus, the findings give rise to the
question why individual values are more important for employees located in Brazil than
value congruence. A possible explanation may lie in the variety of ethnic groups in
Brazil. In this regard, it is pertinent to emphasize that most of the respondents were
located close to Sao Paulo, or in Sao Paulo City. People coming from Sao Paulo, called
“Paulistas”, and who have been described as business-orientated and action-directed
(Hofstede, Hilal, Malvezzi, Tanure, & Vinken, 2010; Lenartowicz & Roth, 2001).
These characteristics may result in a distinctly more individualist approach to work. A
strong association was also found between individual values and outcome variables for
the participants in Germany, Czech Republic, and China compared to the other nations.
It might be explained, Czech Republic transitioned from socialism in which it was
common practice to be dictated to by a collective and to follow a strict regime and only

107
basic needs were guaranteed where people had no chance to satisfy their individual
needs (Swiatkowski, 2004, as cited in Arbeitswelt-Lebenswelt). Also noticeable, people
in the Czech Republic had no commitment to the company and were not used to
working hard. Work was only important in terms of earning money, receiving
promotions and good pay, and having fewer working hours (Vecernik, 2006). This may
indicate that individual values are more important for employees in Czech Republic
rather than value congruence because serving to the collective brought no merit.
Furthermore, it was found that one of the few national cultures in which a
moderating effect was present was that of China, where the level of individual values
changed the relationship between value congruence and affective commitment. This
may be caused by the experience of working under “Western” management practices
whereby the traditional values are gradually being replaced by values promoted by
“Western” organizations (McFarlin & Sweeney, 2014). Another moderating effect of
individual values on the relationship between value congruence and outcome variables
was for Italy. The results indicate that employees who scored higher on individual
values changed the magnitude of the relationship between value congruence and
productivity. Collectively, partial support was thus found for Hypothesis 6, which states
that for each national culture the effect of value congruence on outcome variables is
moderated by individual values.
4.7 Summary
This chapter examined the relationship between value congruence (respectively
individual-level values) and emotional exhaustion, work engagement, organizational
commitment, and work productivity. Also, it investigated whether this relationship was
moderated by individual values.
The results indicate that value congruence is associated positively with affective
commitment and productivity, and negatively associated with emotional exhaustion.
However, value congruence was not found to be related to work engagement. Moreover,
individual values were found to moderate the relationship between value congruence
and all four outcome variables, even though the strength of this moderation effect was
found to depend on the perceived importance of the individual-level values. Employees
who scored high on individual values exhibited a positive relationship between value

108
congruence and productivity and organizational commitment and a negative relationship
between value congruence and emotional exhaustion and work engagement.
Table 21: Summary Result Hypothesis 1 - 4
Hypothesis Result
H1: Value Congruence is positively associated with (a) Work Engagement, (c) Affective Commitment, and (d) Productivity - but negatively with (b) Emotional Exhaustion.
Partially supported
H1a: Value Congruence is positively associated with Work Engagement. H1b: Value Congruence is negatively associated with Emotional Exhaustion. H1c: Value Congruence is positively associated with Affective Commitment. H1d: Value Congruence is positively associated with Productivity.
Not supported Supported Supported Supported
H2. Individual Values are more strongly associated with (a) Work Engagement, (b) Emotional Exhaustion, (c) Affective Commitment, and (d) Productivity than Value Congruence.
Not supported
H3. Value Congruence is still associated with (a) Work Engagement, (b) Emotional Exhaustion, (c) Affective Commitment, and (d) Productivity, when Individual Values are taken into account.
Partially supported
H3a. Value Congruence is still associated with work engagement when individual values are taken into account . H3b.Value Congruence is still associated with emotional exhaustion when individual values are taken into account. H3c. Value Congruence is still associated with affective commitment when individual values are taken into account. H3d. Value Congruence is still associated with productivity when individual values are taken into account.
Not supported Supported Supported Supported
H4. The effect of Value Congruence on (a) Work Engagement, (b) Emotional Exhaustion, (c) Affective Commitment, and (d) Productivity depends on (is moderated by) the level of Individual Values.
Supported
When exploring the multinational context, it was observed that value congruence
was negatively associated with emotional exhaustion in Italy, whereas individual values
were found to be negatively associated with emotional exhaustion in Germany and
China. Value congruence was found to be positively associated with work engagement
in Italy. By contrast, individual values were found to be positively associated with work
engagement in Germany, Czech Republic and Brazil. Furthermore, value congruence
was found to be positively associated with affective commitment in Germany, Italy,
Poland and China. By contrast, only individual values were found to be positively
associated with affective commitment in the Czech Republic. While in Italy value

109
congruence was positively associated with productivity, in Germany, Czech Republic
and Brazil individual values were found to be positively associated with productivity.
The next chapter will analyze how dimensions of value congruence and
individual values affect outcome variables. This approach has been suggested by Amos
and Weathington (2008), Bao, Dolan and Tzafrir (2012), Finegan, (2000), and Suar and
Khuntia (2010) and aims to provide further insights into which dimensions of value
congruence and individual values have a stronger or weaker association with the
outcome variables.