Embed Size (px)
Citation preview

CHAPTER 4. UKRAINIAN STEEL EXPORT: PERFORMANCE, SUSTAINABILITY AND MEDIUM-TERM PROSPECTS48
A. EXPORT PERFORMANCE
4.1 Ukraine i s among the leading world producers and exporters o f ferrous metals. In 2003, i t s share in the global output o f cast i ron and steel was 4.55 percent and 3.84 percent respectively, and it also accounted for 8.7 percent o f exports o f semi-finished steel products and 6.8 percent o f scrap exports. Together with Russia, Ukraine has an essential impact on trends at the world steel market.
4.2 The cast i ron and steel sector i s the core o f the Ukrainian metallurgic and metalworking industry which plays an important role in the national economy: in 2003, the sector generated about 5 percent o f GDP and 24.3 percent o f the total industrial output. The sector accounts for 7.2 percent o f total industrial assets and 6.4 percent o f employment in the industry. I t s annual production capacity i s 33.9 million tons o f cast iron, 42.1 mi l l ion tons o f crude steel and 36.6 mi l l ion tons o f rol led steel. The core o f the sector is represented by 15 large mills, most o f which are large f i l l -cycle metallurgic combines (producing cast iron, steel and rolled products).
4.3 Ukraine’s steel sector is capable o f operating as a closed technological system that covers raw material extraction and processing, coke manufacturing, cast iron and steel smelting, and it has limited dependence on imports. In 2003, imports o f finished rol led products and i ron ore made up 2.5 percent and 12 percent o f their national production. The country has an extensive raw material base, including large sources o f metal scrap supply. In addition, the country’s power system and transportation network are sufficiently developed to support operations o f large scale metallurgical production and exports.
4.4 Ferrous metals4’ are the crit ical portion o f Ukraine’s exports and in 2003 their exports amounted to US$6.7 billion, an increase by more than 70 percent over the period 2000-03 (Table 4.1). While the portion o f ferrous metals in total exports remains quite significant, i t has been declining recently from 34.5 percent in 2000 to 29.3 percent in 2003. The sector’s contribution to the total growth o f Ukrainian exports in 1999-2003 was about 20 percent.
4.5 The sector’s capacity, inherited by Ukraine after the breakup o f the Soviet Union, exceeds the internal needs o f the national economy several times, and it has consequently provided the grounds for the sector’s heavy focus on exports. In 2003, rol led stock exports made up 79 percent o f the total output. Due to i t s export orientation, the sector is quite sensitive to
48 This chapter i s based on the background report prepared by the expert team from the Ukrainian Center for Economic Development (CED) led by Dr Alexander Paskhaver and Dr Lidia Verkhovodova. 49 Exports o f steel and cast iron sector products are accounted in the group of 72 UKT VED. Cast iron, steel and rolled stock accounted for 85 percent of exports within this group of products in 2003, while the rest of exports related to scrap, ferroalloys, etc.
95

developments o f the global steel markets, which have been recently characterized by the fol lowing trends:
0 a--&astic increase i d e m a n d since early 2002 fo-F&c&-de&stock-awLkp&s for the metallurgic industry; significant pricing growth for all main inputs in the sector; the expansion o f a relatively new niche on the wor ld steel market related to a growing demand for semi-finished steel products; the co-existence o f producers with different technological levels, allowing traditional manufacturers to remain profitable, while operators that use new technologies expand.
~
0
0
0
4.6 The recent growth o f export prices on Ukrainian steel i s mostly due to an increase in both global demand and prices for steel and semi-finished products (Fig. 4.1), which was driven primarily by growth in demand in East Asia. Since the mid-90s’ the global prices for ferrous metal had been declining, but this process ended in 2001. Then global market prices moved upward in 2002, turning to a galloping growth since July 2003. Ukrainian exporters have managed to use the favorable market situation for significant export growth and their expansion to new markets.
4.7 USSR’s ferrous metals industry was primari ly focused on meeting i t s domestic needs. Whi le only 55 percent o f Ukraine’s metallurgy output was sold within the country, these shipments were primarily to other former Soviet republics. The volumes exported to destinations outside o f the USSR were hardly significant. In 1990, exports to foreign countries accounted for only 3 million tons (8 percent o f the output) o f rolled steel from the total o f 15 mi l l ion tons shipped outside o f Ukraine.
4.8 As a result, during the first years o f sovereignty the Ukrainian metallurgic enterprises lacked sk i l ls needed to operate at the global market. They were neither known among customers, nor were their products’ quality in l ine with international standards. Consequently, Ukraine’s products were relatively low priced.
The situation was exacerbated by crisis developments on the global steel market. Significant extra volumes o f cheap metal that entered the market in the m i d - 9 0 ~ ~ ’ threatened traditional manufacturers. Starting from 1995, Ukraine’s steel producers have increasingly become subject to antidumping investigation measures and other instruments o f domestic market protection (Box 4.1). It i s estimated that over the last 10 years almost 60 antidumping investigations were launched worldwide against Ukrainian exports o f ferrous metals, which i s an extraordinarily high number for an industry with total sales below U S 1 0 billion. Eremenko and Lisenkova (2003) provide detailed information on anti-dumping duties imposed on Ukrainian steel producers during 1993-2001.
50 At that time, in addition to Ukraine, Russia and Brazil also entered the market with the cheap metal.
96

Figure 4.1: Exports volumes and average export pr ice
f o r the ferrous meta l sector in 1999-2003
250 8 7
- 6
U S $ per t 2oo 150 100 - - i 50 -
o ! , 1999 2000 2001 2002
Average export price, US$/ t
Exports o f ferrous metals, bn. U S $ / /
Source: CED.
T 5 ' 4 US$ 1; bn
0 2003
Table 4.1: Contribution of the steel sector to Ukraine's economic performance in 2000-03
Indices 2000 2001 2002 2003
Gross domestic product, UAH million Including: Metallurgy and metalworking, UAH mil l ion
- share in GDP, percent
Cast iron & steel sector, UAH mil l ion
- share in GDP, percent
Total industrial output, UAH million
Including: Metallurgy and metalworkmg, UAH mil l ion
- share in industrial output, percent
Cast iron & steel sector, UAH mil l ion
- share in industrial output, percent
Total exports, US$ million Including: Metallurgy and metalworking, US$ mil l ion
- share in total exports, percent
Cast iron & steel sector, US$ bi l l ion
- share in total exports, percent
170,070
10,687 6.28
4,569 2.7
144,412
33,900
23.5 25,153
17.4
14,573
6,459
44.3 5.03
34.5
204,190 225,810 263,228
10,520 9,122 12,600 5.15 4.04 4.79
5,157 5,476 6,423 2.5 2.4 2.4
155,891 171,207 220,605
35,270 39,03 1 53,650 22.6 22.8 24.3
26,114 28,029 38,455 16.8 16.4 17.4
16,265 17,957 23,008
6,365 6,555 8,419
39.1 36.5 36.6 4.98 5.37 6.73
30.7 29.9 29.3
Source: Datafiom the Ukrainian Ministry for State Statistics and CED.
97
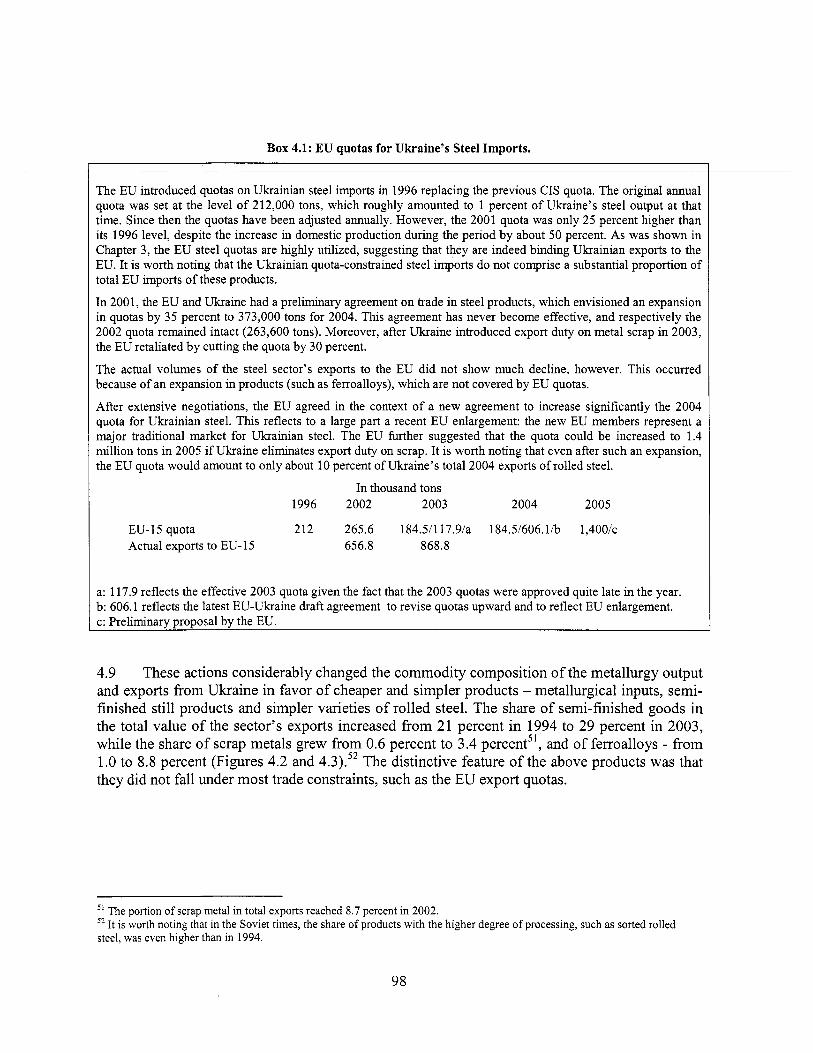
Box 4.1: EU quotas for Ukraine’s Steel Imports.
The EU introduced quotas o n Ukrainian steel imports in 1996 replacing the previous CIS quota. The original annual quota was set at the level o f 212,000 tons, which roughly amounted to 1 percent o f Ukraine’s steel output at that time. Since then the quotas have been adjusted annually. However, the 2001 quota was only 25 percent higher than i t s 1996 level, despite the increase in domestic production during the period by about 50 percent. As was shown in Chapter 3, the EU steel quotas are highly utilized, suggesting that they are indeed binding Ukrainian exports to the EU. I t i s wor th not ing that the Ukrainian quota-constrained steel imports do no t comprise a substantial proport ion o f total EU imports o f these products.
In 2001, the EU and Ukraine had a preliminary agreement o n trade in steel products, which envisioned an expansion in quotas by 35 percent t o 373,000 tons for 2004. This agreement has never become effective, and respectively the 2002 quota remained intact (263,600 tons). Moreover, after Ukraine introduced export duty o n metal scrap in 2003, the EU retaliated by cutting the quota by 30 percent.
The actual volumes o f the steel sector’s exports to the EU did no t show m u c h decline, however. This occurred because o f an expansion in products (such as ferroalloys), wh ich are no t covered by EU quotas.
After extensive negotiations, the EU agreed in the context o f a n e w agreement to increase significantly the 2004 quota for Ukrainian steel. This reflects to a large part a recent EU enlargement: the new EU members represent a major traditional market for Ukrainian steel. The EU h r t h e r suggested that the quota could be increased t o 1.4 m i l l i on tons in 2005 if Ukraine eliminates export duty o n scrap. I t i s wor th noting that even after such an expansion, the EU quota would amount to on ly about 10 percent o f Ukraine’s total 2004 exports o f rol led steel.
In thousand tons 1996 2002 2003 2004 2005
EU- 15 quota 212 265.6 184,511 17.9/a 184.51606.117~ 1,4001~ Actual exports to EU- 15 656.8 868.8
a: 117.9 reflects the effective 2003 quota given the fact that the 2003 quotas were approved quite late in the year. b: 606.1 reflects the latest EU-Ukraine draft agreement to revise quotas upward and to reflect EU enlargement. c: Preliminary proposal by the EU.
4.9 These actions considerably changed the commodity composition o f the metallurgy output and exports from Ukraine in favor o f cheaper and simpler products - metallurgical inputs, semi- finished s t i l l products and simpler varieties o f rolled steel. The share o f semi-finished goods in the total value o f the sector’s exports increased from 21 percent in 1994 to 29 percent in 2003, while the share o f scrap metals grew from 0.6 percent to 3.4 percent5’, and o f ferroalloys - from 1.0 to 8.8 percent (Figures 4.2 and 4.3).52 The distinctive feature o f the above products was that they did not fal l under most trade constraints, such as the EU export quotas.
5’ The portion o f scrap metal in total exports reached 8.7 percent in 2002. 52 I t i s worth noting that in the Soviet times, the share of products with the higher degree o f processing, such as sorted rolled steel, was even higher than in 1994.
98

, Figure 4.2: Export structure of Ukrainian ferrous metallurgy in 1994 by type o f product
2% 17%
21% 60 I
i i I3 Metallurgical inputs Semi-finished products W o l l e d steel 0 Other products
Figure 4.3: Export structure of Ukrainian ferrous metallurgy in 2003 by type of product
1% 16%
I 0 Metallurgical inputs 0 Rolled steel
4 Semi-finished products 0 Other products
Source: CED.
4.10 Ukrainian manufacturers have also faced serious market access restrictions introduced against their exports to the principal global markets (EU and USA). However, by the end o f the 90s Ukrainian exporters managed to resolve most o f the init ial problems o f market penetration.
4.11 Sales to Asia amount to about a ha l f o f total ferrous exports. Other major markets include the CIS, Afr ica and Europe (both EU-15 and EU-10). (Fig. 4.4) A s compared to the late 9Os, the major change to the geographical structure o f exports occurred due to a drastic decline in exports to the United States (the share declined from 5.4 percent to 1.2 percent o f the total). This was compensated by expansion in sales to Afr ica (primarily Algiers and Egypt) and to the EU- 15. However, export growth in Europe took place largely at the expense o f scrap metals and other inputs. Overall, the export strategy o f Ukrainian steel producers appears to emphasize markets in Asia and Africa, which together in particular years amounted to two-thirds o f total exports. These markets are considered to have a capacity for further growth, while at the same time they are less competitive.
99

Figure 4.4: Geographic structure of ferrous metal exports in 2003
Source: CED.
4.12 Ukrainian manufacturers are using the current favorable situation in the world market for building up their market reputation. In order to strengthen their position in the market, they have established strategic partnerships with leading steel traders. 11 out o f 15 mi l ls are currently exporting through such traders. This partnership also facilitates exporters’ access to borrowing from foreign banks. In addition, Ukrainian producers made a major effort to improve the quality of their products. Practically al l steel exports are certified by intemational certification agencies. Starting from 2002 the quality control systems o f the largest Ukrainian steel manufacturers have been in l ine with international standards ( IS0 9001-200). In order to reinforce their presence at major export markets, Ukrainian financial and industrial groups in the steel sector (FIGS) have started acquiring metallurgic assets abroad.
4.13 Currently, Ukraine positions i tself o n the market as a competitive manufacturer o f steel products with a l o w degree o f processing. This niche wil l remain the main focus o f Ukrainian exporters in the medium term. So far, their penetration into the market niches o f higher-value products (e.g., coated rolled-stock) has been slow. This is reflected in rather a stable export structure and sustainable average export prices (Table 4.2). Such a conservative nature o f the export structure in the sector i s due to the existing competition o n the global market, on the one hand, and to Ukraine’s current level o f technological capabilities along with the l o w investment level, on the other.
4.14 The year 2003 marked a revival o f the intemal market o f ferrous metals in Ukraine. After a long break, internal prices have started to increase due, first, to a stronger demand on the part o f rapidly developing metal-consuming industries (machine-building in particular), and, second, a reduced supply caused by raised exports. As a result, in 2003 there was a simultaneous growth o f both export and internal prices in Ukraine that created even better conditions for development in the steel sector.
100

l--
-+t-
-H-
101
B. ASSETS, INVESTMENTS AND CAPACITY CONSTRAINTS
4.15 Ukraine has inherited the metallurgic industry f rom the USSR, which largely is based ~~ on ~~
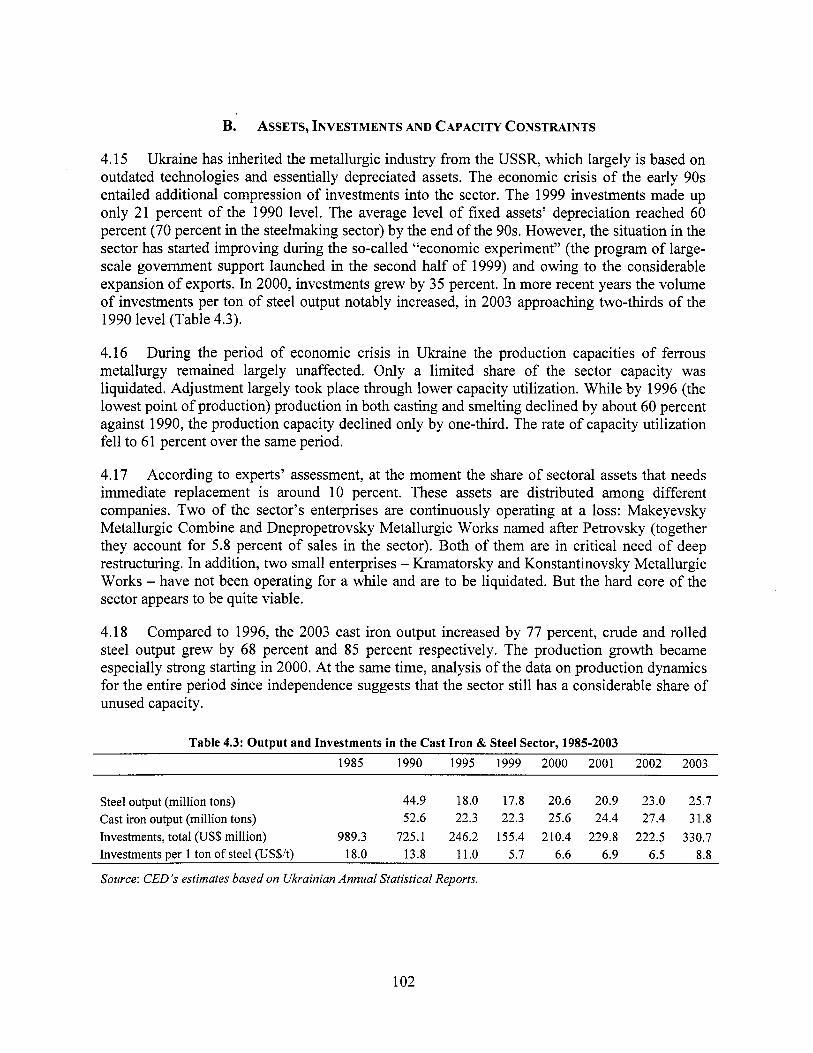
outdated technologies and essentially depreciated assets. The economic crisis o f the early 90s entailed additional compression o f investments into the sector. The 1999 investments made up only 21 percent o f the 1990 level. The average level o f fixed assets’ depreciation reached 60 percent (70 percent in the steelmaking sector) by the end o f the 90s. However, the situation in the sector has started improving during the so-called “economic experiment” (the program o f large- scale government support launched in the second hal f o f 1999) and owing to the considerable expansion o f exports. In 2000, investments grew by 35 percent. In more recent years the volume o f investments per ton o f steel output notably increased, in 2003 approaching two-thirds o f the 1990 level (Table 4.3).
4.16 During the period o f economic crisis in Ukraine the production capacities o f ferrous metallurgy remained largely unaffected. Only a l imited share o f the sector capacity was liquidated. Adjustment largely took place through lower capacity utilization. Whi le by 1996 (the lowest point o f production) production in both casting and smelting declined by about 60 percent against 1990, the production capacity declined only by one-third. The rate o f capacity utilization fe l l to 61 percent over the same period.
4.17 According to experts’ assessment, at the moment the share o f sectoral assets that needs immediate replacement is around 10 percent. These assets are distributed among different companies. Two o f the sector’s enterprises are continuously operating at a loss: Makeyevsky Metallurgic Combine and Dnepropetrovsky Metallurgic Works named after Petrovsky (together they account for 5.8 percent o f sales in the sector). Both o f them are in critical need o f deep restructuring. In addition, two small enterprises - Kramatorsky and Konstantinovsky Metallurgic Works - have not been operating for a while and are to be liquidated. But the hard core o f the sector appears to be quite viable.
4.18 Compared to 1996, the 2003 cast i ron output increased by 77 percent, crude and rolled steel output grew by 68 percent and 85 percent respectively. The production growth became especially strong starting in 2000. At the same time, analysis o f the data o n production dynamics for the entire period since independence suggests that the sector s t i l l has a considerable share of unused capacity.
Table 4.3: Output and Investments in the Cast Iron & Steel Sector, 1985-2003 1985 1990 1995 1999 2000 2001 2002 2003
Steel output (million tons) 44.9 18.0 17.8 20.6 20.9 23.0 25.7 Cast iron output (million tons) 52.6 22.3 22.3 25.6 24.4 27.4 31.8 Investments, total (US$ million) 989.3 725.1 246.2 155.4 210.4 229.8 222.5 330.7 Investments per 1 ton o f steel (US$/t) 18.0 13.8 11.0 5.7 6.6 6.9 6.5 8.8
Source: CED s estimates based on Ukrainian Annual Statistical Reports.
102

4.19 The investment resources currently available to the sector operators are insufficient to - - start their- in-depth restructuring and upgrading. An unfavorable investment climate. i n - l he
country does not facilitate the attraction o f foreign investment^.^^ Local operators are not strong enough yet, but at the same time they remain to be quite hostile to the idea o f strategic foreign investors entering the Ukrainian market. Moreover, the preparation o f large restructuring projects in the sector i s constrained by uncertain forecasts for long-term developments o n the ferrous metals market. Meanwhile, the current favorable state o f the market has provided even more incentives to insiders to postpone decisions on large investment projects.
4.20 The sector currently implements mostly small investment projects focused on a partial and narrowly selected upgrading o f the most deteriorated assets. During the last decade only few new (green field) shops or major pieces o f equipment were put into operation. This approach provides for a cost-efficient equalizing o f the technical level among different stages o f the technological cycle within the companies and facilitates quality improvements. Output growth has been driven mainly by increased capacity utilization and the recovery o f non-operating units. Such an investment strategy so far has proved to be a practical way to support output and export expansion.
4.21 Analysis also shows that new owners o f large metallurgical enterprises focus their medium-term (5-1 0 years) strategies on the utilization o f existing obsolete capacities until their complete physical depreciation. Maintenance and upgrading costs have been kept at the minimum, just enough to meet the immediate market needs and maintain the competitiveness o f products with the niche currently occupied by Ukraine. This strategy ensures the low capital intensity o f current production: 2-2.5 times less than in Russia and 3-4 times less than in OECD countries.
4.22 There are obvious adverse effects o f this investment strategy, including preservation o f obsolete technologies, maintenance o f an excessive energy intensity o f production, and an increased impact on the environment. But ultimately i t is up to market participants to decide when and how much to invest in the sector. In the past, sometimes steel operators managed to use their older assets much longer that outside observers believe i s efficient (Tarr, 1985). However, in the medium term the sector would inevitably face the problem o f liquidation and replacement o f outdated units, starting with those that operated before the 1950s.
4.23 In spite o f a nearly 30 percent decline in metallurgical output during the years o f independence, the sector’s employment leve l has remained practically unchanged. Moreover, employment in the sector increased by roughly 12 percent over the period 1995-2000. Consequently, labor productivity dropped even further than output. In 2003, one employee produced 180 tons o f steel (against 255 tons in 1990). The rate o f labor productivity in the Ukrainian ferrous metal industry i s similar to the one in Russia and i t is above China’s level, but i t i s much lower than in the majority o f countries with more modem metallurgical industries. For
53 I t i s estimated that for the period 1992-2002, total FDI in the ferrous metallurgy and metal processing amounted to U S 2 8 1 mi l l ion (5 percent o f the total FDI in Ukraine). However, it is believed that a considerable portion o f this capital inf low represents a return flight capital o f the sector’s insiders.
103

example, labor productivity in Brazi l i s 471 tons per person, in the EU - 599 tons per person, and in Japan - 63 1 tons per person.
‘ Y . . . 4.24 - m w v e .4 mekuurgy i s q its employment structure, inherited from the Soviet era. Nearly a ha l f o f the enterprises’ staff i s s t i l l employed in operations that are not part o f the metallurgical production i tself and that in OECD countries are performed by independent non-metallurgical companies. Those are, first, construction, maintenance, and technical upgrading o f metallurgical facilities, and, second, social services and agricultural production. The difference in labor productivity in similar metallurgical operations i s not so striking. Ukraine’s productivity is 74 percent o f that in Brazil, 58 percent o f that in the EU, and 55 percent o f that in Japan. In 1999-2003, average labor productivity in the sector increased by about 50 percent.54
4.25 In the 9Os, the Ukrainian metallurgical companies managed to drastically reduce their expenditures on provision o f social services, which were substantial in the Soviet era. First o f all, they almost completely divested to municipalities the most burdensome and costly part o f social assets - housing stock and childcare establishments. In 2003, total spending on social services in the sector made up only 1-3 percent o f companies’ profits and 0.2-1.0 percent o f their total expenses.
4.26 At the same time, the metallurgical companies have recently increased their expenditures on the socially attractive non-core assets (sports, medical, and recreational facilities). For top managers and owners in the sector, spending on such facilities turns into a political resource in their relationship with employees, local and central governments. The growth o f the employment rate in ferrous metallurgy since 1995 was primarily due to the expansion o f non-core activities. The latter constitutes a major reserve for employment rationalization.
c. GOVERNMENT POLICIES: MAIN INSTRUMENTS OF SUPPORT TO LOCAL STEEL PRODUCERS
4.27 Ukraine’s ferrous metals industry has been traditionally enjoying significant government support due to the importance o f the role it plays in the economy. In the event o f privatization in the sector,55 the majority o f enterprises fe l l under the control o f several large domestic financial and industrial groups (FIGs).
4.28 Privatization and subsequent operations o f the privatized and state-owned assets in ferrous metallurgy have formed the basis for the emergence o f the largest private companies in Ukraine. This process has nearly the same political and economical importance for the economical development and economical pol icy of today’s Ukraine as had similar processes in the Russian o i l industry At present, the process o f consolidating controls in the sector by new owners i s close to being completed. The Ukrainian FIGs generally are vertically-integrated
54 It is worth noting, however, that during the latest period o f economic expansion labor productivity in Ukraine’s entire real sector has been growing rapidly, and in this respect the steel sector under-performed significantly relative to the rest o f manufacturing. 55 The share o f state owned enterprises in the total sectoral output declined from 93 percent in 1992 to 45 percent in 1995 and to 14 percent in 1999 (Kuzmyn, 2002).
104

companies that have established an efficient control over financial flows o f formally independent enterprises, especially suppliers o f raw materials and other inputs.
4.29 implementing policies that facilitated rapid capital consolidation by new owners. The latter pol icy included such measures as privatization “by request” o f influential private sector players, maintenance o f l o w prices on industrial inputs (raw materials, energy, and transportation), maintenance o f soft budgetary constraints for large firms. In particular, the government did not impose any significant sanctions on firms that had accumulated considerable tax and energy arrears. I t was also a liberal observer o f the large-scale outflow o f new owners’ capital from the country.
I11 th e 98s, the government-activdy but i n d i r w - p r o - Y
Box 4.2: Kryvorizhstal Privatization: Insiders Won, Who Lost?
The sale o f Kryvorizhstal was the largest, controversial privatization effort in the history o f Ukraine. In mid-2004, the 93 percent stake in the giant ferrous metallurgy firm was sold to the Investment Metal lurgy Un ion (IMU), a consortium o f two major domestic FIGS (Interpipe and System Capital Management), for UAH 4.26 b i l l i on (approx. US$0.8 bil l ion). The qualif ication requirements for bidders, quality o f privatization procedures, and a short tender duration, a l l suggest the discriminative nature o f t h i s tender. Failure to conduct such a major transaction transparently damaged Ukraine’s investment image and in the medium te rm locked the country out o f benefits associated with the potential entry o f the global international player. In addition, government revenues fe l l we l l be low the original ly forecasted asset value o f Kryvorizhstal (estimated at about US$1.5 bi l l ion, Le., about 3 percent o f GDP).
Kryvorizhstal i s the largest Ukrainian ferrous metal producer that accounts for almost 2 0 percent o f domestic steel and cast i r on production with over 50,000 employees. In 2003, being fully state-owned, it generated over US$0.25 b i l l i on in profits.
The major discriminative requirement for bidders was a request to have experience in domestic coke production for at least three years (two o f wh ich had to be profitable), a condition that n o potential foreign bidder and very few domestic bidders could satisfy. Aside f r o m being explicit ly discriminative against foreign competitors, this requirement had l i t t le economic sense. Formally, i t intended to address the issue o f growing domestic prices o f coke (due to expansion in its exports) by further consolidation o f the sector under the control o f f ew vertically integrated ~ompan ies . ’~ As a result o f such a policy, the combined share o f the new owners o f Kryvorizhstal in Ukraine’s total steel production may reach 50 percent. This poses a real risk o f undermining competit ion in the sector.
The tender procedure was further complicated by the tight timetable for submission o f necessary b idd ing documents. Given these t ime constraints, a tender requirement for bidders to be registered in the national company registrar became a separate major obstacle.
Despite participating foreign bidders (LNMAJS Steel and SeverstaliArcelor) offering substantially larger bids (the L N M - U S Steel consortia offered about U S $ l . 5 bil l ion), the IMU was selected as a winner. The fact that the primary owners o f the IMU are k n o w n to have close ties with the current government does no t provide for additional credibil i ty t o the transaction. The privatization procedure generated strong resentment among Russian and British bidders. I t may have longer-term negative implications for Ukraine’s commercial diplomacy in times when the country needs the additional good wil l o f i t s partners to accelerate WTO accession and regional integration mocesses.
56 An immediate concem relates to the dominance o f vertically integrated companies and is l inked to potential price discrimination: independent and potentially more efficient steel producers w i l l face higher prices for major inputs (such as coal) compared to those steelmakers who are subsidiaries o f the FIGS that also control/own producers o f inputs (e.g., coal mines).
105

4.30 Under these circumstances, the formation o f powerful FIGs has expanded the lobbying capacity o f the sector,57 ensuring i t s access to various types o f government support.’* The interests o f FIGs are explicitly taken into account in both intemal and foreign policies o f the
the Eu are considered. The recent privatization o f Kryvorizhstal, the largest Ukrainian steel producer and the last major metallurgical firm, whose privatization was initially delayed, illustrates the political leverage o f sector insiders (Box 4.2).
mr\ 4
4.3 1 The main instruments o f government support for the sector have recently included:
0 restrictions on scrap metal exports; 0 tax benefits granted within the “experiment” o f 1999-2002; 0 maintenance o f l ow energy tariffs, primarily for electricity.
4.32 Due to the upsurge o f prices at wor ld markets, Ukraine and other countries with a developed metallurgy sector have faced the challenge o f skyrocketing domestic prices and expanded raw material exports, including exports o f scrap metals (Figure 4.5). Steelmaking in Ukraine requires a larger use o f scrap since it s t i l l relies more widely on open-hearth furnaces. To ensure the same quality o f steel, the latter technology implies higher scrap consumption (70- 90 percent higher) per unit o f output compared to the newer oxygen-based technology. In other words, the higher intensity o f scrap consumption enables Ukrainian steelmakers to improve the quality o f their steel and thus make it more competitive internationally.
140 120 100
80 60 40
20 0
Figure 4.5: Evolution o f scrap metal prices, 1999-2003, USD/ton
__ + E x p o r t p r i c e
-w- D o m e s t i c r i c e exc lus ive %AT
-A- W o r l d m a r k e t p r i c e
1999 2000 2001 2002 2003 I
Source: Data from the Ministry for Industrial Policy and the National Statistical Sewice, world market prices are according to httrJ://wtvw.steelonthenet. com/vfk. lztml
’’ See World Bank (2004) Ukraine Country Economic Memorandum on the role o f the financial and industrial groups in Ukraine in the latest period o f economic recovery. 58 Subsidization o f domestic steel producers has been common to both developed and developing countries, including Brazil, Turkey, India, China, and Egypt. Multilateral talks to introduce intemational ru les in this area and limit the amount o f subsidies, led by the OECD, have been unsuccessful so far.
106

4.33 In response to growth in global demand, Ukraine became one o f the f i rs t countries that introduced restrictions on scrap metal exports.59 Initially, the GOU employed administrative restrictions, but since January 1, 2003, i t introduced an export duty o n scrap metal in the amount o f Euro 381%. ~~~~ ~ ~ ~ ~~
4.34 On the one hand, the measure caused Ukraine certain both political and economic losses:
0
.
Poli t ical losses. While Ukraine’s partners protested aggressively against the tax, the country’s international image has been affected, and the process o f Ukraine’s integration into the EU has slowed down. In addition, this step raised pressures inside the country in favor o f further administrative interventions into metal markets. Inter alia, the industry’s lobby has been insisting (so far unsuccessfully) on introducing quotas and export duties for other types o f metallurgic inputs (coke and i ron ore). Economical losses. In 2003, the EU cut the de facto quota o f Ukrainian steel imports to 117,900 tons. Had the duty been removed, the quota would have been expanded to 373,000 tons in 2004 without the enlargement adjustment. A s a result, the Ukrainian enterprises had to shift exports to markets with lower prices that incurred certain financial losses to the industry. Moreover, overall collection and supply o f scrap in Ukraine declined in 2003 because o f weakened incentives for scrap operators.
0
4.35 benefits to Ukraine, such as:
On the other hand, restrictions on scrap metal exports have brought some immediate
0 a major expansion in scrap supply for domestic metallurgic enterprises,60 which in 2003 reached the highest level for the 1 0-year period (9 1.2 percent o f the total estimated needs o f the industry);
0 reducing costs o f rolled stock production and receiving extra yields (estimated at US$36.6 million);
ensuring additional budgetary receipts, including scrap export duties (estimated at US$41.3 million).
0
4.36 Overall, primarily due to the increased global demand for steel in 2003, exporters’ aggregate net losses appeared to be insignificant. The losses in exports to Europe were compensated by increased sales at other markets. After losing the quota o f 237,000 tons o f the de facto quota for exports to the EU, Ukraine’s growth in exports to the CIS in 2003 amounted to 1,258,000 tons, and to Af i ican countries - 515,000 tons. Under different market conditions, however, the impact on the industry would have been more damaging.
59 Other countries have recently initiated similar limitations o f scrap exports. In 2001, Russia introduced a duty of 15 percent or at least 15 EUROit on scrap exports, while South Korea has started to apply i ts licensing. Since October 2003, Serbia introduced a duty on scrap exports in the amount of 15 percent o f i t s customs price. Protective measures have also been established by Venezuela.
6o Introduced restrictions proved to be quite efficient in limiting exports of scrap metals: from the average o f 4.8 million tons in 1999-2002 to 3.8 million tons in 2002 and 1.9 million tons in 2003.
107

4.37 Unfortunately, some in Ukraine have interpreted the temporary positive effects from the use o f export restrictions to justify a broad adjustment in policies aimed at expansion o f govemment regulation o f the industry and primarily at maintaining l o w input prices. Such perceptions indeed 4 ” e - + m p m -directly affect exporters and entail further distortion o f market signals. These recent measures include, inter alia, increased rail. freightage rates for export of metallurgic raw materials and additional complications o f customs clearance procedures for exports.
4.38 Moreover, new shadow mechanisms have emerged to bypass the administrative restrictions o n exports. In particular, the countries that have free trade agreements with Ukraine remain free o f export duty o n scrap, and they are being used by exporters as duty-free transit channels. As reported by the Ukrainian media, in 2003 scrap exports to Georgia and Moldova were estimated to exceed 30 percent o f the total Ukrainian exports o f scrap metal.
4.39 International experience suggests that export tariff restrictions may be used only as short- term extraordinary measures. In the long run, they wil l entail serious adverse effects o f restrained competition and distortion of market signals that are the basis o f strategic decision-making in the sector. Strategically, Ukraine has no other choice than to bring its national system o f metallurgy regulation and support in l ine with the generally recognized WTO and EU standards. In particular, despite the fact that export taxes are not i l legal under the WTO, the reality o f accession process would require that the Ukrainian government makes a commitment to change this policy. A practical solution would be the development o f a schedule for the gradual (e.g., for the next 5-6 years) phasing-out o f scrap export duties as part o f the government strategy o f W T O accession. Moreover, such gradual phasing out should be supplemented with a considerable (up to 50 percent) one-time cut o f the duties in 2004-05.
Economic Experiment of 1999-2002
4.40 The Ukrainian government never provided direct budgetary support to steel producers l ike i t did, for example, to the coal sector and agriculture. In the early 90s the GOU provided the metallurgy sector with some support that was mostly on a case-by-case basis and was insufficiently transparent (Le., largely kept outside o f the scope o f annual budgets), such as writing-off tax arrears, granting government guarantees to back commercial loans, etc. The economic experiment undertaken between July 1, 1999 and January 1,2002 that involved almost al l the large metallurgical enterprises (overall 73 enterprises participated in the experiment) has been the only example so far o f government support to the sector, which was more o f a programmatic nature. The experiment was aimed at the financial rehabilitation o f metallurgic enterprises and the consequent increase o f exports, investments and demand in related industries. The analysis that pre-dated the experiment indicated that the lack o f working capital and accumulation o f arrears had completely blocked enterprise development.
4.41 Despite some improvements, the experiment as a program o f massive govemment subsidies remained far from being fully transparent. In a situation o f considerable state budget deficit, the G O U decided to use writ ing-off and restructuring o f tax arrears, and introduction o f tax and other payment benefits as i t s primary financial rehabilitation instruments. Moreover, the Government has never undertaken a comprehensive cost-benefit analysis o f the program. Thus,
108

the real contribution o f the experiment to the eventual recovery o f the sector i s not easy to measure accurately.
A A ? n . . ~~ -t.-t.L u m - t h e - ~ ~ ~ - ~ ~ 3 ~ j h k S
and tax benefits) provided to ore mining and steelmaking enterprises were estimated to amount to UAH 2.7 b i l l ion (US$514 million). This i s equivalent to an annual subsidy for a three-year period in the amount o f nearly 2.9 percent o f annual sales in the sector. In addition, during the same period the same enterprises were granted a tax deferral worth about UAH 2 bi l l ion (US$450 million).
4.43 During the short period o f time, the rendered financial support along with the contribution f rom other essential factors has drastically improved the sector’s financial position as follows:
0 Profitability has improved markedly. In 2003, the average profitability rate in the sector reached 13.5 percent (due to both increased efficiency and pricing factors), while investment rates increased considerably primarily because o f reinvested profits. Shortage o f working capital has disappeared enabling a decline in the share o f barter in total sales from 38 to 3 percent. Enterprises have become reliable taxpayers. After the experiment they have not been accumulating any more arrears due either to the budget or to energy and input suppliers. By experts’ estimates, in 2002 the sector paid the budget 3.5 times more in real terms than in 1 999.6’ The drastic expansion o f metallurgic exports has become a primary source o f monetary and macroeconomic stabilization in the country.
0
0
0
4.44 The above results look even more significant considering the crisis situation on the global steel market during the same period o f 1999-2001. I t i s particularly important to highlight the psychological aspect o f the experiment. Having de facto declared a tax amnesty, the GOU has reduced the enterprises’ r isks o f potential bankruptcy and tax fines. This improved expectations for both companies’ owners and managers that facilitated investments and more broadly implementation o f long-term development projects, and has also reduced capital flight.
4.45 However, the successes in the sector could not be attributed solely to the considerable financial support provided by the government. The situation improved also because the support provided coincided with other essential factors, such as:
0 Ukraine’s general economic recovery after 2000 that was due to genuine fiscal stabilization and improved payment discipline;
0 economic growth in Russia and consequent surge o f demand in the Russian market; and 0 effects o f mostly completed privatization, and consolidation o f control by new owners.
I t i s worth noting that tax compliance in Ukraine improved considerably across the board starting f rom 2002, reflecting major efforts o f the Govemment to strengthen financial discipline in the economy.
109

4.46 Therefore, the G O U should be careful not to overestimate the experiment’s role. Moreover, i t i s worth noting that under present conditions o f a rapidly growing economy, repeating a similar program o f large-scale subsidization in other sectors would be even less j t t s t i f i - i d w .
4.47 The experiment was terminated in 2002, in part, because o f the increased number o f antidumping investigations triggered by experiment-induced subsidies, the steel operators requested the Government to stop the program. Since then the sector’s taxation practice has been in l ine with the general requirements o f Ukraine’s tax legislation.
Energy subsidies to metallurgy
4.48 Government tar i f f pol icy in the energy sector currently represents a major instrument o f implici t government support to the real sector in Ukraine. The metallurgy (both ferrous and non- ferrous) sector i s a major recipient o f implici t energy subsidies in the non-residential sector. The metallurgy sector received energy subsidies worth about US$0.3 bi l l ion or 0.7 percent o f GDP in 2002. The metallurgy sector accounted for about half o f al l implici t energy subsidies to the Ukrainian industry. Most energy subsidies were provided in the form o f l o w electricity tariff while, according to World Bank’s estimates, full economic costs o f producing and delivering electricity to large industrial consumers in Ukraine amount to 3.0 c per kWt-hour, the 2002 average tar i f f (net o f VAT) in metallurgy was only 2.3 c. The 2002 energy subsidies amounted to about 4.7 percent o f Ukraine’s off icial ly reported metallurgical (ferrous and non-ferrous) exports o f US$5.9 billion.
4.49 I t i s worth noting that we do not have data to estimate allocation o f the total energy subsidy ‘among ferrous and non-ferrous metallurgy sub-sectors. Whi le the ferrous metallurgy sector (which i s the subject o f the analysis in this chapter) shows larger output and sales, i t i s likely that i t receives a somewhat smaller portion of total energy subsidies because the non- ferrous metallurgy sector i s much more energy intensive. Still, i t may be proper to assume that the implici t energy subsidies to ferrous metallurgy could reach 0.5 percent o f GDP a year in the early 2000s.
4.50 At the same time, i t has to be mentioned that the 2002 situation shows a clear decline in the level o f energy subsidization. In 1999, energy subsidies to the sector amounted to an estimated 1.4 percent o f GDP. Most o f this decline derived from the upward adjustment in the power tariff (from less than 1.6 c in 1999). Gas subsidies to metallurgy have been insignificant. The average gas tari f f for metallurgy exceeds 90 percent o f the respective LRMC. However, the sector received some additional energy subsidies through depressed coal prices. However, we do not have data to estimate the amount o f the latter, so coal subsidies are not reflected in the above aggregates.
The issue of VAT refund to steel exporters
4.51 The problem o f timely and accurate VAT refund to exporters has been a major fiscal and governance issue in Ukraine for several years (World Bank, 2004). In any event, the matter goes much beyond the problems of steel exports or for that matter o f the trade policy. However, i t i s worth noting that steel producers, as most other leading country’s exporters, are seriously
110

affected by delays in VAT refund. I t i s estimated that at the end o f 2003 the total amount o f VAT refund due to steel exporters exceeded US$200 million. While this amount represents a considerable and unnecessary tax on the industry, there i s no s i g n that these delays so far have
t k e " H o r the sector's m p m m s s ; - m v e L v i c i ~ ~ steel exporters (through their affiliated traders) do participate in various schemes to inflate values of VAT refunds. This known fraud with the V A T refund does not make a reform o f VAT administration less urgent: the government has to upgrade the system, based on the best international practice, to ensure its transparency, equity and protection from external manipulations. A s surveys o f Ukrainian exporters confirm, this i s an important measure toward a general improvement in the economy-wide business environment. Given that the current arrangements are especially harmful to small and new exporters, which in the existing system do not have sufficient leverage to lobby for VAT refund, sorting out the VAT administration has to be a priori ty for any future export diversification program the GOU may want to pursue.
. .
D. COMPARATIVE ADVANTAGES OF UKRAINIAN FERROUS METALLURGY
4.52 The main competitive advantage of Ukrainian metallurgy i s due to traditionally low domestic prices on sectoral inputs and energy resources. Until now, it has supported a lower leve l o f unit production costs comparing to OECD countries even considering the higher material (by 5-7 percent) and energy (by 25-30 percent) intensity o f production in Ukraine. Based on 2003 data, the estimated comparative cost advantages with respect to four principal inputs (coke, i ron ore, natural gas and electricity) showed that even accounting for relative over-consumption o f these resources, total unit costs in Ukraine made up only 87.4 percent o f similar costs at average world market prices.
4.53 factors :
Extra sources o f comparative advantages o f Ukraine's metallurgy relate to the following
a lower labor costs62; b low investment/capital expenses; and c l ow costs related to environmental protection.
4.54 and Germany are shown in Table 4.4.
M a i n differences in the aggregated structure o f costs in ferrous metallurgies o f Ukraine
Table 4.4: Comparative cost structure in ferrous metallurgies o f Ukraine and Germany in 2001(in per cent) Ukraine Germany
Material costs 78.5 59.8
Payrol l costs 6.9 25.2 Spending o n social assets and services Other operational costs 8.1 5.0
Depreciation charges 4.0 10.0
2.5
~
In 2003, the monthly average wage in Ukraine's ferrous metallurgy was about US$200 while i t was nearly US$500 in Russia, Poland and Brazil (source: www.infmetal.org).
111

Source: ‘National Metallurgy of Russia’ magazine, September-October 2003, p. 10.
4.55 I t should be noted that the abovementioned estimates o f the sector’s comparative a b n t a g e s take full account o f the s~ on m- in 2003 fueled by the growth of world market prices. Within a year a considerable conversion o f global and domestic input prices has taken place and aggregate production costs per one ton o f rolled steel increased in Ukraine by 17.3 percent. However, this did not worsen the sector’s financial position since the internal and export prices were growing faster than costs. Compared to 2002, the sector’s profitability rate rose from 7.5 to 13.5 percent in 2003.
. . . . . .
4.56 Pricing in the coal industry has been changing the most recently. Ukraine’s coal mines traditionally enjoy an explicit government subsidy in an amount o f more than US$0.5 bi l l ion a year. These subsidies for a long time have been helping to depress domestic coal prices in Ukraine thus allowing for reduced metal production costs. The situation has started changing, particularly with regard to coking coal. First, the bulk o f coal industry subsidies by now are allocated to the mines that extract steam rather than coking coal: in 2003, coking coal producers received less than 10 percent of total subsidies to the industry. Second, exports o f Ukrainian coke increased drastically (5.4 times during 1999-2003). That has implied coke shortages o n the internal market, expansion o f i t s imports and a consequent alignment o f national and global coke prices. In 2003, the internal coke prices grew by nearly 60 percent.
4.57 The analysis shows that in general in the next 5-7 years the Ukrainian cast iron and steel sector will manage to retain its main competitive advantages notwithstanding cyclical price fluctuations on the global market. The cost advantages available to the sector at the moment make i t relatively resistant to potential external shocks and challenges. The major factors o f retaining the sector’s competitiveness in the middle run are the following:
0 The existence o f large vertically-integrated companies that wi l l retain control over the sources o f relatively cheap inputs (including iron ore and ferroalloys). The existence o f a developed raw material base, inherited from the Soviet era, which in the medium term would not require significant extra investments and would ensure l o w transportation costs, making the sector less vulnerable to the situation in global markets. Maintenance of l ow energy tariffs (compared to the EU) primarily due to the secured access to Russian and Turkmenistan gas that i s supplied under long-term contracts. Lower investment and payroll costs. Higher profitability rate for major steel producers that provides them with an extra safety margin.
0
0
0
0
4.58 Extra (latent) financial reserves existing in the sector are reflected in the high margins o f i t s export operations. This margin also includes a part o f revenues that producers prefer to leave outside the country. The comparison o f stated export prices and global sale prices shows that the export sale margin currently reaches 20-25 percent o f the registered export price.
4.59 grounded the conclusion on i t s resistance to potential external shocks.
Table 4.5 shows the principal indicators o f the sector’s financial performance that have
112

Table 4.5: Financial indicators o f Ukraine’s ferrous metallurgy (calculated per 1 ton of rolled steel)
1999 2000 200 1 2002 2003
Production costs, US$/t 169.6 150.1 160.9 168.9 202.2 Revenues from sales, US$/t 174.1 176.0 175.2 181.5 229.5 Pre-tax profits, US$/t 4.5 25.9 14.3 12.6 27.3 Profitability, percent 2.7 17.3 8.9 7.5 13.5 Internal wholesale prices, net 26 1.2 239.3 226.9 215.3 258.8 o f VAT, US$/t Export prices, US$/t 159.7 179.8 175.5 176.7 224.8
percent to export prices
percent to export price
World market prices*, in Expert estimate 124-1 65
Export sale margin*, in Expert estimate 20-25
* Relates to the prices o f principal commodity groups o f Ukrainian steel exports. Source: DECs estimates on the data from the Ministy of Industrial Policy and State Statistical Agency, and www.meus,co.uk, www.metaltorg.ru.
E. MEDIUM-TERM PROSPECTS
4.60 Based on intemational projections, Ukrainian experts estimate that external conditions for the development o f ferrous metallurgy in the middle run will remain favorable. The prices for Ukrainian rolled steel exports are expected to remain at the same high levels throughout the whole period. While a certain drop in global steel prices seems very possible after 2007, average ferrous metal prices for the period to 2010 are not expected to be lower than their 2003
4.61 In such conditions, the Ukrainian cast i ron and steel sector will most l ikely fol low the inertia part based on i t s current development model. Production capacity will be expanded by only about 5 percent through reconstruction and partial upgrading. Further improvements in capacity utilization wil l remain the major source o f output growth.
4.62 Rolled steel output is expected to grow by 11.5 percent (Table 4.6) and steel output by 10.5 percent (Table 4.7). The growth will be driven primarily by increased internal demand. Export volume wil l remain practically intact. However, there are expectations o f significant shifts in the structure of exports toward products with a higher degree o f processing that would allow for raising unit export proceeds by 25-30 percent.
63 I t i s worth noting that the recent forecast by the Economist Intelligence Unit i s much more conservative. I t suggests that global metal prices would start to fall slowly by 2005. An aggregate drop in prices during 2005-08 i s estimated at 25 percent, Le., prices will actually come back to the 2003 level. However, given that 2003 prices were also significantly higher than the average steel prices for the last 10 years, this scenario should not generate major problems for Ukrainian producers either (Source: www.eiu.com).
113

4.63 By the end o f the period the demand on the global market i s expected to follow the downward trend, and that wil l be the time for the Ukrainian ferrous metallurgy sector to start a gradual closing down o f i t s depreciated production units. By that time Ukrainian operators should be-able t o ~ ~ ~ f ~ ~ t ~ ~ - ~ ~ ~ ~ o ~ e ~ t ~ ~ they -are likely to accumulate the required investment resources to finance the sector-wide restructuring effort that would be needed.
Table 4.6: Ukraine’s projected output, domestic consumption, exports and imports of rolled steel in 2004-10, million tons
2003 2004 2005 2010 Growth, 2003- forecast forecast forecast 201 0, percent
output 31.4 33.6 34.0 35.0 11.5 Exports, 24.8 26.45 26.5 24.5 -1.2
Including:
finished goods f lat rolled steel 8.02 8.35 8.5 9.0 12.5 assorted rolled steel 6.34 7.10 7.3 8.0 26.0
Imports 0.80 0.85 0.9 1 .o 25.0 Domestic consumption 7.40 8.00 8.4 11.5 49.0
Inputs and Semi- 10.18 11.0 10.7 7.5 -26.5
Source: Estimates by the Ukrainian Economical Research and European Integration Policy Institute under the Ministry of Economy.
4.64 Projected growth is expected to entail a gradual employment reduction (about 10 percent by 2010) and a labor productivity growth in the sector (Table 4.7). In the medium run, labor cuts in the metallurgy sector wil l not be concentrated and remain mostly local phenomena. The current investment pol icy o f Ukraine’s metallurgical enterprises does not imply any considerable changes in labor productivity and, as a rule, i t does not entail any significant employment cuts in the sector. The expected capacity reduction wil l primarily concern individual units within the larger combines, but wil l not affect entire companies. The metallurgy sector also accounts for a relatively large share o f pensioners in the total number o f employed. This provides extra room for future smooth restructuring and employment adjustments.
4.65 However, the issue o f labor force releases in the metallurgy sector could become sharper in the long run, considering the expected cyclical recession on the global steel market and the ultimate need for a deep restructuring in the sector.
Table 4.7: Medium-term projections for output and employment in Ukraine’s ferrous metallurgy sector 1990 1995 2000 2001 2002 2003 2005 2010
forecast forecast
Steel output, mil l ion tons 52.6 22.3 31.8 33.5 34.5 37.5 40.5 41.0
Number o f employed, thousand 206.6 193.4 216.2 216.1 212.0 208.0 198.0 186 Growth, percent to previous year -57.6 142.6 105.3 103.0 108.7 108.0 101.2
Labor productivity, tons per person 255 115 147 155 163 180 205 220 Growth, percent to previous year -6.4 11.8 -0.1 -1.9 -1.9 -4.8 -6.1
Growth, percent to previous year -54.9 127.8 105.4 105.2 110.4 113.9 107.3
Source: C E D s estimates on the basis of data from the Ukrainian Annual Statistical Reports.
114

F. CONCLUSIONS
4.66 Ukraine’s cast i ron and steel sector in the middle run will fol low the existing development model that i s primarily based on outdated technologies and technical assets. This model wil l be efficient as long as the level o f global steel prices i s high, allowing Ukraine to retain its advantages as a lower-cost supplier o f low-end products. However, high material and energy intensity of metallurgical products and low labor productivity may threaten the sector’s competitiveness in the future.
4.67 In the medium term, the ferrous metal sector would not be able to remain a driver for further expansion in overall Ukrainian exports. For the period to 2010 the sector i s expected to maintain the current volume o f steel exports, while gradually increasing the quality o f steel products and unit value of export proceeds. Despite the sector maintaining its leading position in Ukraine’s foreign trade, i t s share in total exports i s expected to go down.
4.68 The sector’s development within the existing model wil l be impossible by the end o f the decade. Ukraine will face the need to pick a new model for the development o f its steel sector. In that period the government and the sector’s operators will face serious problems regarding the need to attract large-scale investments to implement in-depth sector-wide restructuring and settle environmental and social problems in the metallurgical regions.
4.69 Ukraine’s cast i ron and steel sector i s highly export oriented and i t s development i s strongly influenced by global market trends. Therefore, global integration processes, f i rst o f a l l Ukraine’s entry in WTO, wil l provide the sector with significant potential benefits, such as:
0 reduction o f limitations on the access o f Ukraine’s metallurgy products to principal foreign markets; better opportunities for protecting the interests o f Ukrainian producers under WTO procedures; improved possibilities for attracting foreign investments; and improvements in the domestic business environment due to stabilization and better transparency o f the legal and regulation framework.
0
0
0
4.70 Trade liberalization will not threaten Ukrainian producers’ operation o n the national market as far as they preserve significant cost advantages. At the same time, Ukraine’s entry into the WTO will require the limitation and further abolition o f specific arrangements that benefit domestic producers, as wel l as the leveling o f competition conditions for national enterprises.
4.71 Today’s pol icy of government support for individual industries and enterprises should be replaced by a new industrial pol icy that would focus on creating incentives for private investments in an environment o f equal conditions for al l market participants, as well as o n creating real sector support mechanisms that would meet WTO requirements. In particular, a new governmental pol icy in the sector should be based on the fol lowing principles:
0 transparent and maximum competitive privatization, including in the coal industry;
115

0 withdrawal from administrative intervention in market mechanisms (administrative limitation o f exports, raw material pricing and transportation tariffs);
0 ~ tar i f f pol icy ~~~ reforms in the energy industry and a gradual transfer to tariffs that are based upon estimates o f full costs (LTMC); concentration o f budgetary support to the sector for programs that tackle elimination o f outdated capacities, implementation o f social and environmental measures in vulnerable regions, and financing o f research infrastructure projects.
0
4.72 The future competitiveness o f Ukrainian metallurgical companies wil l largely depend upon the rate o f restructuring o f the existing major operators in the sector, including changes in their corporate management mechanisms. On the one hand, the existing sectoral structure with a, l imited number o f dominant vertically-integrated corporations is currently a source o f considerable cost advantages for the sector and provides Ukraine with significant economic and fiscal benefits. On the other hand, i t may become a source o f non-competitive tendencies and a barrier for sectoral restructuring. The situation has to be monitored closely. As a first step, existing Ukrainian legislation should be amended to take into account the realities o f operating large private corporations. At the moment, Ukrainian FIGs remain mostly informal structures, and this makes i t complicated to monitor their operations and behavioral pattems. The legislation should allow for legalization o f FIGs, which should include introduction o f consolidated reporting and taxation arrangements.
116