Embed Size (px)
Citation preview

L.C. Jain et al. (Eds.): Innovations in Defence Support Systems - 2, SCI 338, pp. 207–240. springerlink.com © Springer-Verlag Berlin Heidelberg 2011
Chapter 7
Biorhythmic Analysis to Prevent Aviation Accidents
R.K. Saket1,*, Wg. Cdr. S.P. Kaushik2, and Col. Gurmit Singh3
1 Department of Electrical Engineering, Institute of Technology,
Banaras Hindu University, Varanasi-221005, Uttar Pradesh, India [email protected], [email protected],
[email protected] http://www.itbhu.ac.in, http://www.bhu.ac.in
2 Department of Mechanical Engineering, Sobhasaria Engineering College, Sikar (Rajasthan), India
[email protected] 3 Faculty of Engineering and Technology,
Sam Higginbottom Institute of Agriculture, Technology and Sciences–Deemed University,
Allahabad (Uttar Pradesh), India [email protected]
Abstract. The Word “Biorhythm” is derived from the Greek word “Bios” which means life and “Rhythm” which means flowing with a regular move-ment. Biorhythm theory uses mostly scientific methods to chart the rhythms or cycles that affect the internal functioning of the body and of human behavior. This is particularly applicable to the physical, emotional and intellectual or men-tal abilities. Biorhythm theory states that, at the moment of birth three statistical cycles are initiated and these will recur consistently throughout life. This chapter proposes an investigation of the reasons for human error as a contributing factor in flying accidents. Physical factors such as man machine interactions involved in flying mistakes and a taxonomic approach to errors has been proposed in this chapter, in order to avoid accidents. This chapter presents a new methodology based on a probabilistic approach for biorhythmic analysis in an attempt to pre-vent aviation accidents. The methodology has been developed using a Gaussian distribution technique for evaluation of the aviation system reliability consider-ing the biorhythmic effects on the pilot. Normal distributed data from the US air force were tested and analyzed. These were based on the performance ability of pilots and the peak demand of the performance using a Gaussian distribution approach. Validation of an aircraft accident due to biorhythm is explained in this chapter with consideration of the peak performance demand and differing stan-dard deviations in the performance ability of each pilot. A new curve named the Incident – Duration Curve has been introduced. This is based on a biorhythmic analysis of Indian and US air force data. The area under normal distribution curve of the US air force data represents the successful performance ability zone
* Corresponding author.

208 R.K. Saket, S.P. Kaushik, and G. Singh
of the Pilot. The accident zone is the area of operation during which the Perfor-mance Demand exceeds the Performance Ability of the particular aircraft pilot. Operation within the zone of the normal distribution curve is successful owing to ability and fitness of the particular pilot. Failure probabilities considering Peak Performance Demand and pilot’s ability have been evaluated using a Gaussian distribution approach. A Safety Factor Concept is also given in this chapter. This has been done so as to include biorhythmic analysis in the attempt to avoid aviation accidents. A Stepped Incident-Duration Curve has been uti-lized in order to evaluate the particular pilot’s reliability when using the system. The complete aviation system was evaluated by using Simpson’s 1/3rd rule.
Keywords: Biorhythmic Analysis, Incident-Duration Curve, Performance Ability of that pilot included items such as: Performance Demand, Accident Prone Zone/Critical day, Gaussian distribution, Reliability Evaluation, Safety Factor.
1 Introduction
The word Biorhythm is derived from the Greek word Bios means life and Rhythm meaning a regular moment. Biorhythm theory mostly uses scientific methods to chart the rhythms or cycles that affect the internal functioning of the body and human behavior in particular based on the physical, emotional and intellectual or mental abilities. The biorhythm theory states that from the moment of birth three statistical cycles are initiated and they recur consistently throughout a person’s life. Our Productivity, Efficiency, Intelligence and activity levels are not merely just matters of will power. Thommen George S. (1973) has explained that each of us is subjected to biological rhythms. The three biorhythm cycles have indepen-dent duration and influence. These cycles compose the classical theory, which became popular with the general public after 1970. The earliest observed biologi-cal cycles were recorded by Alexander the great scribe, Androsthenes, in the fourth century BC. Many studies done abroad, including the United States during the 1940’s and 1950’s have demonstrated a higher disposition towards accidents and human error that coincide with these biorhythmic cycles. The physical, emo-tional and intellectual biorhythm cycles have sinusoidal characteristic and are shown in fig. 1. They are of 23, 28 and 33 days duration, respectively. At birth these cycles begin at zero and then follow the above sinusoidal characteristics. This characteristic goes in the plus direction and return to zero or mid cycle, then go in the minus or downward direction. They then turn around and return to the positive. The cycle is then repeated. Biorhythm cycles are thus composed of posi-tive phases, negative phases and nodal points where the curve crosses the abscissa. Hines, Terence M. (1998) state each cycle starts on the positive phase at the mo-ment of birth. The positive phases correspond to periods of better performance and the negative phase corresponds to periods of poor performance and the greatest susceptibility to harm. Critical periods are usually 24 hrs to 48 hrs duration. The physical cycle has a 23 days period and affects a broad range of physical factors like resistance to disease, strength, coordination, speed and other basic body
Biorhythmic Analysis to Prevent Aviation Accidents 209
functions. In addition to a sensation of physical well being, the emotional cycle has a period of 28 days and affects creativity, sensitivity, mental health and mood for example. The intellectual cycle has a period of 33 days and it affects memory, alertness, receptivity to knowledge and logical analytical functions of the mind. Since the periods of all three cycles are different (23, 28 and 34 days), the interac-tion of the three cycles when overlaid on each other is complex. They are not in this exact configuration for a further 21, 252 days or 58 years and 66-68 days, depending on leap years. The theory of Davis W. Carvey and Roger G. Nibler (2006) predicts that accidents will occur more on accident prone days. On these days more than one cycle, out of the three will cross the abscissa. Zimmerman, R. O. (2001) has presented an example of a study related to biorhythm. This was popular in the late 1970’s it is used to illustrate the separating of scientific evi-dence and pseudo-science. The cited biorhythm study focuses on the relationship of the accident dates and the three biorhythm cycles. John C. Aldrin; Entique A. Medina; Daniel A. Allwine; Mohammed Qadeer Ahmed; Joseph Fisher; Jeremy S. Knopp; and Eric A. Lindgren (2006) have described human factors in a nonde-structive evaluation which is critical to maintain inspection reliability. Reliability of structural health monitoring systems is particularly sensitive to sensor degrada-tion over time. To investigate the impact of these issues, probabilistic models for risk assessment and cost benefits analysis have been developed. Quantitative stu-dies are presented evaluating the effects of variations in probability of detection associated with human factors (Michael Clarke, Editor: 1995). They also evaluate the in situ sensor degradation of life cycle measures which include factor of cost and the probability of failure.
This chapter is organized to take account of pilot error in aircraft accidents, the human factor component in aircraft accident analysis, the human factor in accident patterns, statistical analysis of the accident data and Reliability Evaluation of the system based on different probabilistic analysis. In Section: I the meaning of the word ‘Biorhythm’ and its brief history is given. Section: II gives an overview of typical natural biorhythm cycles and its considerations - physical, emotional and intellectual cycles in detail. The causes of aircraft accidents including direct and indirect causes are highlighted in section: III. Behavioral analysis and Impact of cycles of biorhythm on human performance with causes and safety measures are illustrated in section: IV. Analysis of causative Human Error Factor and a Deve-lopmental Model for Predicting Human Error where consideration to various causes have been described in section V. Statistical techniques for biorhythmic analysis for accident prone days are described in Section: VI. In Section: VII the reliability analysis of the biorhythmic aviation accidents is discussed. Several methods of analysis are given in this section. They include Gaussian Distribution Approach, Failure Probability Evaluation Approach, Safety Factor Concept and Peak Load Considerations Approach and Performance Evaluation Approach using Simpson’s 1/3rd rule are presented. Section: VIII represents results and discussions based on biorhythmic data. Conclusions and projected future research work plans are given in section: IX.

210 R.K. Saket, S.P. Kaushik, and G. Singh
2 Typical Biorhythm Cycles: An Overview
As previously stated at the moment of birth each of the three biorhythm cycles is initiated and the cycles proceed to follow a fixed sinusoidal pattern throughout the life of the individual. The physical cycle P has a period of 23 days, the sensitivity (or emotional) cycle S has a period of 28 days and the intellectual cycle has a period of 33 days. Individuals with different birth dates will consequently have different composite biorhythm charts, although the theory holds that the cycles of all individuals follow the same 23, 28 and 33 days natural biological rhythm. The calculation of an individual’s biorhythm at any given time requires that the date being investigated is specified. The subject’s age in days from the date of birth, up to an including the date of interest must next be determined [England, C.E. and Naitoh, P. (1980)]. In this calculation individual biorhythm consideration need to be given in terms of regular leap years and centurial leap years.
The equations for the natural biorhythm curves are as follows:
(a) Physical Biorhythm Cycle: sin (2πt / 23), (b) Emotional Biorhythm Cycle: sin (2πt / 28), (c) Intellectual Biorhythm Cycle: sin (2πt / 33), (d) Intuitive Biorhythm Cycle: sin (2πt / 38)
Where, t indicates the number of days since birth. Typical natural biorhythm cycles are shown in figure (1). Percentage values indicated in Y-axis of fig (1) represent percentage numerical values of physical, emotional, intellectual and intuitive natural biorhythm cycles.
Fig. 1. Natural Biorhythm Cycles

Biorhythmic Analysis to Prevent Aviation Accidents 211
(a) The Physical Biorhythmic Cycle (23 days)
The physical cycles originate in the muscle tissues or fibers. The physical cycle is from our masculine inheritance and affects our physical condition. During the plus side of the cycle (day 2 through day 11) our physical condition is in a charged state. That is we are optimistic, our stamina is high, we need a good deal of movements and physical work is easier. We feel more vigorous and have more vitality. Our endurance level is higher and this is therefore a time of activity and for starting new tasks. Some doctors believe that the days 2 through to 9, that is in the plus half of the cycle are the best days to have elective surgery. During the minus portion of the cycle which is day 13 to day 23 is a recuperative recharging state and one may tire more easily. This period is conducive to recuperation and we are less resistant to stress and physically activity. This is not a good time for starting difficult or energy demanding tasks. George S., Thommen (1973) states that some athletes, depending on this and the state of other cycles and factors can experience a slump during this time. Despite this a well trained athlete who has not over prepared may succeed at this time. It is not a "bad" time. In fact it can be a good time to practice routine physical activities and to "recuperate." Thommen compares the physical cycle to that of a car battery and generator. The fully charged battery can spark the ignition to provide full power. When the battery has run down the generator switches to the charge mode and returns the battery to full strength. The critical points in the physical cycle are day 1 and day 12 1/2. We may be more prone to misjudge our physical energy or endurance while switching from one phase to the other. On critical days we must be more careful, more atten-tive, and should not hesitate to put off things which involve much physical efforts.
(b) The Emotional Biorhythmic Cycle (28 days)
The emotional cycle governs the nervous system. It is due to the influence on the nerve cells from one's feminine inheritance and it affects the emotional lev-el. During the high end of the cycle (day 2 to day 14) one is more inclined towards optimism and cheerfulness. Creativity, productivity, friendship, feelings, love and cooperation are favorably influenced. The positive phase brings optimism, joy, openness, tolerance, and self control. During the low end of the cycle (day 16 to day 28) your emotions are in a recuperative state as explained by Hines, Terence M. (1998). You are more inclined to be irritable and negative. The negative side brings pessimism, withdrawal, bad moods and sometimes completely illogical sadness. The relative highs and lows of these two phases is definitely influenced by our general temperament. An excitable person will have a wider swing than a more sedate or calm person. The critical days are day 1 and day 15. Insurance and industrial statisticians in the US and in other lands have noticed a higher percen-tage of self caused accidents on these days. Drivers and other people needing to react quickly with sound judgment should be cautious on these days. According to George S. Thommen, (1973) there is something interesting about these critical days. Since the emotional cycle is 28 days long, exactly 4 weeks, day 1 and day 15 always fall on the day of the week that you were born. Every other week, this day is a critical day in your emotional cycle. If you don't know what day of the
212 R.K. Saket, S.P. Kaushik, and G. Singh
week you were born your bio-chart can tell you. Just look at the days when your emotional cycle is on the axis between plus and minus.
(c) The Intellectual Biorhythmic Cycle (33 days)
The Intellectual Cycle was not discovered together with the physical and emotion-al cycle and it does appear to have less prominence than the other two. It does, however, have an influence. The intellectual cycle originates in the brain cells. When the intellectual cycle is on its high, on its plus phase (day 2 to day 16) we are more capable of absorbing new ideas and appear to think more clearly. Mental responses are more spontaneous and memory functions better according to Doug-las, Neil and Francis, L Sink (1976). In the positive phase we have maximum powers of concentration and our memory skills are high. We can adapt to any situation and can make difficult decisions during this period. This is a good time for creative thought and the study of new ideas. During the low phase (day 18 to day 33) your capacity to think may be reduced. This may be a better time to re-hearse and review known concepts. Practice of things known will facilitate the storage into the mind and the sub-conscious. The critical points are at day 1 and day 17 1/2. On these days we should defer making important decisions.
2.1 Interpretation of Biorhythm Cycles
Biorhythmic study focuses on physiological, emotional and intellectual processes and their forecasting. Biorhythm phenomena are observable human conditions and can be detailed and explained by biorhythmic studies. Each cycle oscillates be-tween a positive phase [0% to 100%] and a negative phase [- 100% to 0%], during which time bioelectric activity strengthens and weakens. In the waveform of any of the three cycles, the positive period is thought to represent favorable conditions; they are high performance intervals for intellectual function (I) or for physical coordination (P). On the other hand the negative period is thought to represent a recharging phase. During the recharging phase it is believed that a person is in-clined to tire more easily (P) become depressed or irritable more readily (S), thus exhibiting a lesser degree or acuity in the learning and decision making process. In the workplace - railways, roads and airlines have most experimented with bior-hythm. A pilot describes both the Japanese and American attitude towards biorhythms [Shaffer, J. W.; Zlotowitz, H.L and Fisher, R. S. (1978)]. He acknowl-edges, researching his pilot logbook, and finding that his greatest errors of judg-ment occurred on critical days. He concludes that an awareness of one’s critical days and the need to pay extra attention to the matter at hand is essential to ensure safety [Khalil, T.M. and Kurucz, C.N. (1977)].
2.2 Accident Prone Zone / Critical Days
Critical days have been described as being full of danger and difficulties. They are accident-Prone days and are said to occur when one’s energy expenses change from the positive phase to the negative phase or vice versa. These days also called Critical Days and are considered to be accident-prone because the body’s system is in a state of transition and are not stable. They are days of flux and great

Biorhythmic Analysis to Prevent Aviation Accidents 213
instability. This instability does not in itself cause accidents but does apparently have a mild negative influence on the performance, which may increase danger. Critical days are not the days when an accident will occur, but are a time when you will be more accident prone. John, H. Wolcott; Mc Meekin R. Robert; Burgin R. E.; and Yanowitch R. E. (1977) have represented the correlation of general aviation accidents with the Biorhythmic Theory and the experience of it as acci-dent-prone days. On these days the organism polarity is in state of flux and there-fore the feedback process is highly variable. In this period the organism does not experience immediate and accurate assessment of its capacity. Each accident case was analyzed to determine whether or not the accident occurred on a biorhythmi-cally critical day as shown in table I. The data was also systematically evaluated for the existence of Non- Biorhythmic Cycles. Accidents can be prevented if an individual is prevented from working in a hazardous situation on critical or acci-dent-prone days.
2.3 Combined Biorhythm Cycles
The three-biorhythm cycles may be charted on one curve as shown in Fig. 1. The three rhythms are plotted independently and their relative positions will change from month to month. Combined biorhythm cycles illustrate several accident-prone days. Accident-prone day 1 shows a crossing of the Physical Cycle. Here the sensitivity cycle is recharging, while the intellectual cycle is at a high. On the other hand, an accident-prone day illustrates that a double-crossing of the zero axes appears to be a Double Critical Day. Similarly, three crossings within the same day results in a Triple Critical Day.
3 The Causes of Aircraft Accidents
The correlation of occurrences of aircraft accidents to the critical and negative phases of the biorhythm cycles have been investigated by John, H. Wolcott; Mc Meekin R. Robert; Burgin R. E.; and Yanowitch R. E. (1977). Data from 880 US air force pilots involved in accidents were studied and added to 4278 previously reported cases. The data were tested by Chi-Square analysis under the null hypo-thesis that proposed there is no effect of biorhythm on aviation accidents. Using this hypothesis, the expected number of accidents occurring on critical days should be 179.13 for the US air force. The investigation of Sacher, Dietmar (1974) dealt critically with the problems of biorhythmic and its influence on human error and accidents. This was based on data obtained from 4346 naval aircraft mishaps in the Fiscal year 1968-1973. John, H. Wolcott; Mc Meekin R. Robert; Burgin R. E.; and Yanowitch R. E. (2006) have calculated biorhythm for over 4000 pilots involved in general aviation accidents in 1972. The data was obtained from the National Transportation Safety Board. The data was analyzed for a correlation of aircraft accident occurrences with both biorhythmically critical days and with individual and multiple low or negative phases of cycle. The causes of aircraft accidents in military aviation can be classified into Direct and Indirect causes.
214 R.K. Saket, S.P. Kaushik, and G. Singh
3.1 Direct Causes of Aircraft Accidents
Direct causes of aviation accidents [Scott A. Shappell; Cristy A. Detwiler; Kali A. Holcomb; Carla A. Hackworth; Albert J. Boquet; Douglas A. Wiegmann (2006)] are shown to be directly responsible for the aircraft accidents. Direct causes are sub-classified as follows:
3.1.1 Technical Defects in Aircraft
Technical defect indicates failure of some aircraft system while it is flying. Exam-ple of failure chances for a single engine of twin-engine aircraft system is the failure of the carriage system to come down. Technical defects create hazardous situations, which may lead to an aircraft accident [Kaushik, S.P. Murthy, W. Selva and Shrivastava, K.K. (1990)]. If crew fails to take proper steps to deal with this hazardous situation when landing the aircraft, safety for the nearest aircraft is also impaired. The reliability of the aircraft system where accidents are due to technic-al defects are evaluated using a Binomial Distribution.
3.1.2 Environment Factors
Environment factors are the factors, which are beyond the control of the pi-lot/crew/military aviation. Some typical environmental factors are:
3.1.2 (A) Bad Weather Conditions: Some military aircraft have to
fly in bad weather conditions. For example CB clouds creates ha-zardous environmental situation. CB clouds are charged clouds which may jam the Gyro instruments in the aircraft. Severe up-draft and down draft which are inherently present in the cloud can throw the aircraft, up or down until it disintegrates. The best way to overcome this hazardous situation is to avoid flying into this type of cloud. The exact position of the CB clouds should be given to the pilot by Weather Radar and Ground Control.
3.1.2 (B) Bird Strikes: The aircraft needs to avoid bird strikes during takeoff and landing. The aircraft is flying at supersonic speed and birds act as a missile which will damage the aircraft. George E. Meyer (1974) has presented activities related to the aircraft ha-zard as a result of bird strike at Charleston AFB, South Carolina. He studied a 500 square mile coastal area from 1 June 1971 to 1 June 1972. He gave the theoretical development for the calcula-tion of the Binomial Probability Distribution Functions useful for assessing the risk of bird hazards to aircraft by the use of radar. Each distribution function has been studied in order to determine the degree of risk and the corresponding number of birds in-volved. The cumulative probability of bird strikes over an entire route can be determined by calculating the union of discrete cell probability sets.

Biorhythmic Analysis to Prevent Aviation Accidents 215
3.1.2 (C) Ricochets: Ricochet is an environment factor in military avia-tion. Ricochets occur when bullets fire from an aircraft are reflected. The reflected bullets may hit the originating aircraft or one of the other aircraft in the formation during bombing or target practice.
3.1.3 Human Factors
Human errors are basic mistakes committed by the Pilot or the Aircrew during flight. It was observed that even the most experienced pilot had committed basic mistakes of landing with the flaps in up position calling three greens when the under carriage lever is in the up position. These human errors can lead to a major aircraft accident if not detected in time. It is difficult to understand, why expe-rienced pilots have made such silly mistakes. Psychologists believe that the mis-takes committed by the experienced pilots may be due to some indirect causes. These effect the functioning of the mind of the pilot and interface with his skills. This ultimately leads to the commitment of such mistakes.
3.2 Indirect Causes of Aircraft Accidents
The indirect cause is some factor, which affects the human performance. It can lead to an aircraft accident. The indirect cause is an inter-action between skill and stress. The pilots acquire the skill of flying an aircraft through an intensive train-ing for a minimum of a three year period. Experienced, pilots have capabilities to overcome unfavorable environmental situations and even to deal with technical defects when developed during flying. The performance of these pilots while fly-ing an aircraft is the result of an interaction between skill and stress. Skill represents physical and mental capabilities. Acquired knowledge about the aircraft and its operations and factors such as experience are also important. Stress is a feeling of hardship or tension caused by an over powering situation when the individual feels that his resources to deal with it are inadequate. Stress is a part and parcel of a human being and is unavoidable. Pilots have to routinely face stresses. The pilots are subjected, to two types of stress.
3.2.1 Cumulative Stress
(A) Unusual Life Condition: Unusual life conditions may include an unhappy family life, financial problems, and the frequent transfer of pilots. A study by NATO revealed that cumulative stress loads of such events in the immediate past predispose a person to psychosomatic or a purely physical cause for a reduction of ability (Thompson, Simon G.; Ghanea-Hercock, Robert: 2005). Such cumulative stress may lead to attention failure, error of judgment or forget fullness. (B) Life Style and Temperament: Life style factors are (a) Over ambition, (b) Constant Worry, (c) Expectation of Perfection in every event. A poor tempera-ment of the pilot is one which is responsible for some air craft accidents.
(C) Zero Error Factor: Modern aviation undoubtedly calls for a zero error factor. This is an inescapable requirement. Some social scientists believe that it is im-possible to achieve a zero error factor as a person is likely to make a mistake at

216 R.K. Saket, S.P. Kaushik, and G. Singh
some time. Achievement of zero error factors in a particular field it has been seen is possible to achieve. What is needed is a very high degree of mental discipline and unwavering adherence, to meet the specified parameters. Increasing sophisti-cation in science and technology leads to more and more closely structured organizations. These provide very little independence of action or thought to an individual. There is a known and inherent element in a human being which causes resistance to severe structuring. This is a pointer towards incidents/accidents where lack of flying discipline has been the primary cause. In advanced countries, technology evolution has been gradual accompanied by steadily improving results. Individuals in such a society could systematically acclimatize to the stress placed on them in the form of higher demands for mental discipline and the need to curb the general tendency or urge for independent action. In the developing countries such as ours, instead of gradual, technical evolution, there has been a technology explosion in the last two or three decades. We have been suddenly exposed to a high level of technology. The society or the individual had insufficient time to adjust to the constant, demands of high technology. This is a basic cause of aberra-tions in flying discipline. It has been much in evidence in the early 50’s in the USAF despite about 300 years of backup of the growing technology. Later during the 60’s by the royal Air Force. This is an important element, which must find a place in our training. It is incorrect to state that the pilot could throw around the aircraft around like a tempest or hurricane. He cannot afford to indulge this prac-tice in even a very small way with high performance aircraft like Jaguar, Mirage 2000 and the F16 class. This aspect requires to be emphasized adequately in pilot training from the beginning. It is a continuous process and only though rigorous training can we achieve the very high degree of psycho motor skills and develop-mental discipline required to create a safe flying environment.
3.2.2 Effects of Sudden Stress
The Pilot is subjected to sudden stress when he needs to cope with the following situations:
(A) Technical Defects in Aircraft: A pilot is subjected to sudden stress when some aircraft systems fail in the air. For example, failure of one engine of a twin engine aircraft or the failure of the under carriage system when it fails to come down according to need.
(B) Cognitive Factor: Cognitive factor arises during a conflict situation; it occurs when each pilot tries to establish identity and needs recognition. Cognitive conflict is found predominantly in the military aviation by the Air Force.
4 Behavioral Analysis and the Impact of Cycles of Biorhythm on Human Performance: Bio Analysis
The combined individual performance under a combination of the influences of each of four cycles consists of the combination of positive, negative and zero cycles for Physical, Sensitivity, Intellectual and Spiritual Cycles, resulting in

Biorhythmic Analysis to Prevent Aviation Accidents 217
behavior influence possibilities shown below. For days other than those critical days or for about 80% of the time the positive and negative positions of the cycles result in a change of the behavioral pattern as shown below:
Table 1. Accident Prone Days
Table 2. Combination of Biorhythm behavior

218 R.K. Saket, S.P. Kaushik, and G. Singh
Fig. 2. Anatomy of Accident Flow Chart

Biorhythmic Analysis to Prevent Aviation Accidents 219
4.1 Behavior Based Biorhythm Management
A good manager is a successful planner who strives to achieve numerous objec-tives by overcoming work losses or errors. It means that the managers will have managed to execute their plans to achieve their goals despite unplanned events occurring. If these unplanned events are on the increase it becomes necessary to reduce their effect by skillful management or by skillful use of the biorhythm. The essence of biorhythm management is to establish a set of procedures by which the biorhythmic accident prone period of each individual worker is considered and compensated for on an individual basis. In this way the likelihood of worker per-formance accidents may be minimized.
4.2 Causes of an Accidents and Safety Measures
An accident is an unplanned, uncontrolled, and undesirable event. It may be a sudden mishap which interrupts an activity or a function. A narrow miss which avoids an accident or a mishap is much the same. We know that the results of the accident frequently cause a delay in production, damage to material, and reduction of quality and possibly the loss of life.
Contributing Factors: These are frequently an accumulation of unsafe acts and unsafe conditions which provide circumstance predisposed to cause an accident. The Supervisor plays an important role in preventing accidents. Effective Safety Management necessitates eliminating and controlling these contributing factors.
Safety Responsibilities and Measures
• Recognize unsafe acts • Training and monitoring staff • Recognizing poor performance • Enforcing Safety rules • Planning for Safety as an essential part of the job • Correcting and identifying hazards which are due to improper or inade-
quate maintenance • Providing and enforcing clear Safety instructions • Insuring Safety devices are adequate and maintained. • Proper Overall Safety management
The worker is the second major contributing factor. The mental, physical, emo-tional and spiritual condition of the worker results in the following:
Mental Conditions:
• Possible lack of Safety awareness • An improper attitude • Inattention to the job at hand

220 R.K. Saket, S.P. Kaushik, and G. Singh
• Slow mental reaction • Poor management • Substance abuse
Physical Conditions:
• Extreme fatigue • Lack of coordination • Physically unqualified for the job • Loss of sleep • Substance Abuse
Emotional Conditions:
• Lack of emotional stability • Nervousness • Temperament • Loss of family members • Under Heavy Stress environment • Home life • Lack of sleep
Immediate causes:
• Unsafe acts • Unsafe condition • Failure to use protective equipments or tools • Hazardous movement • Inadequate illumination • Poor ventilation • Bad house keeping • Ineffective or Inadequate Safety devices
Safety measures:
• Develop Safety awareness and Safety consciousness • Adequate training • Proper Safety environment • Use of Biorhythm model for “off days” • Precautions against Accident Prone days • Improving worker morale • Improving attitude • Improving working environment • Managing stress • Avoid Fatigue • Avoidance of bad habits • Provision of tangible rewards for accident free periods

Biorhythmic Analysis to Prevent Aviation Accidents 221
Identifying the primary factors which influence safety is a complex task and no single factor can be an adequate predictor of a worker’s or supervisor’s perfor-mance or susceptibility towards making and reducing errors. Biorhythms provide a potential management tool to inform and aid better decision making by a consid-eration of the periods when a worker may be most susceptible to errors.
5 Analysis of the Causes of Human Error Factor and the Development of a Model for Predicting Human Error
Error may be considered in its most basic form as an intended action which is not correctly executed. At a simple but often opaque level errors are actions which result from various unconscious or conscious mistakes. At the most transpa-rent level an error may be considered as any act which results in an accident or incident that may involve personal injury, death and damage. Studies show that human error rates doing simple repetitive tasks can normally be expected to occur about once in 100 events. It has also been demonstrated that under certain circumstances human reliability can be improved by several orders of magnitude. An error rate of 1 in 1000 is regarded as good. The British Civil Aviation Authori-ty for instance requires that automatic landing equipment must not suffer a catastrophic failure more than once in 10 million landings. Human errors vary widely depending on the task and many other factors such as Physiological factors.
Fatigue: Fatigue can be defined as The Level of Reduced Per-formance in which there is no certainty that a person can react in an emergency even when the need is obvious. Long working hours and inadequate rest periods are potential threats as they re-sult in inadequate responses.
Sleeplessness: It adversely affects and lowers the performance due to a lack of focus. It is difficult to function at an adequate at-tention level.
Lack of motivation: It has been noticed that in many accidents that a well trained and highly capable pilot or technician has made an error. In many examples it is most likely due to a low motivation level. Selection, training and periodic checking can help ensure the ability to perform a given task for a given period of time. The continuing performance of a person showing the same dedication is largely governed by his motivational level and not by his ability.

222 R.K. Saket, S.P. Kaushik, and G. Singh
Stress: Extended working hours usually cause a person stress. All personnel are trained and conditioned to cope with this situa-tion. However, if the stress levels increase drastically due to to-tally unrelated factors such as, death of a spouse, administrative problems, financial problems, the likelihood of a person making an error increases dramatically. Misunderstanding and lack of in-formation is part of work culture. It can be reduced or contained by the use of concerted efforts.
5.1 Man Machine Interaction When Considering Flying Mistakes
A Communications study by Michaela A. and Dorheim Moffect shows that in 107 reports involving competing tasks, the biggest cause was distraction, 68 of 107 incidents were due to communications problems. Crew members who com-municate well tend to perform better but conversation demands attention. For example it is necessary to think of responses and retain them in memory until it is your turn to speak. Flying crew may become preoccupied with the conversation and not notice other demands on their attention. Head down activity (22 out of 107) such as the performing the flight management system or re viewing approach charts, was a factor in 22 incidents. When engaged in head down activities the eyes are diverted and can require a high degree of concentration. When the head is down the pilot cannot reliably monitor the flying during longer tasks. When the head is down it is necessary to suspend programming in mid stream and 13 out of 22 such cases caused a failure by the pilot to monitor flying. Response to an abnormal situation was involved in 19 out of 107 incidents. In one example, the crew had to deviate around thunder storms and then had to descend and the cabin pressurization slowly failed. They had forgotten to reset their altimeters when descending to the lower air space and were set at 300 feet low at an attitude of 13000 feet. Treating an urgent situation narrows the focus of attention. Visually searching for other traffic was a factor in 11 incidents out of 107. One air crew was reported as receiving an alert and then missing the turn at an intersection because they were looking for other traffic. Head down work when searching requires attention and it takes the eyes from where they should be. In all of the above cases the main routine task was neglected. The neglected duties were monitoring the status of the aircraft and the pilots flying. Failure to correctly monitor occurred in 69% of cases. Altitude Deviation was the neglected task in 31 of the 107 cases. Sixteen of these cases involved not making a required turn and 13 of the cases involved a failure to reset the altimeter. There were 107 re-ports. The percentage failure probability of making flying mistakes considering various cases has been plotted on the Y-Axis of figure: 3.

Biorhythmic Analysis to Prevent Aviation Accidents 223
Fig. 3. Man Machine Interaction and Flying Mistakes
5.2 An Error Taxonomic Approach
An analysis of 93 major accidents over a period of 24 years from 1959 to 1983 has been analyzed. Sears 1986 found that 12% which is 11 accidents were caused by maintenance and inspection deficiencies. Similarly Nagel 1988 reports that four out of every hundred accidents that occurred from 1977 to 1988 were the result of maintenance error. During an aircraft inspection certain defects were found in an aircraft which was ready to fly. This was clearly unacceptable. It is pertinent to make this requirement explicit by providing information about the requirements. These requirements are based on human error avoidance.
5.3 Factors Which Affect Decision Making
Decision making is the task during which any potential defect is located by searching and evaluated in order to determine whether it should be reported. In this task both Type I errors (False Alarms) and Type 2 errors failure to FIN can
224 R.K. Saket, S.P. Kaushik, and G. Singh
occur. These errors have their own “Tradeoff Relationship”. Some combined ac-curacy measure must be derived before any tradeoff between the search Speed and the Accuracy can be determined.
A particular model of the human being having the ability to provide a rational economic maximization which has received widespread support for inspection is Signal Detection Theory (SDT), it was originally proposed by Swets and co-workers (e.g. Swets, 1967). This was to serve as a model of how humans are able to detect Signals in the presence of noise. It was subsequently applied successfully to the inspection problem by Wallack and Adams, 1969, 1970; Sheehan and Drury, 1971; Drury and Addison. 1973.
In the SDT the inspector is assumed to be making a choice for each item in-spected as to whether the item contains a defect (“signal”) or does not (“noise”) As the evidence for signal or noise is somewhat equivocal, there is assumed to be an “Evidence Variable”. This increases when a signal is present and equivocal. There is also assumed to be an “Evidence Variable” which increases when a signal is present and decreases when only noise is present. An example of its use would be the judgment whether a dent in a stabilizer leading edge should be reported. Dents can range from almost imperceptible to those which must be reported. The Evidence Variable (dent visual severity) must be judged against both Written Size Standards and the likely effects of the dent or the Flight Characteristics.
5.4 Factors Affecting Sensitivity
Most factors affecting discriminability or sensitivity are physical. They can be characterized as the perceived difference between the observed indication and the relevant standard. Thus, indications obviously well above or below the standard will have high discriminability (d) values. Examples would be the existence of large areas of corrosion, cracks which are noticeably larger than those allowed or completely missing rivets. None would require difficult or Error Prone decisions. The expression “perceived difference” implies both High Signal and Low Noise in SDT terminology. Low noise means low levels of visual distraction. That is com-petent cleaning, Low levels of fatigue that is frequent task breaks; Very Clear Standards well defined and well presented job aids. All of these can be improved for the aircraft inspection task. Comparison standards at the work place have been shown to be effective in improving discriminability. It should be possible for the inspector to make a direct side-by-side comparison of fault indication by using a standard. For example, the critical amount of corrosion beyond which a report must be made should be indicated by a life-sized diagram on the work card. If different corrosion types are present, life-sized photographs help in reaching a positive identification.
5.5 Factors Affecting Criterion
From SDT, the factors affecting the choice of criterion are the relative costs of making errors such as Misses and False Alarms and the True Rate of Defects (p). Using these factors, the optimum criterion can be calculated. This is rarely the exact criterion which is used by the inspector. In laboratory tasks and in

Biorhythmic Analysis to Prevent Aviation Accidents 225
non-aviation inspection tasks the inspectors will choose a criterion in a conserva-tive manner. For examples, if the criterion should be low they should be very willing to report indications as defects. Inspectors will choose a criterion which is not low enough. Similarly, they will choose a criterion which will not react quick-ly enough in changing their criterion as the costs and probabilities will change. It is important to provide accurate and up-to-date feed forward information on the probabilities of defects in different areas in order to allow the inspector to make rapid criterion changes.
There are also known criterion shifts that consider both the changing defect rate and the time spent on the task. There is little to be done when increasing the defect rate. It is fixed by the state of the aircraft. The reduction in the hit rate at very low defect rates may set a limit to the use of humans as detectors of rare events. Para-doxically, as the maintenance improves and gives fewer defects, the ability of the inspector to detect the few remaining defects worsens. There is a need for more research into the human or machine function allocation to alleviate the low defect rate problem. The time on the task, the vigilance phenomenon, cause a reduced detection rate due to the Criterion Shift under special circumstances. That is unin-terrupted performance. This may not be a problem of aircraft inspection, although heavy use of night shift inspection where interruptions are less frequent and the human less vigilant, requires further study.
5.6 Rationale for Research on Visual Inspection Training
From the above discussion, training for visual search would be expected to result in reduced search errors. That is type 2 errors and a reduced search time. Similar-ly, training for decision making and perception can be expected to result in re-duced type 1 and type 2 errors. Although training can be used to improve visual inspection performance, specific training schemes are not associated with factors that determine improvement in visual inspection performance. Hence, training schemes are developed that guarantee improvements for a particular task without consideration as to whether such a training scheme could be extended to a similar task, a different task, or whether the training is optimizing the use of instructor and the trainee time. The first step in the development of a rational training scheme is to identify the factors that affect visual inspection performance. The next step is to determine which of the functions of the inspection task can be developed by train-ing. This in turn will serve to establish the sensitivity of the inspection parameters for training.
For any training scheme to be effective it should minimize both Search Errors and Decision Errors. Referring to the earlier proposed model of visual inspection, it is observed that intervention strategies could be developed at various stages of the inspection process. This could be hypothesized to change the inspection para-meters to achieve an improved performance.
The following factors are critical in the search process:
(a) The ability to identify salient features which can be associated with a par-ticular defect. This is so that features may be searched for in parallel instead of requiring separate attention.

226 R.K. Saket, S.P. Kaushik, and G. Singh
(b) Visual search (c) Eye movement scanning strategy.
In order to improve the visual inspection performance it is necessary to develop training schemes which provide improvements in the above factors. The following section briefly describes various training schemes.
5.6.1 Visual Lobe Training
The visual lobe is a very important determinant on search performance. Those observers with a larger visual lobe require fewer fixations than observers with a smaller visual lobe. A large visual lobe or peripheral acuity may account for supe-rior search performance. We still need to know how a large visual lobe can affect search performance and how people can be trained so as to increase the size of the visual lobe. If the above questions could be answered, this could result in a strate-gy to improve the visual lobe. More general questions then arise. How does lobe size training generalize across tasks such as targets and back grounds. We wish to understand whether the visual lobe training on a given target; would result in an improved search performance for a different target type and the sensitivity of the appropriate search parameter for this type of training. It is essential to identify whether a cross-over effect exists. If it does, then it is sufficient to train only on one target type. If not, then it is necessary to identity various target subsets, for examples T1, T2, where the cross-over occurs. Trainees could then be provided visual lobe training on a single target of each target subset.
5.6.2 Feedback Training
A person needs rapid accurate feedback to correctly classify a defeat, or the effec-tiveness of a search strategy. Every training program should begin with frequent feedback and to gradually reduce this until the level of proficiency required is reached. Additional feedback beyond the training program will help to keep the inspector “calibrated”.
The following feedback could be provided:
(i) Feedback showing accuracy of classifying defective items into the correct categories
(ii) Feedback of the search strategy derived from monitoring eye movements (iii) Feedback of fixation times from the subjects eye movement search.
The First item is known to be essential in learning perceptual tasks (Annett, 1966). It provides the novice with information regarding a critical difference between a defective item and the satisfactory item. This helps to develop a mental attitude which contains the internal characteristics of a defective item. We are, however, still unsure as to what has been improved. For example, learning resulted in pro-ducing a new internal conceptual model of the task or is the inspector using only certain dimensions of the fault to classify it.
It has been shown that an important difference between the best and the poorest search performance is the length of the sweeps between eye fixations during the search task. Does there exist a difference between how a novice and an expert
Biorhythmic Analysis to Prevent Aviation Accidents 227
move their eyes across the visual field. Gould (1973) during a visual inspection study of circuit chips found that most of eye fixations occur within a definite boundary, which is the area most likely to contain the targets. It has been demon-strated that eye movements during a visual search occur based on knowledge of the location of faults and on the probability of them occurring. The question that needs to be answered is: Does feedback information regarding the eye movements help to improve the scanning strategy? We hypothesize that providing such feed-back information would aid the inspectors by allowing them to identify areas which have been not covered or areas where excessive time is spent. By helping the inspector to develop such a strategy it will become possible to cover the entire area more effectively.
5.6.3 Feed Forward Training
When a novice inspector with no knowledge of the type of faults, the probability of faults, and the occurrence of faults, conducts a visual search, it would be ex-pected to be inefficient. Providing feed forward information should result in an improved search strategy. This is because the uncertainty is reduced as the inspec-tor knows both where to look and what to look for. Perhaps the inspector may use the information to achieve a more systematic search strategy, guided by know-ledge of the fault characteristics. The inspector could use feed forward information in the following ways:
(1) To ignore the information completely (2) To selectively incorporate some of the information (3) To incorporate this information only at later stages of inspection,
That is only after gaining some verification. Using this suggests that experienced inspector’s make use of feed forward information that complements their existing sensitivity to the fault. If the fault is one that is not easily detected, then the in-spector relies heavily on any information provided. Inspection tasks that will most likely benefit from this addition to prior information include those where the value of inspection time is great. Those faults have been looked easily in which the fault is particularly difficult to detect and those in which the product may contain rare detrimental.
5.6.4 Attribute Training
Consider an item A. Let the item be faulty on attributes A1, A2, A3 and A4. The inspector could be trained on each of the above attributes such training would allow the inspector to set a response criterion for each attribute. The training should be generalized in the sense that the inspector should be able to classify the items as defective if the items are faulty on one or more of the attributes. Main attributes of the systems reliability are probability of the system, performance of functions adequately, operating conditions and time periods (Saket, R.K.; Wg. Cdr. Kaushik, S.P. and Col. Singh, Gurmit, 2008). The inspector could be trained on which of the attributes match. Firstly based on the probability of the item being faulty on these attributes and the ease with which the matching occurs. Experience

228 R.K. Saket, S.P. Kaushik, and G. Singh
and training of the inspectors determine how defective attributes are arranged (Goldberg and Gibson, 1986).
5.6.5 Schema Training
It is essential that the subject develops an appropriate valid mental template or internal representation schema of the fault. The key to the development of such a schema is that it should provide for successful extrapolation for use in novel situa-tions which are still recognizable instances of the schema. We need to know how schemas are developed. Whether inspectors can be trained to develop schemas, and what sort of training being either Rule based or Knowledge based must be provided to the inspectors for effective development of such schemas. The effects of the two methods of training need to be evaluated during schema development: “active training” and “passive training”. In active training, the inspector is pre-sented with various instances of fault and no-fault. He has to classify them as defective or non-defective. Feedback is provided regarding the correctness of this classification. In contrast, passive training is where the inspector is merely pre-sented with various instances of the faults without being required to provide an active response.
5.6.6 Interaction of SRK Behavior
It must be explained at this point that in aircraft inspection Skill Based (S), Rule Based (R) and Knowledge Based (K) behaviors are rarely stand alone or distance behaviors modes, indeed they overlap on some occasions and support each other on others. For example the skill based behavior of probe movement is supported by either knowledge based for line choice or rule based for expert behavior that exists on the boundaries of the movement. The probe should not cut the overhead line and a movement too close to an edge should be avoided. Similarly, rule based behavior and clarification in visual inspection is sometimes superseded by know-ledge based behavior that is based on active reasoning on a deeper level and a functional understanding of the aircraft. During Virtual Inspection of line wing leading edge, the inspector who is looking for dents may realize that a dent for-ward of another dent may be more important because it could cause problems in fight control. This and the preceding example highlight control and the often sym-biotic relationship of default behavior.
6 Statistical Technique for Biorhythmic Analysis
In any Biorhythm research analysis it is necessary to scientifically demonstrate whether or not a relationship exists between the biorhythm and the human perfor-mance (Douglas, Neil and Francis, L Sink (1976). Hence fundamental concepts in probability and statistical analysis have been applied to use the Gaussian distribu-tion approach for biorhythmic analysis used to prevent aviation accidents. Bior-hythm is reviewed in this paper. The probability of occurrence of accident-prone days is 21.9%. This value is reduced to 20.4% by excluding multiple critical days.
Biorhythmic Analysis to Prevent Aviation Accidents 229
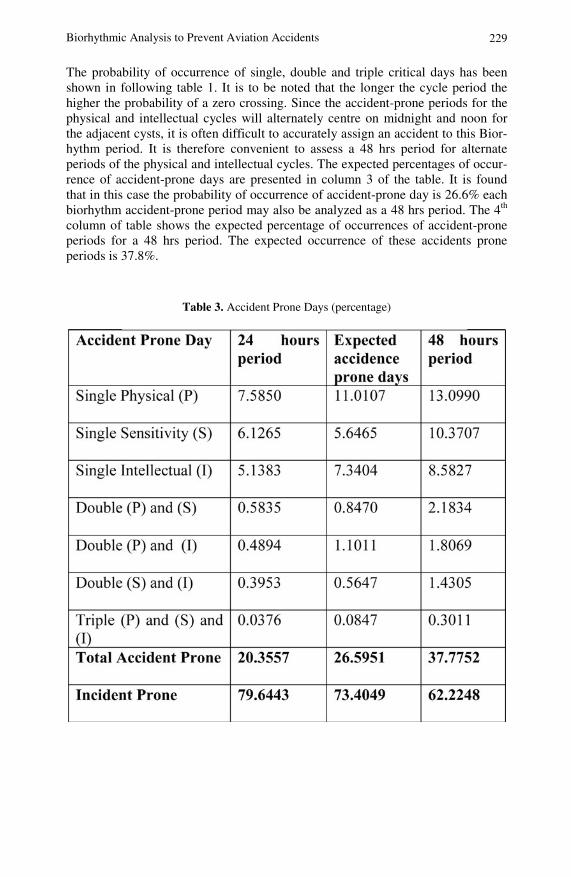
The probability of occurrence of single, double and triple critical days has been shown in following table 1. It is to be noted that the longer the cycle period the higher the probability of a zero crossing. Since the accident-prone periods for the physical and intellectual cycles will alternately centre on midnight and noon for the adjacent cysts, it is often difficult to accurately assign an accident to this Bior-hythm period. It is therefore convenient to assess a 48 hrs period for alternate periods of the physical and intellectual cycles. The expected percentages of occur-rence of accident-prone days are presented in column 3 of the table. It is found that in this case the probability of occurrence of accident-prone day is 26.6% each biorhythm accident-prone period may also be analyzed as a 48 hrs period. The 4th column of table shows the expected percentage of occurrences of accident-prone periods for a 48 hrs period. The expected occurrence of these accidents prone periods is 37.8%.
Table 3. Accident Prone Days (percentage)

230 R.K. Saket, S.P. Kaushik, and G. Singh
Carlos M. Perez (2004) found that four principles are essential for successful hos-tage rescue mission: surprise, intelligence, operation’s skill, and deception. These principles are derived from planning models used by special operations, personal experience, and an analysis of six historical case studies. The normal distribution curve based on data available in air force has been used; the area under normal distribution curve represents the accident zone. In this example the accident zone is that area of operation during which the performance demand exceeds the per-formance ability of the aircraft pilot. The Incident-duration curve of aircraft acci-dents has been designed by Saket, R.K. and Kaushik, (Wg. Cdr.) S.P. (2005). The incident-duration curve has been assumed to be a straight line and increases with the duration for the reliability evaluation of the aircraft system.
7 Reliability Evaluation of Biorhythmic Aviation Accidents
Reliability of the aviation system is defined as the overall ability of the aircraft system to perform its function. Reliability theory as an extension of probability theory was first applied in electronics, nuclear and space industries after World War-II, where high reliability was a requirement for these increasingly complex systems. Nowadays reliability studies are performed in almost all engineering branches. This chapter presents a new methodology for the evaluation of the prob-ability of an accident (Pac) based on Biorhythmic approach. The methodology has been developed in this paper using normal distribution curves of the accidents. Biorhythmic accidents have a continuous distribution function and have a Gaus-sian distribution for a specified time interval.
7.1 Gaussian Distribution Approach
The performance demand model for pilots flying has been a Gaussian distribution for a specified time interval according to the incident – duration curve [Arya L. D., Chaube, S. C. and Saket, R .K. (2001)].
( )2
d
dd
σPP
0.5
2πdd e
σ1
Pf⎟⎠
⎞⎜⎝
⎛− −
= (1)
The aggregated performance capacity model of the pilot and the air craft system has been approximated as Gaussian.
2
cσCC
0.5
c
e2 πσ
1f(C) ⎥
⎥⎦
⎤
⎢⎢⎣
⎡ −−
= (2)
The failure probability (PF) of the above performance demand and capacity models can be written as follows:
PF = (1-Ps) (3)

Biorhythmic Analysis to Prevent Aviation Accidents 231
The success probability of the model (Ps) can express as follows:
dcdPeeσ2ππ
1P
C
dσ
PP0.5σ
CC0.5
dcs
2
d
dd2
c∫∫∞−
⎟⎟⎠
⎞⎜⎜⎝
⎛−⎥⎦
⎤⎢⎣
⎡ −−∞
∞−
−
= (4)
After substitutions, equation (4) can be written as follows.
( )∫ ∫∞
∞− ∞−
+−⎥⎦
⎤⎢⎣
⎡= dxdyeP
zyx
s
225.0 (5)
In the view of the above substitution (5) the success probability of the system can be written as follows using Gaussian distribution approach [Saket, R.K.; Wg. Cdr. Kaushik, S.P. and Col. Singh, Gurmit (2008)].
( )∫ ∫∞
∞− ∞−
′+′− ′′=β
yx0.5s xdyde
2π1
P22
(6)
Where,2C
2d
d
σσPCβ
+−=
−−
(7)
The limit β comes out to be independent of x΄. Further equation (6) can simplified as follows:
( ) ( )∫ ∫∞−
′−∞
∞−
′− ′⎥⎦
⎤⎢⎣
⎡′=
βy0.5x0.5
s ydexde2π1
P22
( ) ( )∫+
∞−
′− =′=β
y0.5 βφyde2π1 2
(8)
In fact φ (β) is the success probability of the air craft system and represents the area under the normal distribution curve having mean zero and standard deviation
[ ] 1N(0,1) =∫∞−
β
. Various curves based on equation (8) have been plotted using MATLAB simulation. This expression satisfies the Gaussian distribution approach to the pilot’s reliability evaluation. ϕ (β) is the area under the normal distribution curve having zero mean and standard deviation [N (0, 1)] is one from - ∞ to β. This value can be conveniently obtained from standard tabulated data. Daily variations

232 R.K. Saket, S.P. Kaushik, and G. Singh
in the mental load or performance demand on the pilot can be accounted for by predicting the various demand levels Pdi and the relative frequency of accident occurrence of these levels are assumed to be Lo, L1, L2 ………, Li. The frequency of occurrence is α0, α1, α2, ….. , αi. For each demand level probability of failure can be calculated and overall probability of failure is given as
Pf =∑i
fii Pα (9)
Various plots of Pf v/s dP
C have been plotted in this paper. The curves shown
here can be used as a standard curve for evaluating the pilot’s capacity.
7.2 Safety Factor Concept and Peak Demand Considerations
The probability distribution function of the pilot capacity has been earlier obtained as a Gaussian. Further, it has been determined that the peak performance demand dominates over low-level loading, whereas, the probability of failure under low load level condition is negligible. Pdmax is the peak performance loading / demand on the pilot. The safety factor ‘S’ is defined as:
S = C/P dmax (10)
It is obvious that the pilot’s ability to fly / flying capacity ‘C’ has a normal distri-bution and S is a random variable. Since Pdmax has been considered to be constant, the safety distribution function ‘S’ will also be a normal and is given as follows [Arya L. D., Chaube, S. C. and Saket, R .K. (2001)].
⎟⎟⎠
⎞⎜⎜⎝
⎛ −−
= c
dmax
σCSP
0.5
c
dmaxs e
σ2 πP
f (11)
The mean safety factor and standard deviation of the safety factor is given as:
dmaxP
CS = and
dmax
cs P
σσ = (12)

Biorhythmic Analysis to Prevent Aviation Accidents 233
The probability of the performance failure is given as under:
∫∞−
⎟⎟⎠
⎞⎜⎜⎝
⎛ −−
⎥⎥⎥⎥⎥⎥⎥
⎦
⎤
⎢⎢⎢⎢⎢⎢⎢
⎣
⎡−
==1
max
max
σ/Pdmaxcs
0.5
s
dmaxF
1
dseσ2 π
PP
2
s
d
c
d
P
P
C
σφ (13)
The Failure Probability PF v/sdmaxP
C curves have been plotted using MATLAB
simulation. There are the standard curves available for evaluating the performance capacity of the pilot based on the safety factor concept and peak load considera-tions [Saket, R.K.; Wg. Cdr. Kaushik, S.P. and Col. Singh, Gurmit (2008)] .
7.3 Performance Evaluation Based on Peak Demand Using Simpson 1/3rd Rule
The LOLP is one of the most commonly used indexes for planning the perfor-mance capacity of the pilot. This index is generally obtained by convolving the performance model with a demand model. All types of composite reliability indic-es such as the loss of performance demand probability, and accident frequency have been assessed not only for the overall aircraft system but also for single components and aircraft pilots. Failure probability has been evaluated using a more realistic model as Incident - Duration Curve. A Stepped Incident-Duration Curve has been considered for aircraft system reliability evaluation using Simp-son’s 1/3rd rule. In the following expression, 100 small steps have been considered in Daily Incidence - Duration Curve. The performance model adopted is a Normal Distribution Function and the evaluation is based on the Maximum Average Per-formance Capacity of pilot available. The probability of the performance demand exceeding the performance capacity (LOLP) of the pilot using a Stepped Inci-dence - Duration Curve can be written as follows:
∫ ∫⎥⎥⎥
⎦
⎤
⎢⎢⎢
⎣
⎡=
∞−
⎟⎟⎠
⎞⎜⎜⎝
⎛ −−100
0
(t)Pσ
CC0.5
c
dtdceσ2π
1
100
tLOLP
d
2
c (14)
Putting, Zσ
CC
C
=−−

234 R.K. Saket, S.P. Kaushik, and G. Singh
The LOLP expression of (14) can be expressed as:
( ) dtdzeσ2π
1
100
tLOLP
100
0
(t)PZ0.5
c
d2
∫ ∫⎥⎥⎦
⎤
⎢⎢⎣
⎡=
∞−
−
∫ ⎟⎟⎠
⎞⎜⎜⎝
⎛ −=100
0 c
d dtσ
C(t)Pφ100
t (15)
The LOLP of the composite aircraft system can be evaluated by using the above methods of area evaluation for any step of the Incident - Duration Curve [Arya L. D., Chaube, S. C. and Saket, R .K. (2001)]. The Simpson’s 1/3rd rule has been used to evaluate the LOLP of the pilot of the aircraft system. Reliability of the air craft operation or the success or failure probability of the aircraft system based on biorhythm theory has been evaluated using Simpson’s 1/3rd rule considering small time steps of durations and various operation periods of aircraft systems.
8 Results and Discussion
The failure probability due to the biorhythmic effect on the pilot of the aircraft system which has been explained earlier was evaluated by assuming the following available data. The mean performance ability of pilot to fly (Pa) in percentage and standard deviation data are give in following table (4).
Table 4. Mean performance ability of pilot (Pa) and standard deviation data
(Pa) 90 89 88 87 86 85 84 83 82 81 81.5 80.1
σa= 5%
4.50 4.45 4.40 4.35 4.30 4.25 4.20 4.15 4.1 4.05 4.02 4.005
σa=10%
9.0 8.9 8.8 8.7 8.6 8.5 8.4 8.3 8.2 8.1 8.05 8.01
σa=15%
13. 5 13.35 13.2 13.05 12.9 12.75 12.6 12.45 12.30 12.15 12.07 12.02
Biorhythmic Analysis to Prevent Aviation Accidents 235
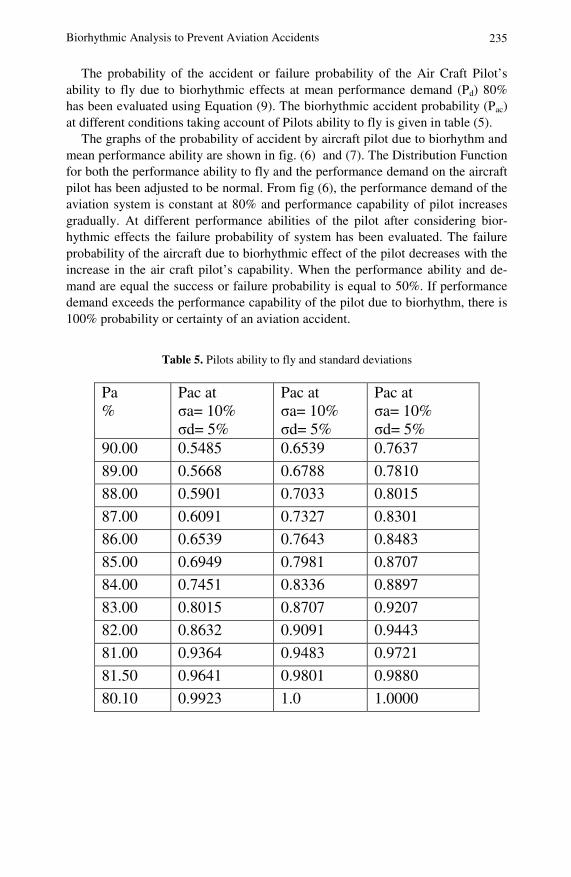
The probability of the accident or failure probability of the Air Craft Pilot’s ability to fly due to biorhythmic effects at mean performance demand (Pd) 80% has been evaluated using Equation (9). The biorhythmic accident probability (Pac) at different conditions taking account of Pilots ability to fly is given in table (5).
The graphs of the probability of accident by aircraft pilot due to biorhythm and mean performance ability are shown in fig. (6) and (7). The Distribution Function for both the performance ability to fly and the performance demand on the aircraft pilot has been adjusted to be normal. From fig (6), the performance demand of the aviation system is constant at 80% and performance capability of pilot increases gradually. At different performance abilities of the pilot after considering bior-hythmic effects the failure probability of system has been evaluated. The failure probability of the aircraft due to biorhythmic effect of the pilot decreases with the increase in the air craft pilot’s capability. When the performance ability and de-mand are equal the success or failure probability is equal to 50%. If performance demand exceeds the performance capability of the pilot due to biorhythm, there is 100% probability or certainty of an aviation accident.
Table 5. Pilots ability to fly and standard deviations
Pa %
Pac at σa= 10% σd= 5%
Pac at σa= 10% σd= 5%
Pac at σa= 10% σd= 5%
90.00 0.5485 0.6539 0.7637
89.00 0.5668 0.6788 0.7810
88.00 0.5901 0.7033 0.8015
87.00 0.6091 0.7327 0.8301
86.00 0.6539 0.7643 0.8483
85.00 0.6949 0.7981 0.8707
84.00 0.7451 0.8336 0.8897
83.00 0.8015 0.8707 0.9207
82.00 0.8632 0.9091 0.9443
81.00 0.9364 0.9483 0.9721
81.50 0.9641 0.9801 0.9880
80.10 0.9923 1.0 1.0000

236 R.K. Saket, S.P. Kaushik, and G. Singh
The Failure Probability of the aircraft system due to biorhythmic effects has been evaluated using the safety factor concept and is shown in fig (6). At a con-stant performance demand of the aircraft system the safety factor increases with the performance ability of the pilot. This graph indicates that the Failure Probabili-ty decreases with an increasing value of the Performance Safety Factor. At constant Performance Ability and increasing Performance Demand, Failure Prob-ability of the aviation system increases and the curves cut each other at 0.5. At this point, the success and failure probabilities become equal to 50%. If the demand increases with biorhythmic ability of the pilot, no one can prevent the aircraft system from an accident.
Fig. 6. Failure Probability (Aviation Accident Chances) versus Performance Capability of the Aircraft Pilot
Probability of Failure versus Performance capacity of the Pilot
0
0.05
0.1
0.15
0.2
0.25
0.3
0.35
0.4
0.45
50 60 70 80 90 100
Performance capacity of the Pilot in Percent
Pro
bab
ility
of
Fai
lure
A
B
C
D

Biorhythmic Analysis to Prevent Aviation Accidents 237
Fig. 7. Failure Probability (Aviation Accident Chances) versus Performance Safety Factor of the Pilot
9 Conclusion
It has been demonstrated that whenever pilot demand exceeds the Pilot Perfor-mance Ability, the probability of an air craft accident increases. Biorhythm plays a vital role in increasing the internal demands on the pilot and simultaneously dimi-nishes the Pilots ability. The failure probability of the system due to pilot inability has been described by various plots as shown in the figures (6) and (7). The Fail-ure Probability of the aircraft system decreases as the standard deviations of the performance ability of the pilot. Serious aircraft accidents at the rate of 70 to 80% are associated with the influence of human error. These are considered to be the most critical when the functional systems of aircraft fail and the pilot is exposed to adverse factors. Because a pilot’s Psyche and physiological factors affect his per-formance in the air, errors are likely. Among the factors which lead to distur-bances in pilot’s psycho may be personal living experiences and events; various psychological factors, biorhythmic effects, reaction to emergency situations, ef-fects of trainings, machine factors which are largely technical in nature and envi-ronmental conditions. It is necessary to study the physical cycle, the emotional cycle and the intellectual cycle to determine when a pilot is prone to an accident. Selection of pilot’s who are not prone to accidents and who can impart training. It is necessary to determine whether or not the pilot can keep his cool during emer-gencies. Study of the behavioral aspects, the man-machine interface and reliability
Probability of Failure versus Performance Safety Factor
0
0.05
0.1
0.15
0.2
0.25
0.3
0.35
0.4
1 1.05 1.1 1.15 1.2 1.25
Performance Safety factor
Pro
bab
ility
of
Fai
lure
A
B

238 R.K. Saket, S.P. Kaushik, and G. Singh
improvements will help to reduce the number of aviation accidents. Reliability analysis of the aviation system considering the biorhythmic effects according to typical biorhythm cycles at constant performance ability of the pilot. A variable biorhythmic demand has also been proposed for future research.
Acknowledgements
Authors are grateful to Aviation Research Centre and Maintenance Safety Inspec-tion division of the Indian Air Force for providing the necessary facilities and with financial support to complete this chapter. The corresponding author dedicates this chapter to sweet memories of his great father Shi Ram Das Saket Vardhan who has passed away on August 17, 2008. Without his blessings, constant support and timely encouragement it would not have been possible to complete this work in its present shape. He would also like thank to Aanchal, Aakanksha, Siddharth and newly born son Siddhant Vardhan (May 15, 2009) for providing Biorhythmic Emotional and Intellectual supports during this first work for Springer-Verlag, Germany.
References
Arya, L.D., Chaube, S.C., Saket, R.K.: Generation System Adequacy Evaluation Using Probability Theory. Journal of The Institution of Engineers (India) 81, 170–174 (2001), http://www.ieindia.org
Perez, C.M.: Anatomy of a Rescue: What Makes Hostage Rescue Operations Successful? Master’s Thesis, Naval Postgraduate School, Monterey, Canada, No: A396724 (Sep-tember 2004)
Carvey, D.W., Nibler, R.G.: Biorhythmic Cycles and the Incidence Of Industrial Accidents. Personnel Psychology 30(3), 447–454 (2006),
http://www3.interscience.wiley.com/journal Sacher, D.: The Influence of Biorhythmic Criticality on Aircraft Mishaps. Naval Postgra-
duate School, Monterey Calif., AD0718387 (September 1974), http://www.oai.dtic.mil/oai Douglas, N., Francis, L.S.: Laboratory Investigation and Biorhythm. Hypothesis Aviation,
Space and Environment Medicine, 425–429 (1976) England, C.E., Naitoh, P.: An Attempted Validation Study of the Birth Date-Based Bior-
hythm. Hypothesis Aviation, Space and Environmental Medicine, 583–590 (1980) Meyer, G.E.: The Application of Probability Calculations For Bird-Aircraft Strike Analysis
and Predictions Using Radar. Military Aircraft Operations, Air Force Weapons Lab, Kirtland, AFB NM (March 1974),
http://www.stormingmedia.us/10/1098/a109800.html Hines, T.M.: A Comprehensive Review of Biorhythm Theory. Reprinted From: Psycholog-
ical Reports, Psychology Department; Pace University (August 1998) Aldrin, J.C., Medina, E.A., Allwine, D.A., Ahmed, M.Q., Fisher, J., Knopp, J.S., Lindgren,
E.A.: Probabilistic Risk Assessment: Impact Of Human Factors On Nondestructive Evaluation And Sensor Degradation On Structural Health Monitoring. Human Factors Engineering And Man Machine System, A876464, No: 3361503C5226 (September 2006), http://www.stormingmedia.us/87/8764/a876464.html

Biorhythmic Analysis to Prevent Aviation Accidents 239
John, H.W., Mcmeekin, R.R., Burgin, R.E., Yanowitch, R.E.: Correlation Of Occurrence of Aircraft Accidents With Biorhythmic Critically And Cycle Phase In US Air Force. US Army And Civil Aviation Pilots 48(10), 976–978 (1977),
http://www.ncbi.nlm.nih.gov/pubmed John, H.W., Mcmeekin, R.R., Burgin, R.E., Yanowitch, R.E.: Correlation of General Avia-
tion Accidents With the Biorhythmic Theory. Transportation Research Board of The National Academics, NTL Integrated Search, US Army And Civil Aviation Pilots 19(3), 283–293 (1977), http://www.worldcat.org/ocle
Kaushik, S.P., Murthy, W.S., Shrivastava, K.K.: Biorhythmic Approach for Accident Pre-vention in Military Aviation. Defence Inst. of Physiology and Allied Sciences, New Delhi; Project Studies AR & DB, No. 820 (1990)
Khalil, T.M., Kurucz, C.N.: The Influences of ‘Biorhythm’ On Accident Occurrence and Performance. Ergonomic 20(4), 387–398 (1977)
Kurucz, C.N., Charls, W.: Probability Models For Analyzing The Effect Of Biorhythms On Accidents Occurrences. Journal Of Safety & Research, 150–155 (1977)
Michaela, A., Moffect, D.: Aviation Week and Space Technology, pp. 58–60 (August 17, 2000)
Clarke, M. (ed.): Brassey’s Defence Yearbook, 1995. Centre for Defence Studies, Publish-er, Brassey’s (U.K.) Ltd (1995),
http://www.alibris.co.uk/search/books/ ISBN-13: 9781857531312 ISBN: 1857531310
Sacher, D.: The Influence of Biorhythmic Critically on Aircraft Mishaps. Defense Technic-al Information Center, Naval Postgraduate School, Monterey Calif., AD0783817 (Sep-tember 1974), http://www.oai.dtic.mil/oai
Saket, R.K., Kaushik, (Wg. Cdr.) S.P.: Use of Gaussian Distribution Method for Biorhyth-mic Analysis to Prevent Aviation Accident. In: Proceedings of The 14th ISME Interna-tional Conference on Mechanical Engineering in Knowledge age, Delhi College of En-gineering, Delhi (India), pp. 139–147 (December 2005), http://www.dce.ac.in
Saket, R.K., Kaushik, (Wg. Cdr.) S.P., Singh, G.: Probabilistic Approach for Biorhythmic Analysis to Prevent Aviation Accidents. International Journal of Intelligent Defence Support Systems 1(4), 271–289 (2008),
http://www.inderscience.com/ijidss Shaffer, J.W., Zlotowitz, H.L., Fisher, R.S.: Biorhythm and Highway Crashes. Achieves of
General Psychiatry, 41–46 (1978) Shappell, S.A., Detwiler, C.A., Holcomb, K.A., Hackworth, C.A., Boquet, A.J., Wiegmann,
D.A.: Human Error And Commercial Aviation Accidents: A Comprehensive, Fine-Grained Analysis Using HFACS. Human Factors Engineering and man Machine Sys-tem, Federal Aviation Administration, Washington DC Office Of Aviation Medicine, A568364 (July 2006), http://www.stormingmedia.us/56/5683/A568364.html
Thommen, G.S.: Biorhythms: Is This Your Day (1973), PHB CROWN 1987, http://www.cycletourist.com/biochart ISBN: 0-517-00742-8
Thompson, S.G., Ghanea-Hercock, R. (eds.): DAMAS 2005. LNCS (LNAI), vol. 3890. Springer, Heidelberg (2006) ISBN: 978-3-540-32832-2
Zimmerman, R.O.: Safety Intervention Effectiveness. DOE Scientific and Technical Infor-mation, USDOE Office of Environmental Management, UK, OSTI ID: 807467 (October 2001)

240 R.K. Saket, S.P. Kaushik, and G. Singh
Nomenclatures:
PF = Failure Probability Ps = Success Probability
Pa = Performance Ability of Pilot to Fly Pd = Probability of Demand
dP = Probability of Mean Demand C = Capability of the Pilot
C = Mean Capability of the Pilot β = Constant independent of x΄ ϕ (β) = Area under Normal Distribution Curve α0, α1, α2, ….. , αi = Frequency of Accident Occurrence Pdi = i
th Demand Levels
dmaxPC
= Safety Factor
Pdmax = Peak Performance Demand
Cσ = Standard Deviation of Ability of the Pilot
dσ = Standard Deviation of Demand on the Pilot Pac = Biorhythmic Accident Probability
sf = Safety Distribution Function
S = Safety Factor
S = Mean Safety Factor
sσ = Standard Deviation for Safety Factor