Embed Size (px)
Citation preview
CHAPTER 7
Ecological Integrity, Socioeconomic Resiliency, and Trends in Risk
Thomas M. Quigley Danny C. Lee
Richard W. Haynes James R. Sedell
Richard S. Holthausen Wendel J. Hann
Bruce E. Rieman Bruce G. Marcot
Amy L. Horne
•&38 Integrity, Resiliency, Risk
Thomas M. Quigley is a range scientist/economist with the USDA Forest Service, Interior ColumbiaBasin Ecosystem Management Project, Walla Walla, WA.
Danny C. Lee is a research biologist with the USDA Forest Service, Intermountain Research Station,Forestry Sciences Laboratory, Boise, ID.
Richard W Haynes is a research forester with the USDA Forest Service, Pacific Northwest ResearchStation, Forestry Sciences Laboratory, Portland, OR.
James R. Sedell is a principal research biologist with the USDA Forest Service, Pacific NorthwestResearch Station, Forestry Sciences Laboratory, Corvallis, OR.
Richard S. Holthausen is a wildlife biologist with the USDA Forest Service, Washington Office,Terrestrial Habitat Ecology Program, Corvallis, OR.
Wendel J. Hann is a landscape ecologist with the Interior Columbia Basin Ecosystem ManagementProject, Walla Walla, WA/Boise, ID.
Bruce E. Rieman is a research fisheries biologist with the USDA Forest Service, Intermountain ResearchStation, Forestry Sciences Laboratory, Boise, ID.
Bruce G. Marcot is a wildlife ecologist with the USDA Forest Service, Pacific Northwest ResearchStation, Pordand, OR
Amy L. Home is a research forester with the USDA Forest Service, Pacific Northwest Research Station,Portland, OR.
TABLE OF CONTENTS
Ecological Integrity Composite Ecological Integrity Trends in Composite Ecological Integrity
Methods Results and Discussion
Social and Economic Resiliency Current Socioeconomic Resiliency
Low socioeconomic resiliency rating Medium socioeconomic resiliency rating High socioeconomic resiliency rating
Trends in Socioeconomic Resiliency Risk Assessment: Human Ecological Interactions
Current Risks Associated with Human-wildland Interaction Trends in Risks Associated with Human-ecological Interaction Results and Discussion
Acknowledgments Literature Cited
839
840
841
841
845
855
855
855
857
857
857
860
860
860
860
875
876
• . . ~ . ~ . . ~ ` ~ . ~ ' ~ . ~ . . . . ~ . . . ~ . . . . ~ . . . . ~ . . ~ . . . . . . . . ` . ` . . . . ~ . . . ~ ' . ~ . . ~ ' . . . ~ . . . . ~ . ~ . . ~ . . - - . . . . . ~ . . . ~ . . . ~ . . . . . . . . . ~ . . . . ` . . v .
Integrity, Resiliency, Risk

•838 Integrity, Resiliency, Risk
The Draft Environmental Impact Statements ed as disturbances within the wildland systemdescribe two primary needs underlying the pro- come in conflict with human assets. These trendsposed action: (1) restore and maintain long-term are projected for each alternative. They provideecosystem health and integrity; and (2) support useful estimates to show how FS and BLM man-the economic and/or social needs of people, cul- agement as proposed in the alternatives mighttures, and communities, and provide sustainable influence ecological integrity and socioeconomicand predictable levels of products and services. resiliency. These estimates are not intended to beThe needs are linked with specific goals selected measures of final outcomes, but are an indicationby the EIS teams. The goals they identified of the direction of movement brought on by theinclude: 1) maintain, and where necessary restore, implementation of each EIS alternative. Eachthe long-term health and integrity of forest, alternative was evaluated to project how therangeland, aquatic, and riparian ecosystems; 2) actions of the FS and BLM would contribute toprovide sustainable and predictable levels of prod- integrity, socioeconomic resiliency, and humanucts and services within the capability of the ecological interactions,ecosystem; 3) provide opportunities for diversecultural, recreational, and aesthetic experiences ECOlOffJCfll IntG^TitVwithin the capability of the ecosystem; 4) con-tribute to the recovery and delisting of threatened It is recognized that there are no direct measures ofand endangered species; and, 5) manage natural ecological integrity and that assessing integrityresources consistent with treaty and trust responsi- requires comparisons against a set of ecologicalbilities to American Indian tribes (Preliminary conditions and against a set of clearly stated man-Draft EISs 1996'). These needs and goals imply agement goals and objectives (Woodley, Kay, andthe desire to achieve and maintain ecological Francis 1993). This process is not strictly a scientif-integrity at a high level. These needs and goals ic endeavor (Wickium and Davies 1995), becausewere examined by addressing ecological integrity, to provide meaning, ecological integrity must besocioeconomic resiliency, and the risks associated grounded to desired outcomes. The overriding eco-with human ecological interactions. logical outcome expected, as articulated in the EIS
Alternatives for FS- and BLM-administered landsA composite estimate of current ecological integri- within the Basiri) is to maintain or enhance ecosys-ty was developed across the entire Basin for all FS- tem or ecological integrity,and BLM-administered land and the trend in eco-logical integrity was estimated for each alternative High levels of ecological integrity are dependentover the next 100 years. This required identifica- on: the maintenance of evolutionary and ecologicaltion of the current condition of specific ecological processes, such as types and frequencies of distur-integrity components (aquatic/riparian, forest, bances, water cycling, energy flow, and nutrientrangeland, and hydrologic) (Quigley and others cycling; ecosystem functions and processes that1996). Current socioeconomic resiliency was esti- operate on multiple ecological domains and evolu-mated for social and economic systems, and its tionary time frames; and, viable populations ofvariation across the Basin was described (Quigley native and desired non-native species (see Haynesand others 1996). The trends in risk associated and others 1996 for a broader discussion). Thesewith human ecological interaction represents the processes and functions have transitioned from his-change expected to result from people interacting toric ranges of conditions to their present status,with the wildland system, and the change expect- The basic components of ecological integrity
'On file with: U.S. Department of Agriculture, Forest Service; U.S. Department of Interior, Bureau of Land Management,Interior Columbia Basin Ecosystem Management Project, 112 E. Poplar Street, Walla Walla, Washington 99362.
Integrity, Resiliency, Risk 83S
include the forest, range, and aquatic systems with undoubtedly will be refined as additional infbrma-a hydrologic system interconnecting the landscape tion becomes available. Given more time andinto a whole. High integrity for these components information, integrity indices might have includedcan be defined: direct consideration for elements such as recovery
... . . . i . x cycles, synereistic interactions between environ-A forest and range (terrestrial environment) memaj com*onems ̂ biophysical linkageS) ^system that exhibits high integrity is defined fcedback mechanisms m on differem
here as a mosaic of plant and animal communi- ^ ^j ora] scales within the ^ties, consisting of well connected, high-quality
*X°lTrlB^e±itf±±d Composite Ecological Integritydesired non-native species, the appropriate Subbasins (approximately 325,000 to 400,000expression of potential life histories and taxo- hectares in size) were rated as having high, medi-nomic lineages, and the taxonomic and genetic uni) or low ecological integrity for: forest lands,diversity necessary for long-term persistence rangelands, forest and rangeland hydrologic sys-and adaptation in a variable environment. temS) and aquatic systems (Sedell and others
An aquatic system that exhibits high integrity is 1996>- ̂ °f *f 164 sak^ ̂ *? J^defined here as a mosaic of well connected, was rated, and ratings considered all ownershipshigh-quality water and habitats that support a wlthin ^ Basm' T^ actual r*anf combined.diverse assemblage of native and desired non- ^™ bas<;don descriptive data layers, empiricalnative species, the fall expression of appropriate Process models, trend analysis, and expert judg-potential life histories and dispersal mecha- ment The basic data sets on which the ratingsnisms, and the genetic diversity necessary for wef ******* aggregations of data from broad-long-term persistence and adaptation in a vari- scale ma? &emes> ̂ watershed information orable environment. model ProJe««>ns (Quigley and others 1996).
Landscapes jointly encompass the terrestrial These basic layers Provided ^f backdr°P for «f'and aquatic environments. A hydrologic net- "^/o^ f C°mP°SIte <jc°loflcal. mteSnty for
Lwork operates within basins on the landscape. fS- and BLM-administered lands within each sub-A hydrologic system that exhibits high integrity basm' L
The Component integrity layers were usedis defined here as a network of streams, along wlth ^ in^tion brought forward through thewith their unique ground water ecosystems, assessment (Quigley and Arbelb,de in press), thewithin the broader landscape where the upland, evaluation of alternatives which included a discus-
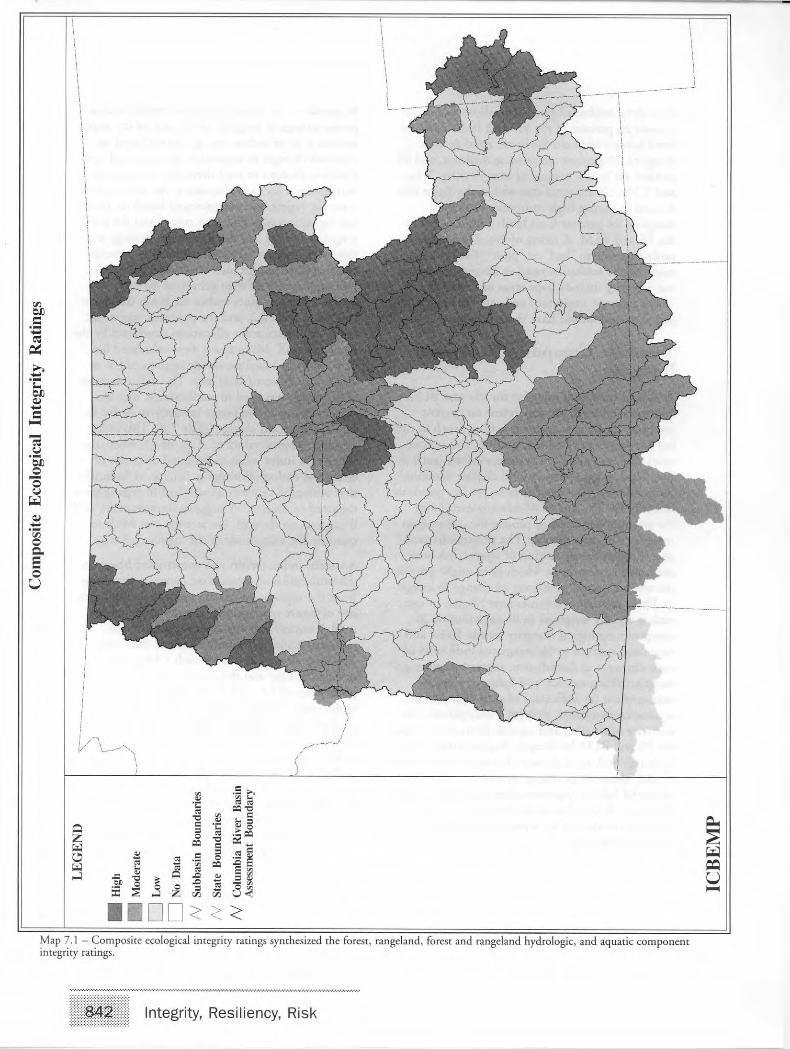
floodplain, and riparian areas have resilient veg- »°n of k^)C T8"*7' T™5^ ^T^ j-etation, where the capture, storage, and release (Marcot 1996) and our understanding of condi-of water limits the effects of sedimentation and tlons ̂ dtrends'. to estimate the current compositeerosion, and where infiltration, percolation, ecological integrity for each subbasm (map 7.1).and nutrient cycling provide for diverse and Composite integrity was estimated by comparingproductive aquatic and terrestrial ** «™P°n«K ""*g"«y ratings and knowledge ofenvironments. ^ ?n-the^ound conditions with how each
subbasm met the definitions described previouslyThese estimates of integrity and resiliency are pre- for systems with high ecological integrity.sented as initial estimates based on our under- . . . . . . . . .standing of the information available. Absolute The comP°s'te ecological integrity ratings are rela-levels of integrity or resiliency within the Basin are tlve,measures wlthin ^ Basm- Hl& comP^fnot presumed to have been measured nor revealed. ecological integrity indicates that, relative to theRather, these represent the first attempt at estimat- ^ subba*f ̂ in^e ^essment area, a sub-ing relative integrity at this spatial level and basm meets the defini»ons of ^ integrity more
S4H Integrity, Resiliency, Risk
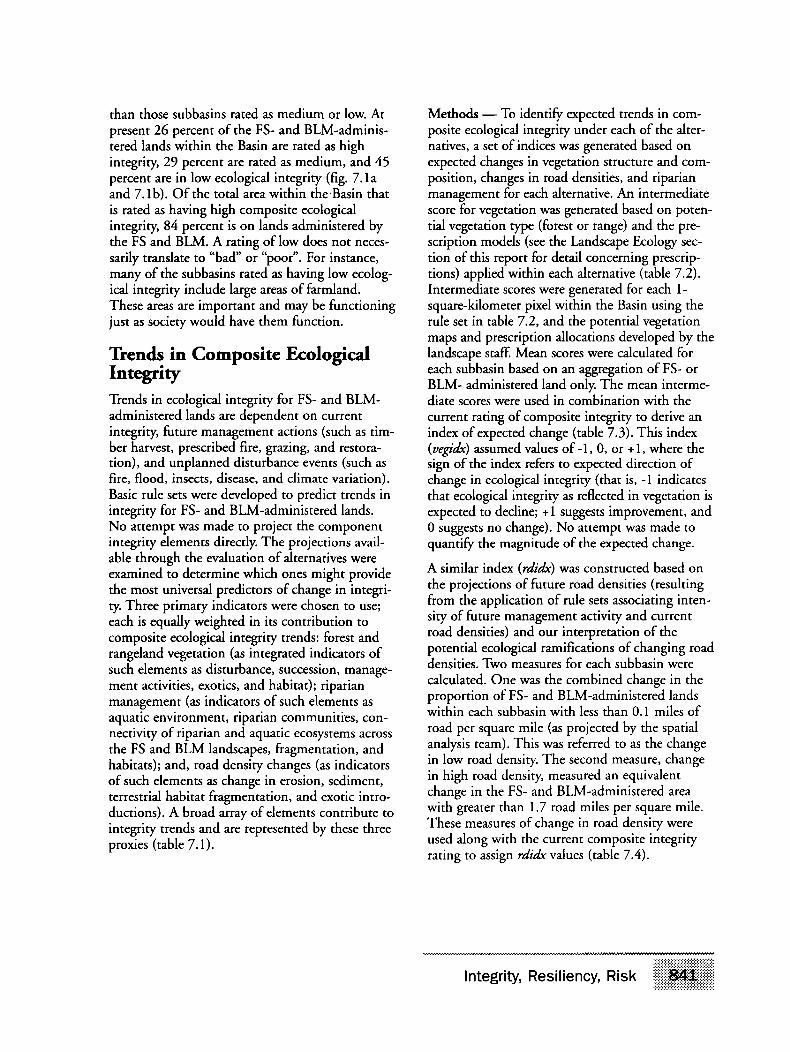
than those subbasins rated as medium or low. At Methods — To identify expected trends in corn-present 26 percent of the FS- and BLM-adminis- posite ecological integrity under each of the alter-tered lands within the Basin are rated as high natives, a set of indices was generated based onintegrity, 29 percent are rated as medium, and 45 expected changes in vegetation structure and corn-percent are in low ecological integrity (fig. 7.la position, changes in road densities, and riparianand 7.1b). Of the total area within the Basin that management for each alternative. An intermediateis rated as having high composite ecological score for vegetation was generated based on poten-integrity, 84 percent is on lands administered by tial vegetation type (forest or range) and the pre-the FS and BLM. A rating of low does not neces- scription models (see the Landscape Ecology sec-sarily translate to "bad" or "poor". For instance, tion of this report for detail concerning prescrip-many of the subbasins rated as having low ecolog- tions) applied within each alternative (table 7.2).ical integrity include large areas of farmland. Intermediate scores were generated for each 1-These areas are important and may be functioning square-kilometer pixel within the Basin using thejust as society would have them function. rule set in table 7.2, and the potential vegetation
maps and prescription allocations developed by theTrends ill Composite Ecological landscape staff. Mean scores were calculated forIntegrity each subbasin based on an aggregation of FS- or
® BLM- administered land only. The mean interme-Trends in ecological integrity for FS- and BLM- diate scores were used in combination with theadministered lands are dependent on current current rating of composite integrity to derive anintegrity, future management actions (such as tim- index of expected change (table 7.3). This indexber harvest, prescribed fire, grazing, and restora- (vegidx) assumed values of-1, 0, or +1, where thetion), and unplanned disturbance events (such as sign of the index refers to expected direction offire, flood, insects, disease, and climate variation). change in ecological integrity (that is, -1 indicatesBasic rule sets were developed to predict trends in that ecological integrity as reflected in vegetation isintegrity for FS- and BLM-administered lands. expected to decline; +1 suggests improvement, andNo attempt was made to project the component 0 suggests no change). No attempt was made tointegrity elements directly. The projections avail- quantify the magnitude of the expected change,able through the evaluation of alternatives wereexamined to determine which ones might provide A similar index <r^ was constructed based onthe most universal predictors of change in integri- *c Projections of future road densities (resultingty. Three primary indicators were chosen to use; from *e application of rule sets associating mten-each is equally weighted in its contribution to SIV °{, *""« management activity and currentcomposite ecological integrity trends: forest and road densities) and our interpretation of therangeland vegetation (as integrated indicators of potential ecological ramifications of changing roadsuch elements as disturbance, succession, manage- densities. Two measures for each subbasin werement activities, exotics, and habitat); riparian calculated. One was the combined change in themanagement (as indicators of such elements as proportion of FS- and BLM-administered andsaquatic environment, riparian communities, con- wlthm each subbasin with less than 0.1 miles ofnectivity of riparian and aquatic ecosystems across road Per s<luare mlle &* Pro)ected b7 the sPatlal
the FS and BLM landscapes, fragmentation, and analysls team)' Tms was referred to « the change
habitats); and, road density changes (as indicators m low ™ad density. The second measure changeof such elements as change in erosion, sediment, m hl8h road denslty> measured an equivalentterrestrial habitat fragmentation, and exotic intro- change in the FS' and BLM-administered areaductions). A broad array of elements contribute to with Sreater than 17 road miles Pef S1uare mik
integrity trends and are represented by these three These measures of change m road density wereproxies (table 7 1) used ^onS ™lt" tne current composite integrity
rating to assign rdidx values (table 7.4).
Integrity, Resiliency, Risk 841
Integrity, Resiliency, Risk
Map 7.1 - Composite ecological integrity ratings synthesized the forest, rangeland, forest and rangeland hydrologic, and aquatic component integrity ratings.
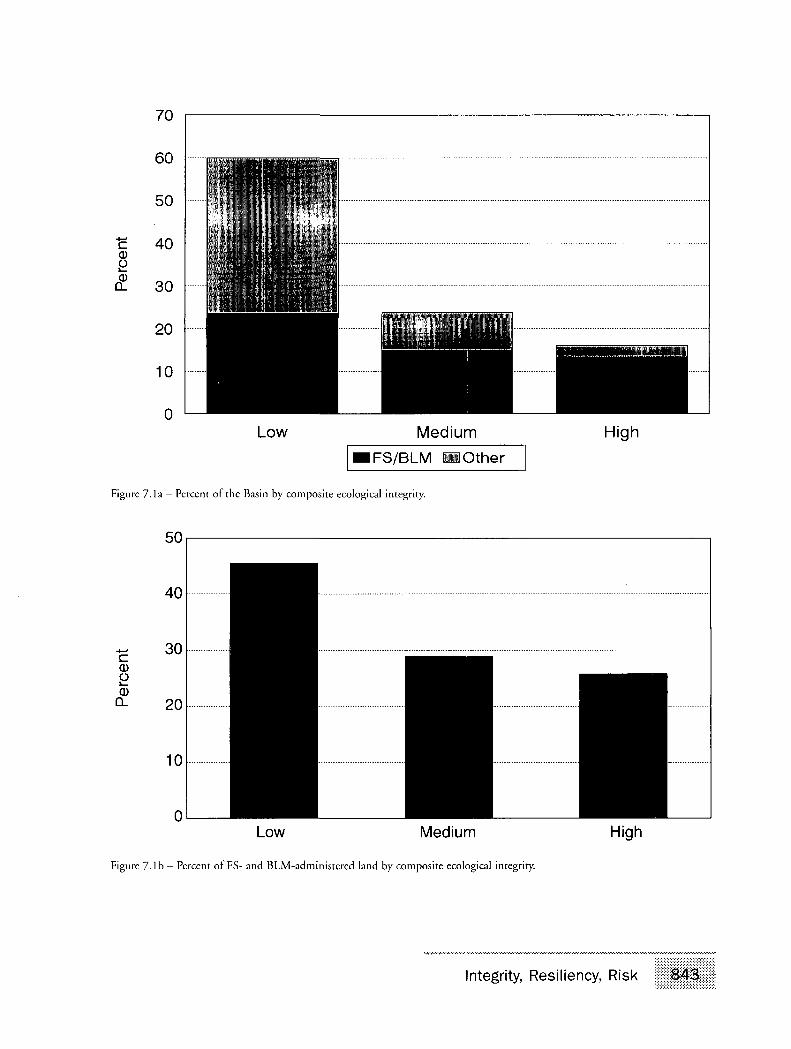
Figure 7.la- Percent of the Basin by composite ecological integrity.
Figure 7.1b — Percent of FS- and BLM-administered land by composite ecological integrity.
Integrity, Resiliency, Risk
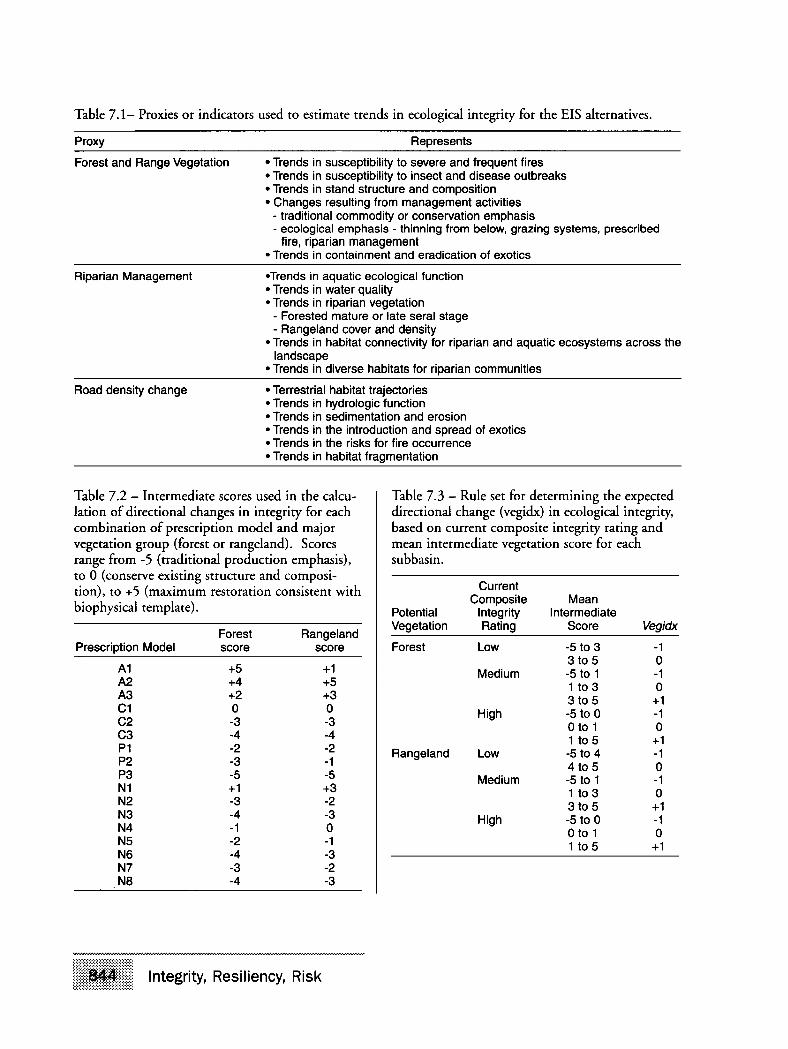
Table 7.1- Proxies or indicators used to estimate trends in ecological integrity for the EIS alternatives.
Proxy Represents
Forest and Range Vegetation • Trends in susceptibility to severe and frequent fires• Trends in susceptibility to insect and disease outbreaks• Trends in stand structure and composition• Changes resulting from management activities
- traditional commodity or conservation emphasis- ecological emphasis - thinning from below, grazing systems, prescribed
fire, riparian management• Trends in containment and eradication of exotics
Riparian Management «Trends in aquatic ecological function• Trends in water quality• Trends in riparian vegetation
- Forested mature or late serai stage- Rangeland cover and density
• Trends in habitat connectivity for riparian and aquatic ecosystems across thelandscape
• Trends in diverse habitats for riparian communities
Road density change • Terrestrial habitat trajectories• Trends in hydrologic function• Trends in sedimentation and erosion• Trends in the introduction and spread of exotics• Trends in the risks for fire occurrence• Trends in habitat fragmentation
Table 7.2 - Intermediate scores used in the calcu- Table 7.3 - Rule set for determining the expectedlation of directional changes in integrity for each directional change (vegidx) in ecological integrity,combination of prescription model and major based on current composite integrity rating andvegetation group (forest or rangeland). Scores mean intermediate vegetation score for eachrange from -5 (traditional production emphasis), subbasin.to 0 (conserve existing structure and composi-tion), to +5 (maximum restoration consistent with Currenti - i - i i \ Composite Meanbiophysical template). Potential Integrity Intermediate
: ;—— Vegetation Rating Score VegidxForest Rangeland — —
Prescription Model score score Forest Low -5 to 3 -1r; - : 3 to 5 o*! +° +l Medium -5 to 1 -1« +o +~ 1to3 0A3 +2 +3 3to5 +1
S o o H'gh -5to° -1
™ , , 0 to 1 0S? 1 1 1to5 +1
'LL ~2 "7 Rangeland Low -5 to 4 -1DO c "1 4 to 5 0™ * -° Medium -5 to 1 -1N1 +1 +3 1 to 3 0
™ 1 1 3<°5 +1N3 -4 -3 High -5 to 0 -1MJ "1 H 0101 0
IS 2 1 UH5 1!_N7 -3 -2N8 -4 -3
844 Integrity, Resiliency, Risk
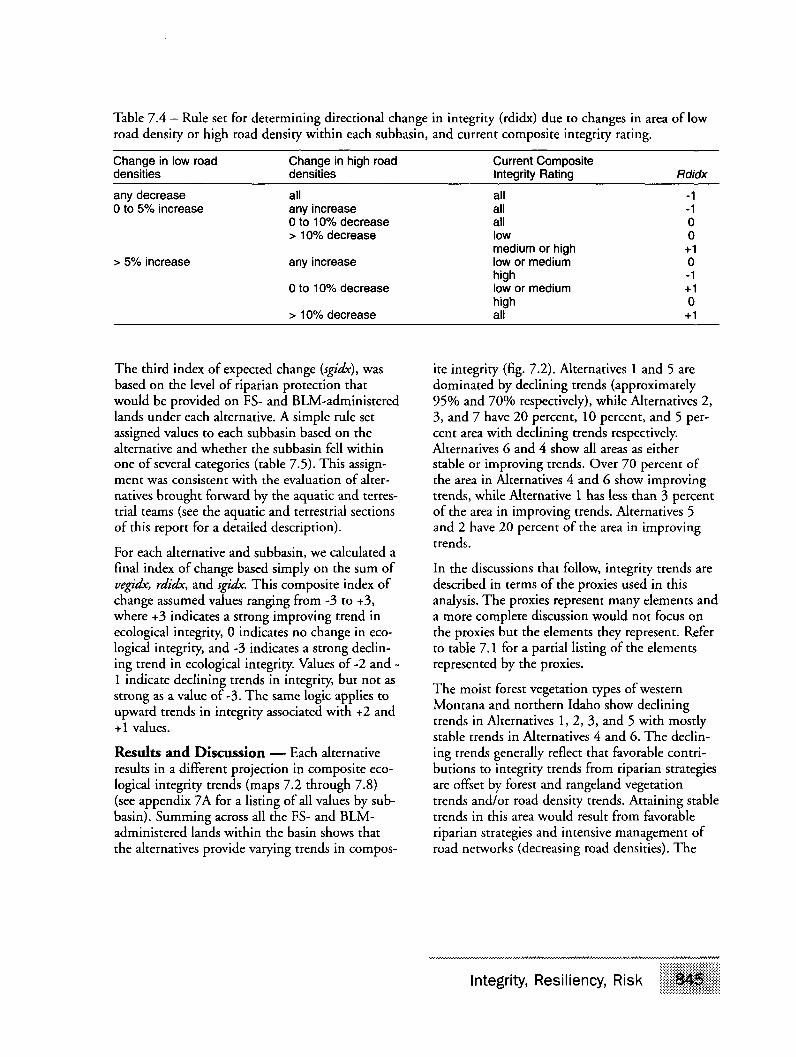
Table 7.4 — Rule set for determining directional change in integrity (rdidx) due to changes in area of lowroad density or high road density within each subbasin, and current composite integrity rating.
Change in low road Change in high road Current Compositedensities densities Integrity Rating Rdidx
any decrease all all -10 to 5% increase any increase all -1
0 to 10% decrease all 0> 10% decrease low 0
medium or high +1> 5% increase any increase low or medium 0
high -10 to 10% decrease low or medium +1
high 0> 10% decrease all +1
The third index of expected change (sgidx), was ite integrity (fig. 7.2). Alternatives 1 and 5 arebased on the level of riparian protection that dominated by declining trends (approximatelywould be provided on FS- and BLM-administered 95% and 70% respectively), while Alternatives 2,lands under each alternative. A simple rule set 3, and 7 have 20 percent, 10 percent, and 5 per-assigned values to each subbasin based on the cent area with declining trends respectively,alternative and whether the subbasin fell within Alternatives 6 and 4 show all areas as eitherone of several categories (table 7.5). This assign- stable or improving trends. Over 70 percent ofment was consistent with the evaluation of alter- the area in Alternatives 4 and 6 show improvingnatives brought forward by the aquatic and terres- trends, while Alternative 1 has less than 3 percenttrial teams (see the aquatic and terrestrial sections of the area in improving trends. Alternatives 5of this report for a detailed description). and 2 have 20 percent of the area in improving
For each alternative and subbasin, we calculated afinal index of change based simply on the sum of In the discussions that follow, integrity trends arevegidx, rdidx, and sgidx. This composite index of described in terms of the proxies used in thischange assumed values ranging from -3 to +3, analysis. The proxies represent many elements andwhere +3 indicates a strong improving trend in a more complete discussion would not focus onecological integrity, 0 indicates no change in eco- the proxies but the elements they represent. Referlogical integrity, and -3 indicates a strong declin- to table 7.1 for a partial listing of the elementsing trend in ecological integrity. Values of -2 and - represented by the proxies.1 indicate declining trends in integrity, but not as . . r . r
strong as a value of-3. The same logic applies to The molst f°rest veg«anon types of westernupward trends in integrity associated with +2 and Mon,tana and northe™ Idah° ^™ declining
, , trends in Alternatives 1, 2, 3, and 5 with mostlystable trends in Alternatives 4 and 6. The declin-
Results and Discussion — Each alternative ing trends generally reflect that favorable contri-results in a different projection in composite eco- butions to integrity trends from riparian strategieslogical integrity trends (maps 7.2 through 7.8) are offset by forest and rangeland vegetation(see appendix 7 A for a listing of all values by sub- trends and/or road density trends. Attaining stablebasin). Summing across all the FS- and BLM- trends in this area would result from favorableadministered lands within the basin shows that riparian strategies and intensive management ofthe alternatives provide varying trends in compos- road networks (decreasing road densities). The
Integrity, Resiliency, Risk 84S
forest and rangeland vegetation management noxious weeds are contained or reduced, and thestrategies applied within the alternatives were gen- vegetation structure and cover type changes thaterally not effective in restoring composition and result from grazing, disturbances, changes in firestructure to that which would be consistent with regime, and woody species encroachment. Wherethe long-term disturbance processes and the capa- aggressive management of noxious weeds, grazingbilities of the biophysical environment. More management, watershed restoration, and roadextensive treatments, focused specifically on the density reductions are planned, the trends are sta-mid-seral vegetation types and prioritized within ble or improving,the area, might result in favorable trends for the „. , .... _ .vegetation component of integrity. The specific The larf reserves °f ̂ ™™ 7 hfe *™interactions that would occur with changing vege- where the integrity trend is projected to be declm-tation treatments would need to be explored if m& Tms declmmg "end reflects *? «mefrarnesuch a proposal were to come forward. Where this (100-year projection), current conditions, andarea shows improving trends in ecological integri- projected approach to fire management and roadty in Alternative 7 is related to decreasing road closures Fire suppression during the last severaldensities and favorable riparian strategies as decades has been effective in removing fire fromopposed to vegetation conditions consistent with ^ o{ thf existing wilderness areas of centrallong-term disturbance processes and the capabili- Idaho' result™% m
L ^ bullduP f ^5 m much _,ties of the biophysical environment. of [hls area This buildup of fuels ,s not projected
to burn within the next decade, but is likely toThe dry forest vegetation types of eastern Oregon burn with large fires in the next 100 years. Forshow declining trends in Alternatives 1 and 5, sta- those areas showing declining trends in the 100-ble trends in 2, 3, and 4, and improving trends in year timeframe in the reserves, the trend in the6 and portions of 7. The rationale for these trends next decade might be stable and in a 400 yearis similar to those for the moist forest types. In timeframe might be favorable,the action alternatives the improving-trend contri- .bution from riparian strategies is generally offset The ratlonalf for the "Panan strategy con<"bu-by declining trends from road density changes. non to "ends ls related l° the managementThe forest and rangeland vegetation trends under aPProach to,exi"m§ roads w"hm ** re se™s'the prescriptions of the alternatives did not result Alternative 7 calls for the roads to be closed, butin improving trends in integrity. The forest and not necessarily obliterated or put to bed. Most,rangeland vegetation management strategies but not f' of the «^«m potential contnbu-applied within the alternatives generally were not r°rs *° adverse ecological conditions from theseeffective in restoring composition and structure to flosed roads would bf ^dressed. This would like-that consistent with the long-term disturbance ^ conmbute » problems during the 100 yearprocesses and the capabilities of the biophysical timeframe as culverts become plugged and wash-environment. More extensive treatments, focused °uts oc
Lc,ur' and erosion on road surfaces >ncreases.
specifically on the mid-serai vegetation types, and Favorable trends in integrity for riparian strategiesprioritized within the area might result in favor- were not Rejected within reserves. Similar con-able trends for the vegetation component of cerns are Pr°Jected for rangeland areas withinintegrity. Alternative 6 shows improving trends for Tfserve
as related
fto .7°X1OUS ̂ expansion and
this area that reflect favorable riparian strategies the influence of wildfire in the absence of substan-and more aggressive road density management tlal «^oration. Fire suppression was projected to
than the other alternatives. occurj *
cc°tdmS to natlfnal fire P0'1 '̂ b"r Pr°'jected wildnre size was larger than could be errec-
In the action alternatives (3 through 7) declining lively controlled,trends on rangelands generally reflect the degree
$4B Integrity, Resiliency, Risk
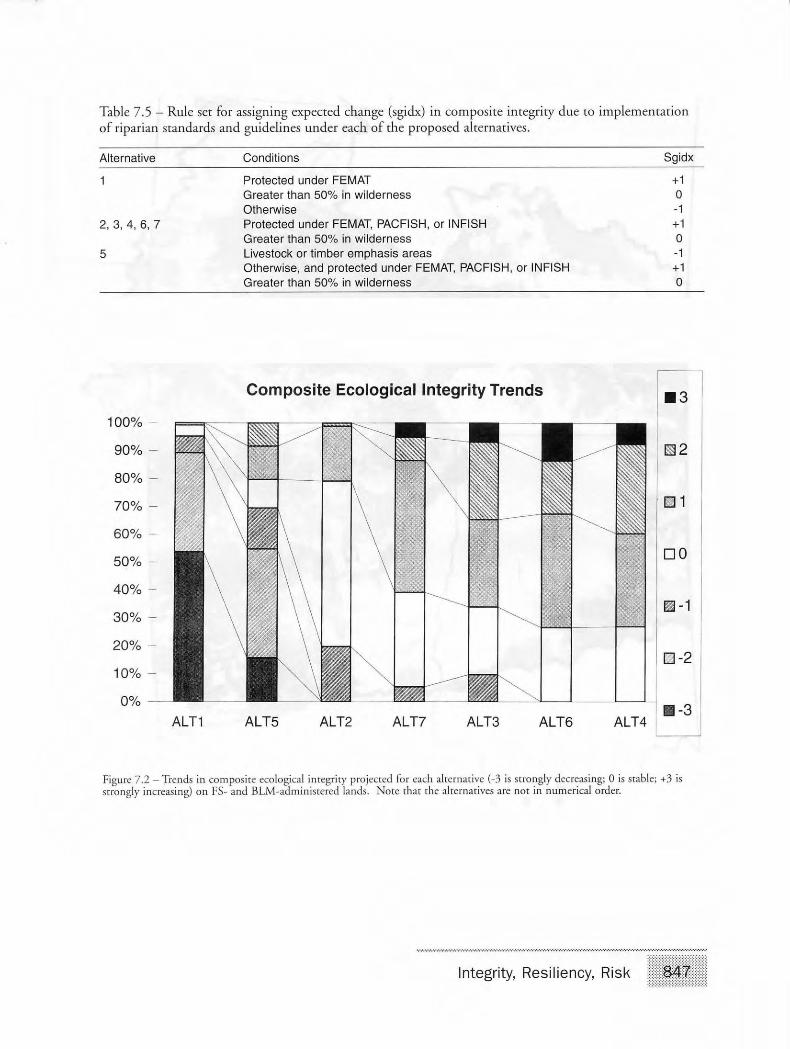
Table 7.5 - Rule set for assigning expected change (sgidx) in composi te integrity due to implementa t ion of riparian standards and guidelines under each o f the proposed alternatives.
Alternative Conditions Sgidx
Protected under FEMAT +1 Greater than 50% in wilderness 0 Otherwise -1
2, 3, 4, 6, 7 Protected under FEMAT, PACFISH, or INFISH +1 Greater than 50% in wilderness 0 Livestock or timber emphasis areas -1 Otherwise, and protected under FEMAT, PACFISH, or INFISH +1 Greater than 50% in wilderness 0
Figure 7.2 - Trends in composite ecological integrity projected for each alternative (-3 is strongly decreasing; 0 is stable; +3 is strongly increasing) on FS- and BLM-administered lands. Note that the alternatives are not in numerical order.
Integrity, Resiliency, Risk
Composite Ecological Integrity Trends

Map 7.2 - Long-term trends in ecological integrity for FS- and BLM-administered land: Alternative 1.
Integrity, Resiliency, Risk
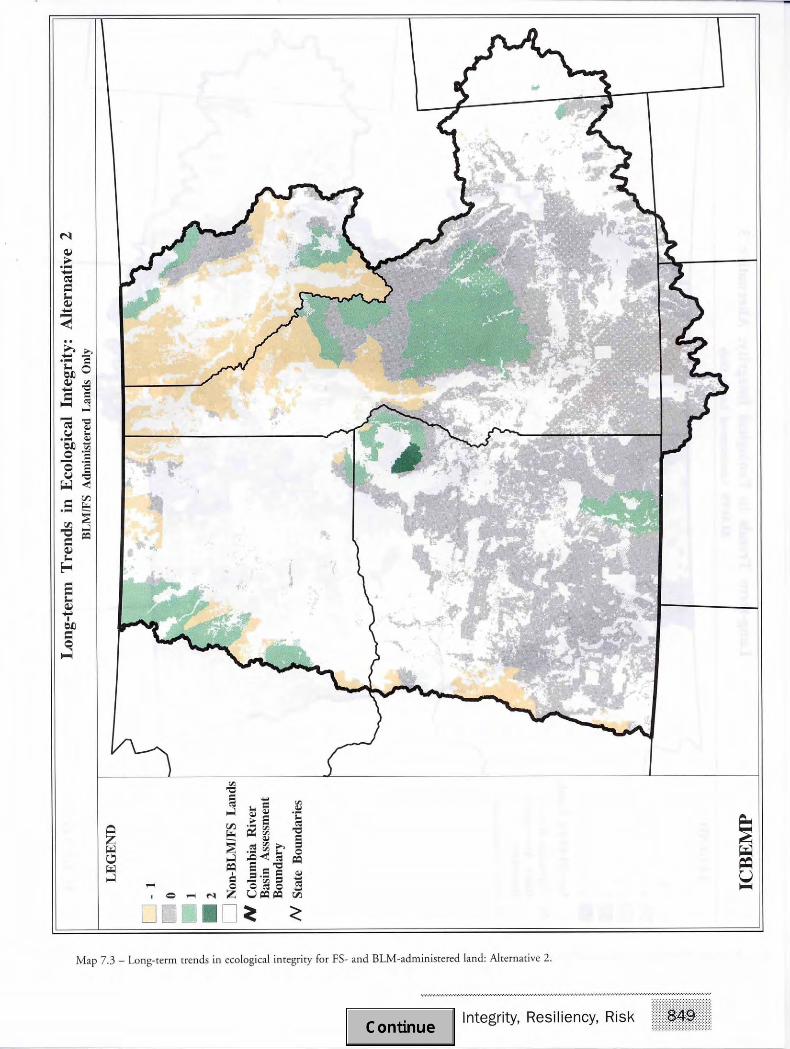
Map 7.3 - Long-term trends in ecological integrity for FS- and BLM-administered land: Alternative 2.
Integrity, Resiliency, Risk ~