Embed Size (px)
Citation preview

3/19/2018
1
Chapter 4
Physical, Chemical and
Biological Properties of MSW
Physical Properties of MSW
Specific Weight (Density)
Moisture Content
Particle Size and Distribution
Field Capacity
Permeability of Compacted Waste
3/19/2018
2
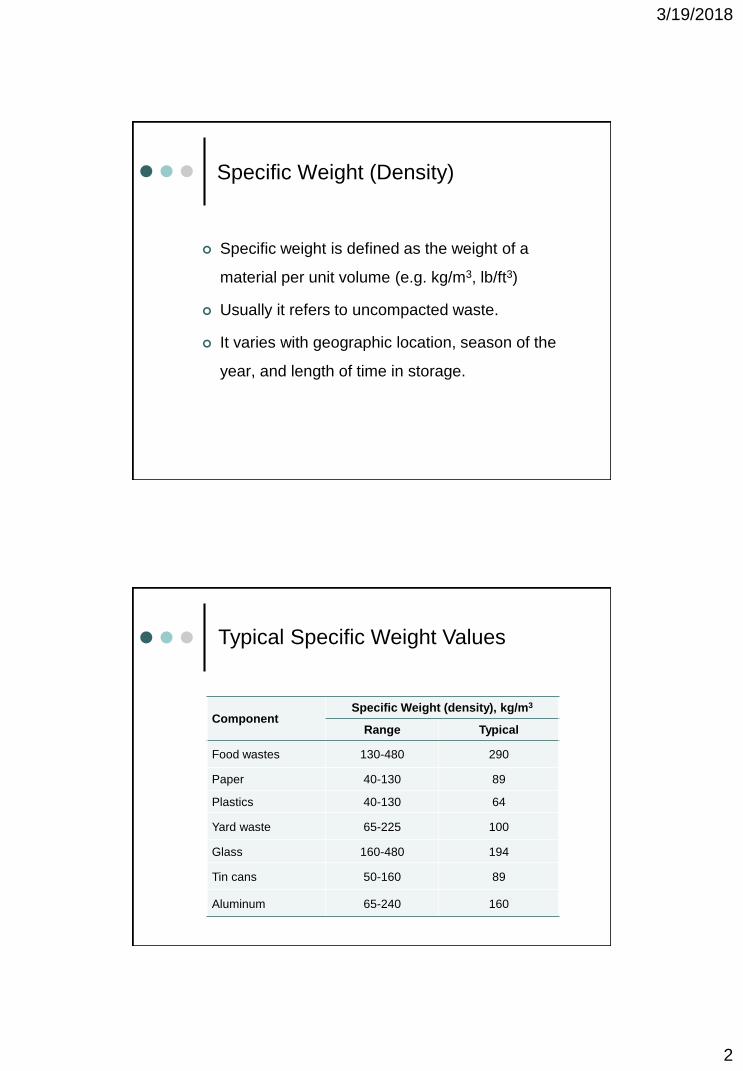
Specific Weight (Density)
Specific weight is defined as the weight of a
material per unit volume (e.g. kg/m3, lb/ft3)
Usually it refers to uncompacted waste.
It varies with geographic location, season of the
year, and length of time in storage.
Typical Specific Weight Values
ComponentSpecific Weight (density), kg/m3
Range Typical
Food wastes 130-480 290
Paper 40-130 89
Plastics 40-130 64
Yard waste 65-225 100
Glass 160-480 194
Tin cans 50-160 89
Aluminum 65-240 160

3/19/2018
3
Typical Specific Weight Values
Condition Density (kg/m3)
Loose MSW, no
processing or compaction90-150
In compaction truck 355-530
Baled MSW 710-825
MSW in a compacted
landfill (without cover)440-740
The moisture in a sample is expressed as percentage
of the wet weight of the MSW material
Analysis Procedure:
Weigh the aluminum dish
Fill the dish with SW sample and re-weigh
Dry SW + dish in an oven for at least 24 hrs at 105°C.
Remove the dish from the oven, allow to cool in a
desiccator, and weigh.
Record the weight of the dry SW + dish.
Calculate the moisture content (M) of the SW sample
using the equation given above.
100 xw
dwM
Moisture Content
3/19/2018
4
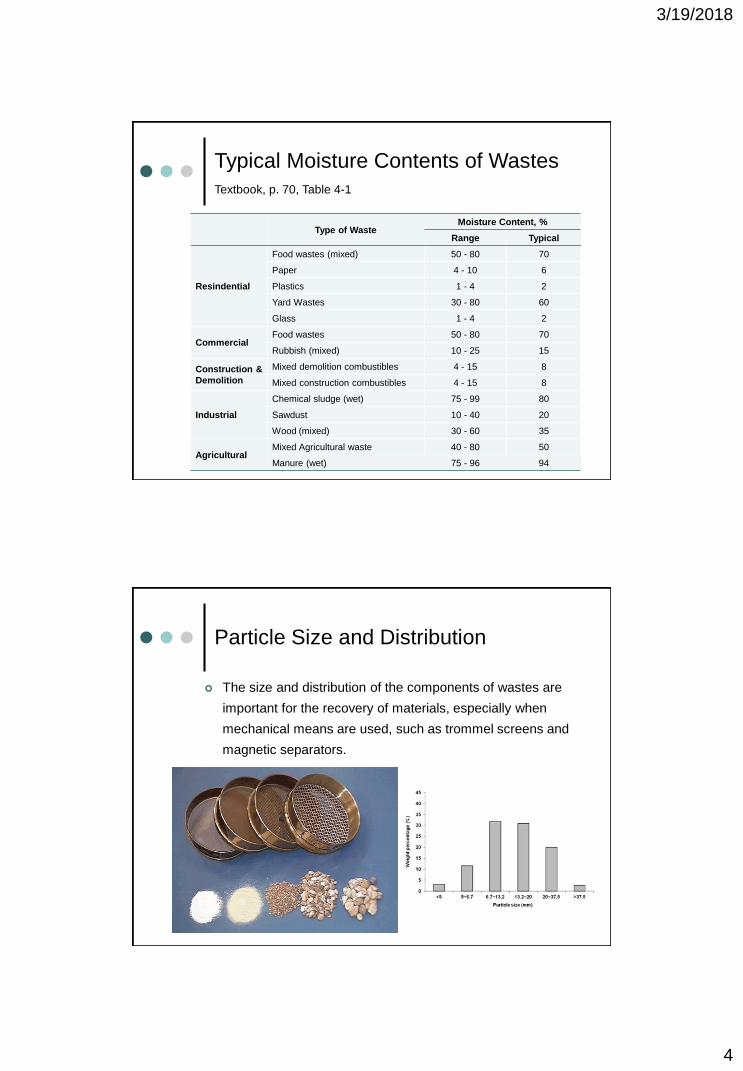
Type of WasteMoisture Content, %
Range Typical
Resindential
Food wastes (mixed) 50 - 80 70
Paper 4 - 10 6
Plastics 1 - 4 2
Yard Wastes 30 - 80 60
Glass 1 - 4 2
CommercialFood wastes 50 - 80 70
Rubbish (mixed) 10 - 25 15
Construction &
Demolition
Mixed demolition combustibles 4 - 15 8
Mixed construction combustibles 4 - 15 8
Industrial
Chemical sludge (wet) 75 - 99 80
Sawdust 10 - 40 20
Wood (mixed) 30 - 60 35
AgriculturalMixed Agricultural waste 40 - 80 50
Manure (wet) 75 - 96 94
Typical Moisture Contents of Wastes
Textbook, p. 70, Table 4-1
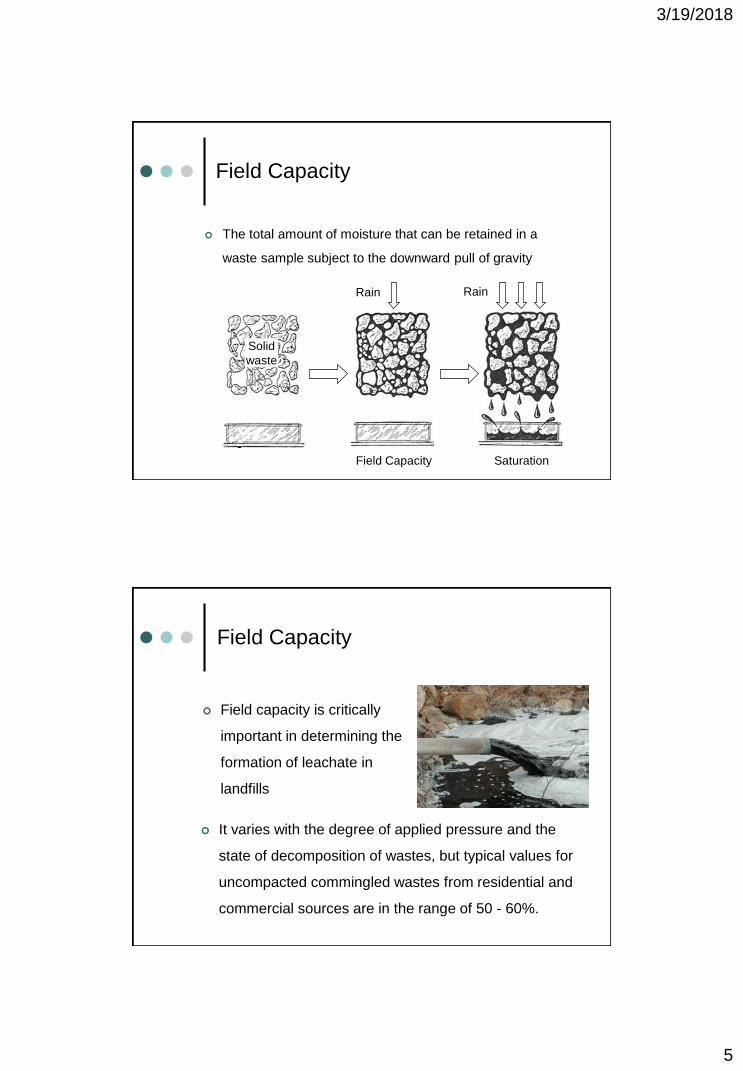
Particle Size and Distribution
The size and distribution of the components of wastes are
important for the recovery of materials, especially when
mechanical means are used, such as trommel screens and
magnetic separators.
3/19/2018
5
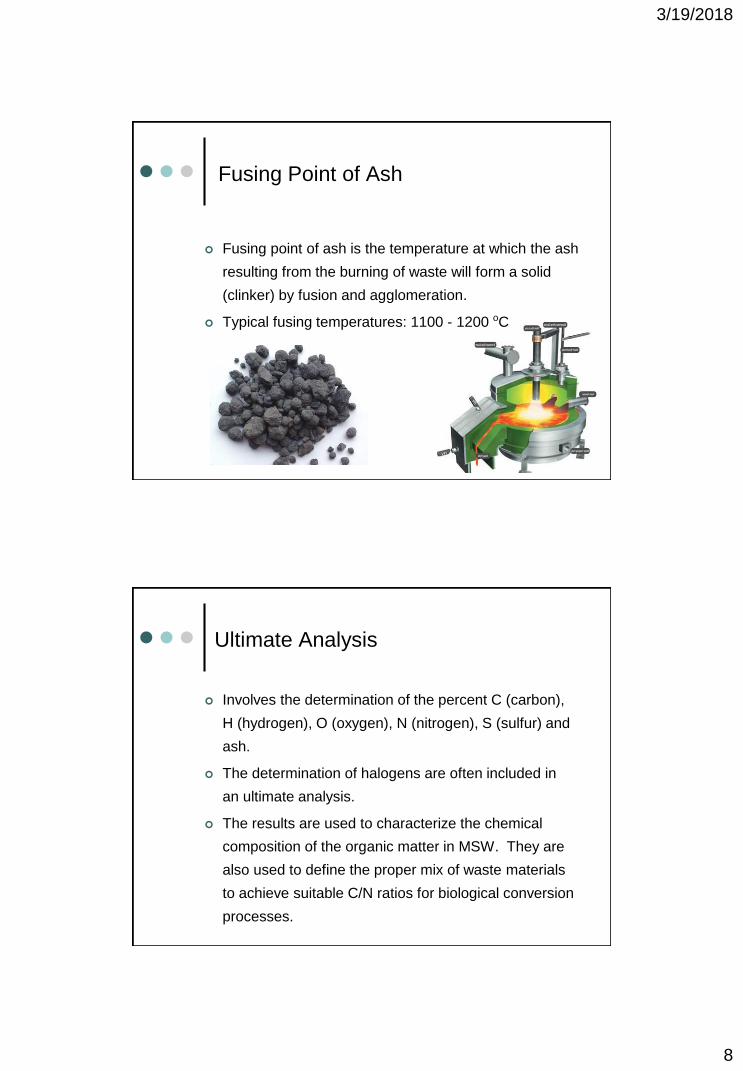
The total amount of moisture that can be retained in a
waste sample subject to the downward pull of gravity
Field Capacity
Field Capacity Saturation
Solid
waste
Rain Rain
It varies with the degree of applied pressure and the
state of decomposition of wastes, but typical values for
uncompacted commingled wastes from residential and
commercial sources are in the range of 50 - 60%.
Field Capacity
Field capacity is critically
important in determining the
formation of leachate in
landfills

3/19/2018
6
Permeability of Compacted Waste
The permeability (hydraulic conductivity) of compacted
solid waste is an important physical property because it
governs the movement of liquids & gases in a landfill.
Permeability depends on;
Pore size distribution
Surface area
Porosity
Chemical Properties of MSW
Chemical properties of MSW are very important in
evaluating the alternative processing and recovery
options:
Proximate analysis
Fusing point of ash
Ultimate analysis (major elements)
Energy content

3/19/2018
7
Proximate Analysis
Proximate analysis for the combustible components of
MSW includes the following tests:
Moisture (drying at 105 oC for 1 h)
Volatile combustible matter (ignition at 950 oC in the
absence of oxygen)
Fixed carbon (combustible residue left after Step 2)
Ash (weight of residue after combustion in an open crucible)
Typical Proximate Analysis Values
(% by weight)
Type of Waste Moisture Volatiles Carbon Ash
Mixed food 70.0 21.4 3.6 5.0
Mixed paper 10.2 75.9 8.4 5.4
Mixed plastics 0.2 95.8 2.0 2.0
Yard wastes 60.0 42.3 7.3 0.4
Glass 2.0 - - 96-99
Residential MSW 21.0 52.0 7.0 20.0
Textbook, p.78, Table 4-2
3/19/2018
8
Fusing Point of Ash
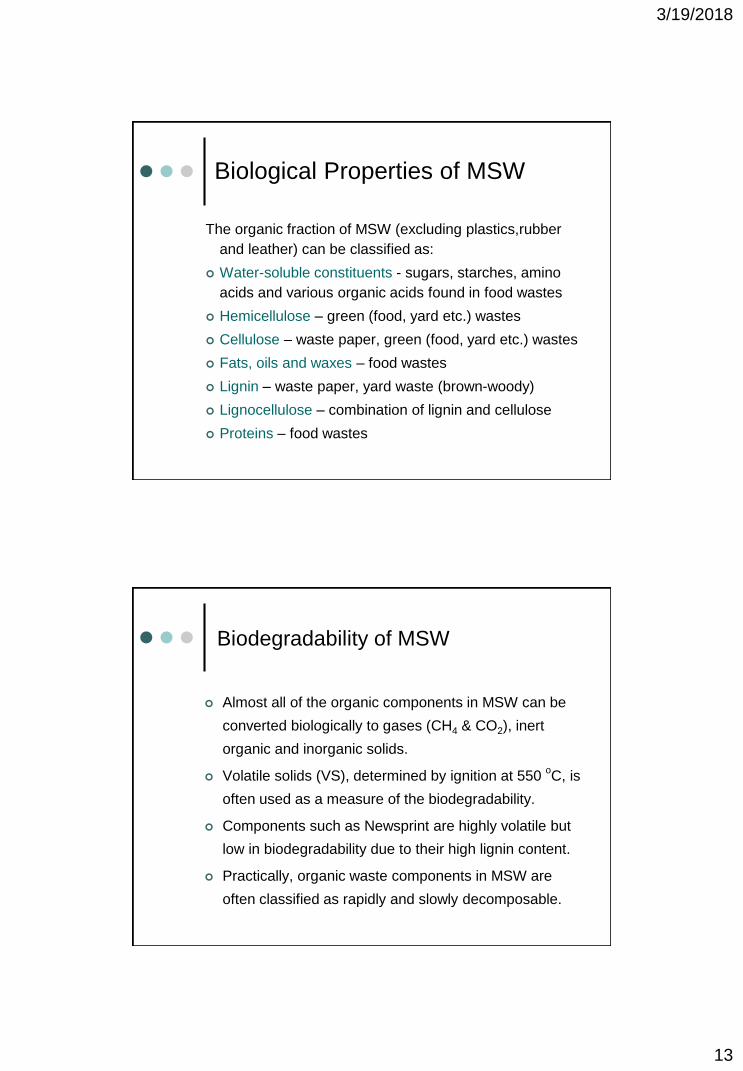
Fusing point of ash is the temperature at which the ash
resulting from the burning of waste will form a solid
(clinker) by fusion and agglomeration.
Typical fusing temperatures: 1100 - 1200 oC
Ultimate Analysis
Involves the determination of the percent C (carbon),
H (hydrogen), O (oxygen), N (nitrogen), S (sulfur) and
ash.
The determination of halogens are often included in
an ultimate analysis.
The results are used to characterize the chemical
composition of the organic matter in MSW. They are
also used to define the proper mix of waste materials
to achieve suitable C/N ratios for biological conversion
processes.

3/19/2018
9
Table 4-3. Typical data on ultimate analysis of
combustible materials found in SW
Chemical composition of typical MSW
Sulfur 0,1%
Ash 5,5% Nitrogen 0,5%
Oxygen
21%
Water
28%
Carbon
25%
Hydrogen
3,3%
Glass-Ceramics
9,3%
Metals 7,2%

3/19/2018
10
Typical data in elemental analysis
(% by weight)
Type C H O N S Ash
Mixed food 73.0 11.5 14.8 0.4 0.1 0.2
Mixed paper 43.3 5.8 44.3 0.3 0.2 6.0
Mixed plastic 60.0 7.2 22.8 - - 10.0
Yard waste 46.0 6.0 38.0 3.4 0.3 6.3
Refuse Derived
Fuel (RDF)44.7 6.2 38.4 0.7 <0.1 9.9
Energy Content of Solid Waste
Energy content can be determined by;
1. By using a full scale boiler as a
calorimeter
2. By using a laboratory bomb
calorimeter
3. By calculation
Most of the data on the energy
content of the organic components of
MSW are based on the results of
bomb calorimeter tests. http://chemistry.umeche.maine.edu/~amar/fall2007/bomb.html
Bomb Calorimeter

3/19/2018
11
Table 4-5. Inert residue and energy content
of residential MSW
Components
Inert Residue Percentage Energy, kJ/kg
Range Typical Range Typical
Organic
Food wastes 2-8 5 3489-6978 4652
Paper 4-8 6 11630-18608 16747
Cardboard 3-6 5 13956-17445 16282
Plastics 6-20 10 27912-37216 32564
Textiles 2-4 2.5 15119-18608 17445
Rubber 8-20 10 20934-27912 23260
Leather 8-20 10 15119-19771 17445
Yard wastes 2-6 4.5 2326-18608 6513
Wood 0.6-2 1.5 17445-19771 18608
Misc. organics - - - -
Inorganic
Glass 96-99 + 98 116-233 140
Tin cans 96-99 + 98 233-1163 698
Aluminum 90-99 + 96 - -
Other metal 94-99 + 98 233-1163 698
Dirt,ashes,etc 60-80 70 2326-11630 6978
Municipal solid waste - - 9304-13956 11630
Average composition and heating
values for MSW
Energy content of MSW~10,000 kJ/kg (2390 kcal/kg or 2.78 kWh/kg)
Waste Component Weight %Heating Value
kJ/kg kcal/kg kWh/kg
Paper & paper products 37.8 17700 4230 4.9
Plastic 4.60 33500 8007 9.3
Rubber and leather 2.20 23500 5617 6.5
Textiles 3.30 32500 7768 9.0
Wood 3.00 20000 4780 5.6
Food wastes 14.2 15100 3609 4.2
Yard wastes 14.6 17000 4063 4.7
Glass and ceramics 9.00 0 0 0
Metals 8.20 0 0 0
Miscellaneous inorganic 3.10 0 0 0

3/19/2018
12
Energy content of MSW components
1 kJ = 4.184 kcal
Essential nutrients & other elements
Important if organic fraction of MSW is to be used for production
of compost or CH4
3/19/2018
13
Biological Properties of MSW
The organic fraction of MSW (excluding plastics,rubber
and leather) can be classified as:
Water-soluble constituents - sugars, starches, amino
acids and various organic acids found in food wastes
Hemicellulose – green (food, yard etc.) wastes
Cellulose – waste paper, green (food, yard etc.) wastes
Fats, oils and waxes – food wastes
Lignin – waste paper, yard waste (brown-woody)
Lignocellulose – combination of lignin and cellulose
Proteins – food wastes
Almost all of the organic components in MSW can be
converted biologically to gases (CH4 & CO2), inert
organic and inorganic solids.
Volatile solids (VS), determined by ignition at 550 oC, is
often used as a measure of the biodegradability.
Components such as Newsprint are highly volatile but
low in biodegradability due to their high lignin content.
Practically, organic waste components in MSW are
often classified as rapidly and slowly decomposable.
Biodegradability of MSW
3/19/2018
14
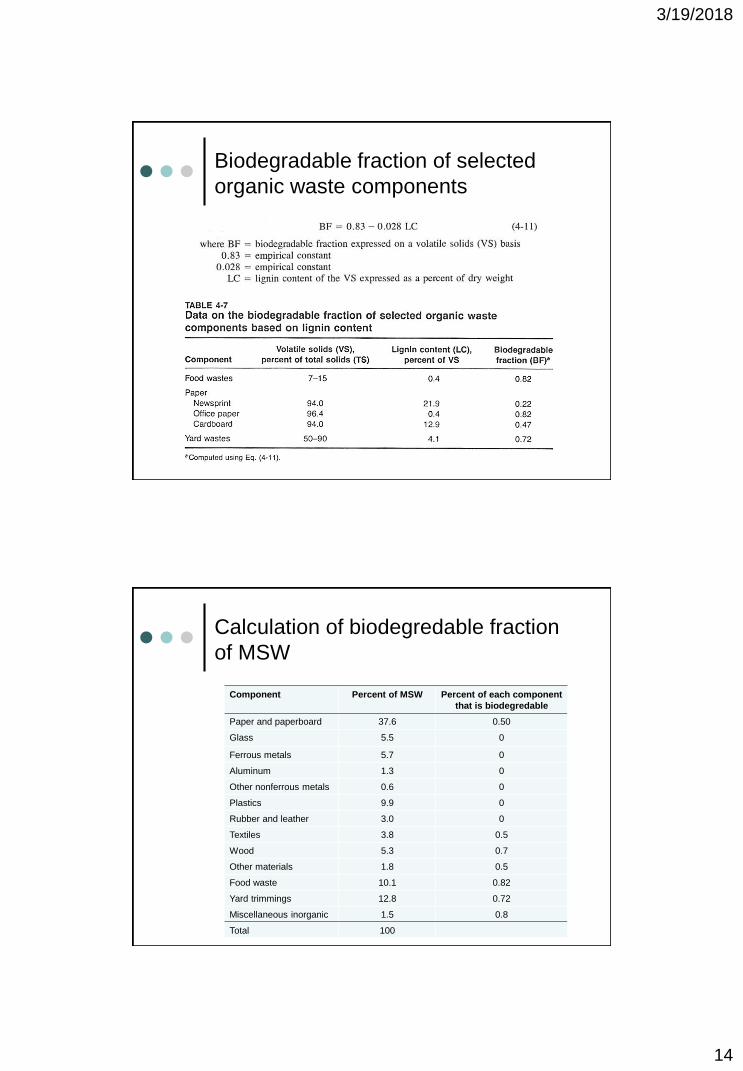
Biodegradable fraction of selected
organic waste components
Calculation of biodegredable fraction
of MSW
Component Percent of MSW Percent of each component
that is biodegredable
Paper and paperboard 37.6 0.50
Glass 5.5 0
Ferrous metals 5.7 0
Aluminum 1.3 0
Other nonferrous metals 0.6 0
Plastics 9.9 0
Rubber and leather 3.0 0
Textiles 3.8 0.5
Wood 5.3 0.7
Other materials 1.8 0.5
Food waste 10.1 0.82
Yard trimmings 12.8 0.72
Miscellaneous inorganic 1.5 0.8
Total 100

3/19/2018
15
Production of odors
Odors are developed when solid wastes are stored
for long periods of time on-site between collections,
in transfer stations, and in landfills.
It is more significant in warm climates.
The formation of odors results from the anaerobic
decomposition of the readily decomposable organic
components found in MSW.
Process Method Principal Conversion Products
Physical
Transformation
• separationmanual and/or
mechanical
individual components found in
comingled MSW
• volume reduction Force or pressure original waste reduced in volume
• size reductionShredding, grinding, or
millingaltered in form and reduced in size
Chemical
Transformation
• combustion thermal oxidation CO2, SO2, oxidation products, ash
• pyrolysis destructive distillation a variety of gases, tar and/or oil
• gasification starved air combustion gases and inerts
Biological
Transformation
• aerobic compostaerobic biological
conversion compost
• anaerobic digestionanaerobic biological
conversion methane, CO2, trace gases, humus
• anaerobic digestion
in landfills
anaerobic biological
conversionmethane, CO2, digested waste
Transformation Processes used for
MSW Management (Textbook, p.91, Table 4-8)

3/19/2018
16
Physical Transformations
The principal physical transformations that may occur in
the operation of solid waste management systems
include:
component separation
mechanical volume reduction
mechanical size reduction
Physical transformations do not involve change in phase
(e.g., solid to gas), unlike chemical and biological
transformation.
Chemical Transformations
Chemical transformations of solid waste typically involve
a change of phase (e.g., solid to liquid, solid to gas, etc.)
To reduce the volume and/or to recover conversion
products, the principal chemical processes used to
transform MSW include:
Combustion (chemical oxidation)
Pyrolysis
Gasification
Thermal
processes

3/19/2018
17
Biological Transformations
The biological transformations of the organic fraction of
MSW may be used;
1) to reduce the volume and weight of the material
2) to produce compost
3) to produce methane
and include:
1) aerobic composting
2) low-solids anaerobic digestion
3) high-solids anaerobic digestion
(anaerobic composting)
Importance of Transformation
Typically waste transformations are used:
to improve the efficiency of solid waste
management systems
to recover reusable and recyclable materials
to recover conversion products and energy

3/19/2018
18
Importance of Transformation
The organic fraction of MSW can be converted to
usable products and ultimately to energy in a
number of ways including:
combustion to produce steam and electricity
pyrolysis to produce a synthetic gas, liquid or solid
fuel, and solids
gasification to produce a synthetic fuel
biological conversion to produce compost
biodigestion to generate methane and to produce a
stabilized organic humus
EXAMPLE 4-1 Estimation of moisture content of typicalresidential MSW.
Estimate the overall moisture content of a sample of as collected residential MSW with the typical composition given in Table 3-4.
Set up the computation table to determine dry weights of the components using the data given in table 4-1.
Determine the moisture content of the MSW sample
100-78,78 = 21.2%100
ComponentPercent by
weightMoisture content,%
Dry weight, kg
OrganicFood wastes 9 70 2,7Paper 34 6 32,0Cardboard 6 5 5,7Plastics 7 2 6,9Textiles 2 10 1,8Rubber 0,5 2 0,5Leather 0,5 10 0,5Yard wastes 18,5 60 7,4Wood 2 20 1,6
InorganicGlass 8 2 7,8Tin cans 6 3 5,8Aluminum 0,5 2 0,5Other metal 3 3 2,9Dirt, ash, etc 3 8 2,8
Total 100 78,8

3/19/2018
19
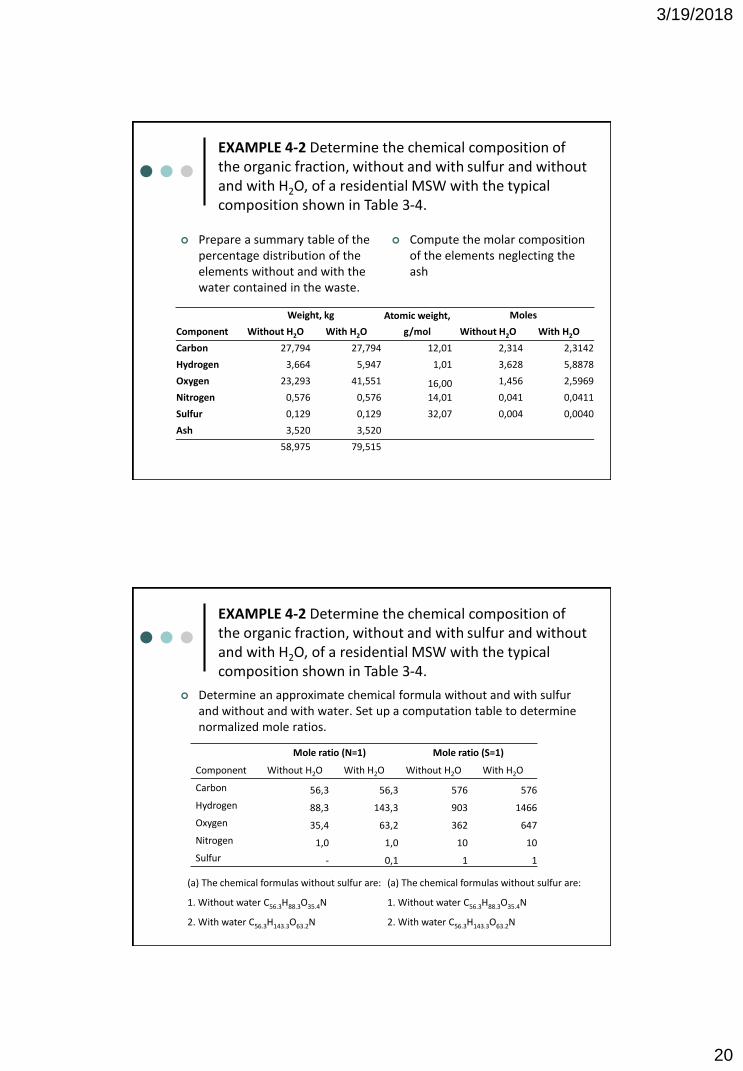
EXAMPLE 4-2 Determine the chemical composition of the organic fraction, without and with S and without and with H2O, of a residential MSW with the typical composition shown in Table 3-4.
Set up a computation table to determine the % distribution of the major elements composing the waste. The necessary computations are presented below:
Table 4-4 Typical data on the ultimate analysis of the combustible components in residential MSW
Percent by weight, kgComponent Carbon Hydrogen Oxygen Nitrogen Sulfur Ash
OrganicsFood wastes 48 6,4 37,6 2,6 0,4 5
Paper 43,5 6 44 0,3 0,2 6Cardboard 44 5,9 44,6 0,3 0,2 5
Plastics 60 7,2 22,8 10Textiles 55 6,6 31,2 4,6 0,15 2,5Rubber 78 10 2 10Leather 60 8 11,6 10 0,4 10
Yard wastes 47,8 6 38 3,4 0,3 4,5Wood 49,5 6 42,7 0,2 1 1,5
EXAMPLE 4-2 Determine the chemical composition of the organic fraction, without and with sulfur and without and with H2O, of a residential MSW with the typical composition shown in Table 3-4.
Water (H2O) = 79,5-59 = 20,5 kg
Wet weight, kg
Moisture content, %
Dry weight, kg
Composition, kgComponent C H O N S AshFood wastes 9 70 2,7 1,296 0,173 1,015 0,070 0,011 0,135Paper 34 6 32,0 13,903 1,918 14,062 0,096 0,064 1,918Cardboard 6 5 5,7 2,508 0,336 2,542 0,017 0,011 0,285Plastics 7 2 6,9 4,116 0,494 1,564 0,000 0,000 0,686Textiles 2 10 1,8 0,990 0,119 0,562 0,083 0,003 0,045Rubber 0,5 2 0,5 0,382 0,049 0,000 0,010 0,000 0,049Leather 0,5 10 0,5 0,270 0,036 0,052 0,045 0,002 0,045Yard wastes 18,5 60 7,4 3,537 0,444 2,812 0,252 0,022 0,333Wood 2 20 1,6 0,792 0,096 0,683 0,003 0,016 0,024
Total 79,5 59,0 27,794 3,664 23,293 0,576 0,129 3,520
3/19/2018
20
EXAMPLE 4-2 Determine the chemical composition of the organic fraction, without and with sulfur and without and with H2O, of a residential MSW with the typical composition shown in Table 3-4.
Prepare a summary table of the percentage distribution of the elements without and with the water contained in the waste.
Weight, kg Atomic weight,
g/mol
Moles
Component Without H2O With H2O Without H2O With H2O
Carbon 27,794 27,794 12,01 2,314 2,3142
Hydrogen 3,664 5,947 1,01 3,628 5,8878
Oxygen 23,293 41,551 16,00 1,456 2,5969
Nitrogen 0,576 0,576 14,01 0,041 0,0411
Sulfur 0,129 0,129 32,07 0,004 0,0040
Ash 3,520 3,520
58,975 79,515
Compute the molar composition of the elements neglecting the ash
EXAMPLE 4-2 Determine the chemical composition of the organic fraction, without and with sulfur and without and with H2O, of a residential MSW with the typical composition shown in Table 3-4.
Determine an approximate chemical formula without and with sulfur and without and with water. Set up a computation table to determine normalized mole ratios.
(a) The chemical formulas without sulfur are:
1. Without water C56.3H88.3O35.4N
2. With water C56.3H143.3O63.2N
(a) The chemical formulas without sulfur are:
1. Without water C56.3H88.3O35.4N
2. With water C56.3H143.3O63.2N
Mole ratio (N=1) Mole ratio (S=1)
Component Without H2O With H2O Without H2O With H2O
Carbon 56,3 56,3 576 576
Hydrogen 88,3 143,3 903 1466
Oxygen 35,4 63,2 362 647
Nitrogen 1,0 1,0 10 10
Sulfur - 0,1 1 1
3/19/2018
21
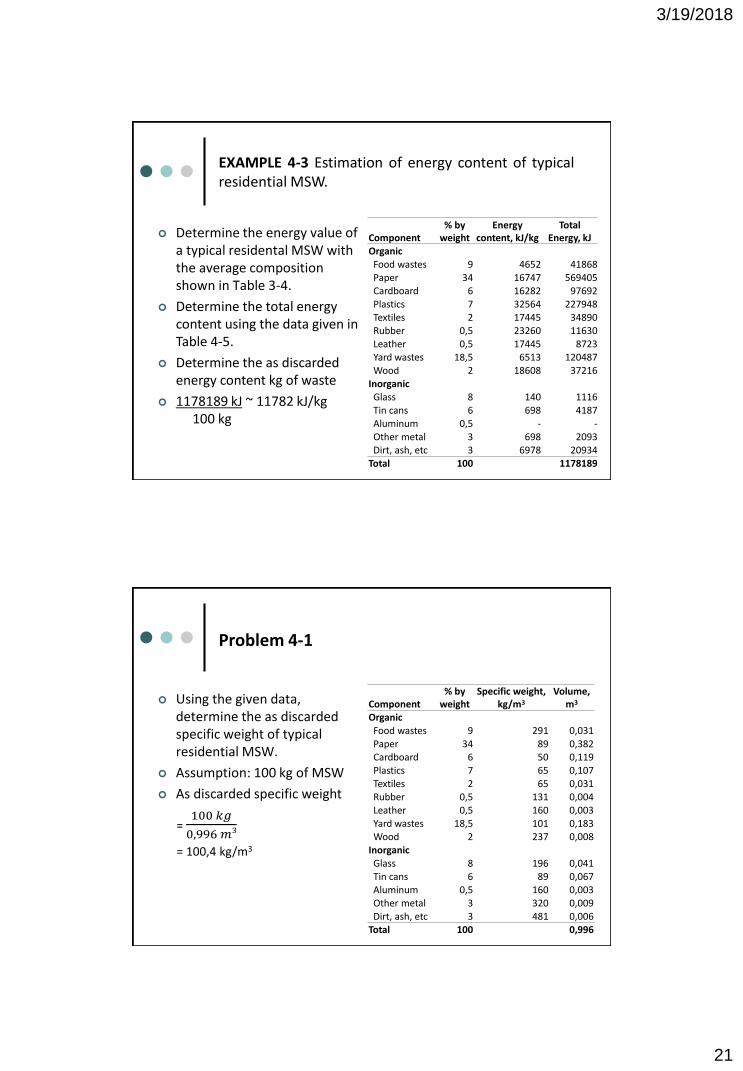
EXAMPLE 4-3 Estimation of energy content of typicalresidential MSW.
Determine the energy value of a typical residental MSW with the average composition shown in Table 3-4.
Determine the total energy content using the data given in Table 4-5.
Determine the as discarded energy content kg of waste
1178189 kJ ~ 11782 kJ/kg100 kg
Component% by
weightEnergy
content, kJ/kgTotal
Energy, kJOrganicFood wastes 9 4652 41868Paper 34 16747 569405Cardboard 6 16282 97692Plastics 7 32564 227948Textiles 2 17445 34890Rubber 0,5 23260 11630Leather 0,5 17445 8723Yard wastes 18,5 6513 120487Wood 2 18608 37216
InorganicGlass 8 140 1116Tin cans 6 698 4187Aluminum 0,5 - -Other metal 3 698 2093Dirt, ash, etc 3 6978 20934
Total 100 1178189
Problem 4-1
Using the given data, determine the as discardedspecific weight of typicalresidential MSW.
Assumption: 100 kg of MSW
As discarded specific weight
= 100 𝑘𝑔
0,996𝑚3
= 100,4 kg/m3
Component% by
weightSpecific weight,
kg/m3
Volume, m3
OrganicFood wastes 9 291 0,031Paper 34 89 0,382Cardboard 6 50 0,119Plastics 7 65 0,107Textiles 2 65 0,031Rubber 0,5 131 0,004Leather 0,5 160 0,003Yard wastes 18,5 101 0,183Wood 2 237 0,008
InorganicGlass 8 196 0,041Tin cans 6 89 0,067Aluminum 0,5 160 0,003Other metal 3 320 0,009Dirt, ash, etc 3 481 0,006
Total 100 0,996