Embed Size (px)
Citation preview

CHAPTER-III

CHAPTER-III
MATERIALS AND METHODS
A) GENERAL GEOGRAPHY AND CLIMATOLOGY:
The Maharashtra state forms a major part of peninsular India with the
Arabian Sea coast of its western side. It lies 1604’ to 22
01’ north and 72
06’ to
8009’ east are North West Gujarat, Madhya Pradesh in North Andhra
Pradesh in the south east and Karnataka and Goa in the South. It has total
area of 3, 07, 762 sq.km (Plate-1).
THE DISTRICT DHULE OF MAHARASHTRA STATE FORMALLY
KNOWN AS WEST KHANDESH:
The climate of the district is generally dry and hot except monsoon
season. The year is broadly divisible into 3 seasons in present investigation.
The characteristics of these weather period during January, 2009 to
December, 2010 were considered in present study. Diurnal changes occurred
frequently in the air temperature during the summer. In monsoon season the
rain was not continuous. The average annual rain fall in the district was 628
mm.
B) STUDY AREAS:
From Dhule district of North Maharashtra SULWADE BARRAGE
was selected for the present investigation (Plate-2).
I) SALIENT FEATURES AND DESCRIPTION OF SULWADE
BARRAGE SALIENT FEATURES:
1) LOCATION:
i) Nala / River : Tapi River
ii) Village & Taluka : Village, Near Sulwade
Taluka, Shinkdkheda.
iii) District : Dhule (Maharashtra)
iv) Co-ordinates
a) Latitude : 210-18’-12”N
b) Longitude : 740-48;-12”E
2) HYDROLOGY:
i) Total catchment area upto dam site. : 52149 sq.Km.
ii) Free catchment area (Below Lower Tapi : 3649.65 sq.Km
Project)
iii) Maximum annual rainfall : 994 mm.
iv) Minimum annual rainfall : 332 mm.
v) Average annual rainfall : 628 mm.
vi) 75% dependable annual rainfall : 507 mm.
vii) Run-off-factor : 0.21
viii) 75% dependable annual yield : 389.85 hm3
xi) Reservation for upstream utilization buy : 276.45 hm3
medium and MI Tanks in the free catchment
x) Net yield available for planning : 113.40 hm3
3) RESERVOIR:
i) Top of bund level : 147.50 m.
ii) H.F.L. (with Afflux) : 145.40 m.
iii) H.F.L. (Normal) : 143.60 m.
iv) F.R.L. : 133.00 m.
v) Crest level : 122.00 m.
vi) Lowest bed level : 121.30 hm3
vii) Gross storage : 65.060 hm3
viii) Live storage : 64.942 hm3
ix) Dead storage : 0.0118 hm3
x) Annual utilization : 84.54 hm3

4) BARRAGE:
i) Type : Barrage with vertical lift gates.
ii) Length : 503 m.
iii) Top width : 13.4 m.
iv) Crest level : 122 m.
v) Type of gates : Vertical lift
vi) No. of gates and size : 27 nos., 1.5 m.x11 m. size
vii) Normal flood lift over FRL : 10.5 m.
viii) Free board : 2.10 (above HFL with afflux)
ix) Design flood (PMF) : 49224 Cumec.
5) SUBMERGENCE:
i) Area under submergence : 1272 ha.
ii) Forest land : NIL.
iii) Private land : 82 ha.
iv) Govt. land (River bed) : 1190 ha.
b) Total population Affected : NIL
c) No. of villages affected : NIL
6) IRRIGATION:
i) Gross command area : 9333 ha.
ii) Culturable Command area : 8400 ha.
iii) Annual Irrigation : 8533 ha.
iv) Cropped area : 8582 ha.
Sulwade Barrage has two main sources for water collection of water
i.e. Nala and river Tapi. During the two year study period, annual total
rainfall in the catchment and submargence area of Sulwade Barrage was
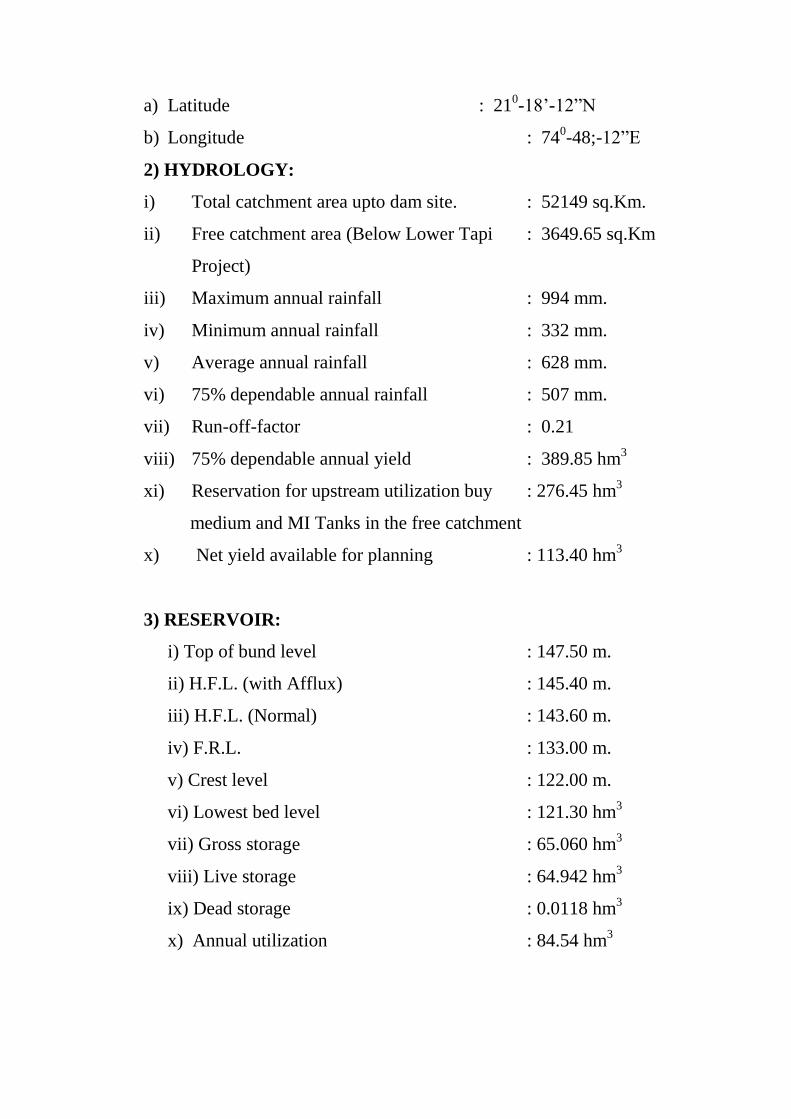
52149 sq.km (Plate-3, 4). The following six stations were selected for the
collection of water and algal samples. These stations are S-I, S-II, S-III, S-

IV, S-V and S-VI (Plates 5, 6, 7, 8, 9, 10) respectively. The water samples
were collected from water surface layer about one feet depth of each side.
C) FILED WORK:
a) Collection of water Samples:
Water samples for analysis of physico-chemical parameters, were
taken from all six stations of Sulwade Barrage from January, 2009 to
December, 2010 (Plate-11). The collection of water sample were collected in
acid wasted plastic cans with liters capacity from all stations of study areas.
For estimation of dissolved oxygen, separate samples were collected
in 250 ml BOD glass bottles and fixed in the field where water temperature
of each site was recorded periodically by using mercury centigrade
thermometer at depth of 4 to 6 cm from the surface layer of water. pH of
water was examined in the filed at the time of collection by using universal
pH paper and also checked by using digital pH meter in laboratory.
b) Collection of algal samples:
Algal samples were collected at monthly intervals during January,
2009 to December, 2010. Algal samples are collected in sunpet Jar about
150 ml capacity, the Jars are leak proof, unbreakable and preserved in 4%
formalin for further taxonomic investigations. The attached epiphytic and
floating forms of algae were collected separately in acid washed collection
bottles.
D) LABORATORY WORK:
I) BIOTOPE:
Physico-chemical analysis of water:
The physico-chemical analysis of water samples from Sulwade
Barrage was carried out by standard methods of APHA (1975) and Trivedy
and Goel (1984). The physico-chemical parameters were studied for water
analysis Viz. pH, Water Temperature, Dissoved Oxygen, Free CO2, Total
alkalinity, Carbonate, Bicarbonate, Sulphate, Phosphate, Nitrate, Hardness,

Chloride, Magnesium, Magnesium Hardness, Calcium, Calcium Hardness,
Total Solids, Total Dissolved Solids and Total Suspended Solids were
recorded from both sites during January, 2009 to December, 2010. The
methods for analysis of physico-chemical parameters are shown in Table-1.
II) BIOCENOSE:
Algal Analysis:
The algal samples of Sulwade Barrage was collected at monthly
intervals. The population of 4 groups of algae was estimated by
Haemocytometer method (Whitton, 1969). For quantitative study of algae.
The density of population of 4 groups of algae viz. Cyanophyceae (Blue-
green algae), Chlorophyceae (Green algae), Bascillariphyceae (Diatoms),
and Euglenineae (Euglenoids) was estimated at every month from January,
2009 to December, 2010. Similarly the percentage of different algal taxa of
Sulwade Barrage was calculated every month during the two years of the
study and it was compared for six stations by choosing monthly means of
cells/ml of both years. The comparison of seasonal percentage of four
groups of algae was made for 2 years.
For qualitative study of algae, algal samples were preserved in 4%
formalin for further study and identification of algae. Line drawings of
different forms of algae were made by camera lucida. The algae were
identified by relevant monographs and recent available literature. (Hustedt,
1930; Pochmann, 1942; Hunber-Pestalozzi, 1955; Pringsheim, 1956,
Desikachary, 1959; Randhwa, 1959; Ramanathan, 1964; Philipose, 1967;
Iyengar and Desikachary, 1981; Gonzalves, 1981; Sarode and Kamat. 1984).
III) POLLUTION INDEX:
The pollution tolerant genera and most pollution tolerant species of
algae were recorded for each station of Sulwade Barrage.


Algal pollution indices of Palmer (1969) based on genus and
species were used in rating samples for high organic pollution.
A list of all significantly occurring algae in the samples was made
for all stations of Barrage.
Twenty most frequent genera were taken into account. A pollution
index factor was assigned to each genus by determining the relative
number of total points scored by each alga. For rating of water samples as
high or low organically polluted, observations were made according to
palmer (1969).
The following numerical values for the individual zones have been
followed:
(i) 0 - 10 - Suggests lack of organic pollution.
(ii) 10 - 15 - indicate moderate pollution.
(iii) 15 - 20 - indicate probable high –organic pollution.
(iv) 20 or more - confirmed high organic pollution.
(v) 44 - Theoretical maximum (probably not
Attainable except under the most
stringent artificial conditions)
The lower figures below 15 indicate that –
(i) Organic pollution in not high.
(ii) Sample is not representative or
(iii) Some substance of factor interfering with algal persistence is
present and active.
The pollution index was calculated for all station of the barrage.
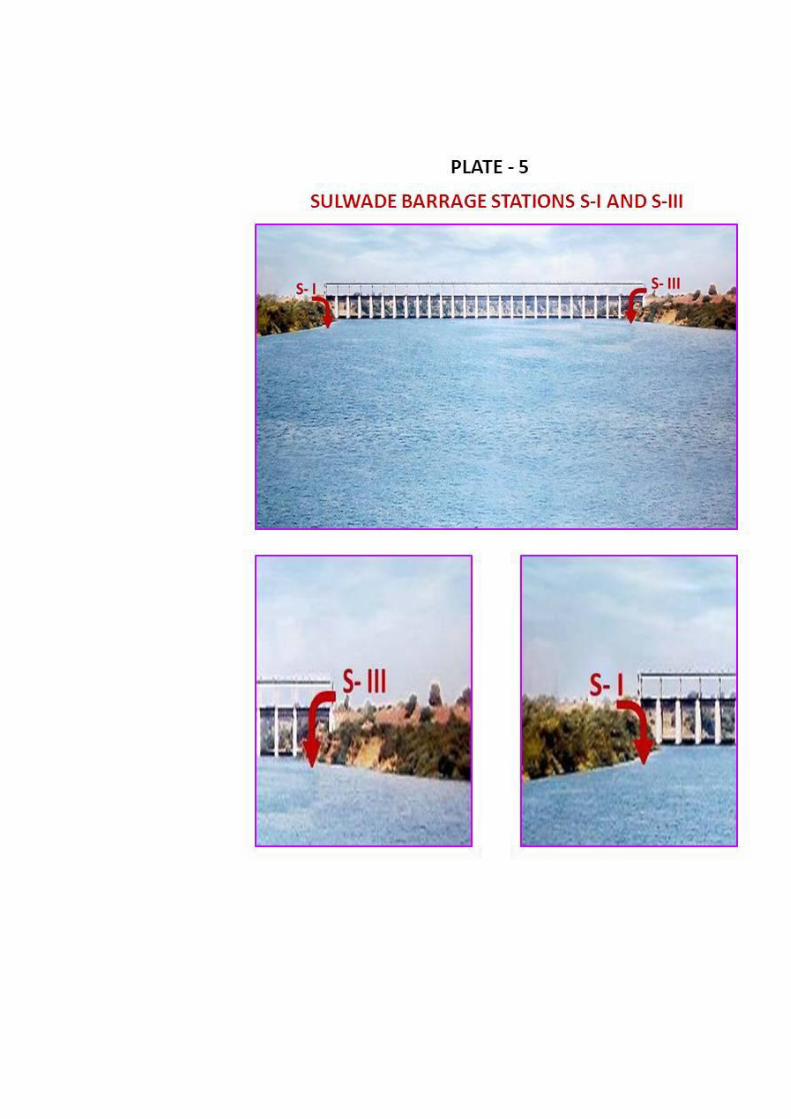
IV) TROPHIC STATE INDICES:
Nygaard’s (1949) tropic indices are used to determine trophic state
of 5 stations of Barrage and one station of river. These indices are helpful
for determining the nature of water. The values of index for different
categories of algae for oligotrophic and eutrophic conditions were
followed according to Nygaard’s (1949).
Nygaard’s trophic state indices are as follows:
________________________________________________________
Sr.No. Index Calculation Oligotrophic
Eutrophic
___________________________________________________________
1 Myxophycean Myxophycean 0.0 – 0.4 0.1 – 3.0
_________________
(BGA) Desmideae
2 Chlorophycean Chlorophycean 0.0 – 0.7 0.2 – 9.0
_________________
(Green algae) Desmideae
3 Diatom Centric Diatoms 0.0 – 0.3 0.0– 1.75
_________________
(Green algae) Pinnate diatoms
4 Euglenophyte Euglenophyta 0.0 – 0.2 0.0 – 1.0
_________________
Myxophyceae
5 Compound Myxophyceae 0.0-1.0 1.2 – 2.5
+ Chlorococcales
+ Centric diatoms
+ Euglenophyta
_________________
Desmideae
___________________________________________________________
For determining the indices, the number of genera in each group of
algae was determined up to species level for each sampling station of
barrage. The ratios of these groups were calculated and are used as
biological index of water quality. From these values the degree of

eutrophication is determined for each station of barrage and one stations
of river.
V) SAPROBITY INDEX:
The saprobity indices for 6 stations of Sulwade Barrage were
calculated according to Pantle and Buck (1955).
s.h
M = { S } = --------------------
h
Where, S – is the mean saprobity index.
s - is the degree of saprobity.
h – is the frequency with which single species occurs.
For the calculation, the following numerical degree are used.
(i) Oligo – saprobic indicator organism ………………. S =1.
(ii) β – Mesosaprobic indicator organism ………………. S =2.
(iii) α – Mesosaprobic indicator organism ………………. S =3.
(iv) Poly – Mesosaprobic indicator organism ………………. S =4.
(1) Species found by chance ………………. h =1.
(2) Species found frequently ………………. h =3.
(3) Species occurring in abundance ………………. h =5.
The following numerical values for the individual zones have been
followed:
(i) 1.0 – 1.5 denotes oligo (0) saprobic zone.
(ii) 1.5 – 2.5 denotes β – Mesosaprobic zone.
(iii) 2.5 – 3.5 denotes α – Mesosaprobic zone.
(iv) 3.5 – 4.0 denotes poly saprobic zone.

The various saprobitic organisms included in saprobitic levels of
Kolkwitz and Marsson (1908) are listed from 6 stations of Sulwade
Barrage of present investigation.
VI) GENERAL STATISTICAL ANALYSIS:
A multi-factoral correlation analysis of the data was made to study
the interrelationships of various parameters of 6 station of Sulwade
Barrage.
The coefficients of correlation of general statistics calculatd and
the significance of the difference between the mean was tested by‘t’ test
of 50% level of significance with 48 degree of freedom for 19 parameters
during January, 2009 to December, 2010 following Rao et.al. (1975).
To show the interrelationship among the parameters, correlation
matrix of each parameter was compared to every parameter at each
station of Sulwade Barrage of present investigation.
∑ (X- X) (Y – Y)
r =
∑ [ X - X2) ∑ (Y- Y)
2 ]
r = Correlation coefficient.
x = Deviations of x Variable.
y = Deviations of y variable.
VII) TAXONOMICAL STUDY:
For taxonomical study of algae, identification of various algal
forms of 6 station of Sulwade Barrage was made with the help of
standard monograph and literature.
(Hustedt, 1930; Pochmann, 1942; Hubner- Pestalozzi, 1955; Pringsheim,
1956; Desikachary, 1959; Randhawa, 1959; Ramanathan, 1964;

Philipose, 1967; Iyenger and Desikachary, 1981; Gonzalves, 1981;
Sarode and Kamat, 1984).
Certain forms were identified with the help of experts. Systematic
accounts of all algal taxa were made for 4 groups of algae.
Viz. (i) Cyanophyceae.
(ii) Chlorophyceae.
(iii) Bascillariophyceae.
(iv) Euglenineae.
Line drawings were made with the help of Camera Lucida.
Microphotography of algal taxa are also taken simultaneously while
standing Camera Lucida.


![CHAPTER III - shodhganga.inflibnet.ac.inshodhganga.inflibnet.ac.in/bitstream/10603/17464/8/08_chapter 3.pdf · that returns a value.[ 137] A time-dependem media object is presented](https://img.pdfslide.net/doc/110x75/606bc77b005f95280d2e40bc/chapter-iii-3pdf-that-returns-a-value-137-a-time-dependem-media-object-is.jpg)