Embed Size (px)
Citation preview
7/23/2019 CHAPTER III.doc
http://slidepdf.com/reader/full/chapter-iiidoc 1/22
CHAPTER III
RESEARCH METHODOLOGY
This chapter presents the research methodology used in this study. The
research methodology consists of place and time of research, approach and types
of research, the source of data, method of collecting data, procedure of the
research, and technique of analyzing data. The complete information about
research methodology use by researcher in this research will be presented as
follows:
A. Place and Time of Research
1. Place of Research
This research takes place at SMP ! Madiun that is located on
"bdurrahman Saleh #rd street, Madiun $ity. The reason for selecting this
school as the place of research is that there ha%e not been any researches
at this school yet, particularly concerning with the application of films or
songs as learning media in teaching writing.
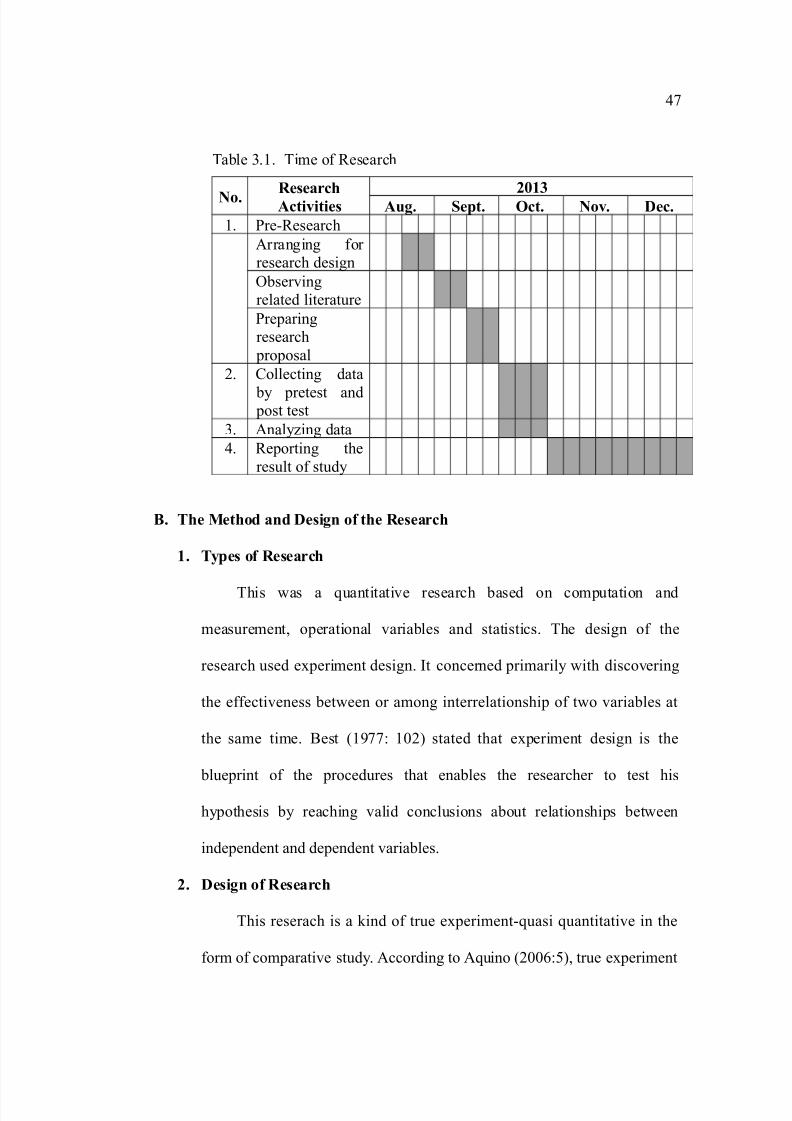
. Time of Research
This study has been conducted for & months' from "ugust to
(ecember )*+# The research acti%ities that the researcher does during
the time are presented as follows:
!
7/23/2019 CHAPTER III.doc
http://slidepdf.com/reader/full/chapter-iiidoc 2/22
Table #.+. Time of -esearch
!o. ResearchAc"i#i"ies
$1%
A&'. Se(". Oc". !o#. Dec.
+. Pre-esearch
"rranging for
research design
/bser%ing
related literature
Preparing
research
proposal
). $ollecting data
by pretest and post test
#. "nalyzing data
!. -eporting the
result of study
). The Me"hod and Desi'n of "he Research
1. T*(es of Research
This was a quantitati%e research based on computation and
measurement, operational %ariables and statistics. The design of the
research used e0periment design. 1t concerned primarily with disco%ering
the effecti%eness between or among interrelationship of two %ariables at
the same time. 2est 3+455: +*)6 stated that e0periment design is the
blueprint of the procedures that enables the researcher to test his
hypothesis by reaching %alid conclusions about relationships between
independent and dependent %ariables.
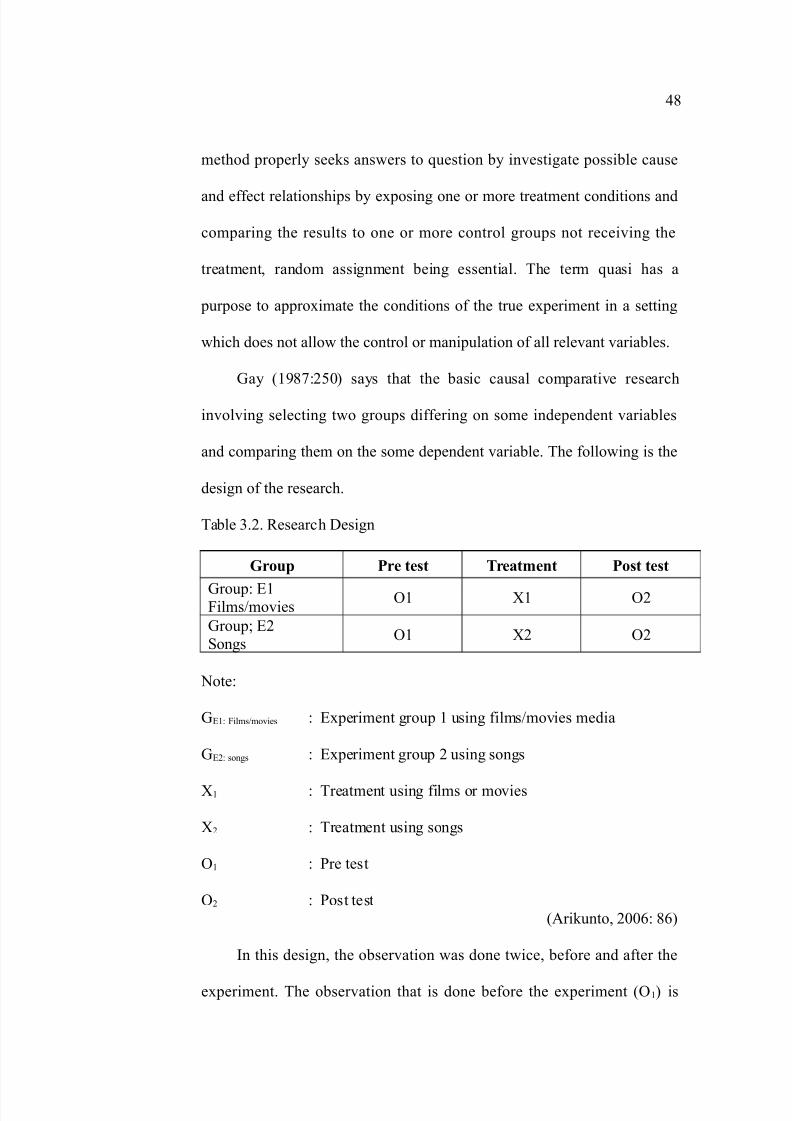
. Desi'n of Research
This reserach is a kind of true e0perimentquasi quantitati%e in the
form of comparati%e study. "ccording to "quino 3)**:&6, true e0periment
!5
7/23/2019 CHAPTER III.doc
http://slidepdf.com/reader/full/chapter-iiidoc 3/22
method properly seeks answers to question by in%estigate possible cause
and effect relationships by e0posing one or more treatment conditions and
comparing the results to one or more control groups not recei%ing the
treatment, random assignment being essential. The term quasi has a
purpose to appro0imate the conditions of the true e0periment in a setting
which does not allow the control or manipulation of all rele%ant %ariables.
7ay 3+485:)&*6 says that the basic causal comparati%e research
in%ol%ing selecting two groups differing on some independent %ariables
and comparing them on the some dependent %ariable. The following is the
design of the research.
Table #.). -esearch (esign
Gro&( Pre "es" Trea"men" Pos" "es"
7roup: 9+ilms;mo%ies
/+ <+ /)
7roup' 9)
Songs/+ <) /)
ote:
79+: ilms;mo%ies : 90periment group + using films;mo%ies media
79): songs : 90periment group ) using songs
<+ : Treatment using films or mo%ies
<) : Treatment using songs
/+ : Pre test
/) : Post test
3"rikunto, )**: 86
1n this design, the obser%ation was done twice, before and after the
e0periment. The obser%ation that is done before the e0periment 3/+6 is
!8
7/23/2019 CHAPTER III.doc
http://slidepdf.com/reader/full/chapter-iiidoc 4/22
called pre test, and the obser%ation that is done after the e0periment 3/ )6 is
called posttest. The difference between /+ and /) is assumed as the effect
of the treatment;e0periment.
C. Po(&la"ion+ Sam(le+ and Sam(lin'
1. Po(&la"ion
=" population is a set 3or collection6 of all elements processing one
or more attributes of interest> 3"rikunto, )**: +#*6. ?owe%er,
=Population is number of indi%idual or thing that will make an ob@ect
ofresearch> 3?adi, +44&:5)6. rom the statement abo%e, the researcher
conclude that the population is a number of people that ha%e similar
characteristics and become the ob@ect of the research. The population of
this research was the eighth grade of SMP ! Madiun in the academic
year of )*+#;)*+!.
There are se%en classes, namely A111", A1112, A111$, A111(,
A1119, A111, A1117, A111?, and A1111. The total number of the
students is #*8 students. "ll of them were gi%en 9nglish materials in
teaching and learning process. Moreo%er, they were chosen as the
population of the research based on some reasons, those are:
a. The students were all in the same grade.
b. The students were relati%ely in the same age.
c. The students had been studying 9nglish for the same period.
. Sam(le
!4
7/23/2019 CHAPTER III.doc
http://slidepdf.com/reader/full/chapter-iiidoc 5/22
"ccording to "rikunto 3)*+*: +#*6, =Sample is a part that can
represent all the population obser%ed. 1t is called sample research when
people want to generalize the sample research result>. 1n this research, not
all data and information will be processed and not all people but simply
studied using a representati%e sample. 1n this study, the writer took class
A111 " B A111 7 as the sample.
c. Sam(lin'
1n this research, it is more con%enient to study sub@ect in naturally
occurring groups or clusters. To gain the sample for this research, the
researcher use a cluster random sampling. This means that the researcher
pick up the sample from the a%ailable population by random. "ccording to
Setyosari 3)*+*: +4++4)6,
teknik kelompok atau rumpun (cluster) digunakan apabila populasi
atau sampel yang tersedia adalah berupa unit-unir rumpun dalam
populasi ……Penelitian eksperimental tentang pengaruh metode
mengajar biasanya menggunakan kelas-kelas atau kelompok-
kelompok, dan tidak mungkin mengambil secara acak setiap
individual anak dari setiap kelas. Sampel sering diambil dari
kelompok-kelompok yang telah ditentukan atau tersedia.
1t means that cluster technique use if population or sample is in
cluster units. 90perimental research is impossible to pick up the indi%idual
from class by random. Sample usually pick from groups.
"ccording to this theory, in this study the researcher use cluster
random sampling. 2y random, the researcher decide the sample by lottery.
The first lottery was to determine the e0perimental group. rom se%en
class, the class is selected as e0perimental group is A111 " which consists
&*
7/23/2019 CHAPTER III.doc
http://slidepdf.com/reader/full/chapter-iiidoc 6/22
of ## students. 90perimental group is taught using mo%ies. Chile class is
selected as control group is A111 7 which consists of #+ students. $ontrol
group is taught using songs.
D. The Techni,&e of Collec"in' "he Da"a
There are some methods of collecting data which can be used for
collecting the data in a research. The researcher uses some techniques as
follows:
1. O-ser#a"ion
/bser%ation has purpose to get the information from the ob@ect of
obser%ation. "ccording to Murray 3)**#:*6 >/bser%ation is gathering
information in%ol%es watching and listening to e%ents then recording what
occurred>. 1t means that obser%ation is the way to research directly by
watching and listening the ob@ect the record what happened in the e%ents.
1n this research, the researcher uses the direct obser%ation so the researcher
in%ol%ed directly in teaching process. 1t is used to find the teaching writing
conditions in eighth grades of SMP ! Madiun in the academic year of
)*+#;)*+! as pre-research.
. Doc&men"a"ion
This research also uses documentation to collect the data. Dincoln
and 7uba 3in 7all et al. )**5: +6 stated, =(ocumentation is as written
communication that are prepared for personal rather than official reasons>.
Chile, 7rabe and Stoller 3)**): +6 say =(ocument gathering is
collection of sets of documents 3interpreted broadly6 that are rele%ant to
&+
7/23/2019 CHAPTER III.doc
http://slidepdf.com/reader/full/chapter-iiidoc 7/22
the research question 3e.g. inclass e0am' lesson plans' preand posttest,
software, students e0ercises, worksheets, writing assignment or pro@ects,
student record' te0tbooks6>.
2ased on the statement abo%e, it can be said that documentation in
collecting data means collecting all written documents which are rele%ant
to the research question. rom the documentation technique, the researcher
gets some data of the studentsE writing achie%ement and any document
used in teaching writing process in SMP ! Madiun. The data from the
documentation technique are then interpreted and e%aluated as the
information to support this research.
%. Tes" Me"hod
The research instrument is a tool used for capturing data in the study.
1n this study, the research instrument used is a test technique. 2rown
3+44!: )&!6 defines a test as a method of measuring a personEs ability or
knowledge in a gi%en area. " test is used to collect the data of studentsE
writing skill.
E. Proced&re and Me"hod of Da"a Collec"ion
There were some steps in gathering the data in this study, they are
scoring technique, try out, pretest, and posttest.
1. Scorin' Techni,&e
&)
7/23/2019 CHAPTER III.doc
http://slidepdf.com/reader/full/chapter-iiidoc 8/22
?eaton 3+45!:+#&6 points out =three types of method in grading
writing score' they are: the impression methods, analytic method and the
mechanical accuracy.>
1n facilitating to analyze the studentsE test result in writing report of
the two groups of this study, the writer attempted to apply analytic method
which =consists of an attempt to separate the %arious features of a
composition for scoring purposes> 3?eaton, +45!:+#6. The writer only
limited to the items as follows:
a. 7rammar refers to appropriate tenses'
b. Aocabulary refers to diction'
c. Mechanics refers to punctuation and spelling'
d. luency refers to style and ease of communication' and
e. -ele%ance refers to the content in relation to the task demanded of the
students 3?eaton, +45!:+#56
"ccording to ?eaton 3+45!:+#6, analytical method is =ideally suited
to the classroom situation: because certain features ha%e been graded
separately, each student is able to see how his particular grade has been
obtained.> ?ere, underlying such reason, the writer attempted to use
?eatonEs 7rid and $ategories as the scoring system of this study.
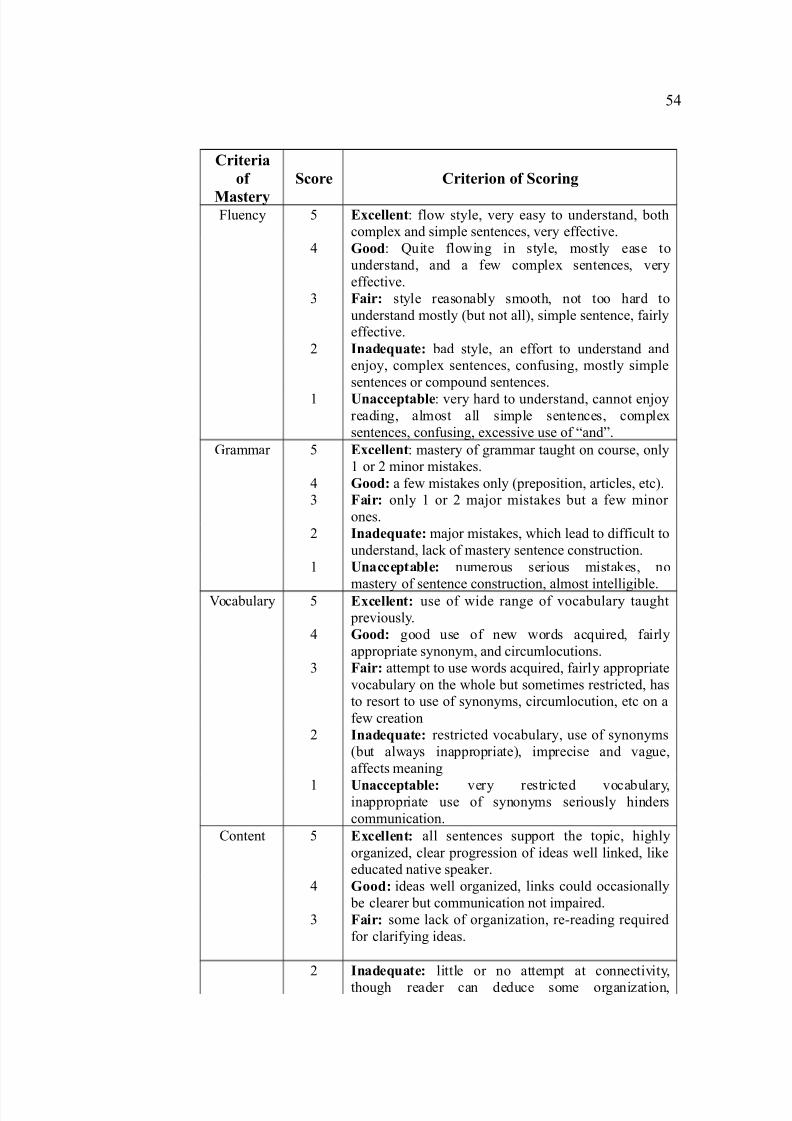
Table #.#. Scoring 7uidance Taken from ?eatonEs 7rid and $ategories
&#
7/23/2019 CHAPTER III.doc
http://slidepdf.com/reader/full/chapter-iiidoc 9/22
Cri"eria
of
Mas"er*
Score Cri"erion of Scorin'
luency & Ecellen": flow style, %ery easy to understand, both
comple0 and simple sentences, %ery effecti%e.
! Good: Fuite flowing in style, mostly ease to
understand, and a few comple0 sentences, %ery
effecti%e.
# /air0 style reasonably smooth, not too hard to
understand mostly 3but not all6, simple sentence, fairly
effecti%e.
) Inade,&a"e0 bad style, an effort to understand and
en@oy, comple0 sentences, confusing, mostly simple
sentences or compound sentences.
+ nacce("a-le: %ery hard to understand, cannot en@oy
reading, almost all simple sentences, comple0
sentences, confusing, e0cessi%e use of =and>.
7rammar & Ecellen": mastery of grammar taught on course, only
+
or ) minor mistakes.
! Good0 a few mistakes only 3preposition, articles, etc6.
# /air0 only + or ) ma@or mistakes but a few minor
ones.
) Inade,&a"e0 ma@or mistakes, which lead to difficult to
understand, lack of mastery sentence construction.
+ nacce("a-le0 numerous serious mistakes, no
mastery
of sentence construction, almost intelligible.Aocabulary & Ecellen"0 use of wide range of %ocabulary taught
pre%iously.
! Good0 good use of new words acquired, fairly
appropriate synonym, and circumlocutions.
# /air0 attempt to use words acquired, fairly appropriate
%ocabulary on the whole but sometimes restricted, has
to resort to use of synonyms, circumlocution, etc on a
few creation
) Inade,&a"e0 restricted %ocabulary, use of synonyms
3but always inappropriate6, imprecise and %ague,
affects meaning
+ nacce("a-le0 %ery restricted %ocabulary,inappropriate use of synonyms seriously hinders
communication.
$ontent & Ecellen"0 all sentences support the topic, highly
organized, clear progression of ideas well linked, like
educated nati%e speaker.
! Good0 ideas well organized, links could occasionally
be clearer but communication not impaired.
# /air0 some lack of organization, rereading required
for clarifying ideas.
) Inade,&a"e0 little or no attempt at connecti%ity,
though
reader can deduce some organization,
&!

7/23/2019 CHAPTER III.doc
http://slidepdf.com/reader/full/chapter-iiidoc 10/22
Cri"eria
of
Mas"er*
Score Cri"erion of Scorin'
indi%idual ideas, may be clearer but %ery difficult to
deduce
+ nacce("a-le0 lack of organization to ser%e that
communication is seriously imparted.
Spelling & Ecellen"0 no error.
! Good0 + or ) minor errors only.
# /air0 se%eral errors, not too hard to understand.
) Inade,&a"e0 se%eral errors, some interfere with
communication, some words %ery hard to recognize.
+ nacce("a-le0 numerous errors, hard to recognize,
se%eral words communication made %ery difficult.
2ased on the scoring guidance abo%e, the ma0imum score is )& for
there are fi%e aspects and each is scored fi%e. The scoring was based on the
analytical method. To get the score of each student, the scoring considered
the fi%e components abo%e. 9ach student should be able to write +*+&
sentences related to the topic and construct them into a report te0t and the
studentsE score were multiplied by !, so the ma0imum score was +**.
1n classifying the score, the writer used the measurement of studentsE
achie%ement suggested by ?arris 3+44:+#!6 that is placing the score into
some categories as follows:
Table #.!. Scoring 7uidance by ?arris
Grade Cri"eria of Mas"er* Le#el
" 4+ B +** 90cellent
2 8+ B 4* Aery good
$ 5+ B 8* 7ood
( + B 5* air
9 &+ B * Poor
Dess than &* Aery poor
. Tr* O&"
&&
7/23/2019 CHAPTER III.doc
http://slidepdf.com/reader/full/chapter-iiidoc 11/22
The instrument to collect the data will clearly affect to the quality of
the data obtained. " good instrument is to fulfill two important
qualifications, they are %alid and reliable. Therefore, to measure the
%alidity and reliability of the instrument it should be tried out first to the
students in another class. Try out is also important since =try out is a kind
of pretesting, which pro%ides opportunities for the testmaker to try out
the test directions and to check the estimated time required to work the
items of the test. 1f the directions are not clear to the sub@ects, this should
certainly be noted at the time of pretesting, so that the instructions can be
clarified in the final form> 3?arris, +44:+*!6. Thus, through try out, it
could be identified whether the test instrument is %alid and reliable or not.
This try out was also to identify the appropriateness of the scoring system
applied on the instrument.
%. Pre2Tes"
Pretest was gi%en before doing the e0periment in starting the data
collection to identify the writing report achie%ement. The test was in the
form of writing test. "fter ha%ing been e0plained about what they were
going to do, the students were gi%en the instrument. They were to write the
te0t in !* minutes.
3. Pos"2Tes"
Posttest was gi%en after conducting all the acti%ities during
treatment. 1t was to measure the studentsE achie%ement in writing report
after the treatment. The test was also as the same as the pretest, i.e.
&
7/23/2019 CHAPTER III.doc
http://slidepdf.com/reader/full/chapter-iiidoc 12/22
writing report te0t with the same. The e0perimental group was shown a
mo%ie before starting to do their post test. The control group, on the other
hand, was not gi%en the similar method with the e0perimental one. The
students of the control group were songs to help them in doing posttest.
/. Research Ins"r&men"
1nstrument is important thing in an e0periment since it will affect on the
data obtained. "s Gerlinger 3+4&: ++86 states =an instrument plays an
important role in a study in the sense that the reliability of data obtained.>
"rikunto 3)*+*: )*#6 also defines that research instrument is = Alat atau
asilitas yang digunakan oleh peneliti dalam pengumpulan data agar
pekerjaannya lebih mudah dan hasilnya lebih baik, dalam arti lebih cermat,
lengkap, dan sistematis sehingga lebih mudah diolah. 3a de%ice used by the
researcher while collecting data to make his work easier and get a better,
complete and systematic result in order to make the data easy to be processed6.
1t is important to use instrument in doing e0periment. 1n this study, the
test was used as the instrument to obtain the data that is the studentsE ability in
writing. Test can be defined as =a set of techniques, procedures, or items of
measuring a person ability, knowledge, or performance in a gi%en domain>
32rown, )**!:#6.
The writer carried out the writing test in this research since the aim of
this study is to in%estigate the studentsE achie%ement in writing after ha%ing
been gi%en the treatment. The writer particularly chose writing composition
test to be implemented on this study. =The writing of a composition is a task
&5

7/23/2019 CHAPTER III.doc
http://slidepdf.com/reader/full/chapter-iiidoc 13/22
which in%ol%es the students in manipulating words in grammatically correct
sentences and in linking those sentences to form a piece of continuous writing
which successfully communicate the writerEs thoughts and ideas on a certain
topics> 3?eaton, +45!:+)56. ?a%ing gathered the data, then the studentsE result
was scored based on a scoring guidance.
?arris 3+44: +#6 states that all good tests possessed three qualities, i.e.
%alidity, reliability, and practicality. The test that the researcher use has to be
appropriate in terms of four ob@ecti%es, dependable in the e%idence it pro%ides,
and applicable to our particular situation. Those characteristics of a good test
will be e0plained further below.
1. 4alidi"* of "he Tes"
"ccording to ?arris 3+44: +4)+6 states that %alidity is distinguished
into three kinds. They are content %alidity, empirical %alidity, and face
%alidity. 1n this study, the writer concerns to content %alidity because
content %alidity is particularly important to achie%ement test. 1n content
%alidity, a %alid instrument is an instrument which has high %alidity. /n
the contrary, an in%alid instrument is an instrument which has low %alidity.
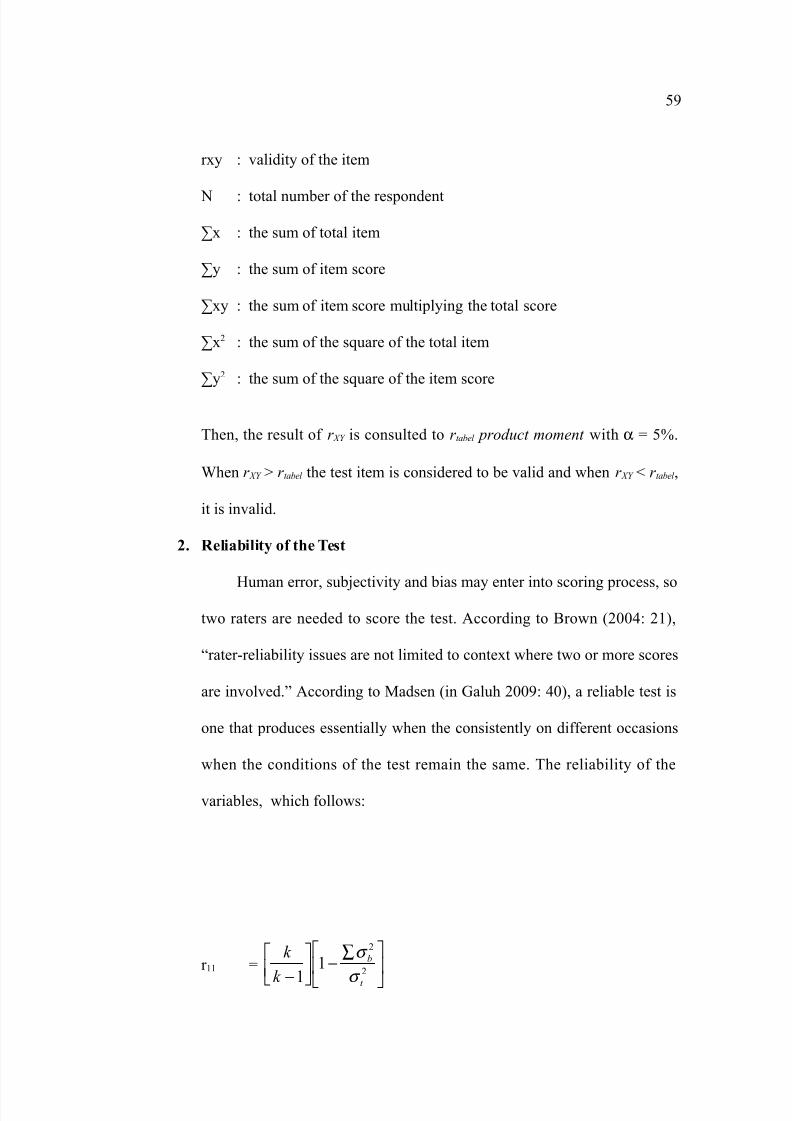
The formula used in measuring the %alidity of an instrument
according to "rikunto 3)**5: 46 is by using Product Moment ormula
below:
( )( )
( ){ } ( ){ }∑ ∑∑∑∑∑ ∑
−
−=
)))) y y ! " " !
y " "y ! r "y
Chere:
&8
7/23/2019 CHAPTER III.doc
http://slidepdf.com/reader/full/chapter-iiidoc 14/22
r0y : %alidity of the item
: total number of the respondent
H0 : the sum of total item
Hy : the sum of item score
H0y : the sum of item score multiplying the total score
H0) : the sum of the square of the total item
Hy) : the sum of the square of the item score
Then, the result of r #$ is consulted to r tabel product moment with α I &J.
Chen r #$ K r tabel the test item is considered to be %alid and when r #$ L r tabel ,
it is in%alid.
. Relia-ili"* of "he Tes"
?uman error, sub@ecti%ity and bias may enter into scoring process, so
two raters are needed to score the test. "ccording to 2rown 3)**!: )+6,
=raterreliability issues are not limited to conte0t where two or more scores
are in%ol%ed.> "ccording to Madsen 3in 7aluh )**4: !*6, a reliable test is
one that produces essentially when the consistently on different occasions
when the conditions of the test remain the same. The reliability of the
%ariables, which follows:
r ++ I
∑−
−
)
)
+
+ t
b
k
k
σ
σ
&4
7/23/2019 CHAPTER III.doc
http://slidepdf.com/reader/full/chapter-iiidoc 15/22
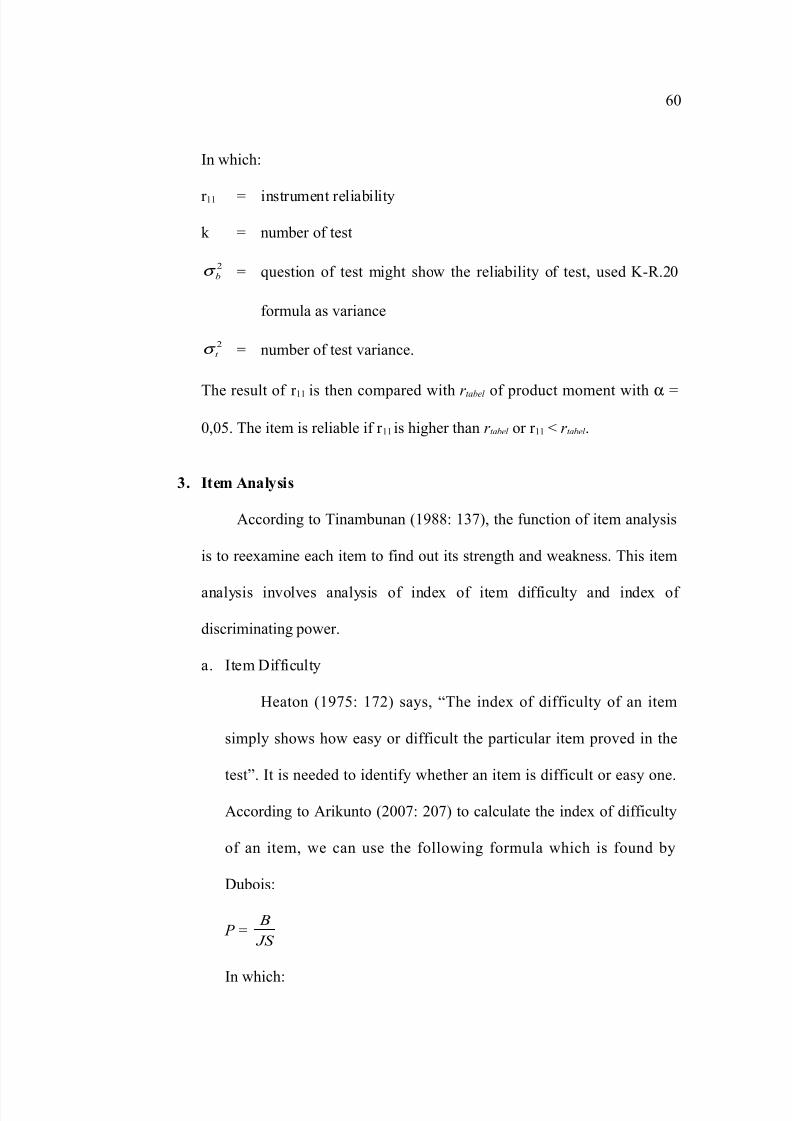
1n which:
r ++ I instrument reliability
k I number of test
)
bσ I question of test might show the reliability of test, used G-.)*
formula as %ariance
)
t σ I number of test %ariance.
The result of r ++ is then compared with r tabel of product moment with α I
*,*&. The item is reliable if r ++ is higher than r tabel or r ++ L r tabel .
%. I"em Anal*sis
"ccording to Tinambunan 3+488: +#56, the function of item analysis
is to ree0amine each item to find out its strength and weakness. This item
analysis in%ol%es analysis of inde0 of item difficulty and inde0 of
discriminating power.
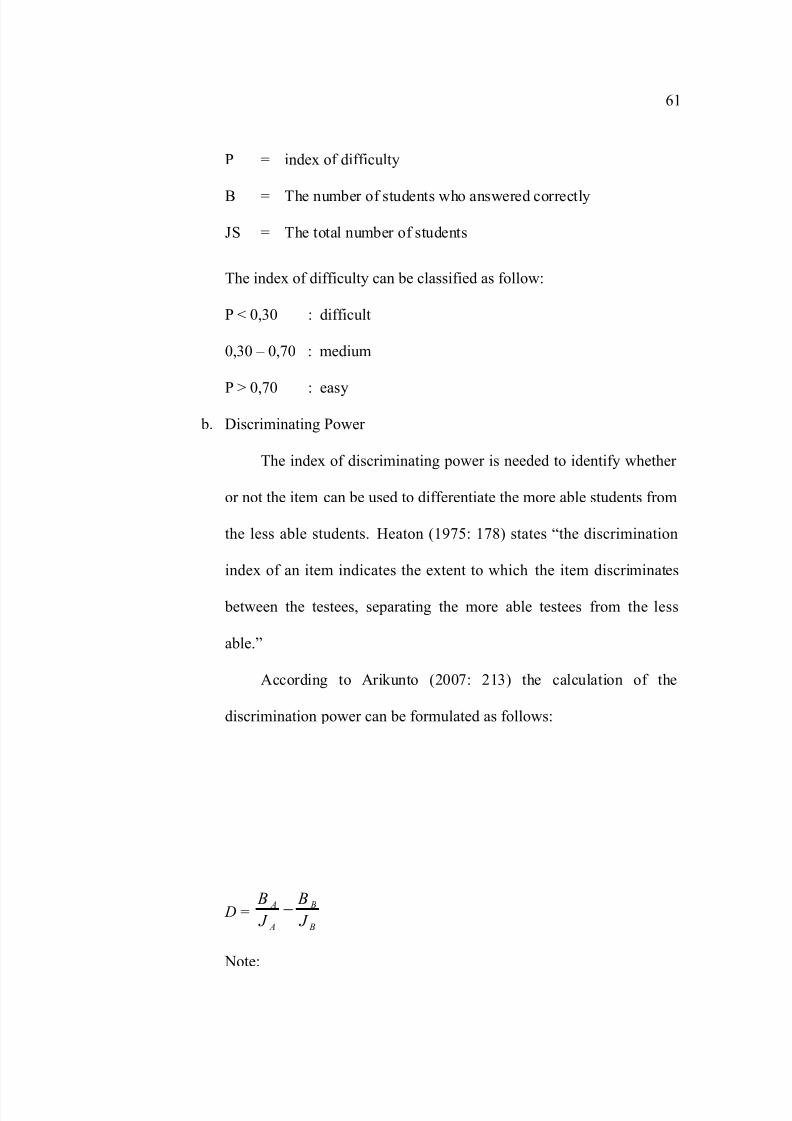
a. 1tem (ifficulty
?eaton 3+45&: +5)6 says, =The inde0 of difficulty of an item
simply shows how easy or difficult the particular item pro%ed in the
test>. 1t is needed to identify whether an item is difficult or easy one.
"ccording to "rikunto 3)**5: )*56 to calculate the inde0 of difficulty
of an item, we can use the following formula which is found by
(ubois:
P I %S
&
1n which:
*
7/23/2019 CHAPTER III.doc
http://slidepdf.com/reader/full/chapter-iiidoc 16/22
P I inde0 of difficulty
2 I The number of students who answered correctly
S I The total number of students
The inde0 of difficulty can be classified as follow:
P L *,#* : difficult
*,#* B *,5* : medium
P K *,5* : easy
b. (iscriminating Power
The inde0 of discriminating power is needed to identify whether
or not the item
can be used to differentiate the more able students from
the less able students.
?eaton 3+45&: +586 states =the discrimination
inde0 of an item indicates the e0tent to which
the item discriminates
between the testees, separating the more able testees from
the less
able.>
"ccording to "rikunto 3)**5: )+#6 the calculation of the
discrimination
power can be formulated as follows:
' I &
&
A
A
%
&
%
&−
ote:
+
7/23/2019 CHAPTER III.doc
http://slidepdf.com/reader/full/chapter-iiidoc 17/22
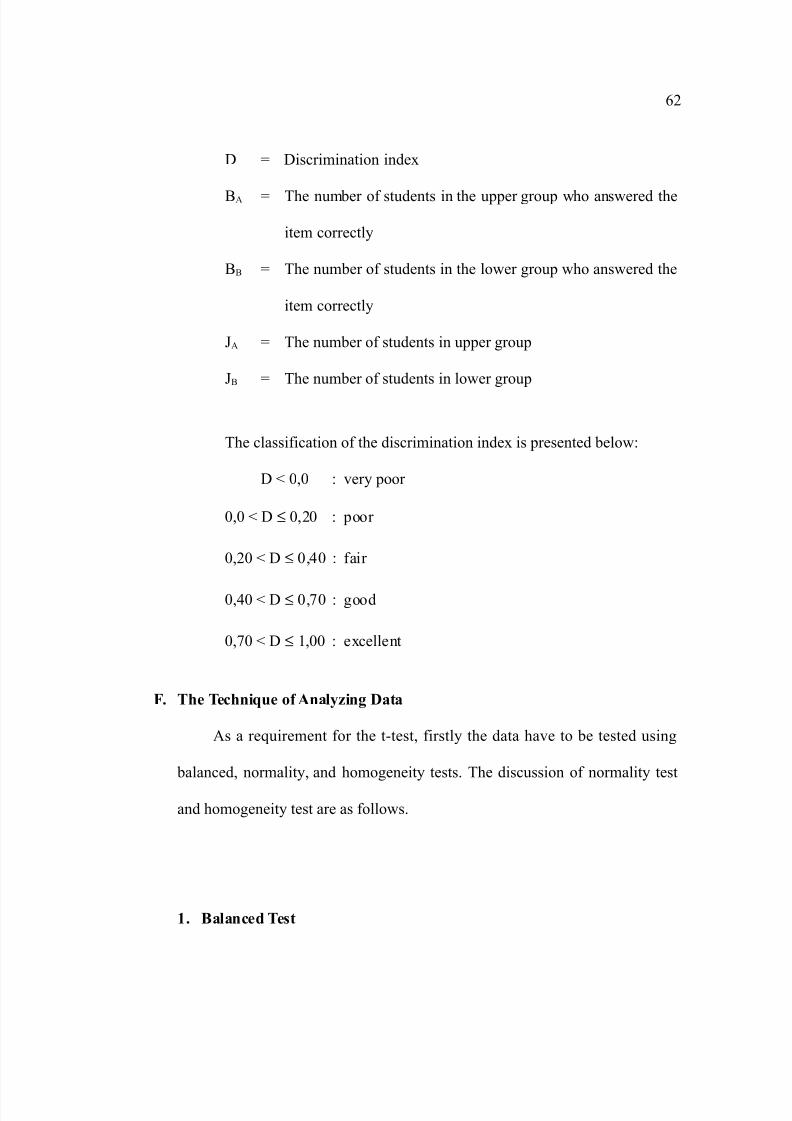
( I (iscrimination inde0
2" I The number of students in the upper group who answered the
item correctly
22 I The number of students in the lower group who answered the
item correctly
" I The number of students in upper group
2 I The number of students in lower group
The classification of the discrimination inde0 is presented below:
( L *,* : %ery poor
*,* L ( ≤ *,)* : poor
*,)* L ( ≤ *,!* : fair
*,!* L ( ≤ *,5* : good
*,5* L ( ≤ +,** : e0cellent
/. The Techni,&e of Anal*5in' Da"a
"s a requirement for the ttest, firstly the data ha%e to be tested using
balanced, normality, and homogeneity tests. The discussion of normality test
and homogeneity test are as follows.
1. )alanced Tes"
)

7/23/2019 CHAPTER III.doc
http://slidepdf.com/reader/full/chapter-iiidoc 18/22
2ased on Cinner in 2udiono 3)**!: +56, before the e0periment is
conducted by using ttest at the significance le%el of α I *,*& to find out
that e0periment group + and e0periment group ) ha%e the same or
balanced initial ability.
"ccording to 2udiono 3)**!: +8&6 the procedures of ttest are as
follows.
a. (etermine the hypothesis
?o : + I ) I # I N n 3all of population ha%e same ta%erage
count6
?+ : + O ) O # I N n 3all of population not ha%e same ta%erage
count6
b. De%el of significancy : I *,*&
c. Statistical test
t I
(
)
)
)
+
)
+
)+
n
S
n
S
# #
−
−
+
63)
)
−
−Σ=
n
# " iS i 3Sud@ana, )**+: 4&6
ote:
t I the significant score of group
# + I a%erage score of e0periment group + test
# ) I a%erage score of e0periment group ) test
)
+ s I the %ariance of e0periment group +
)) s I the %ariance of e0periment group )
#
7/23/2019 CHAPTER III.doc
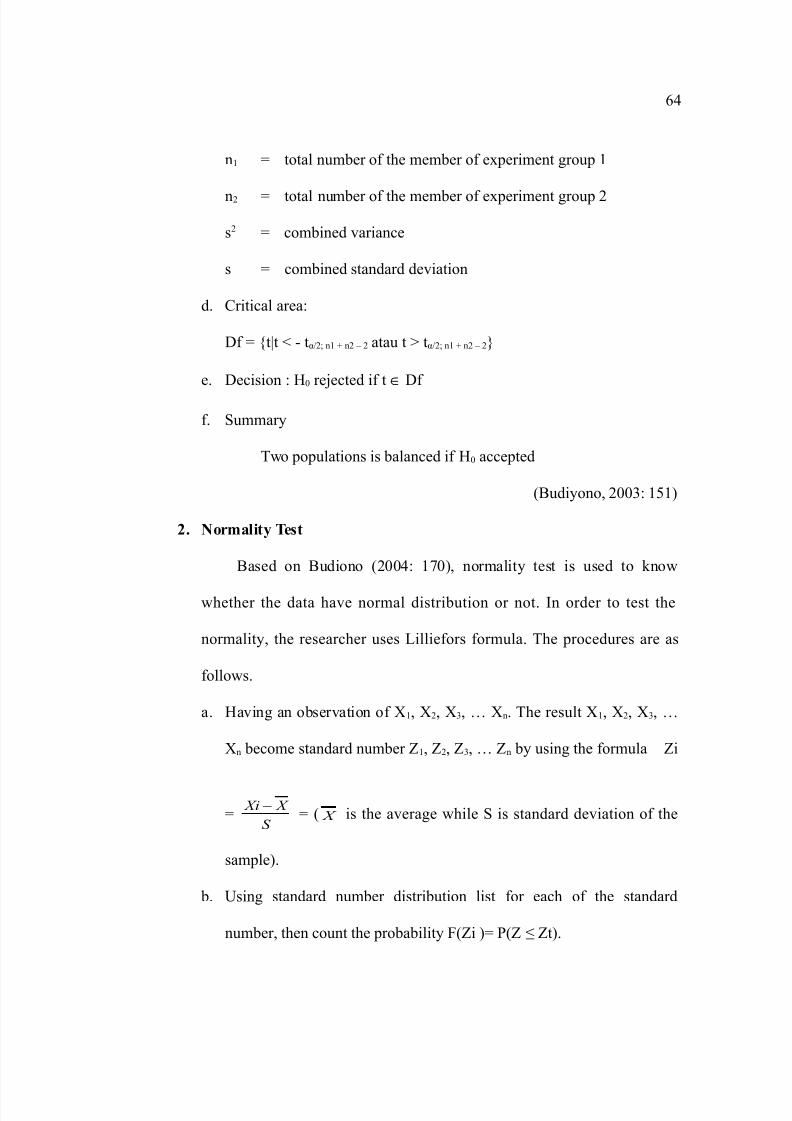
http://slidepdf.com/reader/full/chapter-iiidoc 19/22
n+ I total number of the member of e0periment group +
n) I total number of the member of e0periment group )
s) I combined %ariance
s I combined standard de%iation
d. $ritical area:
(f I tQt L tR;)' n+ n) B ) atau t K tR;)' n+ n) B )
e. (ecision : ?* re@ected if t ∈ (f
f. Summary
Two populations is balanced if ?* accepted
32udiyono, )**#: +&+6
. !ormali"* Tes"
2ased on 2udiono 3)**!: +5*6, normality test is used to know
whether the data ha%e normal distribution or not. 1n order to test the
normality, the researcher uses Dilliefors formula. The procedures are as
follows.
a. ?a%ing an obser%ation of <+, <), <#, N <n. The result <+, <), <#, N
<n become standard number U+, U), U#, N Un by using the formula Ui
IS
# #i − I 3 # is the a%erage while S is standard de%iation of the
sample6.
b. Vsing standard number distribution list for each of the standard
number, then count the probability 3Ui 6I P3U W Ut6.
!
7/23/2019 CHAPTER III.doc
http://slidepdf.com/reader/full/chapter-iiidoc 20/22
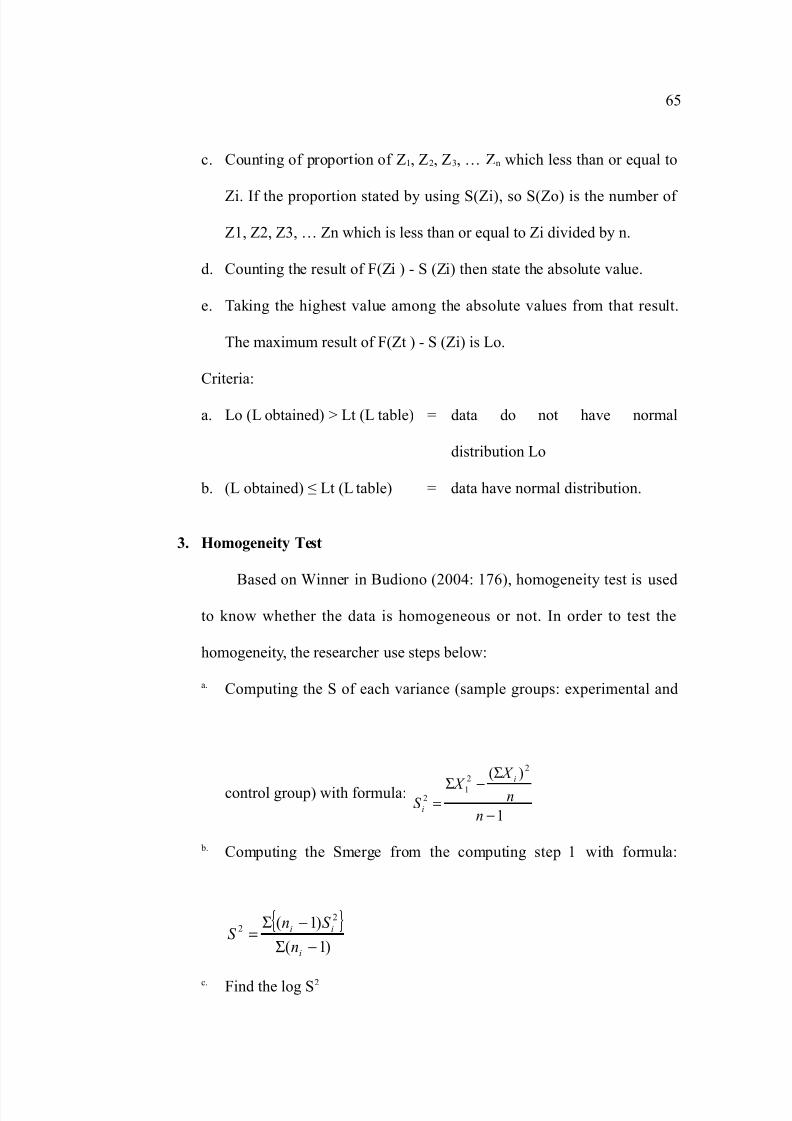
c. $ounting of proportion of U+, U), U#, N Un which less than or equal to
Ui. 1f the proportion stated by using S3Ui6, so S3Uo6 is the number of
U+, U), U#, N Un which is less than or equal to Ui di%ided by n.
d. $ounting the result of 3Ui 6 S 3Ui6 then state the absolute %alue.
e. Taking the highest %alue among the absolute %alues from that result.
The ma0imum result of 3Ut 6 S 3Ui6 is Do.
$riteria:
a. Do 3D obtained6 K Dt 3D table6 I data do not ha%e normal
distribution Do
b. 3D obtained6 W Dt 3D table6 I data ha%e normal distribution.
%. Homo'enei"* Tes"
2ased on Cinner in 2udiono 3)**!: +56, homogeneity test is used
to know whether the data is homogeneous or not. 1n order to test the
homogeneity, the researcher use steps below:
a. $omputing the S of each %ariance 3sample groups: e0perimental and
control group6 with formula:
+
63 )
)
+)
−
Σ
−Σ=n
n
#
# S
i
i
b. $omputing the Smerge from the computing step + with formula:
{ }6+3
6+3 )
)
−Σ
−Σ=
i
ii
n
S nS
c. ind the log S)
&
7/23/2019 CHAPTER III.doc
http://slidepdf.com/reader/full/chapter-iiidoc 21/22
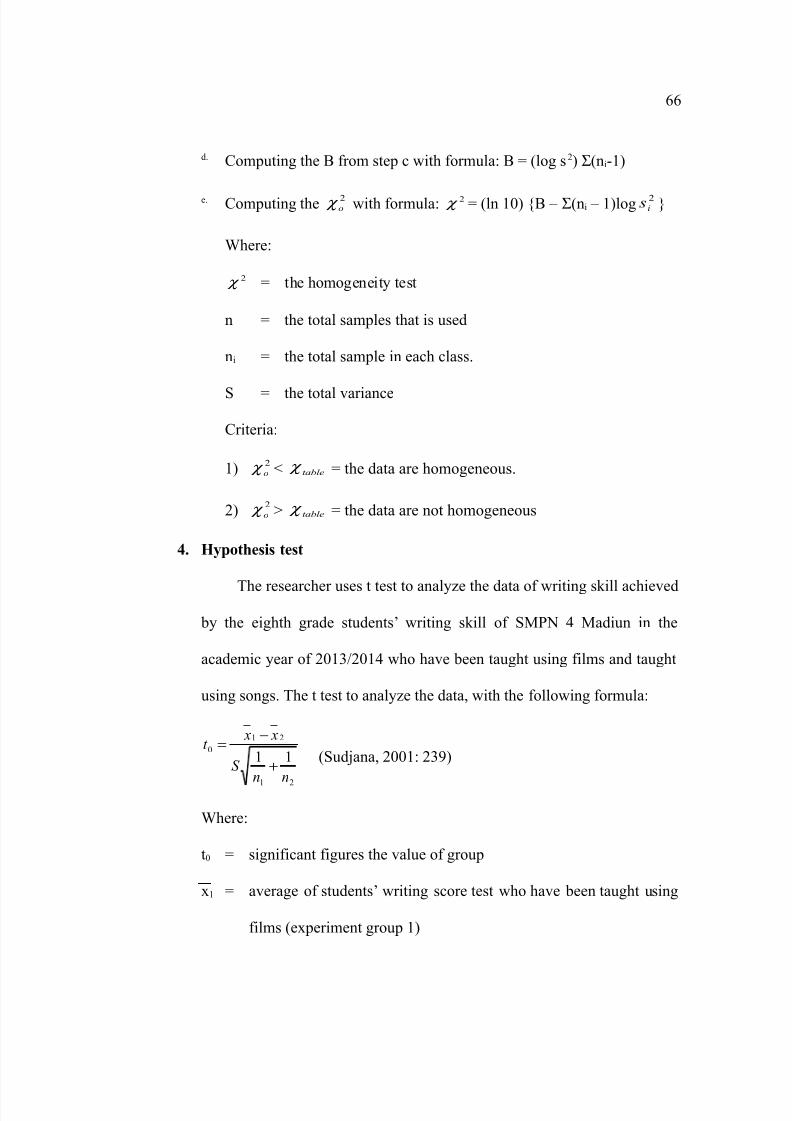
d. $omputing the 2 from step c with formula: 2 I 3log s)6 Σ3ni+6
e. $omputing the )
o χ with formula: )
χ I 3ln +*6 2 B Σ3ni B +6log )
i s
Chere:
) χ I the homogeneity test
n I the total samples that is used
ni I the total sample in each class.
S I the total %ariance
$riteria:
+6 )
o χ L table
χ I the data are homogeneous.
)6 )
o χ K table
χ I the data are not homogeneous
3. H*(o"hesis "es"
The researcher uses t test to analyze the data of writing skill achie%ed
by the eighth grade studentsE writing skill of SMP ! Madiun in the
academic year of )*+#;)*+! who ha%e been taught using films and taught
using songs. The t test to analyze the data, with the following formula:
)+
)+
*++
nnS
" "t
+
−=
3Sud@ana, )**+: )#46
Chere:
t* I significant figures the %alue of group
0+ I a%erage of studentsE writing score test who ha%e been taught using
films 3e0periment group +6
7/23/2019 CHAPTER III.doc
http://slidepdf.com/reader/full/chapter-iiidoc 22/22
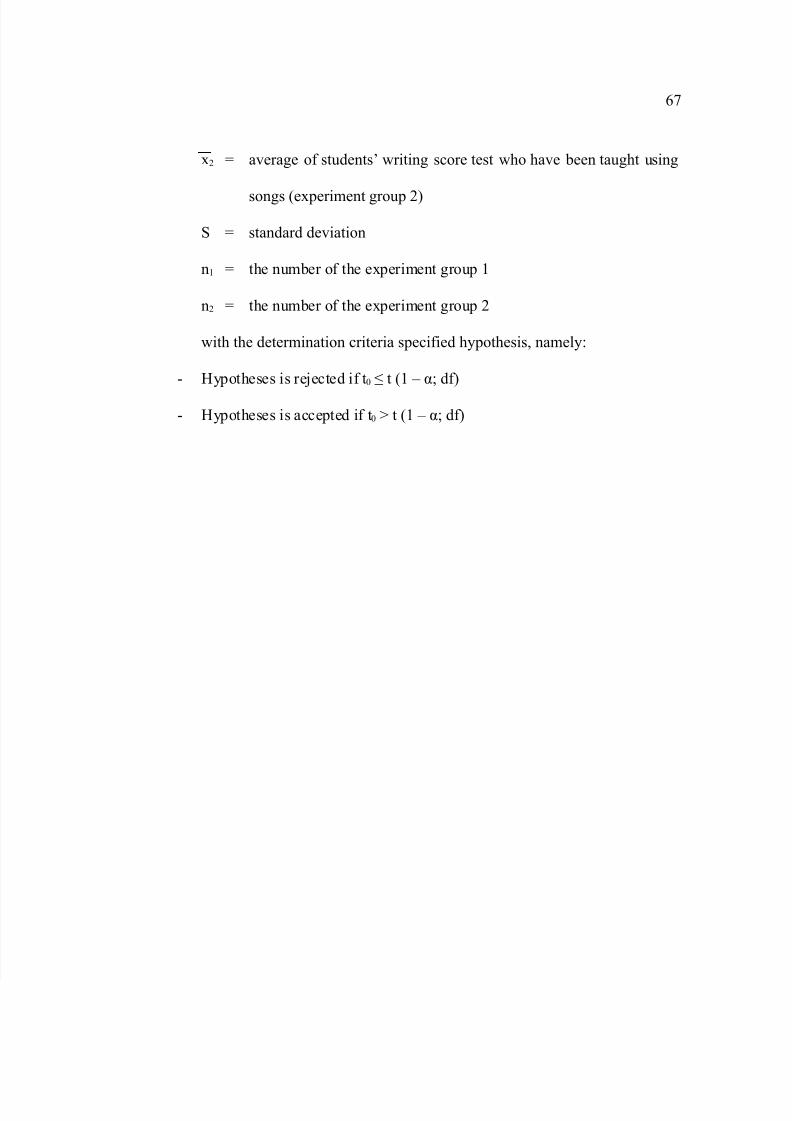
0) I a%erage of studentsE writing score test who ha%e been taught using
songs 3e0periment group )6
S I standard de%iation
n+ I the number of the e0periment group +
n) I the number of the e0periment group )
with the determination criteria specified hypothesis, namely:
?ypotheses is re@ected if t* W t 3+ B R' df6
?ypotheses is accepted if t* K t 3+ B R' df6
5