Embed Size (px)
Citation preview

RESEARCH ARTICLE
Characterization of extracellular polymeric substances(EPS) from periphyton using liquid chromatography-organiccarbon detection–organic nitrogen detection (LC-OCD-OND)
Theodora J. Stewart & Jacqueline Traber &
Alexandra Kroll & Renata Behra & Laura Sigg
Received: 2 July 2012 /Accepted: 24 September 2012 /Published online: 12 October 2012# The Author(s) 2012. This article is published with open access at Springerlink.com
Abstract A protocol was developed to extract, fractionate,and quantitatively analyze periphyton extracellular polymer-ic substances (EPS), which obtains both information on themolecular weight (Mr) distribution and protein and polysac-charide content. The EPS were extracted from freshwaterperiphyton between July and December 2011. Organic car-bon (OC) compounds from different EPS extracts wereanalyzed using liquid chromatography-organic carbon de-tection–organic nitrogen detection (LC-OCD-OND), andtotal protein and polysaccharide content were quantified.Four distinct OC fractions, on the basis of Mr, were identi-fied in all extracts, corresponding to high Mr biopolymers(≥80–4 kDa), degradation products of humic substances(Mr not available), low Mr acids (10–0.7 kDa), and smallamphiphilic/neutral compounds (3–0.5 kDa). Low C/N ratios(4.3±0.8) were calculated for the biopolymer fractions, whichrepresented 16–38 % of the measured dissolved organic car-bon (DOC), indicating a significant presence of high Mr
proteins in the EPS. Protein and polysaccharide representedthe two major components of EPS and, when combined,accounted for the measured DOC in extracts. Differences inspecific OC fractions of EPS extracts over the course of the
study could be quantified using this method. This study sug-gests that LC-OCD-OND is a new valuable tool in EPScharacterization of periphyton.
Keywords Periphyton . Biofilm . EPS . Characterization .
LC-OCD-OND . Polysaccharide . Protein
Introduction
Phototrophic biofilms, also commonly referred to as periphy-ton, are communities of hetero- and autotrophic organismsheld together by a network of extracellular polymeric sub-stances (EPS). The excreted EPS, typically composed ofpolysaccharides, proteins, glycoproteins, glycolipids, nucleicacids, and amphiphilic compounds (Cogan and Keener 2004;Neu and Lawrence 2009; Stoodley et al. 2002), provide bothbiofilm structure and a nutrient source for periphytic organ-isms, but also may serve as a protective barrier against toxiccompounds, such as nonessential trace metals.
Methods of EPS characterization have largely relied ontechniques for quantification of total proteins and polysac-charides in EPS, using assays, such as the Bradford andLowry, and the DuBois methods (Bradford 1976; DuBois etal. 1956). Despite the relative ease of standard assays, thesemethods only provide information on total concentrations ina sample. More detailed characterization techniques, such asHPLC, have been used to determine the monosaccharidecomposition in both bacterial and phototrophic biofilms(Celik et al. 2008; Congestri 2006; Meisen et al. 2008),coupled mass spectrometry (MS) techniques, such as LC-MS/MS, have been used to identify specific proteins inbacterial biofilms (Cao et al. 2011), and confocal scanninglaser microscopy has been used to study the exopolysac-charide composition of biofilms using fluorescently labeled
Responsible editor: Philippe Garrigues
Electronic supplementary material The online version of this article(doi:10.1007/s11356-012-1228-y) contains supplementary material,which is available to authorized users.
T. J. Stewart : J. Traber :A. Kroll : R. Behra : L. Sigg (*)Eawag, Swiss Federal Institute of Aquatic Scienceand Technology,8600 Dübendorf, Switzerlande-mail: [email protected]
T. J. Stewart : L. SiggETH, Institute of Biogeochemistry and Pollutant Dynamics IBP,8092 Zurich, Switzerland
Environ Sci Pollut Res (2013) 20:3214–3223DOI 10.1007/s11356-012-1228-y

lectins (Zippel and Neu 2011). These methods have theadvantage of targeting and identifying specific types ofextracellular compounds. However, what is needed is acomprehensive and quantitative approach, able to simul-taneously fractionate and characterize EPS.
Liquid chromatography-organic carbon detection–organ-ic nitrogen detection (LC-OCD-OND) is a technique basedon size-exclusion chromatography (SEC), which is able toprovide quantitative information regarding organic carbon(OC) compounds, such as polysaccharides and proteinsfound in EPS. Although SEC has been previously used forthe separation of compounds in bacterial EPS (Ras et al.2011; Simon et al. 2009; Villain et al. 2010), LC-OCD-ONDprovides additional information by the online coupling ofSEC to OC, organic nitrogen (ON), and ultraviolet (UV)detectors. The total (TOC) and dissolved organic carbon(DOC) are measured, and DOC is further separated andquantified in six separate fractions: biopolymers (high Mr
polysaccharides and proteins), humic substances (HS),building blocks of HS, low Mr acids, and amphiphilic/neu-tral compounds (alcohols, aldehydes, ketones, and aminoacids). This technique has been used in the drinking andgroundwater monitoring sectors, and there is a collection ofwork that has studied different fractions of EPS from bac-terial biofilms, with respect to assessing membrane fouling(Al-Halbouni et al. 2008; Meng et al. 2009; Zheng et al.2009). However, LC-OCD-OND has never been used as atool to characterize EPS from periphyton.
The aim of this work was twofold: to develop an extractionprotocol for EPS from periphyton suitable for metal analysisand to obtain Mr and protein and polysaccharide content ofdifferent OC fractions of EPS using LC-OCD-OND. The EPSwas extracted from biofilms, colonized between July andDecember 2011. Chromatograms from this 6-month periodwere compared to determine if differences in EPS composi-tion could be observed and quantified using this technique.Results were compared with total polysaccharide and proteinquantification. The application of LC-OCD-OND for thecharacterization of periphyton EPS is assessed.
Materials and methods
Periphyton colonization
All periphyton was colonized on glass microscope slides,previously acid soaked in 0.03 M HNO3 and washed withnanopure water (Ω 18, Milli-Q), which were placed inPlexiglas flow-through channels with continuous pumpingof natural stream water from the Chriesbach (Dübendorf,Switzerland) (Navarro et al. 2008). Each channel containedfour rows of eight paired glass slides (76×26 mm, ThermoScientific), amounting to a total of 64 slides per channel.
Larger-sized sediment was removed from the water beforeentering colonization channels by using a sediment trap(51×70×260 cm) with an average residence time of20 min. Flow rate was maintained at approximately 1 cm/sand monitored with a Schildknecht MiniAir2 flow meter.Illumination was provided by BioSun fluorescent tubes(MLT Moderne Licht-Technik AG, ML-T8 36W/965/G13B), mimicking the natural sunlight spectrum. Light/darkcycles, each 12 h, were maintained with electronically con-trolled timers (Demelectric AG). Slides were transferred to aplastic box containing stream water, so that drying of thebiofilms was avoided during transport, prior to extraction.
Periphyton EPS extraction
Glass slides were taken from flow-through channels after25 days of colonization. Biomass was gently scraped offwith a clean glass slide into a 100-mL muffled glass beakerplaced on ice containing the extraction solution composedof NaNO3 (10 mM, pH 7.4) and a 1-μg/mL protease inhib-itor cocktail, with equal amounts of Aprotinin, Leupeptin,and Pepstatin A (AppliChem AG). The 10-mM NaNO3 waschosen, as it is a chemically inert salt with an ionic strengthsimilar to the stream water used to colonize the periphyton.A volume of 60 mL was used for the extraction of 32 slides.The biofilm slurry was resuspended in the solution by gentlepipetting and then further resuspended using a water soni-cation bath (45 kHz 60 W, VWR Ultrasonic Cleaner) for30 s. Fine sediment and larger biomass was allowed tosettle, and the solution was removed and centrifuged at1,880×g for 10 min. Biomass was resuspended a secondtime in fresh solution and treated as described above. In aseparate series of extractions, NaHCO3 (2 mM, pH 7.6) wasused as an extraction solution.
To determine if agitation of the solution over time yieldedhigher EPS extraction efficiencies, two different physicalmethods were compared, referred to as shaking and stirringmethods. A biofilm slurry was obtained according to theabove protocol and a control sample, representing t00, wastaken before the remaining slurry was separated into sepa-rate aliquots. Half of the aliquots were placed on a shaker at90 rpm, whereas the remaining aliquots were stirred at300 rpm. Samples were taken after 30, 60, 90, and120 min from each type of extraction method and centri-fuged at 1,880×g for 10 min. The resulting biomass pelletwas lyophilized overnight, and dry weight measurementswere taken. All supernatants were filtered through 0.22 μmPES Millipore filters, which were previously flushed with1 L of nanopure water (Ω 18, Milli-Q) to prevent OCcontamination of the sample. Filtered samples were storedin muffled 100-mL glass Schott flasks at 4 °C and treatedwith a final concentration of 0.02 % (w/v) NaN3 to preventbacterial growth and subsequent degradation of EPS.
Environ Sci Pollut Res (2013) 20:3214–3223 3215
Glucose-6-phosphate dehydrogenase assay
Activity of glucose-6-phosphate dehydrogenase (G6P-DH),an intracellular enzyme, was measured in extracts accordingto Esposito et al., to determine the degree of cell lysisresulting from the extraction technique used in this study(Esposito et al. 2006). At each step of the extraction (i.e.,scraping of biofilms from slides, sonication, centrifugation,and filtration), samples were taken in triplicate and trans-ferred to a 96-well plate. Upon addition of 180 μL ofreaction mixture (50 mM Tris Base, 0.15 mM NADP,10 mMMgCl2, and 3 mM glucose-6-phosphate), absorptionof NADPH (formed during the conversion of glucose-6-phosphate) was measured at 340 nm at 30 °C over 30 min.A standard curve was generated using G6P-DH in bothwater and in the EPS extract to verify that the EPS did notinterfere with the detection of G6P-DH activity. The limit ofdetection in both cases was 0.00125 U/mL (U0 the amountof enzyme that reduces 1.0 μmol NADP/min at 30 °C,pH 7.8). To measure total activity of the biomass, cell lysiswas induced by combining 1 mL of the biomass suspensionwith the same volume of extraction solution containing0.1 % SDS. The sample was sonicated for 15 min, centri-fuged, and the supernatant was used as a representation oftotal G6P-DH activity. A known amount of G6P-DH wasalso treated as described above to verify that the proceduredid not inhibit G6P-DH activity.
LC-OCD-OND characterization of extracted EPS
To characterize the OC compounds found in the extractedEPS, LC-OCD-OND was used. Samples were diluted (1:50)with nanopure water (Ω 18, Milli-Q) in muffled assimilableorganic carbon-free 20-mL glass vials. Compounds wereseparated using a size exclusion column (250×20 mm,Toyopearl TSK HW-50S) able to separate both polysacchar-ides (0.1–18 kDa) and proteins (0.5–80 kDa for globularproteins), as reported by the manufacturer. A handling con-trol, in which the extraction solution was treated like theperiphyton EPS extract, was performed to assess the carboncontamination associated with the extraction protocol. In allcases, OC coming from the handling control accounted forless than 2 % of DOC in extracts and, therefore, was negli-gible for the quantification of OC compounds in EPS. Phos-phate buffer (24 mM, pH 6.6) was used as the mobile phaseand phosphoric acid solution (60 mM, pH 1.2) was used asan acidification solution to aid in the removal of inorganiccarbon prior to analysis. The limit of quantification was10 μg/L for both OC and ON.
The TOC and DOC, as well as specific OC com-pounds, were identified and quantified using FIFFIKUS,a software quantification method (DOC-Labor Dr. Huber,Germany). Distinguishable fractions can include mineral
colloids, polysaccharides, HS, building blocks of HS,low Mr acids, and amphiphilic/neutral compounds. Thesoftware uses information obtained from the isolation ofpolysaccharides, and other fractions from EPS, and theirsubsequent measurement using ion chromatography andamperometric detection for sugars.
LC-OCD-OND calibration
Protein and polysaccharide standards were measured tocreate a calibration curve for the Mr determination of peaksfrom extracts. BSA (66.5 kDa), ovalbumin (44 kDa), Car-bonic Anhydrase (29 kDa), Ribonuclease A (13.7 kDa),Aprotinin (6.5 kDa), and Pepstatin A (0.686 kDa) were usedas protein standards. Thyroglobulin (669 kDa) was used todetermine the void volume of the column and for the calcu-lation of retention factors. Protein standards were measuredboth individually and in mixtures in phosphate buffer,NaNO3, NaHCO3, and spiked in EPS extracts so as to ruleout matrix effects on elution times. As no significant effectswere observed, the standard calibration curve in phosphatebuffer was used forMr calculations (Online resource 1 in theElectronic supplementary material (ESM)). Mixtures of pro-tein standards (Thyroglobulin (669 kDa), BSA (66.5 kDa),Ovalbumin (44 kDa), and Pepstatin A (0.686 kDa)),corresponding to retention times of peaks seen in EPSextracts, were analyzed (Online resource 2 in the ESM) todetermine the resolution of Mr separation in these mixtures.Polyethylene glycol (PEG) standards ranging from 0.106 to21.030 kDa were used as polysaccharide standards andmeasured in nanopure water (Ω 18, Milli-Q), NaNO3,NaHCO3, and spiked in EPS extracts. The standard calibra-tion curve in nanopure water was used for Mr calculations.
Protein and polysaccharide quantification
The Bradford assay was conducted on the whole extract toquantify total protein (Bradford 1976). BSA was used forstandard calibration, and extracts were diluted with nano-pure water to fall within the calibration range. Bradford dyereagent (Bio-Rad) was used for the analysis. Absorbancewas measured at 595 nm, and samples were measured intriplicate. Protein was converted from micrograms of proteinto milligrams of carbon, assuming an average carbon con-tent of 0.53 g C/g protein (Rouwenhorst et al. 1991).
The phenol-sulfuric acid method (DuBois method) wasused on the whole extract to determine total polysaccharidecontent (DuBois et al. 1956). Glucose was used as a cali-bration standard. Equal volumes of sample or glucose stan-dard were mixed with phenol (500 μL, 2 % (w/v), Fluka) inglass vials and then 2.5 mL of concentrated sulfuric acid(95–97 %, Sigma-Aldrich) was added, and the solution wasmixed via gentle vortex. After allowing the sample to cool
3216 Environ Sci Pollut Res (2013) 20:3214–3223

for 30 min, absorbance of solutions was measured at490 nm. Polysaccharide was converted from microgramsof polysaccharide to milligrams of carbon, assuming 0.4 gC/g polysaccharide (Rouwenhorst et al. 1991).
Results
Extraction method
The EPS extraction efficiencies of the shaking and stirmethods were evaluated with respect to TOC and DOC.The amount of extracted TOC and DOC are shown inFig. 1 as a function of extraction time. No significant differ-ences were observed between these two methods over thecourse of 120 min nor were differences observed over timewithin a single type of extraction technique. No differenceswere observed between NaNO3 and NaHCO3 as extractionsolutions (Online resource 3 in the ESM). Results from theG6P-DH assay indicated no detectable G6P-DH activityduring any step of the EPS extraction, as measurementswere all below the limit of detection of the assay (Onlineresource 4 in the ESM).
EPS characterization
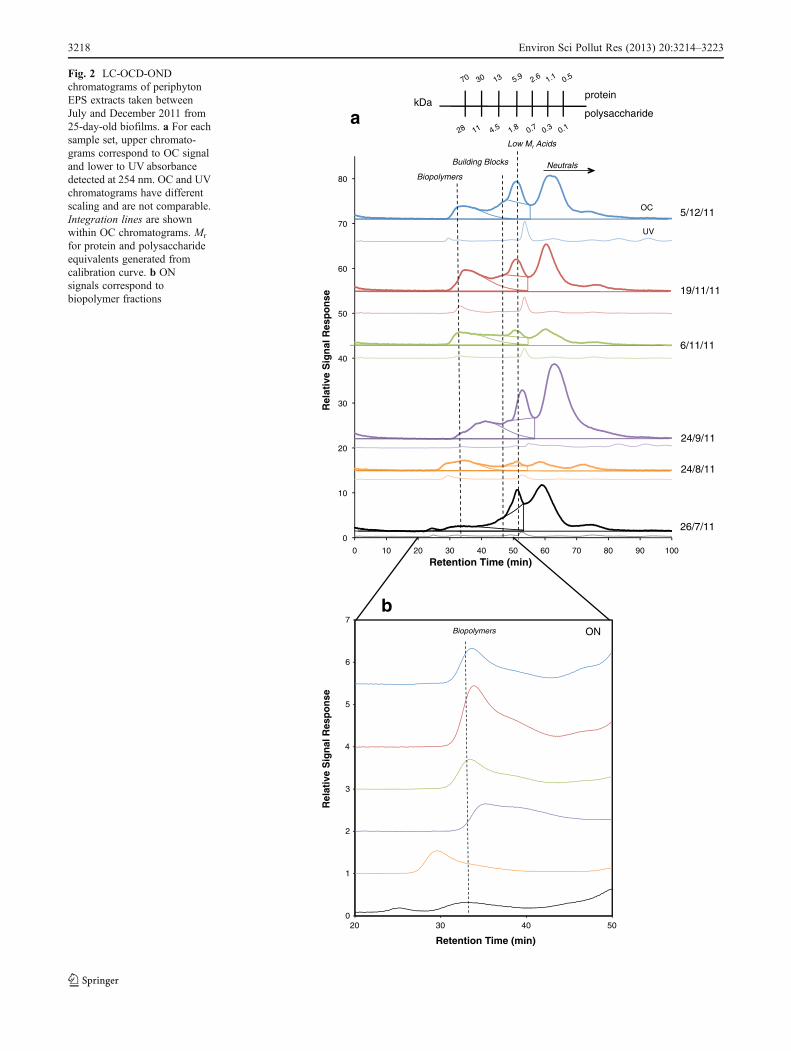
In all LC-OCD-OND chromatograms (Fig. 2a), four distinctfractions were observed corresponding to biopolymers,building blocks of HS, low Mr acids, and neutral/amphiphil-ic compounds. No HS were present in any EPS extractsmeasured, as HS typically elute at approximately 45 minand would display a distinct signal in the UV spectra (Huberet al. 2011). However, UV absorbance (254 nm) was ob-served for the biopolymer and low Mr acid fractions in allextracts (Online resource 5 in the ESM). An ON signal wasmeasured for all biopolymer fractions (Fig. 2b) but could
not be assessed for the other fractions as the nitrogen signalfrom NaNO3, which was detected at the same retention timeas the remaining fractions, was too large. Areas of individ-ual fractions were integrated as shown in Fig. 2a, quantified,and are presented as a percentage of chromatographableDOC (Fig. 3).
As seen in Fig. 3, the biopolymer fraction represented16–38 % of measured DOC, whereas the building block,low Mr acid, and neutral fractions corresponded to 16–25,5–8, and 40–60 % DOC, respectively. Extract taken in Julycontained the least amount of biopolymers (16 % DOC)relative to the other OC fractions, whereas extracts fromAugust and the beginning of November (6 November2011) contained the largest amounts (38 and 37 % DOC,respectively). A decreasing trend was observed betweenNovember and December. From the quantification of OCand ON in the biopolymer fractions, an average C/N ratio of4.3±0.8 was calculated. The amount of building blocksvaried less over the course of study, with the greatestamount found in the September extract. The low Mr acidswere consistent throughout all extracts. The neutral/amphi-philic fraction corresponded to the greatest percentage ofmeasured DOC in the EPS extracts. Similar amounts werequantified in extracts from August through early November(37–40 % DOC) and greater amounts were measured inextracts from July (60 % DOC), November (19 November2011; 49 % DOC) and December (53 % DOC) (Fig. 3).
Calculated ranges of Mr for each fraction, using proteinand polysaccharide-generated standard curves, are shown inTable 1. The Mr range of proteins in the biopolymer fractionwas 12 to ≥80 kDa, whereas polysaccharides fell between 4 to≥20 kDa. The low Mr acid fraction corresponded to a peptiderange between 2 and 10 and 0.7 and 3 kDa for polysaccharides.Neutral/amphiphilic compounds corresponded to 0.5–3 kDa.The Mr of the building blocks fraction was not calculatedbecause there were no distinct peaks corresponding to thisfraction for which aMr range could be calculated.
Differences between EPS extracts obtained in replicate,taken from the same set of biofilms harvested from onechannel, was less than 20 % for biopolymers and buildingblocks and less than 10 % for low Mr acid and neutral/amphiphilic fractions (Online resource 6 in the ESM). Variabil-ity between replicate measurements of the same sample usingLC-OCD-ONDwas assessed by the manufacturer and reportedthe half confidence interval to be less than 10% (12.4 % for theneutrals fraction) (DOC-Labor Dr. Huber, Germany).
Total polysaccharide and protein quantification
Polysaccharide and protein were present in similar amountsin EPS extracts and, in most cases, their summationaccounted for the measured DOC (Fig. 4). In the Augustextract, the sum of protein and polysaccharide was greater
Fig. 1 OC extraction efficiency of shaking and stirring extractionmethods. Biomass slurry from harvested biofilms was split into sepa-rate aliquots, and EPS was extracted either with shaking (solid line) orstirring (dashed line) methods over 120 min in triplicate. Samples weretaken at different time points for analysis with LC-OCD-OND. Errorbars generated from standard deviation of triplicates
Environ Sci Pollut Res (2013) 20:3214–3223 3217
0
1
2
3
4
5
6
7
20 30 40 50
Rel
ativ
e S
ign
al R
esp
on
se
Retention Time (min)
Biopolymers
0
10
20
30
40
50
60
70
80
0 10 20 30 40 50 60 70 80 90 100
Rel
ativ
e S
ign
al R
esp
on
se
Biopolymers
Building Blocks
Low Mr Acids
Neutrals
OC
UV
ON
a
b
Retention Time (min)
70 30 13 5.9 2.6
1.1 0.5
28 11 4.5 1.8
0.7 0.3
0.1
kDa protein
polysaccharide
5/12/11
19/11/11
6/11/11
24/9/11
24/8/11
26/7/11
Fig. 2 LC-OCD-ONDchromatograms of periphytonEPS extracts taken betweenJuly and December 2011 from25-day-old biofilms. a For eachsample set, upper chromato-grams correspond to OC signaland lower to UV absorbancedetected at 254 nm. OC and UVchromatograms have differentscaling and are not comparable.Integration lines are shownwithin OC chromatograms. Mr
for protein and polysaccharideequivalents generated fromcalibration curve. b ONsignals correspond tobiopolymer fractions
3218 Environ Sci Pollut Res (2013) 20:3214–3223

than measured DOC. Polysaccharide fluctuated between 0.3and 1.3 mg C/g dry mass and protein between 0.7 and2.5 mg C/g dry mass over the course of study. Additionally,total protein quantified was compared with the biopolymerfraction (Fig. 5). Calculations of C/N ratios for the low Mr
acid and neutrals fractions were not possible due to theinterference of the NO3 signal, and therefore these fractionswere not included in the comparison with total protein. Thebiopolymer fraction ranged from 30 to 67 % of the totalquantified protein.
Discussion
Extraction technique
As the focus of this work was to obtain an EPS extractiontechnique suitable for use in future metal-binding studies, aprotocol was developed to extract DOC from EPS for
subsequent metal analysis. Because introducing agitation,such as shaking and stirring, as well as longer periods ofextraction time, did not increase the extraction efficiency ofDOC (Fig. 1), such steps were not included in the extractionprotocol. No significant differences in the types of extractedOC compounds were observed between NaNO3 and NaHCO3
extraction solutions (Online resource 3 in the ESM), and,therefore, NaNO3 was chosen to avoid possible formation ofmetal-carbonate complexes.
It is important to note that the relative amounts of extractedcompounds are dependent upon the method of extraction (Liuand Fang 2002; Nielsen and Jahn 1999; Takahashi et al.2009). Extraction procedures can be physical methods, asused in this study, or chemical methods used to isolate specifictypes of compounds, whereby either easily extractable solublecompounds, or more tightly bound compounds are extracted,respectively. Soluble compounds include any soluble macro-molecules or colloids, whereas the fraction more stronglybound to cell walls of embedded organisms or to other organicmaterial is considered to contain the less easily extractedcompounds of the EPS (Nielsen and Jahn 1999). Character-ization of the soluble compounds is more commonly reported
Fig. 3 Quantification of OC fractions from periphyton EPS samples asdetermined by LC-OCD-OND using the software integration programFIFFIKUS (DOC-LABOR, Germany). Values expressed as percent ofchromatographable DOC. Standard deviation bars were generated fromreplicate extractions performed on the same set of biofilms
Table 1 Mr distribution of EPSfractions identified withLC-OCD-OND
Both protein and polysaccharideequivalent Mr ranges calculatedfor each sample from calibra-tions generated from globularprotein standards and PEGstandards and using min andmax elution times for eachfraction (Online resource1 in the ESM)
Sample Biopolymers Low Mr acids Neutrals
Mr (kDa)
Protein Polysaccharide Peptide Polysaccharide Peptide Polysaccharide
5 December 2011 ≥80–25 ≥20–9 9–3 3–0.7 3 to ≤0.5 0.7 to ≤0.5
19 November 2011 ≥80–19 ≥20–7 9–3 3–0.7 3 to ≤0.5 0.7 to ≤0.5
6 November 2011 ≥80–25 ≥20–9 8–3 3–0.7 3 to ≤0.5 0.7 to ≤0.5
24 September 2011 ≥80–12 ≥20–4 7–2 2–0.7 2 to ≤0.5 0.7 to ≤0.5
24 August 2011 ≥80–14 ≥20–4 7–3 2–0.8 2 to ≤0.5 0.8 to ≤0.5
26 July 2011 ≥80–42 ≥20–15 10–3 3–0.9 3 to ≤0.5 0.9 to ≤0.5
Fig. 4 Comparison of DOC to total protein and polysaccharide fromperiphyton EPS extracts. Total protein and polysaccharide measuredwas converted to milligrams of carbon and normalized to lyophilizeddry biomass to compare with measured DOC. Standard deviation barswere generated from triplicate measurements
Environ Sci Pollut Res (2013) 20:3214–3223 3219

in the literature; however, there have also been studies thatcharacterized the more tightly bound fraction (Aguilera et al.2008; Liang et al. 2010; Sheng et al. 2010). In this study,extracted DOC only reflects OC from soluble and looselybound EPS. The extraction technique established in this workis suitable when metal speciation is an important consider-ation. Using sequential chemical extraction techniques caninfluence properties of the EPS, which can impact metalspeciation and produce artifacts (van Hullebusch andZandvoort 2003). Additionally, using cation exchange resinsor EDTA removes metal cations from the EPS (Liang et al.2010), allowing for the extraction of tightly bound com-pounds, but also making it difficult to identify specific EPSfractions involved in metal binding.
To assess differences in EPS composition between extractstaken in this study, it was important to determine the variabil-ity associated with replicate extractions, which takes intoaccount both the variability associated with biological hetero-geneity of the biofilms, as well as that associated with theextraction procedure. Comparison of replicates from extrac-tions performed on two separate occasions showed that thevariability is low for DOC andOC compounds over the courseof study (Online resource 6 in the ESM). Percent differencesbetween replicates taken in July was less than 10 % for DOC,building blocks, lowMr acids, and neutrals and less than 20%for biopolymers. In November, percent differences for DOCand biopolymers was less than 5 % and less than 20 % for theremaining compounds. This analysis shows that differencesbetween replicate extracts is low enough to compare differ-ences between extracts over the period of study.
EPS composition
Biopolymers, building blocks of HS, low Mr acids, andneutral/amphiphilic compounds were identified in all EPS
extracts and should only reflect either those compoundsexcreted from organisms, incorporated from the surroundingwater, or released intracellular compounds coming fromdying or dead organisms. The extraction procedure itselfshould not have caused the release of additional compounds,as no detectable amount of cell lysis occurred as a result ofextraction (Online resource 4 in the ESM). To date, themajority of work analyzing Mr fractions of EPS comes frombacterial biofilms and there is little work done with EPSfrom phototrophic biofilms. However, as periphyton are notjust comprised of algae, but also contain bacterial commu-nities, the results obtained in this study were compared withthe available work conducted with bacterial EPS.
The biopolymer fraction can correspond to high Mr poly-saccharides, which are hydrophilic and non-UV absorbing.Al-Halbouni et al. (2008) reported the biopolymer fractionof EPS taken from a membrane bioreactor (MBR) to bemainly composed of polysaccharides and Hong et al. (2012)reported <1% of protein in the biopolymer fraction. However,this fraction can also contain amino sugars and proteins. In thepresent study, the biopolymer fraction was UVabsorbing andthe C/N ratio was more similar to ratios calculated for proteincalibration standards C=N ¼ 0:8� 1:1ð Þ than for PEG stand-ards C=N ¼ 30� 40ð Þ. Therefore, as the C/N ratio is influ-enced by the relative amounts of proteins and polysaccharides,it seems that the biopolymer fraction was largely composed ofproteins. In another MBR study, Jiang et al. (2010) alsoindicated the presence of proteins in the biopolymer peak ofsoluble microbial products measured in sludge waterC=N ¼ 17� 18ð Þ, although less than what was measured inthe present study.
The biopolymer fraction contained a range of different Mr
proteins, as can be seen by the broad peaks corresponding tothis fraction (Fig. 2a). Part of the biopolymer peak containedproteins corresponding to the column separation range(Table 1), while many of these compounds fell within the voidvolume of the column, corresponding toMr larger than 80 kDa.Resolution of individual proteins within the biopolymer frac-tion having similarMr close to the void volume (i.e., BSA andOvalbumin) was not possible using the OC signal (Onlineresource 2 in the ESM). Therefore, a column with a higherseparation range should be used with LC-OCD-OND for fur-ther characterization of the biopolymer fraction.
Studies assessing theMr distribution of EPS frommicrobialbiofilms have also reported highMr fractions in similar rangesas found in this study. Simon et al. (2009) observed a fractioncorresponding to 32–126 kDa in protein equivalent for anaer-obic sludge. Another study investigating theMr distribution ofEPS from activated sludge flocs found two high Mr fractionscorresponding to 16–190 and 270–275 kDa (Comte et al.2007). Alasonati and Slaveykova (2011) reported specificproteins ranging from 29 to 90 kDa that were identified inEPS from the bacterium Sinorhizobium meliloti and, by using
Fig. 5 Comparison of biopolymer fractions to total protein fromperiphyton EPS. Total protein measured was converted to milligramsof carbon to compare with the biopolymer fraction and biopolymerfraction presented as a percentage of total protein as determined by theBradford method
3220 Environ Sci Pollut Res (2013) 20:3214–3223

asymmetrical flow field-flow fractionation, concluded that a140-kDa fraction was predominately protein-like substances.
In most extracts, the biopolymer fraction consistentlyaccounted for 30–35 % of the total protein measured usingthe Bradford assay. This suggests that lower Mr proteinspresent in the other LC-OCD-OND fractions may contributeto 65–70% of the total measured protein. It has been observedthat peptides down to 3 kDa are detectable using the Bradfordassay (Kruger 2002), and therefore, peptides in the low Mr
acid fraction should be detected. Assays of individual frac-tions would be needed to determine protein content in the lowMr acid fraction, as calculation of C/N ratios was not possiblebecause of interference of the NO3 signal.
No HS were measured in the EPS extracts, despite beingcontinually measured in the Chriesbach stream water overthe course of this 6-month study (data not shown). Liu andFang (2002) reported humic acids to represent 8.4–30.6 %of extracted EPS from different sludge types, whereas otherstudies investigating EPS from sludge and wastewater treat-ment sources cited lower values of 5 and 6.9 % (Frølund etal. 1996; Nielsen and Jahn 1997). A study conducted withperiphyton taken from an acidic river showed humic acids toonly compose up to 4 % of EPS (Aguilera et al. 2008). Theabsence of HS in this study is probably because EPS wereextracted from newly colonized biofilms after 25 days ofgrowth, and that no HS were incorporated into the EPS fromthe stream water used to colonize the biofilms. However,building blocks of HS were measured. This fraction, definedas lower Mr break down products of HS (Huber et al. 2011),was most likely not HS degradation products, but rathersmall organics incorporated from river water or exudatesfrom organisms. Contrary to what was observed in thebiopolymer fraction, the more consistent amounts quantifiedin extracts (Fig. 3) indicate that the compounds within thebuilding block fraction reflected less the changes takingplace within the periphyton community over the course ofthe 6-month study. The percent of building blocks relative toDOC corresponds well with values found by Hong et al.(2012) who reported values between 11.2 and 19.3 % DOCof foulants in a MBR.
The low Mr acid peak, corresponding to final degradationproducts of organics and products from algal and bacterialexcretion, is the sum of all free mono- and diprotic low Mr
organic acids. As in the case of building blocks, a narrowMr
range for the low Mr acids was observed and did not displaysignificant changes between July and December (Table 1).In agreement with this finding, Comte et al. (2007) reportedthat a significant portion of low Mr compounds in EPSextracted from activated sludge were between 0.7 and2.7 kDa. Hong et al. (2012) did not observe low Mr acids;however, Al-Halbouni et al. (2008) presented LC-OCD-OND chromatograms with similar percentages of low Mr
acid fractions as found in this study.
The low Mr neutral/amphiphilic fraction corresponds toalcohols, aldehydes, ketones and amino acids. This fractionmeasured in our study was in a similar range as found byHong et al. (2012), who reported slightly lower amounts(25.1–38.3 % DOC). Interestingly, another group reportedthat the neutral fraction was only observed in the tightlybound EPS that had been extracted using Dowex cationexchange resin and was not present when only centrifuga-tion was used for extraction (Al-Halbouni et al. 2008).
Applications of LC-OCD-OND in EPS studies
Information on the C/N ratio of the biopolymer fraction couldbe useful in studying changes in EPS as a result of shifts inspecies composition from seasonal succession, different stagesof biofilm development, or changes in environmental condi-tions. Changes in extracellular monosaccharide composition ofphototrophic biofilms were observed with seasonal changes(D’Souza et al. 2005) and with shifts in community structure(Congestri et al. 2006). A decrease in the total C/N ratio,indicating an increase in protein, of EPS extracted frommarinebiofilms was observed as a function of biofilm age (D’Souza etal. 2005), and specific proteins were identified necessary forbacterial biofilm formation and development (Southey-Pillig etal. 2005). To monitor such changes, LC-OCD-OND could beused as a comprehensive approach that provides more infor-mation than total C/N ratios and is not limited to the analysis ofspecific saccharides and proteins, as done using HPLC.
The proteinaceous nature of the biopolymer fraction is alsoof particular interest with respect to metal binding. A studyconducted by Guibaud et al. (2003) showed that proteins werean important contributor to the number of binding sites andoverall complexation constants that were determined for Cd,Cu, and Pb. Additionally, it was reported that certain Mr
proteins in EPS extracted from periphyton were involved inthe binding of Hg (Zhang et al. 2010) and Cu (Zhang and Lee2012). The metal binding ability of EPS and its role in metaltoxicity to periphyton is important to investigate, as manystudies have measured total metal accumulation and toxicityto periphyton (Ancion et al. 2010; Bradac et al. 2009a, b; LeFaucheur et al. 2005), but less work has been done to under-stand how metal binding properties of EPS influence metalbioavailability to periphytic organisms. When coupled to met-al analysis, LC-OCD-OND could aid in understanding whichcomponents of EPS are significant in metal binding.
Conclusions
The technique LC-OCD-OND is advantageous over othersize based fractionation methods as it quantifies both OCand ON, thus providing additional information about relativeamounts of proteins and polysaccharides in different fractions.
Environ Sci Pollut Res (2013) 20:3214–3223 3221
We have developed both polysaccharide and protein calibra-tions for betterMr determination in LC-OCD-OND and this isthe first study to use this technique for analysis of EPSoriginating from periphyton. We have shown that seasonalvariation in EPS composition can be detected and quantified,and that LC-OCD-OND has applications beyond purelychemical characterization. Suggested applications includestudies of biofilm community structure and metal-EPS bind-ing. Therefore, we conclude that LC-OCD-OND can be usedas a new tool for periphyton EPS characterization to simulta-neously identify and quantify OC fractions with respect toprotein and polysaccharide content as well asMr distribution.
Acknowledgments We would like to acknowledge the Swiss Na-tional Science Foundation for providing funding for this work as wellas the Eawag Werkstatt for their help in the installation of the periph-yton colonization flow-through system. We would also like to thankDr. Marc Suter for internal review of the manuscript.
Open Access This article is distributed under the terms of the CreativeCommons Attribution License which permits any use, distribution, andreproduction in any medium, provided the original author(s) and thesource are credited.
References
Aguilera A, Souza-Egipsy V, San Martín-Úriz P, Amils R (2008)Extracellular matrix assembly in extreme acidic eukaryotic bio-films and their possible implications in heavy metal adsorption.Aquat Toxicol 88:257–266. doi:10.1016/j.aquatox.2008.04.014
Alasonati E, Slaveykova VI (2011) Composition and molar masscharacterisation of bacterial extracellular polymeric substancesby using chemical, spectroscopic and fractionation techniques.Environ Chem 8:155–162. doi:10.1071/EN10119
Al-Halbouni D, Traber J, Lyko S et al (2008) Correlation of EPScontent in activated sludge at different sludge retention times withmembrane fouling phenomena. Water Res 42:1475–1488.doi:10.1016/j.watres.2007.10.026
Ancion P-Y, Lear G, Lewis GD (2010) Three common metal contam-inants of urban runoff (Zn, Cu and Pb) accumulate in freshwaterbiofilm and modify embedded bacterial communities. EnvironPollut 1–8. doi:10.1016/j.envpol.2010.04.013
Bradac P, Behra R, Sigg L (2009a) Accumulation of cadmium inperiphyton under various freshwater speciation conditions. Envi-ron Sci Technol 43:7291–7296. doi:10.1021/es9013536
Bradac P, Navarro E, Odzak N et al (2009b) Kinetics of cadmiumaccumulation in periphyton under freshwater conditions. EnvironToxicol 28:2108–2116. doi:10.1897/08-511R1.1
BradfordMM (1976) A rapid and sensitive method for the quantification ofmicrogram quantities of protein utilizing the principle of protein-dyebinding. Anal Biochem 72:248–254. doi:10.1006/abio.1976.9999
Cao B, Shi L, Brown RN et al (2011) Extracellular polymeric sub-stances from Shewanella sp. HRCR-1 biofilms: characterizationby infrared spectroscopy and proteomics. Environ Microbiol13:1018–1031. doi:10.1111/j.1462-2920.2010.02407.x
Celik GY, Aslim B, Beyatli Y (2008) Characterization and productionof the exopolysaccharide (EPS) from Pseudomonas aeruginosaG1 and Pseudomonas putida G12 strains. Carbohyd Polym73:178–182. doi:10.1016/j.carbpol.2007.11.021
Cogan N, Keener J (2004) The role of the biofilm matrix in structuraldevelopment. Math Med Biol 21:147–166. doi:10.1093/imammb21.2.147
Comte S, Guibaud G, Baudu M (2007) Effect of extraction method onEPS from activated sludge: an HPSEC investigation. J HazardMater 140:129–137. doi:10.1016/j.jhazmat.2006.06.058
Congestri R, Di Pippo F, De Philippis R et al (2006) Seasonal succes-sion of phototrophic biofilms in an Italian wastewater treatmentplant: biovolume, spatial structure and exopolysaccharides. AquatMicrob Ecol 45:301–312. doi:10.3354/ame045301
D’Souza F, Garg A, Bhosle NB (2005) Seasonal variation in the chemicalcomposition and carbohydrate signature compounds of biofilm.Aquat Microb Ecol 41:199–207. doi:10.3354/ame041199
DuBois M, Gilles K, Hamilton J et al (1956) Colorimetric method fordetermination of sugars and related substances. Anal Chem28:350–356. doi:10.1021/ac60111a017
Esposito S, Guerriero G, Vona V et al (2006) Glucose-6P dehy-drogenase in Chlorella sorokiniana (211/8k): an enzyme withunusual characteristics. Planta 223:796–804. doi:10.1007/s00425-005-0110-2
Frølund B, Palmgren R, Keiding K (1996) Extraction of extracellularpolymers from activated sludge using a cation exchange resin.Water Res 30:1749–1758. doi:10.1016/0043-1354(95)00323-1
Guibaud G, Tixier N, Bouju A, Baudu M (2003) Relation betweenextracellular polymers' composition and its ability to complex Cd,Cu and Pb. Chemosphere 52:1701–1710. doi:10.1016/S0045-6535(03)00355-2
Hong S, Aryal R, Vigneswaran S et al (2012) Influence of hydraulicretention time on the nature of foulant organics in a high ratemembrane bioreactor. Desalination 287:116–122. doi:10.1016/j.desal.2011.07.030
Huber SA, Balz A, Abert M, Pronk W (2011) Characterisation ofaquatic humic and non-humic matter with size-exclusionchromatography-organic carbon detection–organic nitrogen de-tection (LC-OCD-OND). Water Res 45:879–885. doi:10.1016/j.watres.2010.09.023
Jiang T, Kennedy MD, Schepper VD et al (2010) Characterizationof soluble microbial products and their fouling impacts inmembrane bioreactors. Environ Sci Technol 44:6642–6648.doi:10.1021/es100442g
Kruger NJ (2002) The Bradford method for protein quantitation. In:Walker J (ed) The protein protocols handbook, 2nd edn. HumanaPress, New Jersey, pp 15–21
Le Faucheur S, Behra R, Sigg L (2005) Thiol and metal contents inperiphyton exposed to elevated copper and zinc concentrations: afield and microcosm study. Environ Sci Technol 39:8099–8107.doi:10.1021/es050303z
Liang Z, Li W, Yang S, Du P (2010) Extraction and structural charac-teristics of extracellular polymeric substances (EPS), pellets inautotrophic nitrifying biofilm and activated sludge. Chemosphere81:626–632. doi:10.1016/j.chemosphere.2010.03.043
Liu H, Fang HHP (2002) Extraction of extracellular polymeric sub-stances (EPS) of sludges. J Biotechnol 95:249–256. doi:10.1016/S0168-1656(02)00025-1
Meisen S, Wingender J, Telgheder U (2008) Analysis of microbial extracel-lular polysaccharides in biofilms by HPLC. Part I: development of theanalytical method using two complementary stationary phases. AnalBioanal Chem 391:993–1002. doi:10.1007/s00216-008-2068-y
Meng F, Drews A, Mehrez R et al (2009) Occurrence, source, and fateof dissolved organic matter (DOM) in a pilot-scale membranebioreactor. Environ Sci Technol 43:8821–8826. doi:10.1021/es9019996
Navarro E, Robinson C, Behra R (2008) Increased tolerance to ultra-violet radiation (UVR) and cotolerance to cadmium in UVR-acclimatized freshwater periphyton. Limnol Oceanogr 53:1149–1158. doi:10.4319/lo.2008.53.3.1149
3222 Environ Sci Pollut Res (2013) 20:3214–3223
Neu T, Lawrence J (2009) Extracellular polymeric substances in mi-crobial biofilms. In: Moran A, Holst O, Brennan P, von Itzstein M(eds) Microbial glycobiology: structures, relevance and applica-tions. Elsevier, London, pp 735–758
Nielsen P, Jahn A (1997) Conceptual model for production and com-position of exopolymers in biofilms. Water Sci Technol 36:11–19.doi:10.1016/S0273-1223(97)00318-1
Nielsen H, Jahn A (1999) Extraction of EPS. In: Wingender J, Neu TR,Flemming H-C (eds) Microbial extracellular polymeric substances:characterization, structures and function. Springer, Berlin,pp 49–69
Ras M, Lefebvre D, Derlon N et al (2011) Extracellular polymericsubstances diversity of biofilms grown under contrasted environ-mental conditions. Water Res 45:1529–1538. doi:10.1016/j.watres.2010.11.021
Rouwenhorst RJ, Frank Jzn J, Scheffers WA, van Dijken JP (1991)Determination of protein concentration by total organic carbonanalysis. J Biochem Biophys Methods 22:119–128. doi:10.1016/0165-022X(91)90024-Q
Sheng G-P, Yu H-Q, Li X-Y (2010) Extracellular polymeric substances(EPS) of microbial aggregates in biological wastewater treatmentsystems: a review. Biotechnol Adv 28:882–894. doi:10.1016/j.biotechadv.2010.08.001
Simon S, Païro B, Villain M et al (2009) Evaluation of sizeexclusion chromatography (SEC) for the characterization ofextracellular polymeric substances (EPS) in anaerobic granu-lar sludges. Bioresour Technol 100:6258–6268. doi:10.1016/j.biortech.2009.07.013
Southey-Pillig CJ, Davies DG, Sauer K (2005) Characterization of tem-poral protein production in Pseudomonas aeruginosa biofilms. JBacteriol 187:8114–8126. doi:10.1128/JB.187.23.8114-8126.2005
Stoodley P, Sauer K, Davies G, Costerton J (2002) Biofilms as com-plex differentiated communities. Annu Rev Microbiol 56:187–209. doi:10.1146/annurev.micro.56.012302.160705
Takahashi E, Ledauphin J, Goux D, Orvain F (2009) Optimisingextraction of extracellular polymeric substances (EPS) from ben-thic diatoms: comparison of the efficiency of six EPS extractionmethods. Mar Freshw Res 60:1201. doi:10.1071/MF08258
van Hullebusch E, Zandvoort M (2003) Metal immobilisation bybiofilms: mechanisms and analytical tools. Rev Environ Sci Bio-technol 2:9–33. doi:10.1023/B:RESB.0000022995.48330.55
Villain M, Simon S, Bourven I (2010) The use of a new mobilephase, with no multivalent cation binding properties, to dif-ferentiate extracellular polymeric substances (EPS), by sizeexclusion chromatography (SEC), from biomass used forwastewater treatment. Process Biochem 45:1415–1421.doi:10.1016/j.procbio.2010.05.018
Zhang D, Lee D (2012) Fluorescent quenching for biofilm extracellularpolymeric substances (EPS) bound with Cu(II). J Taiwan InstChem Eng 43:450–454. doi:10.1016/j.jtice.2011.12.010
Zhang D, Pan X, Mostofa KMG et al (2010) Complexation betweenHg(II) and biofilm extracellular polymeric substances: an appli-cation of fluorescence spectroscopy. J Hazard Mater 175:359–365. doi:10.1016/j.jhazmat.2009.10.011
Zheng X, Ernst M, Jekel M (2009) Identification and quantification ofmajor organic foulants in treated domestic wastewater affectingfilterability in dead-end ultrafiltration. Water Res 43:238–244.doi:10.1016/j.watres.2008.10.011
Zippel B, Neu TR (2011) Characterization of glycoconjugates ofextracellular polymeric substances in tufa-associated biofilms byusing fluorescence lectin-binding analysis. Appl Environ Microbiol77:505–516. doi:10.1128/AEM.01660-10
Environ Sci Pollut Res (2013) 20:3214–3223 3223