Embed Size (px)
Citation preview

i
Department of Electrical and Computer Engineering
Characterization of Power Transformer Frequency Response Signature
using Finite Element Analysis
Naser Hashemnia
This thesis is presented for the Degree of
Doctor of Philosophy of
Curtin University
December 2014

ii
DECLARATION
To the best of my knowledge this thesis contains no material previously published by
any other person except where due acknowledgment has been made. This thesis
contains no material that has been accepted for the award of any other degree or
diploma in any university.
Signature: Naser Hashemnia Date: 11/05/2015

iii
ABSTRACT
Power transformers are a vital link in power system networks. Monitoring and
diagnostic techniques are essential to decrease maintenance and improve the reliability
of the equipment. The problem of transformer winding and core deformation is
increasing due to the long–term exposure of transformers to systemic faults and the
continued growth of the power grid [1, 2]. Winding movements may lead to serious
faults and subsequent damage to the transformer and draining the transformer oil to
carry out winding inspection is not recommended. When the winding deformation
happens due to huge short circuit force, the winding structure changes and will result
in varying of the relative internal components (inductance and capacitance ).
Frequency response analysis (FRA) is a method to detect these changes. FRA has been
successfully used for detecting winding deformations, core and clamping structure.
The frequency response analysis (FRA) is an off-line test that is used to measure the
input/output relationship as a function of a wide frequency range. This provides a
transformer fingerprint for future diagnosis. Because of its dependency on graphical
analysis, FRA calls for trained personnel to conduct the test and interpret its results in
order to identify and quantify internal mechanical faults. Another drawback of the
FRA test is that the transformer has to be de-energized and switched out of service
causing complete interruption to the electricity grid.
This research has developed a novel, versatile, reliable and robust technique for high
frequency power transformers modelling. The purpose of this modelling is to enable
engineers to conduct sensitivity analyses of FRA in the course of evaluating
mechanical defects of power transformer windings. The importance of this new
development is that it can be applied successfully to industry transformers of real
geometries.
The FRA test requires identification of any winding displacement or deformation in
the early stages. A comprehensive model is ideal, but it is normally difficult to obtain
full design information for a transformer, as it requires exclusive manufacturing design
records that most manufacturers would be reluctant to reveal. In order to validate the
appropriateness of the model for real transformers, a detailed Finite Element Model
(FEM) is necessary[60]. To establish the capabilities of a high-frequency power
transformer model, the construction and geometric data from the manufacturer,
iv
together with transformer material characteristics are utilized. All electrical circuit
parameters in the distributed lumped model representation are calculated based on
FEM analysis [60].
The main conclusions drawn from the work in this thesis can be summarized as
follows:
1. A very simple, analytical method using lumped RLC parameters cannot
accurately represent the performance of high-frequency power transformers.
The reason is that simple models normally ignore the iron core element of the
transformer. Inclusion of the iron core in models simulating performance of
power transformers can improve the accuracy of the calculated inductance. To
overcome limitations of simple models, a frequency-dependent complex
permeability can be used in a FEM to represent both the core and the windings
in a realistic manner.
2. This study has produced diagnostic charts, which correlate the percentage
change in each electrical parameter (involved in a transformer) with the level
of mechanical fault for a variety of faults. This can provide precise simulation
of mechanical failures using a combination of the transformer’s equivalent
circuit and the deterministic analysis of the FRA signature.
3. FRA has the potential to detect Bushing faults and oil degradation in the high
frequency range.
Keywords: Power transformer, High-frequency model, Condition monitoring, Finite
Element Analysis, Lumped parameters model, Frequency response
analysis (FRA), internal stresses, Mechanical faults.

v
ACKNOWLEDGMENTS
First and foremost, I would like to express my immense gratitude and love to the
closest of people in my circle, my wife, Sahar Baraei, who has provided unconditional
and unrelenting support during my pursuit of study and learning. I recognize that her
hard work and determination was largely for the betterment of my life for which I am
eternally grateful. For my wife, it is with great pleasure and deep felt love that I
dedicate this work to you.
Special thanks must go to several people in connection with the research documented
in this thesis. I am especially grateful for the active and enthusiastic involvement of
my primary Supervisor, Dr. Ahmed Abu-Siada, who has selflessly given countless
hours of his time in discussing my research in-depth. Associate Supervisor, Professor
Mohammad-Ali Masoum, is to be thanked for his contributions in this research project
serving as co-author in some of my publications. Likewise, Professor Syed M. Islam
has been extremely supportive in my research endeavors.
Department Secretary Margaret Pittuck and Technical Manager Mark Fowler deserve
special mention as they have been very helpful in all my administration and study
material needs. For providing valuable technical hardware support in the experimental
aspects of my work on power transformers, I am grateful to the skillful laboratory
technicians, Mr. Zibby Cielma and Mr. Russell Wilkinson. Without their help, I would
not have been able to carry out safe and accurate measurements for validation and
testing of theoretical and simulation model findings.
Finally, a great many thanks must go to the people who helped in reviewing and
proofreading this thesis. The behind-the-scenes and often unsung contributors, the
reviewers and examiners of this thesis and related publications, should be
acknowledged for their time in helping to ensure the work is of a high standard.

vi
PUBLICATIONS
The main results from this work have either been published in the following journals
and conference proceedings:
Journal Papers
1. Naser Hashemnia, Ahmed Abu- Siada, Syed Islam, “Improved Power
Transformer Winding Fault Detection using FRA Diagnostics Part 1: Axial
Displacement”, Dielectric and Insulation, IEEE Transaction on, Vol.22, No.1,
Feb. 2015.
2. Naser Hashemnia, Ahmed Abu-Siada, Syed Islam, “Improved Power
Transformer Winding Fault Detetcion using FRA Diagnostics Part 2: Radial
Deformation” Dielectric and Insulation, IEEE Transaction on , Vol.22, No.1, Feb.
2015.
3. Naser Hashemnia, Ahmed Abu-Siada, Syed Islam, “Detection of Bushing Faults
and oil degredation of Power Transformer using FRA Diagnostics”, Dielectric
and Insulation, IEEE Transaction on,2014 (under review).
4. A. Masoum, N. Hashemnia, A. Abu Siada, M. Masoum, and S. Islam, "Online
Transformer Internal Fault Detection Based on Instantaneous Voltage and Current
Measurements Considering Impact of Harmonics," Power Delivery, IEEE
Transactions on, vol. PP, pp. 1-1, 2014.
5. A.Masoum, Naser Hashemnia, Ahmed Abu-Siada, A.S. Masoum and Syed
Islam, ‘’Finite-Element Performance Evaluation of On-Line Transformer Internal
Fault Detection based on Instantaneous Voltage and Current Measurements”
AJEEE: Australian Journal of Electrical & Electronics Engineering, 2013.
6. A. Abu-Siada, N. Hashemnia, S. Islam, and M. A. S. Masoum, "Understanding
power transformer frequency response analysis signatures," Electrical Insulation
Magazine, IEEE, vol. 29, pp. 48-56, 2013.

vii
Conferences
1. Naser Hashemnia, M.A.S. Masoum, Ahmed Abu-Aiada, Syed Islam,
“Transformer Mechanical Deformation Diagnosis: Moving from Offline to
Online Fault Detection”, AUPEC, Australia, 2014.
2. Naser Hashemnia, Ahmed Abu-Siada, Syed Islam, “Detection of Power
Transformer Disk Space Variation and Core Deformation using Frequency
Response Analysis”, South Korea, International Condition Monitoring
Conference,2014.
3. A. S. Masoum, N. Hashemnia, A. Abu-Siada, M. A. S. Masoum, and S. M. Islam,
"Performance evaluation of on-line transformer winding short circuit fault
detection based on instantaneous voltage and current measurements," in PES
General Meeting | Conference & Exposition, 2014 IEEE, 2014, pp. 1-5.
4. N. Hashemnia, A. Abu-Siada, and S. Islam, "Impact of axial displacement on
power transformer FRA signature," in Power and Energy Society General Meeting
(PES), 2013 IEEE, 2013, pp. 1-4.
5. A. Abu-Siada, N. Hashemnia, S. Islam, and M. S. A. Masoum, "Impact of
transformer model parameters variation on FRA signature," in Universities Power
Engineering Conference (AUPEC), 2012 22nd Australasian, 2012, pp. 1-
6. N. Hashemnia, A. Abu-Siada, M. A. S. Masoum, and S. M. Islam,
"Characterization of transformer FRA signature under various winding faults," in
Condition Monitoring and Diagnosis (CMD), 2012 International Conference on,
2012, pp. 446-449.
7. Naser Hashemnia, A. Abu-Siada, Mohammad A.S. Masoum, and Syed M. Islam,
“Toward the Establishment of Standard Codes for Power Transformer FRA
Signature Interpretation in Condition Monitoring and Diagnosis (CMD),
International Conference, 2012.

viii
TABLE OF CONTENTS
1. INTRODUCTION ........................................................................................................ 1
1.1 BACKGROUND OF RESEARCH........................................................................................... 1
1.2 SCOPE OF WORK ........................................................................................................ 2
1.3 RESEARCH METHODOLOGY ............................................................................................. 3
1.4 THESIS OUTLINE ............................................................................................................. 3
2. BACKGROUND .......................................................................................................... 5
2.1 CONDITION MONITORING – PURPOSE AND PRACTICE .......................................................... 5
2.1.1 Condition Monitoring By Partial Discharge Analysis ...................................................... 7
2.1.2 Condition Monitoring By Vibration Analysis .................................................................. 8
2.1.3 Condition Monitoring By Dissolved Gas Analysis .......................................................... 9
2.2 POWER TRANSFORMERS DESIGN ................................................................................. 10
2.2.1 Cores and Windings ..................................................................................................... 10
2.2.2 Transformer insulation and cooling ............................................................................... 10
2.2.3 Transformer Tank ......................................................................................................... 11
2.3 ROOTS OF MECHANICAL FAULTS IN POWER TRANSFORMER .......................... 11
2.4 FREQUENCY RESPONSE ANALYSIS (FRA) ......................................................................... 12
2.3.1 Measurement Techniques ............................................................................................. 15
2.3.2 SFRA (Sweep Frequency Response Analysis)............................................................... 16
2.3.3 SFRA ................................................................................................. 18
2.3.4 SFRA Disadvantages [58] ............................................................................................ 18
2.5 COMPARISON METHODS ................................................................................................ 19
2.4.1 Time-Based Comparison .............................................................................................. 19
2.4.2 Construction-Based Comparison ................................................................................... 19
2.4.3 Comparison Based On Symmetry[60] ........................................................................... 19
2.4.4 Model-Based Comparison ............................................................................................ 19
2.6 INTERNATIONAL EXPERIENCE ........................................................................................ 19
2.7 ALTERNATIVE TECHNIQUES ........................................................................................... 22
2.8 FRA SUMMARY ............................................................................................................. 23
2.9 TRANSFORMER MODELLING ........................................................................................... 23
2.8.1 Inductance Calculation ................................................................................................. 24
2.8.2 Capacitance Calculation ............................................................................................... 25
2.10 MODELLING ACCURACY ................................................................................................ 26
2.11 CONCLUSIONS ............................................................................................................... 27
3. FINITE ELEMENT ANALYSIS ............................................................................... 29
3.1 PARAMETER CALCULATION ........................................................................................... 33
3.1.1 Inductance and Resistance Matrices Calculation ........................................................... 33
3.1.2. Capacitance Matrix Calculation .................................................................................... 35

ix
3.2 COUPLING MAXWELL DESIGNS WITH ANSYS STRUCTURAL............................................... 35
3.3 TRANSFORMER CONSTRUCTION USED IN FEA .................................................................. 36
3.3.1 Core Characteristics ..................................................................................................... 36
3.3.2 Shell and Core Type Transformer ................................................................................. 36
3.3.3 Windings Conductor..................................................................................................... 37
3.3.4 Winding Types ............................................................................................................. 38
4. INTERPRETATION OF FREQUENCY RESPONSE ANALYSIS (FRA) .............. 41
4.1 BASIC FEATURES OF END-TO-END FRA RESPONSES .......................................................... 41
4.2 TRANSFORMER MODEL (DISTRIBUTED PARAMETER MODEL) ............................................ 44
4.3 AXIAL DISPLACEMENT FAILURE MODE AND TRANSFORMER EQUIVALENT CIRCUIT
PARAMETERS CALCULATION ....................................................................................................... 47
4.3.1 Impact of Axial Displacement on Equivalent Electric Circuit Parameters ...................... 51
4.3.2 Impact of Proposed Parameter Changes on FRA Signature ............................................ 56
4.4 IMPACT OF RADIAL DEFORMATION ON EQUIVALENT ELECTRIC CIRCUIT PARAMETERS ....... 60
4.4.1 Impact of Buckling Deformations on Equivalent Electric Circuit Parameters ................. 62
4.4.2 Impact of proposed parameter changes on the FRA signature ........................................ 69
4.5 DISK SPACE VARIATIONS ............................................................................................... 72
4.6 CORE DEFORMATION ..................................................................................................... 75
4.7 BUSHING FAULTS AND OIL DEGRADATION ...................................................................... 77
4.7.1 Bushing Fault Detection Techniques ............................................................................. 78
4.7.2 Insulation System Properties ......................................................................................... 78
4.7.3 Transformer Bushing Construction and Equivalent Circuit ............................................ 80
4.7.4 Impact of the Bushing Fault and Oil Degradation on the FRA Signature ........................ 85
4.8 EXPERIMENTAL RESULTS ............................................................................................... 89
5. CONCLUSION........................................................................................................... 91
5.1 FURTHER WORK ....................................................................................................... 94

x
LIST OF FIGURES
Figure 2-1 Power Transformer[54] .............................................................................................. 11
Figure 2-2 Typical FRA signature with shorted turns on phase C [6] ......................................... 14
Figure 2-3. HV winding End to End open circuit test [1] ............................................................. 17
Figure 2-4. LV winding End to End open circuit ......................................................................... 17
Figure.2-5. Capacitive inter-winding test ..................................................................................... 18
Figure 3-1. Mesh shown on the Transformer core ....................................................................... 30
Figure 3-2. Inductance/capacitance matrix configurations for a three disks winding................. 34
Figure 3-3. Transformer core with laminated sheet[54] .............................................................. 36
Figure 3-4. Shell type transformers[54] ........................................................................................ 37
3-5. Rectangular shape conductor[54] ........................................................................................ 38
Figure 3-6. Layer winding type[54] .............................................................................................. 39
Figure 3-7. Helical winding type[54]............................................................................................ 40
Figure 3-8 Disk winding type[54] ................................................................................................. 40
Figure 4-1 Fundamental trends and features of FRA responses. ................................................. 42
Figure 4-2 N-Stage Transformer Winding Lumped Ladder Network[126] ................................ 42
Figure 4-3 - 3D model of (a) single phase transformer , (b) 3 phase transformer ....................... 46
Figure 4-4. Transformer Lumped parameters model ................................................................. 46
Figure 4-5 Axial displacement[1] .................................................................................................. 48
Figure 4-6 Axial displacement after short circuit fault ................................................................ 49
Figure 4-7 Magnetic flux density (a) Healthy Condition (b) Faulty Condition............................ 50
Figure 4-8 configuration of axial fault .......................................................................................... 52
Figure 4-9- Variation of Mutual Inductance for various fault levels ........................................... 53
Figure 4-10 Variation of HV-LV Capacitance ............................................................................ 53
Figure 4-11. Variation of Capacitance between LV-Core (LV Axial fault). ................................ 54
Figure 4-12. Variation of Capacitance between HV-Tank (HV Axial fault)................................ 54
Figure 4-13. Variation of Inductance and Capacitance Matrices (1 and 5 MVA). ...................... 56
Figure 4-14 Effect of Axial Displacement on FRA signature (simulated by changing MHV-LV
only) (a) HV winding (b) LV winding . ......................................................................................... 57
Figure 4-15. Effect of Axial Displacement (simulated by changing Capacitance and Inductance
Matrices) on FRA signature (a) HV winding (b) LV winding, (c) LV winding FRA signature till 2
MHz .............................................................................................................................................. 59
Figure 4-16. (a) Forced buckling (LV), (b) Free buckling (HV). .................................................. 61
Figure 4-17 Buckling deformation ............................................................................................... 62
Figure 4-18. Variations of magnetic energy after deformation on top disk of HV. ..................... 64
Figure 4-19. (a) Free buckling HV winding (top, middle and bottom). (b) Force buckling LV
winding (top, middle and bottom). ............................................................................................... 65
Figure 4-20. Variations of inductance and capacitance matrices (force buckling on LV winding)
– 1MVA transformer. ................................................................................................................... 66

xi
Figure 4-21 Variation of inductance and capacitance matrices (free buckling on HV winding)-
1MVA transformer. ...................................................................................................................... 67
Figure 4-22. Free buckling at the top of the HV winding (5 MVA). ............................................ 68
Figure 4-23. Variations of inductance and capacitance matrices (free buckling on the HV winding)
- 5 MVA transformer. ................................................................................................................... 69
Figure 4-24. Effect of buckling deformations on the FRA signature (simulated by changing the
capacitance matrix only) (a) Free buckling on HV winding (b) Force buckling on LV winding 70
Figure 4-25. Effect of buckling deformations on the FRA signature (simulated by changing the
capacitance and inductance matrices) (a) Free buckling on HV winding (b) Force buckling on LV
winding. ......................................................................................................................................... 71
Figure 4-26. Disk space variations after short-circuit fault ......................................................... 74
Figure 4-27. FRA signature for Disk Space Variation ............................................................... 74
Figure 4-28. Core deformation ..................................................................................................... 76
Figure 4-29. Healthy condition (a)Variations of magnetic flux after deformation on core(b). .... 76
Figure 4-30. HV FRA signature for core deformation ................................................................. 77
Figure 4-31 Insulation System within a power transformer ........................................................ 80
Figure 4-32. 3D model of Bushing solved in electrostatic FEM solver ......................................... 81
Figure 4-33. Transformer Bushing layers and its equivalent T-model ........................................ 83
Figure 4-34. Capacitance change of the bushing T-model due to moisture content .................... 83
Figure 4-35.Variations in the oil effective capacitance value due to moisture content ................ 84
Figure 4-36. Variations in the oil conductivity due to moisture content ...................................... 84
Figure 4-37. FRA signature with and without inclusion of the bushing T-model ........................ 85
Figure 4-38. Moisture content in bushing insulation effect on FRA test...................................... 86
Figure 4-39. FRA signature with and without insulating oil ........................................................ 87
Figure 4-40. Impact of oil degradation on transformer FRA signature....................................... 87
Figure 4-41. Disk space variation fault on Phase C ...................................................................... 88
Figure 4-42 Impact of Disk space variations on the FRA signature with and without the bushing
model (add square to zoned range)............................................................................................... 89
Figure 4-43. Practical FRA signatures with and without the bushing ......................................... 89
Figure 4-44. Practical FRA signature with 2 healthy conditions of insulating oil ....................... 90
Figure 4-45. Practical FRA signature with and without insulating oil ........................................ 90

xii
LIST OF TABLES
Table 2.1. Frequency Response Analysis Bands and their sensitivity to faults ............................ 14
Table 4.1. Model parameters and the mechanical faults that influence them ............................. 46
Table 4.2- Average effect of 1% axial winding displacement (1 MVA) ....................................... 59
Table 4.3- Average effect of 1% axial winding displacement (5 MVA) ....................................... 60
Table 4.4. Average effect of 5% buckling deformation (1 MVA)................................................. 72
Table 4.5. Average effect of 5% buckling deformation (5 MVA)................................................. 72
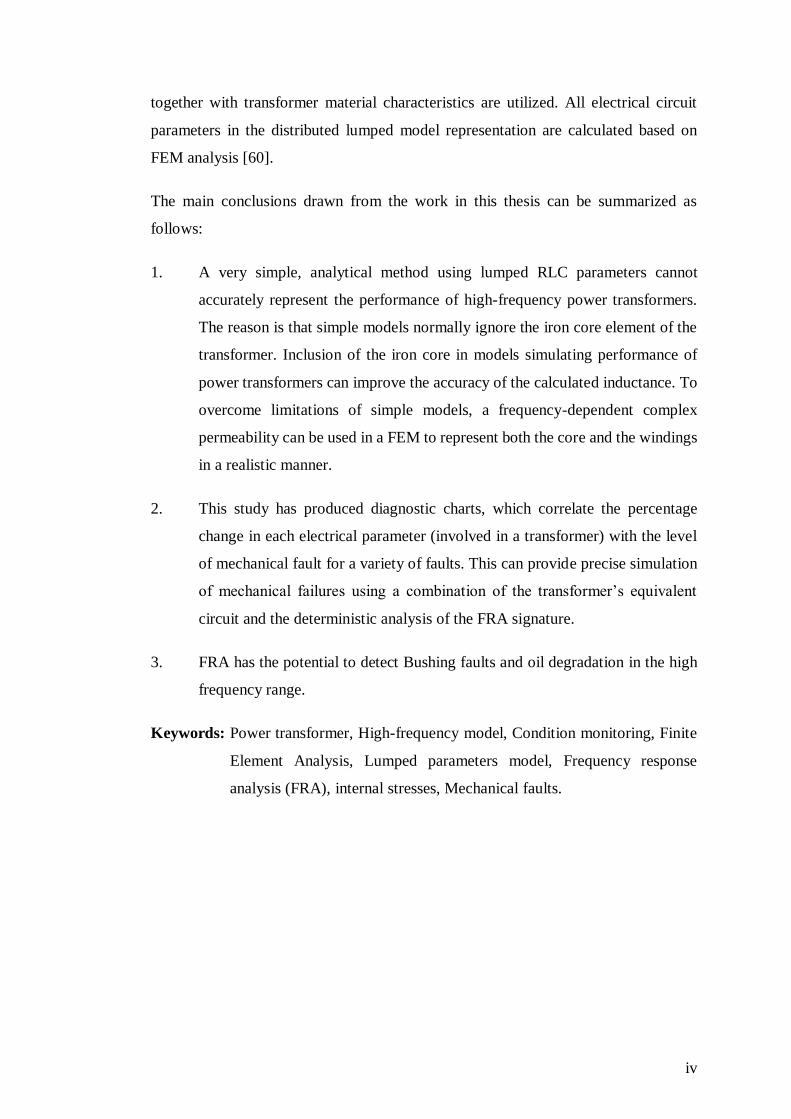
Table 4.6. Variation of Capacitance and Inductance HV and LV ............................................... 73
Table 4.7. Transformer FRA signature for disk space variation fault with and without a bushing
model ............................................................................................................................................. 88

1
1. INTRODUCTION
1.1 BACKGROUND OF RESEARCH
Power transformers are vital links and one of the most critical and expensive assets in
electrical power systems. Majority of in-service power transformers have already
exceeded their expected life span as they were mostly installed prior to 1980 [1]. This
poses a significant risk for existing utilities, since the impacts of in-service transformer
failures can be catastrophic. In addition to the risk above, the daily increase in load
demand, the global trend towards developing smart grids and the growing number of
nonlinear loads (such as smart appliances and electric vehicles) will further increase
the likelihood of unusual loads on transformers (non-sinusoidal operations) and
eventual failure. These combined effects of aging plus nonlinear and unusual loads on
transformers are increasing the rate of faults in existing networks, which renders
inspection of transformers and detection of incipient faults inevitable. Unfortunately,
current fault-detection methods are unable to detect and identify all sorts of faults
during routine condition monitoring of assets. Accordingly, there is an increasing need
for advanced methods of condition assessment that can readily detect transformers
faults so that the rate of faults can be kept at a manageable level. To this end, it is
essential to develop simple, reliable and accurate diagnostic tools that can perform the
following functions for transformers:
1. determine the current status of a transformer;
2. Diagnose and predict the failures may happen to the assets
3. Estimation of asset’s remaining life
4. Failure prevention and improve the maintenance strategy, increasing the
reliability of the power system.
5. Maintenance cost reduction and safety improvement.
The technique of Frequency Response Analysis (FRA) is one of those promising
methods that can be used to achieve the goals above, because it offers excellent
sensitivity and accuracy in detecting mechanical faults in transformer windings. An
aging transformer is more prone to mechanical deformations due to the reduction of
its capability to ride through short-circuit faults. On the other hand, less severe

2
deformations lead to partial discharges and insulation ruptures, which can normally be
detected by oil analysis. Whilst minor deformations show no important variations in
their functional characteristics, the mechanical properties of the copper winding may
be altered, seriously, risking a break during the next occurrence. This can cause
reduction in impulse strength due to degraded insulation and reduced distances. FRA
has proved to be a reliable method in both laboratory investigations and in practice[60].
However, there is little understanding about why and how FRA works and how the
FRA signature can be classified and interpreted. All interpretational characteristics
relating to FRA should be studied before standardizing this technique for the purpose
of condition monitoring of power transformers. To establish this test as a standard
method, separate or combined experimental and theoretical investigations (transformer
model) should be performed [3-5].
During the last few decades, transformer modeling has attracted much attention,
because of its importance in power networks, which are normally characterized by the
complexity of their various components. Some disagreements still exist in the literature
as to which assumptions should be permitted ideally, accurate models of transformers
would use data directly from transformers’ manufacturers, but such data is not
generally available.
1.2 SCOPE OF WORK
The main objectives of the work presented in this thesis are as follows:
• development of a high-frequency model of power transformer using a
software based on the Finite Element Method (FEM);
• investigation of the 3D model based on the actual geometry of a transformer;
• development of charts that correlate the percentage change of all the
parameters pertinent to a transformer’s equivalent circuit with levels of
winding deformations and displacement that result by mechanical faults.
Another goal in this thesis is to use the model developed for investigating the FRA
technique to study the following aspects:
• the impact of various winding deformations and displacements;
• the FRA sensitivity to different types and levels of fault;

3
• other faults that might vary the FRA-signature, such as bushing faults and oil
degradation;
• determination of the type of fault and the corresponding frequency band that
the FRA signature may be altered or modified by such fault.
The results obtained from the above investigation will be used to improve the
understanding of the FRA technique and consequently, achieve a better interpretation
of the FRA signature.
1.3 RESEARCH METHODOLOGY
This thesis introduces detailed analyses of the mechanical faults and their impacts on
the electrical parameters of the transformer detailed equivalent circuit and hence on its
FRA signature. In this regard, a comprehensive review on transformer design as well
as Frequency response analysis (FRA) technique are carried out. Then detailed
physical single-phase and three phase transformer’s geometry are simulated using 3D
finite element software to emulate real transformer operation. Finally, a guideline for
FRA signature’s interpretation is introduced.
1.4 THESIS OUTLINE
This thesis has two main parts: methodology and modelling. The subdivisions of this
thesis reflect the progress of the work when it comes to the choice of methods.
The remaining chapters of this thesis are as follows:
• Chapter 2 explains the transformer condition monitoring and modelling
including the relevant materials,
• Chapter 3 illustrates how the elementary quantities utilized for creating the
transformer model is calculated by FEM software. Then the model (High
frequency Transformer Model) is developed by using ANSYS, a FEM-based
software will be presented,
• Chapter 4 describes the results obtained from the FEM model. This chapter
explains the specific effects of mechanical faults on changing the electrical
parameters of the distributed power transformer model. In addition, the chapter
investigates the impact of mechanical failures on the signature of FRA;

4
• Chapter 5 discusses the main conclusions drawn from this work and
recommends topics for further investigation.

5
2. BACKGROUND
Power transformers are the most expensive and vital assets in a power system. It is,
therefore, highly expected that suitable care should be practiced in the commissioning
and in the preventative and detective maintenance of power transformers. Since
maintenance demands a considerable investment of time, with spare units not always
obtainable, it is important to regularly monitor the condition of the power transformers
of a network. An international survey of monitoring the condition of large power
transformers such as the one conducted by the CIGRE [6] shows that the annual
transformer failure rate is between 1% to 2%. Even though the survey shows that the
failure rate is relatively low, a single incipient fault in a large transformer normally
incurs huge losses for the overall utility. Thus, the significance of condition monitoring
of power transformers is listed as a key priority in any utility. Frequency response
analysis, FRA, is a relatively novel detective method used for evaluating the
mechanical condition of transformer windings. This technique compares the FRA
signatures obtained with baseline measurements and any variation between the two
signatures may be interpreted as potential mechanical failures. Hence, a reliable high-
frequency model of power transformer is essential to establish and interpret the
sensitivity guidelines for various mechanical failures.
Since transformer was invented, engineers have established various methods of
transformer modelling depends on the applications [7-9]. In order to verify the
accuracy of the model, the experimental work was performed as the starting point.
Then, the computer technology came into the industry and helped engineers to solve
the complex equations and problems. So the advanced computer software empowered
the engineers to use the computational logics for develop the internal voltages within
transformer windings at high frequencies[60] [6]. An appropriate technique of
modeling has been investigated in order to examine the FRA technique and to assess
various internal faults [1, 2, 10].
2.1 CONDITION MONITORING – PURPOSE AND PRACTICE
During the last decade, condition monitoring of power transformers has attracted much
attention from the utilities. Asset management and asset life expectancy have become

6
significant because financial considerations have altered the technical strategies of
power utilities. In order to decrease the costs of maintenance and increase the life
expectancy of the components at the same time, the maintenance policy has been
changed from time-based maintenance to condition-based maintenance. Since many
of the global power transformers currently in service will reach their designated
lifespan in just a few years [11] regular monitoring of the condition of these units is
very important for estimating the remaining lifespan and avoiding any incipient
failures as well as long power outages. Dr E. Bjerkan [60] categorised the failures of
power transformer into one of the following categories:
• “Defects or deficiencies that will eventually represent incipient faults;
• Problems originating from aging processes;
• Problems induced by operating conditions exceeding the transformer
capabilities.’’
Normally, transformers defects persist for some time before they lead to catastrophic
failures. Condition assessment of transformers contributes to prolonging the lifespan
based on gained experience and knowledge resulting in decisions regarding
refurbishment, replacement and retirement to be made reliably[60]. In order to
establish efficient lifespan management, a comprehensive model that calls for several
parameters is required. Therefore, comprehensive investigation is needed to identify
these parameters and assess their role in the condition of the various components of a
transformer. Some important factors which should be considered during investigation
of a transformer’s conditions are listed below [12-14].
• Insulation of windings and conductors, cellulose structure, mechanical
strength, decomposition and aging products;
• Transformer oil analysis such as dissolved gas analysis (DGA), partial
discharges (PD), etc.;
• On-load Tap Changers (OLTC);
• Core, circulating currents, Core – clamp to structure issue that causes
overheating because of faulty grounding-leads touched , overrated flux-levels,
local short-circuit faults;

7
• Winding strength condition mechanically, short circuit withstand strength,
winding displacement and deformation, Electromagnetic force and supportive
structure and clamping force;
• Bushings, oil-level, and pollution.
• Tank and components involved and cooling system.
Various diagnostic techniques have been developed by several studies to assess the
condition of the transformer and its components [6-8].These studies were
undertaken to establish statistics for power transformer faults and the types of
parameters associated with these faults. Some of the most popular power
transformer condition monitoring techniques are briefly elaborated below:
2.1.1 Condition Monitoring By Partial Discharge Analysis
When the strength of the electric field exceeds the strength of the dielectric
breakdowns of a localized area, an electrical partial discharge bridges the insulation in
between conductors as well as ground. This indicates a partial discharge (PD) activity
within the transformer [15]. The dielectric properties of insulation might be affected
significantly if it is subject to consistent partial discharge activity over a long period
of time [16-19]. In addition, if the PD activity persists and is not attended it might
ultimately lead to complete electrical failure of the system. Partial discharge activity
can be an important symptom of the deterioration of a transformer and the aging of its
insulation .Investigations of PD events in liquid dielectrics (such as oil) are not very
common and consequently are less well understood than solid dielectrics [20].
Partial discharge activity can be defined and categorized by the type of defect/fault
responsible and the area where it occurs. The range of fault classes shown in table
Table 1 [21]:
Floating
component
caused by conducting objects that have become disconnected and
acquired a floating potential
Bad contact caused by sparking, e.g. between the threads of loose nuts and bolts;
Suspended
particle caused by small, moving conducting objects or debris within the
insulating oil;
Table 1 Partial Discharge Fault Categories [21]

8
Rolling
particle
caused by particles lying on a conductive surface until they become
influenced by the electric field, causing them to roll or bounce
around
Protrusion caused by fixed, sharp metallic protrusions on HV conductors
Surface
discharge
caused by moisture ingress or as a result of interactions between
cellulose material and the insulating oil, causing surfaces to become
semiconducting
Floating
electrodes
caused by components such as stress shields that may have become
partially detached from the chamber, resulting in ineffective
bonding and capacitive sparking [22].
PD is determined and detected by using piezoelectric sensors [23, 24]. Moreover,
Optical Fiber and Ultra-High Frequency (UHF) sensors are used to detect the PD
signal [25]. In comparison with the traditional PD measurements method , the Ultra-
High Frequency (UHF) sensors are quite more sophisticated[26, 27].
The are various factors that determine the discharge type such as[28]:
• The pulse amplitude;
• The time of occurrence (point on wave) on the mains cycle;
• The number of discharges per second;
• The interval between discharges
Because of the fact that a significant number of insulation problems are induced by
partial discharge (PD), it is used extensively to monitor the condition of the
transformer insulation[29].
2.1.2 Condition Monitoring By Vibration Analysis
Vibration analysis is effective for detecting mechanical failures, and it can be used to
diagnose the transformer’s condition online, even when the transformer is electrically
connected [30-32]. Critical information can be provided by vibrations recorded on the
transformer tank under normal operational conditions [33]. Many different sources can
cause a transformer tank to vibrate. Examples of these are the windings and the core
(which contributes significantly to vibration) .Other sources of vibration include On-
Load Tap Changers (OLTCs), cooling fans and oil pumps, which can readily be
distinguished from other important components that may contribute to vibration [34-

9
36]. Both the internal core and windings can create vibrations signals that may be very
difficult and complex to model. Historical records show that winding deformations can
cause 12%-15% of transformers failures [37, 38]. Therefore, it is essential to develop
a vibration model that can reflect the status of the windings with high accuracy [39].
The process involved in using vibration analysis to monitor the condition of a
transformer can be described as follows:
Vibrations generated by windings and core spread through the transformer’s oil. The
signatures generated by the vibrations [40] reach the transformer walls, which are
picked by vibration sensors. Then accelerometers collect the vibration signals by
attaching the leads signal collectors to the all side of transformer’s walls. In the next
step the signals are recorded for a period of time from 1 hour to days. The recorded
signal are interpreted as a series of decaying burst, with each of the bursts being the
consequence of a mixture of a finite number of decaying sinusoidal waveforms [41].
Limiting vibration analysis to diagnose a few important parts may be inadequate, and
this entails more investigation to evaluate the condition of all of the transformer parts
[35, 37, 39].
2.1.3 Condition Monitoring By Dissolved Gas Analysis
Dissolved gas-in-oil analysis (DGA) is an outstanding method to detect the incipient
insulation (or concealed) faults in an oil-immersed power transformer. Some small
quantities of gases are liberated when insulating oils face abnormal electrical or
thermal stresses [20, 42, 43]. By means of DGA, it is feasible to differentiate a variety
of faults, such as PD, thermal faults or arcing in a great variety of oil-filled equipment.
The trending of gas concentration in transformer oil is crucial to determine the
incipient fault level and different types. To obtain the accurate gas concentration trend
the interval oil sampling must be performed over a period of time. This information
obtained from DGA result will then create a part of preventive maintenance plans.
Data from DGA can provide [44-46] :
• Information on the rate of fault development;
• Confirmation of the existence of faults;
• Justification for repair schedules;
• Condition monitoring data within overload [47-49].
Thermal decomposition of oil and paper produces gases such as methane, hydrogen,

10
ethylene, ethane, acetylene, CO, CO2 in addition to organic compounds, alcohols,
aldehydes and peroxide acids [49].
The concentration of fault gas in an oil sample can be used to identify and quantify
various faults. Many DGA data interpretation such as the Rogers ratio[47, 50],
Doernenburg ratio[49], IEC, [48] Logarithmic Nomograph, [51] Key gases[52] and
the Duval triangle[47, 52, 53] are currently widely used.
2.2 POWER TRANSFORMERS DESIGN
A power transformer is a none- rotating electrical equipment that uses electromotive
force (EMF) to transfer the electric power from one circuit to another with same
frequency [54]. Power transformers are essential components of a power system
which is typically designed to have a 30 year operating life. Their function is to
transform voltages to suitable levels between the generation, transmission and
distribution stages of a power system. Power transformers can be classified into three
categories based on their power ratings, small (500 to 7500kVA), medium (7500kVA
to 100MVA) and high (100MVA+) [54]. A power transformer consists of different
parts as following:
2.2.1 Cores and Windings
The active part where the transformation takes place consists of the core and the
windings. A transformer utilises the low reluctance path provided by a magnetic core
to transfer energy from one winding to another. The materials used to make the core
are normally iron and steel to reduce hysteresis loses. The limbs are made of a number
of thin core steel sheets to reduce eddy current losses and they are kept by means of
glue for the small transformers and by means of steel straps around the limbs or an
epoxy-cured stocking for large transformers.
The conductor material is generally made of copper or aluminium and they can
arranged in either disk winding, helix winding or layer-type winding [54].
2.2.2 Transformer insulation and cooling
The main insulation system of a power transformer consists of a combination of paper
and pressboard cellulose material which is immersed in mineral oil. The oil
impregnated cellulose material is of low cost and has excellent insulation properties.
It is used to insulate winding turns and is circulated in ducts for cooling purposes [54].

11
2.2.3 Transformer Tank
The active part of transformer (winding , core and clamp) are placed inside a
transformer tank . The transformer tank is filled with transformer oil and is sealed to
protect the active part against the moisture and air penetration. Other transformer’s
accessories and cooling system such as fans and radiators are mounted on transformer
tank externally [54]. Fig 2.1 shows the main components of a power transformer.
2.3 ROOTS OF MECHANICAL FAULTS IN POWER TRANSFORMER
It has been reported that transformer winding and core failures are at the top of the list
of failures. It is assumed that some dielectric defects occur due to mechanical
displacements inside the winding. Mechanical condition assessment of the winding
and the core can prevent occurrence of such faults at an earlier stage [55, 56].
2-1 Power Transformer[54]

12
Several mechanisms exist to analyse the root of mechanical failures found in
transformer windings:
• Huge short-circuit forces due to secondary short-circuited faults.
• Damage during the transport,
• Dynamic forces in service (for example, seismic forces or vibrations);
• Aging, which decreases clamping force to supportive structure and insulation,
leading to reductions in the withstand strength of dielectric insulation against
the above factors[60].
It is recommended to diagnostically detect deformations at an earlier stage before they
lead to catastrophic failures or any unexpected outages. Short-circuit forces due to
secondary faults are the most common reasons for mechanical deformations [51, 57,
58]. The main mechanical fault modes are [53]:
• Axial displacement (e.g. winding displacement completely or partially which
is called telescoping,
• Stretching and bending;
• Radial deformation (e.g. free and force buckling)[60].
Secondary faults (associated faults) are usually caused by the disruption of strand and
turn insulation, resulting in local short circuits[57]. This normally creates hot-spots
and cause partial discharges or strand ruptures, and casual gassing. The latter symptom
of gassing is where DGA usually can be used to detect and classify the fault [51, 59] .
Frequency response analysis is known as the most reliable nondestructive technique
in identifying mechanical deformation within power transformers [60].The SFRA calls
for experts to conduct the test and analyse its results. This thesis is aimed at
establishing a comprehensive interpretation guideline for SFRA signatures.
2.4 FREQUENCY RESPONSE ANALYSIS (FRA)
Frequency response analysis (FRA) is a powerful diagnostic technique currently used
to identify winding deformations within power transformers [2, 61-64] The FRA
technique is based on the fact that deformations and displacements of a transformer
winding alter its impedance and consequently its frequency response signature. The
change in the transformer’s FRA signature is used for both fault identification and
quantification.
Transformer components such as windings, core, and insulation can be represented

13
by equivalent circuits, comprising resistors, capacitors, and self or mutual inductances
whose values will be altered by a mechanical fault within the transformer. Thus the
frequency response of the relevant equivalent circuit will change. Changes in a
transformer’s geometry or in the dielectric properties of its insulating materials due to
aging or increasing water content also affect the shape of the frequency response,
especially the resonant frequencies and their damping [8]. Frequency response analysis
is an off-line technique, in which a low-voltage AC signal is injected at one terminal
of a winding and the response is measured at the other terminal of the same winding
with reference to the grounded tank. The FRA analyzer measures the transfer function,
impedance or admittance of the winding, typically over the frequency range 10 Hz to
5 MHz, and one or all of these three properties can be used for fault diagnosis. FRA
equipment can be connected to the transformer in different ways [12]–[14].
A typical FRA signature (winding transfer function in dB against frequency) is shown
in Figure 2-2 [6]. The figure shows 3 responses from the 3 phases of the same
transformer. For a normal (healthy) transformer, they should closely follow each other
(overlap). In this case, the one that stands out is indicative of abnormality on that phase.
The point is that in cases where historical data is not available, it is still possible to
reveal the fault through comparison between phases. This signature can be compared
with a previously recorded signature to detect any mechanical deformation that may
have developed between the recordings of the two signatures. A FRA diagnosis has
also been used recently to identify winding deformations in rotating machines [65, 66].
While the measurement procedure using commercial test equipment is quite simple,
skilled and experienced personnel are required to interpret the FRA signatures and
correctly identify the type and location of a fault. Although much research has been
performed on the topic of FRA signature interpretation, a reliable interpretation code
on the method has not yet been published [5]. In [66] the FRA frequency range is
subdivided into the following:

14
Figure 2-2 Typical FRA signature with shorted turns on phase C [6]
• The low frequency range (<20 kHz), within which inductive components
dominate the transformer winding response;
• the medium frequency range (20–400 kHz), within which the combination of
inductive and capacitive components results in multiple resonances;
• the high frequency range (>400 kHz), within which capacitive components
dominate the FRA signature [15].
These ranges and the associated fault types are summarized in
Table 2.2 [16], [17].
Table 2.2. Adapted Frequency Response Analysis Bands and their sensitivity to faults [6]
Frequency
band Fault sensitivity
<20 kHz Core deformation, open circuits, shorted turns and residual
magnetism, bulk winding movement, clamping structure loosening
20-400
kHz Deformation within the main or tap windings
>400 kHz Movement of the main and tap windings , ground impedance
variations
If the original transformer FRA signature in the healthy condition status is not
available, the reference signature can be either from similar transformers
(construction-based comparison) or other phases (symmetric comparison) [67]. The

15
best way to conduct study on the FRA technique is to model a comprehensive internal
transformer model. This model supports the investigation of the sensitivity and effect
of different types of faults[60][68].
The methods of shunt reactors and impulse testing were invented 60 years ago, by
examining current measurements for faults. The FRA that was first invented by Dick
and Erven [69] in 1978 is actually an improved version of impulse testing technique
[70].
2.3.1 Measurement Techniques
Currently there are no consistent, reliable guidelines for FRA signature quantification
and classification, and different signature setups are used throughout the world.
Different interpretation setups would produce different fault detection results[71].
Standardizing interpretation setups is actually inevitable. A comparison of the two
measurement techniques of low voltage impulse (LVI) and sweep frequency analysis
(SFRA) is explained in the following section [72]:
2.3.1.1 LVI (Low Voltage Impulse)
The LVI method was developed from the impulse test technique [60]. To perform the
impulse test an impulse generator applies the voltage to the one terminal of primary
winding and then the voltage is measured at the terminal on secondary winding. This
procedure was repeated simultaneously for comparison and gaining the best result.
Then the frequency domain method conversion (Fast Fourier Transform (FFT) ) is
used for converting the time domain result to frequency domain to establish the
transfer function from the ratio of the two transformed signals[73][60].
2.3.1.2 LVI Advantages [60]:
• Decreasing the measurement time can be achieved by using several
channels/transfer functions;
• In comparison with SFRA the LVI test is fast less than one minute as one set
of measurement is applied (in order to determine the average of time series a
number of impulses are injected )[74, 75][60].

16
2.3.1.3 LVI Disadvantages [60]
• It has static resolution. The result at low frequency range is not clear and
reliable specifically makes it difficult to predict the internal electrical failure.
Additionally high -pass filtering is another problem as being used to decrease
the issues with FFT;
• The accuracy of the result is dependent to the frequency range because the
injected signal power spectrum is frequency-dependent;
• Slowly decaying signals are not recorded; window-function, zero padding or
high-pass filtering is necessary;
• To perform the test different types of equipment are required like high pass ,
noise and broad band noise filters ;
• Mathematical assessment affect the results[60]
2.3.2 SFRA (Sweep Frequency Response Analysis)
This technique is performed by sweeping the desired frequency using a very low
sinusoidal voltage and it is much slower than the LVI technique. The main FRA
methods categorized by the CIGRE are as follows [76] :
2.3.2.1 High Voltage winding End-To-End Open Circuit Connection Test
In the End-to-end open circuit test, a signal is injected into the end of a winding through
the bushing and the output is measured form the other end of same winding. It is a very
common test, because of its simplicity for examining each winding separately. The
sensitivity of a wide range of FRA method connections was categorised by Satish et
al [44] The sensitivity was quantified by separately counting the number of natural
frequencies obtained during each FRA test. Among other tests, the end-to-end open
circuit test was rated as the highest level in the sensitivity group. This test can be
carried out on windings of both high voltage (HV) and low voltage (LV), as shown in
Figure 2-3[77].

17
Figure 2-3. HV winding End to End open circuit test [1]
2.3.2.2 Low Voltage Winding End-To-End Open Circuit Connection Test
This test is quite similar to the end-to-end open circuit test, but it is important to short-
circuit the other windings of the same phase. Therefore, at low frequency, the effect of
magnetising and leakage inductances dominating the lower frequency ranges is
eliminated. The outcome is close to the end-to-end open circuit test at greater
frequency ranges. Figure 2-4 shows the setup of this connection[77]
Figure 2-4. LV winding End to End open circuit
2.3.2.3 Capacitive Inter-Winding Connection Test
The capacitive test is performed by means of signal injection into the winding lead and
receiving/ measuring the signal magnitude from the end of the winding (same phase
)as shown in Figure.2-5[78]. The interwinding capacitance existing between disks of
winding affect sensitively the measurement. [78, 79]. In research conducted by

18
Jayasinhe [5] in 2006 on the sensitivity of different FRA connections and their
capabilities for diagnosing various types of faults, it was revealed that the capacitive
inter-winding test is more sensitive to the faults of radial deformation and axial
displacement than other tests. In addition, Ryder [80] proposed the capacitive inter-
winding test for its sensitivity to axial displacement on 300 MVA transformers in his
article in 2003.
Figure.2-5. Capacitive inter-winding test
2.3.2.4 Inductive Inter-Winding Connection Test
This test is conducted in the same way as the capacitive inter-winding test but the
opposite ends of both windings are connected to the ground.
2.3.3 SFRA Advantages [75]
• It gives the ability to sweep an extensive frequency range, from 10Hz -5 MHz;
• By controlling the number of frequency points, the resolution of the signature
can be improved;
• With higher resolution, the range of frequency can be divided into different
frequency bands in a range from low to high.
The FRA signature can be logarithmic or linear.
2.3.4 SFRA Disadvantages [58]
• The standard network analyser cannot determine simultaneously of several
transfer functions .

19
• SFRA is an offline test and to conduct this test, the transformer must be shut
down and disconnected from the network.
• Each measurement takes time to perform and averaging techniques are very
time-consuming.
• Low signal amplitude.
2.5 COMPARISON METHODS
A measurement is compared to a number of different references:
2.4.1 Time-Based Comparison
A signature is obtained during the factory acceptance test. This provides the best
sensitivity, because it excludes almost all natural changes. Possible aging and
temperature impacts might be observed with this technique[81].
2.4.2 Construction-Based Comparison
In this method the signature obtained is compared to the signature obtained from
identical transformers with the same construction. This comparison has a lower
sensitivity, because any small changes to the design and differences in lead layout will
influence the measurements [6].
2.4.3 Comparison Based On Symmetry[60]
The comparison measurement is used when the base line signature or factory test result
is not available. Inconsistency of signature between the phases are seen due to onload
tap changer as well as slight differences in geometry between the phases [60][82, 83].
2.4.4 Model-Based Comparison
Baseline measurement must be compared with the transformer computer model to
ensure accuracy of the latter. This method is adopted in this work for interpreting FRA
signatures.
2.6 INTERNATIONAL EXPERIENCE
Dr Bejerkan [60] discussed numerous FRA projects that were carried out at the
University of Stuttgart in Germany. They have used the LVI method exclusively:

20
• Leibfried [82, 83] did research on using switching operations to measure the
impulse excitation which led to the online monitoring technique. Leibfried
could detect the minor deformation /displacement because of switching
operations make the frequency to be very highly variable[60]. Leibfried
stablished the offline technique that is called the wide tolerance bands. It
detects the minor deformations which are seen at the upper band of high
frequency ranges beyond several MHZ [60].
• Christian [84] [85] studied three measurements based on time, design and type
among various power transformers and could establish promising statistical
foundation[60]. He also introduced an experimental system used at the
University of Stuttgart to investigate radial deformation sensitivity and axial
displacement. The overall axial displacement sensitivity is 1-2 % of the total
winding axial height. At a buckling depth of 3 % of the winding diameter at 10
% of its height, radial deformations have a sensitivity limit. These are the only
quantified sensitivities found in literature. The results showed that the voltage
ratio test were more sensitive than the Admittance measurements.
• In high-frequency models developed by Rahimpour, the sensitivities observed
by Christian were confirmed [86]-[2, 10, 87], using the same approach of
Christian’s work. He built a reduced laboratory scale models to make the easy
application of winding displacements and deformations. The core flux was
neglected because he used a slit cylinder as the transformer core [60] .
• Helsinki University in Finland has carried out a variety of experiments on
various types of transformers using the measurements from factory (standard
lightning pulse) voltage at maximum and low level [88]. Full voltage checking
requires the use of dividers, which narrowly restricts the applicable frequency
spectrum. Additionally, they applied different grounding typologies such as
establishing one point of grounding or grounding each terminal at the
flange[60].
• Many experiments were performed by the University of Stuttgart (as described
above) on similar transformers with different tapping positions and phases. In
addition, the impact of various types of windings was investigated.
Capacitances with different values were added to the windings to artificially
simulate damage such as deformations. In these experiments, the tank and core

21
were replaced by two metallic cylinders. However, the artificial damage could
not show the different degrees of deformations directly. Therefore, the
application of these results is limited.
• Wang and Vandermaar[89], [90] stated that there were significant differences
in the measured admittance above the 1 MHz for the units in the range size of
140 and 630 MVA in comparison before and after the reclamping. Wang et al.
also carried out another investigation [91] found out important characteristics
of FRA performed in the filed during the measurements. For the admittance
test the shunt impedance is important and must be applied. They applied
different range of resistant from 1 to 50 ohm to investigate the sensitivity. The
result revealed that with decreasing the shunt impedance, the sensitivity
improves. The effect of 50 ohm shunt are seen above the high frequency range
500 kHz, while for a 10 Ω shunt the impacts are seen over the very high
frequency ranges above the 3 MHz. Therefore they recommended to utilise
the current transformer rather than shunt impedance for achieving promising
result [60].
• Studies by Wang [91] on the influence of connecting cables at the top or bottom
of the bushing on FRA signature. He stated that the cables shifted lightly the
resonances and anti-resonances below 1 MHz and very notably over the 3
MHz . In addition with or without neutral grounding the FRA signature is
impacted very small above the 2 MHz and large variation in lower frequency
range. Minor local axial displacements are obviously identified above 4 MHz
but the FRA signature changes above the 7MHz for the small buckling
deformations. The biggest variation is detected above 1 MHz for connecting
different lengths of the measurement leads. They concluded that the lengths of
the measurement leads affect the FRA response and should be as short as
possible. In addition, their conclusion shows that the size of the transformer
should be considered as the bushing’s size limits the upper usable frequency
owing to the increasing length of the leads [60].
• ERA [92] investigated the utilization of an LVI technique in winding
deformation and displacement was stated to be effective application of FRA.
Their experience underscores that extreme winding disruption does not
necessarily cause secondary effects, such as broken conductors or poor
insulation resistance, and that significant distortions can occur without

22
affecting normal power frequency output. They emphasized the need for
FRA[60].
• Very famous companies ‘’Dobble and Omicron’’ provide FRA tools for
implementing the SFRA test. They have made a very comprehensive user
guidance based on many years experience from filed and academic research on
FRA method which is accessible to most of users. They run transformer
workshop around the world to support and train the users for diagnostic and
FRA interpretation. They train users how to connect the FRA tool to the
transformer and distinguish healthy and non-healthy status and which type of
connections is applied to differentiate regular differences from faulty
anomalies due to mechanical or electrical failures [60].
• In their user guidance for one of the instruments [93] applicable to FRA
measurements, they draw on wide-ranging experience. The application
examples indicate transformers in both healthy and faulty condition, which
connections should be applied and how to distinguish normal variations from
faulty deviations due to mechanical or electrical failures[60].
• Høidalen [94] conducted experiments on radial and axial faults on a 35 MVA
single-phase transformer. He recorded low sensitivity to both axial and radial
faults during the experiments. The buckling deformation occurred locally
within 1%-3% of the winding height, whereas the outer winding was displaced
axially at 5% of the total winding height. The researcher also studied the impact
of transformer oil and bushing type and size as well as tank on FRA signature.
In addition he found that the winding type affect the FRA sensitivity, two
windings on each legs of core and one on the middle leg have sensitivity on
FRA signature [60].
2.7 ALTERNATIVE TECHNIQUES
As stated earlier, the other electrical test such as winding resistance, turn ratio stray
inductance and impedance measurements tests do not have the accuracy to detect the
mechanical deformations in transformers with adequate sensitivity [60]. These
techniques have a rate of inaccuracy of 2% or more [95].During the last decade, the
Frequency Response Stray Losses (FRSL) [95] technique, which is a newer and
simpler technique than FRA, was developed. In this technique, the stray losses in the

23
frequency range of 10 Hz to 1 kHz are measured. It is reported that the FRSL method
can readily diagnose and interpret deformations with less dependency on the
measurement-setup than FRA, because the method operates within a low frequency
range. Other methods such as vibro-acoustic techniques for detecting winding
slackness and other clamping defects related to the windings and core are casually used
[96], [97]-[96].Finally, there is a special application for detecting buckling
deformations of the winding called “ultrasonic measurements” for in-service
assessments [96].
2.8 FRA SUMMARY
As revealed from scrutinizing the literature, it is essential to have interpretational
guidelines and criteria to interpret FRA results. In order to establish a comprehensive
guideline for FRA, a detailed study considering actual transformer geometries is
urgently needed through a computer model.
In addition, and as iterated above, standardizing the equipment and methods for FRA
testing is recommended.
Fortunately, the literature indicates that most the mechanical failures are diagnosable
with the limitation that minor damage is diagnosed at frequencies where the inherent
limitation of the measuring devices can affect the results. This is obviously a
restriction, reflecting the need to perform more comprehensive investigations into this
area. Apparently, the LVI technique is not as sensitive as SFRA method. The very
small winding deformation are seen and detected over the high frequency range above
1 MHz, which endorses the SFRA method. However, the limitations such as frequency
range and dynamic performance in terms of in terms of noise and digitizing problems
are very obvious in LVI technique. Minimizing the loops of the measurement-leads
connected to the bushings is important. It should be noted, that FRA is not yet totally
accepted by the industry as a diagnostic method [60].
2.9 TRANSFORMER MODELLING
For decades, simple analytical methods have been utilized widely in transformer
modelling. Such approaches are assumed to have some limitations related to details of
transformer geometry. However, these methods are investigated due to their
convenience for studying of winding deformation [60].

24
Due to the absence of a reliable and reproducible technique, existing methods are used
despite of their limitations and disadvantages. However, these methods can be used as
a basis for developing a new, reliable fault detecting technique.
2.8.1 Inductance Calculation
In [1], [39] the authors explained about the calculation of inductance, discussed the its
analysis and some explanation of transformer design. The transformer models are
classified as [60]:
2.8.1.1 Modelling Based On Self and Mutual Inductances
This model is based on a lather network. Weed [86] was the first researcher proposed
the modelling based on self and mutual inductances, and he neglected the mutual
inductances [60]. He confirmed the model experimentally, included the losses and
modified the inductance using the empirical data [60]. Wilcox has recently improved
the model by including the core and winding losses [98], [99]. The report shows that
modelling based on self and mutual inductance is accurate for calculating the passive
components self and mutual inductances of winding , turn to turn and oven the compact
disks. To model the high frequency transformer model , this approach has advantages
and was used in earlier sensitivity-analysis of FRA [99].
2.8.1.2 Modelling Based On Leakage Inductance
This approach was proposed by Blume[100] following which the method was
improved by McWirther [101] and Shipley [102]. The method is used to represent the
leakage inductance of the transformer at low frequencies; however the behaviour of
core- properties in the low frequency ranges are not considered properly. This
technique is good enough to show the short-circuited issues at low frequency ranges
and has the ability to be expanded for the mid to high frequency ranges [60] [103].
2.8.1.3 Transmission Line Modelling
The method was initiated by Wagner [104]. The transformer winding is modelled as a
multi-conductor transmission-line.
2.8.1.4 Modelling Based On Terminal Measurements (Black-Box Modelling)
This is not an appropriate method for the investigation of geometrical influences such
as mechanical failures in windings, because of its nonphysical nature. This method is
still applied for domain models into time domain[105].

25
2.8.1.5 Analysis Based On Electromagnetic Fields
This type of modelling is not different to the black box modelling, but it can establish
the transformer paraments. This model is used by transformer designer to calculate the
design paraments using the electromagnetic field for large power transformer [60].
Finite element method (FEM) is the most accepted numerical solution for field
problems [106]. As the method has been developed over the years using the FEM
(finite element modelling ), most of transformer manufactures and designer agreed that
3D FEM model is very essential to calculate transformer parameters in the design
process (e.g. such as the evaluation of eddy-current stray losses ) [60] [107].
So far, the methods explained above have issues with calculating the winding
inductances for the transformer modelling. It should be considered that there are other
elements in transformer modelling that behave in high frequency ranges which are
briefly explained as follows [60]:
2.8.2 Capacitance Calculation
Capacitances are one of the components in transformers modelling which can be
calculated by the conventional mathematics approach or using the advanced
computerized approach like FEA [60] where the geometry and material parameters are
important and can be included [108]. Shunt capacitances (capacitance between
windings and from winding to ground) can be calculated by simplifying the
transformer geometry and analytical formulas. In addition the capacitance between
transformer winding disks is called series capacitance. It determines the electrostatic
voltage distribution. More details for the calculation of this parameter can be found in
[60].
2.8.3 Losses
Consideration of losses in transformer fault detection model is demanding,
predominantly in factory test where the internal stresses evaluated in order to prove
the transformer design [60]. Without the consideration of the losses, the stresses
predicted by the simulation will be higher than in reality, leading to a design that is
both costly and less competitive [60].
There are various loss-mechanisms in a transformer, as follows:
• DC-resistance of windings;

26
• Frequency dependent losses in the conductors due to eddy currents; eddy
currents cause skin effect and Proximity effect ;
• Core magnetic field that create eddy currents in core laminations;
• Insulation dielectric losses for series- and shunt conductance.
2.8.4 Iron Core
Depending on the application, transformer modeling is divided into two different
paths. In order to handle the nonlinear influences such as saturation and hysteresis
effects of core, the time-domain models have been developed for the frequency range
of slow transient from 50Hz to 10 kHz. Since it is assumed that the behavior of
transformers in the high-frequency range is linear, high-frequency models are typically
applied in the frequency domain .Many studies have shown [109] that although the
iron core was neglected in high-frequency transformer models, reasonable results of
fault detection were obtained.
2.10 MODELLING ACCURACY
If the transformer design paraments and construction are available, modelling the high-
frequency transformer models will not be that much difficult and can be improved at
the highest degree of accuracy. To develop very detailed internal transformer model
the construction details are required. The high frequency transformer model needs the
accurate parameters like size of windings, the distance between the windings , winding
to core and windings to tank and also other component like bushings, tap-changer,
connections, leads, etc. The effect of these component are seen on high frequency
range of FRA signature [60].
Dr Bjerkan discussed some of research did by Rahimpour [60]. He introduced a new
approach [10] which is based on analytical air-core theory. Rahimpour proved that the
all flux is displaced from the core above 10 kHz. It seems that Rahimpour’s approach
is more accurate for high frequency transformer modelling in comparison with
terminal measurements model [60]. Rahimpour applied his method on various
windings to investigate different mechanical failures such as axial displacement, radial
deformation, disk variation and turn to turns short circuits (one for each application,
in experimental work carried out by Christian[85]) [60].
Rahimpour also confirmed his practical results with analytical theory to develop the
FRA sensitivity analysis. His final results show that there is a promising correlation

27
between the developed transformer model and measurements [60] .
De Leon’s approach [110] performed some practical measurements along with theory
approach based on the magnetic field analytical equations. In his approach he injected
a current inside the core to adjust the leakage field with some limitations like requiring
of calibration [60]. He could establish turn-to-turn parameters which are reduced to a
terminal equivalent. In his approach the calculation of losses is based on turn to turn
but they are represented by a Foster-equivalent at the terminals. It is found that all
terminal behaviour is related to the internal representation which makes the accuracy
of his approach very low and questionable. De Leon applied his method on simple
and small transformer construction with layer winding type. Although he tried to
develop the method, the results show that there is no agreement between the theory
model and measurement for the transfer function and was not in satisfactory level. It
was concluded that his method is appropriate for very simple transformer design on
theory base discussion and failed for the field power transformer with complicated
design construction [60].
There are some methods that the researchers claimed confirmation between analytical
model and measurements based on time domain method [60] [111], [112]. They
compared the simulation result with measurements in time domain. To investigate the
transformer behaviour in frequency domain these methods are not suitable for
detection of mechanical failures inside the transformer and are not appropriate for high
frequency model analysis [60].
Dr Bjerkan discussed Fergestad’s work [60] that he[113] performed some practical
measurements and could achieve some promising results in line with time-domain
responses, however some corrections are required for the inductance calculation. In
addition, all losses are added on an empirical basis.
Dr Bjekan [60] said that Wilcox et al. [114], [99] could measure the value of
inductances for iron cores. However, for different core materials the new set of
calculations is required to establish the different parameters. In addition, the formulas
seem to be difficult to implement numerically. Mombello also performed some
research on formulas for the calculation of inductance- [115].
2.11 CONCLUSIONS
Transformer condition-based monitoring is one the significate topic for transformer
asset management for the industries and utilities. It has led to novel techniques for

28
detecting very incipient failures such as mechanical faults. Normal operation of power
transformers may not be degraded by such failures, but their presence over a long
period of time might lead to short circuits and over voltages, which damage the
windings severely. A few studies were undertaken to investigate the sensitivities and
drawbacks of this technique. To this end, high-frequency transformer modelling based
on construction information seems to be an appropriate approach to examine the
sensitivities and drawbacks of the FRA method. In addition, this approach can show
the effect of the different mechanical failures on the FRA signature[116].

29
3. FINITE ELEMENT ANALYSIS
These days in order resolve very difficult engineering problems in the field of Thermal
electromagnetics, fluid flow, structural, , acoustic, widely engineers and scientists and
researchers take advantage of a very advanced tool which is called Finite element
analysis (FEA) [120]. FEA method uses advanced mathematical/numerical analysis
method to solve the Currently the finite element method is clearly the dominant
numerical analysis method for the simulation of physical field distributions, with
success not paralleled by any other numerical technique. In essence, the finite element
method finds the solution to any engineering problem that can be described by a finite
set of spatial partial derivative equations with appropriate boundary and initial
conditions. It is used to solve problems for an extremely wide variety of static, steady
state, and transient engineering applications from diverse sectors such as automotive,
aerospace, nuclear, biomedical, etc.
The FEA method features a strong hypothetical establishment. It is based on
mathematical hypotheses that ensure an asymptotic increment within the exactness of
the field calculation towards the precise arrangement as the estimate of the limited
components utilized within the arrangement handle diminishes. For time-domain
arrangements, the spatial discretization of the issue must be refined in a way facilitated
with the time steps of the calculation agreeing to evaluated time constants of the
arrangement[120].
Maxwell [120] solves the electromagnetic field issues by understanding Maxwell's
conditions in a limited locale of space with fitting boundary conditions and, when
fundamental, with user-specified starting conditions, in arrange to get a arrangement
with ensured uniqueness. In arrange to get the set of logarithmic conditions to be
unraveled, the geometry of the issue is discretised into tetrahedral components (for 3D
problems)[78]. A mesher code meshes the model automatically. Assembly of all
tetrahedral is referred to as the finite element mesh of the model or simply, the mesh.
Inside each tetrahedron, the unknown characteristics for the field being calculated are
represented as polynomials of a second order degree[120]. Thus, in regions with rapid
spatial field variations, the mesh density needs to be increased for good solution

30
accuracy (see Figure 3-1 for an example of adaptive mesh refinement).
Figure 3-1. Mesh shown on the Transformer core
In the 3D Model, the solver uses the Maxwell formulation. Motion (translational or
cylindrical/non-cylindrical rotation) is allowed, excitations, currents and/or voltages-
can assume arbitrary shapes as functions of time, and nonlinear BH material
dependencies can also be modelled. The support of voltage excitations for the windings
means that the winding currents are unknown and thus the formulation has to be
modified slightly to allow Maxwell to account for source fields resulting from unknown
currents in voltage - driven solid conductors (where eddy effects are evaluated) and in
voltage-driven stranded conductors - where the eddy effects (such as skin and proximity
effects) are ignored. Also for a simpler formulation of problems where motion is
involved, Maxwell adopts a particular convention using the fixed coordinate system for
Maxwell's equations in the moving and the stationary part of the model. Thus, the
motion term is completely eliminated for the translational type of motion while for the
rotational type of motion a simpler formulation is obtained by using a cylindrical
coordinate system with the z axis aligned with the actual rotation axis[79] .
The formulation used by Maxwell transient module supports Master-Slave boundary
conditions and motion-induced eddy currents throughout the model, for both stationary
and moving parts. Mechanical equations associated with the rigid-body moving parts

31
allow complex formulation with the electric circuits being strongly coupled with the
finite element part and also coupled with the mechanical elements whenever transient
mechanical effects are included by users in the solution. In this case the electromagnetic
force/torque is calculated using the virtual work approach. For problems involving
rotational types of motion, a "sliding band" type of approach is followed and thus no
re-meshing is performed during the simulation. For translational types of motion, the
mesh in the band object (surrounding the part in motion) needs to be re-created at each
time step with a degree of refinement that is dependent upon the mesh size in the
moving object. In this latter case, the mesh in both stationary and moving objects
remains unchanged as initially created by the user. For transient types of
electromagnetic field analysis (with or without motion), the user is responsible for
creating the mesh that is capable of "catching" the respective physics such as skin and
proximity effects (if any) -when they are present in the resulting fields.
The following three Maxwell's equations are being used in the programmer[121] :
)(EH = (1)
t
BE
−= (2)
= D (3)
Where the following two equations directly result from the above equations:
01
=
+
t
BH
(4)
0= B (5)
where σ is the electric conductivity, ε the dielectric permittivity, μ the magnetic
permeability, B is the magnetic flux density and H is the magnetic flux intensity.
The result is a formulation where vector fields are represented by first order edge
elements and scalar fields are represented by second order nodal unknowns. Field
equations are coupled with circuit equations for both solid and stranded conductors,
because, in the case of applied voltage supplies, the currents are unknown [117, 118].
For the case of voltage-driven solid conductors, the following equation is used to
account for the Ohmic drop across the i-th conductor loop:
+=)(
0 )(iRC
IRi dRBVEJV (6)
where J0i represents the current density.
The induced voltage can be derived from the following equation:

32
−= BdRHe ii * (7)
where the integration is performed over the whole conductor region.
Stranded conductors are assumed to be free from induced eddy currents, and, thus, are
placed in the non-conducting region. This means that, for the purpose of calculating the
Ohmic voltage drop, the same procedure cannot be used as for solid conductors.
Instead, a lumped parameter is used to represent the DC resistance of the winding.
Induced voltage is obtained as a result of the total flux linkage in way that is similar to
solid conductors. In both cases, it is also possible to add an external inductance and
capacitance.
For the nonlinearities allowed in 3D transient applications, the classical Newton-
Raphson algorithm is used to solve the equilibrium equations.
The transient solver in Maxwell supports the coil terminals and winding definitions.
Thus it is possible in the model to specify the number of turns of coils that is necessary
for the calculation of critical engineering parameters such as flux linkage and back EMF
of coils. After calculation, the 3D transient solver produces a number of quantities
automatically and displays them as 2D plots (functions of time; these plots are voltage
(current), flux linkage and back emf. Other global quantities can also be calculated by
the 3D transient solver and displayed as 2D plots; examples are power loss, core loss,
stranded loss, and electromechanical quantities such as force/torque, speed and
displacement.
The 3D (frequency domain or harmonic solver) uses Maxwell formulation for analysis.
It is based on the assumption that all electromagnetic fields pulsate at the same
frequency (specified by the user) and have magnitudes and initial phase angles
calculated by Maxwell. There are no moving objects (velocity is zero everywhere).
Permanent magnets cannot be part of the model, and all materials are assumed to be
linear. Electromagnetic radiation can also be simulated.
In the non-conducting regions, the magnetic field strength is given by the following
equation:
+=→→
PHH (8)
In regions with non-zero conductivity where eddy current calculation has been set up,
the following equation where the electric vector potential is calculated using edge
elements is true:
→→→
++= THH P (9)

33
At the interface between conductors and non-conductors, the tangential component of
the electric vector potential is constrained to zero. The quantity calculated by Maxwell
in this case is the magnetic field H(x,y,z,t). Typical sources for eddy current problems
include current and current density. In applying the sources for the magnetic field
problems, the applied current distribution must be divergence free in the entire space of
the solution as it is physical for (quasi) stationary conduction current density
distributions. Thus, the conduction path (s) for the applied current distributions must be
closed when totally contained within the solution space for the problem or must begin
and end at the boundaries. The total current applied to conductors that touch the
boundaries does not require existence of the terminals at the ends where the current is
applied; in this case, the respective planar surfaces of the conductors in the plane of the
region (background) can be used to apply the excitations.
The insulating boundary condition is of particular use for applications where very thin
insulating layers are impractical to model due, for example, to high aspect ratio
geometries that would be generated in association with meshing difficulties. Thus
insulating boundary conditions can be assigned to surfaces of separation between
conductors. Another remarkable situation where such a boundary condition proves to
be extremely useful is in modelling faults in conductors (cracks for example). Thus,
modelling 2D (sheet) objects at the location of the respective cracks and applying the
insulation boundary condition proves to be a very effective way of modelling the flaws
without having to generate 3D cracks that would be difficult and impractical to mesh.
3.1 PARAMETER CALCULATION
3.1.1 Inductance and Resistance Matrices Calculation
To compute an inductance matrix, the software performs a sequence of magnetostatic
field simulations. In each field simulation, one ampere is allowed to flow in a single
conductor[60, 81]. For an n-conductor system, n field simulations are automatically
performed. The energy stored in the magnetic field that couples two conductors is:
= dHBW jiij2
1 (10)
where Wij is the energy stored in the magnetic field linking conductor i with conductor
j., Ii is the current in conductor I, Bi is the magnetic flux density where one ampere is
allowed to flow through conductor i andHj is the magnetic field where one ampere is

34
allowed to flow through conductor j.
The inductance coupling conductors i and j is therefore:
== dHBI
WL ji
ij
ij 2
2
(11)
For multi-turn conductors, the net value of inductance is the value given by:
matrixnet LNL 2= (12)
where N is the number of turns in the coil.
By solving the 3D model, winding resistance and inductance can be estimated using the
energy balance method as shown below:
2/)(2 iiiii IjWlmL = (13)
2/)Re(2 iiiii IjWwR = (14)
where 𝐿𝑖𝑖 and 𝑅𝑖𝑖 are the self-inductance and resistance of the ith section, respectively,
and 𝑊𝑖𝑖 is the magnetic energy when current I is applied to the ith section of the winding.
Mutual inductance and resistance between ith and jth winding sections can be calculated
using the parameters obtained in equations (15) and (16) along with additional solution
for energy stored when current is applied to both winding sections [60, 119].
ij
jjjiiiijmagji
ijII
ILILWnn
M.
.2
1.
2
1Re.. 22
, −−
=
(15)
ij
jjjiiiijmagji
ijII
IRIRWnn
R.
.2
1.
2
1Im... 22
, −−
=
(16)
where 𝑊𝑖𝑗 is the entire magnetic energy when currents 𝐼𝑖 and 𝐼𝑗 are applied to winding
sections i and j, respectively.
L11
L22
L33
L13 L12
L23 13C C1012C
20C30C
23C
I1
I2
I3
ΔV1
ΔV2
ΔV3
Figure 3-2. Inductance/capacitance matrix configurations for a three disks winding
Given the three current loops shown in Figure 3-2, the relationship between induced
flux and currents can be expressed in the following matrix form:

35
[𝜆1
𝜆2
𝜆3
] = [𝐿11 𝐿12 𝐿13
𝐿21 𝐿22 𝐿23
𝐿31 𝐿32 𝐿33
] [𝑖1
𝑖2
𝑖3
] (17)
3.1.2. Capacitance Matrix Calculation
Similar to inductance-calculation, capacitance can be calculated using the electrostatic
energy 𝑊𝑒𝑙 .
2
2
1CVWel = (18)
The capacitances between disks/windings are calculated as below:
ij
jjjiijel
ijVV
CVCVW
Cii
.
2
1.
2
1Re 22
, −−
= (19)
2
,Re2
i
iiel
iiV
WC = (20)
A capacitance matrix represents the charge coupling within a group of conductors.
Given a ground reference for the three conductors shown Figure 3-2, the net charge on
each object is [120]:
[Q1
Q2
Q3
] =
[C10 + C12 + C13 −C12 −C13
−C21 C20 + C21 + C23 −C23
−C31 −C32 C30 + C31 + C32
] [V1
V2
V3
] (21)
Any change in the winding geometry due to faults will lead to alteration of the
capacitive and inductive elements of the transformer’s equivalent.
3.2 COUPLING MAXWELL DESIGNS WITH ANSYS STRUCTURAL
Stress feedback coupling between Maxwell and ANSYS Structural is supported via the
Workbench [120]. Stress feedback is supported for Maxwell magnetostatic, eddy
current and transient types. The design and geometry must be set up appropriately. The
process for stress feedback coupling between Maxwell and ANSYS Structural helps to
accurately estimate the resultant mechanical forces considering structural
characteristics of the system in the form of stress distribution and displacement of the

36
windings as well as heat losses.
3.3 TRANSFORMER CONSTRUCTION USED IN FEA
3.3.1 Core Characteristics
In order to design the transformer core, some factors should be considered like voltage,
current and frequency and in addition to those factors cost of core’s construction
should be taken into account. The core is commonly made from some soft materials
like steel and soft iron. Using these materials depends on transformer size and its
application. For the applications in the range of high frequency above 20kHz ,the air -
core transformer is utilised while the iron-core transformers is used when the voltage
has frequency less than 20 kHz[121]. In order to design small distribution transformer
, the soft iron-core is suggested and beneficial for the reduction in physical size of
transformer and increasing the efficiency. The power is transferred more efficient by
iron -core transformer in comparison with air-core transformer. The heat is dissipated
easily and the eddy current is reduced in a transformer core with laminated sheets of
steel [122].
Some non-conducting materials such as varnish are placed between the laminations of
transformer core (see Figure 3-3). As explained above the transformer core is
laminated into many very thin layers for reduction of eddy current losses. The best
transfer of power and having the highest efficiency happen for a transformer core
which can create a smoother path that allow the most lines of magnetic flux moving
on the core in order to achieve the least loss in electrical and magnetic energy.
Figure 3-3. Transformer core with laminated sheet[54]
3.3.2 Shell and Core Type Transformer

37
Shell type transformers are the most popular and efficient transformer core as shown
in Figure 3-4.Error! Reference source not found. The core is designed in shape
sections of E- and I – In order to form the laminations these sections are stuck together
and insulation is placed between laminations. Then in the last stage of manufacturing,
they get pressed together. In core type each phase is provided with a core of single
magnetic circuit together with winding applied around it. On the other hand, more than
two shells of magnetic circuit surround the windings in shell type[123].
Figure 3-4. Shell type transformers[54]
3.3.3 Windings Conductor
The windings of power transformers are usually wound in rectangular-shaped
conductors for efficient use of the available space as shown in 3-5. Even in small
distribution transformers, rectangular-shaped conductors are used to increase the space
factor in the core window[124]. To reduce eddy current losses in the windings, the
conductor area should be increased and divided into two or more parallel elements. A
rectangular-shaped conductor is called a strand and each conductor is insulated with
paper and enamel lacquer.

38
3-5. Rectangular shape conductor[54]
3.3.4 Winding Types
There are four types of winding design as follows[78]:
3.3.4.1 Layer Winding
Shell type transformers are commonly designed with layers winding type. As the HV
and LV coils are placed on the same magnetic axis or leg, the short circuit impedance
is more easily controlled. In addition, the leakage flux is decreased, and the mutual
inductance is increased. Increasing the number of sandwiched coils can reduce the
reactance substantially [122]. The cooling of windings is improved in transformers with
circular core and coil winding type with many winding layers. The oil is circulated
around and between windings layers but not expected to reach to every layers and
conductors. In comparison with rectangular core and winding type , the space factors,
insulation and cooling system is more improved. However, it is not as good as a disk
and helical circular core and coil construction. Figure 3-6. shows the construction of a
circular core and coil winding with the utilization of layer windings.

39
Figure 3-6. Layer winding type[54]
3.3.4.2 Helical Windings
One very common cylindrical coil arrangement is the helical winding (Figure 3-7).
This is made of a large cross-section rectangular conductor wound on its side. The coil
progresses as a helix that is commonly used for LV windings. The insulation
requirement also is not too high. Between layers no insulation (other than conductor
insulation) is needed, as the voltage between layers is low. The complexity of this type
of winding rapidly increases as the current to be handled increases. The conductor
cross-section becomes too large and difficult to handle and the eddy current losses in
the conductor rapidly increase[123]. Hence two or more conductors have to be wound
and connected in parallel. The parallel circuits introduce problems of current sharing
between the circuits. Transpositions of the parallel paths have to be adopted to reduce
unequal current distribution. The modern practice is to use continuously transposed
and bunched conductors. The helical winding is the preferred concept when the
number of turns and the total amount of current permit. The quality of conducting
material that can fitted inside a given volume is high compared to other types of
winding. It is said that helical windings have a high space factor, which is beneficial
for an overall total mass-total loss relation. Moreover, it is mechanically robust and
easy to manufacture, particularly when continuously transposed cable is used[54].

40
Figure 3-7. Helical winding type[54]
3.3.4.3 Disk Windings
Disk coils consist of conductors wound in a spiral from the centre outwards (Figure
3-8). Alternating disks spiral from the outside towards the centre. Sectional disks or
continuous disks may be used. These have excellent thermal properties and the
behaviour of the winding is highly predictable. Winding of a continuous disk requires
specialized skills.
Figure 3-8 Disk winding type[54]

41
4. INTERPRETATION OF FREQUENCY
RESPONSE ANALYSIS (FRA)
In this chapter, the basic features of the FRA concept are investigated. Furthermore, the
chapter discusses how different types of winding movement and deformation can be
diagnosed by FRA. Also, the chapter discusses the outlook of FRA interpretation and
presents some recommendations for further developments.
4.1 BASIC FEATURES OF END-TO-END FRA RESPONSES
The behaviour of a single winding at low frequency is like that of an inductive
element, whereby the end-to-end FRA response magnitude tends to fall until the
frequency increases with a linear decreasing gradient of about 20dB per decade. The
FRA magnitude reduces when the core inductance is larger. The magnetization
inductance (Lm) can be calculated as Lm=N2/R, where N is the number of turns of
the winding, and R is the reluctance of the magnetic path. Thus, the FRA responses
of a transformer with high voltage and large power ratings typically have low
magnitude to initiate with at low frequencies, and within the same transformer, and
due to the turn ratio, the high-voltage (HV) winding FRA response has a lower
magnitude than the low-voltage (LV) winding FRA response. In addition, the FRA
response of the middle-phase winding for a three-phase transformer at low
frequencies is quite different from the response associated with other phases[125,
126]. This is because of the difference of the magnetic path between the middle phase
and other phases. The behaviour of a single winding at high frequency range is similar
as a capacitive element. The mutual inductive couplings between windings affect the
FRA signature resonances within mid- to high-frequency ranges. The mid-frequency
range is affected by the combination of winding leakage inductance and series
capacitance (LC paralleled). This combination creates anti-resonances at some
certain frequencies on the end-to-end FRA response. These anti-resonances manifest
themselves as a local minimum or so-called “valley” with a large negative decibel
value. On the other hand, LC in series produces a series resonance that amplify the
signal at specific frequencies on the end-to-end FRA signature response of a cascaded

42
LC network. These resonances manifest themselves as a local maximum or so-called
“peak” with a slight negative decibel value[85]. The conductive and dielectric losses
affect the FRA response signature by decreasing the sharpness of the resonances and
the anti-resonances. Figure 4-1 shows the basic trends and features of FRA signature
responses.
Figure 4-1 Fundamental trends and features of FRA responses.
Figure 4-2 N-Stage Transformer Winding Lumped Ladder Network[126]
A regular designed winding can be indicated by a n-stage ladder network as shown in
Figure 4-2.The winding consists of leakage inductance, series and shunt capacitances
which evenly distributed among the n stages. Equations 21 and 22 calculate the voltage
and current at any point on the network [74, 125, 126].
)sinh()cosh(),( rxBrxAjxu += (21)
)]cosh()sinh([1
),( rxBrxAZ
jxi += (22)

43
Where, 2
2
22
1
s
g
LC
n
LC
r−
−
= and 21( sg LCC
LZ
−= .
, where X is the number of stages along the winding, A and B are constants, Z is the
impedance and r is the propagation constant of the winding. At both ends of the
winding, the boundary conditions for FRA measurements are:
Aju =),0( , )0( =x (23)
0)sinh()cosh(),( =+= rnBrnAjxu )( nx = (24)
It is assumed that the impedance of 50Ω connected at the end of the winding is much
smaller than the total equivalent winding impedance. The end-to-end FRA response can
be derived as:
)sinh(
1
)sinh(
)(cosh)(sinh1
),0(
),( 22
rnZrn
rnrn
Zju
jni −=
−=
(25)
The end-to-end FRA response is divided into three different frequency regions.
=
=
,)sinh(
1
,01
,)sin(
),0(
),(
rnZj
nrZ
j
ju
jni
s
s
S
LCf
LCf
LCf
2
1
2
1
2
1
=
(26)
In the frequency region where < 1/2π√LCs , the FRA response is dominated by
inductive components and sin(|r| n)is oscillating between [-1,1]. When sin (|r| n)=0 ,
some local resonances are created at the frqeuncies as :
2
2)(2 LCkLC
kfk
g
+=
and krn = 1,...,2,1 −= nk (27)
It is seen from (27) that leakage inductances L , series capacitances CS and shunt
capacitances Cg affect the resonances of FRA response of an electric equivalent
network made from distributed parameters .In the frequency range where = 1/2π√LCs
, anti-resonant frequencies are produced and the magnitude drops sharply to the greatest
negative decibel value .However, when f > 1/2π√LCs , the FRA response behaves
capacitively and the magnitude trend increasing.

44
4.2 TRANSFORMER MODEL (DISTRIBUTED PARAMETER MODEL)
Maxwell software of ANSYS [120]is used to simulate the transformer model geometry
shown in Figure 4-3(a) and (b). The model consists of a metal shield core and
pressboard spacers between LV and HV windings. In order to maintain the exact
position of the low voltage winding, pressboard spacers are placed on core insulation.
The 3D transformer model is solved in magnetostatic and electrostatic solvers using
Maxwell’s equations to extract the inductance and capacitance matrices. Since the
vector potential formulation can be easily correlated to both flux and magnetic energy,
it is used to solve magnetic problems in FEM and is chosen based on Maxwell’s fourth
equation [61]. Windings resistance is calculated using eddy current solver because of
its dependency on the frequency. The complexity of the model is reduced by lumping
several turns into one electrical element. In order to design the transformer distributed
parameters model, depending on transformer size, modelling a single disk as the
smallest part of the coil /winding and discretising it to the entire winding/coil is
sufficient for a model up to 2 MHZ . On the other hand, the real transformer has 2 or 3
HV, LV and TR windings and each winding has several turns. Therefore the parameters
distributed entire the windings and each turn has consists magnetic and electrical
characteristics that called passive parameters inductive, capacitive and resistive [60].
When several turns are combined into one electrical lumped element, these parameters
are merged. All mutual parameters are considered for the disk as one element [60]. This
principle is the same for other winding configurations. The equivalent transformer
lumped-parameters electrical model is shown in Figure 4-4. In the model, HV and LV
windings are represented by series resistance (Rs) and inductance (Ls) shunted by
capacitor (Cs) and conductance (Gs). The capacitance between HV winding and LV
winding (CHL) shunted by dielectric conductance (GHL) simulates the insulations
between the two windings. Also, the mutual inductances (M) between relevant coils are
represented. The dielectric insulation between the LV winding and the earthed core and
that is between the HV winding and the earthed tank are simulated by a capacitance
(Cg) and dielectric conductance (Gg).

45
(a)
(b)

46
Figure 4-3 - 3D model of (a) single phase transformer , (b) 3 phase transformer
Csh-HGsh-H
Rs
Ls
CHL
CHL
G GHL
Gsh-L
G
Rs
G G
Ls Cg-L
Cg-L/2
Ro
Vin
LV Winding HV Winding
VO
Cg-H/2
Csh-L
Cg-H
GHL
Ri
Mij Mi’j’
Mij’
Figure 4-4. Transformer Lumped parameters model
Since mechanical faults cause deformations on the windings and the core of the power
transformer, which is simulated as a distributed lumped parameters model, the
sensitivity analysis of each parameter on FRA response is very crucial for
understanding the variations of FRA response. It is important to understand the effect
of each parameter on FRA response. Table 4.1 lists the transformer model parameters,
and the mechanical faults that influence them. Various mechanical faults can be
simulated by changing the relevant parameters in the transformer model. This can aid
in establishing a standard code for FRA signature interpretation.
Table 4.1. Model parameters and the mechanical faults that influence them
Model
Parameter
Type of Fault
Inductance Disk deformation, local breakdown and winding
short circuits.
Shunt
Capacitance
Disk movements, buckling due to large
mechanical forces, moisture ingress and loss of
clamping pressure.

47
Series
Capacitance
Aging of insulation and disk space variation.
Resistance Shorted or broken disk and partial discharge.
4.3 Axial displacement failure mode and transformer equivalent circuit
parameters calculation
Axial displacement occurs by the imbalanced magnetic forces generated by a short
circuit fault in the upper and lower parts of a particular winding. Considering a typical
single-phase transformer, the short-circuit current generated is approximately
calculated as [61, 127-129]:
−−−++=
−− )][cos()cos(2)( 0
t
sc
e etIiti
t
(28)
Where
𝜏 = 𝐿𝑒𝑞
𝑅𝑒𝑞 , 𝐼𝑆𝑐 =
𝑉
√𝑅𝑒𝑞2 + 𝜔2𝐿𝑒𝑞
2
, 𝜑 = tan−1𝜔𝐿𝑒𝑞
𝑅𝑒𝑞
where 𝜓 is the voltage angle when the fault occurred, ISC is the steady state value of
the short circuit current, I0 is is the initial current at fault application, Req and Leq
represent the total series impedance of the winding and V is the effective supply
voltage.

48
Figure 4-5 Axial displacement[1]
During short circuit faults, the electromagnetic forces acting on the coils may suddenly
rise from a few newtons to Mega Newtons. These forces oscillate at double the circuit
frequency of the supply [75, 130-132]. The crushing forces within the coil might be
extremely high whilst the forces exerted on the coil clamps may be zero [133], leading
to compression of some parts of the winding, whereas other parts of the same winding
may be in tension. At the winding terminals, the leakage field tries to spread out and
form a radial component that produces an axial force along the winding as shown in
Figure 4-5. The net force is equal to zero as long as the magneto motive forces (MMF)
produced are completely balanced. Once the MMF are out of axial balance, the net
force tends to raise this imbalance, leading to separation of the windings and breakage
of the clamping structure [128]. Electromagnetic force on the transformer winding is
a result of the interaction of the leakage flux and short circuit current in the winding
[134, 135]; its effect on a small volume dV of a winding having a current density J
placed in a point where the radial component of the flux density is B(r) can be
calculated as [61, 134, 136]:
df=JB(r)dV (29)
The electromagnetic force on the winding is analysed by means of ANSYS
mechanical software as expressed below (see Figure 4-6).
𝐹 = ∫ (𝐽 × 𝐵)𝑑𝑉𝑣𝑜𝑙
(30)

49
Figure 4-6 Axial displacement after short circuit fault

50
Figure 4-7 Magnetic flux density (a) Healthy Condition (b) Faulty Condition
Figure 4-7a shows a colour shaded plot of the magnetic flux density distribution within
the studied transformer under normal operating condition whereas Figure 4-7b shows
the magnetic flux distribution within the same transformer under axial displacement
of the HV winding. Figure 4-7a clearly shows that the central limb, where the
transformer windings are wound on, has higher magnetic flux density than the other
two limbs and the flux density distribution is symmetrical around the central limb. On
the other hand, the asymmetrical distribution of the electromagnetic flux can be
noticed in case of HV axial displacement as shown in Figure 4-7b. Modification of the
electromagnetic field in the vicinity of the faulty region can be justified by the increase
in leakage flux at the upper part of the central limb due to axial displacement of the
HV winding. As leakage flux is directly proportional to the winding current, the
resultant electromagnetic force, as given in equation (30), is proportional to the square
of the short circuit current. The leakage flux consists of radial and axial components
and any change in the flux density before and after the fault causes variation to the
transformer equivalent circuit inductance due to the change in the magnetic energy

51
stored W as below[120]:
jiij HBW =2
1 (31)
Where, Wij is the energy stored in the magnetic field linking conductor i with conductor
j, Bi is the magnetic flux density within coil i and Hj is the magnetic field intensity of
coil j. The parameters of the model shown in Figure 4-4 are calculated from the physical
geometry (given in the appendix) of the transformer using 3D finite element analysis
for normal winding condition. Various fault levels of axial displacement are simulated
on the 3D finite element model and the model parameters are recalculated to investigate
the impact of axial displacement on all model parameters as elaborated below.
4.3.1 Impact of Axial Displacement on Equivalent Electric Circuit Parameters
When axial displacement occurs in a winding, the equivalent electrical parameters of
the winding model are expected to alter due to the change in the physical configuration
of the windings [124, 137]. In order to precisely simulate an axial displacement using
a transformer electrical circuit model, it is crucial to identify the percentage change in
the electrical circuit parameters that is equivalent to a particular fault level [116, 138].
According to [10, 11, 139], axial displacement will alter the mutual inductance between
HV and LV disks windings; however, the change in capacitive components is small and
can be neglected. To accurately identify the impact of the axial strain level (which is
calculated as the ratio of winding displacement to the winding height, Δh/h as shown
in Figure 4-8), on the electrical parameters of the transformer equivalent circuit, the
physical dimensions of the two single-phase transformers are simulated using 3D finite
element analysis, where various axial displacement levels are simulated in both low
voltage and high voltage windings.
The impact of each axial displacement fault level on the electrical parameters of the
equivalent circuit is investigated. Two case studies are presented using single-phase
transformers (1 and 5 MVA) of different physical geometry to investigate the impact
of transformer size on the transformer equivalent electrical parameters change due to
axial displacement. The electrical parameters pertinent to normal and faulty conditions
are extracted using FEM based on the following 3 steps:
(a) The electromagnetic forces calculated during a short-circuit fault by the Maxwell
program is used as the input source of sequential FEM (ANSYS static structural) to
accurately estimate the resulting mechanical forces, considering the structural

52
characteristics such as stress distribution and displacement of the windings. The
mechanical stress and displacement of HV and LV windings are predicted by the static
structural analysis.
(b) The resultant mechanical displacement due to forces achieved from the static
structural is solved using the electromagnetic Maxwell software in electrostatic and
magnetostatic domains to obtain the inductance and capacitance matrices.
(c) The electrical parameters matrices are extracted for normal and faulty conditions
and the percentage change in each parameter due to axial displacement is calculated
as:
Percentage change x=𝑥𝑛−𝑥𝑓
𝑥𝑛× 100% (32)
where xn and xf are the values of inductance and capacitance parameters during normal
and faulty conditions, respectively.
Figure 4-8 configuration of axial fault
4.3.1.1 Case Study 1: 1MVA Single-Phase Transformer
Figure 4-9 shows the percentage change of the mutual inductance between HV and LV
windings with respect to the base value of healthy condition for different axial
displacement fault levels when it takes place within the HV and LV windings. As
shown in Figure 4-9 the percentage change in mutual inductance decreases with the
increase of fault level. For small fault levels (up to 4.5%), the percentage change in the
mutual inductance due to axial displacement on the HV or LV windings is the same.
However, beyond this fault level, a slight difference is observed. This may be
attributed to the asymmetry of the produced magnetic field generated by high axial
displacement levels in both cases. Since the LV winding is closer to the core, LV
winding axial displacement will lead to less change in the mutual inductance between
the HV and LV windings than the change caused by axial displacement of the HV

53
winding [114]. In general, the change in mutual inductance between the two windings
is quite small due to the fact that FRA is performed on one winding while the other
winding is kept open circuited.
Figure 4-9- Variation of Mutual Inductance for various fault levels
Figure 4-10 Variation of HV-LV Capacitance
0 1 2 3 4 5 6 7 8 9 10 11 12 13 14 15-2
-1.8
-1.6
-1.4
-1.2
-1
-0.8
-0.6
-0.4
-0.2
00
Axial Fault (%)
MH
V-L
V (%
)
HV
LV
0 1 2 3 4 5 6 7 8 9 10 11 12 13 14 15-10
-9
-8
-7
-6
-5
-4
-3
-2
-1
0
Axial Fault (%)
CH
V-L
V (%
)
HV
LV
0 1 2 3 4 5 6 7 8 9 10 11 12 13 14 150
0.2
0.4
0.6
0.8
1
1.2
1.4
Axial Fault (%)
CL
V-C
ore
(%
)

54
Figure 4-11. Variation of Capacitance between LV-Core (LV Axial fault).
Figure 4-10 shows the percentage change in the capacitance (with respect to the normal
condition value) between the HV and LV winding when various axial displacement
levels takes place on HV and LV windings. As revealed in Figure 4-10, the percentage
change in capacitance between HV and LV windings is decreasing with the increase
of fault level. The change in the capacitance is the same for the same axial fault level
when it takes place on the HV or LV windings.
Figure 4-11 shows how the capacitance between the LV winding and core changes for
various axial fault levels within the LV winding. It can be seen that the percentage
change in capacitance increases with the increase of fault level. Figure 4-12 shows the
same trend for the change in the capacitance between the HV winding and the tank for
axial displacement within the HV winding. However, the percentage change in the
capacitance between HV winding and the tank for a particular HV axial displacement
level is higher than the percentage change in the capacitance between the LV winding
and the core for the same level of axial displacement on the LV winding. It is worth
mentioning that the equivalent electrical parameters of a 3-phase transformer will have
a similar trend to the single phase transformer equivalent electrical parameters as the
effect of phase coupling will be insignificant and can be neglected.
Figure 4-12. Variation of Capacitance between HV-Tank (HV Axial fault).
4.3.1.2 Case Study 2: 5 MVA Single-Phase Transformer
To investigate the impact of transformer sizing on the changes in electrical parameters
due to axial displacement, the geometry of 5 MVA transformers is simulated using
0 1 2 3 4 5 6 7 8 9 10 11 12 13 14 150
0.5
1
1.5
2
2.5
3
3.5
Aixal Fault (%)
CH
V-T
ank (
%)

55
FEM. The percentage change in the equivalent electrical parameters with respect to
the normal condition parameters for various axial fault levels on the HV windings was
observed and compared with the previous case study as shown in Figure 4-13. Figure
4-13a shows the change in the mutual inductance between the HV and LV windings
due to HV winding axial displacement for the two case studies. Up to 10% fault level,
the change in the mutual inductance is the same for the two cases studied. However,
beyond this fault level, the percentage change in the mutual inductance for the high
rating transformer is slightly higher. Figure 4-13b and Figure 4-13c show that the
variation in the capacitance matrices due to various axial fault levels is almost the same
for the two cases studied. The results of this analysis reveal that the transformer size
has a slight impact on the change in the electrical parameters due to different axial
fault levels and the transformer size effect could be ignored, as the electrical parameter
change is calculated with respect to the base value for healthy transformer conditions.
It is worth mentioning that corrective action should be taken as soon as any minor axial
deformation is detected, since leaving this fault unattended can lead to winding
collapse or failure of the end supporting structure due to the progressive nature of axial
deformations [9, 140].
0 1 2 3 4 5 6 7 8 9 10 11 12 13 14 15-2
-1.8
-1.6
-1.4
-1.2
-1
-0.8
-0.6
-0.4
-0.2
0
MH
V-L
V (%
)
Case1
Case2
(a)

56
Figure 4-13. Variation of Inductance and Capacitance Matrices (1 and 5 MVA).
4.3.2 Impact of Proposed Parameter Changes on FRA Signature
In order to investigate the impact of the parameters discussed above on the FRA
signature, the FRA signature of the lumped transformer model (1 MVA) shown in
Figure 4-4 is plotted for both healthy and faulty conditions. As shown in Figure 4-14,
the FRA signature for the HV winding is obtained by connecting a low voltage ac
sweep frequency source (Vin) to one terminal of the winding while the response (Vo)
is measured at the other terminal of the same winding with respect to the earth. The
input and output resistors (Ri and Ro) shown in Figure 4-4 emulates the resistances
of coaxial cables used in practical measurements. The FRA signature is plotted as the
magnitude of the transfer function (TF) in dB; 20 log10 (Vo/Vi) against frequency.
The FRA signature for the axial fault conditions is first obtained by changing only
the mutual inductance between the HV and LV windings, as proposed in the literature
[6], and subsequently changing the inductive and capacitive parameters, as discussed
above. Figure 4-14a and Figure 4-14b show the influence of various levels of HV
0 1 2 3 4 5 6 7 8 9 10 11 12 13 14 15-10
-9
-8
-7
-6
-5
-4
-3
-2
-1
0
CH
V-L
V (%
)
Case1
Case2
(b)
0 1 2 3 4 5 6 7 8 9 10 11 12 13 14 150
0.5
1
1.5
2
2.5
3
3.5
4
4.5
Axial Fault (%)
CH
V-T
ank (%
)
Case1
Case2
(C)

57
and LV winding axial displacement (1%, 3% and 5%) that is simulated by changing
only the mutual inductance between HV and LV windings on the FRA signature. The
value of the mutual inductance that corresponds to each fault level is calculated based
on Figure 4-9. As shown in Figure 4-14(a) and Figure 4-14(b), the fault impact on
the FRA signature is hardly observable in the frequency range above 200 kHz, where
there is a minor shift of the resonance and anti-resonance frequencies to the right; the
shift increases by increasing the fault level.
Figure 4-14 Effect of Axial Displacement on FRA signature (simulated by
changing MHV-LV only) (a) HV winding (b) LV winding .
Figure 4-15(a) and Figure 4-15(b) show the effect of various axial displacements on

58
the FRA signature of the HV and LV windings, respectively, by considering the
changes in both capacitance and inductance matrices. The value of the electrical
parameters corresponding to each fault level is calculated based on Figure 4-9 through
Figure 4-12. Figure 4-15shows a clear influence of the axial displacement fault on the
FRA signature for both windings. Figure 4-15 (c) shows the LV winding FRA signature
from 10 Hz to 2 MHz. According to [124] the FRA signature due to axial winding
displacement is not predicted for frequencies above 1 MHz.

59
Figure 4-15. Effect of Axial Displacement (simulated by changing Capacitance
and Inductance Matrices) on FRA signature (a) HV winding (b) LV winding, (c)
LV winding FRA signature till 2 MHz .
The impact is observable for fault as small as 1% in the frequency range above 150
kHz in which resonance and anti-resonance frequencies shift to the right up to about
400 kHz; above this frequency they start to shift to the left due to the fact that within
this range, capacitance elements considered in simulating the fault will dominate the
FRA signature. Minor deviations in capacitance, ΔC, have more influence at a high-
frequency range, since 𝑓2/𝑓1 =1/2 𝜋√1 + 𝛥𝐶/𝐶 where f1 and f2 are the resonant
frequencies of the displaced and intact windings, respectively [139].Table 4.2 and Table
4.3summarise the variation of the resonance frequencies Δf due to 1% axial fault with
respect to the healthy condition for both HV and LV windings of 1 MVA and 5 MVA
single phase transformers. As shown in the tables, the frequency deviation of the faulty
signature compared with the healthy one is much higher when both inductance and
capacitance matrices are considered in simulating the fault. While the shift in resonance
frequencies is to the right through the entire frequency range above 100 kHz when
inductance variation is considered to only simulate axial displacement, the shift of these
frequencies tends to the left in the high frequency range (above 600 kHz) when both
capacitance and inductance elements are considered in simulating the fault as proposed
herein. This result agrees well with the practical axial displacement impact on the
transformer FRA signature provided in [2, 6, 124, 141].
Table 4.2- Average effect of 1% axial winding displacement (1 MVA)
Δf of axial fault signature; kHz

60
Resonance Frequencies
(Normal Condition; kHz)
considering
inductance only
considering inductance
and capacitance
HV LV HV LV HV LV
147.321 191.651 0 0 1.01 1.91
242.721 233.491 0 0 2.5 3.2
284.161 271.91 0 0.12 2.8 11.6
329.821 410.791 0.6 0.75 12.11 5.04
402.181 537.091 0.57 0.65 15.61 11
665.071 699.411 1.5 1.8 -33.2 -29.6
977.941 998.411 1.2 1.52 -76.3 -35.08
Table 4.3- Average effect of 1% axial winding displacement (5 MVA)
Resonance Frequencies
(Normal Condition; kHz)
Δf of axial fault signature; kHz
considering
inductance only
considering inductance
and capacitance
HV LV HV LV HV LV
137.43 180.52 0 0 1.5 2.5
236.73 220.43 0 0 3.52 2.24
286.61 262.49 0.15 0.17 4.28 10.6
350.53 401.61 1.36 1.1 14.11 6.04
420.27 580.39 1.57 0.85 13.61 13
680.75 650.76 2.75 2.5 -40.2 -35.2
970.62 980.36 +3..2 2.532 -73.3 -40.08
4.4 IMPACT OF RADIAL DEFORMATION ON EQUIVALENT
ELECTRIC CIRCUIT PARAMETERS
During a short circuit fault, the electromagnetic forces acting on the coils may
suddenly rise from a few newtons to Megatons and oscillate at double of the circuit
frequency [57, 129]. The radial components of the electromagnetic forces in a
transformer with concentric disk windings have never been considered significant due
to the fact that the radial strength of the winding is adequate to cope with these forces
[61]. Winding radial buckling can be avoided by a perfectly round winding cross-

61
section and by placing adequate radial spacer supports as shown in Figure 4-16 [142-
144]. On the other hand, spacer supports influence the buckling strength of windings,
which are subjected to radial electromagnetic forces [57, 145]. Radial forces on disk
windings of a two-winding transformer produce a hoop stress that tends to extend the
radius of the outer winding while, at the same time, produces a compressive stress on
the inner winding, resulting in buckling, as shown in Figure 4-16 .The mean hoop
stress (σmean) in the conductor of the outer winding at the peak of the first half-cycle of
short-circuit current, assuming an asymmetry factor of 1.8 is [2, 10, 33, 146].
(peak)kN/mm030 2
2
z
cu
meanhe
W.σ = (33)
where Wcu = I2Rdc is the losses in the winding in kW, h is axial height of the winding
in mm and ez is the voltage applied in per unit.
Figure 4-16. (a) Forced buckling (LV), (b) Free buckling (HV).
The inner winding is subjected to radial forces acting inwards (forced buckling), while
the outer winding is subjected to outward acting force (free buckling), as shown in
Error! Reference source not found.. The failure modes include winding collapse or b
ending between supports. If the winding is of a disk type, each disk is subjected to a
radial force that can be calculated as [145, 147]
w
ccmeanr
D
AnP
2= (34)
where meanis the mean stress calculated in equation (6), Pr is the radial force in kN
per mm of length, Ac is the cross-sectional area of the disk in mm2, nc is the number

62
of conductors in each disk and Dw is the mean diameter of the winding in mm.
Figure 4-17 Buckling deformation
4.4.1 Impact of Buckling Deformations on Equivalent Electric Circuit
Parameters
In order to exactly simulate radial deformation using a transformer equivalent
electrical circuit model, it is essential to detect the percentage change in the electrical
circuit parameters that corresponds to a particular fault level. According to [11, 78,
139], the radial deformation can be simulated by randomly changing the capacitance
value of the HV and of LV windings while the change in inductance is neglected. The
study did not emphasize the amount of change in the capacitance that corresponds to
the fault levels studied. The main contribution of this section is the investigation of the

63
correlation between various radial fault levels and the corresponding percentage
change in electrical circuit parameters to help with accurate simulation of radial faults
using transformer high-frequency electrical equivalent circuits and to ease the
deterministic analysis of FRA signatures. In this regard, the physical geometrical
dimensions of a single-phase transformer is simulated using 3D finite elements and by
means of coupling ANSYS magnetic parts with ANSYS static structural mechanical
parts; various radial deformation levels, calculated as the percentage ratio of the
change in the perimeter of the faulty disk with respect to the disk perimeter prior to
deformation, are implemented by controlling the level of the short-circuit current
through the windings. In the case of a single-phase transformer, the current during
transient conditions can be approximately calculated by equation (28) [61, 128].
Similar to axial displacement study above, the calculated electromagnetic forces are
used as input sources of sequential FEM to predict the resultant mechanical forces,
considering the structural characteristics such as stress distribution and winding
deformation. The radial force due to a short-circuit current and axial leakage flux
within the gap between the HV and LV windings is calculated in the finite element
analysis as [4, 5, 61]:
( )NIH
NIDF
w
averadial 22
2 0
=
(35)
where Hw, Dave, N, I and µ0 are the winding height, the average winding diameter, the
number of turns, the RMS winding current and the permeability of air, respectively.
To investigate the impact of fault location on the percentage change in various
electrical parameters of the transformer equivalent circuit, radial deformation was
simulated in three different locations of the HV and LV windings. The impact of
transformer size is also investigated as will be explained in the following sections.
4.4.1.1 Case Study 1: 1 MVA Single-Phase Transformer
Figure 4-18 shows variation of the magnetic energy after deformation of the top disk
of the HV winding due to a short-circuit current. Inductances associated with the
deformed disks are calculated using Maxwell’s equations. To calculate the capacitance
matrix for the deformed winding, a sequence of electrostatic field simulations was
performed to measure the energy stored in the electric field associated with the
capacitance between the HV and LV windings, the LV winding and the core and the

64
HV winding and the tank. The electrical parameters matrices are extracted for normal
and faulty conditions and the percentage change in each parameter due to buckling
deformation is calculated as in equation (32).
Figure 4-18. Variations of magnetic energy after deformation on top disk of HV.
This procedure is performed for three different fault locations: top, middle and bottom
of both HV and LV windings as shown in Figure 4-19. The percentage changes in
inductive and capacitive elements as a function of the specific fault level are shown in
Figure 4-20 and Figure 4-21 . Figure 4-20 reveals that the percentage change in the
self-inductance of the deformed disk winding decreases after buckling of the LV
winding with increasing fault level. The percentage change in the capacitance between
LV and HV windings at the fault location decreases with the increase of the fault level
whereas the percentage change in the capacitance between the LV winding and the
core increases, since the distance between the deformed disk and core decreases.
Figure 4-21 shows that, due to the free buckling the HV winding exhibits, the
percentage change in capacitance between the HV winding and the tank and the
percentage change in the self-inductance of HV winding increase with the increase in
the fault level. The percentage change in the capacitance between the HV and LV
winding shown in Figure 4-21c has the same trend as the one shown in Figure 4-20c.

65
Figure 4-19. (a) Free buckling HV winding (top, middle and bottom). (b) Force
buckling LV winding (top, middle and bottom).
Simulation results show that the deformation location has a slight impact on the
electrostatic and magneto-static fields. As a result, the percentage change in the
electrical circuit parameters is not significantly impacted by the fault location, as
shown in Figure 4-20 and Figure 4-21.
0 1 2 3 4 5 6 7 8 9 10
-4
-3
-2
-1
0
Sel
f -I
nd
uct
ance
(%
)
Bottom Top Middle
(a)

66
Figure 4-20. Variations of inductance and capacitance matrices (force buckling on
LV winding) – 1MVA transformer.
0 1 2 3 4 5 6 7 8 9 100
2
4
6
8
10
12
C H
V-T
ank
(%)
Top Middle Bottom
(b)
0 1 2 3 4 5 6 7 8 9 10-12
-10
-8
-6
-4
-2
0
Fault (%)
C H
V-L
V (%
)
Top Middle Bottom
(c)
0 1 2 3 4 5 6 7 8 9 100
1
2
3
4
5
6
Sel
f- In
du
ctan
ce (
%)
Top Middle Bottom
(a)
67
Figure 4-21 Variation of inductance and capacitance matrices (free buckling on
HV winding)-1MVA transformer.
4.4.1.2 Case study 2: 5MVA single-phase Transformer
To investigate the impact of transformer sizing on the electrical parameters variations
due to radial deformation, the geometry of 5 MVA transformer was simulated and the
same approach explained above was used to calculate the percentage change in the
equivalent electrical parameters corresponding to various fault levels of free buckling
deformation on the HV winding in three different locations. Free buckling on the top
of the HV winding is shown in Figure 4-22 and the resulting changes in electrical
parameters are presented in Figure 4-23.
0 1 2 3 4 5 6 7 8 9 100
2
4
6
8
10
12
C H
V-T
ank
(%)
Top Middle Bottom
(b)
0 1 2 3 4 5 6 7 8 9 10-12
-10
-8
-6
-4
-2
0
Fault (%)
C H
V-L
V (
%)
Top Middle Bottom
(c)

68
Figure 4-22. Free buckling at the top of the HV winding (5 MVA).
Figure 4-23 reveals that the change in the electrical parameters due to free buckling
deformations of the HV winding of a 5 MVA transformer is quite similar to that
obtained from buckling of the HV winding of a 1 MVA transformer. However the
changes in the parameter associated with the high-rating transformer are slightly
higher.
0 1 2 3 4 5 6 7 8 9 100
2
4
6
8
10
Self-
Indu
ctan
ce (%
)
Top Middle Bottom
(a)

69
Figure 4-23. Variations of inductance and capacitance matrices (free buckling on
the HV winding) - 5 MVA transformer.
4.4.2 Impact of proposed parameter changes on the FRA signature
To investigate the effect of the parameter changes proposed in the previous section on
the transformer FRA signature, the transformer model (1 MVA) shown in Figure 4-4
was energized by a sweep frequency AC source (Vin) of 10 V and variable frequency
(up to 1 MHz); the resulting FRA signature (Transfer function; TF = 20 log10(Vo/Vi))
is plotted against the frequency for healthy and faulty conditions. The value of the
electrical parameters corresponding to each fault level is calculated based on Figure
4-20 and Figure 4-21. Figure 4-24shows the influence (on the FRA signature) of two
fault levels (1% and 5%) of simulated HV and LV winding buckling deformations by
changing only the capacitance matrix as proposed in the literature [11, 139]. As shown
in Figure 4-24, the buckling deformation fault impact on the FRA signature is hardly
observable in frequency range less than 500 kHz; at higher frequency, the resonance
frequencies and magnitude are slightly changed. Figure 4-25 shows the effect of 1%
and 5% buckling deformations on the FRA signature of the HV and LV windings by
0 1 2 3 4 5 6 7 8 9 100
4
8
12
16
C H
V-Ta
nk (%
)
Top Middle Bottom
(b)
0 1 2 3 4 5 6 7 8 9 10-13
-11
-9
-7
-5
-3
-10
Fault (%)
C H
V-LV
(%)
Top Middle Bottom
(c)

70
considering both capacitance and inductance variations.
(a)
(b)
Figure 4-24. Effect of buckling deformations on the FRA signature (simulated by
changing the capacitance matrix only) (a) Free buckling on HV winding (b) Force
buckling on LV winding
(a)

71
(b)
Figure 4-25. Effect of buckling deformations on the FRA signature (simulated by
changing the capacitance and inductance matrices) (a) Free buckling on HV
winding (b) Force buckling on LV winding.
In contrast with the FRA signatures shown in Figure 4-24, by considering both
capacitance and inductance variations in simulating buckling deformations, the
influence of the fault on the FRA signature is observable even at a low fault level of a
1% (see Figure 4-25) . This aligns well with the practical results presented in [85, 124,
148, 149], which indicated that buckling deformation influences the whole frequency
range of the FRA signature. The change in the FRA signature in the case of HV
buckling faults in the low-frequency range is attributed to the change in the magnetic
flux distribution due to the fault.Error! Reference source not found.Table 4.4 and
Table 4.5 summarize the variations of the resonance frequencies Δf due to 5% radial
deformation with respect to the healthy FRA signature for both HV and LV windings
of two single-phase transformers of different ratings, 1 MVA and 5 MVA.. Five
resonance peaks in four frequency ranges (10-100 kHz, 100-400 kHz, 400-600 kHz
and 600-1000 kHz) are tabulated to quantify the change in peak resonances with and
without considering inductance matrix variations. It is noted that the variation in the
FRA signature due to buckling faults starts in the frequency range above 400 kHz only
if capacitance element variations are considered. Variations in the FRA signature start
from the low-frequency range when inductive elements are also considered, which
agrees with the practical measurements presented in [6, 124, 148]. Table 4.4 and Table
4.5 show that, with the increase in the transformer rating, the shift in resonance
frequencies will increase for the same fault level.

72
Table 4.4. Average effect of 5% buckling deformation (1 MVA)
Resonance Frequencies
(Normal Condition; kHz)
Δf of Radial deformation fault signature; kHz
considering
capacitance only
considering inductance
and capacitance
HV LV HV LV HV LV
74.80 75.36 0 0 -5.01 +8.91
134.9 151.59 0 0 -2.5 +3.2
466.85 425.93 +3.2 +4.1 + 9.2 +10.02
760.65 641.47 +5.23 +6.75 + 17.21 +15.2
950.46 930.59 +10.5 +9.65 + 19.36 +17.5
Table 4.5. Average effect of 5% buckling deformation (5 MVA)
Resonance Frequencies
(Normal Condition; kHz)
Δf of Radial deformation fault signature; kHz
considering
capacitance only
considering inductance
and capacitance
HV LV HV LV HV LV
73.75 80.52 0 0 -6.25 +9.62
146.8 153.63 0 0 -3.51 +3.32
500.62 485.83 +4.2 +5.2 + 10.25 +11.15
790.55 661.52 +6.16 +7.73 + 18.31 +17.19
970.43 950.45 +11.52 +10.16 + 20.14 +18.63
4.5 DISK SPACE VARIATIONS
The axial displacement measured between the magnetic centres of the windings results
in unbalanced magnetic force components in each half of the winding, which leads to
a variation in its relative location [2, 10, 57]. Axial forces cause the conductors to tilt
or bend and are recognized to be more destructive when the windings are not spaced
equally [150]. Tilting and bending of conductors that cause disk space variations
between spacers as shown in Figure 4-26 are the most commonly reported
deformations resulting from excessive axial forces [139]. The electrical parameters for
normal and faulty windings are extracted using FEM based on the following steps:
73
(a) large short circuit current is injected into the HV winding;
(b) the structure of HV and LV windings are predicted using static structural analysis;
(c) the resulting mechanical displacement due to forces produced from the static
structural analysis is solved using the electromagnetic Maxwell software in electrostatic
and magnetostatic domains to obtain the inductance and capacitance matrices.
Results of the finite element analysis show that disk space variations affect several
parameters of the transformer model, such as shunt capacitance at the location of the
fault and the mutual inductance associated with the location of the fault. Table 4.6
summarizes the changes of these elements at different winding locations. Figure 4-26
(b) shows the variation of the magnetics flux after disk space variation fault.
Table 4.6. Variation of Capacitance and Inductance HV and LV
Fault location CS (pF)
HV LV
Mutual Inductance (μH)
HV LV
Healthy 3 45 142.25 153.45
2 disks Top 3.5 45.6 142.26 153.26
2 disks Middle 3.6 45.8 142.27 153.465
2disks Bottom 3.65 45.7 142.26 153.37

74
Figure 4-26. Disk space variations after short-circuit fault
Figure 4-27. FRA signature for Disk Space Variation

75
Figure 4-27 shows the FRA signature for disk space variations of HV winding at three
different locations compared with the FRA signature for healthy winding conditions.
Figure 4-27 shows that the impact of disk space variations on the FRA signature is
clearly visible at a frequency range above 400 kHz. This is attributed to the fact that
capacitive elements dominate the FRA response at this range. Fault location has an
impact on the FRA signature, as shown in Figure 4-27 , where the fault in the bottom
disk has more impact on the FRA signature, followed by the effect of the fault when it
takes place in the middle disk and finally when it takes place in the top disk. This may
be attributed to the FRA connection arrangement. . Figure 4-27 shows that the change
in CS due to disk space variation faults is significant when compared with the changes
in the mutual inductance that can be neglected in simulating such fault.
4.6 CORE DEFORMATION
Core defects (as shown in Figure 4-28) include shorted/burnt core laminations,
multiple/unintentional core grounds, joint dislocations and lost core ground [150, 151].
In addition, there are core defects ensuing from poor insulation of the tightening screws
of the core or due to blocked cooling oil ducts that cause the core to exhibit excessive
heat [152] that can cause damaging vibrations [152-154]. Figure 4-29 (a) shows the
magnetic flux before core deformation.
The winding inductance can be calculated using core material properties and physical
dimensions as below [152]:
l
ANL r
2
0= (36)
where N is the number of turns of the winding, A is the cross-sectional area of the core
section, µ0 is the permeability of the vacuum, µr is the relative permeability of the core
material and l is the length of the core section.
According to (36) it is expected that the core deformation will change winding
inductance. Figure 4-29 (b) shows that the flux density changes when the core is
deformed.

76
Figure 4-28. Core deformation
(a)
(b)
Figure 4-29. Healthy condition (a)Variations of magnetic flux after deformation on
core(b).

77
Figure 4-30. HV FRA signature for core deformation
Figure 4-30 shows the core deformation effect on the FRA signature. The impact is
clearly visible at the low frequency range (below 10 kHz). This is attributed to the fact
that flux penetration into the core is significant at the low-frequencies and its impact
dominates the response at this frequency range.
4.7 BUSHING FAULTS AND OIL DEGRADATION
Bushings are one of the major components causing forced outages of power
transformers [6]. A CIGRE international survey [6] indicated that the most frequent
sources of transformer failures are attributed to tap changers, bushings, and paper-oil
insulation systems, which deteriorate mainly due to heat, oxidation, acidity, and
moisture [124, 155-159]. There are many issues relating to transformer bushing faults:
• Oxidation, Heat, acidity, and moisture are the major issues related to insulation
deterioration.
• Insufficient or inappropriate routine maintenance and operation for transformer
bushings.
• Poor dielectric withstand strength of the oil part of the HV bushing due to
contamination of transformer oil with conductive particles and penetration of
carbon on the lower porcelain surface.
• Temperature stresses due to short circuits and heavy loading conditions.
• Environmental pollution leading to degradation of bushings and finally to
failure.

78
4.7.1 Bushing Fault Detection Techniques
Various diagnostic techniques have been adopted for transformer bushings as
follows[160]:
4.7.1.1 Power/dissipation Factor and Capacitance Test
This test should be performed when the bushing is first installed. After that, the test
should be conducted at regular intervals (typically 3 years to 5 years). It should be
noted that the transformer windings can affect the test after bushing installation, since
the temperature affects the dissipation factor test. This test should usually be
performed at 20 °C or converted to ambient temperature by using temperature-
correction.
4.7.1.2 Gas-in-oil Test
This test is not suggested as a prediction test, because the bushing must be opened and
exposed to the outside atmosphere as in this case, the moisture can penetrate the
bushing dielectric insulation. While this test is performed by many companies, the
degree of expertise required to conduct and interpret the test results makes it
impractical for most operators. Unfortunately, there are no IEEE guidelines for DGA
tests on bushings[58]. The gas-in-oil test should be used only for the purposes of
detecting faults on bushings due to dissipation factor measurements or high power or
other situations. The results of gas-in-oil tests should be compared with test results
from other bushings. The test oil analysis results from transformers cannot be
compared with bushing tests due to the differences in oil volumes and paper/oil ratios.
4.7.1.3 Frequency Response Analysis
While many researchers have investigated the impact of various mechanical winding
deformations such as axial displacement[57, 161], buckling deformation[11, 80, 162],
disk space variation [142, 143] and short circuit turns[58, 61, 87, 133, 163-165] on the
transformer FRA signature, no attention has been given to the impact of transformer
oil insulation and various bushing faults on the FRA signature. In the following
sections, the impact of insulation system properties as well as the impact of bushing
faults on the transformer FRA signature are elaborated.
4.7.2 Insulation System Properties
Presence of moisture in transformers is due to insulation aging, atmospheric leaks,
79
cellulose decomposition and after the dry-out process where moisture migration
between oil and paper insulation takes place [156, 166]. The dissipation factor test is
a method that can be used for identifying the moisture content inside the dielectric
insulation [124, 160]. The complex permittivity of transformer oil at a given frequency
w and temperature T can be calculated as[1, 124]:
)()(2.2..
)( "'
0
*
j
j
TOil
oil−=+= (37)
where Oil is oil conductivity, 0 is the permittivity of free space.
Dielectric behaviour usually refers to the variations of ' and " with frequency,
composition, temperature, and voltage [1, 124]. The real and imaginary parts of the
dielectric permittivity as a function of the frequency are given by [1]:
22
0'
1
+
−+=
(38)
22
0
1
)("
+
−= (39)
Where is the infinite-frequency dielectric constant and is the dielectric time
constant. For an equal thickness of oil-paper composite transformer insulation, is
given by [167]:
oilpaper
oilpaper
+
−= (40)
where, paper and
oil are the absolute value of permittivity of paper and oil insulation,
respectively, and paper and
oil are the conductivity of paper and oil insulation,
respectively.
The computation of oil conductivity requires details of the transformer physical
geometry as shown in Figure 4-31 as well as dielectric permittivity of the test object
[1].

80
Figure 4-31 Insulation System within a power transformer
4.7.3 Transformer Bushing Construction and Equivalent Circuit
There are two common types of transformer bushings, namely solid porcelain bushings
(which are used for low rating transformers) and oil-filled condenser bushing (also
known as oil impregnated paper OIP bushing, which is used for high rating
transformers [159]. An OIP transformer bushing is composed of insulation paper
wound around a central core as shown in Figure 4-32. The portions of the bushing in
the air and inside the transformer are also considered in the simulation. At defined
intervals, conductive sheets are placed between the paper layers to control the electric
field distribution [157]. Layers of paper and foil are usually filled with an insulating
fluid such as oil. The main insulation system is represented by capacitance C1 in the
equivalent bushing T-model shown in Figure 4-33, while layers near ground are
represented by capacitance C2. In the bushing model shown in Figure 4-33. Rs and
Ls represent the central conductor within the bushing that connects the line with the
transformer energized windings.
Bushings are designed to have a constant dielectric capacitance over the asset life
[155]. Therefore, variations in bushing capacitance can be used as an indicator of a
potential problem. An increase in capacitance of more than 3% to 5% is typically
interpreted as an indication of a problem within a bushing [168]. To accurately identify
the effect of bushing faults on the electrical parameters of a bushing equivalent T-
model, the physical geometrical dimension of a 10 kVA bushing of a three-phase

81
transformer Figure 4-33. Transformer Bushing layers and its equivalent T-model was
simulated using 3D finite element software (ANSYS) for healthy and faulty
conditions. Faulty bushings are emulated through altering their insulation complex
permittivity, which is influenced by many factors such as ambient temperature and the
structure of the insulation system [155]. Moreover, insulation aging and moisture
content have significant effects on bushing dielectric properties.
Figure 4-32. 3D model of Bushing solved in electrostatic FEM solver

82
C1
C2
Signal Injected
to BushingSignal Injected to
Transformer winding
Rs RsLs Ls
Bushing Model

83
Figure 4-33. Transformer Bushing layers and its equivalent T-model
The electrical parameters for normal and faulty conditions are extracted using FEM
based on the following steps:
Step 1: The 3D model of the transformer bushing shown in Figure 4-32 is analysed
using electrostatic, magnetostatic and DC conduction solvers to obtain the capacitance,
conductance and inductance matrices for the case of healthy condition. To extract the
bushing T-model parameters, the effect of capacitive grading on the electric field
distribution is also analysed.
Step 2: Faulty conditions are simulated by changing the permittivity of the transformer
oil-paper insulation of the bushing, and the corresponding variations in the
capacitances and inductance matrices for different faulty condition levels are
calculated using the electrostatic, magnetostatic and DC conduction solvers.
Step 3: The FRA signature is plotted as the transfer function TFdB= 20 log10 |V0/Vin|
for healthy and faulty conditions.
Moisture content inside the bushing leads to variations in the capacitive values C1
and C2. In the FEA, moisture content inside the bushing can be simulated through
changing the permittivity and/or conductivity of the dielectric insulation. In the
transformer model under study, moisture content within the bushing oil was varied
by changing the oil permittivity from 1% to 5%. Figure 4-34 shows the
corresponding percentage change in the bushing capacitances C1 and C2. These
results reveal that the change in C1 is more than in C2 for the same percentage
increase in moisture content; for example, a 2% increase in moisture content leads
to a 7.5% increment in C1 while C2 increased by only 3%.
Figure 4-34. Capacitance change of the bushing T-model due to moisture content

84
Figure 4-35 shows the impact of increasing moisture content on the change of the total
oil capacitance as predicted by the FEA. The figure shows that oil effective capacitance
increases with the increase in moisture content in the two types of oil used in the
simulation (vegetable and mineral). The increment in vegetable oil capacitance is,
however, slightly more than that of mineral oil at the same moisture content. It is worth
mentioning that these calculations are conducted based on the assumption that the
operating temperature as well as the network frequency are constants.
Figure 4-35.Variations in the oil effective capacitance value due to moisture
content
Figure 4-36. Variations in the oil conductivity due to moisture content
Variations in the oil conductivity can be calculated using the DC conduction solver
provided by ANSYS as below[120]:

85
),(),(),( yxyxEyxJ −== (41)
where J is the current density, E is the electric field intensity, is the conductivity of
the material (S/m) and is the electric potential.
Figure 4-36 presents the percentage changes in vegetable and mineral oil conductivity
due to the increase in moisture content. Figure 4-36 reveals that the increase in
moisture within transformer oil increases its conductivity. Simulation results also show
that vegetable oil dielectric strength is slightly more sensitive to moisture content than
mineral oil, as can be seen in Figure 4-35and Figure 4-36.
4.7.4 Impact of the Bushing Fault and Oil Degradation on the FRA Signature
To show the impact of a bushing model on the HV winding FRA signature, Figure
4-37 was plotted for the transformer model shown in Figure 4-3(b) with and without
the inclusion of the bushing T-model. With the inclusion of the bushing T-model, the
transfer function of the transformer produced new resonant peaks after 700 kHz with
a slight change in the TF magnitude. On the other hand, the magnitude and the resonant
peaks do not change from the low- to mid-frequency range. This is confirmed by the
practical test that will be presented in the next section.
Figure 4-37. FRA signature with and without inclusion of the bushing T-model
The above findings reveal that, for an accurate simulation of transformer FRA
signatures, a bushing model should be included in the transformer high-frequency
model. The following case studies are conducted using FEA along with the transformer
distributed parameters-based equivalent model shown in Figure 4-3 (b) with the
0 1 10 100 1000 3000Frequency (kHz)
-100
-80
-60
-40
-20
0
TF
(dB
)
Curve Info
With Bushing ModelWithout Bushing Model
628 1000 2107Frequency (kHz)
-17
-15
-13
-10
-8
-5
TF
(dB
)
Curve Info
With Bushing ModelWithout Bushing Model

86
inclusion of the bushing T-model as shown in Figure 4-33.
4.7.4.1 Case study 1 (bushing insulation degradation)
Figure 4-38 shows variations in the HV FRA signature for 2% and 4% moisture
content (simulated by changing oil/paper permittivity) within the oil and paper of the
transformer bushing. The figure shows the impact of the moisture on the FRA
signature appears in the frequency range above 700 kHz where the resonance and anti-
resonance frequencies along with the peaks alter with respect to the healthy signature.
The impact is more pronounced at the high-frequency range and with more moisture
content.
Figure 4-38. Moisture content in bushing insulation effect on FRA test
4.7.4.2 Case study 2 (Transformer oil degradation)
In order to exactly simulate the transformer oil degradation using a transformer
distributed parameter model, it is essential to detect the percentage change in the
electrical circuit parameters that corresponds to a particular oil degradation level.
Figure 4-39 shows the effect of new insulation oil on the transformer FRA signature
when compared with the dry transformer FRA signature. As can be seen in Figure
4-39, new insulation oil will shift the resonance peaks to the left on the entire frequency
range. This is attributed to the fact that adding insulation oil will increase the overall
capacitance and hence reduce the resonance frequencies. The permittivity of the new
oil is increased by 4% to simulate moisture content in the oil. As shown in Figure 4-40,
oil degradation has a slight impact on the FRA signature from the low to high
frequency range.

87
Figure 4-39. FRA signature with and without insulating oil
Figure 4-40. Impact of oil degradation on transformer FRA signature
4.7.4.3 Case study 3 (Disk space variation) with bushing model and 3 phase
transformer
To show the impact of the consideration of the bushing model in the transformer
equivalent circuit, a disk space variation fault is simulated in phase C as shown in
Figure 4-41. Finite element calculations reveal that due to disk space variations, the
shunt capacitance at the location of the fault and some elements associated with the
inductance matrix will change significantly. Table 4.7 and Figure 4-42 show the
variations in the resonant peaks with and without the bushing model connected to the
distributed parameter transformer model shown in Figure 4-3 (b). Figure 4-42 and
0 1 10 100 1000 3000Frequency (kHz)
-100
-80
-60
-40
-20
0
TF
(dB
)
Curve Info
Without insulation OilNew Insulation Oil

88
Table 4.7 show that the variations in the resonant peaks start after 300 kHz. Since the
T-model adds high capacitance value to the transformer model, the difference between
resonant peaks with and without the bushing model increases, particularly in the high-
frequency range.
Figure 4-41. Disk space variation fault on Phase C
Table 4.7. Transformer FRA signature for disk space variation fault with and without
a bushing model
Resonance Frequencies
(Normal Condition; kHz)
Δf FRA signature; kHz
Without Bushing With Bushing
330 +1.2 + 1.6
380 +2.3 + 2.8
752 -6.8 -7.6
986 -26.6 -31.6
1232 -32.5 -43.6
1745 -40.6 -56.2
2890 -69.3 - 78.3

89
4.8 EXPERIMENTAL RESULTS
To assess the accuracy of the proposed bushing model, the simulation results obtained
as shown above are compared with a practical FRA signature. Measurements were
conducted on three-phase 132kV, 35MVA power transformers at an ambient
temperature of 25o C. The FRA signature for phase A with and without the bushing is
obtained using a frequency response analyser as shown in Figure 4-43 which reveals
the impact of the bushing on the transformer FRA signature in the high-frequency
range. This confirms the simulation results of Figure 4-37.
Figure 4-43. Practical FRA signatures with and without the bushing
0 1 10 100 1000 3000Frequency (kHz)
-140
-120
-100
-80
-60
-40
TF
(dB
)
Curve Info
With BushingWithout Bushing
Figure 4-42 Impact of Disk space variations on the FRA signature with and without
the bushing model (add square to zoned range)

90
The transformer bushing oil was tested and a moisture content of 3% was found in the
Phase-A HV bushing. A FRA measurement was conducted on this phase and was
compared with the same phase FRA signature with new oil to assess the impact of
moisture content on the transformer’s FRA signature. As shown in Figure 4-44,
resonant peaks in the high-frequency range above 700 kHz shift to the left due to the
existence of moisture in the bushing insulation oil. This aligns well with the FEM
simulation shown in Figure 4-38.
To investigate the impact of insulating oil on the FRA signature, a FRA measurement
is conducted on Phase A of the transformer with, and without, new insulation oil as
shown in Figure 4-45. The FRA signature measured reveals that the whole frequency
range varies due to the change in the total capacitance matrices as resonance peaks
shift to the left. This is similar to the simulation results obtained in Figure 4-39 and the
practical test presented in [1].
Figure 4-44. Practical FRA signature with 2 healthy conditions of insulating oil
Figure 4-45. Practical FRA signature with and without insulating oil
0 1 10 100 1000 3000Frequency (kHz)
-125
-100
-75
-50
-25
TF
(dB
)
Curve Info
Healthy3% mositure in bushing insulation
0 1 10 100 1000 3000Frequency (kHz)
-125
-113
-100
-88
-75
-63
-50
-38
TF
(dB
)
Curve Info
New Insulating OilWithout Insulating Oil
24 100 1000 2862Frequency (kHz)
-75
-65
-55
-45
-35
TF (d
B)

91
5. CONCLUSION
The main goal of this study is to find the most promising procedure to demonstrate
high frequency power transformers model for the ability of computing internal
failures and the impact of winding movement/ deformation utilizing Sweep
Frequency Response Analysis (SFRA) method. SFRA is a very new technique to
determine the mechanical failures to transformer windings. SFRA can be done without
opening the transformer tank which supports the insulation and winding structure
facing to further damages [60].
FRA is an offline test and is used to measure the input/output relationship as a function
of frequency. This provides a fingerprint of a transformer which can be compared with
a transformer future signature for fault diagnosis. The FRA technique calls for trained
personnel to conduct the test and interpret its results for fault identification and
quantification. Another drawback of the FRA test is that the transformer has to be de-
energized and switched out of service causing severe interruption to the electricity
grid.
The computer-based transformer modelling should be very match/close to the
transformer manufacture design. It also should be capable to compute the internal
stress as well as extremal resonances because of external transformer components such
as bushings, cables and leads.
Transformer modelling should support the real transformer geometry based on
construction information from the manufacturer. In addition, the model should have
the capability to compute the internal and external resonances due to bushing and
leads.
The core geometry modelling (iron-core) is very crucial in order to compute the
magnetic parameters precisely. The value calculated from inductive components of
transformer model ( Self and Mutual inductances ) are very frequency dependable to
the behaviour of the core.
Based on the simulation results presented in this work, the following conclusions can
be drawn:
1. Simple, analytical approaches based on transformer construction cannot be
applied to establish a comprehensive high-frequency power transformer model

92
.Since applying physical faults on the real transformer windings is very
difficult and not applicable everywhere, the FEM can be used as an accurate
and sophisticated method in its place. In comparison with a simple numerical
method, the FEM increases the coherence of measurement results since a more
accurate implementation of design details can be included, such as properties
of the materials for the windings and core as well as temperature.
2. This study introduces effective charts that correlate the percentage changes in
each electrical parameter with various mechanical fault levels. This facilitates
a precise simulation of mechanical failures using transformer equivalent
circuits and the quantification analysis of the FRA signature.
3. FRA sensitivities are established for buckling deformations (free and forced)
and axial displacements. Buckling deformations are heavily dependent on the
shape of capacitance and inductance elements variations and accurate buckling
deformations can be emulated by using the transformer equivalent circuit
model. In addition, other previous studies [2, 85, 149] neglected the variations
in capacitance elements in simulating transformer winding axial
displacements. However, the FEM results showed that by considering
capacitance and inductance element variations, accurate axial displacements
can be emulated on the transformer lumped parameters model of deformation.
In contrast to other previous studies that neglected the variations in inductance
elements in simulating transformer winding radial deformations, the results of
finite element analysis show them clearly.
4. This study shows that the percentage changes in the electrical parameters due
to radial deformations are almost independent on the fault location. The shift
in the entire frequency range of the FRA signature can be used as an index for
the detection of the radial deformation and the amount of change is correlated
to the severity of the fault level. Axial displacement causes the shift in
resonance frequencies over 100 kHz to the high-frequency range. The FRA
signature obtained from simulation coincides with the FRA signature obtained
from practical measurements [10, 57].

93
5. Transformer sizing has a slight impact on the change in the electrical
parameters due to different axial fault levels and can be overlooked.
6. Disk space variations significantly affect the series capacitance of the
transformer equivalent electrical model and hence their impact on the FRA
signature is seen in the high-frequency range. Disk space fault locations have
different impact on the FRA signature. Disk space variations are obviously
detectable independently of their position within the winding because the
magnetic behaviour is altered.
7. Core deformation changing winding inductance and its impact are shown in
the low-frequency range of the FRA signature.
8. This study discussed the detection mechanism of the FRA method on bushing
insulation through simulation and experiments. In contrast with other studies,
where the bushing model is not considered for the FRA test, this study showed
that the bushing model should be added to the transformer linear model for the
purposes of the FRA test. It showed that the bushing model has an effect on
the FRA signature and causes the variations in peak resonances from the
medium- to high-frequency ranges and found that the frequency response is a
capacitive characteristic curve.
9. In addition, the permittivity of dielectric materials and transformer oil is
intensely affected by frequency, moisture, and temperature. Aging affects the
high-frequency characteristics of transformer oil strongly. The impact of
moisture content on the frequency response analysis of the transformer
winding was investigated in detail. This study showed that transformer
moisture deviation can affect the FRA trace variation significantly. It is clear
that the moisture content in the oil insulation would result in the local
resonances of the FRA signature moving horizontally from high-frequency
range towards the low-frequency range. The finite element analysis showed
that changes of moisture in the oil insulation significantly affect the
transformer winding shunt and series capacitances. The result obtained by the
simulation is confirmed by the practical test. It can be concluded that the FRA

94
test can provide very significant information on moisture variations in the oil
insulation and the bushing insulation.
5.1 FURTHER WORK
The following research avenues are suggested for future study in continuation of this
work.
1. As the FRA test is an offline test and it has some disadvantages such as shutting
down the transformer from the network which is very costly, the further
research can be performed on On-line FRA test while the transformer is
energized. FRA is an offline test based on the measurement of the impedance,
admittance or transfer function of a particular phase as a function of a wide
frequency range which is used as a transformer fingerprint that can be
compared with its previous signatures to detect any winding displacements [8].
Although FRA is a powerful diagnostic tool for detecting winding deformation,
its offline nature and reliance on graphical analysis are considered as the main
drawbacks;
2. Several of the studied electromagnetic disturbances that impact transformers
such as inrush, harmonic distortion and unbalanced operation are also known
to affect transformer performance adversely. This should be further
investigated through online condition monitoring. This can be done by
investigating on online transformer internal fault detection technique and
examining impact of harmonics through detailed nonlinear simulation of a
transformer using three-dimensional finite element modelling.
3. Although FRA is a powerful method to detect mechanical faults within the
windings, it cannot show the location of fault within the windings. This can be
further investigation for using FRA test to show the location of fault within the
windings. It has been a long-term question from researcher and engineers to
find out how to determine the fault location using the extracted data from the
various resonance-frequencies in voltage-ratio measurement or an admittance
measurement. This can be the future investigation by analysing the variations
on main resonances that change due to failures.

REFERENCES
[1] M. Bagheri, B. T. Phung, and T. Blackburn, "Influence of temperature and moisture content on frequency response analysis of transformer winding," Dielectrics and Electrical Insulation,
IEEE Transactions on, vol. 21, pp. 1393-1404, 2014.
[2] E. Rahimpour, J. Christian, K. Feser, and H. Mohseni, "Transfer function method to diagnose
axial displacement and radial deformation of transformer windings," Power Delivery, IEEE
Transactions on, vol. 18, pp. 493-505, 2003.
[3] V. Behjat and M. Mahvi, "Statistical approach for interpretation of power transformers
frequency response analysis results," Science, Measurement & Technology, IET, vol. 9, pp.
367-375, 2015.
[4] J. C. Gonzales Arispe and E. E. Mombello, "Detection of Failures Within Transformers by
FRA Using Multiresolution Decomposition," Power Delivery, IEEE Transactions on, vol. 29,
pp. 1127-1137, 2014. [5] W. Herrera Portilla, G. Aponte Mayor, J. Pleite Guerra, and C. Gonzalez-Garcia, "Detection
of Transformer Faults Using Frequency-Response Traces in the Low-Frequency Bandwidth,"
Industrial Electronics, IEEE Transactions on, vol. 61, pp. 4971-4978, 2014.
[6] C. A2.26, "Mechanical Condition Assessment of Transformer Windings Using Frequency
Response Analysis (FRA)," CIGRE Brochure 3422008.
[7] R. P. Jackson, "Recent Investigation of Lightning Protective Apparatus," American Institute of
Electrical Engineers, Transactions of the, vol. XXV, pp. 881-900, 1906.
[8] D. A. K. Pham, T. M. T. Pham, H. Borsi, and E. Gockenbach, "A new diagnostic method to
support standard frequency response analysis assessments for diagnostics of transformer
winding mechanical failures," Electrical Insulation Magazine, IEEE, vol. 30, pp. 34-41, 2014.
[9] Z. W. Zhang, W. H. Tang, T. Y. Ji, and Q. H. Wu, "Finite-Element Modeling for Analysis of
Radial Deformations Within Transformer Windings," Power Delivery, IEEE Transactions on, vol. 29, pp. 2297-2305, 2014.
[10] E. Rahimpour, M. Jabbari, and S. Tenbohlen, "Mathematical Comparison Methods to Assess
Transfer Functions of Transformers to Detect Different Types of Mechanical Faults," Power
Delivery, IEEE Transactions on, vol. 25, pp. 2544-2555, 2010.
[11] A. Abu-Siada and S. Islam, "A Novel Online Technique to Detect Power Transformer Winding
Faults," Power Delivery, IEEE Transactions on, vol. 27, pp. 849-857, 2012.
[12] B. K. Gupta, J. Densley, and A. Narang, "Diagnostic Practices Used For Instrument
Transformers," in Electrical Insulation, 2008. ISEI 2008. Conference Record of the 2008 IEEE
International Symposium on, 2008, pp. 239-242.
[13] B. K. Gupta, J. Densley, and A. Narang, "Review of diagnostic techniques for oil-paper
insulated instrument transformers," in Electrical Insulation (ISEI), Conference Record of the 2010 IEEE International Symposium on, 2010, pp. 1-5.
[14] B. H. Ward and S. Lindgren, "A survey of developments in insulation monitoring of power
transformers," in Electrical Insulation, 2000. Conference Record of the 2000 IEEE
International Symposium on, 2000, pp. 141-147.
[15] W. Zhongdong, W. Xin, Y. Xiao, L. Sitao, and J. V. Hinshaw, "Gas generation in natural ester
and mineral oil under partial discharge and sparking faults," Electrical Insulation Magazine,
IEEE, vol. 29, pp. 62-70, 2013.
[16] A. Santosh Kumar, R. P. Gupta, K. Udayakumar, and A. Venkatasami, "Online partial
discharge detection and location techniques for condition monitoring of power transformers:
A review," in Condition Monitoring and Diagnosis, 2008. CMD 2008. International
Conference on, 2008, pp. 927-931.
[17] M. Stace and S. M. Islam, "Condition monitoring of power transformers in the Australian State of New South Wales using transfer function measurements," in Properties and Applications of
Dielectric Materials, 1997., Proceedings of the 5th International Conference on, 1997, pp.
248-251 vol.1.
[18] N. Tapsi and S. Yaduvir, "Condition Monitoring and Diagnostics of Power Transformers
Using WSNs," in Computational Intelligence and Communication Networks (CICN), 2011
International Conference on, 2011, pp. 274-278.
[19] H. Yann-Chang and H. Chao-Ming, "Evolving wavelet networks for power transformer
condition monitoring," Power Delivery, IEEE Transactions on, vol. 17, pp. 412-416, 2002.
[20] Go, x, N. A. mez, H. M. Wilhelm, C. C. Santos, and G. B. Stocco, "Dissolved gas analysis

91
(DGA) of natural ester insulating fluids with different chemical compositions," Dielectrics and
Electrical Insulation, IEEE Transactions on, vol. 21, pp. 1071-1078, 2014.
[21] M. A. Elborki, P. A. Crossley, Z. D. Wang, A. Darwin, and G. Edwards, "Detection and
characterisation of partial discharges in transformer defect models," in Power Engineering
Society Summer Meeting, 2002 IEEE, 2002, pp. 405-410 vol.1.
[22] M. D. Judd, S. D. J. McArthur, J. R. McDonald, and O. Farish, "Intelligent condition
monitoring and asset management. Partial discharge monitoring for power transformers,"
Power Engineering Journal, vol. 16, pp. 297-304, 2002.
[23] A. Akbari, P. Werle, H. Borsi, and E. Gockenbach, "Transfer function-based partial discharge
localization in power transformers: a feasibility study," Electrical Insulation Magazine, IEEE, vol. 18, pp. 22-32, 2002.
[24] M. D. Judd, Y. Li, and I. B. B. Hunter, "Partial discharge monitoring for power transformer
using UHF sensors. Part 2: field experience," Electrical Insulation Magazine, IEEE, vol. 21,
pp. 5-13, 2005.
[25] M. S. Naderi, M. Vakilian, T. R. Blackburn, B. T. Phung, M. S. Naderi, and A. Nasiri, "A
hybrid transformer model for determination of partial discharge location in transformer
winding," Dielectrics and Electrical Insulation, IEEE Transactions on, vol. 14, pp. 436-443,
2007.
[26] T. V. Oommen and S. R. Lindgren, "Streaming electrification study of transformer insulation
system using a paper tube model," Power Delivery, IEEE Transactions on, vol. 5, pp. 972-983,
1990. [27] R. Sarathi and G. Koperundevi, "Investigation of partial discharge activity of single conducting
particle in transformer oil under DC voltages using UHF technique," Science, Measurement &
Technology, IET, vol. 3, pp. 325-333, 2009.
[28] K. Spurgeon, W. H. Tang, Q. H. Wu, Z. J. Richardson, and G. Moss, "Dissolved gas analysis
using evidential reasoning," Science, Measurement and Technology, IEE Proceedings, vol.
152, pp. 110-117, 2005.
[29] H. Yann-Chang and S. Huo-Ching, "Dissolved gas analysis of mineral oil for power
transformer fault diagnosis using fuzzy logic," Dielectrics and Electrical Insulation, IEEE
Transactions on, vol. 20, pp. 974-981, 2013.
[30] W. G. Ariastina, I. A. D. Giriantari, I. K. Solin, and O. Yolanda, "Condition monitoring of
power transformer: A field experience," in Properties and Applications of Dielectric
Materials, 2009. ICPADM 2009. IEEE 9th International Conference on the, 2009, pp. 1051-1054.
[31] S. Ji, Y. Luo, and Y. Li, "Research on extraction technique of transformer core fundamental
frequency vibration based on OLCM," Power Delivery, IEEE Transactions on, vol. 21, pp.
1981-1988, 2006.
[32] S. Ji, P. Shan, Y. Li, D. Xu, and J. Cao, "The vibration measuring system for monitoring core
and winding condition of power transformer," in Electrical Insulating Materials, 2001. (ISEIM
2001). Proceedings of 2001 International Symposium on, 2001, pp. 849-852.
[33] K. Hiraishi, Y. Hori, and S. Shida, "Mechanical Strength of Transformer Windings Under
Short-Circuit Conditions," Power Apparatus and Systems, IEEE Transactions on, vol. PAS-
90, pp. 2381-2390, 1971.
[34] K. Hong, H. Huang, J. Zheng, J. Zhou, Y. Zhou, and J. Liu, "Time-frequency analysis for power transformer fault detection using vibration method," in Industrial Electronics and
Applications (ICIEA), 2014 IEEE 9th Conference on, 2014, pp. 2110-2114.
[35] K. Hong and Z. Pan, "Vibration model of power transformer under short-circuit condition," in
Electrical Machines and Systems, 2009. ICEMS 2009. International Conference on, 2009, pp.
1-5.
[36] E. Rivas, J. C. Burgos, Garci, x, and J. C. a-Prada, "Vibration Analysis Using Envelope
Wavelet for Detecting Faults in the OLTC Tap Selector," Power Delivery, IEEE Transactions
on, vol. 25, pp. 1629-1636, 2010.
[37] F. H. Wang and Z. J. Jin, "Using the vibration frequency response analysis method to detect
the winding deformation of power transformer," in Power and Energy Society General
Meeting, 2011 IEEE, 2011, pp. 1-6.
[38] F. H. Wang, J. Xu, Z. J. Jin, and S. S. Gui, "Experimental research of vibration sweep frequency response analysis to detect the winding deformation of power transformer," in Transmission
and Distribution Conference and Exposition, 2010 IEEE PES, 2010, pp. 1-6.
[39] T.-T. He, J.-D. Wang, J. Guo, H. Huang, X.-x. Chen, and J. Pan, "A Vibration Based Condition
Monitoring System for Power Transformers," in Power and Energy Engineering Conference,

92
2009. APPEEC 2009. Asia-Pacific, 2009, pp. 1-4.
[40] B. S. Munir, J. J. Smit, and I. G. M. R. Rinaldi, "Diagnosing winding and core condition of
power transformer by vibration signal analysis," in Condition Monitoring and Diagnosis
(CMD), 2012 International Conference on, 2012, pp. 429-432.
[41] S. Borucki, T. Boczar, P. Fracz, and D. Zmarzly, "Diagnostics of power transformers cores
using a modified vibroacoustic method," in Electrical Insulation (ISEI), Conference Record of
the 2012 IEEE International Symposium on, 2012, pp. 179-183.
[42] A. Abu-Siada, S. Hmood, and S. Islam, "A new fuzzy logic approach for consistent
interpretation of dissolved gas-in-oil analysis," Dielectrics and Electrical Insulation, IEEE
Transactions on, vol. 20, pp. 2343-2349, 2013. [43] A. Abu-Siada and S. Islam, "A new approach to identify power transformer criticality and asset
management decision based on dissolved gas-in-oil analysis," Dielectrics and Electrical
Insulation, IEEE Transactions on, vol. 19, pp. 1007-1012, 2012.
[44] S. Mofizul Islam, T. Wu, and G. Ledwich, "A novel fuzzy logic approach to transformer fault
diagnosis," Dielectrics and Electrical Insulation, IEEE Transactions on, vol. 7, pp. 177-186,
2000.
[45] N. A. Muhamad, B. T. Phung, and T. R. Blackburn, "Dissolved gas analysis for common
transformer faults in soy seed-based oil," Electric Power Applications, IET, vol. 5, pp. 133-
142, 2011.
[46] A. Shintemirov, W. Tang, and Q. H. Wu, "Power Transformer Fault Classification Based on
Dissolved Gas Analysis by Implementing Bootstrap and Genetic Programming," Systems, Man, and Cybernetics, Part C: Applications and Reviews, IEEE Transactions on, vol. 39, pp.
69-79, 2009.
[47] A. K. Mehta, R. N. Sharma, S. Chauhan, and S. Saho, "Transformer diagnostics under
dissolved gas analysis using Support Vector Machine," in Power, Energy and Control
(ICPEC), 2013 International Conference on, 2013, pp. 181-186.
[48] S. Singh and M. N. Bandyopadhyay, "Dissolved gas analysis technique for incipient fault
diagnosis in power transformers: A bibliographic survey," Electrical Insulation Magazine,
IEEE, vol. 26, pp. 41-46, 2010.
[49] Y. Wang, F. Lu, and H. Li, "The fault diagnosis method for electrical equipment based on
Bayesian network," in Electrical Machines and Systems, 2005. ICEMS 2005. Proceedings of
the Eighth International Conference on, 2005, pp. 2259-2261 Vol. 3.
[50] L. Ming-Jong and Y. Chao-Tang, "A Pragmatic Approach to Diagnose on Transformer's Insulating Oil with Gas Pattern," in Computer, Consumer and Control (IS3C), 2014
International Symposium on, 2014, pp. 1002-1005.
[51] S. S. Patil and S. E. Chaudhari, "An Attempt to Investigate the Transformer Failure by using
DGA and SFRA Analysis," in Properties and Applications of Dielectric Materials (ICPADM),
2012 IEEE 10th International Conference on the, 2012, pp. 1-4.
[52] A. A. Suleiman, N. A. Mohamad, N. Bashir, A. S. AlGhamdi, and M. Aizam, "Improving
accuracy of DGA interpreation of oil-filled power transformers needed for effective condition
monitoring," in Condition Monitoring and Diagnosis (CMD), 2012 International Conference
on, 2012, pp. 374-378.
[53] M. A. B. Amora, O. M. Almeida, A. P. S. Braga, F. R. Barbosa, L. A. C. Lisboa, and R. S. T.
Pontes, "Improved DGA method based on rules extracted from high-dimension input space," Electronics Letters, vol. 48, pp. 1048-1049, 2012.
[54] ABB, ABB Transformer hand book. switzerland, 2009.
[55] F. L. Dixon, D. Steward, and J. Hoffmeister, "When to replace aging transformers," in
Petroleum and Chemical Industry Conference (PCIC), 2010 Record of Conference Papers
Industry Applications Society 57th Annual, 2010, pp. 1-14.
[56] E. T. Norris, "Mechanical strength of power transformers in service," Proceedings of the IEE
- Part A: Power Engineering, vol. 104, pp. 289-300, 1957.
[57] K. Pourhossein, G. B. Gharehpetian, and E. Rahimpour, "Buckling severity diagnosis in power
transformer windings using Euclidean Distance classifier," in Electrical Engineering (ICEE),
2011 19th Iranian Conference on, 2011, pp. 1-1.
[58] A. Bakshi and S. V. Kulkarni, "Analysis of Buckling Strength of Inner Windings in
Transformers Under Radial Short-Circuit Forces," Power Delivery, IEEE Transactions on, vol. 29, pp. 241-245, 2014.
[59] L. Qingmin, Z. Tong, Z. Li, and J. Lou, "Mechanical Fault Diagnostics of Onload Tap Changer
Within Power Transformers Based on Hidden Markov Model," Power Delivery, IEEE
Transactions on, vol. 27, pp. 596-601, 2012.

93
[60] E. Bjerkan, "High frequency modeling of power transformers stresses and diagnostics,"
Doctoral Thesis for the degree of Doctor Ingeniør, Trondheim, 2005.
[61] A. Hyun-Mo, L. Ji-Yeon, K. Joong-Kyoung, O. Yeon-Ho, J. Sang-Yong, and H. Sung-Chin,
"Finite-Element Analysis of Short-Circuit Electromagnetic Force in Power Transformer,"
Industry Applications, IEEE Transactions on, vol. 47, pp. 1267-1272, 2011.
[62] P. S. Moses, M. A. S. Masoum, and H. A. Toliyat, "Dynamic Modeling of Three-Phase
Asymmetric Power Transformers With Magnetic Hysteresis: No-Load and Inrush Conditions,"
Energy Conversion, IEEE Transactions on, vol. 25, pp. 1040-1047, 2010.
[63] P. S. Moses and M. A. S. Masoum, "Three-Phase Asymmetric Transformer Aging Considering
Voltage-Current Harmonic Interactions, Unbalanced Nonlinear Loading, Magnetic Couplings, and Hysteresis," Energy Conversion, IEEE Transactions on, vol. 27, pp. 318-327, 2012.
[64] M. Arshad, S. M. Islam, and A. Khaliq, "Power transformer aging and life extension," in
Probabilistic Methods Applied to Power Systems, 2004 International Conference on, 2004, pp.
498-501.
[65] P. Li, B.-h. Zhang, Z.-g. Hao, X.-j. Hu, and Y.-l. Chu, "Research on Monitoring of Winding
Deformation of Power Transformer by On-line Parameter Estimation about Leakage
Inductance," in Power System Technology, 2006. PowerCon 2006. International Conference
on, 2006, pp. 1-6.
[66] S. Santhi, S. Jayalalitha, V. J. Kumar, and V. Jayashankar, "Detection of Winding
Deformations During Short Time Current Tests," in Instrumentation and Measurement
Technology Conference, 2005. IMTC 2005. Proceedings of the IEEE, 2005, pp. 203-208. [67] L. Xiaodong, A. El-Kadri, J. Stevens, and R. Adedun, "Frequency Response Analysis for
Phase-Shifting Transformers in Oil Field Facilities," Industry Applications, IEEE Transactions
on, vol. 50, pp. 2861-2870, 2014.
[68] N. Abeywickrama, Y. V. Serdyuk, and S. M. Gubanski, "High-Frequency Modeling of Power
Transformers for Use in Frequency Response Analysis (FRA)," Power Delivery, IEEE
Transactions on, vol. 23, pp. 2042-2049, 2008.
[69] E. P. Dick, C. C. Erven, and S. M. Harvey, "Grounding System Tests for Analysis of Fault-
Induced Voltages on Communication Cables," Power Apparatus and Systems, IEEE
Transactions on, vol. PAS-98, pp. 2115-2125, 1979.
[70] R. Malewski and B. Poulin, "Impulse testing of power transformers using the transfer function
method," Power Delivery, IEEE Transactions on, vol. 3, pp. 476-489, 1988.
[71] C. A2.26, "Mechanical Condition Assessment of Transformer Windings Using Frequency Response Analysis (FRA)," CIGRE Brochure 342April 2008.
[72] K. Kre , König, D., "Comparison of measured resonance frequencies of coilsat sinusoidal and
impulse voltage excitation," Proc. of the 7th Int. Symp. on High Voltage Engineering (ISH
1991), Technische universität Dresden, August 26-30,1991.
[73] S. Tenbohlen, Ryder, S.A.,, "Making Frequency Response Analysis Measurements: A
Comparison of the Swept Frequency and Low Voltage Impulse Methods," Proc. of the 13th
Int. Symp. on High-Voltage Engineering(ISH2003), Netherlands 2003.
[74] K. G. N. B. Abeywickrama, Y. V. Serdyuk, and S. M. Gubanski, "Exploring possibilities for
characterization of power transformer insulation by frequency response analysis (FRA),"
Power Delivery, IEEE Transactions on, vol. 21, pp. 1375-1382, 2006.
[75] A. Abu-Siada, N. Hashemnia, S. Islam, and M. A. S. Masoum, "Understanding power transformer frequency response analysis signatures," Electrical Insulation Magazine, IEEE,
vol. 29, pp. 48-56, 2013.
[76] H. Firoozi, M. Kharezi, H. Rahimpour, and M. Shams, "Transformer Fault Diagnosis Using
Frequency Response Analysis - Practical Studies," in Power and Energy Engineering
Conference (APPEEC), 2011 Asia-Pacific, 2011, pp. 1-4.
[77] S. D. Mitchell, J. S. Welsh, and B. T. Phung, "Relating a distribution transformer's connection
topology and the influence of inductive disparity to the observed frequency response," in
Power Engineering Conference, 2008. AUPEC '08. Australasian Universities, 2008, pp. 1-6.
[78] S. D. Mitchell and J. S. Welsh, "Modeling Power Transformers to Support the Interpretation
of Frequency-Response Analysis," Power Delivery, IEEE Transactions on, vol. 26, pp. 2705-
2717, 2011.
[79] S. D. Mitchell and J. S. Welsh, "The Influence of Complex Permeability on the Broadband Frequency Response of a Power Transformer," Power Delivery, IEEE Transactions on, vol.
25, pp. 803-813, 2010.
[80] S. A. Ryder, "Diagnosing transformer faults using frequency response analysis," Electrical
Insulation Magazine, IEEE, vol. 19, pp. 16-22, 2003.

94
[81] E. Bjerkan and H. K. Høidalen, "High frequency FEM-based power transformer modeling:
Investigation of internal stresses due to network-initiated overvoltages," Electric Power
Systems Research, vol. 77, pp. 1483-1489, 2007.
[82] T. Leibfried and K. Feser, "Off-line- and on-line-monitoring of power transformers using the
transfer function method," in Electrical Insulation, 1996., Conference Record of the 1996 IEEE
International Symposium on, 1996, pp. 34-37 vol.1.
[83] T. Leibfried and K. Feser, "Monitoring of power transformers using the transfer function
method," Power Delivery, IEEE Transactions on, vol. 14, pp. 1333-1341, 1999.
[84] J. Christian, " Erkennung mechanischer Wicklungsschäden inTransformatoren mit der
Übertragungsfunktion " Dissertation, ISBN 3-8322-0480-6 ,University of Stuttgart, 2001. [85] J. Christian and K. Feser, "Procedures for detecting winding displacements in power
transformers by the transfer function method," Power Delivery, IEEE Transactions on, vol.
19, pp. 214-220, 2004.
[86] E. Rahimpour, "Hochfrequente Modellierung von Transformatoren zur Berechnung der
Übertragungsfunktion, ," Dissertation, ISBN 3-8265-9227-1, University of Stuttgart, 2001.
[87] M. Bigdeli, M. Vakilian, and E. Rahimpour, "Transformer winding faults classification based
on transfer function analysis by support vector machine," Electric Power Applications, IET,
vol. 6, pp. 268-276, 2012.
[88] M. J. Pykälä, "Transfer Function as a Diagnostic Tool in Testing of Power and Distribution
Transformers, Report TKK-SJT-68, ISBN 951-22-6905-8, Helsinki University of Technology,
High Voltage Institute,," Espoo, Finland,December 2003. [89] A. J. Vandermaar, Wang, M.,, "Transformer Condition Monitoring by Frequency Response
Analysis ., August 25-29, 1997, Montreal, ," Proc. of the 10th Int. Symp. on High Voltage
Eng(ISH1997), August 25-29, 1997Canada, pp. 119-122.
[90] M. Wang, A. J. Vandermaar, and K. D. Srivastava, "Transformer winding movement
monitoring in service - key factors affecting FRA measurements," Electrical Insulation
Magazine, IEEE, vol. 20, pp. 5-12, 2004.
[91] M. Wang, A. J. Vandermaar, and K. D. Srivastava, "Condition monitoring of transformers in
service by the low voltage impulse test method," in High Voltage Engineering, 1999. Eleventh
International Symposium on (Conf. Publ. No. 467), 1999, pp. 45-48 vol.1.
[92] G. McDowell, "Condition Monitoring of Power Transformers to Assess Residual Life and
Fault Damage " ERA Report 88-0566R, 44 p., June 1989.
[93] W. Doble Engineering Company, Massachusetts. M5100 SFRA Instrument User’s Guide [Online].
[94] H. K. Høidalen, Brede, A.P., Lundgaard, L.,, " “Transformer winding diagnosis using the
transfer function approach," 2001 Nordic Symposium on Electrical Insulation, Stockholm,
Sweden.
[95] L. Bolduc, Picher ,P., Pare, G., Demers, R.J., Belanger, J., ", “Detection of Transformer
Winding Displacement by the Frequency Response of Stray Losses (FRSL)”," Cigre 12/33-
02, 2000.
[96] C. Bartoletti, M. Desiderio, D. Di Carlo, G. Fazio, F. Muzi, G. Sacerdoti, and F. Salvatori,
"Vibro-acoustic techniques to diagnose power transformers," Power Delivery, IEEE
Transactions on, vol. 19, pp. 221-229, 2004.
[97] B. Weiser, H. Pfutzner, and J. Anger, "Relevance of magnetostriction and forces for the generation of audible noise of transformer cores," Magnetics, IEEE Transactions on, vol. 36,
pp. 3759-3777, 2000.
[98] P. I. Fergestad and T. Henriksen, "Inductances for the Calculation of Transient Oscillations in
Transformers," Power Apparatus and Systems, IEEE Transactions on, vol. PAS-93, pp. 510-
517, 1974.
[99] D. J. Wilcox, M. Conlon, and W. G. Hurley, "Calculation of self and mutual impedances for
coils on ferromagnetic cores," Physical Science, Measurement and Instrumentation,
Management and Education - Reviews, IEE Proceedings A, vol. 135, pp. 470-476, 1988.
[100] L. F. Blume and A. Boyajian, "Abnormal Voltages within Transformers," American Institute
of Electrical Engineers, Transactions of the, vol. XXXVIII, pp. 577-620, 1919.
[101] J. H. McWhirter, C. D. Fahrnkopf, and J. H. Steele, "Determination of Impulse Stresses within
Transformer Windings by Computers [includes discussion]," Power Apparatus and Systems, Part III. Transactions of the American Institute of Electrical Engineers, vol. 75, 1956.
[102] R. B. Shipley, D. Coleman, and C. F. Watts, "Transformer Circuits for Digital Studies," Power
Apparatus and Systems, Part III. Transactions of the American Institute of Electrical
Engineers, vol. 81, pp. 1028-1030, 1962.

95
[103] C. M. Arturi, "Transient simulation and analysis of a three-phase five-limb step-up transformer
following an out-of-phase synchronization," Power Delivery, IEEE Transactions on, vol. 6,
pp. 196-207, 1991.
[104] K. W. Wagner, "The Progress of an Electromagnetic Wave in a Coil with Capacity between
Turns," Elektrotechnik und Maschinenbau, Vol.33, 1915, pp. 89-92 & pp.105-108.
[105] B. Gustavsen and A. Semlyen, "Application of vector fitting to state equation representation
of transformers for simulation of electromagnetic transients," Power Delivery, IEEE
Transactions on, vol. 13, pp. 834-842, 1998.
[106] M. V. K. Chari, J. D'Angelo, M. Palmo, and D. K. Sharma, "Application of Three-Dimensional
Electromagnetic Analysis Methods to Electrical Machinery and Devices," Energy Conversion, IEEE Transactions on, vol. EC-1, pp. 145-150, 1986.
[107] G. Lian, Y. Ruoping, and C. Pizhang, "An Equivalent Magnetization Surface Current
Approach of Calculation 3-Dimensional Leakage Fields of a Transformer," Power Delivery,
IEEE Transactions on, vol. 2, pp. 817-822, 1987.
[108] U. Gafvërt, Frimpong, G., Fuhr, J., "Modeling of Dielectric Measurements on Power
Transformers," CIGRE, 15-103, 1998.
[109] T. Orosz, Z. A. Tamus, and I. Vajda, "Modeling the high frequency behavior of the Rogowski-
coil passive L/r integrator current transducer with analytical and finite element method," in
Power Engineering Conference (UPEC), 2014 49th International Universities, 2014, pp. 1-4.
[110] F. de León, "Transformer Model for the Study of Electromagnetic Transients," Dissertation,
University of Toronto, 1992. [111] S. Chimklay, "High-Frequency Transformer Model for Switching Transient Studies Doctoral
Dissertation," University of British Columbia, 1995.
[112] W. L. A. Neves, "Transformer Modeling for Transient Studies”, Doctoral Dissertation,"
University of British Columbia, 1994.
[113] P. I. Fergestad, " Transient oscillations in transformer windings”, dissertation," NTH, Norway,
1971.
[114] D. J. Wilcox, W. G. Hurley, and M. Conlon, "Calculation of self and mutual impedances
between sections of transformer windings," Generation, Transmission and Distribution, IEE
Proceedings C, vol. 136, pp. 308-314, 1989.
[115] E. E. Mombello, " Modeling of a coil system considering frequency-dependent inductances
and losses; I. Analysis of the impedance matrix characteristics”, El. Eng. Springer Verlag, Vol.
84,, pp. 3-10," 2002. [116] S. D. a. S. I. A. Abu-Siada, "Frequency Response Analysis using High Frequency Transformer
Model " presented at the middle East Power Engineering conference MEPCON, Egypt, 2009.
.
[117] S. V. Kulkarni and G. B. Kumbhar, "Analysis of Short Circuit Performance of Split-Winding
Transformer Using Coupled Field-Circuit Approach," in Power Engineering Society General
Meeting, 2007. IEEE, 2007, pp. 1-1.
[118] G. B. Kumbhar and S. V. Kulkarni, "Analysis of Short-Circuit Performance of Split-Winding
Transformer Using Coupled Field-Circuit Approach," Power Delivery, IEEE Transactions on,
vol. 22, pp. 936-943, 2007.
[119] A. D. Podoltsev, K. G. N. B. Abeywickrama, Y. V. Serdyuk, and S. M. Gubanski, "Multiscale
Computations of Parameters of Power Transformer Windings at High Frequencies. Part II: Large-Scale Level," Magnetics, IEEE Transactions on, vol. 43, pp. 4076-4082, 2007.
[120] A. Group, "Ansoft Maxwell," 16.0.0 ed. Australia Leading Engineering Application Providers
Australia, 2013.
[121] (2009). ABB TRANSFORMER HANDBOOK.
[122] M. Crow, ELECTRIC POWER TRANSFORMER ENGINEERING. The USA: Library of
Congress Cataloging-, 2010.
[123] R. H. Larry Lawhead, John Horak Basler Electric Company, Three Phase Transformer
Winding Configurations and Differential Relay Compensation, 2006.
[124] A. Mikulecky and Z. Stih, "Influence of temperature, moisture content and ageing on oil
impregnated paper bushings insulation," Dielectrics and Electrical Insulation, IEEE
Transactions on, vol. 20, pp. 1421-1427, 2013.
[125] D. M. Sofian, W. Zhongdong, and L. Jie, "Interpretation of Transformer FRA Responses— Part II: Influence of Transformer Structure," Power Delivery, IEEE
Transactions on, vol. 25, pp. 2582-2589, 2010.
[126] W. Zhongdong, L. Jie, and D. M. Sofian, "Interpretation of Transformer FRA
Responses— Part I: Influence of Winding Structure," Power Delivery, IEEE

96
Transactions on, vol. 24, pp. 703-710, 2009.
[127] O. A. Mohammed, Z. Liu, S. Liu, and N. Y. Abed, "Finite-element-based nonlinear physical
model of iron-core transformers for dynamic simulations," Magnetics, IEEE Transactions on,
vol. 42, pp. 1027-1030, 2006.
[128] E. Billig, "Mechanical stresses in transformer windings," Electrical Engineers - Part II: Power
Engineering, Journal of the Institution of, vol. 93, pp. 227-243, 1946.
[129] M. Arshad and S. M. Islam, "Power transformer critical diagnostics for reliability and life
extension," in Electrical and Computer Engineering, 2004. Canadian Conference on, 2004,
pp. 625-628 Vol.2.
[130] A. G. Kladas, M. P. Papadopoulos, and J. A. Tegopoulos, "Leakage flux and force calculation on power transformer windings under short-circuit: 2D and 3D models based on the theory of
images and the finite element method compared to measurements," Magnetics, IEEE
Transactions on, vol. 30, pp. 3487-3490, 1994.
[131] R. Tang, S. Wang, Y. Li, X. Wang, and X. Cui, "Transient simulation of power transformers
using 3D finite element model coupled to electric circuit equations," Magnetics, IEEE
Transactions on, vol. 36, pp. 1417-1420, 2000.
[132] M. Bagheri, B. T. Phung, and T. Blackburn, "Transformer frequency response analysis:
mathematical and practical approach to interpret mid-frequency oscillations," Dielectrics and
Electrical Insulation, IEEE Transactions on, vol. 20, pp. 1962-1970, 2013.
[133] M. F. Beavers and C. M. Adams, "The Calculation and Measurement of Axial Electromagnetic
Forces on Concentric Coils in Transformers," Power Apparatus and Systems, Part III. Transactions of the American Institute of Electrical Engineers, vol. 78, pp. 467-477, 1959.
[134] A. Hyun-Mo, O. Yeon-Ho, K. Joong-Kyoung, S. Jae-Sung, and H. Sung-Chin, "Experimental
Verification and Finite Element Analysis of Short-Circuit Electromagnetic Force for Dry-Type
Transformer," Magnetics, IEEE Transactions on, vol. 48, pp. 819-822, 2012.
[135] S. Liu, Z. Liu, and O. A. Mohammed, "FE-Based Modeling of Single-Phase Distribution
Transformers With Winding Short Circuit Faults," Magnetics, IEEE Transactions on, vol. 43,
pp. 1841-1844, 2007.
[136] R. Tang, Y. Li, D. Li, and L. Tian, "Numerical calculation of 3D eddy current field and short
circuit electromagnetic force in large transformers," Magnetics, IEEE Transactions on, vol.
28, pp. 1418-1421, 1992.
[137] J. A. S. B. Jayasinghe, Z. D. Wang, P. N. Jarman, and A. W. Darwin, "Winding movement in
power transformers: a comparison of FRA measurement connection methods," Dielectrics and Electrical Insulation, IEEE Transactions on, vol. 13, pp. 1342-1349, 2006.
[138] A. A. Reykherdt and V. Davydov, "Case studies of factors influencing frequency response
analysis measurements and power transformer diagnostics," Electrical Insulation Magazine,
IEEE, vol. 27, pp. 22-30, 2011.
[139] M. Wang, A. J. Vandermaar, and K. D. Srivastava, "Improved detection of power transformer
winding movement by extending the FRA high frequency range," Power Delivery, IEEE
Transactions on, vol. 20, pp. 1930-1938, 2005.
[140] C. Yao, Z. Zhao, Y. Chen, X. Zhao, Z. Li, Y. Wang, Z. Zhou, and G. Wei, "Transformer
winding deformation diagnostic system using online high frequency signal injection by
capacitive coupling," Dielectrics and Electrical Insulation, IEEE Transactions on, vol. 21, pp.
1486-1492, 2014. [141] P. M. Nirgude, D. Ashokraju, A. D. Rajkumar, and B. Singh, "Application of numerical
evaluation techniques for interpreting frequency response measurements in power
transformers," Science, Measurement & Technology, IET, vol. 2, pp. 275-285, 2008.
[142] M. R. Patel, "Dynamic Response of Power Transformers Under Axial Short Circuit Forces
Part I - Winding and Clamp as Individual Components," Power Apparatus and Systems, IEEE
Transactions on, vol. PAS-92, pp. 1558-1566, 1973.
[143] M. R. Patel, "Dynamic Response of Power Transformers Under Axial Short Circuit Forces
Part II - Windings and Clamps as a Combined System," Power Apparatus and Systems, IEEE
Transactions on, vol. PAS-92, pp. 1567-1576, 1973.
[144] M. Arshad, S. M. Islam, and A. Khaliq, "Power transformer asset management," in Power
System Technology, 2004. PowerCon 2004. 2004 International Conference on, 2004, pp. 1395-
1398 Vol.2. [145] H. A. Thompson, F. Tillery, and D. U. Von Rosenberg, "The Dynamic Response of Low
Voltage, High Current, Disk type Transformer Windings to through Fault Loads," Power
Apparatus and Systems, IEEE Transactions on, vol. PAS-98, pp. 1091-1098, 1979.
[146] "The short-circuit strength of the inner windings of transformers against radial forces," CIGRE,

97
Paris, France,1962.
[147] W. M. J. R. B. Steel, J. J.Narbus, M. R. Patel, R.A.Nelson, "Dynamic measurements in power
transformers under short-circuit conditions," ed: CIGRE, 1972.
[148] K. Ludwikowski, K. Siodla, and W. Ziomek, "Investigation of transformer model winding
deformation using sweep frequency response analysis," Dielectrics and Electrical Insulation,
IEEE Transactions on, vol. 19, pp. 1957-1961, 2012.
[149] J. Christian, K. Feser, U. Sundermann, and T. Leibfried, "Diagnostics of power transformers
by using the transfer function method," in High Voltage Engineering, 1999. Eleventh
International Symposium on (Conf. Publ. No. 467), 1999, pp. 37-40 vol.1.
[150] A. Shintemirov, W. H. Tang, and Q. H. Wu, "Transformer winding condition assessment using frequency response analysis and evidential reasoning," Electric Power Applications, IET, vol.
4, pp. 198-212, 2010.
[151] A. Shintemirov, W. H. Tang, and Q. H. Wu, "Construction of transformer core model for
frequency response analysis with genetic Algorithm," in Power & Energy Society General
Meeting, 2009. PES '09. IEEE, 2009, pp. 1-5.
[152] A. Shintemirov, W. H. Tang, and Q. H. Wu, "Transformer Core Parameter Identification Using
Frequency Response Analysis," Magnetics, IEEE Transactions on, vol. 46, pp. 141-149, 2010.
[153] D. L. Alvarez, J. A. Rosero, and E. E. Mombello, "Circuit model of transformers windings
using vector fitting, for frequency response analysis (FRA) PART II: Core influence," in Power
Electronics and Power Quality Applications (PEPQA), 2013 Workshop on, 2013, pp. 1-5.
[154] E. Gomez-Luna, G. Aponte Mayor, J. Pleite Guerra, D. F. Silva Salcedo, and D. Hinestroza Gutierrez, "Application of Wavelet Transform to Obtain the Frequency Response of a
Transformer From Transient Signals—Part 1: Theoretical Analysis," Power Delivery,
IEEE Transactions on, vol. 28, pp. 1709-1714, 2013.
[155] M. B. Goff and A. H. Eltom, "Oil filled bushing secrets revealed," in Industry Applications
Society Annual Meeting, 2013 IEEE, 2013, pp. 1-9.
[156] F. Meghnefi, I. Fofana, H. Hemmatjou, and M. Farzaneh, "Deriving an equivalent circuit of
composite oil paper insulation for understanding the Frequency Domain Spectroscopic
measurements," in Electrical Insulation and Dielectric Phenomena, 2009. CEIDP '09. IEEE
Conference on, 2009, pp. 478-481.
[157] M. Melo, M. E. G. Alves, and G. A. Moura, "Experience with on-line monitoring of
capacitance and tangent delta of condensive bushings," in Transmission and Distribution
Conference and Exposition: Latin America, 2008 IEEE/PES, 2008, pp. 1-6. [158] R. Nikjoo and H. Edin, "Effect of transformer winding on the transient response of power
transformer bushings," in Lightning Protection (ICLP), 2012 International Conference on,
2012, pp. 1-5.
[159] Z. Daxiong, "An improved method of measuring C<sub>1</sub> power factor of resistance-
graded bushings," Power Delivery, IEEE Transactions on, vol. 14, pp. 437-442, 1999.
[160] Y. Du, M. Zahn, B. C. Lesieutre, A. V. Mamishev, and S. R. Lindgren, "Moisture equilibrium
in transformer paper-oil systems," Electrical Insulation Magazine, IEEE, vol. 15, pp. 11-20,
1999.
[161] J. A. Lapworth, "Detection of winding movement in power transformers by frequency response
analysis (FRA)," presented at the Transformer Int’l. Conf. Power Transformers, Kolobrzeg,
Poland, 1999. [162] Z. Haijun, Y. Bin, X. Weijie, W. Shuhong, W. Guolin, H. Youpeng, and Z. Jingyin, "Dynamic
Deformation Analysis of Power Transformer Windings in Short-Circuit Fault by FEM,"
Applied Superconductivity, IEEE Transactions on, vol. 24, pp. 1-4, 2014.
[163] M. Bagheri, M. S. Naderi, and T. Blackburn, "Advanced transformer winding deformation
diagnosis: moving from off-line to on-line," Dielectrics and Electrical Insulation, IEEE
Transactions on, vol. 19, pp. 1860-1870, 2012.
[164] M. Bagheri, M. S. Naderi, T. Blackburn, and T. Phung, "Practical challenges in online
transformer winding deformation diagnostics," in Electric Power and Energy Conversion
Systems (EPECS), 2011 2nd International Conference on, 2011, pp. 1-6.
[165] M. Bagheri, M. S. Naderi, T. Blackburn, and T. Phung, "FRA vs. short circuit impedance
measurement in detection of mechanical defects within large power transformer," in Electrical
Insulation (ISEI), Conference Record of the 2012 IEEE International Symposium on, 2012, pp. 301-305.
[166] A. Setayeshmehr, I. Fofana, C. Eichler, A. Akbari, H. Borsi, and E. Gockenbach, "Dielectric
spectroscopic measurements on transformer oil-paper insulation under controlled laboratory
conditions," Dielectrics and Electrical Insulation, IEEE Transactions on, vol. 15, pp. 1100-

98
1111, 2008.
[167] J. A. Almendros-Ibaez, J. C. Burgos, and B. Garcia, "Transformer Field Drying Procedures: A
Theoretical Analysis," Power Delivery, IEEE Transactions on, vol. 24, pp. 1978-1986, 2009.
[168] P. Hua-Dong, D. Ming, R. Ming, M. Jin, and Z. Zhi, "Insulation diagnosis for 220kV oil-
immersed current transformer by frequency dielectric spectroscopy," in Electrical Insulation
Conference (EIC), 2011, 2011, pp. 69-73.

99
Every reasonable effort has been made to acknowledge the owners of copyright
material. I would be pleased to hear from any copyright owner who has been omitted
or incorrectly acknowledged.
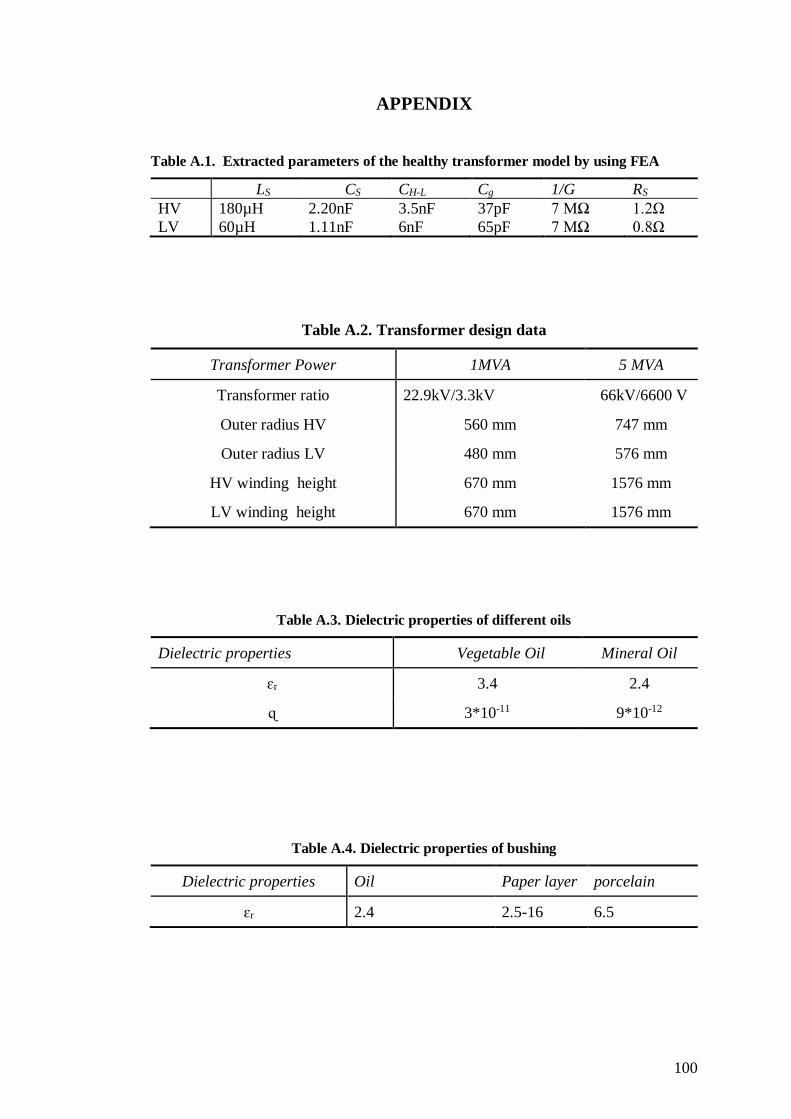
100
APPENDIX
Table A.1. Extracted parameters of the healthy transformer model by using FEA
LS CS CH-L Cg 1/G RS
HV 180µH 2.20nF 3.5nF 37pF 7 MΩ 1.2Ω
LV 60µH 1.11nF 6nF 65pF 7 MΩ 0.8Ω
Table A.2. Transformer design data
Transformer Power 1MVA 5 MVA
Transformer ratio 22.9kV/3.3kV 66kV/6600 V
Outer radius HV 560 mm 747 mm
Outer radius LV 480 mm 576 mm
HV winding height 670 mm 1576 mm
LV winding height 670 mm 1576 mm
Table A.3. Dielectric properties of different oils
Dielectric properties Vegetable Oil Mineral Oil
ɛr 3.4 2.4
ɋ 3*10-11 9*10-12
Table A.4. Dielectric properties of bushing
Dielectric properties Oil Paper layer porcelain
ɛr 2.4 2.5-16 6.5

101
Table A.5. Transformer Parameters (3 phase)
Description Value
HV/LV Rating 11kV / 433V
Z% 9.49
HV Terminal Resistance 0.915Ω
HV Inductance 101mH
LV Inductance 20µH
HV-LV Cap 75 pF
LV-Core Cap 63pF
HV-Tank Cap 11pF
Table A.6. Extracted parameters of the healthy transformer model by using FEA
Electrical parameters C1 C2 LS RS
Value 2000pF 450pF 2.5µH 0.2Ω