Embed Size (px)
Citation preview

This is an electronic reprint of the original article.This reprint may differ from the original in pagination and typographic detail.
Powered by TCPDF (www.tcpdf.org)
This material is protected by copyright and other intellectual property rights, and duplication or sale of all or part of any of the repository collections is not permitted, except that material may be duplicated by you for your research use or educational purposes in electronic or print form. You must obtain permission for any other use. Electronic or print copies may not be offered, whether for sale or otherwise to anyone who is not an authorised user.
Rodera, O.; Pärnänen, T.; Jokinen, J.; Lindgren, M.; Sarlin, E.; Kanerva, M.Chemical ageing effects on the ply and laminate strength of a filament wound cross-ply GFRP
Published in:Composite Structures
DOI:10.1016/j.compstruct.2020.113508
Published: 15/03/2021
Document VersionPublisher's PDF, also known as Version of record
Published under the following license:CC BY
Please cite the original version:Rodera, O., Pärnänen, T., Jokinen, J., Lindgren, M., Sarlin, E., & Kanerva, M. (2021). Chemical ageing effectson the ply and laminate strength of a filament wound cross-ply GFRP. Composite Structures, 260, [113508].https://doi.org/10.1016/j.compstruct.2020.113508

Composite Structures 260 (2021) 113508
Contents lists available at ScienceDirect
Composite Structures
journal homepage: www.elsevier .com/locate /compstruct
Chemical ageing effects on the ply and laminate strength of a filamentwound cross-ply GFRP
https://doi.org/10.1016/j.compstruct.2020.113508Received 14 February 2020; Revised 6 December 2020; Accepted 16 December 2020Available online 25 December 20200263-8223/© 2020 The Authors. Published by Elsevier Ltd.This is an open access article under the CC BY license (http://creativecommons.org/licenses/by/4.0/).
⇑ Corresponding author.E-mail address: [email protected] (O. Rodera).
O. Rodera a,⇑, T. Pärnänen a,b, J. Jokinen a, M. Lindgren c, E. Sarlin a, M. Kanerva a
aTampere University, Faculty of Engineering and Natural Sciences, Engineering Materials Science, P.O. Box 589, 33014 Tampere, FinlandbAalto University, School of Engineering, Department of Mechanical Engineering, P.O. Box 14300, FI-00076 Aalto, FinlandcOutotec Research Center, P.O. Box 69, 28101 Pori, Finland
A R T I C L E I N F O A B S T R A C T
Keywords:ageingfinite element modellingfailure criteriaGFRPvinyl ester
This work presents a numerical approach to multi‐routines based on experiments, and, with a target to analysestrength of a cross‐ply glass fibre reinforced plastics (GFRP) composite after immersion in sulphuric acid solu-tion under pressure (5% H2SO4 solution, 95 °C, 15 bar). Two alternative vinyl ester resins (bisphenol A digly-cidyl ether and epoxy phenol novolac) were investigated. After 0.5, 1, 1.5 and 2 years of conditioning, thespecimens were mechanically tested. The multi‐scale definition of the material system and its virtual condition-ing were performed in a finite element (FE) model. The Hashin 3D failure criterion was implemented by codingthe UMAT subroutine when using the Abaqus software. The experimental results demonstrated better perfor-mance of the bisphenol A vinyl ester resin‐based GFRP when a thin barrier layer is used. The numerical resultsindicated that the shear strength property was the most susceptible at weak zones to present a tendency fordegradation after one year of conditioning.
1. Introduction
Filament winding is a method for producing tubular, rotationallysymmetric products made of composite materials. They are typicallycomposed of glass fibre reinforced plastics (GFRP) with several appli-cations in the chemical industry. The applications of these materialsare various tubes, storage tanks and vessels that often need to sealgas or liquid inside. These operational conditions cause changes inthe material's micro‐structure even at low levels of deformation. Con-sequently, it is necessary to identify the mechanical properties (stiff-ness and strength) of the materials, as well as the behaviour ofmicro‐components and the macro‐structure [1,2].
In addition, the changes in the evolution of the mechanical beha-viour can be degraded by the chemical environment during the oper-ational lifetime of the material and structure. This can include theeffects of moisture, temperature, pressure and chemicals that are typ-ically referred to as ageing. The ageing due to conditioning can resultin changes of the resin component (often thermoset matrix) and thoseoccur at the covalent bonds of the molecular chains [3]. Nevertheless,an advanced resin to be used as the matrix component is vinyl ester,which possesses good corrosion resistance and mechanical propertiesmaking it suitable for many industrial applications [4–6].
Currently, the long‐term mechanical performance of vinyl esterresin in fibre reinforced plastics (FRP) is being increasingly studiedin numerous works. Researchers have been particularly devoted toanalysing the effects of GFRP specimens subject to a sulphuric acidimmersion and subsequent tensile and flexural tests. Banna and Mol-gaard [7] carried out a comparison between the performance ofbisphenol A epoxy vinyl ester and polyester (pure) resins. The resultsdemonstrated superior capabilities for bisphenol A epoxy vinyl esterresin in terms of bending and tensile tests, and a lower penetrationof the acid medium into the micro‐structure. Kootsookos and Burchill[8] studied the corrosion resistance of a certain vinyl ester resin bymeans of an analysis of variances. They concluded that fibre volumefraction affected ageing, which stabilised after six months of condition-ing. Similarly to the acid‐sulphuric immersion, Cabral‐Fonseca et al.[9] applied different water immersion conditions and, interestingly,found that flexural properties were more affected by conditioning thantensile and shear (interlaminar) properties.
Most of the research works involve loading conditions in tension orbending leading to specific types of failure. Specifically, under tensiletests in the longitudinal direction, the cross‐ply laminate fails due totransversal damage and then longitudinal damage [10]. This can bealso altered by the ageing effects and, thus, the material modelling is

O. Rodera et al. Composite Structures 260 (2021) 113508
required to accurately predict and analyse the degradation mecha-nisms. This can be done by taking into account the design factors(e.g. reinforcement type), defects in micro‐structure (such as voids),boundary conditions and failure modes.
To predict ageing, advances have been made in the modelling ofcomposite plies. Barbero and Damiani [11] predicted the tensilestrength of GFRP by a model based on curve‐fitted data collectedfrom the literature. Krishnan and Oskay [12] proposed a multi‐scale damage model to capture the compression‐after‐impactresponse of GFRP first immersed in seawater. Naya et al. [13,14]obtained significant results by using computational micromechanicsthat were implemented in a finite element (FE) modelling. Thedeformation and fracture mechanisms were simulated in a ply ofcarbon FRP and under different environmental conditions. Theresults were compared to the implementations of the Puck [15]and LaRC04 [16] failure criteria. Their damage evolution modelswere applied up to ultimate failure and good correlation wasobtained, especially, with the LaRC04 criterion in terms of the com-pression strength. Typically, the onset of mechanical failure is thelimiting factor applied to design procedures. In consequence, majorwork was carried out to evaluate the performance of failure criteriathrough the World Wide Failure Exercise (WWFE) [17]. This base-line work focused on elucidating the three‐dimensional (3D) stressstate and the failure of laminates during the second exercise(WWFE‐II) [18].
This paper presents an experimental and numerical analysis of afilament‐wound GFRP composite. The target is to evaluate experimen-tal results for the material modelling subject to tensile loading caseand understand the major tendency of degradation of the strengthproperties for the condition affected by ageing. The material was agedin a sulphuric acid environment (5% H2SO4 solution, 95°C, 15 bar) fora maximum of two years. A detailed experimental test programme wascarried out including uni‐axial and flexural tests. A micromechanicalhomogenisation method and FE modelling were employed to simulatethe mechanical response of GFRP specimens. The strength analysis wasimplemented by means of the Hashin 3D failure criterion [19–21] asdamage activation functions through the UMAT subroutine (Abaqus/Standard).
Fig. 1. Manufacturing procedures and lay-up for the specimens in t
2
2. Material and methods
2.1. Laminate preparation and manufacturing defects
This present work investigated two vinyl ester resins: Derakane455–400 (bisphenol A diglycidyl ether (DGEBA) based resin, suppliedby Ashland) and Atlac E‐Nova FW 1045 (epoxy phenol novolac (EPN)based resin, supplied by DSM). Atlac E‐Nova FW 1045 resin (namedresin‐A) has generally good thermal and chemical resistance. Derakane455–400 resin (resin‐D) shows high flexibility and slightly reducedchemical and heat resistance. The GFRP with resin‐D has presented atypical mass increase in sulphuric acid solution immersion for oneyear, while the GFRP with resin‐A presented rather low mass increase[22].
Fig. 1 shows the manufacturing procedures and material processingof the GFRP specimens in this study. The dimensions of the filament‐wound tubes are presented in Fig. 1, as well as the laminate lay‐upsof the structural layer. In addition, the tubes were manufactured withbarrier layers (outer parts), which carried out the protective functionagainst chemical attack from the medium inside. Therefore, both typesof layers constituted the section of the specimens.
The tubes were manufactured with three different configurationsdepending on the sequence and thickness of the barrier layers.According to these characteristics, the tubes were categorised by Sec-tions 1–3 (see Fig. 2). The barrier layers were made with nine layersof chopped strand mat (M723A, 300 g/m2, Owens Corning) forming athickness of 6 mm. The inner surfaces of the specimens were coveredwith a layer of ECR‐glass surface mat (M524‐ECR30S, 30 g/m2,Owens Corning).
The structural layer was manufactured by using the winding tech-nique and a lay‐up of ½902/0/ð90=0Þ14=902=0=902� equal for all thetube configurations. The 0° plies were based on 20 layers of windingroving (U480 R25HX14, 480 g/m2, 3B‐fibreglass) and the 90° plieson 16 layers of axial roving (UD256 R12‐256‐T, 256 g/m2, Ahlstrom).The UD256 reinforcement was wound on a mandrel in the perpendic-ular direction with respect to the longitudinal axis of the tube (90°).The whole tube length was covered by a circumferential winding(see Fig. 1).
his study (longitudinal direction is defined as the 0° direction).

Fig. 2. Cross-sections of the GFRP-A and GFRP-D panels, categorised by means of the thickness and sequence of barrier layers as Sections 1–3.
O. Rodera et al. Composite Structures 260 (2021) 113508
The U480 reinforcement was formed by unidirectional tapes (UT)of 200 mm width, orientating its fibres in the longitudinal direction(0° angle). The UTs were positioned in such a way that the ends nom-inally overlapped 10 mm in each rotation. This overlapping repeateditself every 190 mm, generating a patterned defect in the lay‐upthrough the thickness (see Fig. 1). The properties of the glass fibresfor both kinds of ply are shown in Table 1.
2.2. Experimental specimens
2.2.1. Chemical conditioningOnce the tubes were manufactured, GFRP‐A and GFRP‐D panels
(with the corresponding sections) were cut out in a size of400�400 mm2 and sealed with resin at the edges. Subsequently, thepanels were conditioned by immersion procedure at a temperatureof 95 °C and a pressure of 15 bar (see Fig. 3). The sulphuric acid–waterbath was based on 5% H2SO4 solution. For avoiding harsh corrosion inthe metallic parts of the system, 0.5 g=l of Fe2ðSO4Þ3 was added to act
Table 1The properties of micro-components of the material as provided by the manufacture
Resin Density ðkg=m3Þ Ultimate strain� ð%Þ Te
Resin-A 1145 5–6 3.3Resin-D 1040 4 3.5
Fibre�� Density ðkg=m3Þ Areal weight (g=m2) Te
Glass (U480) 2620 480 79Glass (UD256) 2540 256 72
� Elongation at yield.�� Ultimate strain of 2.6% [25].
Fig. 3. I) Section matter of the tube; II) panel for conditioning (one quarter of smconditioning (structural + barrier layers), V) specimens for mechanical tests (stru
3
as an inhibitor. Series of GFRP panels were removed from the reactorafter 0.5, 1, 1.5 and 2 years of conditioning and, subsequently, themass was measured ð�1 gÞ. Different reactors were used accordingto the resin used and no specimens already conditioned were sub-merged back.
Additionally, the same process of conditioning was carried out withpure resin specimens (Resin‐A and Resin‐D) but limiting their ageingup to one year. The results for the first measurements are reportedin earlier works [22,2].
2.2.2. Resin testingThe pure resin specimens (Resin‐A and Resin‐D) were subject to a
three‐point bending test according to ISO 178:2010 [24]. The speci-mens had a nominal thickness of 6 mm and planar dimensions of15mm�80mm. They were tested with an universal testing machine(Electropuls E 3000, Instron) with a 3 kN load cell and computerisedcontrol (WaveMatrix, Instron). The displacement rate was 2 mm/min. The testing was carried out for six non‐aged specimens and six
rs [22,23].
nsile modulus ðGPaÞ Poisson’s ratio (–) Tensile strength ðMPaÞ
0.3 850.32 88
nsile modulus ðGPaÞ Poisson’s ratio (–) Tensile strength ðMPaÞ
0.2 2750.4 0.2 2450
aller tube section); III) reactors of the conditioning; IV) aged specimens afterctural layer).

O. Rodera et al. Composite Structures 260 (2021) 113508
specimens with a condition after one year‐immersion. The averageflexural modulus, proof stress at 0.05% plastic strain and ultimatestrength were determined; details of the test procedures and analysismethods are given in a previous work [2].
Similarly, a procedure of prior ageing and following mechanicalexperiments was carried out on pure glass fibres. However, measureddata could not be obtained after an ageing condition of more than twoweeks. The 5% H2SO4 solution resulted in a harsh environment for thefibres [25].
2.2.3. Tensile testingThe GFRP panels were cut in narrow pieces without the barrier lay-
ers after the ageing (see Fig. 3‐V). They were categorised as GFRP‐Dand GFRP‐A and per section (Sections 1–3). The specimens were sub-jected to uni‐axial tensile testing in the longitudinal direction at aroom temperature in accordance with ISO 527‐4 [26]. End tabs werenot used. The tests were performed using a servo–hydraulic tester(Dartec 100 kN) with a displacement rate of 2 mm/min. The elonga-tion was measured using an extensometer (50 mm gauge length,MTS). For the specimens with resin‐A, five tests were made for eachof the three sections of the barrier layers in each of the five immersiontimes of conditioning (virgin + four aged cases). The same procedurewas carried out for the specimens with resin‐D by performing a total of150 tests. The dimensions of the specimens were 25 mm in width and250 mm in length, with a nominal thickness of 14 mm (Fig. 1). Thebehaviour of the tensile specimens was determined by means of theultimate strength, Young’s modulus and proof stress based on a pro-portionally limit of 0.05% (see Fig. 4).
2.3. Numerical analysis with multi-routines
A numerical framework of multi‐routines, calibrated with theexperiments, was set to study the ageing effects on the ply properties(strengths) of the laminate. The configuration of two multi‐routineswas designed to model the heterogeneous material and analyse varia-tions in the response, under the tensile loading, due to the chemicalconditioning. The numerical approach was characterised by the sensi-tivity and flow of material data to predict the virgin and conditionedbehaviours of the specimens. The GFRP‐D Section 1 was selected for
Fig. 4. The system of the uni-axial tensile test and description of the behaviour: (adetail view shows the pattern of defects (diagonal red dotted line) on the tested s
4
the analysis as a consequence of its response to the chemical attack(see Section 3). The analysis is limited to the virgin and the 1‐year con-ditioned specimens.
The first numerical multi‐routine (on the left, Fig. 5) defined thematerial with multi‐scale basis at the linear‐elastic domain. The con-nection between micro‐constituents and ply properties was made bythe homogenisation approach of the Halpin‐Tsai method [27].Through its rule of mixture, the elastic constants of the ply were aver-aged by taking the volume ratio of the composition (volume fraction offibres, Vf ) and the mechanical properties at the micro‐scale (seeTable A.8 in the Appendix). Consequently, the homogenised propertieswere plugged into a FE solver, which performed the computing of thereal specimen. This linking process made the ply properties dependenton the micro‐constituents and the FE model. The prediction of their(aged or not) response required two fitting procedures, referred to as‘composition’ and ‘stiffness’ loops. These loops involved iterative oper-ations of comparison between the numerical and experimental results.
The second multi‐routine (right side, Fig. 5) focused on the surveyof the strength properties in the FE model under the ageing conditionof one year. The simulation of the conditioning was carried out by asampling function of the virgin properties at the ply level. This stepgenerated sequences of (conditioned) data that were processedthrough an inputting procedure giving rise to a ‘strength’ loop. Thiswas based on iterative entries of the strength properties into the FEmodel in order to analyse their effect on the failure values.
The numerical analysis of ageing effects through the approach ofthe multi‐routines involved the following crucial presumptions: I)The effects of ageing are assumed not to alter the linear‐elastic beha-viour at the load level of the simulations, though this might not fullyhold true in reality. II) The laminate structure is solid and intact andthe 3D failure criterion can be used to determinate the ‘non‐critical’stress‐strength relation for each failure mode in the filament‐woundplies. III) The ageing condition does not affect the nominal fibre vol-ume fraction (e.g. through removal of material) used in the Halpin‐Tsai equations.
2.3.1. Material definition loop and laminate modellingThe first multi‐routine generated the composition and stiffness
loops for the non‐aged and 1‐year ageing cases, respectively. The
) Set-up, and, (b) stress-strain curve and the definitions used in the study. Thepecimen at the ultimate failure point.

Fig. 5. Numerical multi-routines for the (virtual) conditioning of the stiffness and strength properties, including the modelling of material at micro and mesoscales.
O. Rodera et al. Composite Structures 260 (2021) 113508
fitting variable for each process was the longitudinal Young’s modulus(Ex) obtained from the tensile (virtual) test.
For the non‐aged case, the composition loop focused firstly on cal-ibrating the fibre volume fraction (Vf ). Initially, the first Vf value wasdetermined by the experimental data and the following formula:
Vf ;GFRP�D ¼ ωf ;GFRP�D � ρGFRP�D
ρfð1Þ
where the fibre mass fraction (ωf ;GFRP�D) can be found in a previousresearch [22] and the densities (ρf ;GFRP�D) in Table 1. The densities ofthe two different fibres were presumed to be equal ρf = 2.58 g/m2, giv-ing a value of Vf ;GFRP�D = 53%. The first set of properties at the ply levelwere created by inputting the calculated Vf ;GFRP�D value and the virginconstants of the micro‐constituents (Table 1) into the Halpin‐Tsai equa-tions (see Table A.8 of Appendix). This method involved the ‘reinforce-ment’ parameters that require a specific adjustment. These factors canindicate the degree of matrix reinforcement by the fibres, and allowto consider issues (e.g. matrix defects, fibre distribution, inter‐phases)in the realistic (homogenised) micro‐structure.
For the initial non‐aged case, the micro‐constituents’ constantswere fixed to their original values. Table 2 shows the first set of thenine elastic constants of the ply for GFRP‐D Section 1 (Vf = 53%).Subsequent iterations in the composition loop were based on theadjustment of Vf in the Halpin‐Tsai equations.
Once the definition at the ply level was done, the ply propertieswere input into the FE software (Abaqus/Standard), which simulatesthe tensile test in the routine. The geometry of the model specimenwas based on the measurements of the real specimen: 25 mm wide,250 mm long, and 14 mm thick (nominally) (tnominal). The thicknessof each ply in the lay‐up was calculated by means of the followingformulas:
Table 2The nine non-aged elastic constants (3D) of GFRP-D Section 1 ply determined byusing the stiffness loop (Fig. 5) with Vf = 53%.
E1 E2 ¼ E3 ν12 ¼ ν13 ν23 G12 ¼ G13 G23
ðGPaÞ ðGPaÞ (–) (–) ðGPaÞ ðGPaÞ
43.52 7.09 0.25 0.37 2.69 2.58
5
t00�ply ¼wUD256 � tnominal
wtotalð2Þ
t900�ply ¼wU480 � tnominal
wtotalð3Þ
where finally t00ply = 0.262 mm and t900ply = 0.491 mm; wtotal wasdefined as (16 � wUD256 + 20 � wU480). The subtotal areal weight forthe UD256 and U480 plies can be found in Table 1.
The boundary conditions for the FE model were based on a mech-anism that clamped the right end of the model and applied a displace-ment at the left one (see Fig. 6). The FE model was subjected to adisplacement of ux = 0.1e‐03 m (ɛ11 = 0.67e‐03 m/m) to keep thespecimen behaviour at the linear‐elastic domain. The output datawas collected from the FE model in a similar way to the real experi-ment (points of extensometer arms). The mesh was discretised by atotal number of 916,160 elements of type C3D8, eight‐nodes linearbrick, fully integrated. The default hourglass control method was cho-sen to reduce zero‐energy modes, since it provided a good coarse meshaccuracy under the applied loading condition. The mesh was based onone element per 0° ply and two elements per 90° ply. This elementmesh provided results for predicting stress values in regions near tofree‐edges and ‘weak zones’ (see Fig. 6).
The weak zones in the FE model represent the manufacturingdefects that are repeated through the lay‐up in each 0° ply. As shownin Fig. 1, these defects were provoked by the overlapping between 0°plies along the 1000 mm of GFRP tube length. Fig. 7 (left‐side) showsthis overlap effect between 0° plies (as expected). In addition, thedefects of resin gaps were also detected as a portion of the 0° pliesalong the longitudinal direction and at locations where overlapsshould have taken place (right side, Fig. 7). This might be due to theincorrect position of the overlapped UTs. These defects influencedthe meso‐structure leading to higher deformations as the loadingwas applied. In consequence, they were considered to behave as thecritical points of the micro‐structure.
In order to establish the basis for the modelling of the weak zones,an analysis of the micro‐structure was done through the micro‐graphs,as illustrated in Fig. 7. The length observed for the case of the overlapwas of 10 mm, and similar dimensions for the gap defects.
The micro‐graph of the overlap defect (left‐side, Fig. 7) showsmainly the presence of stitches of the UD256 ply, a high void content

Fig. 6. The modelling of the tensile specimen with resin gaps in the lay-up. The set of elements for failure analysis are in sub-picture (a) out-resin group 1, (b) out-resin group 2 and (c) out-resin group 3.
O. Rodera et al. Composite Structures 260 (2021) 113508
and resin‐rich zones around the overlapping line. According to themicro‐graph of the gap defect (right‐side, Fig. 7), full zones of resincan clearly be observed. The resin‐rich zones at the inter‐laminar facecan not be disregarded, since their presence might affect the longitudi-nal load‐bearing capacity. These zones could also result in higherstrains perpendicularly to the loading condition in 0° plies but, also,in shear direction for the 90° plies.
As a consequence, the weak zones were modelled as resin gaps byconsidering them as primary defects in the design of the meso‐model(see Fig. 6). Whereas the void content was considered in the definitionof the ply properties through the ξ factor and adjusted fibre volumefraction in the Halpin‐Tsai equations. The resin‐rich zones and voidsrequired that the values of the matrix‐dominated moduli i.e. transverseand shear module were indirectly estimated in the semi‐empiricalmethod. It has been reported that the effects of the voids lead to signif-icant degradation of the stiffness properties with respect to virgin con-ditions [28,29]. The mesh in the weak zones was refined through thethickness direction in order to obtain accurate results.
Finally, the virtual conditioning of one year over the material wassimilarly simulated by using the stiffness loop. This consisted of aniterative process where the routines focused on varying only theYoung’s modulus of the fibre constituent (see Fig. 5). The aged elasticconstants could be collected from the experiment and calibrated in theloop. The adjustment in the calibration kept the material composition
6
and geometrical characteristics unchanged as defined previously forthe FE model in the non‐aged case. The voids were also assumed toaffect similarly to the transverse and shear constants under the expo-sure of the conditioning, as has been observed to be the case in com-posites in the current literature [30].
2.3.2. Conditioning of strength properties and failure criterionThe second multi‐routine carried out the virtual conditioning of
1‐year by means of the strength loop. This iterative process workedonly on the properties at the ply level, with a subsequent plugging intothe FE model. This procedure required the properties and characteris-tics of the model that were defined in the first multi‐routine for thenon‐aged condition and the one‐year ageing condition.
The nine strength properties that were collected from the ESACompsoftware’s library [23], were the reference values of our sensitivityanalysis. The reference represents the original, standard level ofstrength. The effects of the resin gaps and voids were not separatelyanalysed. Research works have demonstrated that the void contentproduce similar mechanisms of degradation than ageing, especiallyon the matrix‐dominated properties [28,31]. The reference values ofthe strengths can be found in Table 3.
Subsequently, the (original) properties were processed by using theOptimal Latin Hypercube Sampling (OLHS) [32]. This method gener-ated a set of optimal values for each strength variable within a
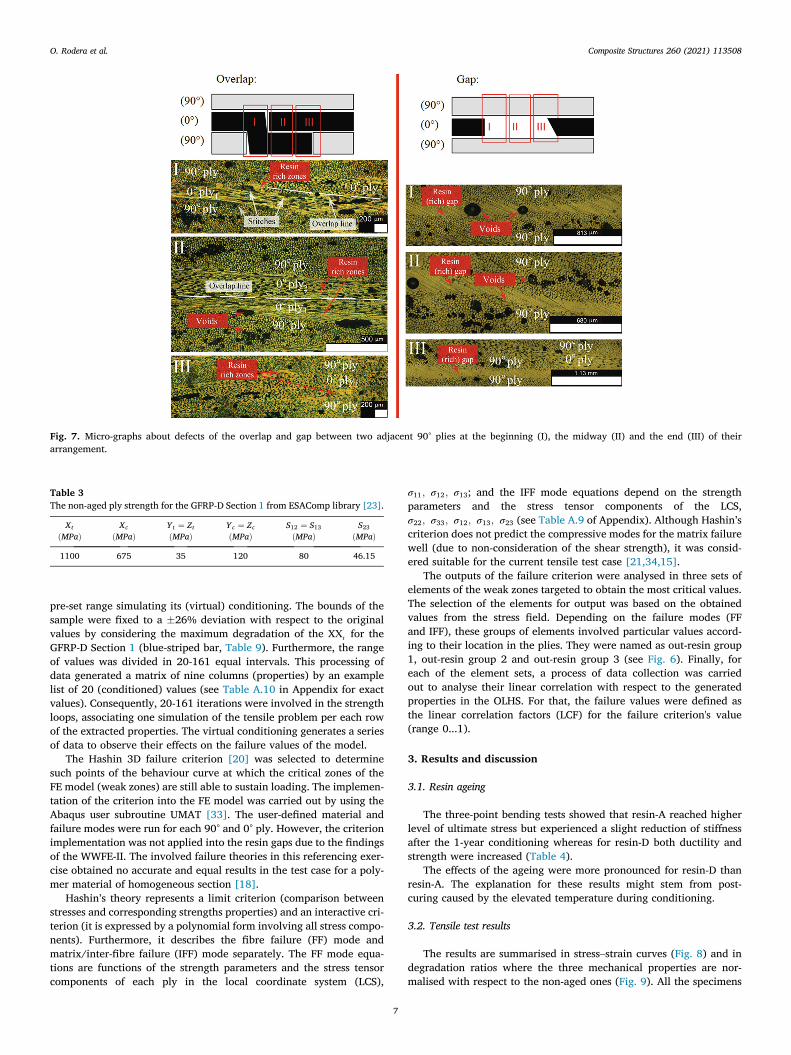
Fig. 7. Micro-graphs about defects of the overlap and gap between two adjacent 90° plies at the beginning (I), the midway (II) and the end (III) of theirarrangement.
Table 3The non-aged ply strength for the GFRP-D Section 1 from ESAComp library [23].
Xt Xc Yt ¼ Zt Yc ¼ Zc S12 ¼ S13 S23ðMPaÞ ðMPaÞ ðMPaÞ ðMPaÞ ðMPaÞ ðMPaÞ
1100 675 35 120 80 46.15
O. Rodera et al. Composite Structures 260 (2021) 113508
pre‐set range simulating its (virtual) conditioning. The bounds of thesample were fixed to a �26% deviation with respect to the originalvalues by considering the maximum degradation of the XXt for theGFRP‐D Section 1 (blue‐striped bar, Table 9). Furthermore, the rangeof values was divided in 20‐161 equal intervals. This processing ofdata generated a matrix of nine columns (properties) by an examplelist of 20 (conditioned) values (see Table A.10 in Appendix for exactvalues). Consequently, 20‐161 iterations were involved in the strengthloops, associating one simulation of the tensile problem per each rowof the extracted properties. The virtual conditioning generates a seriesof data to observe their effects on the failure values of the model.
The Hashin 3D failure criterion [20] was selected to determinesuch points of the behaviour curve at which the critical zones of theFE model (weak zones) are still able to sustain loading. The implemen-tation of the criterion into the FE model was carried out by using theAbaqus user subroutine UMAT [33]. The user‐defined material andfailure modes were run for each 90° and 0° ply. However, the criterionimplementation was not applied into the resin gaps due to the findingsof the WWFE‐II. The involved failure theories in this referencing exer-cise obtained no accurate and equal results in the test case for a poly-mer material of homogeneous section [18].
Hashin’s theory represents a limit criterion (comparison betweenstresses and corresponding strengths properties) and an interactive cri-terion (it is expressed by a polynomial form involving all stress compo-nents). Furthermore, it describes the fibre failure (FF) mode andmatrix/inter‐fibre failure (IFF) mode separately. The FF mode equa-tions are functions of the strength parameters and the stress tensorcomponents of each ply in the local coordinate system (LCS),
7
σ11; σ12; σ13; and the IFF mode equations depend on the strengthparameters and the stress tensor components of the LCS,σ22; σ33; σ12; σ13; σ23 (see Table A.9 of Appendix). Although Hashin’scriterion does not predict the compressive modes for the matrix failurewell (due to non‐consideration of the shear strength), it was consid-ered suitable for the current tensile test case [21,34,15].
The outputs of the failure criterion were analysed in three sets ofelements of the weak zones targeted to obtain the most critical values.The selection of the elements for output was based on the obtainedvalues from the stress field. Depending on the failure modes (FFand IFF), these groups of elements involved particular values accord-ing to their location in the plies. They were named as out‐resin group1, out‐resin group 2 and out‐resin group 3 (see Fig. 6). Finally, foreach of the element sets, a process of data collection was carriedout to analyse their linear correlation with respect to the generatedproperties in the OLHS. For that, the failure values were defined asthe linear correlation factors (LCF) for the failure criterion's value(range 0...1).
3. Results and discussion
3.1. Resin ageing
The three‐point bending tests showed that resin‐A reached higherlevel of ultimate stress but experienced a slight reduction of stiffnessafter the 1‐year conditioning whereas for resin‐D both ductility andstrength were increased (Table 4).
The effects of the ageing were more pronounced for resin‐D thanresin‐A. The explanation for these results might stem from post‐curing caused by the elevated temperature during conditioning.
3.2. Tensile test results
The results are summarised in stress–strain curves (Fig. 8) and indegradation ratios where the three mechanical properties are nor-malised with respect to the non‐aged ones (Fig. 9). All the specimens

Table 4Experimental results i.e. mechanical properties of resin-A and resin-D-based pure specimens (non-aged and 1-year aged cases) by three-point bending test.
Mechanical properties Non-aged case 1-year ageing condition Incremental effects
Resin-A Resin-D Resin-A Resin-D Resin-A Resin-D
Young’s modulus (GPa) 3.2 � 0.1 3.5 � 0.1 2.8 � 0.2 2.9 � 0.1 (–) 15% (–) 18%Proof stress (offset 0.05%) (MPa) 80� n/a� � � 51�� 68 � 17 (–) 36% n/a� � �
Ultimate strength (MPa) 66 � 8 72 � 3 71 � 10 96 � 20 (+) 8% (+) 33%
� One specimen �� Two specimens � � � No plastic strain for offset.
O. Rodera et al. Composite Structures 260 (2021) 113508
showed essentially brittle behaviour until the ultimate load wasreached.
The GFRP‐A and GFRP‐D series presented a gradual decrease inultimate strengths over the two years of conditioning. The strengthvalues of GFRP‐D decreased less than those of GFRP‐A.
Regardless of the type of resin, the specimens with the thinnest bar-rier layer (Section 3) presented generally lower values for the ultimatestrength than the thicker sections (Sections 1 and 2). However, theGFRP‐A Section 1 (having originally the thickest barrier layers) ledto higher degradation than any section of the GFRP‐D specimens upto the 1‐year conditioning. This demonstrated the better resistanceof the GFRP‐D specimens to the chemical conditioning than theGFRP‐A specimens.
The proof stress values were in the range of 40 MPa to 65 MPa. Atthe beginning of the conditioning, the highest differences of degrada-tion between GFRP‐A and GFRP‐D were in the range of 17 to 22%.However, this difference diminished after one year, to a range between6 and 10%. For the Young’s modulus, the maximum degradation wasfound in the Section 3 of GFRP‐D, which showed a 25% decrease after1.5 years of conditioning. In summary, most of the stiffness lossoccurred up to a one‐year ageing condition through the test series.
The conditioning in the sulphuric acid–water solution could haveled to the physical ageing [1]. In addition to the chemical effects,
Fig. 8. Experimental stress–strain curves of the GFRP-D and GFRP
8
the presence of small molecules leads to swelling that might changethe micro‐structure. Therefore, the mass increase was measured tostudy the effect per section, as shown in Fig. 10. The panels had initiallevel of mass range of 4959–8193 g. The GFRP‐D middle sections (Sec-tion 2) gained approximately twice as much mass as the thickest sec-tions of the GFRP‐A per measurement point. All the curves had anincreasing trend towards the end of the conditioning. Therefore, spec-imens did not reach the saturation point after two years.
3.3. Simulated tensile test results
The results of the fitting procedure for the composition (non‐agedcase) and stiffness (1‐year ageing case) loops are shown in Fig. 11.The stress strain curves show the prediction of the FE simulation withrespect to the experimental results.
For the non‐aged condition, the composition loop involved adjust-ing the Vf of ply in three steps (40%, 53% and 60%). Fig. 11 a showsthe three geometrical configurations for the modelling of resin gaps(weak zones). The loop did not involve alteration of the micro‐component constants in their virgin status but only Vf in the Halpin‐Tsai equations (ply level). Furthermore, this method required the fit-ting of its parameters (ξs and ξt) in the predictions of the transverseand shear elastic constants. Usual values for these parameters are ξs
-A specimens with the Sections 1–3 under the tensile testing.

Fig. 9. Degradation ratios of the mechanical properties of different specimen series. The left column represents GFRP-A sections and the right side GFRP-Dsections.
Fig. 10. The mass increases observed over the ageing in the GFRP-A/D panels.
O. Rodera et al. Composite Structures 260 (2021) 113508
= 2 and ξt = 1, which have been demonstrated to achieve accuratepredictions under normal conditions without defects in the micro‐structure [35]. For the current case, the value of ξt;s = 0 resulted inthe lower bound values (43% lower for E2 = E3 and 30% lower forG12 = G13) to account for void defects and resin rich zones outsideresin gaps.
9
As shown in Fig. 11 and Table 5, the fitting procedure of the longi-tudinal Young’s modulus was reached with the value of Vf =60%. Theinitial design for the resin gap (upper configuration) resulted in beingthe most proper under the structural characteristics. Consequently, theupdated nine elastic constants of the ply were obtained for the non‐aged case, as given in Table 6. It should be noted that the adjustment

Fig. 11. The fitting of the numerical curves (longitudinal stiffness) of the GFRP-D Section 1 specimen to the experimental ones: (a) Non-aged condition, and,(b) 1-year ageing condition.
Table 5Experimental (average � standard deviation) results of the tensile testing; andthe stiffness of the simulated model at the linear-elastic regimen (for non-agedcondition).
Specimen Young’s modulusðGPaÞ
0.05% proof stress(m/m)
Ultimate strength(MPa)
GFRP-A Section 1 19.1 � 1.6 59.9 � 2.2 143.1 � 4.9GFRP-A Section 2 17.4 � 0.1 63.5 � 3.0 154.1 � 4.9GFRP-A Section 3 18.0 � 0.4 60.0 � 0.9 157.4 � 2.7GFRP-D Section 1 19.2 � 0.7 60.4 � 0.9 149.1 � 4.3GFRP-D Section 2 17.6 � 0.7 59.8 � 2.2 142.5 � 2.7GFRP-D Section 3 18.9 � 0.6 60.0 � 0.5 147.2 � 1.8
GFRP-D Section 1FE model
18.51 n/a n/a
O. Rodera et al. Composite Structures 260 (2021) 113508
of Vf here involves effects of voids that are implicitly included in theexperimental test data. Therefore, the adjusted Vf and Vm are effectivevalues for modelling.
Fig. 11 a and b also show the points of the test simulation for thetensile test and at which the failure analysis was carried out.
The target (input) load for the non‐aged case, σx = 14.06 MPa andεx = 0.67e‐03 m/m, and for the one‐year ageing condition, σx =12.25 MPa and ɛx = 0.72e‐03 m/m.
Fig. 12 introduces the six components of the stress tensor in themodelling of the weak zone that were obtained by inputting the(non‐aged) ply properties (Table 6).
The stress results show that the presence of the resin gaps locallyproduces high deformations in the 0° and 90° plies and their surround-ing. It should also be pointed out that the shear component σ12 peaksat the edge of the specimen due to the free‐edge effects [36].
The stress results will be discussed in detail to analyse their influ-ence on the failure study for the non‐aged condition in Section 3.4.
Table 6The nine (non-aged) elastic constants of a ply in the GFRP-D Section 1 (with Vf
= 60%).
E1 E2 ¼ E3 ν12 ¼ ν13 ν23 G12 ¼ G13 G23
ðGPaÞ ðGPaÞ (–) (–) ðGPaÞ ðGPaÞ
48.80 8.20 0.25 0.38 3.12 2.98
10
The fitting of the longitudinal Young’s modulus for the 1‐year virtualconditioning is shown on the right in Fig. 11. This process, similarlyto the non‐aged one, calculated the nine elastic constants of a plybut by using the stiffness loop (values in Table 7). The adjusting ofthe fibre’s Young’s modulus in this loop finally resulted in a degradedvalue (due to ageing) of 19.5% with respect to its virgin value. TheYoung’s modulus of the resin was directly fixed by taking the experi-mental value from Section 3.1 (i.e. 18% degraded value).
3.4. Sensitivity of the determined failure to parametric strength variation
Before the virtual conditioning, it was necessary to analyse thestresses and the values of the failure modes at the non‐aged conditionof the FE model. For that, Fig. 13 shows the meso‐model of a baselineweak zone, composed by the cross‐plies (0°/90°/0°), with the corre-sponding failure modes. The implementation of the criterion involved,besides the defined stiffness properties, the non‐aged stress field(Fig. 12) and the inputting of the virgin strength properties (Case 0in Table A.10). By following the division of the Hashin criterion intothe two modes, the failure ratios by longitudinal deformations wereanalysed for the FF mode in the 0° plies and for the IFF mode in the90° plies. Similarly, the failure ratios by transverse deformations wereanalysed for the FF mode in the 90° plies and for the IFF mode in the 0°plies.
Regarding the longitudinal deformations, the representative ele-ment of the 0° plies presented the highest values of stress for the σ11
component. In the 90° plies, the maximum (absolute) stress valueswere achieved by the σ22 component at the second element(s) withrespect to the datum plane (in red colour). In the same plies, relevantvalues (i.e., maximum local stresses) were achieved by the σ23 compo-nent (blue colour) at the first element(s) that resulted in a diagonaldeformation. It should be noted that the high σ23 values were due tothe influence of the resin gaps. According to the results, the IFF modein the 90° plies reached the highest failure values of the weak zone’smodelling. This took place in the first two elements (to the left andright with respect to the datum plane) that were under and on topof the resin gaps. Therefore, the results demonstrated that this typeof stress‐deformation mechanism happens mainly due to the stresscomponents σ22 and σ23. This might typically constitute the interlami-nar failure that occurs at higher levels under transverse tensile stress inthe 90° plies of a cross‐ply (at the failure plane parallel to fibres) [37].

Fig. 12. Results of the stress tensor components at the weak zone for the non-aged condition at overall load condition of ɛ11 = 0.67e-03 m=m in LCS (unitsin Pa).
Table 7The nine elastic constants of the GFRP-D Section 1 at the 1-year ageingcondition (Vf = 60%).
E1 E2 ¼ E3 ν12 ¼ ν13 ν23 G12 ¼ G13 G23
ðGPaÞ ðGPaÞ (–) (–) ðGPaÞ ðGPaÞ
42.26 6.77 0.25 0.38 2.58 2.46
O. Rodera et al. Composite Structures 260 (2021) 113508
The transverse deformations in the 0° plies led to the highest valuesof the stresses (σ22 and σ33) at the first representative element(s) of the0° UD plies. Therefore, they were prone to affecting the laminate fail-ure. As a summary, the FF mode was the most active of the out‐resingroups 1, and the IFF mode for the out‐resin group 3 (see alsoFig. 6)). Out‐resin group 2 would be referred to the FF mode, but nocritical values were identified in it. It must be mentioned that the max-imum strains for the current stress field were ɛgap11;max =1.407e‐03 m/m,
ɛ0� ply
11;max = 0.55e‐03 m/m and ɛ90� ply
22;max = 1.28e‐03 m/m, beinglower compared to the ultimate strains of the fibre and matrix,ɛf ≈ 2.4e‐02 m/m and ɛm = 4e‐02 m/m (Table 1).
Finally, the correlation analysis was developed, in terms of LCF, forthe three out‐resin groups with the elements (virtually) conditionedfor one year. Fig. 14 shows that only S23 had a significant (linear) ten-dency to change results after one year of (virtual) ageing, i.e. the fail-ure results (in out‐resin group 3) generated a correlation of theirvalues with the 20‐161 conditioned inputs of the S23 parameter. Thelinearity of the tendency between the values of the failure and strengthproperties correlated with a factor of R2 = 0.86. The strength param-eter S12 also presented observable sensitivity forout‐resin group 3. Theeffect was low and probably manifests local shear, anticipated largestat free edges at the weak zones. Therefore, in real structures, such aspressure vessels, it is not essential. It must be mentioned that these ten-dencies by the shear properties could be affected, not only by the age-ing of fibre and matrix as pure constituents but also by the response ofthe voids under the conditioning. It has been demonstrated in the cur-rent literature that voids intensify their effects on degradation undermoisture and heat conditions. However, no common results have beenfound due to the high dependency of the strength properties on thecharacteristics of laminates [30,38].
11
It is important to note that the conditioning of the tensile speci-mens was carried out on panels with the edges protected. Therefore,the ageing was not especially exaggerated on the free‐edges of plies.This emphasises the significance of S23 in the aged filament‐woundcross‐ply laminated structures at low load (strain) levels. In summary,it is important to determine the degradation of S23 values in the com-posites due to chemical attack. This is also supported by the observa-tions reported previously [2] and that stated that fibre–matrixinterfaces play a role in the degradation of stiffness in GFRP cross‐ply laminates [39,40]. The shear strength (e.g. S23) of unidirectionalcomposite plies is typically governed by resin behaviour and interfa-cial behaviour [1].
There are simply not many polymeric barrier materials that couldhinder (compared to resins A and D) the diffusion, e.g., from the sidesof the pure resin bending specimens (thickness 6 mm). The resins ofthis study are specifically designed to resist this type of chemical medi-ums. Typically, the idea in the sealing of edges of test specimen forconditioning is to control the direction of diffusion by a medium. Inour study with the target of understanding composite material, theageing of matrix in certain direction is not well‐defined because, inthe composite, the fibre–matrix interfaces and voids much affect thediffusion by the medium and this does not happen in only single cleardefined direction on the ply level. A reinforcement lay‐up has its owneffects. In general, the degradation in the pure resin specimens wasmuch less than in the composites and resins’ strength even increased.This fact indicated that the diffusion and reactions in pure resins mightbe slower than in GFRP environment. For a thin barrier (e.g., Section 2or 3 panels), the reinforcements and voids were presumed to incurpotential accelerated diffusion and ageing also in the pure matrixphase between fibres. Hence, noting that the effective volume fractionof matrix was 47%, the Section 1 panel with around 10 mm barrierlayer during conditioning was selected as the reference compositefor the FE model of the structural layer and matrix properties esti-mated based on the pure matrix tests. The ageing time, to match theaged properties of the resin constituent in the composite’s numericalsimulation, was set equal (1 year), since no generalized method toselect otherwise exist.
For the virtual conditioning, the purpose of the criterion was to pre-dict neither damage onset of the whole model nor evolution in it byderivations of stresses, but to determine the sensitivity of the failure(ratios) values by varying the strength properties from the denomina-tor at a fixed stress state. This is due to the target of analysing the localweak zones at the linear‐elastic regime. Naturally, if the applied loadlevel for the sensitivity analysis was higher, the sensitivity of the stud-ied failure modes to the tensile strength (in terms of effects by Xt andYt) would be essential ones since the ultimate failure of the specimensimply requires sheer breakage of 0°plies. An accurate analysis ofhigher loads necessitates understanding the non‐linear regime priorto ultimate failure, going through the damage onset. This is also impor-tant from the point of view of predicting the failure and its propaga-tion, and therefore designing safe and properly damage‐tolerantindustrial structures.
In future studies, emphasis will be placed on the 3D failure crite-rion’s implementation for a material model capable of a higher amountof stress–strain points, towards the ultimate fracture. This means theimplementation of progressive damage models [41] with correlationbetween the elastic constants and state variables for failure modesand types applicable to the non‐linear (elasto‐plastic) domains.
4. Conclusions
This work studied the performance of filament‐wound GFRP madeof two different vinyl ester resins (Derakane 455‐400 and Atlac E‐NovaFW 1045). Long‐term immersion conditioning in a sulphuric acid–wa-ter solution was carried out and tensile tests of non‐aged andconditioned specimens were performed. A numerical multi‐routine

Fig. 13. Numerical results of the failure mechanism in the weak zone implemented by the Hashin 3D failure criterion with respect to the stress field (at ɛ11 =0.67e-03 m=m) for the non-aged condition.
Fig. 14. Linear correlation analysis between the LCF as failure values (in their corresponding modes) and the strength properties of a ply, for each selected groupof elements. * WWZ = results without Weak Zones in FE model.
O. Rodera et al. Composite Structures 260 (2021) 113508
approach was developed to understand the sources of degradation andfailure onset upon loading, as well as the most critical strength param-eters for aged GFRP. The Hashin 3D failure criterion was implementedas damage activation functions. The simulations allowed to determi-nate the sensitivity of the ply strength parameters at the specificamount of (virtual) ageing condition by means of a failure analysis.Based on the results, the experimental–numerical analysis led to thefollowing conclusions:
• The flexural strength in the pure specimen of the novolac‐basedvinyl ester resin increased by 8%, and in the bisphenol A‐basedvinyl ester ones, by 33%. The values of Young’s modulus decreasedby 15–18%.
• GFRP specimens showed a gradual decrease in the ultimatestrength throughout the whole conditioning time span of two years.The bisphenol A‐based GFRP specimens presented good resistanceto chemical attack in terms of ultimate strength. A marked degrada-tion of stiffness (Young’s modulus) occurred mainly during the 1‐year ageing condition.
• A continuous mass increase was observed for the GFRP panelsthroughout the two years of conditioning. At the end of the condi-tioning, the mass of the panels with bisphenol A had increased by2.36%, whereas novolac‐based panels mass had increased by1.21% on average.
12
• The specimens subject to the tensile tests typically showed a diag-onal fracture path with an influence by the ply overlaps. Thesemanufacturing issues of the 0°plies worked as stress concentrationpoints and allowed us to model the weak zones in the FE model.
• The effects of ageing on the strength of the specimens were anal-ysed by means of a 3D strength‐based failure criterion in thelinear‐elastic region. The shear strength parameter (S23) presentedthe highest tendency of changing results when the (GFRP‐D Sec-tion 1) specimen was virtually conditioned at 1‐year ageing.
5. Data availability statement
The raw/processed data required to reproduce these findings can-not be shared at this time due to technical or time limitations. The sim-ulation re‐performance outputs a significant amount of data;initialisation files are available upon request from the authors.
CRediT authorship contribution statement
G.O. Rodera: Writing ‐ original draft, Writing ‐ review & editing,Methodology, Software, Visualization, Data curation, Formal analysis,Investigation. T. Pärnänen: Validation, Resources, Writing ‐ originaldraft, Writing ‐ review & editing. J. Jokinen: Data curation, Software,Writing ‐ review & editing. M. Lindgren: Resources, Writing ‐ review

O. Rodera et al. Composite Structures 260 (2021) 113508
& editing. E. Sarlin: Supervision, Funding acquisition, Writing ‐review & editing. M. Kanerva: Conceptualization, Project administra-tion, Writing ‐ review & editing.
Declaration of Competing Interest
The authors declare that they have no known competing financialinterests or personal relationships that could have appeared to influ-ence the work reported in this paper.
Acknowledgements
This project was partly funded by the Academy of Finland postdoc-toral project from micro‐scale data to macro‐scale understanding forimproved safety of composite materials –MicMac (Grant No. 314983).
Table A.8Relationships and main parameters of the semi-empirical Halpin-Tsai method for t[2,42,27].
Engineering constants Relationships
E1 1� Vf� �
Em + Vf Ef
E2 = E3Em
1þ ξtηVf� �1� ηVf� �
ν12 = ν13 1� Vf� �
νm þ Vf νfν23 1 – ν21 –
E23Kð Þ
G12 = G13 Gm 1þ ξsηVf� �1� ηVf� �
G23 E2
2 1þ ν23ð Þ
Table A.9Invariants and failure modes of the Hashin’s 3D failure criterion [20,41,21].
Invariants
Quadratic approximationFailure modesFF:ðσ11 > 0Þ
ðσ11 < 0Þ
IFF: ðσ22 þ σ33 > 0Þ
ðσ22 þ σ33 < 0Þ� A1, B1, C12, A3 and A4 developed in [20].
13
Appendix A
The equations of the Halpin‐Tsai method for the ply (3D) propertiesof the FE model can be found in Table A.8. The two reinforcementparameters (ξt and ξs) that determine the prediction of (E2 = E3)and (G12 = G13) were set to zero. Through this assumption, the con-stants were underestimated in the lower bound of the functions (min-imum values) due to the matrix defects and manufacturing issues inthe micro‐structure [35].
The equations of the Hashin 3D failure criterion, implemented inthe FE model for the strength loop, are given in Table A.9.
In this study, the input data matrix of the strength values forthe sensitivity analysis were created by using the Optimal LatinHypercube Sampling (OLHS). The exact values can be found inTable A.10.
he material definition of each ply (transversally isotropic) in the stiffness loop
Other parameters
Lower bound of moduli (assumptions): ξt ¼ 0 ξs ¼ 0
Variable for longitudinal moduli: η =
EfEm
� 1� �
EfEm
þ ξ� �
The bulk moduli:
K = VfKf
þ ð1�Vf ÞKm
h i�1 Kf ¼ Ef
3 1�2νfð ÞKm ¼ Em
3 1�2νmð Þ
8<:
Variable for shear moduli: η =
GfGm
� 1� �
GfGm
þ ξ� �
I1 ¼ σ11, I2 ¼ σ22 þ σ33, I3 ¼ τ223 � σ22σ33, I4 ¼ τ212 þ τ213
A1I1 þ B1I21 þ A2I2 þ B2I22 þ C12I1I2 þ A3I3 þ A4I4 ¼ 1 �
ðσ11Xt
Þ2 þ ðτ12S12
Þ2 þ ðτ13S12
Þ2 ¼ 1
ðσ11Xc
Þ2 ¼ 1
ðσ22 þ σ33Þ2ðYt Þ2
� σ22 � σ33ðS23Þ2
þ τ212S212
þ τ213S212
þ τ223S223
¼ 1
Table A.10The conditioned (virtually) strength properties of the GFRP-D ply by means of the OLHS.
O. Rodera et al. Composite Structures 260 (2021) 113508
Appendix B. Supplementary data
Supplementary data associated with this article can be found, in theonline version, at https://doi.org/10.1016/j.compstruct.2020.113508.
References
[1] Oliveira BF, Creus GJ. An analytical–numerical framework for the study of ageingin fibre reinforced polymer composites. Compos Struct 2004;65(3–4):443–57.
[2] Kanerva M, Jokinen J, Sarlin E, Pärnänen T, Lindgren M, Järventausta M, VuorinenJ. Lower stiffness of GFRP after sulfuric acid-solution aging is due to degradation offibre-matrix interfaces?. Compos Struct 2019;212:524–34.
[3] Davies P, Rajapakse YDS. Durability of composites in a marineenvironment. Netherlands: Springer; 2014.
[4] Karger-Kocsis J, Gryshchuk O. Morphology and fracture properties of modifiedbisphenol a and novolac type vinyl ester resins. Journal of Applied PolymerScience 2006;100(5):4012–22.
[5] Lindgren M, Wallin M, Kakkonen M, Saarela O, Vuorinen J. The influence of high-temperature sulfuric acid solution ageing on the properties of laminated vinyl-esterjoints. International Journal of Adhesion and Adhesives 68 2016;68:298–304.
[6] Lindgren M, Bergman G, Kakkonen M, Lehtonen M, Jokinen J, Wallin M, et al.Failure analysis of a leaching reactor made of glass-fiber reinforced plastic. Journalof Engineering Failure Analysis 2016;60:117–36.
[7] Banna M, Shirokoff J, Molgaard J. Effects of two aqueous acidic solutions onpolyester and bisphenol a epoxy vinyl ester resins. Mater Sci Eng A 2011;528(4–5):2137–42.
[8] Kootsookos A, Burchill PJ. The effect of the degree of cure on the corrosionresistance of vinyl ester/glass fibre composites. Journal of Composites Part A:Applied Science and Manufacturing 2004;35(4):501–8.
[9] Cabral-Fonseca S, Correia JR, Rodrigues MP, Branco FA. Artificial acceleratedageing of GFRP pultruded profiles made of polyester and vinylester resins:caracterisation of physical-chemical and mechanical damage. Strain 2011;48(2):162–73.
[10] Hull D, Clyne TW. An introduction to composite materials. 2nd ed. CambridgeUniversity Press; 1996.
[11] Barbero EJ, Damiani TM. Phenomenological prediction of tensile strength of E-glass composites from available aging and stress corrosion data. Journal ofReinforced Plastic Composites 2003;22(4):373–94.
[12] Krishnan A, Oskay C. Modeling compression-after-impact response of polymermatrix composites subjected to seawater aging. Journal of Composite Materials2012;46(22):2851–61.
[13] Naya F, González C, Lopes CS, Van der Veen S, Pons F. Computationalmicromechanics of the transverse and shear behavior of unidirectional fiberreinforced polymers including environmental effects. Compos Part A-Appl S2016;92:146–57.
14
[14] Naya F, Herráez M, Lopes CS, González C, Van der Veen S, Pons F. Computationalmicromechanics of fiber kinking in unidirectional FRP under differentenvironmental conditions. Compos Sci Technol 2017;144:26–35.
[15] Puck A, Schürmann H. Failure analysis of frp laminates by means of physicallybased phenomenological models. Compos Sci Technol 1998;58(7):1045–67.
[16] Pinho S, Dávila C.G., Camanho P.P., Iannucci L, Robinson P. Failure models andcriteria for frp under in-plane or three-dimensional stress states including shearnon-linearity, NASA/TM-2005-213530.
[17] Hinton MJ, Kaddour AS, Soden PD. In: Failure criteria in fibre reinforced polymercomposites: the World-Wide Failure Exercise. Oxford: Elsevier Science &Techonlogy; 2004.
[18] Kaddour AS, Hinton MJ. Challenging lessons from the second world-wide failureexercise (WWFE-II): Predicting failure in polymer composite laminates under 3-Dstates of stress. In: 19th International Conference on Composite Materials (ICCM-19). Montreal; 2013.
[19] Hashin Z, Rotem A. A fatigue failure criterion for fiber reinforced materials.Journal of Composite Materials 1973;7(4):448–64.
[20] Hashin Z. Failure criteria for unidirectional fiber composites. J Appl Mech 1980;47(2):329–34.
[21] Gu J, Chen P. Some modifications of Hashin’s failure criteria for unidirectionalcomposite materials. Compos Struct 2017;182:143–52.
[22] Sarlin E, Sironen R, Pärnänen T, Lindgren M, Kanerva M, Vuorinen J. The effect ofmatrix type on ageing of thick vinyl ester glass-fibre-reinforced laminates. ComposStruct 2017;168:840–50.
[23] Altair Engineering, Inc., ESAComp; 2018. Material database.[24] ISO 178:2010 (e), Tech rep., Determination of flexural properties testing of plastics
and polymers, International Organization for Standardization (ISO), 2011.[25] Laurikainen P, Pötz S, Jokinen J, Essen von M, Lindgren M, Kallio P, Kanerva M,
Oreski G, Sarlin E. High throughput mechanical micro-scale characterization ofcomposites and the utilization of the results in finite element analysis, in:Proceedings of the 18th European conference on composite materials (ECCM);2018.
[26] ISO 527-4., Tech. rep., Determination of tensile properties. Part 4: Test conditionsfor isotropic and orthotropic fibre-reinforced plastic composites, InternationalOrganization for Standardization (ISO) Plastics, 1997.
[27] Jones RM. Mechanics of composite materials. Taylor & Francis Inc; 1998.[28] P. Olivier, J. Cottu, B. Ferret, Effects of cure cycle pressure and voids on some
mechanical properties of carbon/epoxy laminates. Composites 1995;(26):509–15.[29] Hancox NL. The effects of flaws and voids on the shear properties of CFRP. J Mater
Sci 1977(12):884–92.[30] Leali CM, Cerqueira MR, De Almeida SFM. Strength of hygrothermally conditioned
polymer composites with voids. J Compos Mater 2005(19):97–112.[31] W. D. Bascom, J. B. Romans, Microvoids in glass-resin composites. Their origin and
effect on composite strength. Ind Eng Chem Prod Res Dev 1968;(7):172–8..[32] Jin R, Chen W, Sudjianto A. An efficient algorithm for constructing optimal design
of computer experiments. Journal of Statistical Planning and Inference2005;134:268–87.
[33] ABAQUS/Standard User’s Manual, Version 6.9, Dassault Systèmes SimuliaCorp. United States; 2009.

O. Rodera et al. Composite Structures 260 (2021) 113508
[34] Sun CT, Quinn BJ, Tao J, Oplinger DW, William J. Comparative evaluation offailure analysis methods for composite laminates. In: Tech. rep., DOT/FAA/AR-95/109,. U.S. Department of Transportation, Office of Aviation Research; 1996.
[35] Buragohain MK. Micromechanics of a lamina. In: Composite structures. CRC Press;2017. p. 79–132.
[36] Mittelstedt C, Becker W. Free-edge effects in composite laminates. Appl Mech Rev2007;60(5):217–45.
[37] Davila CG, Camanho PP, Rose CA. Failure criteria for FRP laminates. Journal ofComposite Materials 2005;39(4):323–45.
[38] De Almeida SFM, Dos Santos ZNN. Effect of void content on the strength ofcomposite laminates. Compos Struct 1994(28):139–48.
15
[39] Sullivan JL. Creep and physical aging of composites. Compos Sci Technol 1990;39(3):207–32.
[40] Rocha IBCM, Raijmaekers S, Van der Meer FP, Nijssen RPL, Fischer HR, Sluys LJ.Combined experimental/numerical investigation of directional moisture diffusionin glass/epoxy composites. Compos Sci Technol 2017;151:16–24.
[41] Camanho PP, Matthews FL. A progressive damage model for mechanicallyfastened joints in composite laminates. Journal of Composite Materials 1999;33(24):2248–80.
[42] Fragoudakis R. Failure analysis and prevention: Failure concepts in fiberreinforced plastics. InTech; 2017.


![Numerical Example - Contact Study A two layered [0 0 /90 0 ] laminate with a pre-existing delamination at the ply interface is considered. The plate is](https://img.pdfslide.net/doc/110x75/551813da550346a2318b458a/numerical-example-contact-study-a-two-layered-0-0-90-0-laminate-with-a-pre-existing-delamination-at-the-ply-interface-is-considered-the-plate-is.jpg)