Embed Size (px)
Citation preview
Childhood Neurodevelopmental Factors and Risk of Psychotic
Experiences in Early Adolescence: Genotypic Variation and
Developmental Endophenotypes
by
Mohajer Abbass Hameed BPsyc
Post Grad. Dip. PsycMaster of Psychoanalysis Studies
Submitted in fulfilment of the requirements for the degree of
Doctor of Philosophy
Deakin University
July, 2013

Acknowledgments
I have been fortunate to have Associate Professor Andrew J. Lewis, a
research academic in Clinical Psychology at the School of Psychology, Faculty of
Health, Deakin University, Melbourne, Australia, as my principal academic
supervisor. From our initial meeting on 14 April 2009, until now, I have been
inspired by his academic talents, supervision, managerial and organisational skills.
I am indebted to Assoc. Professor Andrew J. Lewis, as his support persisted
throughout the PhD journey, and was further strengthened by his continuous
encouragement for me to initiate collaborative relationships with academics and
mental health practitioners within and outside Deakin University. He supported,
accompanied and guided me when I had face-to-face meetings with Assoc. Prof.
Suresh Sundram (Director of Mental Health Research, Institute of Victoria,
Australia) and Professor Tom Callaly (Executive Director and Clinical Director,
Mental Health, Drug & Alcohol Services, Barwon Health, Geelong, Australia)
regarding academic research partnership.
This academic working alliance further deepened when we actively
approached Dr Stanley Zammit, seeking access to the Avon Longitudinal Study of
Parents and Children (ALSPAC [UK]). Dr Zammit is a clinical senior lecturer in
psychiatric epidemiology at Cardiff University and the University of Bristol, United
Kingdom, and leads ALSPAC psychotic symptom studies. I am indebted to Dr
Stanley Zammit, as he has been involved in every step I took forward with ALSPAC
academic collaboration. I would also like to thank Sarah Sullivan for her enormous
input in manuscript preparation, data analysis and interpretations. Ms Sarah Sullivan
is an academic researcher within the Academic Unit of Psychiatry, School of Social
and Community Medicine, University of Bristol, Bristol, UK.

I am also grateful to Dr Raghu Lingam for his academic contributions in
preparing the manuscript and his suggestions regarding trajectories of change in early
childhood developmental skills. Dr Raghu Lingam is a pediatrician and senior
clinical lecturer at the School of Social and Community Medicine, Center of Child
and Adolescent Health, University of Bristol.
I would also like to thank Dr Jarrad Lum, Dr Bosco Rowland, Assoc. Prof.
John Reynolds and Dr Marina Haywood from Deakin University, Melbourne and
Geelong, Australia, for their academic consultations regarding statistical data
manipulation and analysis. I must also thank Dr Margaret Kumar (Language &
Learning Advisor, Student Transition & Study Skills at Deakin University) for her
support and encouragement to participate and publish in the Deakin University
higher degree research magazine.1
Collectively, all of the above-mentioned, highly honoured and experienced
academics have taught me great lessons that will guide me in supervision of future
PhD candidates.
I must also express my gratitude to my beloved mother, Belqees Kadhum
Saeed, my dear father Abas Hameed Abas, and my respected brothers and sisters
(Ahmed, Ali, Maram, Mariam and Zeanab) for their continuous support and
encouragement, despite my shortcomings in meeting my family/interpersonal
obligations and duties.
1 Hameed, M. A. (2010). Know Thyself. Showcase. A Snapshot of Deakin University Higher Degree
Student Research, 34–36; Hameed, M. A. (2011). Multi-dimensionality of the human psyche.
Showcase. A Snapshot of Deakin University Higher Degree Student Research, 33–35.

Further, while they are still young, a day may come when my children will
read this acknowledgment. I thank my eldest son Hamzah (5½ years old) for teaching
me how to persist in gaining a desired outcome (that is, my PhD qualification). My
second son, Abbass (3½ years old), was born towards the end of my first year of
candidature. He has taught me how to overcome my weaknesses, since, despite his
diagnosis of ataxia telangiectasia, and recurrent respiratory inflammations, he has
stood firm, adapted and developed new strategies to compensate for his subtle motor
imbalances. Finally, my last child, Amenah (2 years old), has taught me how to cry
with the purpose of gaining a desired object, such that through much laughing, and a
few cries, I have completed this thesis.
I must also thank my dear and beloved wife Hawra, as she voluntarily
decided to become a full-time carer for the children, and tolerated my absences and
shortcomings as a husband and a father.
I would also like to thank all the families that took part in the pilot trial in
Melbourne, Australia; the families who gave their time and support for the ALSPAC;
the midwives for their help in recruiting them; and the whole ALSPAC team, which
includes interviewers, computer and laboratory technicians, clerical workers,
research scientists, volunteers, managers, receptionists and nurses.
Finally, I am grateful to all the people who regularly attended the Fawkner
Imam Ali (PBUH) Center (Melbourne, Australia), and who continuously praised and
wished me all the best with my PhD project every time I left the stage, performing on
culture-specific occasions.
Thank you all
Mohajer Abbass Hameed
April 2013
CHILDHOOD DEVELOPMENT FACTORS AND RISK OF PSYCHOTIC EXPERIENCES vii
Table of Contents
Table of Contents .....................................................................................................vii
List of Tables............................................................................................................xiii
List of Figures ........................................................................................................xviii
List of Abbreviations...............................................................................................xix
Abstract ..................................................................................................................xxiii
Synopsis .................................................................................................................xxvii
Chapter 1: Introduction ............................................................................................ 1 1.1 Brief History of Psychosis ................................................................................. 2 1.2 Neurodegenerative Model of Schizophrenia...................................................... 3 1.3 Neurodevelopmental Model of Schizophrenia................................................... 6 1.4 Developmental Instability Model of Schizophrenia......................................... 11 1.5 Psychotic Experiences in Early Adolescence................................................... 14 1.6 Endophenotypes in Psychiatric Research......................................................... 21 1.7 Thesis Scope, Contributions, Aims and Overview .......................................... 22
Chapter 2: Childhood Neurodevelopmental Indicators of Schizophrenia: AReview of Longitudinal High-Risk Studies ............................................................ 25
2.1 Introduction ...................................................................................................... 25 2.1.1 Previous reviews. ...................................................................................... 26
2.2 Method ............................................................................................................. 30 2.2.1 Literature search procedure....................................................................... 30 2.2.2 Inclusion and exclusion criteria. ............................................................... 30
2.3 Results.............................................................................................................. 31 2.3.1 General overview of high-risk studies. ..................................................... 31 2.3.2 Obstetric and perinatal complications....................................................... 31 2.3.3 Childhood neurological and motor development...................................... 39 2.3.4 Childhood cognitive performance............................................................. 40 2.3.5 Childhood social behaviour. ..................................................................... 42
2.4 Discussion ........................................................................................................ 49
Chapter 3: Birth Cohort Studies of Childhood Literacy, Speech andLanguage Indicators of Schizophrenia: A Systematic Review ............................. 53
3.1 Introduction ...................................................................................................... 53 3.2 Method ............................................................................................................. 54
3.2.1 Literature search procedure....................................................................... 54 3.2.2 Inclusion and exclusion criteria. ............................................................... 54
3.3 Results.............................................................................................................. 54 3.3.1 General overview of the reviewed birth cohort studies. ........................... 54 3.3.2 Childhood literacy, speech and language indicators of schizophrenia. .... 55
3.3.2.1. National Survey of Health and Development.................................... 55 3.3.2.2. National Collaborative Perinatal Project......................................... 55 3.3.2.3. Dunedin Multidisciplinary Health and Development Study ............. 58 3.3.2.4. Danish Longitudinal Study (Project Metropolitan) .......................... 59 3.3.2.5. National Child Development Study................................................... 60 3.3.2.6. Northern Finland 1966 Birth Cohort................................................ 60 3.3.2.7. Mater University Study of Pregnancy............................................... 64
CHILDHOOD DEVELOPMENT FACTORS AND RISK OF PSYCHOTIC EXPERIENCES viii
3.4 Discussion ........................................................................................................ 64
Chapter 4: The Genetic Liability to Schizophrenia: A Selective SystematicReview ....................................................................................................................... 68
4.1 Introduction ...................................................................................................... 68 4.2 Method ............................................................................................................. 68
4.2.1 Literature search procedure....................................................................... 68 4.2.2 Inclusion and exclusion criteria. ............................................................... 69
4.3 Results.............................................................................................................. 69 4.3.1 Epidemiological research on schizophrenia.............................................. 69 4.3.2 Major susceptibility genes for schizophrenia............................................ 70 4.3.3 Single nucleotide polymorphisms, cognitive profiles and schizophrenia. 73
4.3.3.1. Dystrobrevin-binding protein 1. ....................................................... 73 4.3.3.2. Catechol-O-methyltransferase. ......................................................... 76
4.4 Discussion ........................................................................................................ 81
Chapter 5: Childhood Developmental Factors and Risk of Non-ClinicalPsychotic-Like Symptoms in 12-Year-Olds: A Systematic Review of AllALSPAC Studies ...................................................................................................... 84
5.1 Introduction ...................................................................................................... 84 5.2 Method ............................................................................................................. 85
5.2.1 Literature search procedure....................................................................... 85 5.2.2 Inclusion and exclusion criteria. ............................................................... 85
5.3 Results .............................................................................................................. 86 5.3.1 Overview of the Avon Longitudinal Study of Parents and Children........ 86 5.3.2 Outcome variable: Psychotic-like symptoms............................................ 86 5.3.3 Childhood social cognitive profiles and risk of PLIKS. ........................... 87
5.3.3.1. Emotion recognition.......................................................................... 87 5.3.3.2. Intellectual profile............................................................................. 87 5.3.3.3. Attribution style................................................................................. 88 5.3.3.4. Autistic traits. .................................................................................... 89
5.3.4 Childhood peer victimisation and risk of PLIKS...................................... 92 5.3.4.1. Bullying. ............................................................................................ 92
5.3.5 Prenatal factors and risk of PLIKS. .......................................................... 92 5.3.5.1. Maternal (adverse events)................................................................. 92 5.3.5.2. Maternal folate deficiency. ............................................................... 93 5.3.5.3. Maternal (analgesics exposure). ....................................................... 94 5.3.5.4. Maternal (drug exposure). ................................................................ 94 5.3.5.5. Fetal physical growth........................................................................ 95
5.3.6 Family history of schizophrenia and risk of PLIKS. ................................ 95 5.3.6.1. Family characteristics....................................................................... 95
5.4 Discussion ........................................................................................................ 96 5.5 Aims and hypotheses of proceeding empirical studies .................................... 98
5.5.1 Study 1: Childhood literacy skills............................................................. 98 5.5.2 Study 2: Childhood attention skills........................................................... 99 5.5.3 Study 3: Childhood motor skills. .............................................................. 99 5.5.4 Study 4: Trajectories of early childhood developmental skills............... 100 5.5.5 Study 5: Genotypic variation and childhood cognitive profiles. ............ 100 5.5.6 Study 6: Pilot trial of a social cognitive enhancement programme. ....... 101
Chapter 6: Research methods ............................................................................... 102 6.1 Introduction .................................................................................................... 102
CHILDHOOD DEVELOPMENT FACTORS AND RISK OF PSYCHOTIC EXPERIENCES ix
6.2 Method ........................................................................................................... 102 6.2.1 ALSPAC sample. .................................................................................... 102 6.2.2 Participants.............................................................................................. 102 6.2.3 Measures. ................................................................................................ 103
6.2.3.1. (I) Primary outcome variable: Psychotic experiences (interview). 103 6.2.3.2. (II) Secondary outcome variable: Trajectories of psychotic
experiences (questionnaire)............................................................. 103 6.2.4 Predictor variables................................................................................... 110
6.2.4.1. Study 1: Childhood literacy skills. .................................................. 110 6.2.4.2. Study 2: Childhood attention skills. ................................................ 110 6.2.4.3. Study 3: Childhood motor skills...................................................... 110 6.2.4.4. Study 4: Trajectories of early childhood developmental skills. ...... 110 6.2.4.5. Study 5: Genotypic variation and cognitive profiles. ..................... 111 6.2.4.6. Study 6: Pilot trial of a social cognitive enhancement
programme. ..................................................................................... 111 6.2.5 Covariates................................................................................................ 111 6.2.6 Sample characteristics............................................................................. 111 6.2.7 Statistical analyses. ................................................................................. 112
Chapter 7: Study 1: Childhood Literacy Skills.................................................... 118 7.1 Introduction .................................................................................................... 118 7.2 Method ........................................................................................................... 118
7.2.1 Sample..................................................................................................... 118 7.2.2 Participants.............................................................................................. 119 7.2.3 Measures. ................................................................................................ 119
7.2.3.1. Primary outcome............................................................................. 119 7.2.3.2. Secondary outcome. ........................................................................ 119 7.2.3.3. Literacy skills. ................................................................................. 119 7.2.3.4. Spelling (age 7 and 9) ..................................................................... 119 7.2.3.5. Test of basic reading (age 7 & 9). .................................................. 120 7.2.3.6. Test of reading skills and comprehension (age 9). ......................... 120 7.2.3.7. Listening comprehension and oral expression................................ 120
7.2.4 Covariates................................................................................................ 120 7.2.5 Data manipulation and statistical analyses.............................................. 121
7.3 Results............................................................................................................ 122 7.3.1 Participants and missing data. ................................................................. 122 7.3.2 Sample characteristics............................................................................. 123 7.3.3 Predicting psychotic experiences from literacy skills............................. 123 7.3.4 Predicting psychotic experiences from changes in literacy performance
over time. ................................................................................................ 126 7.3.5 Gender specific effects............................................................................ 126
7.4 Discussion ...................................................................................................... 130
Chapter 8: Study 2: Childhood Attention Skills.................................................. 133 8.1 Introduction .................................................................................................... 133 8.2 Method ........................................................................................................... 133
8.2.1 Sample..................................................................................................... 133 8.2.2 Participants.............................................................................................. 134 8.2.3 Measures. ................................................................................................ 134
8.2.3.1. Primary outcome............................................................................. 134 8.2.3.2. Secondary outcome. ........................................................................ 134
CHILDHOOD DEVELOPMENT FACTORS AND RISK OF PSYCHOTIC EXPERIENCES x
8.2.3.3. Attention skills................................................................................. 134 8.2.3.4. Inhibitory control skills................................................................... 136 8.2.3.5. Attention skills (questionnaire). ...................................................... 136
8.2.4 Covariates................................................................................................ 137 8.2.5 Data manipulation and statistical analyses.............................................. 137
8.2.5.1. Attention skills scores (assessment). ............................................... 137 8.2.5.2. Attention skills scores (questionnaire). ........................................... 137
8.3 Results............................................................................................................ 138 8.3.1 Participants and missing data. ................................................................. 138 8.3.2 Sample characteristics............................................................................. 138 8.3.3 Predicting psychotic experiences from childhood attention skills.......... 138 8.3.4 Predicting psychotic experiences from changes in attention performance
over time. ................................................................................................ 142 8.3.5 Predicting psychotic experiences from DAWBA attention standardised
factor scores. ........................................................................................... 146 8.4 Discussion ...................................................................................................... 151
Chapter 9: Study 3: Childhood Motor Skills ....................................................... 152 9.1 Introduction .................................................................................................... 152 9.2 Method ........................................................................................................... 152
9.2.1 Sample..................................................................................................... 152 9.2.2 Participants.............................................................................................. 152 9.2.3 Measures. ................................................................................................ 153
9.2.3.1. Primary outcome............................................................................. 153 9.2.3.2. Secondary outcome. ........................................................................ 153 9.2.3.3. Childhood motor skills. ................................................................... 153
9.2.4 Covariates................................................................................................ 153 9.2.5 Data manipulation and statistical analyses.............................................. 153
9.3 Results............................................................................................................ 154 9.3.1 Sample characteristics............................................................................. 154 9.3.2 Participants and missing data. ................................................................. 154 9.3.3 Predicting suspected and definite PEs from childhood motor skills....... 154 9.3.4 Predicting persistent PEs over time from childhood motor skills........... 155
9.4 Discussion ...................................................................................................... 160
Chapter 10: Study 4: Trajectories of Early Childhood Developmental Skills.. 161 10.1 Introduction.................................................................................................. 161 10.2 Method ......................................................................................................... 161
10.2.1 Sample................................................................................................... 161 10.2.2 Participants............................................................................................ 161 10.2.3 Measures. .............................................................................................. 162
10.2.3.1. Primary outcome........................................................................... 162 10.2.3.2. Secondary outcome. ...................................................................... 162 10.2.3.3. Infant developmental skills............................................................ 162
10.2.4 Covariates.............................................................................................. 162 10.2.5 Data manipulation and statistical analyses............................................ 163
10.2.5.1. Primary analyses........................................................................... 163 10.2.5.2. Secondary analyses. ...................................................................... 163
10.3 Results .......................................................................................................... 164 10.3.1 Participants and missing data................................................................ 164 10.3.2 Sample characteristics........................................................................... 165
CHILDHOOD DEVELOPMENT FACTORS AND RISK OF PSYCHOTIC EXPERIENCES xi
10.3.3 Primary analyses. .................................................................................. 165 10.3.3.1. Associations between early adolescent PEs and early childhood
developmental skills. ....................................................................... 165 10.3.4 Secondary analyses. .............................................................................. 168
10.3.4.1. Latent class growth analysis. ........................................................ 168 10.3.4.2. Fine motor skills............................................................................ 168 10.3.4.3. Gross motor skills. ........................................................................ 168 10.3.4.4. Social Skills. .................................................................................. 168 10.3.4.5. Associations between early adolescent PEs and early childhood
developmental trajectories .............................................................. 175 10.4 Discussion .................................................................................................... 180
Chapter 11: Study 5: Genotypic Variation and Childhood Cognitive Profiles. 181 11.1 Introduction.................................................................................................. 181 11.2 Method ......................................................................................................... 182
11.2.1 Sample................................................................................................... 182 11.2.2 Participants............................................................................................ 182 11.2.3 Measures. .............................................................................................. 182
11.2.3.1. Primary outcome........................................................................... 182 11.2.3.2. Secondary outcome. ...................................................................... 182 11.2.3.3. Literacy skills. ............................................................................... 182 11.2.3.4. Intellectual profile......................................................................... 182 11.2.3.5. DTNBP1, DISC1 and NRG1 genotypes. ....................................... 182
11.2.4 Covariates.............................................................................................. 183 11.2.5 Data manipulation and statistical analyses............................................ 183
11.2.5.1. Genetic analysis. ........................................................................... 183 11.2.5.2. Literacy factor............................................................................... 183 11.2.5.3. Intellectual factor. ......................................................................... 183 11.2.5.4. Additive model of interaction........................................................ 184
11.3 Results .......................................................................................................... 185 11.3.1 DTNBP1, NRG1 and DISC1 genotypes and psychotic experiences. ... 185 11.3.2 Literacy skills, intellectual profiles and psychotic experiences. ........... 192 11.3.3 Interactive effect of genotypic risk indicator, cognitive skills and
psychotic experiences. ............................................................................ 192
Chapter 12: Study 6: Pilot Trial of a Social Cognitive EnhancementProgramme ............................................................................................................. 200
12.1 Introduction.................................................................................................. 200 12.2 Method ......................................................................................................... 204
12.2.1 Participants............................................................................................ 204 12.2.2 Study design.......................................................................................... 204 12.2.3 Procedures............................................................................................. 205 12.2.4 Material. ................................................................................................ 206
12.2.4.1. Programme.................................................................................... 206 12.2.5 Measurements. ...................................................................................... 208
12.2.5.1. Neuropsychological Investigation for Children-II........................ 208 12.2.5.2. The Children’s Attributional Style Interview. ............................... 208 12.2.5.3. Child Behaviour Checklist (CBCL)............................................... 209 12.2.5.4. Demographic questionnaire.......................................................... 209
12.3 Results .......................................................................................................... 209 12.3.1 Sample characteristics........................................................................... 209
CHILDHOOD DEVELOPMENT FACTORS AND RISK OF PSYCHOTIC EXPERIENCES xii
12.3.2 Neuropsychological Investigation for Children-II. ............................... 210 12.3.3 Child behaviour checklist...................................................................... 210 12.3.4 Children’s attributional style interview................................................. 210
12.4 Discussion .................................................................................................... 215
Chapter 13: Discussion and Conclusion............................................................... 216 13.1 Discussion .................................................................................................... 216
13.1.1 Study 1: Childhood literacy skills......................................................... 217 13.1.2 Study 2: Childhood attention skills....................................................... 220 13.1.3 Study 3: Childhood motor skills. .......................................................... 224 13.1.4 Study 4: Trajectories of early childhood developmental skills............. 226 13.1.5 Study 5: Child genotype and cognitive profiles.................................... 228 13.1.6 Study 6: Pilot trial of a social cognitive enhancement programme. ..... 231
13.2 Research applications and implications ....................................................... 233 13.2.1 Translational research for psychotic experiences and schizophrenia. .. 234 13.2.2 Early preventative intervention............................................................. 238 13.2.3 Psychological intervention models of schizophrenia............................ 238 13.2.4 Early identification and intervention for psychotic symptoms. ............ 239
13.3 Thesis’ Original Contribution to Knowledge............................................... 244 13.4 Summary, Conclusion, and Future Research Directions.............................. 245
References ............................................................................................................... 248 Appendix 1.A. DSM—IV and DSM—5 criteria for schizophrenia and
schizoaffective disorder .................................................................................. 277 Appendix 6.A. ALSPAC Research Proposal and Ethics Approval...................... 278 Appendix 6.B. Deakin University Human Research Ethics Approval
(ALSPAC studies) .......................................................................................... 279 Appendix 6.C. Psychotic-Like Symptoms Semi-Structured Interview................... 280 Appendix 7.B. Descriptive statistics for literacy standardised z-scores by
PLIKS completion status ................................................................................ 288 Appendix 8.A. Descriptive statistics for attention and inhibitory control skills
according to PLIKS interview completion status ........................................... 289 Appendix 9.A. Frequencies, percentages, and statistical significance of motor
impairment scores for those with and without complete PLIKS interview .... 290 Appendix 10.A. Descriptive and inferential statistics for standardised z scores
of Denver Developmental Screening Test- II domains by PLIKScompletion status ............................................................................................ 291
Appendix 10.B. Descriptive statistics for standardised z scores of DenverDevelopmental Screening Test- II domains and psychotic experiences......... 292
Appendix 10.C. Descriptive statistics for standardised z scores of DenverDevelopmental Screening Test- II domains and classes of psychoticexperiences ..................................................................................................... 293
Appendix 11.A. Correlation matrix for measurements of literacy ski.................. 294 Appendix 12.A. Deakin University Human Research Ethics Approval (pilot
trial) ................................................................................................................ 296 Appendix 12.B. Pilot trial invitation flyer............................................................ 297 Appendix 12.C. Parental consent and plain language statement ......................... 298 Appendix 12.D. Children consent and plain language statement ......................... 308 Appendix 12.E. Descriptions of NEPSY-II subtests, interpretive suggestions
used for the pilot trial...................................................................................... 316 Appendix 12.F. The Children’s Attributional Style Interview ............................. 317
CHILDHOOD DEVELOPMENT FACTORS AND RISK OF PSYCHOTIC EXPERIENCES xiii
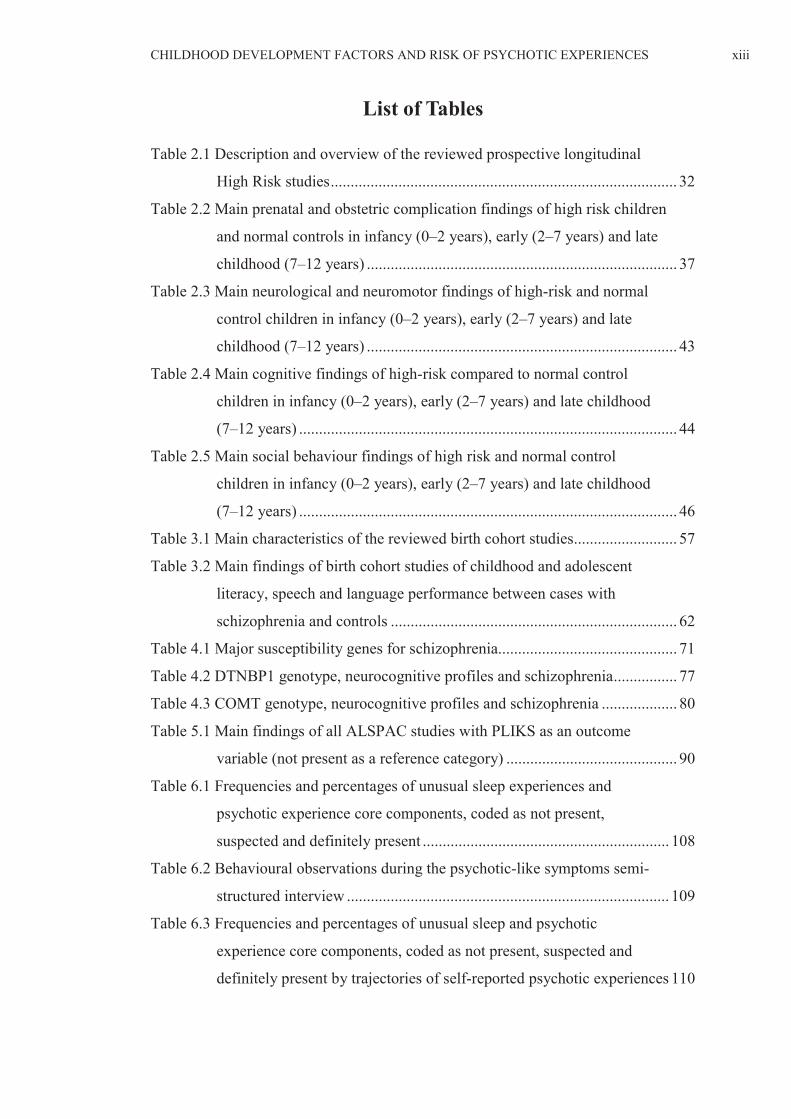
List of Tables
Table 2.1 Description and overview of the reviewed prospective longitudinal
High Risk studies....................................................................................... 32
Table 2.2 Main prenatal and obstetric complication findings of high risk children
and normal controls in infancy (0–2 years), early (2–7 years) and late
childhood (7–12 years) .............................................................................. 37
Table 2.3 Main neurological and neuromotor findings of high-risk and normal
control children in infancy (0–2 years), early (2–7 years) and late
childhood (7–12 years) .............................................................................. 43
Table 2.4 Main cognitive findings of high-risk compared to normal control
children in infancy (0–2 years), early (2–7 years) and late childhood
(7–12 years) ............................................................................................... 44
Table 2.5 Main social behaviour findings of high risk and normal control
children in infancy (0–2 years), early (2–7 years) and late childhood
(7–12 years) ............................................................................................... 46
Table 3.1 Main characteristics of the reviewed birth cohort studies.......................... 57
Table 3.2 Main findings of birth cohort studies of childhood and adolescent
literacy, speech and language performance between cases with
schizophrenia and controls ........................................................................ 62
Table 4.1 Major susceptibility genes for schizophrenia............................................. 71
Table 4.2 DTNBP1 genotype, neurocognitive profiles and schizophrenia................ 77
Table 4.3 COMT genotype, neurocognitive profiles and schizophrenia ................... 80
Table 5.1 Main findings of all ALSPAC studies with PLIKS as an outcome
variable (not present as a reference category) ........................................... 90
Table 6.1 Frequencies and percentages of unusual sleep experiences and
psychotic experience core components, coded as not present,
suspected and definitely present .............................................................. 108
Table 6.2 Behavioural observations during the psychotic-like symptoms semi-
structured interview ................................................................................. 109
Table 6.3 Frequencies and percentages of unusual sleep and psychotic
experience core components, coded as not present, suspected and
definitely present by trajectories of self-reported psychotic experiences 110
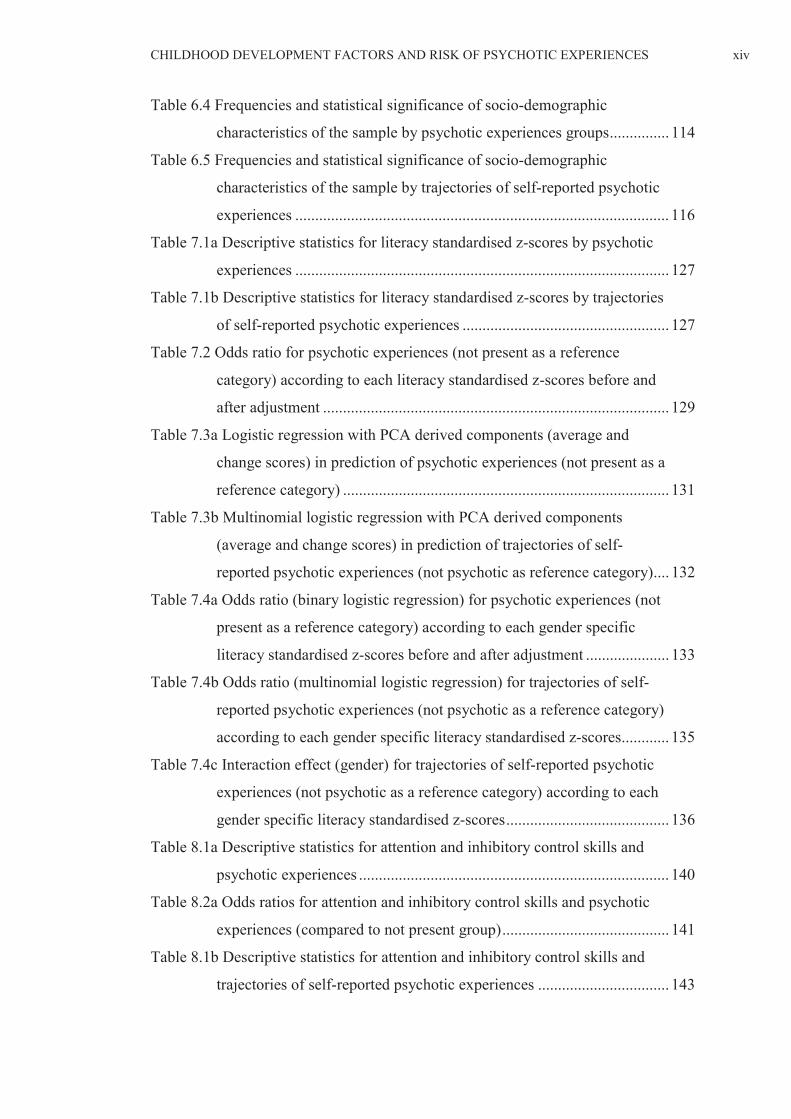
CHILDHOOD DEVELOPMENT FACTORS AND RISK OF PSYCHOTIC EXPERIENCES xiv
Table 6.4 Frequencies and statistical significance of socio-demographic
characteristics of the sample by psychotic experiences groups............... 114
Table 6.5 Frequencies and statistical significance of socio-demographic
characteristics of the sample by trajectories of self-reported psychotic
experiences .............................................................................................. 116
Table 7.1a Descriptive statistics for literacy standardised z-scores by psychotic
experiences .............................................................................................. 127
Table 7.1b Descriptive statistics for literacy standardised z-scores by trajectories
of self-reported psychotic experiences .................................................... 127
Table 7.2 Odds ratio for psychotic experiences (not present as a reference
category) according to each literacy standardised z-scores before and
after adjustment ....................................................................................... 129
Table 7.3a Logistic regression with PCA derived components (average and
change scores) in prediction of psychotic experiences (not present as a
reference category) .................................................................................. 131
Table 7.3b Multinomial logistic regression with PCA derived components
(average and change scores) in prediction of trajectories of self-
reported psychotic experiences (not psychotic as reference category).... 132
Table 7.4a Odds ratio (binary logistic regression) for psychotic experiences (not
present as a reference category) according to each gender specific
literacy standardised z-scores before and after adjustment ..................... 133
Table 7.4b Odds ratio (multinomial logistic regression) for trajectories of self-
reported psychotic experiences (not psychotic as a reference category)
according to each gender specific literacy standardised z-scores............ 135
Table 7.4c Interaction effect (gender) for trajectories of self-reported psychotic
experiences (not psychotic as a reference category) according to each
gender specific literacy standardised z-scores......................................... 136
Table 8.1a Descriptive statistics for attention and inhibitory control skills and
psychotic experiences .............................................................................. 140
Table 8.2a Odds ratios for attention and inhibitory control skills and psychotic
experiences (compared to not present group).......................................... 141
Table 8.1b Descriptive statistics for attention and inhibitory control skills and
trajectories of self-reported psychotic experiences ................................. 143
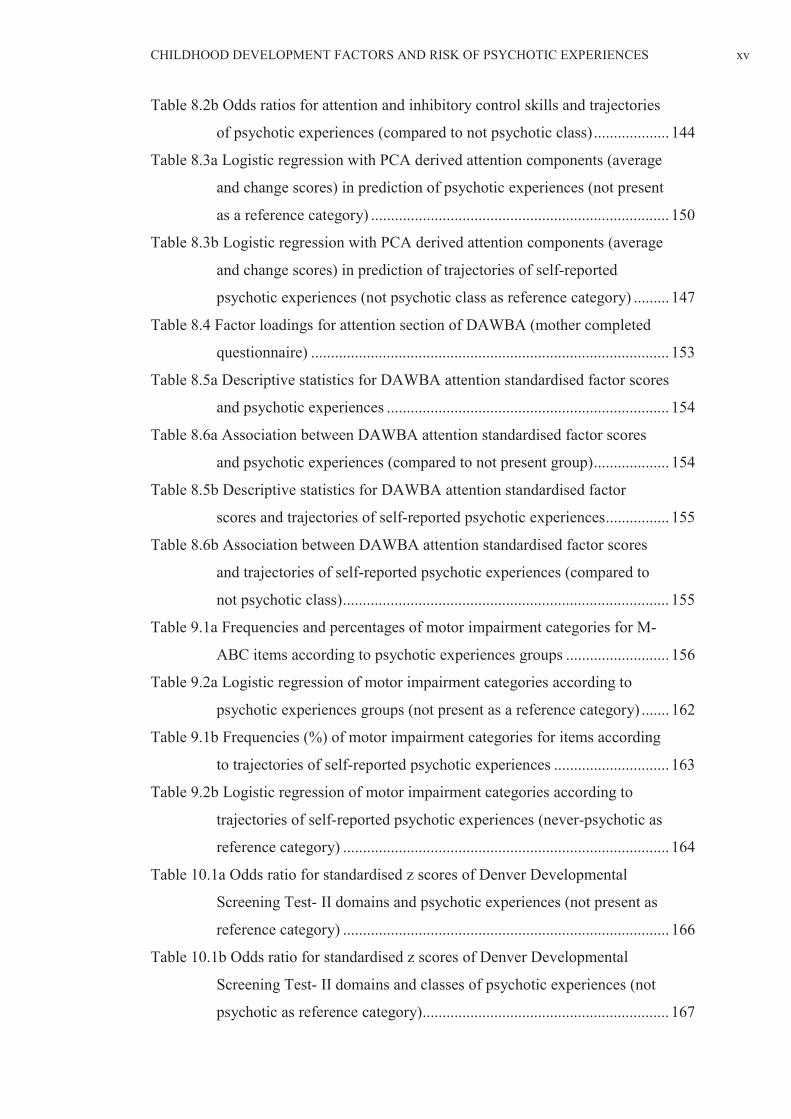
CHILDHOOD DEVELOPMENT FACTORS AND RISK OF PSYCHOTIC EXPERIENCES xv
Table 8.2b Odds ratios for attention and inhibitory control skills and trajectories
of psychotic experiences (compared to not psychotic class)................... 144
Table 8.3a Logistic regression with PCA derived attention components (average
and change scores) in prediction of psychotic experiences (not present
as a reference category) ........................................................................... 150
Table 8.3b Logistic regression with PCA derived attention components (average
and change scores) in prediction of trajectories of self-reported
psychotic experiences (not psychotic class as reference category) ......... 147
Table 8.4 Factor loadings for attention section of DAWBA (mother completed
questionnaire) .......................................................................................... 153
Table 8.5a Descriptive statistics for DAWBA attention standardised factor scores
and psychotic experiences ....................................................................... 154
Table 8.6a Association between DAWBA attention standardised factor scores
and psychotic experiences (compared to not present group)................... 154
Table 8.5b Descriptive statistics for DAWBA attention standardised factor
scores and trajectories of self-reported psychotic experiences................ 155
Table 8.6b Association between DAWBA attention standardised factor scores
and trajectories of self-reported psychotic experiences (compared to
not psychotic class).................................................................................. 155
Table 9.1a Frequencies and percentages of motor impairment categories for M-
ABC items according to psychotic experiences groups .......................... 156
Table 9.2a Logistic regression of motor impairment categories according to
psychotic experiences groups (not present as a reference category) ....... 162
Table 9.1b Frequencies (%) of motor impairment categories for items according
to trajectories of self-reported psychotic experiences ............................. 163
Table 9.2b Logistic regression of motor impairment categories according to
trajectories of self-reported psychotic experiences (never-psychotic as
reference category) .................................................................................. 164
Table 10.1a Odds ratio for standardised z scores of Denver Developmental
Screening Test- II domains and psychotic experiences (not present as
reference category) .................................................................................. 166
Table 10.1b Odds ratio for standardised z scores of Denver Developmental
Screening Test- II domains and classes of psychotic experiences (not
psychotic as reference category).............................................................. 167

CHILDHOOD DEVELOPMENT FACTORS AND RISK OF PSYCHOTIC EXPERIENCES xvi
Table 10.2a Model selection results from latent class growth analysis (mixture)
of Denver Developmental Screening Test – II ........................................ 170
Table 10.2b Proportion of individuals in each class and average latent class
probabilities for most likely latent class membership ............................. 171
Table 10.3a Frequencies and percentages for early childhood developmental
trajectories and psychotic experiences in early adolescence ................... 177
Table 10.3b Odds ratios for early childhood developmental trajectories and
psychotic experiences (not present as reference category)...................... 177
Table 10.4a Frequencies and percentages for early childhood developmental
trajectories and classes of psychotic experiences .................................... 178
Table 10.4b Odds ratios for early childhood developmental trajectories and
classes of psychotic experiences (not psychotic as reference category) . 178
Table 10.5a Logistic regression with PCA derived components (average and
change scores) in prediction of psychotic experiences (not present
group as reference category).................................................................... 179
Table 10.5b Logistic regression with PCA-derived components (average and
change scores) in prediction of classes of self-reported psychotic
experiences (intermittent, persistent, decreasing).................................... 179
Table 11.1a Frequencies and percentages of DTNBP1, NRG1 and DISC1
genotypes and psychotic experiences ...................................................... 193
Table 11.1b Odds ratios for DTNBP1, NRG1 and DISC1 genotypes and
psychotic experiences (not present as a reference category) ................... 195
Table 11.1c Genotypic frequencies (%) and statistical analysis of DTNBP1,
NRG1 and DISC1 genotypes and trajectories of psychotic experiences. 197
Table 11.2a Frequencies and percentages of childhood low average cognitive
profiles and psychotic experiences .......................................................... 201
Table 11.2b Odds ratios for childhood low average cognitive profiles and
psychotic experiences (not present as a reference category) ................... 201
Table 11.2c Distribution and statistical analysis of childhood low average
cognitive profiles and trajectories of self-reported psychotic
experiences .............................................................................................. 202
Table 11.3 Odds ratios for definite psychotic experiences attributable to additive
interaction between low average literacy skills and DTNBP1
(rs4715984) minor alleles (G:A + A:A) .................................................. 203
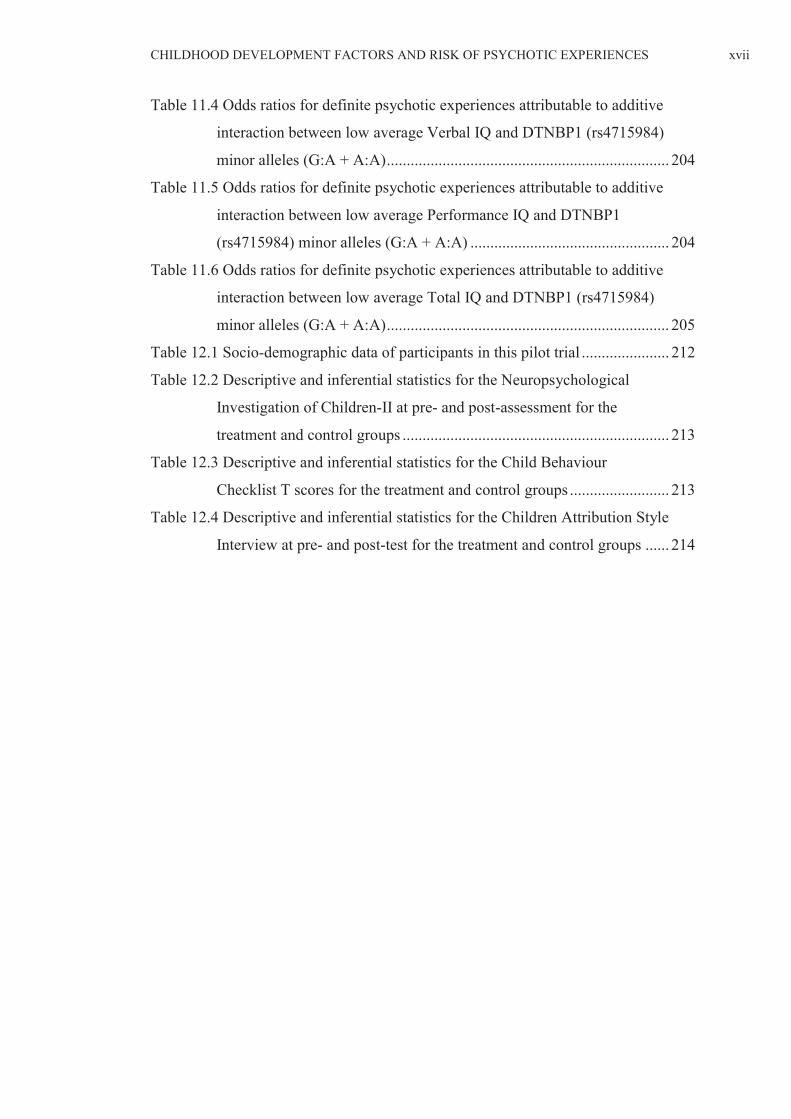
CHILDHOOD DEVELOPMENT FACTORS AND RISK OF PSYCHOTIC EXPERIENCES xvii
Table 11.4 Odds ratios for definite psychotic experiences attributable to additive
interaction between low average Verbal IQ and DTNBP1 (rs4715984)
minor alleles (G:A + A:A)....................................................................... 204
Table 11.5 Odds ratios for definite psychotic experiences attributable to additive
interaction between low average Performance IQ and DTNBP1
(rs4715984) minor alleles (G:A + A:A) .................................................. 204
Table 11.6 Odds ratios for definite psychotic experiences attributable to additive
interaction between low average Total IQ and DTNBP1 (rs4715984)
minor alleles (G:A + A:A)....................................................................... 205
Table 12.1 Socio-demographic data of participants in this pilot trial ...................... 212
Table 12.2 Descriptive and inferential statistics for the Neuropsychological
Investigation of Children-II at pre- and post-assessment for the
treatment and control groups ................................................................... 213
Table 12.3 Descriptive and inferential statistics for the Child Behaviour
Checklist T scores for the treatment and control groups ......................... 213
Table 12.4 Descriptive and inferential statistics for the Children Attribution Style
Interview at pre- and post-test for the treatment and control groups ...... 214

CHILDHOOD DEVELOPMENT FACTORS AND RISK OF PSYCHOTIC EXPERIENCES xviii
List of Figures
Figure 10.a Trajectories of fine motor skills over time............................................ 172
Figure 10.b Trajectories of gross motor skills over time ......................................... 173
Figure 10.c Trajectories of social skills over time ................................................... 174
Figure 13.1. Conceptual model for risk estimation research in schizophrenia and
psychotic experiences.............................................................................. 243
CHILDHOOD DEVELOPMENT FACTORS AND RISK OF PSYCHOTIC EXPERIENCES xix
List of Abbreviations
ADD Attention deficit disorder
ADHD Attention-deficit hyperactivity disorder
ALSPAC Avon Longitudinal Study of Parents and Children
ANCOVA Analysis of covariance
ANOVA Analysis of variance
AR% Attributable risk percentage
AS Asperger’s syndrome
BIC Bayesian Information Criteria
CANTAB Cambridge Automated Test Battery
CASI Children’s Attributional Style Interview
CBCL Child Behaviour Checklist
CBT Cognitive behavioural therapy
CCRT Computerised cognitive rehabilitation therapy
CD Cognitive deficit
CELF-3 Clinical Evaluation of Language Fundamentals -3
ChIPS Children’s Interview for Psychiatric Syndromes
CHR Copenhagen High Risk
CIDI Composite International Diagnostic Interview
COMT Catechol-O-methyltransferase
CPT Continuous Performance Test
CS Cognitively spared
DA Directional asymmetries
CHILDHOOD DEVELOPMENT FACTORS AND RISK OF PSYCHOTIC EXPERIENCES xx
DAAO D-amino acid oxidase
DANVA Diagnostic Analysis of Non-Verbal Accuracy
DAs Directional asymmetries
DAWBA Development and Well-Being Assessment
DI Developmental instability
DISC Diagnostic Interview Schedule for Children
DMHD Dunedin Multidisciplinary Health and Development
DSM-III Diagnostic and Statistical Manual of Mental Disorders,
Volume 3
DSM-III-R Diagnostic and Statistical Manual of Mental Disorders,
Volume 3, revised edition
DSM-IV Diagnostic and Statistical Manual of Mental Disorders,
Volume 4
DZ Dizygotic
EHRS Edinburgh High-Risk Study
ERPs Event related potentials
EUP Emory University Project
FA Fluctuating asymmetry
FAFS Finish Adoptive Family Study
FEP First-episode psychosis
FFW Fast For Word
FHDR Finnish Hospital Discharge Register
GoM Grade of membership
HR High-risk
IQ Intelligence quotient

CHILDHOOD DEVELOPMENT FACTORS AND RISK OF PSYCHOTIC EXPERIENCES xxi
JIDS Jerusalem Infant Development Study
KMO Kaiser-Meyer-Olkin
LCGA Latent class growth analysis
LD Linkage disequilibrium
LMR–LRT Lo-Mendell-Rubin Likelihood Ratio Test
LOC Locus of control
MINI Mini International Neuropsychiatric Interview
MPA Minor physical anomalies
MRI Magnetic resonance imaging
MUSP Mater University Study of Pregnancy
MZ Monozygotic
NCs Normal controls
NCDS National Child Development Study
NCPP National Collaborative Perinatal Project
NEMESIS Netherlands Mental Health Survey and Incidence Study
NSHD National Survey of Health and Development
NYIS New York Infant Study
OC Obstetric complications
OPCS Office of Population Census and Statistics (UK)
PCA Principal Component Analysis
PDM Pandysmaturation
PE Psychotic experiences
PLIKS Psychotic-like symptoms
PPV Positive predictive value
PPVT Peabody Picture Vocabulary
CHILDHOOD DEVELOPMENT FACTORS AND RISK OF PSYCHOTIC EXPERIENCES xxii
RCT Randomised controlled trial
RLS Rochester Longitudinal Study
RR Relative risk
SDQ Strengths and Difficulties Questionnaire
SLI Specific language impairment
SNP Single nucleotide polymorphisms
ToM Theory of mind
TRS Treatment-resistant schizophrenia
URCFS University of Rochester Child and Family Study
WCST Wisconsin Card Sorting Test
WHO World Health Organization
WISC Wechsler Intelligence Scale for Children
WM Working memory
WMS Wechsler memory scale
WOLD Wechsler Objective Language Dimensions
WRAT Wide Range Achievement Test reading scale
WTAR Wechsler Test of Adult Reading
YSR Youth Self-Report
CHILDHOOD DEVELOPMENT FACTORS AND RISK OF PSYCHOTIC EXPERIENCES xxiii
Abstract
Over the last decade there has been increasing interest in psychotic experiences (PEs)
in the general population in early adolescence as a sign of vulnerability to adult
psychotic conditions such as schizophrenia. The accumulated evidence implies that
the presence of PEs in a proportion of individuals from the general population that do
not fulfil the clinical diagnostic criteria of schizophrenia may signal a problem of
potential public health concern. Further, the association of PEs with known
childhood neurodevelopmental indicators of schizophrenia is insufficiently studied.
This thesis argues that if PEs is an early expression of later vulnerability to adult
onset schizophrenia, they will share similar childhood developmental
endophenotypes and genetic markers associated with the development of
schizophrenia. The identification of factors associated with PEs occurring at key
points in child development may add substantially to efforts towards early detection
and preventative intervention. This thesis substantially contributes to understanding
PEs and their relation to known childhood neurodevelopmental indicators of
schizophrenia.
Using prospective data from the Avon Longitudinal Study of Parents and Children
(ALSPAC) (conducted at the University of Bristol in the United Kingdom [UK]),
this thesis examined differences in the literacy, attention, cognitive, motor, social and
communication skills of children that later completed the psychotic-like symptoms
(PLIKS) interview at a mean age of 12.9 (95% confidence interval = 12.5–13.3
years). The thesis further examined the association between patterns of performance
CHILDHOOD DEVELOPMENT FACTORS AND RISK OF PSYCHOTIC EXPERIENCES xxiv
over time in relation to the likelihood of reporting PEs. Finally, this thesis
investigated the association of a selection of known genetic markers of schizophrenia
and risk of reported PEs.
Through five empirical studies, data from 6,790 (45.6% of the original ALSPAC
sample) children who participated in the PLIKS semi-structured interview were
examined to assess their literacy, attention, cognitive, motor, social and
communication skills, by both standardised and ALSPAC research purpose-
developed measurements. Genotyping of single nucleotide polymorphisms (SNPs)
was performed using KBioscience services.
Overall, the results indicated strong evidence for literacy, cognitive and attention
skills in childhood as predictive of adolescent PEs and weak to moderate evidence
for the predictive value of motor, social and communication skills. When a selection
of known genetic markers of schizophrenia was added to the predictive model, the
prediction of adolescents’ PEs was not substantially improved.
The theoretical implications of these findings are that lower performance on literacy,
cognitive and attention skills is consistent with a neurodevelopmental model. This
model appears to be applicable to studies in which both schizophrenia and PEs are
used as the outcome variables. In addition, the examination of patterns of
performance over time suggested that declining patterns are associated with PEs,
which is consistent with a neurodegenerative model of schizophrenia. The
consistency of these findings with this study’s review of high-risk and birth cohort
studies suggests that the measurement of PEs in early adolescence may be a useful
CHILDHOOD DEVELOPMENT FACTORS AND RISK OF PSYCHOTIC EXPERIENCES xxv
indication of risk for the development of schizophrenia. Combining both the
neurodevelopmental and neurodegenerative models suggests that the developmental
process leading to schizophrenia may be one in which deficits occurring very early in
development impair functioning gradually and progressively over time.
This thesis also investigated whether children might benefit from a computer-aided
social cognitive enhancement programme. Research-based evidence on this issue is
inconsistent. However, the thesis argues that understanding the benefits of these
programmes may add substantially to development of targeted interventions for
children with a highly elevated risk of psychotic symptoms, and arguably
schizophrenia.
A pilot study was conducted to evaluate the feasibility and neuropsychological
benefits of a computer-aided programme in a community sample of typically
developing children (treatment n = 10; control n = 10), recruited from public primary
schools in Melbourne and Geelong, Australia. Childhood neuropsychological,
behavioural functioning and attributional style were measured pre- and post-
programme. The results indicated that participating in this programme was not
associated with significant social cognitive improvements. The treatment and control
groups showed a similar trend of improvement over time. Thus, the results of this
pilot trial did not suggest benefits in using computer-aided programmes with
children. However, theoretically, it may be argued that children at risk of developing
psychotic symptoms may benefit from targeted programmes drawing on traditional
cognitive, behavioural, psychodynamic or systemic interventions in schizophrenia.
CHILDHOOD DEVELOPMENT FACTORS AND RISK OF PSYCHOTIC EXPERIENCES xxvi
The findings of the empirical studies comprising this research imply that clinicians
and researchers should focus on the development of risk assessment strategies for
children who may have an elevated risk of developing psychotic symptoms, and
arguably schizophrenia. Further, a number of areas requiring further investigation are
identified. Firstly, the association between PEs in early adolescence and the
incidence of schizophrenia-related conditions in adulthood should be investigated in
mature cohorts. Secondly, the indication that an early insult in development plays an
important role in the origin of schizophrenia requires further investigation to identify
specific likely causes. This would be a key finding in the field. Finally, it would
appear that it is possible to predict developmental patterns associated with a pathway
towards psychotic symptoms, and arguably schizophrenia. Therefore, the
development of valid screening measures and assessment procedures, as well as
preventive interventions, should be undertaken.
CHILDHOOD DEVELOPMENT FACTORS AND RISK OF PSYCHOTIC EXPERIENCES xxvii
Synopsis
This thesis includes an introductory chapter, four literature reviews, a
research methodology chapter, five empirical studies using data from a longitudinal
cohort study, a pilot trial of a social cognitive enhancement programme, and a
detailed discussion chapter.
Chapter 1 presents a brief historical account of the biological and
psychological origins of schizophrenia. It then discusses three models of the
developmental pathway leading towards schizophrenia (that is, the
neurodegenerative, neurodevelopment and developmental instability [DI] models).
Each model provides an explanation of the casual processes and risk factors leading
to the onset of schizophrenia. The thesis argues that the investigation of PEs in
adolescence is a part of this pathway and that the identification of endophenotypes
associated with schizophrenia occurring at key points in child development can add
substantially to efforts to prevent the disorder. This chapter articulates this argument,
defines the concept of endophenotype in psychiatric research and situates a working
definition of PEs within the literature of the continuum hypothesis of schizophrenia.
While the presence of PEs in early adolescence does not reflect a clinical
diagnosis, psychiatric classification, psychiatric or other functional outcome, this
thesis argues that if PEs represents early vulnerability to adult onset schizophrenia,
they could share similar endophenotypes and developmental risk factors with
schizophrenia. As Chapter 1 explains, this thesis assesses this proposition and
provides a framework for early preventative interventions for children. Chapter 1
concludes with the thesis scope, contributions, aims and overview of the thesis.
Current research indicates that deficits in childhood developmental profiles
CHILDHOOD DEVELOPMENT FACTORS AND RISK OF PSYCHOTIC EXPERIENCES xxviii
are associated with adult schizophrenia. Chapters 2 and 3 use systematic review
methodology. These chapters review current findings on the childhood
neurodevelopmental factors that have been associated with the development of
schizophrenia in adulthood. Chapter 2 concludes by suggesting that children of
parents presenting with schizophrenia show subtle differences in multiple
developmental domains of functioning. Chapter 3 demonstrates that subtle
differences in childhood literacy, speech and language functioning are associated
with schizophrenia. The identification of developmental domains with high
predictive value for schizophrenia guides the selection of variables to be examined in
relation to risk of PEs in early adolescence.
Chapter 4 turns to the issue of the genetic aspects of schizophrenia. Since this
literature is vast, the chapter focuses on a selective review of studies. The aim here is
to present (a) epidemiological rates of schizophrenia in family, twin and adoption
studies; (b) an overview of current findings on candidate genetic risk factors for
schizophrenia; and (c) what is currently known about the relationships between
particular SNPs and cognitive impairments in individuals with schizophrenia.
Overall, these findings provided guidelines for investigating whether PEs are
associated with (a) family history of schizophrenia, (b) a selection of known genetic
markers for schizophrenia and/or (c) interactive effects of genotypes and childhood
cognitive profiles.
Before presenting a series of empirical studies, Chapter 5 introduces the
ALSPAC. Specifically, this chapter reviews all ALSPAC studies currently published
that have presented findings using PEs in early adolescence as the main outcome
variable. This chapter concludes by briefly commenting on the gaps in the literature,
which are then addressed in the subsequent empirical studies.
CHILDHOOD DEVELOPMENT FACTORS AND RISK OF PSYCHOTIC EXPERIENCES xxix
Chapter 6 presents the empirical studies’ research methods, including the
participants, measures, predictors, primary and secondary outcome variables,
covariates, sample characteristics and data analyses that apply to Chapters 7–11.
Chapter 7 presents the findings from the first empirical study relating to
childhood literacy skills and risk of reporting PEs. Chapter 8 focuses on childhood
attention skills, early adolescent attention problems and PEs. Chapters 9 and 10
present findings related to childhood motor competency and change trajectories in
early childhood developmental skills in relation to PEs. Directed by findings from
genetic association studies, Chapter 11 presents a preliminary study examining
genotypic variations in DTNBP1, DISC1 and NRG1 genes and the risk of reporting
PEs. This study also investigates the interactive effects of a genotypic risk indicator
and low-average cognitive skills on PEs.
Guided by the findings from Chapters 7–11, Chapter 12 shifts the focus of the
thesis to the benefits of computer-aided social cognitive enhancement programmes in
children. While the feasibility of such programmes is debatable, understanding the
benefits may guide the development of early interventions for children at risk of
developing psychotic symptoms, and possibly schizophrenia. Chapter 12 presents
findings related to a pilot trial of the neuropsychological benefits of a computer-aided
social cognitive enhancement programme in typically developing children.
Chapter 13 offers an in-depth discussion of the studies presented in Chapter
7–12, including their originality, main findings, comparison with previous research,
strengths and limitations, and alternative explanations of the results. This chapter
then discusses the theoretical applications and implications of the findings, with
major reference to translational research. This discussion then turns to the issue of
the early detection of psychotic symptoms and the feasibility of preventative

CHILDHOOD DEVELOPMENT FACTORS AND RISK OF PSYCHOTIC EXPERIENCES xxx
interventions for children at risk of developing psychotic symptoms, and arguably
schizophrenia. This chapter concludes by areas for further study.
CHILDHOOD DEVELOPMENT FACTORS AND RISK OF PSYCHOTIC EXPERIENCES 1
Chapter 1: Introduction
This chapter presents a brief historical account of the biological and
psychological origins of psychotic conditions. It then discusses three models that
explain the childhood developmental domains and risk factors associated with
psychotic conditions such as schizophrenia. These are the neurodegenerative,
neurodevelopment and developmental instability (DI) models. This chapter holds
that the deterioration of psychological, social and cognitive functioning with
increasing age is consistent with the neurodegenerative model. The presence of
subtle differences in the early developmental profiles of children who later develop
schizophrenia supports a neurodevelopmental model. Conversely, the presence of
minor physical anomalies (MPA), fluctuating asymmetry (FA), mixed handedness,
soft neurological signs and subtle psychomotor impairments well before the onset of
schizophrenia are compatible with a DI model. This chapter then introduces and
defines the notions of psychotic experiences (PEs) in early adolescence, and
endophenotypes in psychiatric research.
Individuals presenting with PEs do not fulfil the diagnostic criteria of
psychotic conditions such as schizophrenia.2 However, this thesis argues that if PEs
represent early vulnerability to adult onset schizophrenia, they might share similar
endophenotypes and premorbid risk factors with schizophrenia. In assessing this
proposition, this thesis investigates the association of multiple childhood
developmental profiles and risk of PEs in early adolescence. Further, it provides a
2 Appendix 1.A. shows the DSM—IV and DSM—5 criteria for schizophrenia and schizoaffective
disorder
CHILDHOOD DEVELOPMENT FACTORS AND RISK OF PSYCHOTIC EXPERIENCES 2
framework for early preventative interventions for children at risk of developing
psychotic symptoms, and arguably schizophrenia. This chapter concludes with the
thesis scope, contributions, aims and overview.
1.1 Brief History of Psychosis
Psychiatry has a long history of ascertaining the neurobiological roots of
psychotic disorders, including schizophrenia. In terms of symptomatology, generally,
schizophrenia is characterised by positive and negative symptoms. The positive
symptoms such as hallucinations, delusions, formal thought disorder, and bizarre
behaviour are more synonymous with ‘paranoia’ or ‘reality distortion’. On the other
hand, negative symptoms such as avolition, apathy, alogia, and anhedonia impact
adversely on social outcome (Tsoi, Hunter, & Woodruff, 2008)
However, controversy remains surrounding a precise definition of
schizophrenia. This issue initially appeared in the late nineteenth century with the
research of Emil Kraepelin (1904), who proposed dementia praecox as a single
deteriorating disease entity with classifiable signs and symptoms attributed mainly to
specific neuropathology and brain anatomical abnormalities (Bruijnzeel & Tandon,
2011; Hafner, 2004; Kraepelin, 1904).
Later, Eugen Bleuler (1950), considerably broadened the concept of dementia
praecox by introducing the name of schizophrenias (Dalzell, 2007). In his well-
known monograph, Dementia Praecox or the Group of Schizophrenias, Bleuler
(1950) indicated that schizophrenia’s basic psychopathological phenomenon
constituted a break in the continuity of several different psychic functions that
reflected a loosening of cognitive associations, disturbances of affectivity,
ambivalence and autism (‘the four A’s’) (Fusar- Poli & Politi, 2008). Bleuler held
that schizophrenia is not a single disease, but refers to a group of conditions with a
CHILDHOOD DEVELOPMENT FACTORS AND RISK OF PSYCHOTIC EXPERIENCES 3
common psychopathological core.
Irrespective of the precise definition and etiological roots, current literature
supports the developmental phases of schizophrenia (e.g., the premorbid, prodromal,
active and residual phases; Golembo-Smith et al., 2012; Keshavan & Hogarty, 1999;
Strauss et al., 2012). Substantial research on the premorbid phase has focused on
identifying neurodevelopmental precursors such as early cognitive, social, emotional
and motor difficulties in children who later developed schizophrenia (Niemi,
Suvisaari, Tuulio- Henriksson & Lonnqvist, 2003). While early developmental
delays and impairments have been suggested to support the neurodevelopmental
model of schizophrenia, a gradual decline over time is consistent with the
neurodegenerative hypothesis of schizophrenia.
1.2 Neurodegenerative Model of Schizophrenia
Kraepelin’s (1919) original clinical observations conceptualised
schizophrenia (dementia praecox) by its progressive and deteriorating course. The
accumulated evidence related to enlarged ventricles in the brain of individuals
presenting with schizophrenia demonstrate brain mass deterioration (Dwork,
Mancevski & Rosoklija, 2007;Wood, Pantelis, Yung, Velakoulis & McGorry, 2009).
However, the precise mechanisms contributing to the progressive change that may
reflect neurodegeneration are controversial (DeLisi, 2008).
Kempton et al. (2010) conducted a meta-analytic review of 13 longitudinal
studies with 473 individuals with schizophrenia and 348 controls. The review
included peer- reviewed studies using magnetic resonance imaging (MRI) to measure
lateral ventricles or the entire ventricular system at a minimum of two time points.
The results showed that individuals presenting with schizophrenia had increased rates
of lateral ventricle dilation over time as compared to the normal controls (NCs)
CHILDHOOD DEVELOPMENT FACTORS AND RISK OF PSYCHOTIC EXPERIENCES 4
(effect size Hedges g3 = 0.45, 95% Confidence Interval [CI] = 0.19–0.71, p =
0.0006) (Kempton, Stahl, Williams & DeLisi, 2010). While these findings are
consistent with a neurodegenerative model of schizophrenia, the question of when
ventricular enlargement starts in schizophrenia has been insufficiently studied
(Kempton et al., 2010). It remains controversial as to whether ventricular dilation
starts in the perinatal period, or later in life during the premorbid, prodromal or active
phases of schizophrenia.
The accumulated evidence from studies using non-invasive neuroimaging
techniques, such as MRI, reveal that after adult onset schizophrenia, some
individuals show progressive loss of grey matter in their frontal and temporal lobes
(Csernansky, 2007). However, the cellular mechanisms accountable for such losses
are unknown. The cognitive neuroimaging literature has reported abnormalities in the
frontal and temporal lobes in relation to impairments of executive function, episodic
memory and working memory in individuals presenting with schizophrenia
(Reichenberg & Harvey, 2007). In addition, comprehensive neuropsychological
research has shown that neurocognitive impairments are present before the onset of
psychotic symptoms (Reichenberg & Harvey, 2007).
Lieberman (1999) mentions that schizophrenia’s original name, dementia
praecox, implied the importance of the cognitive dimension of the disorder
(Lieberman, 1999, p. 733). Similarly, Bleuler (1911) focused much of his theoretical
work on the loosened thought association patterns that he observed in individuals
with schizophrenia. Further, current schizophrenia literature consistently reports
social cognitive deficits in three major broader cognitive domains: emotion
3 Hedges g is a Cohen’s effect size d with a correction for bias from small sample sizes (Hedges &
Olkin, 1985)
CHILDHOOD DEVELOPMENT FACTORS AND RISK OF PSYCHOTIC EXPERIENCES 5
perception, attribution style and theory of mind (ToM) (Green & Horan, 2010;
Moritz, Woodward, Burlon, Braus & Andresen, 2007).
Emotion perception refers to the ability to perceive emotion displayed in
facial expressions, vocal inflections or the interaction of these modalities (Van den
Stock, de Jong, Hodiamont & de Gelder, 2011). Typically, individuals with
schizophrenia show deficits in emotion perception, particularly for negative rather
than positive emotions, as compared to NCs (Mandal, Pandey & Prasad, 1998).
Attribution bias reflects how the causes of positive and negative events are
typically inferred by an individual (Moritz et al., 2007). Individuals with
schizophrenia typically attribute responsibility for negative outcomes to others and
positive outcomes to themselves (Martin & Penn, 2002). This has implications for
maintaining a positive self- image while creating negative perceptions of others.
However, there is also a tendency for acute patients to attribute both negative and
positive events to others more than to themselves (Lincoln, Mehl, Exner,
Lindenmeyer & Rief, 2010). In non-clinical samples, individuals tend to make
dispositional judgments but subsequently correct impressions based on contextual
information (Garnefski et al., 2002). However, negative attributions are not
corrected, despite disconfirming evidence, in individuals with paranoia and
persecutory delusions (Langdon, Corner, McLaren, Ward & Coltheart, 2006). Two
factors appear to prevent bias correction in these individuals: a strong need for
closure (dislike of ambiguity) and deficits in ToM (Langdon et al., 2006). Indeed,
there is a relationship between personalising bias and ToM in both clinical and non-
clinical samples (Randall, Corcoran, Day & Bentall, 2003).
ToM involves both the ability to represent the mental states of self and others,
and the capacity to infer the content and intentions of those mental states. ToM is
CHILDHOOD DEVELOPMENT FACTORS AND RISK OF PSYCHOTIC EXPERIENCES 6
considered to develop intact in individuals with schizophrenia but ‘breakdown’
during an acute psychotic episode (Harrington, Siegert & McClure, 2005). However,
a growing body of research suggests that ToM deficits are present not only in
individuals with schizophrenia, but also in their first-degree relatives (Harrington,
Siegert & McClure, 2005). In addition, following their first psychotic episode,
individuals experience significant decrements in various domains of cognitive
function (Barnow et al., 2010; Hill et al., 2009; Koelkebeck et al., 2010; Saykin,
1994). Further, maternal reports (of children aged five) and self-reports (children
aged 14) of deteriorating attention skills were associated with an increased risk of
non-affective psychosis in young adult males (mean age 21 years; Odds Ratio [OR]
= 5.56, 95% CI = 1.83–16.87) (gender-specific effects) (Welham et al., 2010).
These findings imply that schizophrenia is associated with multiple
impairments in childhood developmental indices, which may also have a
deteriorating pattern of performance over time. Therefore, this thesis argues that if
PEs in early adolescence reflect a risk factor for schizophrenia, a decreasing pattern
of performance in neuropsychological measures over time will also be associated
with risk of adolescents’ PEs. However, while Lierberman (1999) argued that the
specific nature of neurocognitive impairments have proved almost as elusive as the
neuropathology of schizophrenia (Lieberman, 1999), the discussion and
understanding of neurodegeneration in schizophrenia has both diagnostic and
therapeutic implications (Perez-Neri, Ramirez-Bermudez, Montes & Rios, 2006).
1.3 Neurodevelopmental Model of Schizophrenia
The term ‘neurodevelopment’ emerged in schizophrenia literature in
conjunction with considerable research evidence showing that early environmental
stressors, such as obstetric and prenatal complications, may contribute to the
CHILDHOOD DEVELOPMENT FACTORS AND RISK OF PSYCHOTIC EXPERIENCES 7
development of schizophrenia (Walker, Shapiro, Esterberg & Trotman, 2010). The
pathogenesis of schizophrenia is hypothesized to be neurodevelopmental in nature;
this is based on findings of associations between an excess of adverse events during
the pre- and perinatal periods, the presence of cognitive and behavioural signs during
childhood and adolescence, and risk of schizophrenia (Lewis & Levitt, 2002).
There is accumulated evidence that indicates a strong association between
obstetric complications (OCs) and risk of developing schizophrenia in later life
(Walshe et al., 2005). Walshe et al. investigated OCs in 36 individuals with
schizophrenia from families with a history of schizophrenia, 38 of their unaffected
siblings, 31 individuals with schizophrenia with no family history of schizophrenia,
51 of their unaffected siblings and 60 NCs. Information on OCs was derived using
the Lewis–Murray Scale (e.g., rubella, syphilis, rhesus incompatibility, pre-
eclampsia, antepartum haemorrhage or threatened abortion, and birth weight under
2000g). The results indicated that, relative to normal controls, only individuals
presenting with schizophrenia from families with a history of psychosis had elevated
rates of OCs (OR = 3.22, 95% CI = 1.15–9.02, p = 0.03). There were no significant
differences in OCs in their unaffected siblings (OR = 1.2, CI = 0.54–2.72). These
findings imply that OCs may not reflect a genetic predisposition to schizophrenia,
since rates of OCs were not elevated in the unaffected siblings of individuals with
schizophrenia.
The research evidence related to higher rates of OCs and increased risk of
schizophrenia may be interpreted in reference to two major models for genetic
predisposition to schizophrenia. These are the general single-locus model (Meehl,
1962) and the multifactorial-threshold model (Gottesman & Shields, 1967). Meehl’s
(1962, 1989) general single-locus model suggests that schizotaxia, a condition arising
CHILDHOOD DEVELOPMENT FACTORS AND RISK OF PSYCHOTIC EXPERIENCES 8
from a single gene (‘schizogene’), interacts with pre- and post-natal developmental
processes, leading to phenotypic schizotypy, and possibly schizophrenia
(Lenzenweger, 2006; Meehl, 1962, 1989). Meehl (1962) argues that while the
content of schizophrenia is learned, it is ‘fundamentally a neurological disease of
genetic origins’ (1962, p. 837). Moreover, the schizotaxic brain may become the
foundation for adverse interaction with other factors, which might include the ‘social
learning history of an individual as well as other genetic factors’ (Lenzenweger,
2006, p. 197). However, studies on incidence rates of schizophrenia-spectrum
disorders within families reveal trends more consistent with the multifactorial-
threshold model than with Meehl’s general single-locus model (Gottesman, 1991;
Gottesman & Shields, 1967; Gottesman, Shields & Hanson, 1982). The
multifactorial-threshold model proposes that familial transmission of schizophrenia is
due to multiple genetic (polygenic) and environmental factors (McGue, Gottesman &
Rao,1983).
Current literature indicates that susceptibility genes for schizophrenia may
interact with epigenetic and environmental factors to increase risk of schizophrenia
(O’Tuathaigh, Desbonnet, Moran & Waddington, 2012). O’Tuathaigh et al. (2012)
suggested that environmental stressors (e.g., perinatal stressors) and epigenetic
regulators of gene expression (e.g., DNA cytosine methylation and histone
modification) might interact with several genes, leading to molecular alterations
associated with schizophrenia. The accumulated research evidence supports the role
of early perinatal stressors and increased risk of schizophrenia (Clarke, Harley &
Cannon, 2006; Mednick, Parnas & Schulsinger, 1987; Parnas, Schulsinger, Teasdale
et al., 1982). In light of their importance, these early environmental factors have been
integrated with genetic liability in the 2-hit and 3-hit models of schizophrenia.
CHILDHOOD DEVELOPMENT FACTORS AND RISK OF PSYCHOTIC EXPERIENCES 9
The 2-hit schizophrenia model proposes that abnormalities in development
during two critical time points (early brain development and adolescence) contribute
to the overt manifestation of clinical symptoms (Fatemi & Folsom, 2009). By
contrast, as indicated by Keshavan (1999), the 3-hit model proposes that early brain
insults may contribute to the abnormal development of selective neural networks,
accounting for premorbid cognitive and psychosocial impairments. Psychotic
symptoms in adolescence may also be related to elimination of synapses and over-
activity of the dopaminergic pathways. Further, neurochemical alterations in relation
to continuing untreated psychosis may lead to further neurodegenerative processes
(1999, p. 513). Early brain insults (e.g., consequences of pre- perinatal adverse
events) and susceptibility genes may jointly determine the eventual development of
schizophrenia (Cannon et al., 1993; Cannon, Mednick & Parnas, 1989).
The 3-hit hypothesis proposes that these “mechanisms may interact
cumulatively during successive critical windows of vulnerability during brain
development and during the early course of the illness to lead to the clinical
manifestations of the illness” (Keshavan, 1999, p. 513). Generally, the 2-hit and 3-hit
models are diathesis-stress models, which propose that developing schizophrenia
requires both genetic liability and an environmental insult that might contribute to
structural changes in the brain (Cannon et al., 1989).
Research on adults with schizophrenia has shown that they experience
significantly elevated rates of OCs (e.g., hypoxia, maternal illness and low birth
weight) compared with the general population (Geddes & Lawrie, 1995). Further,
among the children of mothers presenting with schizophrenia, there is evidence that
those children that experienced more perinatal birth complications are more likely to
develop schizophrenia (Mednick et al., 1987; Sameroff, Seifer, Zax & Barocas,
CHILDHOOD DEVELOPMENT FACTORS AND RISK OF PSYCHOTIC EXPERIENCES 10
1987). Research also suggests that OCs could interact with genetic liability rather
than act simply as additive risk factors; that is, they might only be pathogenic in the
presence of the genetic diathesis for schizophrenia (Goodman, 1988; Parnas et al.,
1982). This hypothesis is strengthened by evidence that the interaction of genetic risk
with OCs can be used to predict the developmental brain abnormalities seen in
schizophrenia, such as enlarged ventricles (Cannon et al., 1993).
Although presumably subject to the same etiological genetic processes,
individuals presenting with schizophrenia vary widely in clinical presentation, course
and outcome, as well as in psychological, social and neurocognitive function,
structural abnormalities and brain asymmetry and lateralisation patterns (Yeo,
Gangestad, Edgar & Thoma, 1999). As noted by Yeo et al. (1999), if these
abnormalities were caused by a single underlying genetic process (a single gene), the
various abnormalities should be highly inter-correlated. However, findings that
multiple domains of functioning and brain asymmetry/lateralisation patterns correlate
either weakly or not at all suggest that a common gene or set of genes is not
responsible (Yeo et al., 1999). In addition, from an evolutionary perspective, the
failure of selection factors to reduce transmission of a disorder associated with severe
impairment, decreased adaptive functioning and lowered fertility (Gottesman, 1991)
would be difficult to explain if only one genetic process were responsible for the
expression of schizophrenia- spectrum disorders (Yeo et al., 1999). Further, while the
role of genetics in the development of psychopathology in general and schizophrenia
in particular is well supported, no study has yet confirmed genetics as the sole factor
in the onset of schizophrenia. Nieratschker et al. (2010) stated that ‘beside genetic
factors, environmental factors are also involved in the etiology of the disease’ (2010,
p. 1).
CHILDHOOD DEVELOPMENT FACTORS AND RISK OF PSYCHOTIC EXPERIENCES 11
Current research indicates that children who later develop schizophrenia
show deficits in multiple developmental domains of functioning well before the onset
of clinical symptoms. The neurodevelopmental hypothesis considers these premorbid
impairments and the expression of prenatal abnormalities caused by the interaction of
genetic and environmental factors. However, recently, the developmental instability
(DI) model has provided an alternative explanation of psychosocial and
neurocognitive deficits in schizophrenia.
1.4 Developmental Instability Model of Schizophrenia
The DI construct was established by evolutionary theorists such as
Waddington and Lerner, and developed in recent years by Gottesman, Markow,
Woolf and others (Yeo, Gangestad & Thoma, 2007). DI has been proposed as the
mechanism underlying much of health and disease heterogeneity in general, and
schizophrenia in particular (Van Dongen & Gangestad, 2011). The DI model is based
on the assumption that an organism’s ability to precisely carry out its genetic
‘design’ is expressed through an epigenetic developmental process (Yeo et al., 1999,
p. 200).
Yeo et al. (1999) have suggested that during development, environmental and
genetic perturbations such as pathogens, toxins, mutations and environmental
stressors may contribute to or threaten the expression of developmental design. This
is an adaptive problem, and natural selection should thus favour genotypes capable of
buffering an organism’s developmental programme from such perturbations. Indeed,
increased developmental stability buffers development, allowing an organism to
express its genotype precisely, even in the face of adverse environmental conditions
(Yeo et al., 1999).
It is hypothesised that DI is related to homozygosity at the single-loci level
CHILDHOOD DEVELOPMENT FACTORS AND RISK OF PSYCHOTIC EXPERIENCES 12
and the overall genomic level (Markow, 1992). In more heterozygous individuals,
more than one form of a gene is present at any given locus, each with potentially
different suitability for various environmental stressors; heterozygosity thereby
increases fitness by increasing an individual’s probability of being metabolically
efficient in various environments (Markow, 1992; Yeo et al., 1999).
If schizophrenia is conceptualised as a polygenic condition, individuals with
the disorder would have sufficient numbers of relevant genes (acting additively)
contributing to disorder expression. Psychotic symptoms can therefore be viewed as
indicative of underlying polygenic homozygosity, which may result in schizophrenia
(Markow, 1992). From a DI perspective, this homozygosity should also be reflected
in increased DI in individuals with schizophrenia.
While the concept of DI has been applied to schizophrenia, it is not unique to
the disorder. Studies have shown higher rates of DI for a wide range of
neurodevelopmental disorders, including attention-deficit disorder (ADD), autism,
cerebral palsy and mental retardation (Yeo et al., 1999). Schizophrenia can be
conceptualised as resulting from two distinct genetic factors: those unique to
schizophrenia and those related to DI and shared across other neurodevelopmental
disorders (Yeo et al., 1999). Regarding DI’s non-specific role as a factor in
schizophrenia, though it is not unique to the condition, the model suggests that DI
will nonetheless be seen in higher rates within clinical cases as compared to within
the normal population.
Measuring DI has typically relied on identifying fluctuating asymmetry (FA),
MPAs, directional asymmetries (DAs) and mixed handedness as reflections of the
organism’s overall DI (Cannon et al., 1995; Golembo-Smith et al., 2012; Gourion et
al., 2004; Green, Satz, Gaier, Ganzell & Kharabi, 1989; Markow, 1992; Markow &
CHILDHOOD DEVELOPMENT FACTORS AND RISK OF PSYCHOTIC EXPERIENCES 13
Wandler, 1986; Murphy & Owen, 1996; Rosa et al., 2000; Schiffman et al., 2005;
Weinberg, Jenkins, Marazita & Maher, 2007). FA studies have demonstrated higher
rates of FA in individuals with schizophrenia (Markow & Wandler, 1986). MPAs
studies, which typically involve ratings made using variations of the Waldrop (1975)
scale, have shown elevated MPA rates in individuals with schizophrenia (Gourion et
al., 2004; Green et al., 1989; McGrath et al., 1995; Murphy & Owen, 1996;
Schiffman et al., 2002). Although the literature supports this increased rate of MPAs
in schizophrenia, the data’s validity is somewhat limited by the assessment method.
The Waldrop (1975) is the most popular scale used in MPAs research.
Though relatively quick and easy to perform, its drawbacks are that it requires
qualitative judgments and lacks both normative data (particularly for different ethnic
groups) and test– retest reliability, including poor internal consistency (Sivkov &
Akabaliev, 2003, 2004). In addition, because it can be scored in a variety of ways,
the presence or absence of group differences might depend on the scoring criteria
used.
Further, some evidence supports atypical handedness patterns in individuals
with schizophrenia as compared to normal controls (Deep-Soboslay et al., 2010;
Dragovic & Hammond, 2005; Erlenmeyer-Kimling et al., 2005; Preti, Sardu & Piga,
2007). Deep- Soboslay et al. (2010) examined atypical handedness in a clinical
sample of 375 individuals with a Diagnostic and Statistical Manual of Mental
Disorders, Volume 4 (DSM-IV) diagnosis of schizophrenia or schizoaffective
disorder (77.6% male; 82.7% Caucasian), 502 unaffected siblings (40.6% male,
87.5% Caucasian) and 568 unrelated healthy controls (46.0% male; 81.3%
Caucasian). The participants were aged between 17 and 64 years. Handedness was
measured by the Edinburgh Handedness Inventory. It was found that left or mixed
CHILDHOOD DEVELOPMENT FACTORS AND RISK OF PSYCHOTIC EXPERIENCES 14
handedness was not related to any diagnostic group (all p values > 0.15).
However, in Dragovic and Hammond’s (2005) meta-analytic review of 42
studies published over the period of 1972 to 2004 with 3175 clinical cases of
schizophrenia and 65 284 NCs, they found that individuals with schizophrenia were
more likely to be left-handed (estimate of pooled OR = 1.81, 95% CI = 1.61—2.1) or
show mixed handedness (OR = 1.77, 95% CI = 1.3—2.4). Overall, these findings
indicate that atypical handedness subtypes are more prevalent in individuals with
schizophrenia. This may imply that disruption in the processes of cerebral
lateralisation is responsible for an atypical shift in hand dominance (Dragovic &
Hammond, 2005).
The theoretical implication of the DI model is that it provides a framework in
which to conceptualise multiple factors in a neurodevelopmental theory of
schizophrenia. The presence of DI markers may indicate a history of developmental
insults, such as perinatal complications, but also of heightened susceptibility to the
effects of those events. Neurodevelopmental theories of schizophrenia offer an
understanding of the ways in which the DI literature contributes to knowledge of the
development of psychotic experiences.
1.5 Psychotic Experiences in Early Adolescence
Psychotic experiences (PEs) or psychotic-like symptoms such as
hallucinations, delusions and thought broadcasting are reported by approximately 5–
10% of the general population (Horwood et al., 2008) (the term ‘PEs’ is used
throughout this thesis). However, estimates differ substantially, in part due to varying
assessment methodologies, number of items and PEs definitions (Laurens et al.,
2007). Nonetheless, PEs distribution in the general population provides some
evidence for the continuum hypothesis of psychotic symptoms. The continuum
CHILDHOOD DEVELOPMENT FACTORS AND RISK OF PSYCHOTIC EXPERIENCES 15
hypothesis proposes that, while psychotic symptoms are present in individuals
diagnosed as ‘cases,’ they are also present in a proportion of individuals from the
general population that do not fulfil the clinical criteria of ‘case of psychosis’
(Verdoux & van Os, 2002, p. 60).
The accumulated evidence for the existence of psychotic experiences in the
general population supports the continuum hypothesis of psychotic symptoms. In the
Netherlands Mental Health Survey and Incidence Study (NEMESIS), psychotic
symptoms were assessed by the Composite International Diagnostic Interview
(CIDI). The random sample included 7076 men and women, aged between 18–64
years. Of the 1237 individuals who reported any non-clinical psychotic symptoms
(17.5%), 26 (2.1%) received a Diagnostic and Statistical Manual of Mental
Disorders, Volume 3, revised edition (DSM-III-R) diagnosis of non-affective
psychosis (van Os, Hanssen, Bijl & Ravelli, 2000).
Further, a cross-national study, from nationally representative samples of 52
countries worldwide participating in the World Health Organization’s (WHO) World
Health Survey, examined the prevalence of psychotic symptoms using CIDI version
3.0. There were 256 445 participants (55.9% women, with a mean age of 45;
standard deviation [SD] = 11.9). The overall prevalence was 7.08% for delusional
mood, 8.37% for delusions of reference and persecution, 4.80% for delusions of
control and 5.81% for hallucinations (Nuevo et al., 2012).
These findings implied that irrespective of clinical diagnosis, psychotic
symptoms signal a problem of potential public health concern (Nuevo et al., 2012).
There is a continuous relationship between psychotic symptoms and poorer health
status, with a regular linear decrement in health depending on the number of
symptoms. Further, the authors concluded that, although the inclusion of a psychosis
CHILDHOOD DEVELOPMENT FACTORS AND RISK OF PSYCHOTIC EXPERIENCES 16
risk syndrome in Diagnostic and Statistical Manual of Mental Disorders, Volume 5
(DSM-V) is important in early detection, issues such as stigmatisation and the
potential negative effects of treatment in individuals with minor presentations of
symptoms continue to be major limitations and ethical challenges. Nevertheless, the
widespread nature of psychotic symptoms signals the need for a more detailed
evaluation of this phenomenon (Nuevo et al., 2012).
In addition, researchers have reported that psychotic symptoms are relatively
common in children and adolescents (Laurens et al., 2007; Schreier et al., 2009). The
Environmental Risk Longitudinal Twin Study examined self-reported psychotic
symptoms in 2,232 12-year-old children. Auditory and visual hallucinations were the
most commonly reported symptoms, coded as probable or definitely present, while
mind reading was the least common. Psychotic symptoms were reported by 416
children (19.6%); 291 (13.7%) reported only probable symptoms and 125 (5.9%)
reported at least one definite symptom (Polanczyk et al., 2010).
In the Avon Longitudinal Study of Parents and Children (ALSPAC) birth
cohort (which is the data used for the present thesis), 13.7% of children at mean age
12.9 (95% CI = 12.5–13.3 years) reported at least one PEs symptom (Horwood et al.,
2008). Although most children experiencing PEs might not require clinical
interventions, their symptoms closely resemble those of schizophrenia. The
frequency and distribution of hallucinations and delusions in the adult population
suggests that these could be dimensional phenomena on a continuum basis with
normal experiences (Johns & Van Os, 2001).
Dhossche et al. (2002) examined the diagnostic outcome of self-reported
hallucinations in a sample of 914 adolescents (430 males, with a mean age of 14.1,
SD = 2.1 and age range of 11–18 years) participating in an ongoing longitudinal
CHILDHOOD DEVELOPMENT FACTORS AND RISK OF PSYCHOTIC EXPERIENCES 17
study from the Dutch province of Zuid-Holland. Initially, in 1989, the Youth Self-
Report (YSR) questionnaire was used to ascertain experiences of hallucinations in
adolescents. When followed up eight years later in 1997, the self-reported
hallucinations and other problems were compared with Axis 1 Diagnostic and
Statistical Manual of Mental Disorders, Volume 4 (DSM-IV) diagnoses (using the
CIDI computerised 12-month version) in 783 (86%) of the 914 study participants.
Hallucinations were reported by 56 (6%) of 913 adolescents. Forty-three
(5%) of 909 adolescents self-reported auditory hallucinations and 19 (2%) of 911
self-reported visual hallucinations. However, while self-reported hallucinations were
strongly associated with Axis 1 DSM-IV diagnoses such as depressive and substance
use disorders (adjusted OR = 2.8, 95% CI = 1.4–5.9, p = < .001), there was no
association with psychotic disorders (Dhossche et al., 2002).
The Zurich Study—a longitudinal community study, beginning in 1979 with
a sample of 591 participants aged 20–21 years—was the first to assess PEs in the
general population with regular assessments over a period of 20 years (Rössler et al.,
2007). PEs were assessed with a semi-structured interview (Structured
Psychopathological Interview and Rating of the Social Consequences of
Psychological Disturbances for Epidemiology [SPIKE]) and the Symptom Checklist
90-R ([SCL90-R] (paranoid ideation and psychoticism dimensions) at age 23, 28, 30,
35 and 41 years. A considerable proportion of the population at age 20–21 reported
that ‘someone else can control your thoughts’ (38.3%). However, this proportion had
more than halved at age 40–41 (15.2%). Further, this study found that 18.5% of the
population at age 20–21, endorsed the item ‘others being aware of your thoughts’
and 22.6% reported ‘having thoughts that are not your own’ (22.6%). However, by
age 40–41, only 4.7% and 7%, respectively, reported those ideas. Similarly, the
CHILDHOOD DEVELOPMENT FACTORS AND RISK OF PSYCHOTIC EXPERIENCES 18
proportion of individuals who reported auditory hallucinations decreased from 3.2%
at age 20–21 to 1% at age 35–36 and 0.1% at age 40–41 (Rössler et al., 2007).
In this study, factor analysis was used to identify SCL90-R symptom
dimensions (Rössler et al., 2007). A two-factor model was identified. The first factor
included paranoid ideation items (e.g., feeling lonely even when with people; never
feeling close to another person) and it was named the ‘schizotypal signs’ symptom
dimension. The second factor mostly included items from the SCL90-R psychoticism
dimension, and it was referred to as the ‘nuclear symptoms of schizophrenias’.
Cluster analyses were then used to identify the longitudinal patterns of these
two factors. The prevalence of ‘continuously high symptom load’ in the general
population was 5.8% for ‘schizophrenia nuclear symptoms’ and 2.8% for
‘schizotypal signs’. While the ‘schizophrenia nuclear symptoms’ were specifically
associated with high cannabis use (OR = 4.3, 95% CI = 1.3–15.3), the ‘schizotypal
signs’ were associated with deficiencies in social achievement and functioning and
lower levels of family resilience. These included life events such as conflicts at the
place of work (OR = 2.5, 95% CI = 1.9–3.6); left by partner (OR = 2.5, 95% CI =
1.2–5.2); increasing problems with partner (OR = 2.6, 95% CI = 1.8–3.9); and minor
problems with police (OR = 2.5, 95% CI = 1.1–5.5). Although the design of this
study allowed for a detailed analysis of predictors of psychotic experiences, a major
limitation is that it did not investigate the transition of individuals with PEs to
manifest psychotic disorders (Rössler et al., 2007).
However, there is some evidence for the continuity of PEs from early
adolescence to schizophrenia related disorders in adulthood. For example, Poulton et
al. (2000) using data from the Dunedin Multidisciplinary Health and Development
Study (n = 761) found that self-reported PEs at age 11 years (Diagnostic Interview
CHILDHOOD DEVELOPMENT FACTORS AND RISK OF PSYCHOTIC EXPERIENCES 19
Schedule for Children (DISC-C) for DSM-III) predicted schizophreniform diagnosis
(Diagnostic Interview Schedule for DSM-IV) at age 26 years with an odds ratio of
16.4 (95% CI = 3.9 – 67.8) for strong symptoms (n = 12) and 5.1 (95% CI = 1.7-
18.3) for weak symptoms (n = 95) of PEs.
In addition, Welham et al. (2010) reported that auditory hallucination at age
14 years (Youth Self-Report) predicted psychotic disorders at age 21 years with an
odds ratio of 5.09 (95% CI = 2.18–11.84) for males (n =1701, cases n = 26), and 2.27
(95% CI = 1.01–5.12) for females (n = 1872, cases n = 30).
Further, a recent report using data from the Dunedin Multidisciplinary Health
and Development Study provided further evidence regarding the predictive value of
childhood psychotic symptoms and schizophrenia by age 38 years (Fisher et al.,
2013). Relative to children without psychotic symptoms (n = 776), children
presenting with strong psychotic symptoms (n = 13) at age 11 were found to have
elevated risk of developing schizophrenia by age 38 (Relative Risk [RR] 7.24, 95%
CI = 2.17–24.13). While, this association was slightly attenuated after adjustment for
childhood psychopathology, it remained significant (RR 4.86, 95% CI = 1.37–17.27)
(Fisher et al., 2013).
Overall, these findings indicate that individuals from the general population
endorsed statements referring to symptoms that resemble the core symptoms of
psychotic disorders such as ‘others being aware of your thoughts,’ ‘having thoughts
that are not your own’ or ‘someone else can control your thoughts’ (Rössler et al.,
2007). The accumulated evidence for the existence of psychotic experiences in the
general population supports the proposition of the continuity of psychotic symptoms
with normal experiences (Rössler et al., 2007).
It has been argued that dichotomous categorisation of psychotic conditions
CHILDHOOD DEVELOPMENT FACTORS AND RISK OF PSYCHOTIC EXPERIENCES 20
such as schizophrenia (e.g., present v. absent) is compatible with the single-gene
hypothesis, where one gene is held to be responsible for the occurrence of
schizophrenia (Rössler et al., 2007). However, a multifactorial (including polygenic
threshold model) aetiology is consistent with the proposition that psychotic
symptoms occur with an approximately normal distribution in the general population
(Johns and van Os, 2001). This dimensional model of psychotic symptoms is not
concerned with classifying individuals or disorders, but with identifying and
measuring individual differences in psychological phenomenon such as psychotic
experiences. Gilman (1988) argues that the coiner of the term ‘schizophrenia,’ Eugen
Bleuler, noted the occurrence of schizophrenic symptoms among ‘normal’
individuals from the general population. Further, research evidence suggests that
irrespective of family history of psychiatric conditions, individuals from the general
population may have ‘high risk mental states,’ for which initiation of early treatment
is postulated to improve outcome (Owens and Johnstone, 2006, p. 1501).
The presence of PEs in a proportion of individuals from the general
population has several implications. First, similar aetiological mechanisms may
underlie PEs and psychotic conditions such as schizophrenia. Secondly, if PEs
represent an early vulnerability to adult schizophrenia, they will share similar
endophenotypes and risk factors leading to the onset of schizophrenia. Thirdly, the
identification of factors associated with PEs occurring at key points in child
development may add substantially to efforts towards early detection strategies and
preventative intervention. This thesis aims to contribute significantly to
understanding PEs and examining their relation to known childhood
neurodevelopmental indicators of schizophrenia.
CHILDHOOD DEVELOPMENT FACTORS AND RISK OF PSYCHOTIC EXPERIENCES 21
1.6 Endophenotypes in Psychiatric Research
It has been suggested that measurements of endophenotypes are less
complicated than the genetic basis of psychiatric disorders (Flint & Munafò, 2007).
Therefore, if PEs in early adolescence represent vulnerability to schizophrenia, PEs
and schizophrenia might share similar endophenotypes and childhood developmental
risk factors.
Endophenotypes are defined as ‘measurable components unseen by the
unaided eye along the pathway between disease and distal genotype’ (Gottesman &
Gould, 2003, p. 636). The phenotypic and genotypic heterogeneities found in
schizophrenia research have led current researchers to focus on phenotypic
characteristics that may be closer to the genetic determinants (intermediate
endophenotypes) of complex conditions such as schizophrenia. This shift in research
paradigm supports a dimensional concept of psychopathology rather than diagnostic
categories (Miller & Rockstroh, 2013). Miller and Rockstroh (2013) mention that
this shift ‘integrates psychological and biological phenomenon and cuts across
traditional diagnostic categories’ (p. 16).
Endophenotype analysis methods include biological (e.g.,
neurophysiological, biochemical, endocrinological and neuroanatomical) and
psychological (e.g., cognitive and neuropsychological) measures (Gottesman &
Gould, 2003). Flint and Munafò (2007) provided a comprehensive list of
endophenotype measures in psychiatric diseases (e.g., attention-deficit hyperactivity
disorder [ADHD], alcoholism, anxiety, bipolar disorder, depression and
schizophrenia), and proposed that endophenotype measures can be categorised into
six groups: anatomical, developmental, electrophysiological, metabolic, sensory and
psychological/cognitive. The psychological/cognitive deficits included constructs
CHILDHOOD DEVELOPMENT FACTORS AND RISK OF PSYCHOTIC EXPERIENCES 22
such as attention, working, spatial and verbal memory, affect recognition, personality
and executive performance (Flint & Munafò, 2007).
This thesis argues that if PEs in early adolescence represent a risk factor and
vulnerability to adult onset schizophrenia, then PEs and schizophrenia may share
similar endophenotypes and risk factors. This thesis aims to contribute to
understanding the developmental pathways leading to PEs. It is argued that
identification of childhood developmental factors associated with PEs will add
substantially to research efforts towards early detection of individuals with ‘high risk
mental states’ of developing psychotic symptoms. Consequently, this would lead to
evaluation of the benefits of early preventative interventions for children with
elevated risk of developing psychotic symptoms.
1.7 Thesis Scope, Contributions, Aims and Overview
There is an emerging literature investigating the association of childhood
developmental factors and risk of PEs in early adolescence. Indeed, there is some
evidence for the neurodevelopmental hypothesis of schizophrenia, where PEs in
childhood and early adolescence may reflect underlying neurodevelopmental
problems that ultimately result in schizophrenia developing in adulthood
(Weinberger, 1986).
This thesis argues that if childhood motor, psychological, social and cognitive
impairments associated with adult onset schizophrenia represent an early sign of
neurodevelopmental damage, these developmental domains of functioning may also
be associated with risk of PEs. However, support for this proposition will depend on
two major themes of investigation. First, an in-depth evaluation of the current
literature is required to identify the childhood neurodevelopmental indicators of
schizophrenia. Secondly, guided by findings from these literature reviews, childhood
CHILDHOOD DEVELOPMENT FACTORS AND RISK OF PSYCHOTIC EXPERIENCES 23
developmental domains with high predictive value for schizophrenia will be selected
and examined in association to risk of reporting PEs in early adolescence.
Recent research evidence indicates that PEs are relatively common in early
adolescence. However, while they are (a) non-pathological, (b) do not represent a
clinical diagnosis, and (c) do not require pharmacological treatments, this thesis
argues that if PEs represent early vulnerability to adult onset schizophrenia, they will
share similar endophenotypes and developmental risk factors with the disease.
This thesis contributes to an understanding of PEs and their relation to known
premorbid childhood neurodevelopmental indicators of schizophrenia. Further,
guided by the neuropsychological benefits of social cognitive enhancement
programmes, this thesis argues that development of early detection measures will add
substantially to efforts towards preventative interventions for children at elevated risk
of developing psychotic symptoms, and arguably schizophrenia.
This thesis aims to achieve several objectives. First, it will review
longitudinal high- risk and birth cohort studies to identify the childhood
neurodevelopmental domains of functioning associated with adult onset
schizophrenia. Secondly, it will review what is known about the genetic aspects of
schizophrenia. Thirdly, it will evaluate the current findings of all ALSPAC studies
that have used PEs as their main outcome variable to identify gaps in the literature
and guide the selection and examination of childhood developmental domains and
genetic markers (for schizophrenia) in relation to risk of PEs in early adolescence.
Following this, attention shifts to a discussion of the neuropsychological benefits of
computer-aided social cognitive enhancement programmes and the feasibility of
early intervention for children at risk of developing psychotic symptoms.
The remainder of this thesis is organised as follows. Chapters 2 and 3 use
CHILDHOOD DEVELOPMENT FACTORS AND RISK OF PSYCHOTIC EXPERIENCES 24
systematic methodology to review and identify the childhood neurodevelopmental
indicators of adult onset schizophrenia. Chapter 4 selectively reviews the genetic
aspects of schizophrenia. Next, before presenting the results of the six empirical
studies, Chapter 5 introduces and reviews all ALSPAC published studies that have
used PEs as the main outcome variable. Together, these review chapters are intended
to identify the gaps in the literature, which are then addressed in the subsequent
empirical studies. Chapter 6 presents the research methods of the proceeding
empirical studies. The results from five ALSPAC studies related to the examination
of childhood developmental domains of functioning, genetic markers and risk of PEs
are presented in Chapters 7–11. Chapter 12 focuses on the neuropsychological
benefits of computer-aided social cognitive enhancement programmes for typically
developing children. Chapter 13 provides an in-depth discussion of each study’s
results, focusing on the findings and their implications and applications with
reference to translational research. The thesis concludes by briefly reiterating the
empirical studies’ main findings and the thesis’ original contribution to knowledge. It
also proposes further areas for research.
CHILDHOOD DEVELOPMENT FACTORS AND RISK OF PSYCHOTIC EXPERIENCES 25
Chapter 2: Childhood Neurodevelopmental Indicators of
Schizophrenia: A Review of Longitudinal High-Risk Studies
2.1 Introduction
One of the research methods used to investigate the developmental processes
leading to schizophrenia has been the longitudinal study of children of parents
presenting with schizophrenia. These children are considered at high-risk (HR) of
developing schizophrenia due to an inherited biological predisposition towards the
condition (Mulle, 2012). Based on well-established evidence that schizophrenia is a
highly heritable condition, HR status is traditionally defined as children who have a
first-degree relative who meets diagnostic criteria for schizophrenia (Owens &
Johnstone, 2006).
Longitudinal HR studies have the advantage of prospectively examining the
development of children of parents presenting with schizophrenia. These studies
examine predictive value of various childhood developmental domains in relation to
schizophrenia with the aim of elucidating the developmental pathway towards
schizophrenia. Longer- term objectives of such studies are to aide in the early
detection and selective prevention interventions for children at risk of developing
schizophrenia.
The aim of this article is to use a systematic methodology to review
prospective High-Risk longitudinal studies.4 This is done by literature review,5 to
4 Main findings of this review were orally presented at the 27th International Congress of Applied
Psychology, 11–16 July 2010, Melbourne Australia.
CHILDHOOD DEVELOPMENT FACTORS AND RISK OF PSYCHOTIC EXPERIENCES 26
identify the childhood factors associated with the development of schizophrenia in
adulthood. This review identified 18 peer-reviewed studies of children of parents
presenting with schizophrenia which met inclusion criteria.
The studies suggest that childhood developmental indicators of schizophrenia
can be best characterised in terms of obstetric, neurological, neuromotor, cognitive
and social behaviour. In addition, these childhood predictors are presented according
to developmental stages and relative to their effect sizes (Cohen’s d). Alternative
explanations, strengths, limitations, and measurement issues of the studies are
discussed.
In conclusion, this review will argue that accurate identification of predictive
risk factors for schizophrenia would provide insights regarding the developmental
pathways of schizophrenia, upon which researchers could base investigations of the
association of childhood factors and risk of PEs in early adolescence. It is argued that
if PEs reflect an early vulnerability to adult onset schizophrenia, they will share
similar endophenotypes and developmental risk factors with schizophrenia. Further,
identification of neurodevelopmental indicators of schizophrenia and PEs can be
used as a guide in developing early preventative interventions for children at risk of
developing psychotic symptoms, and arguably schizophrenia.
2.1.1 Previous reviews.
Erlenmeyer-Kimling and Cornblatt (1987a) published a narrative summary of
schizophrenia HR research up to the date of publication and focused on background
and demographic differences in HR participants and identifying biological markers
5 Hameed, M. A., & Lewis, A. (2013). The childhood neurodevelopmental indicators of
schizophrenia: A review of longitudinal High-Risk studies. Manuscript submitted to The Australian
and New Zealand Journal of Psychiatry.
CHILDHOOD DEVELOPMENT FACTORS AND RISK OF PSYCHOTIC EXPERIENCES 27
associated with the development of schizophrenia. This review defined background
factors as pregnancy and birth histories, life events, family relations and
communications, and social functioning of HR individuals in childhood and
adolescence. Based on the reviewed papers, the authors concluded that these
background factors were not generalisable to individuals who develop schizophrenia,
and that no consistent research findings had demonstrated the specificity of these risk
factors to the development of schizophrenia. However, this review did find that
among the biological markers (endophenotypes, which reflect a genetic liability to
schizophrenia), smooth pursuit eye movement dysfunction (eye-tracking accuracy)
and impaired performance on measures of sustained attention were consistent
findings in longitudinal HR studies. While this was a detailed narrative review, it was
limited to the available findings emerging from HR longitudinal studies prior to
1987.
Asarnow (1988) conducted a more comprehensive narrative review
summarising major findings from prospective studies examining childhood indicators
of schizophrenia. The researchers argued that the majority of individual with
schizophrenia (85–90%) do not have parents presenting with schizophrenia, and
hence ‘findings from genetic-risk samples may not generalize to the larger number of
preschizophrenic individuals who do not have schizophrenic parents’ (1988, p. 614).
Therefore, this review combined the findings from research on children of parents
presenting with schizophrenia (HR), and children with ‘behavioural risk’. The latter
studies, included individuals referred to outpatient clinics for behavioural
disturbances, communication deficits and scoring above 2 standard deviation of the
mean on perceptual-aberration/magical-ideation, physical anhedonia or impulsive
non-conformity scales (Asarnow, 1988). Based on 24 HR and ‘behavioural risk’
CHILDHOOD DEVELOPMENT FACTORS AND RISK OF PSYCHOTIC EXPERIENCES 28
studies, the authors concluded that early signs of neurointegrative problems, social
deficits and early symptomatology might distinguish some HR children. Secondly,
attention and information processing, motor and social impairments appear to be
specific risk factors for schizophrenia. Thirdly, family environment (e.g., family
communication deficits, negative affective style, high expressed emotion and general
disturbance in family relations) was strongly associated with increased risk for
developing schizophrenia.
Olin and Mednick (1996) provided a selective review of childhood
developmental factors and risk of developing schizophrenia. This review focused
particularly on school and teachers’ reports. This review found that teachers rated
both males and females who later developed schizophrenia as labile in mood and
more susceptible to future emotional or psychological breakdown. In this review,
males were rated as disruptive, anxious, lonely and rejected by peers, as having
higher rates of disciplinary problems and as being more likely to have repeated a
grade; females were rated as nervous and socially withdrawn.
By comparison, Niemi et al.’s (2003) review provided an updated overview
of the factors predicting schizophrenia among HR children. Reviewing 16 HR
studies, this review found that problems in motor and neurological development,
deficits in attention and verbal short-term memory, poor social competence, positive
formal thought-disorder- like symptoms, higher scores on psychosis-related scales in
the MMPI, and severe instability of early rearing environment were associated with
increased risk of schizophrenia.
Owens and Johnstone’s (2006) review broadened the traditional definition of
HR (offspring of parents presenting with schizophrenia) to include individuals
having ‘“high risk mental states” regardless of family history, in whom initiation of
CHILDHOOD DEVELOPMENT FACTORS AND RISK OF PSYCHOTIC EXPERIENCES 29
early treatment is postulated to improve outcome’ (2006, p. 1501). This review
presented an elaborated account of 16 HR studies and suggested that there is the
continuity of psychotic phenomena as a continuous distribution across the population
rather than, a dichotomous clinical diagnosis, (2006).
The present review focused on identifying the neurodevelopmental factors
that significantly distinguish HR children from NCs. This approach allows the
ranking of these factors from high to low, relative to their effect size. In this review,
HR status was defined as having a parent diagnosed with schizophrenia. However,
consistent with Owens and Johnstone’s (2006) inclusion of individuals with ‘high
risk mental states’, this thesis argues that if PEs in early adolescence represents a
vulnerability to adult onset schizophrenia, these PEs would share the childhood
neurodevelopmental indicators of schizophrenia.
In this review, the researcher transformed the derived statistics to a common
standard difference and presented results in Cohen’s d. This allowed for comparison
of various measurements specific to a particular domain of investigation from a child
development perspective. This meant that various measurement scales that
significantly distinguish between HR and NC children could be evaluated.
This review also differs from previous reviews in terms of its clinical
implications. While the identified neurodevelopmental deficits in childhood are
frequently present in HR children, the question of what can be offered as treatment or
early preventative intervention remains unanswered. This review argues that risk
factors can be subjected to modification using appropriately designed and targeted
preventative intervention (Chapter 12.1 provides further details regarding
intervention strategies).

CHILDHOOD DEVELOPMENT FACTORS AND RISK OF PSYCHOTIC EXPERIENCES 30
2.2 Method
2.2.1 Literature search procedure.
The reviewed articles were identified using the Scopus, Medline, Pubmed,
Ovid, Psychinfo and PsychLit electronic databases. Key search terms used included
‘high risk’, ‘longitudinal studies’, ‘schizophrenia’, ‘developmental precursors of
schizophrenia’, ‘offspring of parents with psychotic disorders’ and ‘schizophrenia’,
to locate published papers up to and including January 2013. This search included
9645 articles, which was then reduced to 2096 articles that were limited to
schizophrenia outcome. These papers were searched, first by reading the title and
subsequently, if necessary the abstract and the paper. This yielded 124 potentially
relevant papers. Bibliographic searches were also conducted using the reference lists
from identified papers. Eighteen studies fulfilled the inclusion criteria. Each study
typically had multiple publications and each publication was included in the review.
2.2.2 Inclusion and exclusion criteria.
For simplicity and specificity, the researchers only included case-control
longitudinal HR studies designed to examine childhood developmental indicators of
schizophrenia. HR was defined as denoting a genetic HR; therefore, only studies that
defined the HR group as the biological children of parents diagnosed with a
psychotic disorder were included. By contrast, control groups constituted children
whose biological parents presented with no past or current psychiatric status. For
inclusion, children of neither group could meet the criteria of clinical diagnosis for a
childhood psychiatric disorder. In addition, only studies with an initial sample age
group of less than 15 years were included. All reviewed studies were written in
English.
CHILDHOOD DEVELOPMENT FACTORS AND RISK OF PSYCHOTIC EXPERIENCES 31
2.3 Results
2.3.1 General overview of high-risk studies.
Table 2.1 presents a general summary of the 18 reviewed studies, along with
their major strengths and limitations. All of the studies presented in this table
investigated factors that significantly discriminated between HR and NC children. In
addition, Table 1 shows the studies’ commencing year, inclusion criteria, entry age,
sample sizes and follow- up ages.
2.3.2 Obstetric and perinatal complications.
Table 2.2 lists a number of studies that found elevated obstetric and prenatal
complications in children born to parents presenting with schizophrenia (see table for
list of studies). These findings are compatible with the neurodevelopmental model of
schizophrenia, which suggests that brain insults at critical stages of development in
the perinatal period may contribute to the development of schizophrenia during late
adolescence or early adulthood (Geddes, 1999).
The Copenhagen HR project found that HR children experienced higher
obstetric complications (Cohen’s d = 0.52) and were more likely to have greater
severity of complications than NCs (Cohen’s d = 0.42) (Mednick, Parnas, &
Schulsinger, 1987). These differences were derived from early midwifes’ reports on
pregnancy and birth complications with examples including pelvic contractions,
abnormal fetal positions, problems with umbilical cords, asphyxia, placenta
abnormalities and prematurity.
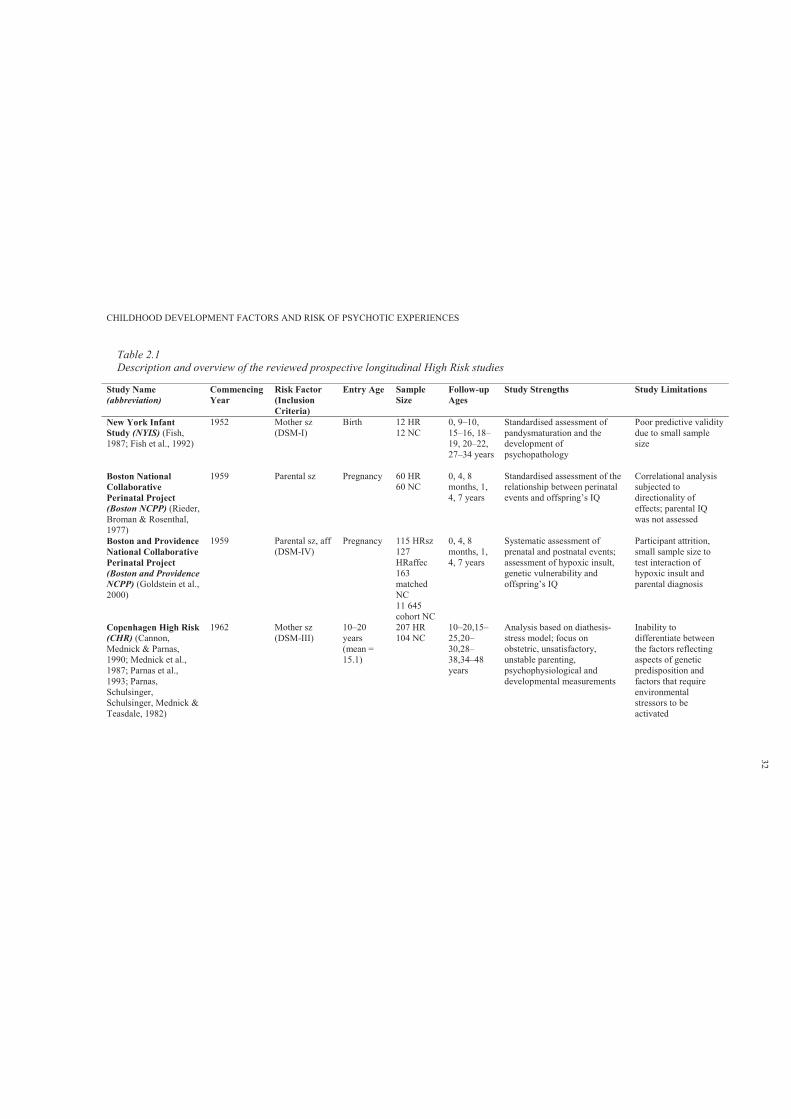
CHILDHOOD DEVELOPMENT FACTORS AND RISK OF PSYCHOTIC EXPERIENCES
Table 2.1Description and overview of the reviewed prospective longitudinal High Risk studies
Study Name (abbreviation)
Commencing Year
Risk Factor (Inclusion Criteria)
Entry Age Sample Size
Follow-upAges
Study Strengths Study Limitations
New York Infant Study (NYIS) (Fish, 1987; Fish et al., 1992)
1952 Mother sz (DSM-I)
Birth 12 HR12 NC
0, 9–10, 15–16, 18–19, 20–22, 27–34 years
Standardised assessment of pandysmaturation and the development of psychopathology
Poor predictive validity due to small sample size
Boston National Collaborative Perinatal Project (Boston NCPP) (Rieder, Broman & Rosenthal, 1977)
1959 Parental sz Pregnancy 60 HR60 NC
0, 4, 8 months, 1, 4, 7 years
Standardised assessment of the relationship between perinatal events and offspring’s IQ
Correlational analysis subjected to directionality of effects; parental IQ was not assessed
Boston and Providence National Collaborative Perinatal Project(Boston and Providence NCPP) (Goldstein et al., 2000)
1959 Parental sz, aff (DSM-IV)
Pregnancy 115 HRsz127HRaffec163matched NC11 645cohort NC
0, 4, 8 months, 1, 4, 7 years
Systematic assessment of prenatal and postnatal events; assessment of hypoxic insult, genetic vulnerability and offspring’s IQ
Participant attrition, small sample size to test interaction of hypoxic insult and parental diagnosis
Copenhagen High Risk (CHR) (Cannon, Mednick & Parnas, 1990; Mednick et al., 1987; Parnas et al., 1993; Parnas, Schulsinger, Schulsinger, Mednick & Teasdale, 1982)
1962 Mother sz (DSM-III)
10–20 years (mean = 15.1)
207 HR104 NC
10–20,15–25,20–30,28–38,34–48 years
Analysis based on diathesis-stress model; focus on obstetric, unsatisfactory, unstable parenting, psychophysiological and developmental measurements
Inability to differentiate between the factors reflecting aspects of geneticpredisposition and factors that require environmental stressors to be activated
32
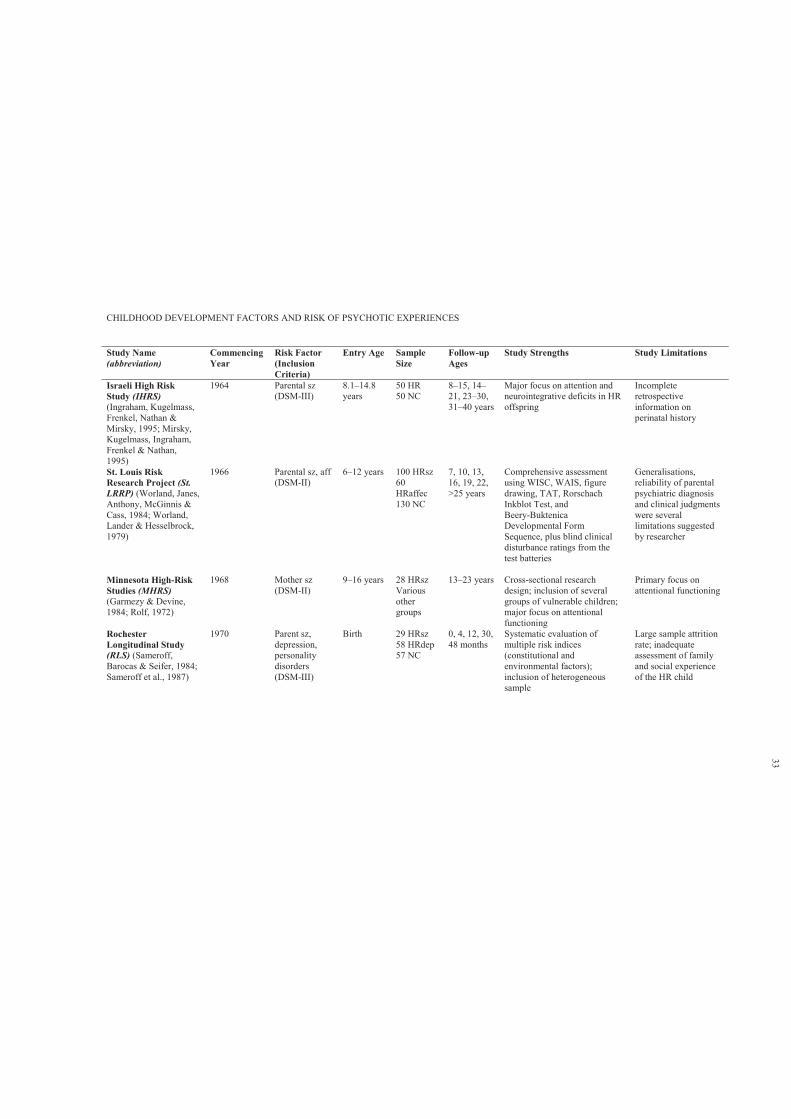
CHILDHOOD DEVELOPMENT FACTORS AND RISK OF PSYCHOTIC EXPERIENCES
Study Name (abbreviation)
Commencing Year
Risk Factor (Inclusion Criteria)
Entry Age Sample Size
Follow-upAges
Study Strengths Study Limitations
Israeli High Risk Study (IHRS)(Ingraham, Kugelmass, Frenkel, Nathan & Mirsky, 1995; Mirsky, Kugelmass, Ingraham, Frenkel & Nathan, 1995)
1964 Parental sz (DSM-III)
8.1–14.8 years
50 HR50 NC
8–15, 14–21, 23–30, 31–40 years
Major focus on attention and neurointegrative deficits in HR offspring
Incomplete retrospective information on perinatal history
St. Louis Risk Research Project (St. LRRP) (Worland, Janes, Anthony, McGinnis & Cass, 1984; Worland, Lander & Hesselbrock, 1979)
1966 Parental sz, aff (DSM-II)
6–12 years 100 HRsz60HRaffec130 NC
7, 10, 13, 16, 19, 22, >25 years
Comprehensive assessment using WISC, WAIS, figure drawing, TAT, Rorschach Inkblot Test, andBeery-Buktenica Developmental Form Sequence, plus blind clinical disturbance ratings from the test batteries
Generalisations, reliability of parental psychiatric diagnosis and clinical judgments were several limitations suggested by researcher
Minnesota High-Risk Studies (MHRS)(Garmezy & Devine, 1984; Rolf, 1972)
1968 Mother sz (DSM-II)
9–16 years 28 HRszVarious other groups
13–23 years Cross-sectional research design; inclusion of several groups of vulnerable children; major focus on attentional functioning
Primary focus on attentional functioning
Rochester Longitudinal Study (RLS) (Sameroff, Barocas & Seifer, 1984;Sameroff et al., 1987)
1970 Parent sz, depression, personality disorders (DSM-III)
Birth 29 HRsz58 HRdep57 NC
0, 4, 12, 30, 48 months
Systematic evaluation of multiple risk indices (constitutional and environmental factors); inclusion of heterogeneous sample
Large sample attrition rate; inadequate assessment of family and social experience of the HR child
33
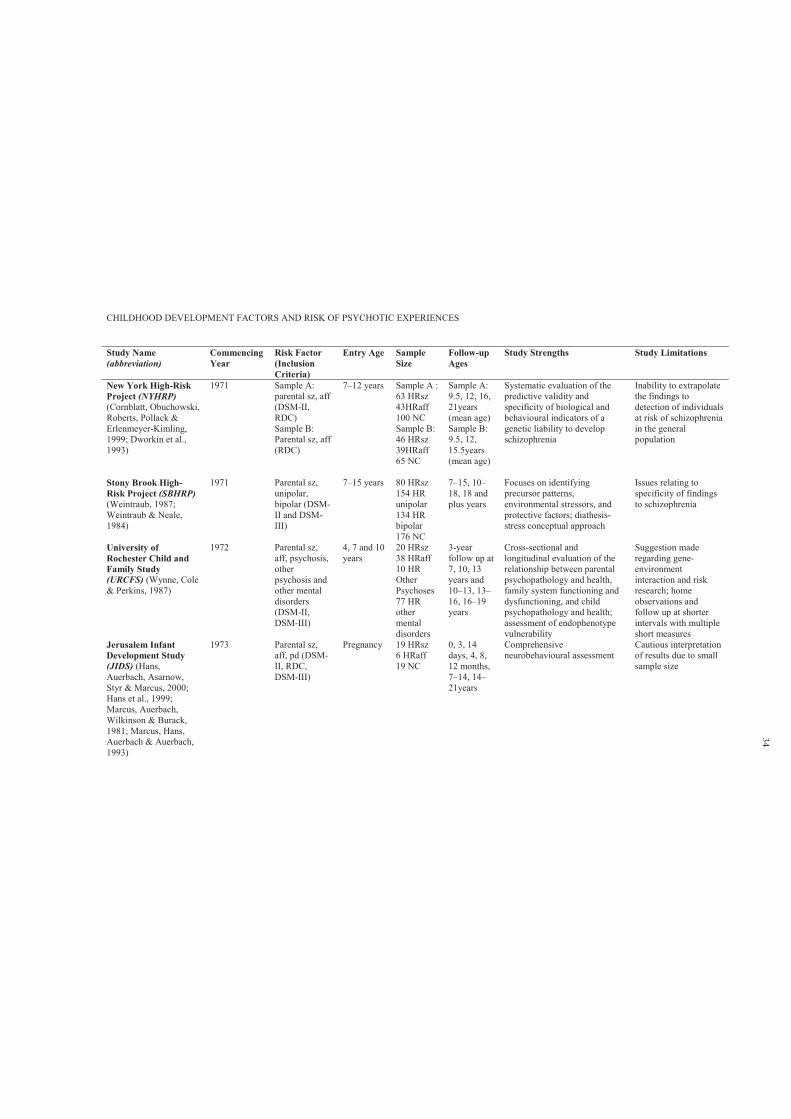
CHILDHOOD DEVELOPMENT FACTORS AND RISK OF PSYCHOTIC EXPERIENCES
Study Name (abbreviation)
Commencing Year
Risk Factor (Inclusion Criteria)
Entry Age Sample Size
Follow-upAges
Study Strengths Study Limitations
New York High-Risk Project (NYHRP)(Cornblatt, Obuchowski, Roberts, Pollack & Erlenmeyer-Kimling, 1999; Dworkin et al., 1993)
1971 Sample A: parental sz, aff (DSM-II, RDC)Sample B:Parental sz, aff (RDC)
7–12 years Sample A : 63 HRsz43HRaff100 NCSample B:46 HRsz39HRaff65 NC
Sample A: 9.5, 12, 16, 21years (mean age)Sample B: 9.5, 12, 15.5years (mean age)
Systematic evaluation of the predictive validity and specificity of biological and behavioural indicators of a genetic liability to develop schizophrenia
Inability to extrapolate the findings to detection of individuals at risk of schizophrenia in the general population
Stony Brook High-Risk Project (SBHRP)(Weintraub, 1987;Weintraub & Neale, 1984)
1971 Parental sz, unipolar, bipolar (DSM-II and DSM-III)
7–15 years 80 HRsz154 HR unipolar134 HR bipolar176 NC
7–15, 10–18, 18 and plus years
Focuses on identifying precursor patterns, environmental stressors, and protective factors; diathesis-stress conceptual approach
Issues relating to specificity of findings to schizophrenia
University of Rochester Child and Family Study (URCFS) (Wynne, Cole & Perkins, 1987)
1972 Parental sz, aff, psychosis, other psychosis and other mental disorders (DSM-II, DSM-III)
4, 7 and 10 years
20 HRsz38 HRaff10 HR Other Psychoses77 HR other mental disorders
3-year follow up at 7, 10, 13 years and10–13, 13–16, 16–19 years
Cross-sectional and longitudinal evaluation of the relationship between parental psychopathology and health, family system functioning and dysfunctioning, and child psychopathology and health; assessment of endophenotype vulnerability
Suggestion made regarding gene-environment interaction and risk research; home observations and follow up at shorter intervals with multiple short measures
Jerusalem Infant Development Study (JIDS) (Hans, Auerbach, Asarnow, Styr & Marcus, 2000;Hans et al., 1999;Marcus, Auerbach, Wilkinson & Burack, 1981; Marcus, Hans, Auerbach & Auerbach, 1993)
1973 Parental sz, aff, pd (DSM-II, RDC, DSM-III)
Pregnancy 19 HRsz6 HRaff19 NC
0, 3, 14 days, 4, 8, 12 months, 7–14, 14–21years
Comprehensive neurobehavioural assessment
Cautious interpretation of results due to small sample size
34
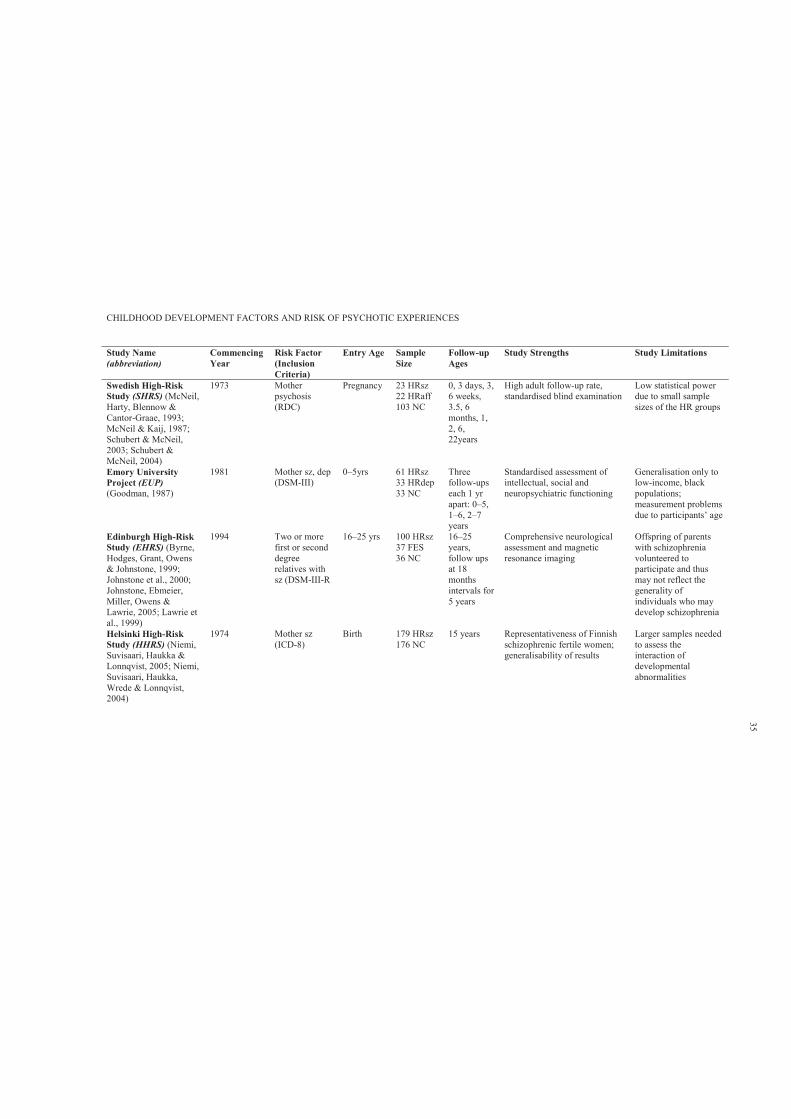
CHILDHOOD DEVELOPMENT FACTORS AND RISK OF PSYCHOTIC EXPERIENCES
Study Name (abbreviation)
Commencing Year
Risk Factor (Inclusion Criteria)
Entry Age Sample Size
Follow-upAges
Study Strengths Study Limitations
Swedish High-Risk Study (SHRS) (McNeil, Harty, Blennow & Cantor-Graae, 1993;McNeil & Kaij, 1987;Schubert & McNeil, 2003; Schubert & McNeil, 2004)
1973 Mother psychosis (RDC)
Pregnancy 23 HRsz22 HRaff103 NC
0, 3 days, 3, 6 weeks, 3.5, 6 months, 1, 2, 6, 22years
High adult follow-up rate, standardised blind examination
Low statistical power due to small sample sizes of the HR groups
Emory University Project (EUP)(Goodman, 1987)
1981 Mother sz, dep (DSM-III)
0–5yrs 61 HRsz33 HRdep33 NC
Three follow-ups each 1 yr apart: 0–5, 1–6, 2–7years
Standardised assessment of intellectual, social and neuropsychiatric functioning
Generalisation only to low-income, black populations; measurement problems due to participants’ age
Edinburgh High-Risk Study (EHRS) (Byrne, Hodges, Grant, Owens & Johnstone, 1999;Johnstone et al., 2000;Johnstone, Ebmeier, Miller, Owens & Lawrie, 2005; Lawrie et al., 1999)
1994 Two or more first or second degree relatives with sz (DSM-III-R
16–25 yrs 100 HRsz37 FES36 NC
16–25 years, follow ups at 18 months intervals for 5 years
Comprehensive neurological assessment and magnetic resonance imaging
Offspring of parents with schizophrenia volunteered to participate and thus may not reflect the generality of individuals who maydevelop schizophrenia
Helsinki High-Risk Study (HHRS) (Niemi, Suvisaari, Haukka & Lonnqvist, 2005; Niemi, Suvisaari, Haukka, Wrede & Lonnqvist, 2004)
1974 Mother sz (ICD-8)
Birth 179 HRsz176 NC
15 years Representativeness of Finnish schizophrenic fertile women; generalisability of results
Larger samples needed to assess the interaction of developmental abnormalities
35
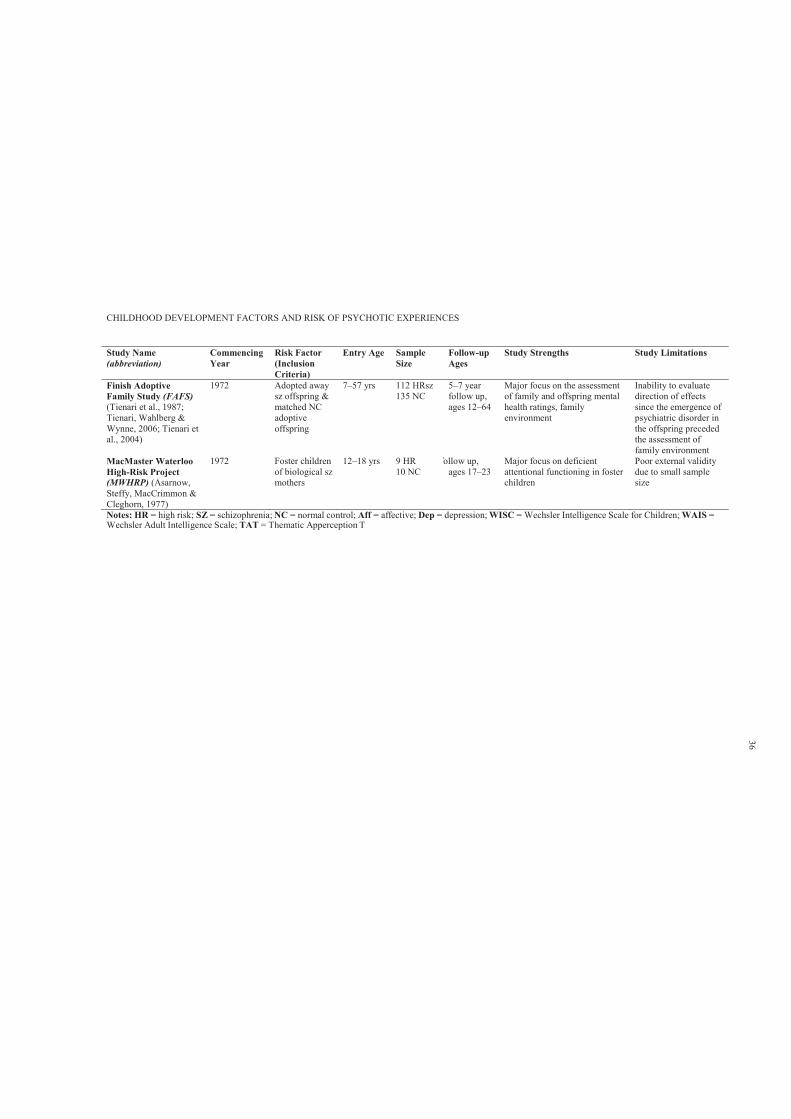
CHILDHOOD DEVELOPMENT FACTORS AND RISK OF PSYCHOTIC EXPERIENCES
Study Name (abbreviation)
Commencing Year
Risk Factor (Inclusion Criteria)
Entry Age Sample Size
Follow-upAges
Study Strengths Study Limitations
Finish Adoptive Family Study (FAFS)(Tienari et al., 1987;Tienari, Wahlberg & Wynne, 2006; Tienari et al., 2004)
1972 Adopted away sz offspring & matched NC adoptive offspring
7–57 yrs 112 HRsz135 NC
5–7 year follow up, ages 12–64
Major focus on the assessment of family and offspring mental health ratings, family environment
Inability to evaluate direction of effects since the emergence of psychiatric disorder in the offspring preceded the assessment of family environment
MacMaster Waterloo High-Risk Project (MWHRP) (Asarnow, Steffy, MacCrimmon & Cleghorn, 1977)
1972 Foster children of biological sz mothers
12–18 yrs 9 HR10 NC
follow up, ages 17–23
Major focus on deficient attentional functioning in foster children
Poor external validity due to small sample size
Notes: HR = high risk; SZ = schizophrenia; NC = normal control; Aff = affective; Dep = depression; WISC = Wechsler Intelligence Scale for Children; WAIS =Wechsler Adult Intelligence Scale; TAT = Thematic Apperception T
36
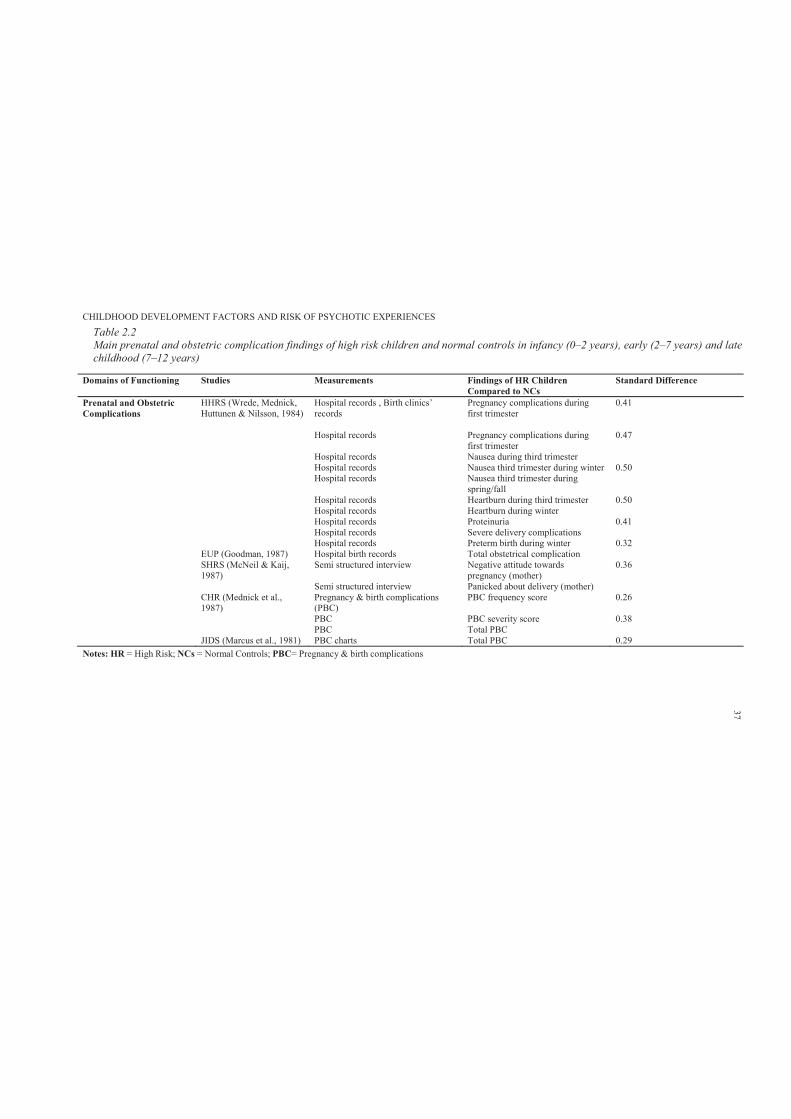
CHILDHOOD DEVELOPMENT FACTORS AND RISK OF PSYCHOTIC EXPERIENCES
Table 2.2Main prenatal and obstetric complication findings of high risk children and normal controls in infancy (0–2 years), early (2–7 years) and late childhood (7–12 years)
Domains of Functioning Studies Measurements Findings of HR Children Compared to NCs
Standard Difference
Prenatal and Obstetric Complications
HHRS (Wrede, Mednick, Huttunen & Nilsson, 1984)
Hospital records , Birth clinics’ records
Pregnancy complications during first trimester
0.41
Hospital records Pregnancy complications during first trimester
0.47
Hospital records Nausea during third trimesterHospital records Nausea third trimester during winter 0.50Hospital records Nausea third trimester during
spring/fallHospital records Heartburn during third trimester 0.50Hospital records Heartburn during winterHospital records Proteinuria 0.41Hospital records Severe delivery complicationsHospital records Preterm birth during winter 0.32
EUP (Goodman, 1987) Hospital birth records Total obstetrical complicationSHRS (McNeil & Kaij, 1987)
Semi structured interview Negative attitude towards pregnancy (mother)
0.36
Semi structured interview Panicked about delivery (mother)CHR (Mednick et al., 1987)
Pregnancy & birth complications (PBC)
PBC frequency score 0.26
PBC PBC severity score 0.38PBC Total PBC
JIDS (Marcus et al., 1981) PBC charts Total PBC 0.29Notes: HR = High Risk; NCs = Normal Controls; PBC= Pregnancy & birth complications
37
CHILDHOOD DEVELOPMENT FACTORS AND RISK OF PSYCHOTIC EXPERIENCES 38
The Helsinki HR study assessed the seasonality of birth in HR and NCs. The results
indicated that mothers with schizophrenia experienced higher rates of nausea, heartburn and
preterm birth during winter (Cohen’s d = 0.50, 0.36 and 0.29, respectively). Further, data derived
from hospital records indicated a higher incidence of pregnancy complications during the third
rather than first trimester (Cohen’s d = 0.47, 0.41 respectively).
There are a variety of possible explanations for such findings. Birth complications may
represent obstetric complications occurring at the time of birth or that may be an index of earlier
problems in fetal development. In addition, poor obstetric outcomes might reflect a lower level of
antenatal care for mothers experiencing schizophrenia. The Emory University Project (Goodman,
1987) found that mothers presenting with schizophrenia began prenatal care significantly later
(mean [M] = end of month 4) than women presenting with depression (M = beginning month 3) or
women with no diagnosable mental health condition (M = end of month 2), p < .01. Mothers
presenting with severe psychological disturbances (measured by the Global Assessment Scale)
were more likely to have babies born earlier (r = .16, p < .05) and smaller (r = .18, p < .03) and
they had higher total obstetrical complication scores (r = .22, p < .01) (Goodman, 1987).
However, some researchers have argued that obstetric complications are not a cause but a
consequence and are positively correlated with schizophrenia only when an existing genetic risk is
present (Fish, Marcus, Hans, Auerbach, & Perdue, 1992; Parnas, Schulsinger, Schulsinger,
Mednick, & Teasdale, 1982). This may imply that obstetric complications may interact with a
genetic predisposition and contribute to the development of schizophrenia. The New York Infant
Study (12 HR participants) found that while those with psychotic disorders gave birth to infants
with lower birth weights, there were no significant obstetric complications in this very small
sample. Nevertheless, studies have found that those HR children exposed to obstetric
complications were more likely to develop schizophrenia in adulthood (Cannon et al., 1993;
Mednick et al., 1987).
In addition, perinatal factors were also found to be predictive of subsequent child mental
health. The Swedish HR Study (McNeil & Kaij, 1987) examined children’s psychological
functioning using the Children’s Global Assessment Scale. It was found that 50% of HR children
CHILDHOOD DEVELOPMENT FACTORS AND RISK OF PSYCHOTIC EXPERIENCES 39
experienced higher levels of psychological disturbance (M = 70.84, SD = 13.40) than NCs (M =
75.73, SD = 14.86) and this difference was statistically significant (p < .004). Mental disturbance
among HR offspring at age 6 years was associated with maternal anxiety during pregnancy (p =
.02), maternal psychotic episodes during the period from 6 months to 2 years after delivery (p =
.01) and ambivalent or negative attitude towards pregnancy (p = .005, Pearson correlation figures
not specified) (McNeil & Kaij, 1987).
2.3.3 Childhood neurological and motor development.
The first case-control longitudinal HR study—the New York Infant Study—was
undertaken by Barbara Fish in 1952 (Fish, 1987). This study examined neurointegrative deficits,
which they called ‘pandysmaturation’ (PDM), by using the Gesell developmental tests, physical
measurements, the block design subtest of the Wechsler Intelligence Scale for Children (WISC)
and the Bender-Gestalt test (this was repeated 10 times between birth and two years). Table 2.3
shows that in early infancy, PDM had the highest standardised difference between HR and NCs
children (Cohen’s d = 1.25). Pandysmaturation includes motor and visual-motor skills in infancy
and was shown to be significantly correlated to blind evaluation of the severity of
psychopathology at the age of 10 years (Fish et al., 1992). In this study, HR children (n = 12) who
later developed psychiatric conditions (1 schizophrenia, 5 schizotypal, 1 paranoid personality
disorder) had higher PDM scores early in infancy (Fish et al., 1992). Although the major
limitation of this study was its small sample size, it was highly influential in being the first to
identify deficits of neurointegration in infancy.
The Swedish HR Study (McNeil & Kaij, 1987) examined neuromotor profiles in HR
children. Neuromotor profiles were assessed using the Griffiths Developmental Test, which
measures gross and fine motor performance and found a very large difference of Cohen’s d of
1.40 when comparing the HR with the NC children. A higher proportion of HR children (22%)
than NCs (3%) were rated low on the neuromotor examination. In addition, the HR children
expressed significantly more clumsy spontaneous movements, choreactic/choreiform involuntary
movements on the right side and poor motor balance with eyes closed (McNeil & Kaij, 1987).
CHILDHOOD DEVELOPMENT FACTORS AND RISK OF PSYCHOTIC EXPERIENCES 40
The Israeli HR Study (Marcus et al., 1987) used various neurological assessments together
with the Birch-Belmont test of auditory-visual integration to examine the neurological and
neuromotor status of HR and NC children. Relative to NCs, HR children were found to have poor
motor coordination (F (1, 89) = 8.32, p <.01), poor sensory perceptual signs (F (1, 89) = 4.72, p <
.05) and poor motor balance (F (1, 89) = 4.99, p < .05). In addition, HR males showed more
severe neurological signs than females (F (7, 92) = 3.51, p < .01) (Marcus, Hans, Lewow,
Wilkinson, & Burack, 1985).
The Jerusalem Infant Development study (Marcus et al., 1993) used the Bayley Scales of
Infant Development to measure psychomotor development over the first year of life. HR children
were found to have lower motor and sensorimotor performance (M = 1.35) than the NCs (M =
1.60), t = 5.0, p < .001). In addition, these profiles in the first year of life correlated with school
age motor and perceptual-cognitive ability only for the HR group (r = 0.61) (Marcus et al., 1993).
2.3.4 Childhood cognitive performance.
In the New York HR Project, attention and information processing emerged as the most
important predictor of adult onset schizophrenia (Erlenmeyer-Kimling & Cornblatt, 1987b). Table
2.4 shows that attention and information processing were measured by the Continuous
Performance Test (CPT), Auditory Attention Span Task and the digits forward and backward
subset from the WISC. The results revealed a higher percentage of HR children (27%) with
p
= .004).
Further, the New York HR project found that attention, memory and gross motor skills in
childhood identified 58%, 83% and 75%, respectively, of the children who later developed a
psychotic disorder (Erlenmeyer-Kimling et al., 2000). Erlenmeyer-Kimling concluded that
attention and information processing appear to be highly promising in offering relatively specific
early indicators of a liability for schizophrenia-related conditions. The authors recommended that
targeted intervention for correction of attention and information processing deficiencies in HR
children at a young age could serve a preventative function (2000).
Consistent with the findings from the New York HR Project, the Stony Brook HR Study in
CHILDHOOD DEVELOPMENT FACTORS AND RISK OF PSYCHOTIC EXPERIENCES 41
1987 found that HR children were less able to maintain attention and ignore irrelevant input and
that they displayed patterns of cognitive slippage that NCs did not (Neale, Winters, & Weintraub,
1984). Although the consistency of these results (attention deficits in HR group) supports the
predictive value of poorly sustained attention as a vulnerability marker for schizophrenia, very
few studies incorporated reaction time and selective attention.
The McMaster-Waterloo HR project (Asarnow et al., 1977) administered a test battery of
eight attention-demanding tasks to a group of foster children of parents with hospital-discharge
diagnosis of schizophrenia and NCs. HR children were found to have significantly lower levels of
performance on attention tasks (measured by the Continuous Performance Test) (Cohen’s d =
0.52).
Further, the Stony Brook HR project showed that HR children produced less speech, and
had a number of distinct discursive features such as less cohesion between ideas, and unclear or
ambiguous references to previously ideas (Weintraub, 1987, p. 444). Table 2.4 shows that IQ in
infancy, verbal ability in early childhood and spatial relations in late childhood had the highest
standard difference (Cohen’s d = 0.55, 1.21 and 0.81, respectively).
In terms of family communication styles (measured by the Consensus Family Rorschach),
the University of Rochester Child and Family Study (Wynne et al., 1987) found that mothers’
healthy communication was positively and significantly related to children’s school performance
(overall teacher rating, r = .24, p < .01; and peer rating, r = .21, p < .03). In contrast, mothers’
negative family communication styles (termed communication deviance measured by the
Consensus Family Rorschach) was negatively and significantly correlated with children’s school
performance (overall teacher rating, r = -.24, p < .01; and peer rating, r = -.15, p <.07) (Wynne et
al., 1987).
In addition, while the Boston NCPP HR study found that the seven-year-old HR children
had a lower IQ (measured on the WISC) than their matched NCs, this difference was not
statistically significant (Rieder et al., 1977). In contrast, the Boston and Providence NCPP HR
study found a significant main effect of parental diagnosis on child IQ at age seven: the low IQ of
HR children remained significant after controlling for potential confounding variables (i.e., SES,
CHILDHOOD DEVELOPMENT FACTORS AND RISK OF PSYCHOTIC EXPERIENCES 42
ethnicity, site and mother’s age at birth) (Goldstein et al., 2000, p. 327).
2.3.5 Childhood social behaviour.
The Emory University project (Goodman, 1987), using multiple scales of social
competence, found that HR children scored lower than NCs on role-play (p < .03) and using the
mother as a resource (p < .02). Compared with NCs, HR children scored lower on expression of
affection and hostility (p < .02) and communicative competence (p < .01), and higher on negative
affect (p < .02) and activity level (p < .04) (no report of effect sizes due to limited data).
The New York Infant Study found that HR children (during infancy) were characterised as
passive, quiet, socially isolated and as having poor affective control on teacher, peer and parent
reports (Fish, 1987). Similarly, using the Infant Temperament Questionnaire (Carey, 1970), the
Rochester Longitudinal Study found that HR children portrayed lower responsiveness to
examiner, and a higher distractible temperament (p <.05) (Sameroff et al., 1984; Sameroff et al.,
1987).
The Israeli HR study examined the social profiles of HR children and NCs. This study
used a variety of data collection methods, such as structured classroom observation, sociometric
questionnaire of the partial-rank-order type, naturalistic observation (school), parent, teacher
interview and the Tennessee Self-Concept Scale, to examine the social profiles of HR and NCs
during childhood (7–12 years of age). HR children were found to have lower social status (peer
evaluation); exhibit less desirable behaviour; be less active, sociable (more withdrawn) and
compliant (more antisocial); and show more undesirable interpersonal behaviours (Marcus et al.,
1987; Sohlberg & Yaniv, 1985). In addition, the HR group showed more confusion, contradiction
and conflict in their self-perception, lower self-esteem, higher levels of defensiveness about their
self-concept, higher levels of maladjustment and less personality integration (all p <.01)
(Sohlberg, 1985) (effect sizes not reported due to limited data).
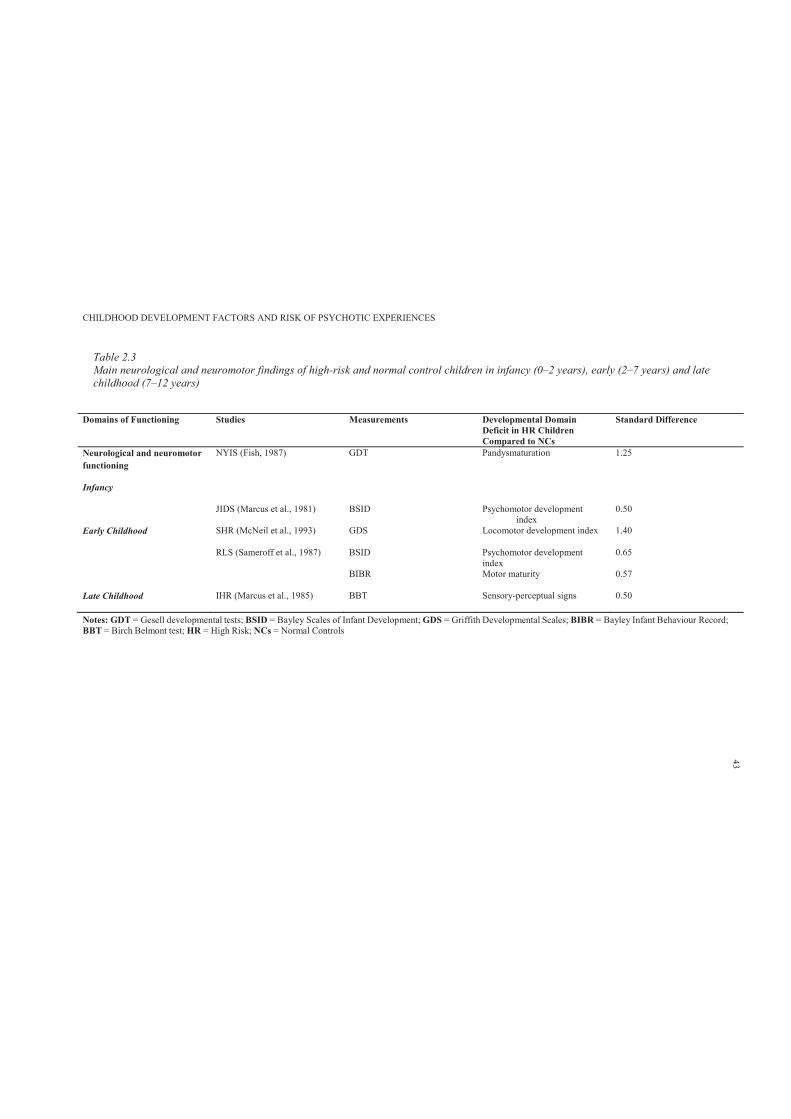
CHILDHOOD DEVELOPMENT FACTORS AND RISK OF PSYCHOTIC EXPERIENCES
Table 2.3Main neurological and neuromotor findings of high-risk and normal control children in infancy (0–2 years), early (2–7 years) and late childhood (7–12 years)
Domains of Functioning Studies Measurements Developmental Domain Deficit in HR Children Compared to NCs
Standard Difference
Neurological and neuromotor functioning
Infancy
NYIS (Fish, 1987) GDT Pandysmaturation 1.25
JIDS (Marcus et al., 1981) BSID Psychomotor development index
0.50
Early Childhood SHR (McNeil et al., 1993) GDS Locomotor development index 1.40
RLS (Sameroff et al., 1987) BSID Psychomotor development index
0.65
BIBR Motor maturity 0.57
Late Childhood IHR (Marcus et al., 1985) BBT Sensory-perceptual signs 0.50
Notes: GDT = Gesell developmental tests; BSID = Bayley Scales of Infant Development; GDS = Griffith Developmental Scales; BIBR = Bayley Infant Behaviour Record;BBT = Birch Belmont test; HR = High Risk; NCs = Normal Controls
43
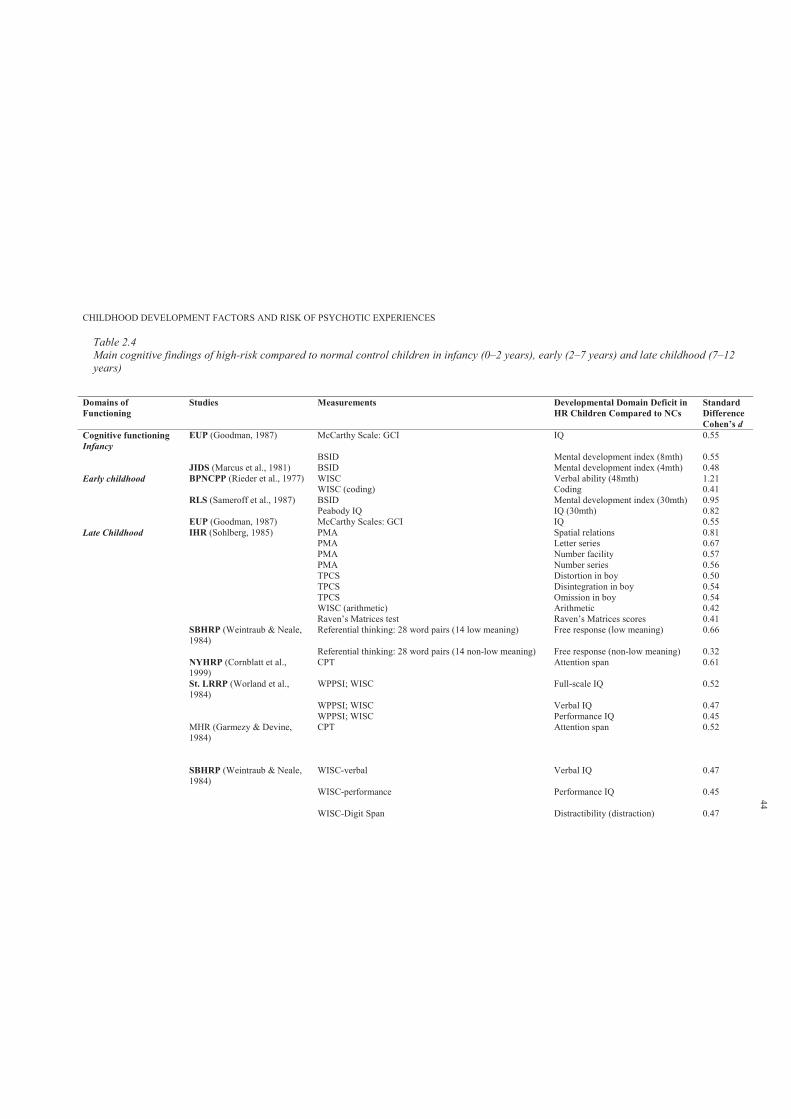
CHILDHOOD DEVELOPMENT FACTORS AND RISK OF PSYCHOTIC EXPERIENCES
Table 2.4Main cognitive findings of high-risk compared to normal control children in infancy (0–2 years), early (2–7 years) and late childhood (7–12years)
Domains of Functioning
Studies Measurements Developmental Domain Deficit in HR Children Compared to NCs
Standard DifferenceCohen’s d
Cognitive functioningInfancy
EUP (Goodman, 1987) McCarthy Scale: GCI IQ 0.55
BSID Mental development index (8mth) 0.55JIDS (Marcus et al., 1981) BSID Mental development index (4mth) 0.48
Early childhood BPNCPP (Rieder et al., 1977) WISC Verbal ability (48mth) 1.21WISC (coding) Coding 0.41
RLS (Sameroff et al., 1987) BSID Mental development index (30mth) 0.95Peabody IQ IQ (30mth) 0.82
EUP (Goodman, 1987) McCarthy Scales: GCI IQ 0.55Late Childhood IHR (Sohlberg, 1985) PMA Spatial relations 0.81
PMA Letter series 0.67PMA Number facility 0.57PMA Number series 0.56TPCS Distortion in boy 0.50TPCS Disintegration in boy 0.54TPCS Omission in boy 0.54WISC (arithmetic) Arithmetic 0.42Raven’s Matrices test Raven’s Matrices scores 0.41
SBHRP (Weintraub & Neale, 1984)
Referential thinking: 28 word pairs (14 low meaning) Free response (low meaning) 0.66
Referential thinking: 28 word pairs (14 non-low meaning) Free response (non-low meaning) 0.32NYHRP (Cornblatt et al., 1999)
CPT Attention span 0.61
St. LRRP (Worland et al., 1984)
WPPSI; WISC Full-scale IQ 0.52
WPPSI; WISC Verbal IQ 0.47WPPSI; WISC Performance IQ 0.45
MHR (Garmezy & Devine, 1984)
CPT Attention span 0.52
SBHRP (Weintraub & Neale, 1984)
WISC-verbal Verbal IQ 0.47
WISC-performance Performance IQ 0.45
WISC-Digit Span Distractibility (distraction) 0.47
44
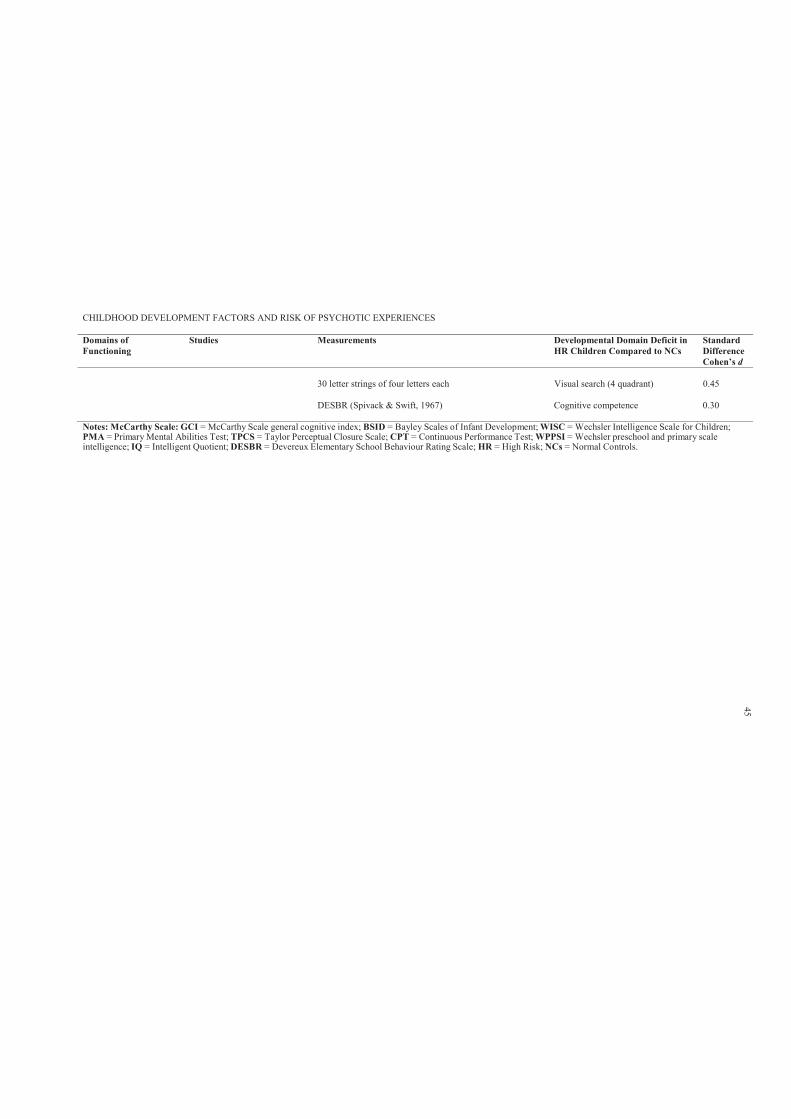
CHILDHOOD DEVELOPMENT FACTORS AND RISK OF PSYCHOTIC EXPERIENCES
Domains of Functioning
Studies Measurements Developmental Domain Deficit in HR Children Compared to NCs
Standard DifferenceCohen’s d
30 letter strings of four letters each Visual search (4 quadrant) 0.45
DESBR (Spivack & Swift, 1967) Cognitive competence 0.30
Notes: McCarthy Scale: GCI = McCarthy Scale general cognitive index; BSID = Bayley Scales of Infant Development; WISC = Wechsler Intelligence Scale for Children;PMA = Primary Mental Abilities Test; TPCS = Taylor Perceptual Closure Scale; CPT = Continuous Performance Test; WPPSI = Wechsler preschool and primary scaleintelligence; IQ = Intelligent Quotient; DESBR = Devereux Elementary School Behaviour Rating Scale; HR = High Risk; NCs = Normal Controls.
45
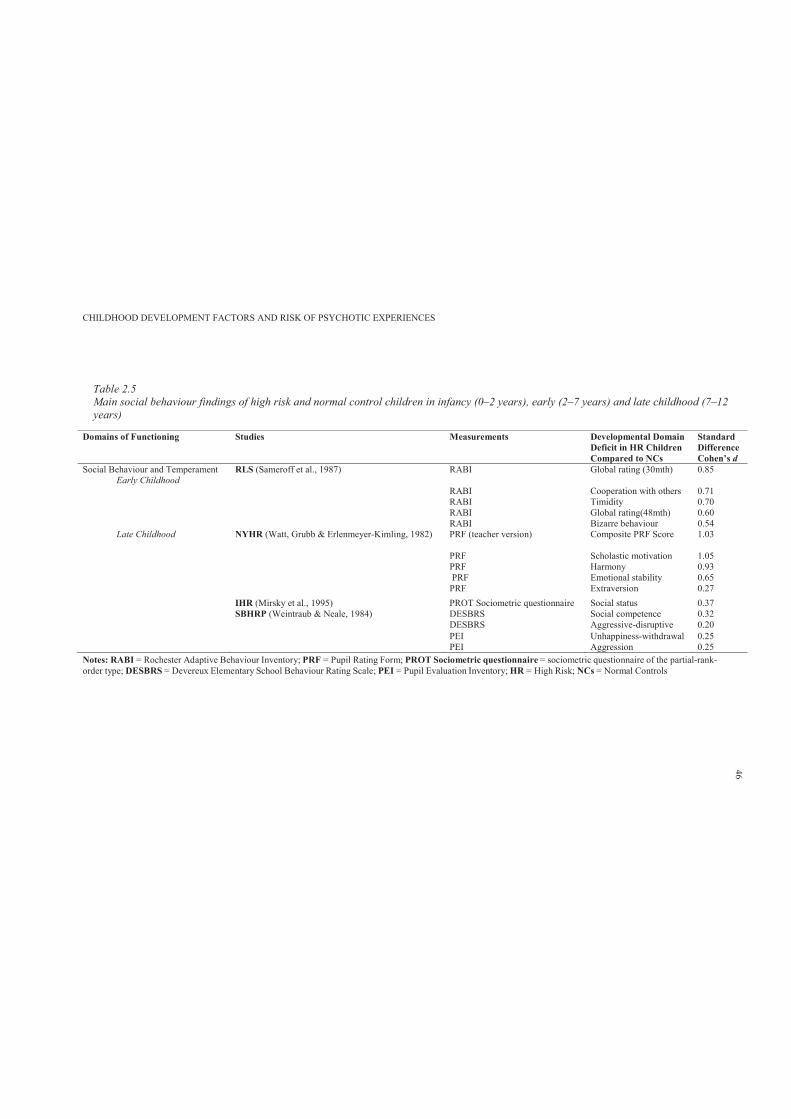
CHILDHOOD DEVELOPMENT FACTORS AND RISK OF PSYCHOTIC EXPERIENCES
Table 2.5Main social behaviour findings of high risk and normal control children in infancy (0–2 years), early (2–7 years) and late childhood (7–12 years)
Domains of Functioning Studies Measurements Developmental Domain Deficit in HR Children Compared to NCs
Standard DifferenceCohen’s d
Social Behaviour and TemperamentEarly Childhood
RLS (Sameroff et al., 1987) RABI Global rating (30mth) 0.85
RABI Cooperation with others 0.71RABI Timidity 0.70RABI Global rating(48mth) 0.60RABI Bizarre behaviour 0.54
Late Childhood NYHR (Watt, Grubb & Erlenmeyer-Kimling, 1982) PRF (teacher version) Composite PRF Score 1.03
PRF Scholastic motivation 1.05PRF Harmony 0.93PRF Emotional stability 0.65
PRF Extraversion 0.27IHR (Mirsky et al., 1995) PROT Sociometric questionnaire Social status 0.37SBHRP (Weintraub & Neale, 1984) DESBRS Social competence 0.32
DESBRS Aggressive-disruptive 0.20PEI Unhappiness-withdrawal 0.25PEI Aggression 0.25
Notes: RABI = Rochester Adaptive Behaviour Inventory; PRF = Pupil Rating Form; PROT Sociometric questionnaire = sociometric questionnaire of the partial-rank-order type; DESBRS = Devereux Elementary School Behaviour Rating Scale; PEI = Pupil Evaluation Inventory; HR = High Risk; NCs = Normal Controls
46
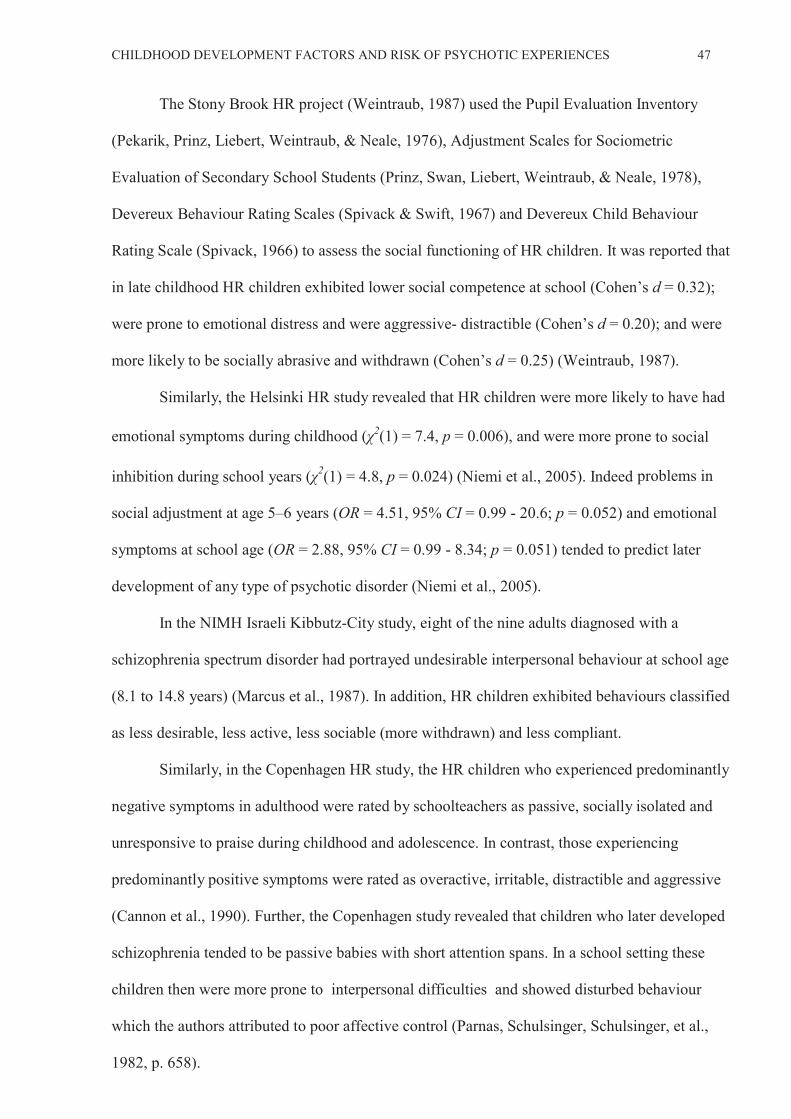
CHILDHOOD DEVELOPMENT FACTORS AND RISK OF PSYCHOTIC EXPERIENCES 47
The Stony Brook HR project (Weintraub, 1987) used the Pupil Evaluation Inventory
(Pekarik, Prinz, Liebert, Weintraub, & Neale, 1976), Adjustment Scales for Sociometric
Evaluation of Secondary School Students (Prinz, Swan, Liebert, Weintraub, & Neale, 1978),
Devereux Behaviour Rating Scales (Spivack & Swift, 1967) and Devereux Child Behaviour
Rating Scale (Spivack, 1966) to assess the social functioning of HR children. It was reported that
in late childhood HR children exhibited lower social competence at school (Cohen’s d = 0.32);
were prone to emotional distress and were aggressive- distractible (Cohen’s d = 0.20); and were
more likely to be socially abrasive and withdrawn (Cohen’s d = 0.25) (Weintraub, 1987).
Similarly, the Helsinki HR study revealed that HR children were more likely to have had
emotional symptoms during childhood ( 2(1) = 7.4, p = 0.006), and were more prone to social
inhibition during school years ( 2(1) = 4.8, p = 0.024) (Niemi et al., 2005). Indeed problems in
social adjustment at age 5–6 years (OR = 4.51, 95% CI = 0.99 - 20.6; p = 0.052) and emotional
symptoms at school age (OR = 2.88, 95% CI = 0.99 - 8.34; p = 0.051) tended to predict later
development of any type of psychotic disorder (Niemi et al., 2005).
In the NIMH Israeli Kibbutz-City study, eight of the nine adults diagnosed with a
schizophrenia spectrum disorder had portrayed undesirable interpersonal behaviour at school age
(8.1 to 14.8 years) (Marcus et al., 1987). In addition, HR children exhibited behaviours classified
as less desirable, less active, less sociable (more withdrawn) and less compliant.
Similarly, in the Copenhagen HR study, the HR children who experienced predominantly
negative symptoms in adulthood were rated by schoolteachers as passive, socially isolated and
unresponsive to praise during childhood and adolescence. In contrast, those experiencing
predominantly positive symptoms were rated as overactive, irritable, distractible and aggressive
(Cannon et al., 1990). Further, the Copenhagen study revealed that children who later developed
schizophrenia tended to be passive babies with short attention spans. In a school setting these
children then were more prone to interpersonal difficulties and showed disturbed behaviour
which the authors attributed to poor affective control (Parnas, Schulsinger, Schulsinger, et al.,
1982, p. 658).
CHILDHOOD DEVELOPMENT FACTORS AND RISK OF PSYCHOTIC EXPERIENCES 48
Similar difficulties at school were also reported in Olin et al. (1995) who found that,
within the HR group, males who later developed schizophrenia were more disruptive in a
classroom in terms of inappropriate behaviour, being emotionally highly strung and socially
isolated and had been judged by teachers as more susceptible to future psychological problems. In
contrast, teachers described females who later developed schizophrenia as more nervous. Indeed,
the HR adolescents who later developed schizophrenia were identified prior to diagnosis of
schizophrenia as those who experienced greater interpersonal difficulties and exhibited disruptive
behaviour (Parnas, Schulsinger, Schulsinger, et al., 1982).
Consistent with these findings, the Stony Brook HR Study found that HR children were
reported by parents as prone to being emotionally upset and distractible (Weintraub, 1987;
Weintraub & Neale, 1984). In addition, teachers and peers described the HR children as abrasive,
withdrawn and low in social competence (Weintraub, 1987). The HR children aged 7–15 years
who were reported as exhibiting both the internalising problem of social withdrawal and the
externalising problem of acting out were also those with a parent with schizophrenia (Weintraub,
1987).
Further, Amminger and colleagues (1999) analysed prospective data from the New York
HR Project and found that schizophrenia occurred in 18.5% of the HR group as compared to in
only 1.1% of NCs. When childhood behavioural disturbances were operationalised as a dependent
variable, and clinical outcome, substance abuse and gender were the independent variables, a
significant main effect for clinical outcome was revealed (F (2, 173)= 4.97, p <.05). This
observation led the researchers to argue that correlational inferences based on childhood
behavioural disturbances are specifically related to the development of schizophrenia in HR
offspring, but not in the general population (Amminger et al., 1999).
The Stony Brook HR project using the Devereux Elementary School Behaviour Rating
Scale (teacher ratings), found that HR children were more likely to have aggressive- disruptive
behaviours than NCs (t (657) = 2.28, p <.025) (Weintraub & Neale, 1984). Similarly, in the
Copenhagen HR study, school reports indicated that the HR children displayed higher frequencies
CHILDHOOD DEVELOPMENT FACTORS AND RISK OF PSYCHOTIC EXPERIENCES 49
of inappropriate behaviour in classrooms (39%) than did NCs (6%), Fisher’s Exact Test = .007
(Parnas, Schulsinger, Schulsinger, et al., 1982).
The family environment of parents presenting with schizophrenia has been described in
HR studies. The HR adolescents in the Stony Brook HR Study, compared with NCs, reported their
family atmosphere to be uptight, heavy and cheerless; the feeling level was cold and restricted;
and there were high levels of conflict and tension between family members (Weintraub, 1987).
Further, in the Finnish Adoptive Family Study, HR children described their families as having
experienced a lot of bad luck and being highly unstable, disorganised and unpredictable. Parents
presenting with schizophrenia were described as sharing less similar values, and were rejecting,
punishing and restrictive (particularly about dating) (Tienari et al., 1987). The researchers
concluded that while genetic vulnerability appears to be a necessary precondition for the
development of schizophrenia, an unstable family and rearing environment may also be necessary
to transform the genetic vulnerability into clinical symptoms of schizophrenia (Tienari et al.,
1987; Tienari et al., 2004).
2.4 Discussion
This chapter used a systematic methodology to review 18 prospective HR longitudinal
studies. These studies examined the childhood neurodevelopmental factors in HR and NC
children. It appears that children of parents presenting with schizophrenia (HR) exhibit deficits in
multiple domains of functioning, able to be broadly characterised as neurological, neuromotor,
cognitive, social behaviour. Further, mothers presenting with schizophrenia were found to have
had higher adverse events during pregnancy.
These findings suggest that the developmental origins of schizophrenia may extend to as
early as fetal development and that there may be clear and reasonably consistent signs across child
development of vulnerability. Schizophrenia shows a complex pattern of development well before
the onset of psychotic symptoms. Alternatively, the findings may suggest that HR children have
various neurodevelopmental delays. Offspring of parents with schizophrenia may experience
biological (e.g. delayed antenatal care and OCs) and social disadvantage (e.g. family
communications styles and parenting) commencing in the antenatal period which later
CHILDHOOD DEVELOPMENT FACTORS AND RISK OF PSYCHOTIC EXPERIENCES 50
phenotypically presents as neurodevelopmental delays in childhood.
This review confirms the well-known association of schizophrenia with perinatal factors
such as birth complications (Mednick et al., 1987; Sameroff et al., 1987). Some time ago
researchers suggested that perinatal birth complications may interact with genetic liability rather
than act simply as additive risk factor; that is, birth complications might only be pathogenic in the
presence of a genetic diathesis for schizophrenia (Parnas, Schulsinger, Teasdale, et al., 1982). This
hypothesis is strengthened by evidence that the interaction of genetic risk with birth complications
can be used to predict the developmental brain abnormalities seen in schizophrenia, such as
enlarged ventricles (Cannon et al., 1993). More recent study reported evidence for the interaction
between genetic risk factors (AKT1, BDNF, DTNBP1) and presence of serious obstetric
complications to increase risk for schizophrenia (Nicodemus et al., 2008). Another possible
explanation is that birth complications reflect an earlier epigenetic effect of some type of fetal
exposure which alters fetal brain development (Kirkbride et al., 2012).
This review also found consistent evidence that HR children were characterized by
problems in motor development (Marcus et al., 1987; McNeil et al., 1993). However, it has been
suggested that motor development is likely to have some interaction with other psychosocial
aspects of development; often motor impairments in children are associated with social cognitive
factors such as lack of confidence, low self-esteem, and social challenges (Henderson & Sugden,
1992). It is possible that the association of motor difficulties and schizophrenia may reflect a
wider problem extending to social-cognitive and interpersonal difficulties.
In terms of cognitive development, attention and information processing across time points
were among the most important predictors of schizophrenia (Erlenmeyer-Kimling & Cornblatt,
1987b). Indeed, the New York HR Project concluded that cognitive deficiencies are the domain
most amenable to early preventative intervention. However, it could be argued that social
behaviour is equally amenable to intervention in early development.
The majority of the reviewed studies reported the importance of impaired social
functioning among HR children, and more specifically on the domains of social withdrawal,
aggression, and lack of social competence. However data collection methods were mainly
CHILDHOOD DEVELOPMENT FACTORS AND RISK OF PSYCHOTIC EXPERIENCES 51
naturalistic observations, parent, teacher, and peer self-reports which may limit the external
validity of the findings. While theses finding appear to point to important indicators of liability to
schizophrenia, few studies assessed the predictive values of more specific sub-domains of
childhood social-cognitive functioning as attribution style, Theory of Mind and emotional
perception (Green & Leitman, 2008; Green et al., 2008). Indeed, cognition and emotion are highly
interconnected, and in many ways associated with overlapping neural systems. It may be argued
that deficient emotional processing negatively influences the cognitive processing of individuals
with schizophrenia and individuals at heightened risk of developing the condition.
However, in terms of social functioning, several essential questions emerged from the
review:
To what extent do childhood social deficits constitute a risk factor for schizophrenia?
How predictive are social deficits in relation to schizophrenia?
Is impaired social functioning an indicator of below-threshold liability for the development
of schizophrenia?
What domains of social functioning appear to have high specificity and sensitivity for the
development of schizophrenia?
The answers to these questions would guide (a) clinicians and researchers to focus on
specific social cognitive domains, and (b) provide the basis and direction for early preventative
interventions.
Overall, this review found that HR children exhibit impairments in multiple developmental
domains of functioning. This implies that genetic predisposition is not the only risk factor
involved in the development of schizophrenia. Indeed, it may be argued that the observed
neurodevelopmental impairments in HR children are also necessary to transform the genetic
vulnerability into schizophrenia. This argument is consistent with Tienari’s et al. (2004)
proposition that an unstable rearing environment is necessary to transform genetic vulnerability
into schizophrenia.
In this review a definition of HR status was adopted which was consistent with the
research design used to recruit participants into these studies, namely having a first-degree relative
CHILDHOOD DEVELOPMENT FACTORS AND RISK OF PSYCHOTIC EXPERIENCES 52
diagnosed with schizophrenia. This raises many questions about the mechanisms of heritability
which could be arguably genetic, epigenetic or environmental – each of which is confounded
within these study designs. What the researcher can say is that the consistent presence of multiple
domains of neurodevelopmental deficits in HR children reviewed indicates that these children
have inherited a susceptibility to schizophrenia and that our definition of HR status is a reasonably
one. However, findings from these HR studies do not necessarily generalise to individuals
presenting with schizophrenia who do not have a first-degree relative with schizophrenia. Further,
the findings may not apply to individuals at risk of schizophrenia in the general population.
Over the last decade, researchers have shifted from genetic high-risk studies, to examine
the neurodevelopmental profiles of children who later developed schizophrenia. These studies use
data from the general population with schizophrenia as the main outcome variable. This shift in
research design may be influenced by the fact that findings from genetic HR studies are
ungeneralisable to children whose parents have no history of psychiatric conditions, but who
themselves later develop schizophrenia. Chapter 3 aims to present a selective review of population
and birth cohort studies of children who later developed schizophrenia.
CHILDHOOD DEVELOPMENT FACTORS AND RISK OF PSYCHOTIC EXPERIENCES 53
Chapter 3: Birth Cohort Studies of Childhood Literacy, Speech and
Language Indicators of Schizophrenia: A Systematic Review
3.1 Introduction
Chapter 2 reviewed findings from longitudinal studies that followed cohorts of children
whose parents had schizophrenia. While the results demonstrated that such HR children differed
from NCs on a range of neurodevelopmental profiles, the findings may not be generalisable to
children of parents with no history of schizophrenia, but who later developed schizophrenia. A
significant body of longitudinal birth cohort studies were reviewed to identify the childhood
neurodevelopmental profiles of individuals who later developed schizophrenia.
The aim of this chapter is to review and identify the neurodevelopmental profiles of
children from the general population who later developed schizophrenia. However, since this
literature is vast, this review6 will use a systematic methodology to examine only those population
and birth cohort studies that examined the literacy, speech and language profiles of pre-
schizophrenia children (children who later developed schizophrenia). These developmental
domains were selected because these have been insufficiently studied by longitudinal HR projects
(see Chapter 2). The results revealed the differences in premorbid literacy, speech and language
functioning (at multiple ages) between individuals with schizophrenia and NCs. The strengths and
limitations of the studies and measurements of literacy, speech and language are also discussed.
While Chapter 2 presented the findings from ‘high risk’ case-control longitudinal studies,
this chapter will identify similarities and converging findings using a population- based cohort.
Recommendations are made for further research that involves the examination of childhood
literacy, speech and language functioning in relation to manifestations of PEs in early
adolescence. It was concluded that the speech and language domain of functioning could be used
6 Main findings of this review were orally presented at the 5th International Congress of Child and Adolescent
Psychiatry (8–11 October 2012), Department of Psychiatry of Tehran University of Medical Sciences, Iran.

CHILDHOOD DEVELOPMENT FACTORS AND RISK OF PSYCHOTIC EXPERIENCES 54
as a guide in developing early preventative interventions for children with elevated risk of
developing psychotic symptoms.
3.2 Method
3.2.1 Literature search procedure.
A broad search using key terms such as ‘schizophrenia’, ‘birth cohort’, ‘population
studies’, ‘premorbid cognitive functioning’, ‘literacy’, ‘speech and language functioning’ was
applied in Scopus, Medline, Pubmed, Ovid, Psychinfo and PsychLit electronic databases. These
databases were searched at the end of May 2011. This search included 458 articles, which was
then reduced to 44 articles that were limited to the key terms. These papers were searched, first by
reading the title and subsequently, if necessary the abstract and the paper. Forty four potentially
relevant articles (English language) were reviewed. Citations from relevant articles and review
articles were also scrutinised to locate additional relevant articles, book chapters and conference
articles. Additional searches were undertaken based on the names of included studies. While each
study had publications examining multiple neurodevelopmental profiles, this selective review
focused only on the literacy, speech and language performance of children who later developed
schizophrenia. Seven studies fulfilled the inclusion criteria.
3.2.2 Inclusion and exclusion criteria.
In this review, the population and birth cohort studies used needed to (a) use data from the
general population; (b) have data on literacy, speech and language functioning collected
prospectively from birth, infancy, childhood or early adolescence (ages 1 – 15 years); and (c) have
schizophrenia as an outcome. A number of relevant studies were found, but only those
investigating childhood literacy, speech and language functioning in relation to adult onset of
schizophrenia were included. Seven birth cohort studies fulfilled the inclusion criteria.
3.3 Results
3.3.1 General overview of the reviewed birth cohort studies.
Table 3.1 presents the main characteristics of the reviewed studies. All included studies
reviewed childhood literacy, speech and language functioning in relation to prediction of
schizophrenia. The table also reports the diagnostic criteria, risk and onset age of schizophrenia
CHILDHOOD DEVELOPMENT FACTORS AND RISK OF PSYCHOTIC EXPERIENCES 55
for each of the studies. In this review, the findings of each birth cohort study are presented
separately.
3.3.2 Childhood literacy, speech and language indicators of schizophrenia.
3.3.2.1. National Survey of Health and Development.
The National Survey of Health and Development (NSHD) examined the association
between adult-onset schizophrenia and childhood cognitive factors within a birth cohort of 5362
people born in the week 3–9 March 1946 (Jones et al., 1994). Table 3.1 shows that 30 cases of
schizophrenia were identified between the ages of 16 and 43 years (cumulative risk 0.63%, 95%
CI = 0.41–0.86%). There was a 2.5 year difference (95% CI = 3.3–8.2) between the age of onset
for males versus females.
This study found that non-verbal skills (measures not specified) at ages 8, 11 and 15 years
distinguished the children who later developed schizophrenia from the NCs (p values equal to
0.05, 0.14 and 0.002, respectively). Similarly, children who later developed schizophrenia were
more likely to have lower levels of verbal language skills (measures not specified) at ages 8, 11
and 15 years (p values equal to 0.02, 0.07 and 0.01, respectively). Literacy skills such as reading
did not show any difference between children who later developed schizophrenia and NCs when
assessed at ages 8 (F = 1.8, p = 0.2), 11 (F = 2.3, p = 0.2) and 15 years (F = 1.5, p = 0.2).
Nonetheless, the researchers concluded that the observed aberrant speech development supports
the hypothesis that explains voice hallucinations and other positive phenomena on the basis of
abnormal language development (Jones et al., 1994; McGuire & Shah, 1993).
3.3.2.2. National Collaborative Perinatal Project
In the National Collaborative Perinatal Project (NCPP Philadelphia), 79% (n = 7326) of
the original sample (N = 9239) were assessed using seven subtests (block design, picture
arrangement, digit span, digit symbol coding, vocabulary, comprehension and information) of the
Wechsler Intelligence Scale for Children (WISC) at mean age 7.6 years (SD = 1.5) (Niendam et
al., 2003). Children who later developed schizophrenia (n = 32) and their siblings (n = 25) were
matched to normal comparison groups (n = 201) by gender, ethnicity, age at examination and
socioeconomic status.
CHILDHOOD DEVELOPMENT FACTORS AND RISK OF PSYCHOTIC EXPERIENCES 56
The results revealed that relative to normal comparison groups, the children who later
developed schizophrenia showed significant differences on the picture arrangement (t = -3.88, p =
0.0001), vocabulary (t = -2.85, p = 0.005) and coding (t = -6.08, p = 0.0001) subtests. Similarly,
the unaffected siblings of children who later developed schizophrenia also performed significantly
lower than normal comparison groups on the picture arrangement (t = -2.85, p = 0.005),
vocabulary (t = -2.90, p = 0.004) and coding (t = -2.19, p = 0.03) subtests. Moreover, those
children who later developed schizophrenia performed significantly worse than their unaffected
siblings only on the coding subtest (t = -2.64, p = 0.009).
Bearden and colleagues (2000) explored childhood language abnormalities as predictors of
adult schizophrenia in the NCPP Philadelphia using data from 2085 participants (21 presenting
with schizophrenia, 17 unaffected siblings and 2047 non- psychiatric controls). The results of this
study showed that after statistically controlling for age, sex, race, parental education level and
parental socioeconomic status, abnormal speech (assessed by a speech pathologist) at age 7 was a
significant predictor of schizophreni 2 = 9.19, df = 1, p = 0.002, OR = 12.70, 95% CI
= 2.46–65.66). This indicates that abnormal speech at age 7 is associated with a greater than 12-
fold increase in risk of developing schizophrenia.
Similarly, good performance on the Auditory-Vocal Association Test at age 7
(assesses expressive language and word association) had a significant negative
2= 9.07, df = 1, p = 0.002, OR = 0.71,
95% CI = 0.57–0.89). This indicates that the lower an individual’s score on this test,
the more likely he or she is to develop schizophrenia.
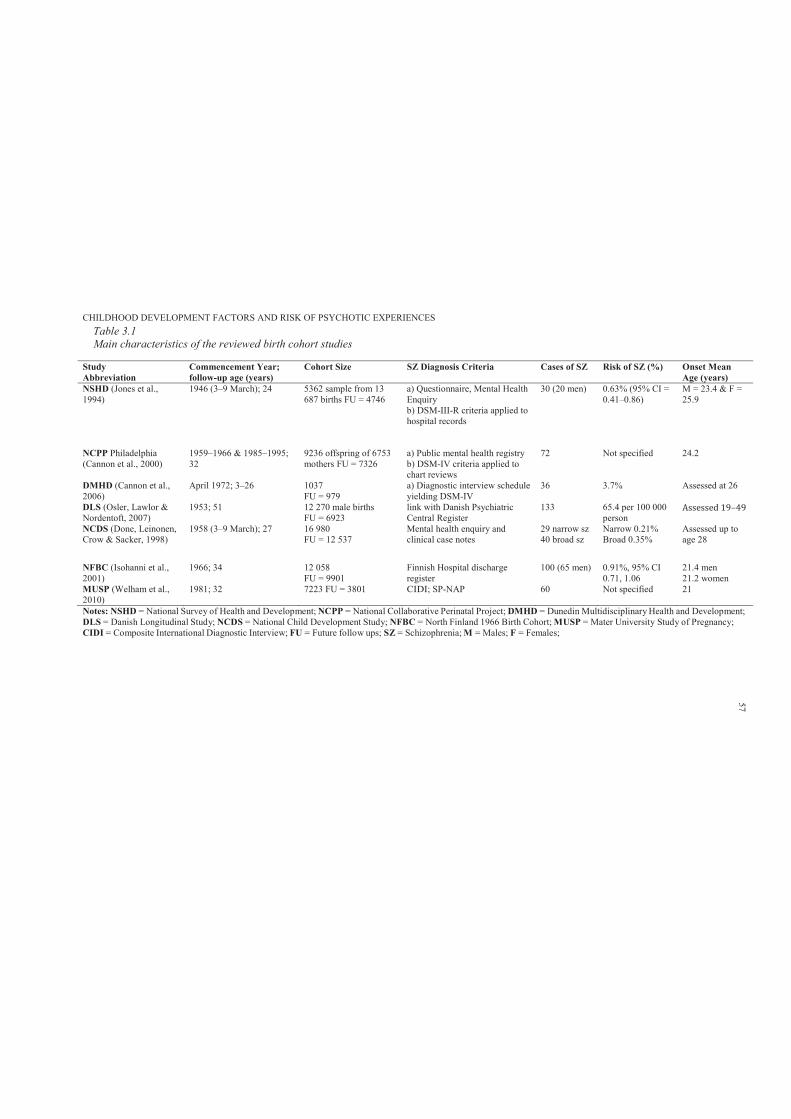
CHILDHOOD DEVELOPMENT FACTORS AND RISK OF PSYCHOTIC EXPERIENCESTable 3.1Main characteristics of the reviewed birth cohort studies
StudyAbbreviation
Commencement Year; follow-up age (years)
Cohort Size SZ Diagnosis Criteria Cases of SZ Risk of SZ (%) Onset Mean Age (years)
NSHD (Jones et al.,1994)
1946 (3–9 March); 24 5362 sample from 13 687 births FU = 4746
a) Questionnaire, Mental Health Enquiryb) DSM-III-R criteria applied to hospital records
30 (20 men) 0.63% (95% CI = 0.41–0.86)
M = 23.4 & F = 25.9
NCPP Philadelphia (Cannon et al., 2000)
1959–1966 & 1985–1995; 32
9236 offspring of 6753 mothers FU = 7326
a) Public mental health registryb) DSM-IV criteria applied to chart reviews
72 Not specified 24.2
DMHD (Cannon et al., 2006)
April 1972; 3–26 1037FU = 979
a) Diagnostic interview schedule yielding DSM-IV
36 3.7% Assessed at 26
DLS (Osler, Lawlor & Nordentoft, 2007)
1953; 51 12 270 male birthsFU = 6923
link with Danish Psychiatric Central Register
133 65.4 per 100 000 person
Assessed 19–49 NCDS (Done, Leinonen, Crow & Sacker, 1998)
1958 (3–9 March); 27 16 980FU = 12 537
Mental health enquiry and clinical case notes
29 narrow sz40 broad sz
Narrow 0.21%Broad 0.35%
Assessed up to age 28
NFBC (Isohanni et al.,2001)
1966; 34 12 058FU = 9901
Finnish Hospital discharge register
100 (65 men) 0.91%, 95% CI 0.71, 1.06
21.4 men21.2 women
MUSP (Welham et al., 2010)
1981; 32 7223 FU = 3801 CIDI; SP-NAP 60 Not specified 21
Notes: NSHD = National Survey of Health and Development; NCPP = National Collaborative Perinatal Project; DMHD = Dunedin Multidisciplinary Health and Development;DLS = Danish Longitudinal Study; NCDS = National Child Development Study; NFBC = North Finland 1966 Birth Cohort; MUSP = Mater University Study of Pregnancy;CIDI = Composite International Diagnostic Interview; FU = Future follow ups; SZ = Schizophrenia; M = Males; F = Females;
57
CHILDHOOD DEVELOPMENT FACTORS AND RISK OF PSYCHOTIC EXPERIENCES
3.3.2.3. Dunedin Multidisciplinary Health and Development Study
Cannon and colleagues (2006), using data from the Dunedin Multidisciplinary Health and
Development Study (DMHD), examined the neuropsychological profiles (age 13) and diagnostic
data (age 26) of children who later developed schizophrenia or schizophreniform disorder (n = 23,
3.7%; combined 1% schizophrenia with 2.7% schizophreniform), manic episode (n = 10, 2.0%) or
depression/anxiety disorder (n = 196, 28.5%), as compared to NCs (n = 470). The 50-minute
neuropsychological assessment comprised of the Rey-Osterreith Complex Figure Test, Rey
Auditory–Verbal Learning Test (four trials), Wisconsin Card Sort Test (three categories), Mazes,
Trail Making Test, Grooved Pegboard and Verbal Fluency (Lezak, 1983).
It was found that, while the mania group did not differ from the NCs on any of the tests,
the scores of children who later developed schizophreniform disorder differed significantly from
NCs on the Trail Making Test, part B score, time to completion: = - 0.76, 95% CI = -0.35 to -
1.2, p < 0.001; Trail Making Test, part B score minus part A score: = -0.74, 95% CI = -0.33 to -
1.16, p < 0.001; Grooved Pegboard, right hand: = -0.68, 95% CI -0.22 to -1.1, p < 0.002;
Grooved Pegboard, left hand: = -0.41, 95% CI = -0.008 to -0.81, p < 0.045; and Verbal Fluency:
= -0.46, 95% CI -0.91 to -0.02, p < 0.043 (Cannon et al., 2006). These results may indicate
some relation of these functional domains to future schizophrenia-related outcomes.
Further, in the DMHD study, receptive and language development was assessed at ages 3
and 5 years using the Reynell Developmental Language Scales, and at ages 7 and 9 using the
Auditory Reception and Verbal Expression subtests of the Illinois Test of Psycholinguistic
Abilities (Cannon et al., 2002). In addition to diagnostic data at age 26 years, this study had the
advantage of assessing psychotic symptoms at age 11 years. The schizophrenia section of the
Diagnostic Interview Schedule for Children (DISC) was administered to 789 study members. It
included five questions regarding psychotic symptoms that were scored by psychiatrist as no (1),
yes, likely (1), and yes, definitely present (2). The scores for each item were summed.
It was found that the majority of the participants (n = 673) had a score of 0, 103 (13%)
obtained a score of 1 (‘weak-symptom group’) and 13 had a score of 2 or higher (‘strong-
CHILDHOOD DEVELOPMENT FACTORS AND RISK OF PSYCHOTIC EXPERIENCES
symptom group’) at age 11 years. This study found that those with ‘strong psychotic symptoms’ at
age 11 years were more likely to develop schizophreniform disorder at age 26 years (OR = 16.4%,
95% CI = 3.9–67.8). Similarly, ‘weak psychotic symptoms’ were associated with an increased
risk of schizophreniform disorder (OR = 5.1, 95% CI = 1.7–18.3) (Cannon et al., 2002).
The group that later developed schizophreniform disorder at age 26 years (n = 36)
exhibited lower receptive language performance across the four testing periods (3, 5, 7, 9 years; -
0.39 SD unit difference, 95% CI = -.54 to -.06) as compared to the NCs. However, there were no
differences in expressive language (0.09 SD unit difference, 95% CI = -0.15 to 0.34). The group
with ‘strong psychotic symptoms’ at age 11 years exhibited lower receptive language performance
at ages 3 to 9 years (-0.57 SD unit difference, 95% CI = -.92 to -.22, p < .01). Similarly, those
with ‘weak psychotic symptoms’ were more likely to have lower receptive language skills at these
same ages (-0.14, 95% CI = -0.27 to -0.005, p = .04). However, there were no differences in
expressive language for either the ‘strong psychotic symptoms’ (p value = 0.5) or the ‘weak
psychotic symptoms’ groups (p value = 0.8).
3.3.2.4. Danish Longitudinal Study (Project Metropolitan)
Osler and colleagues (2007) identified an association of cognitive functioning (including
verbal abilities) and change in cognitive function during adolescence with the development of
adult onset schizophrenia in a cohort of 6923 (from an original 12 270) men born in Copenhagen,
Denmark in 1953. Spatial, arithmetic and verbal information was derived from the Harnquist test.
Diagnostic data was derived from the Danish Psychiatric Central Register between 1969 and
December 2002. In this study, 133 participants were diagnosed with schizophrenia or
schizophrenia spectrum disorder (e.g., paranoid states, other psychoses or schizotypal disorders)
giving a rate of 65.4 per 100 000 persons per year (95% CI = 55.6–76.9).
This study found that cognitive function at ages 12 and 18 was inversely associated with
schizophrenia; higher scores on cognitive functioning (including verbal abilities) were less likely
associated with prediction of adult onset schizophrenia. A regression model indicated that decline
in cognitive function between the ages of 12 and 18 was significantly associated with an increased
risk of schizophrenia (Hazard risk [HR] = 1.32, 95% CI = 1.01–1.75); and all forms of
CHILDHOOD DEVELOPMENT FACTORS AND RISK OF PSYCHOTIC EXPERIENCES
schizophrenic spectrum disorders combined (HR = 1.27, 95% CI = 1.07–1.60) (Osler et al., 2007).
3.3.2.5. National Child Development Study
Done, Leinoneen, Crow and Sacker (1998) investigated syntactic complexity via
narratives written at age 11 by children who later developed a psychiatric disorder (e.g.,
schizophrenia) in the National Child Development Study (NCDS). Children at age 11 completed
the General Ability Scale, a test of verbal and nonverbal intelligence standardised by the National
Foundation for Educational Research in England. In addition, the children were asked to ‘imagine
that you are now 25 years old. Write about the life you are leading, your interests, your home life
and your work at the age of 25; you have 30 minutes to do this’ (Done et al., 1998, p. 131).
Additional diagnostic information was derived from clinical case note histories and Mental Health
Enquiry between 1974 and 1986. Schizophrenia (n = 30), affective psychosis (n = 31), neurosis (n
= 70) and NCs (n = 13 953) were the samples used in this study. The result indicated that in the
cohort as a whole, the essay length was longer in girls than in boys (228.8 v. 180.7 words); essay
length varied across geographic area (regions in the UK) and social class; and essay length
correlated highly with the General Ability Scale.
Two trained linguists blind to diagnosis rated the essays, adhering to the brief syntactical
analysis scheme of Thomas et al. (1996). Overall, the results did not support the hypothesis that
children who later develop schizophrenia can be differentiated from NCs on measures of syntactic
production (z-scores difference = -0.488, 95% CI = -0.88 to -0.1, cases produced shorter
sentences), grammatical errors (4.8 in both groups, p > .05) or spelling errors (cases 5.7 v. 6.4,
95% CI = -1.9–3.2). There was no increased tendency by the cases to produce more grammatical
or spelling errors. The researchers indicated that language impairments in individuals with
schizophrenia might reflect their style of language use rather than suggesting a language disorder.
In addition, subtle language differences may not be predictive of schizophrenia, and thus may not
be indicative of a neurodevelopmental aetiology of schizophrenia (Done et al., 1998).
3.3.2.6. Northern Finland 1966 Birth Cohort
Isohanni and colleagues (2001) tested the hypothesis that delayed childhood development
may predict adult schizophrenia and other psychosis using data from 9901 children (5025 boys,
CHILDHOOD DEVELOPMENT FACTORS AND RISK OF PSYCHOTIC EXPERIENCES
50.8%) who participated in the Northern Finland 1966 birth cohort (original N = 12 058),
followed to age 31 years.
Information on the cohort’s childhood development (age of standing and walking without
support, day/night time wetting, talking and gross neurological development) was obtained using a
special examination at age 1 year by public health nurses and general practitioners during
children’s visits to welfare centres. Psychiatric diagnosis was derived from the nationwide Finnish
Hospital Discharge Register (FHDR), which covers all mental and general hospitals. All derived
case records were scrutinised and diagnoses were validated for DSM-II-R criteria. One hundred
cases with schizophrenia (65 men) arose by the end of the thirty-first year (cumulative incidence =
0.91%, 95% CI = 0.73–1.08).
Although child’s age at learning to stand (p value <0.01 for boys and 0.09 for girls) and
walk without support (p value < 0.01 for boys and 0.38 for girls) were related to subsequent
incidence of schizophrenia, speaking at the age of 1 year was not significantly related to
cumulative incidence of schizophrenia (p values = 0.87 for boys and 0.70 for girls; see Table 3.2).
The researchers suggested that it is likely that the non-significant association between expressive
language and adult onset of schizophrenia may be because 1 year is simply too early to detect
differences in expressive language. However, the overall results of this study supported the
hypotheses regarding psychosis as having a developmental dimension with precursors apparent in
early life.
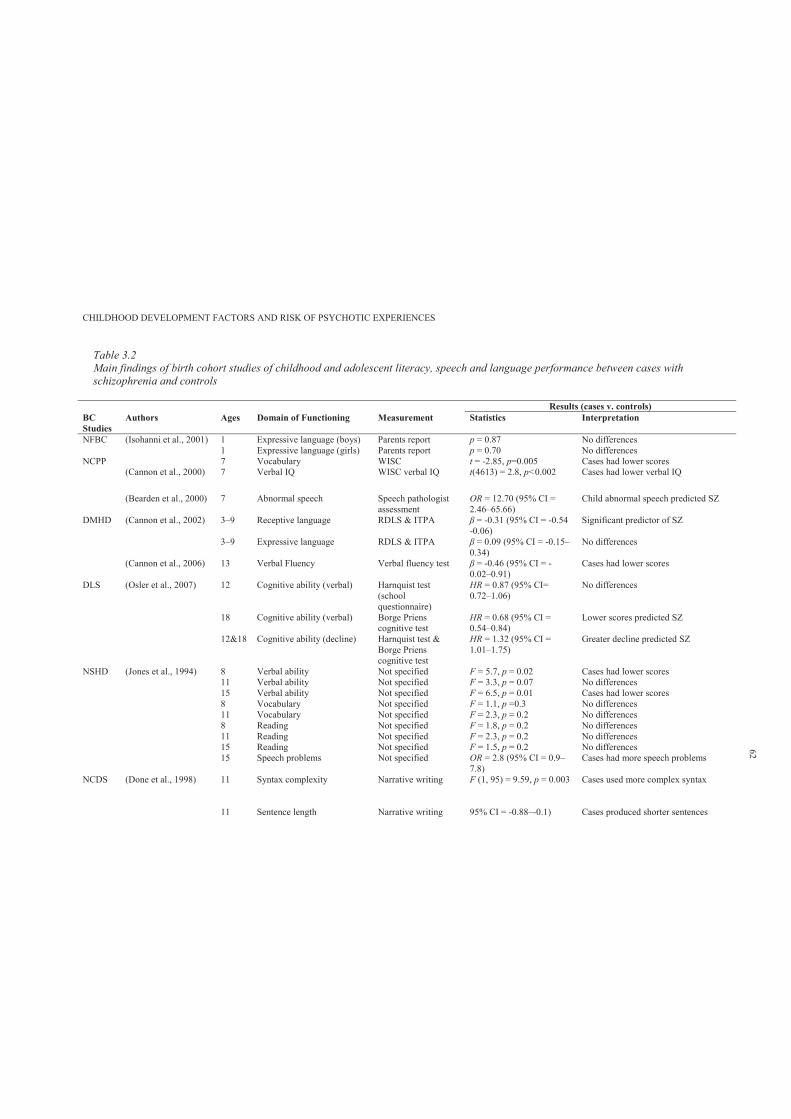
CHILDHOOD DEVELOPMENT FACTORS AND RISK OF PSYCHOTIC EXPERIENCES
Table 3.2Main findings of birth cohort studies of childhood and adolescent literacy, speech and language performance between cases withschizophrenia and controls
Results (cases v. controls)BC Studies
Authors Ages Domain of Functioning Measurement Statistics Interpretation
NFBC (Isohanni et al., 2001) 1 Expressive language (boys) Parents report p = 0.87 No differences 1 Expressive language (girls) Parents report p = 0.70 No differences
NCPP 7 Vocabulary WISC t = -2.85, p=0.005 Cases had lower scores (Cannon et al., 2000) 7 Verbal IQ WISC verbal IQ t(4613) = 2.8, p<0.002 Cases had lower verbal IQ
(Bearden et al., 2000) 7 Abnormal speech Speech pathologist assessment
OR = 12.70 (95% CI = 2.46–65.66)
Child abnormal speech predicted SZ
DMHD (Cannon et al., 2002) 3–9 Receptive language RDLS & ITPA = -0.31 (95% CI = -0.54 -0.06)
Significant predictor of SZ
3–9 Expressive language RDLS & ITPA = 0.09 (95% CI = -0.15–0.34)
No differences
(Cannon et al., 2006) 13 Verbal Fluency Verbal fluency test = -0.46 (95% CI = -0.02–0.91)
Cases had lower scores
DLS (Osler et al., 2007) 12 Cognitive ability (verbal) Harnquist test (school questionnaire)
HR = 0.87 (95% CI= 0.72–1.06)
No differences
18 Cognitive ability (verbal) Borge Priens cognitive test
HR = 0.68 (95% CI = 0.54–0.84)
Lower scores predicted SZ
12&18 Cognitive ability (decline) Harnquist test & Borge Priens cognitive test
HR = 1.32 (95% CI = 1.01–1.75)
Greater decline predicted SZ
NSHD (Jones et al., 1994) 8 Verbal ability Not specified F = 5.7, p = 0.02 Cases had lower scores 11 Verbal ability Not specified F = 3.3, p = 0.07 No differences 15 Verbal ability Not specified F = 6.5, p = 0.01 Cases had lower scores 8 Vocabulary Not specified F = 1.1, p =0.3 No differences 11 Vocabulary Not specified F = 2.3, p = 0.2 No differences 8 Reading Not specified F = 1.8, p = 0.2 No differences 11 Reading Not specified F = 2.3, p = 0.2 No differences 15 Reading Not specified F = 1.5, p = 0.2 No differences 15 Speech problems Not specified OR = 2.8 (95% CI = 0.9–
7.8)Cases had more speech problems
NCDS (Done et al., 1998) 11 Syntax complexity Narrative writing F (1, 95) = 9.59, p = 0.003 Cases used more complex syntax
11 Sentence length Narrative writing 95% CI = -0.88–-0.1) Cases produced shorter sentences
62
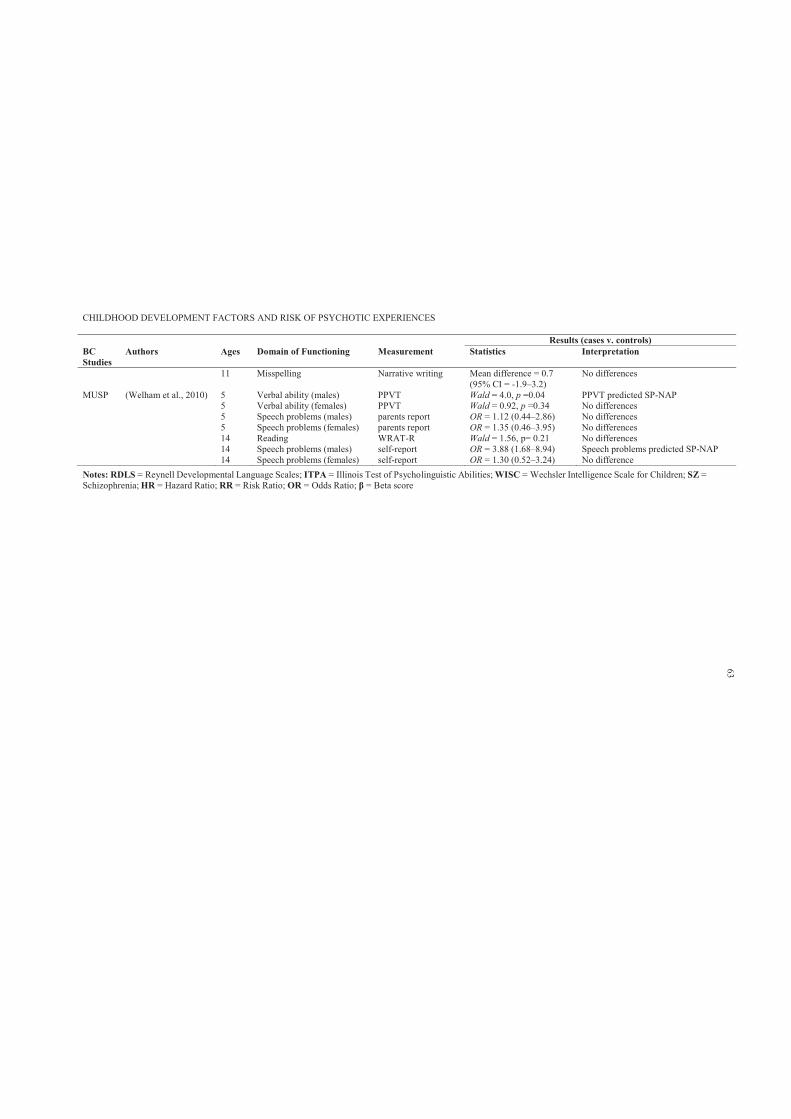
CHILDHOOD DEVELOPMENT FACTORS AND RISK OF PSYCHOTIC EXPERIENCES
Results (cases v. controls)BC Studies
Authors Ages Domain of Functioning Measurement Statistics Interpretation
11 Misspelling Narrative writing Mean difference = 0.7 (95% CI = -1.9–3.2)
No differences
MUSP (Welham et al., 2010) 5 Verbal ability (males) PPVT Wald = 4.0, p =0.04 PPVT predicted SP-NAP5 Verbal ability (females) PPVT Wald = 0.92, p =0.34 No differences 5 Speech problems (males) parents report OR = 1.12 (0.44–2.86) No differences5 Speech problems (females) parents report OR = 1.35 (0.46–3.95) No differences14 Reading WRAT-R Wald = 1.56, p= 0.21 No differences 14 Speech problems (males) self-report OR = 3.88 (1.68–8.94) Speech problems predicted SP-NAP14 Speech problems (females) self-report OR = 1.30 (0.52–3.24) No difference
Notes: RDLS = Reynell Developmental Language Scales; ITPA = Illinois Test of Psycholinguistic Abilities; WISC = Wechsler Intelligence Scale for Children; SZ =Schizophrenia; HR = Hazard Ratio; RR = Risk Ratio; OR = Odds Ratio; = Beta score
63
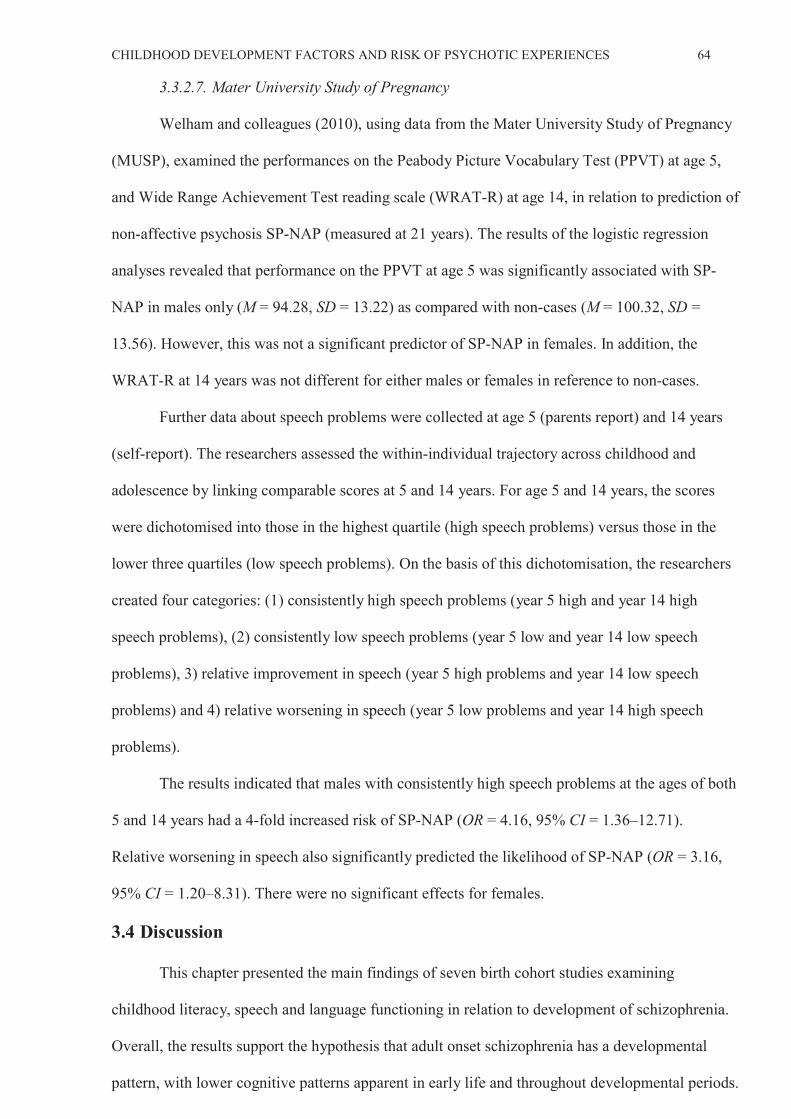
CHILDHOOD DEVELOPMENT FACTORS AND RISK OF PSYCHOTIC EXPERIENCES 64
3.3.2.7. Mater University Study of Pregnancy
Welham and colleagues (2010), using data from the Mater University Study of Pregnancy
(MUSP), examined the performances on the Peabody Picture Vocabulary Test (PPVT) at age 5,
and Wide Range Achievement Test reading scale (WRAT-R) at age 14, in relation to prediction of
non-affective psychosis SP-NAP (measured at 21 years). The results of the logistic regression
analyses revealed that performance on the PPVT at age 5 was significantly associated with SP-
NAP in males only (M = 94.28, SD = 13.22) as compared with non-cases (M = 100.32, SD =
13.56). However, this was not a significant predictor of SP-NAP in females. In addition, the
WRAT-R at 14 years was not different for either males or females in reference to non-cases.
Further data about speech problems were collected at age 5 (parents report) and 14 years
(self-report). The researchers assessed the within-individual trajectory across childhood and
adolescence by linking comparable scores at 5 and 14 years. For age 5 and 14 years, the scores
were dichotomised into those in the highest quartile (high speech problems) versus those in the
lower three quartiles (low speech problems). On the basis of this dichotomisation, the researchers
created four categories: (1) consistently high speech problems (year 5 high and year 14 high
speech problems), (2) consistently low speech problems (year 5 low and year 14 low speech
problems), 3) relative improvement in speech (year 5 high problems and year 14 low speech
problems) and 4) relative worsening in speech (year 5 low problems and year 14 high speech
problems).
The results indicated that males with consistently high speech problems at the ages of both
5 and 14 years had a 4-fold increased risk of SP-NAP (OR = 4.16, 95% CI = 1.36–12.71).
Relative worsening in speech also significantly predicted the likelihood of SP-NAP (OR = 3.16,
95% CI = 1.20–8.31). There were no significant effects for females.
3.4 Discussion
This chapter presented the main findings of seven birth cohort studies examining
childhood literacy, speech and language functioning in relation to development of schizophrenia.
Overall, the results support the hypothesis that adult onset schizophrenia has a developmental
pattern, with lower cognitive patterns apparent in early life and throughout developmental periods.
CHILDHOOD DEVELOPMENT FACTORS AND RISK OF PSYCHOTIC EXPERIENCES 65
However, since birth cohort studies apply repeated measures at different ages, there is
some inconsistency in the findings regarding the continuity of poor literacy, speech and language
skills in relation to risk of schizophrenia. The NSHD study found that children who developed
schizophrenia were not distinguishable from NCs on measures of language functioning by
adolescence (Jones et al., 1994). Similarly, the results of NCDS did not support the proposition of
continuity of language impairments and increased risk of schizophrenia; the researchers
considered such assumptions of continuity as misleading. They suggested that the observed
language impairments in individuals presenting with schizophrenia may reflect a cognitive style
of language use, rather than be indicative of language impairments or disorder (Done et al., 1998).
In addition, in this review, it is unclear whether expressive and/or receptive language is
generally affected in children who later develop schizophrenia-related conditions. For example,
the NCPP study found that childhood expressive language predicted schizophrenia-schizoaffective
disorder; whereas in the DMDS, throughout childhood, receptive rather than expressive language
predicted schizophreniform disorder at age 26 and psychotic symptoms at age 11. It has also been
suggested that those who develop schizophrenia may not necessarily have lower cognitive
functioning (Isohanni et al., 2000); rather, ‘the literature contains many reports of gifted and able
persons who later developed schizophrenia’ (Isohanni et al., 2000, p. 314). Childhood cognitive
impairments may not be a necessary condition for the development of schizophrenia. However,
extreme deviation in cognitive functioning from the norm in either direction (low/high) might
increase the risk of developing the condition (Isohanni et al., 2000).
Overall, studies have produced mixed findings on the association of literacy, speech and
language development during childhood and later incidence of schizophrenia. The positive
findings differ as to whether expressive or receptive language is the salient risk factor. Some
studies have had limited statistical power due to their small samples of cases of schizophrenia, and
there is variation in the quality of measurement, particularly the use of unstandardised measures
such as parental questionnaire and self-report. In addition, the current body of literature has
covered only a small number of the facets of speech and language development, the field of which
comprises specific language systems such as phonology (the sound system of a language), lexicon
CHILDHOOD DEVELOPMENT FACTORS AND RISK OF PSYCHOTIC EXPERIENCES 66
(word knowledge), morphology (combining units of meaning) and syntax (system of combining
words into sentences), as well as pragmatics (understanding the communicative functions of
language), sociolinguistics (understanding how language varies in different sociological contexts)
and literacy (competency in reading and writing) (Murray, O’Callaghan, Castle & Lewis, 1992;
Rapoport, Addington, Frangou & Psych, 2005). However, regardless of these limitations, the
reviewed birth cohort studies provided insights regarding the literacy, speech and language
performance of those children who developed schizophrenia in adulthood.
Since there is evidence regarding the continuity of psychotic symptoms (age 11) and
schizophreniform disorders (age 26) (Cannon et al., 2002), this thesis argues that the presence of
PEs in early adolescence is associated with similar neurocognitive, literacy, speech and language
profiles as observed in children of parents presenting with schizophrenia (HR) and children who
later develop schizophrenia (general population). When measured using well-standardised tests,
child literacy is a good candidate for investigation as a predictor of later PEs, as it provides a
general domain marker of numerous aspects of speech and language development. The
performance of a primary school aged child in literacy tasks such as spelling, reading and
comprehension will be affected by atypically developing speech or language.
There has been no previous work examining the relationship between child literacy and
early signs of PEs in adolescence. Likewise, no study has tested patterns of literacy performance
over time. Using performance over time as a predictor enables testing of whether consistently
lower levels of performance or decline in ability is the better predictor of PEs. It follows that an
examination of the childhood predictors of PEs in adolescence can provide important information
about childhood risk factors for psychotic disorders. In addition, it is argued that if childhood
literacy, speech and language performance is associated with the development of PEs in early
adolescence, then the speech and language domain of functioning can be used as a guide in
developing early preventative interventions.
However, while Chapters 2 and 3 identified the childhood neurodevelopmental domain of
functioning as associated with risk of schizophrenia, the disorder is regarded as a highly heritable
condition (Mulle, 2012). This thesis argues that susceptibility genes with strong evidence of

CHILDHOOD DEVELOPMENT FACTORS AND RISK OF PSYCHOTIC EXPERIENCES 67
association with schizophrenia will also be associated with increased risk of PEs in early
adolescence. Chapter 4 thus examines three inter-related areas relating to genetic liability to
schizophrenia.
CHILDHOOD DEVELOPMENT FACTORS AND RISK OF PSYCHOTIC EXPERIENCES 68
Chapter 4: The Genetic Liability to Schizophrenia: A Selective
Systematic Review
4.1 Introduction
In Chapters 2 and 3, both genetic high-risk and birth cohort prospective studies found that
children that later develop schizophrenia demonstrate impairments in multiple
neurodevelopmental domains of functioning. However, since schizophrenia is regarded as a
highly heritable condition (Mulla, 2012), it is necessary to understand the role of genetic factors.
In addition, it is argued that if PEs in early adolescence share similar childhood
neurodevelopmental factors with schizophrenia, then PEs could be associated with schizophrenia
susceptibility genes.
Since the literature on the genetic aspects of schizophrenia is vast, the aim of this chapter
is to conduct a selective review of studies related to the genetic liability of schizophrenia. The
results chapter of this thesis is divided into three sections. Section 4.3.1 reviews the
epidemiological rates of schizophrenia within family, twin and adoption studies. Section 4.3.2
identifies and reviews the major susceptibility genes for schizophrenia. Section 4.3.3 evaluates
some studies investigating the association of specific single nucleotide polymorphisms (SNPs)
and cognitive profiles in individuals with diagnosed schizophrenia. The findings of this review
will guide the selection and examination of potential genotypes in relation to risk of reporting PEs
in early adolescence.
4.2 Method
4.2.1 Literature search procedure.
A broad search using key terms such as ‘schizophrenia’, ‘family’, ‘twin’, ‘adoption
studies’, ‘susceptibility genes of schizophrenia’, ‘genetic variation’ and ‘cognitive profiles’ was
applied in Scopus, Medline, Pubmed, Ovid, Psychinfo and PsychLit electronic databases. These
databases were searched at the end of December 2012. Selections of some recent and relevant
CHILDHOOD DEVELOPMENT FACTORS AND RISK OF PSYCHOTIC EXPERIENCES 69
articles (English language) consistent with the aims of this chapter were reviewed. Citations from
relevant articles and review articles were also scrutinised to locate additional relevant articles,
book chapters and/or conference articles. A small number of studies were selected on the basis of
the review’s aims and objectives.
4.2.2 Inclusion and exclusion criteria.
Peer-reviewed articles were required to have (a) investigated the rate of schizophrenia in
family, twin or adoption studies, (b) examined susceptibility genes for schizophrenia and (c)
ascertained genetic variation along with cognitive domain of functioning in individuals with and
without a diagnosis of schizophrenia. For the purpose of this brief review, only a small number of
articles were selected for inclusion for each of the three areas under review.
4.3 Results
4.3.1 Epidemiological research on schizophrenia.
Epidemiological research on schizophrenia using data from family, twin and adoption
studies has found that the approximate lifetime risk of developing schizophrenia for first-degree
relatives is approximately 6% for parents, 9% for siblings, 13% for children with one parent with
schizophrenia and 46% for children with two parents presenting with schizophrenia (Faraone,
Taylor & Tsuang, 2002). Indeed, the high concordance rate of schizophrenia in monozygotic
(MZ) compared to dizygotic (DZ) twins, and the high rate of psychopathology in children of
parents presenting with psychotic disorders such as schizophrenia, adds support to the biological
explanation of schizophrenia (Faraone et al., 2002).
In a meta-analytic review of 12 twin studies of schizophrenia, Sullivan, Kendler and Neale
(2003) used a multi-group twin model to quantify estimates of the effect of genes and
environment on liability to schizophrenia. While the estimated heritability of schizophrenia was
81% (95% CI = 73–90%), MZ and DZ twin correlations (rMZ = 0.92; 95% CI = 0.91–0.94 and rDZ
= 0.52, 95% CI = 0.48–0.56) suggested the presence of both additive genetic and common
environmental effects in the etiology of schizophrenia. In line with this, Cardno and Gottesman
(2000) reported that studies conducted after 1995 have yielded concordance rates of 41–65% in
MZ pairs and 0–28% in DZ pairs, and heritability estimates of approximately 80–85% for
CHILDHOOD DEVELOPMENT FACTORS AND RISK OF PSYCHOTIC EXPERIENCES 70
schizophrenia. By comparison, Faraone and colleagues (2002) reported that Kendler reviewed the
results of twin studies and found a rate of concordance of approximately 53% for MZ pairs and
15% for DZ pairs. In a similar review, Gottesman found a concordance rate of 46% for MZ pairs
and 14% for DZ pairs.
Overall, family and twin studies conducted in European populations between 1920 and
1987 have suggested a positive correlation between family relatedness to a person diagnosed with
schizophrenia and risk of developing schizophrenia (Gottesman, 1991). In other words, the more
closely a person is genetically related to an individual with schizophrenia, the greater the risk is of
that person being diagnosed with schizophrenia. In Gottesman’s (1991) words ‘the degree of risk
correlates highly with the degree of genetic relatedness’ (p. 96).
4.3.2 Major susceptibility genes for schizophrenia.
The advent of molecular genetics has allowed researchers to apply both linkage and
association techniques to investigate the role of candidate genes in the expression of
schizophrenia. Indeed various scanning studies of chromosomal areas have linked schizophrenia
with specific genes (Mulle, 2012). Table 4.1 reports the major susceptibility genes for
schizophrenia along with gene location, studied population and relative association strength
(indicator) to schizophrenia.

CHILDHOOD DEVELOPMENT FACTORS AND RISK OF PSYCHOTIC EXPERIENCES
Table 4.1Major susceptibility genes for schizophrenia
Gene No.
Gene Name Gene Locus Studied Population Relative Strength of Association to SZa
1 NRG1 8p12–21 Icelandic, Scotland 52 DTNBP1 6p22 Ireland, Wales, Germany, Sweden, Bulgaria, USA, China, Japan 53 COMT 22q11 USA, China 44 DISC1(translocation) 1q42; 11q14.3 Japan, USA, Finland, Scotland 35 G72 13q34 French, Canada, Russia 36 RGS4 1q21 USA, India 37 GRM3 7q21–22 Scandinavian, French 38 DAAO 12q24 Germany, China, Ashkenazi Jews, USA, South Africa, UK 29 BDNF 11p13 European-American, China, Japan 1Source: compiled and adapted from Craddock, O’Donovan & Owen (2006). Genes for schizophrenia and bipolar disorder? Implications for psychiatric nosology.Schizophrenia Bulletin, 32 (1), 9–16 & Hashimoto et al. (2006). Susceptibility genes for schizophrenia. Psychiatry and Clinical Neurosciences, 60, S4–S10.
Notes: aRelative arbitrary strength of association with schizophrenia (0 to 5 as strongest); NGR1 = Neuregulin 1; DTNBP1= Dystrobrevin-binding protein 1; COMT =Catechol-O-methyltransferase; DISC1 = Disrupted in Schizophrenia 1; RGS4 = Regulator of G-protein signaling 4; GRM3 = DAAO = D-amino-acid oxidase activator;BDNF = Brain Derived Neurotrophic Factor
71
CHILDHOOD DEVELOPMENT FACTORS AND RISK OF PSYCHOTIC EXPERIENCES 72
A study based on 33 Icelandic families (110 individuals presenting with schizophrenia)
identified the Neuregulin1 (NRG1) gene (chromosome 8p22-p21) as a candidate gene for
schizophrenia (Stefansson et al., 2002). Linkage evidence supports an association between a
candidate gene on 8p12, NRG1 and schizophrenia in several European and Chinese clinical
samples (Petryshen et al., 2004).
More recently, evidence has linked two multifunctional proteins (NRG1 with Disrupted in
Schizophrenia 1 [DISC1]) in a common pathway, which may regulate neurodevelopmental
processes (e.g., progenitor cell proliferation, migration and differentiation) and contribute to
susceptibility to schizophrenia (Seshadri et al., 2010). However, based on the investigation of
variants of DISC1 in 485 Japanese individuals with schizophrenia and 660 healthy controls using
a case–control study using four candidate SNPs: rs751229, rs3738401, rs821597 and rs821616
(Hotta et al., 2011), no association was found in the Japanese population between DISC1 and
schizophrenia.
Other research has provided evidence of a linked region that harbors the dystrobrevin-
binding protein 1 (DTNBP1) gene on chromosome 6p (Bray et al., 2005; Fallgatter et al., 2010).
DTNBP1 is a protein that is involved in the modulation of glutamatergic neurotransmission in the
human brain, thereby influencing prefrontal cortex function and associated cognitive processes
(Fallgatter et al., 2010, p. 1).
Bray and colleagues (2005) conducted an allelic expression analysis using the expressed
SNP rs1047631 (located within the 30-UTR of DTNBP1). The frequency of the minor G-allele
(rs1047631) in the sample presenting with schizophrenia was 0.13. However, the common A-
allele of SNP rs1047631 showed a highly statistically significant (p < 0.0001) reduction in
expression relative to the G-allele. These findings indicate that variation in the DTNBP1 gene
confers susceptibility to schizophrenia through reduced expression of the A-allele of SNP
rs1047631.
Linkage studies have also reported catechol-O-methyltransferase (COMT) as a
susceptibility gene for schizophrenia. Physiologically, COMT is a major enzyme that eliminates
CHILDHOOD DEVELOPMENT FACTORS AND RISK OF PSYCHOTIC EXPERIENCES 73
dopamine neurotransmitters in the prefrontal cortex. A functional polymorphism of the COMT
gene, Val158Met, has been reported to affect prefrontal function, and the high-activity Val allele
has been reported to be a genetic risk factor for schizophrenia (Hashimoto et al., 2006).
The first study of the effect of COMT Val108/158Met polymorphism (rs4680) on
interpersonal distress and perceived empathy (measured by Interpersonal Reactivity Index) used a
clinical sample of 28 individuals with schizophrenia (Poletti et al., 2012). The results showed an
effect of COMT on the perceived distress subscale, with methionine Met/Met individuals
reporting lower rates of stress compared with Val/Val. Further, functional magnetic resonance
imaging during an empathy task showed an effect of genotype on empathy processing in the
anterior cingulate, with Val/Val subjects showing the lowest activation (Poletti et al., 2012).
Finally, G72 (13qlinkage region) and d-amino acid oxidase (DAAO) genes have been
reported to modulate glutamate neurotransmission, which is consistent with the glutamatergic
theory of schizophrenia (Andrea et al., 2012). These genes play a major role in neurocognitive
function and they may be altered in individuals with schizophrenia (Andrea et al., 2012;
Hashimoto et al., 2006).
4.3.3 Single nucleotide polymorphisms, cognitive profiles and schizophrenia.
4.3.3.1. Dystrobrevin-binding protein 1.
Zinkstok and colleagues (2007) investigated the association between seven SNPs in the
DTNBP1 gene and intellectual functioning in individuals with a first episode of schizophrenia or
related psychotic disorder (first-episode psychosis [FEP], n = 76), their healthy siblings (n = 31)
and unrelated controls (n = 31). Diagnosis of psychotic condition was confirmed according to
DSM-IV criteria and was based on the Mini International Neuropsychiatric Interview (MINI). All
respondents were administered the Wechsler Adult Intelligence Test—Third version (WAIS-III).
Blood was collected from all participants for DNA isolation and genetic analysis.
The IQ scores of individuals with FEP (mean verbal IQ = 89.2 ± 14.3, mean performance
IQ = 85.7 ± 13.0, mean full-scale IQ = 86.7 ± 13.8) were significantly lower than the IQ scores of
siblings (mean verbal IQ = 95.7 ± 11.1, mean performance IQ = 98.6 ± 11.4, mean full-scale IQ =
96.7 ± 11.6) and controls (mean verbal IQ = 105.6 ± 16.9, mean performance IQ = 106.4 ± 14.4,
CHILDHOOD DEVELOPMENT FACTORS AND RISK OF PSYCHOTIC EXPERIENCES 74
mean full-scale IQ = 107.0 ± 15.5) (p values <0.001). Post-hoc analyses showed that siblings’ IQ
scores were significantly lower than those of the controls (p = 0.005) and significantly higher than
those of the FEP group (p = 0.001). Further, after adjusting for age, gender, ethnicity, educational
level and family membership, three of the seven SNPs examined (rs760761, p = 0.0267;
rs2619522, p = 0.027; and rs2619538, p = 0.030) showed significant association with verbal IQ
scores in the FEP, sibling and control groups (Zinkstok et al., 2007).
A similar study by Burdick and colleagues (2007) examined the intellectual decline of 183
Caucasian individuals with schizophrenia using the Wide Range Achievement Test–Third edition,
Reading Subtest (WRAT-3). The researchers used univariate analysis of variance (ANOVA) with
DTNBP1 risk haplotype as the between subjects factor and the residual score (observed minus
predicted score) reflecting decline as the dependent variable. Haplotype groups were defined as
carriers of the CTCTAC risk haplotype (with one or two copies; n = 35) versus non-carriers of
CTCTAC (no copies; n = 148); heterozygote and homozygote carriers were merged due to the
low frequency of homozygotes (n = 4).
The results revealed that individuals presenting with schizophrenia that carried the
CTCTAC risk haplotype exhibited a significantly greater decline in IQ (residual mean change =
13.5±13.6) than cases that did not carry the risk haplotype (residual mean change = 8.7±12.4) (F =
4.00; df = 1, 182; p = 0.05). Effect size calculations indicated that the DTNBP1 genotype
accounted for 2.2% of the variance in intellectual decline (Burdick et al., 2007). Further, 45.4% of
individuals presenting with schizophrenia who demonstrated intellectual decline greater than 10
points were classified as ‘deteriorating’. In the group of deteriorating individuals with
schizophrenia, the risk haplotype had a frequency of 24%, as compared with a frequency of only
15% in the non-deteriorating group. However, this difference was not statistically significant ( 2
=2.43; p = 0.12) (Burdick et al., 2007).
Hallmayer et al. (2005) dichotomised individuals with schizophrenia into ‘cognitively
spared’ (CS) and ‘cognitive deficit’ (CD) groups using a battery of neuropsychological tests that
assessed performance over seven domains of neurocognitive functioning, and applying grade of
membership (GoM) analysis (Woodbury et al. 1978; Manton et al. 1994). GoM is a form of latent
CHILDHOOD DEVELOPMENT FACTORS AND RISK OF PSYCHOTIC EXPERIENCES 75
structure analysis, directed at defining a parsimonious number of latent groups or pattern of
responses (e.g., representing biological processes or phenotypes) from complex data sets. This
data analysis method allows individuals to resemble each group to varying degrees (rather than
classifying them into mutually exclusive clusters, as done in standard latent class analysis). The
optimal partitioning of the data by a maximum likelihood criterion showed probabilities of 80.6%
(CD) and 70.0% (CS) of being expressed in individuals with schizophrenia spectrum disorders. In
addition, the prevalence of CD was 18.9% among the relatives of individuals with schizophrenia
as compared to 2.0% among the controls, yielding a relative risk ratio of 9.5 (Hallmayer et al.,
2005).
The researchers then performed a whole genome scan, with DSM-IV diagnosis and
neurocognitive profile as a bivariate phenotype. The genotype results indicated an association
between ‘cognitive deficit’ schizophrenia (i.e., a general impairment) and a marker (D6S309) to a
20.25 cM area on chromosome 6 (6p25–22 region), close to the dysbindin gene (p = 0.01). The
researchers concluded that ‘it is the CD “cognitive deficit” schizophrenia subtype that accounts
for the linkage of schizophrenia to chromosome 6p25–24 and that the region contains a novel
susceptibility gene of relatively strong effect’ (Hallmayer et al., 2005, p. 474).
Donohoe et al. (2007) investigated the association between genotype and cognitive
performance for a dysbindin risk haplotype in a clinical sample of 52 individuals with
schizophrenia or schizoaffective disorder (24 risk haplotypes carriers versus 28 non-risk haplotype
carriers). The dysbindin ‘risk’ haplotype was derived from alleles C–A–T at SNPs P1655
(rs2619539), P1635 (rs3213207) and SNP66961 (rs2619538).
Selected subtests from the Wechsler memory scale (WMS), Cambridge Automated Test
Battery (CANTAB), Continuous Performance Test (CPT) and a simple go/no-go task were used
to assess verbal and spatial memory, working memory and attentional control, respectively
(Donohoe et al., 2007). In addition, premorbid IQ was assessed using the Wechsler Test of Adult
Reading (WTAR). The individuals with schizophrenia who carried the dysbindin risk haplotype
were compared with non-carriers on each neurocognitive measure using one-way statistical
analysis of covariance (ANCOVA), after statistically controlling for age and premorbid IQ. After
CHILDHOOD DEVELOPMENT FACTORS AND RISK OF PSYCHOTIC EXPERIENCES 76
adjusting results for the effects of age and IQ, dysbindin risk haplotype carriers showed
significantly lower spatial working memory performance than did individuals with schizophrenia
who were non-risk carriers, with genotype explaining 12% of the variance in performance (F(1,
51) = 7.39; p = .009) (Donohoe et al., 2007).
4.3.3.2. Catechol-O-methyltransferase.
Among various genes mapped to regions on chromosome 22q11 is COMT, which is an
enzyme involved in the metabolism of released dopamine (DA) (Egan et al., 2001). Egan and
colleagues (2001) investigated the effect of val108/158met polymorphism on neurocognitive
performance. In 175 individuals with schizophrenia, 219 unaffected siblings and 55 controls, the
COMT genotype was associated in ‘allele dosage fashion to performance on the Wisconsin Card
Sorting Test (WCST) of executive cognition and explained 4% of variance (p = 0.001) in
frequency of perseverative errors’ (Egan et al., 2001, p. 6917). While an ANOVA for all three
groups revealed a significant effect of the COMT genotype on WCST performance (F (2, 440) =
6.00, p = 0.003), there was no group by genotype interaction (F (4, 440) = 1.40, p = 0.23).
Further, although post-hoc analysis revealed that individuals with the Val/Val genotype performed
worse on the WCST than did those with the Val/Met and Met/Met genotypes (p < 0.002), there
was no significant genotype effect on WRAT or IQ (see Table 4.2).
In addition, while COMT genotypic effect on cognitive performance did not reach
statistical significance, the individuals with schizophrenia had a significantly lower score on
WCST (M = 37.6, SD = 12.6) than did the siblings (M = 45.2, SD = 9.5) and controls (M = 49.4,
SD = 9.0) (F (2, 440) = 29.6, p = 0.00001). Table 4.3 shows that individuals with schizophrenia
performed significantly worse on the WCT and IQ compared with the sibling and control group
(Egan et al., 2001).
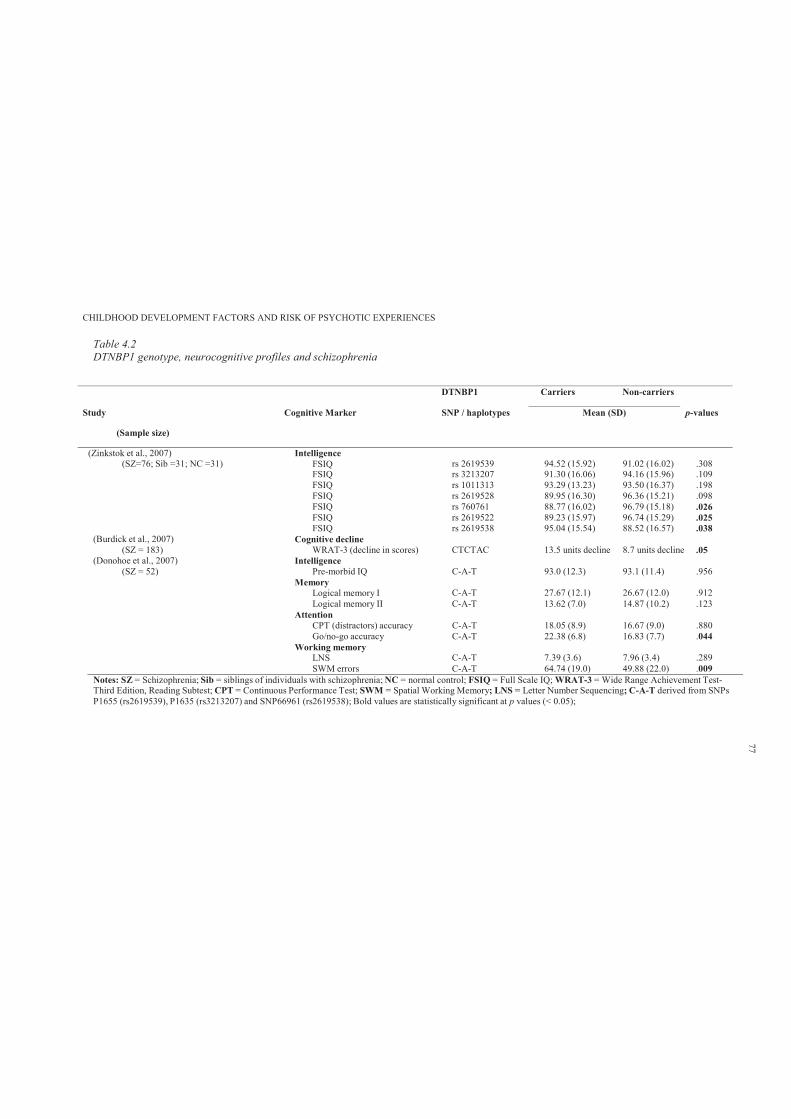
CHILDHOOD DEVELOPMENT FACTORS AND RISK OF PSYCHOTIC EXPERIENCES
Table 4.2DTNBP1 genotype, neurocognitive profiles and schizophrenia
DTNBP1 Carriers Non-carriers
Study
(Sample size)
Cognitive Marker SNP / haplotypes Mean (SD) p-values
(Zinkstok et al., 2007)(SZ=76; Sib =31; NC =31)
IntelligenceFSIQ rs 2619539 94.52 (15.92) 91.02 (16.02) .308FSIQ rs 3213207 91.30 (16.06) 94.16 (15.96) .109FSIQ rs 1011313 93.29 (13.23) 93.50 (16.37) .198FSIQ rs 2619528 89.95 (16.30) 96.36 (15.21) .098FSIQ rs 760761 88.77 (16.02) 96.79 (15.18) .026FSIQ rs 2619522 89.23 (15.97) 96.74 (15.29) .025FSIQ rs 2619538 95.04 (15.54) 88.52 (16.57) .038
(Burdick et al., 2007) Cognitive decline(SZ = 183) WRAT-3 (decline in scores) CTCTAC 13.5 units decline 8.7 units decline .05
(Donohoe et al., 2007) Intelligence(SZ = 52) Pre-morbid IQ C-A-T 93.0 (12.3) 93.1 (11.4) .956
MemoryLogical memory I C-A-T 27.67 (12.1) 26.67 (12.0) .912Logical memory II C-A-T 13.62 (7.0) 14.87 (10.2) .123
AttentionCPT (distractors) accuracy C-A-T 18.05 (8.9) 16.67 (9.0) .880Go/no-go accuracy C-A-T 22.38 (6.8) 16.83 (7.7) .044
Working memoryLNS C-A-T 7.39 (3.6) 7.96 (3.4) .289SWM errors C-A-T 64.74 (19.0) 49.88 (22.0) .009
Notes: SZ = Schizophrenia; Sib = siblings of individuals with schizophrenia; NC = normal control; FSIQ = Full Scale IQ; WRAT-3 = Wide Range Achievement Test-Third Edition, Reading Subtest; CPT = Continuous Performance Test; SWM = Spatial Working Memory; LNS = Letter Number Sequencing; C-A-T derived from SNPsP1655 (rs2619539), P1635 (rs3213207) and SNP66961 (rs2619538); Bold values are statistically significant at p values (< 0.05);
77
CHILDHOOD DEVELOPMENT FACTORS AND RISK OF PSYCHOTIC EXPERIENCES 78
Further, Woodward and colleagues (2007) revealed the association between COMT
val108/158met genotype, cognitive function and cognitive improvement with clozapine. Individuals
with schizophrenia (n = 86) were genotyped for the COMT val108/158met SNP after completing a
cognitive battery consisting of tests of attention, working memory, verbal learning and memory,
executive function and verbal fluency at baseline and after 6 weeks and 6 months of treatment
with clozapine. The results revealed a significant main effect of time on global cognitive score (F
(2, 95) = 3.43, p < .037), attention and verbal fluency domain (F (2, 96) = 26.44, p < .001), which
confirmed the direction of improved performance over time.
In addition, a significant interaction effect was found between the COMT genotype and
improvement on the attention and verbal fluency domain score (F (4, 96) = 2.78, p < .032).
Follow-up contrasts within the attention and verbal fluency domain indicated that both the
Met/Met (Met homozygous) and Val/Met (heterozygous) groups demonstrated better performance
at the 6 month assessment as compared to the Val/Val group (t (96) = 2.48, p < .016; and t (96) =
3.84, p < .001, respectively), after controlling for baseline performance (Woodward et al., 2007).
Similarly, post-hoc analyses showed that relative to Val/Val, the Met/Met and Val/Met groups had
higher Controlled Oral Word Association Test scores at both the 6 week (t (99) = 3.45, p < .001;
and t (99) = 2.45, p < .017, respectively) and 6 month evaluations (t (99) =3.36, p < .002; and t
(99) = 4.24, p < .001, respectively).
Further, Bilder et al. (2002) investigated the effects of the COMT Val158 Met
polymorphism in 58 individuals with schizophrenia. These individuals completed a battery of 15
neurocognitive tests, to produce four reliable neurocognitive domain scores, based on principal
component analysis. These domains were general executive and perceptual organisation,
declarative verbal learning and memory, processing speed and attention, and simple motor speed.
Bilder and colleagues examined the effects of genotype on these four domains and found that the
Met allele was significantly associated with better performance in the processing speed and
attention domain ( 2 (1) = 6.26, p = .0124), but not with the other three neurocognitive domain
scores. Approximately 11% of the variation in processing speed and attention scores was
accounted for by genotype.
CHILDHOOD DEVELOPMENT FACTORS AND RISK OF PSYCHOTIC EXPERIENCES 79
Szoke and colleagues’ (2006) study aimed to replicate previous research findings
supporting the significant effect of the COMT genotype on executive functioning in individuals
with schizophrenia (n = 66), bipolar (n = 94) and relatives and controls (n = 158). This study
examined the effect of one functional polymorphism of the COMT gene and two polymorphisms
of the NET gene on executive function, assessed by the Trail Making Test and the Wisconsin
Card Sorting Test. The COMT and NET genotype results showed no significant effect on any of
the executive functions (see Table 4.3).
A similar study by Rosa and colleagues (2004) attempted to replicate the findings of
previous studies suggesting the significant effect of Val158Met in the COMT gene on prefrontal
cognitive functions. Eighty-nine sibling pairs discordant for psychosis were genotyped for COMT
polymorphism and completed the WCST. As expected, individuals presenting with schizophrenia
demonstrated a higher number of perseverative errors on the WCST compared with their
unaffected siblings (t (88) = 3.2, p = 0.001). However, in the group of individuals with
schizophrenia, the ANOVA did not detect any significant association between the COMT
genotype and WCST (F (2, 84) = 0.9, p = 0.40). This study did not provide support for the role of
Val158Met polymorphism in the risk for schizophrenia-related disorders.
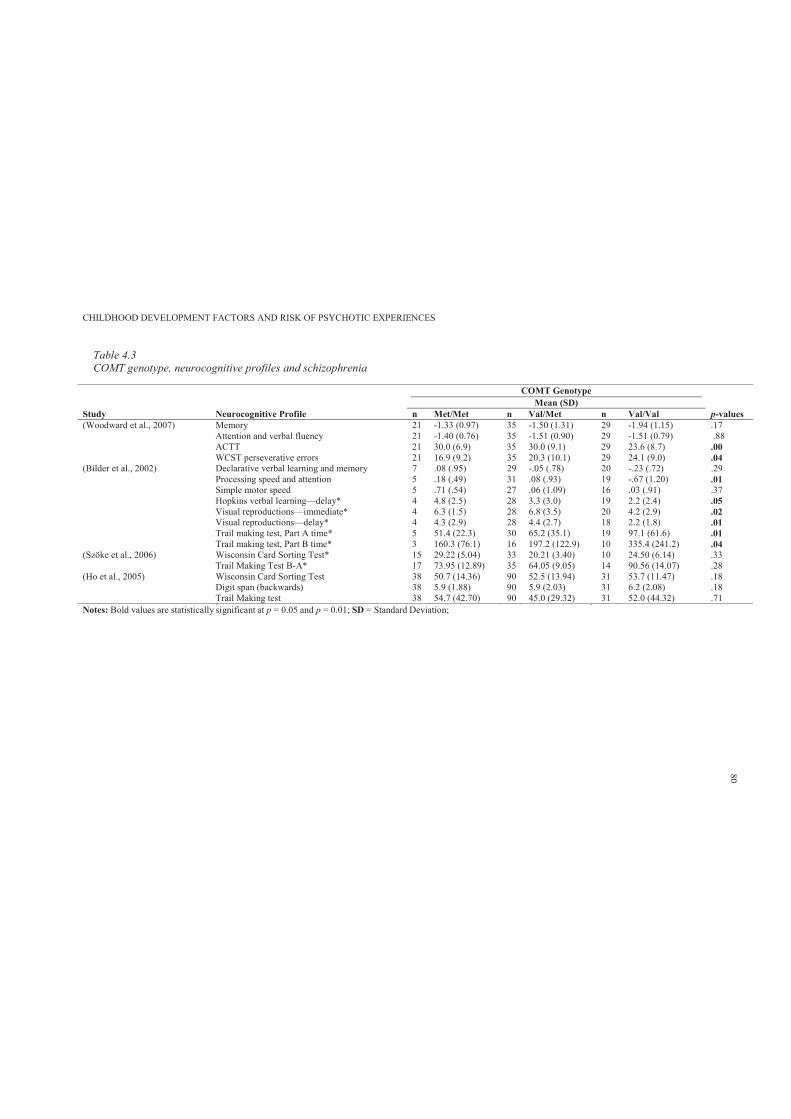
CHILDHOOD DEVELOPMENT FACTORS AND RISK OF PSYCHOTIC EXPERIENCES
Table 4.3COMT genotype, neurocognitive profiles and schizophrenia
COMT GenotypeMean (SD)
Study Neurocognitive Profile n Met/Met n Val/Met n Val/Val p-values(Woodward et al., 2007) Memory 21 -1.33 (0.97) 35 -1.50 (1.31) 29 -1.94 (1.15) .17
Attention and verbal fluency 21 -1.40 (0.76) 35 -1.51 (0.90) 29 -1.51 (0.79) .88ACTT 21 30.0 (6.9) 35 30.0 (9.1) 29 23.6 (8.7) .00WCST perseverative errors 21 16.9 (9.2) 35 20.3 (10.1) 29 24.1 (9.0) .04
(Bilder et al., 2002) Declarative verbal learning and memory 7 .08 (.95) 29 -.05 (.78) 20 -.23 (.72) .29Processing speed and attention 5 .18 (.49) 31 .08 (.93) 19 -.67 (1.20) .01Simple motor speed 5 .71 (.54) 27 .06 (1.09) 16 .03 (.91) .37Hopkins verbal learning—delay* 4 4.8 (2.5) 28 3.3 (3.0) 19 2.2 (2.4) .05Visual reproductions—immediate* 4 6.3 (1.5) 28 6.8 (3.5) 20 4.2 (2.9) .02Visual reproductions—delay* 4 4.3 (2.9) 28 4.4 (2.7) 18 2.2 (1.8) .01Trail making test, Part A time* 5 51.4 (22.3) 30 65.2 (35.1) 19 97.1 (61.6) .01Trail making test, Part B time* 3 160.3 (76.1) 16 197.2 (122.9) 10 335.4 (241.2) .04
(Szöke et al., 2006) Wisconsin Card Sorting Test* 15 29.22 (5.04) 33 20.21 (3.40) 10 24.50 (6.14) .33Trail Making Test B-A* 17 73.95 (12.89) 35 64.05 (9.05) 14 90.56 (14.07) .28
(Ho et al., 2005) Wisconsin Card Sorting Test 38 50.7 (14.36) 90 52.5 (13.94) 31 53.7 (11.47) .18Digit span (backwards) 38 5.9 (1.88) 90 5.9 (2.03) 31 6.2 (2.08) .18Trail Making test 38 54.7 (42.70) 90 45.0 (29.32) 31 52.0 (44.32) .71
Notes: Bold values are statistically significant at p = 0.05 and p = 0.01; SD = Standard Deviation;
80
CHILDHOOD DEVELOPMENT FACTORS AND RISK OF PSYCHOTIC EXPERIENCES 81
The study by Ho and colleagues (2005) examined the effect of the COMT genotype on (a)
WSCT, digit span backward, Trail Making and N-back tests, and (b) MRI frontal brain volumes.
There were 159 individuals with schizophrenia and 84 NCs. The socio- demographic analysis of
the sample revealed that a significantly greater proportion of individuals with schizophrenia were
males (74.24%). The study found that individuals with schizophrenia had less years of education
than did the controls (t (241) = 8.51, p <0.0001), and lower Full-Scale IQ (t (241) = 11.01, p <
0.0001). While it was found that individuals with schizophrenia had significantly lower WCST
scores (M = 52.3, SD = 13.56) than did the healthy controls (M = 56.6, SD = 11.10; main effect of
group, F (1,243) = 5.14, p = 0.02), there were no significant genotype effects on WCST. The
results also showed a similar non-significant genotype effect on digit span and Trail Making Test
(Ho et al., 2005). In addition, there were no statistically significant effects of the COMT genotype
and frontal lobe morphology (F’s < 1.43, df =2,148, p’s > 0.24).
4.4 Discussion
This chapter presented a selective review of three inter-related areas regarding genetic
liability to schizophrenia. It reviewed the epidemiological rate of schizophrenia within family,
twin and adoption studies. Further, it reviewed major susceptibility genes for schizophrenia. It
also included some studies ascertaining the effect of DTNBP1 and COMT SNPs with cognitive
profiles in individuals presenting with schizophrenia.
Although the reviewed studies regarding the epidemiological rate of schizophrenia within
families suggest that the MZ twin concordance rate is approximately 50%, the remaining
percentage may be due to non-genetic or other factors. Nieratschker and colleagues (2010) have
stated that ‘beside genetic factors, environmental factors are also involved in the etiology of the
disease’ (p. 1). In addition, although the role of genetics in the development of schizophrenia is a
well-supported finding, no study to date has confirmed genetics as the sole factor in the onset of
schizophrenia. Every study aimed to ascertain the genetic imprints in the etiology of schizophrenia
have also considered the potential role of external factors.
The neurodevelopmental model of schizophrenia considers the cognitive heterogeneity and
impairments in schizophrenia as the expression of prenatal abnormalities resulting from the
CHILDHOOD DEVELOPMENT FACTORS AND RISK OF PSYCHOTIC EXPERIENCES 82
interaction of genetic and environmental factors. Indeed Zinkstok and colleagues (2007)
recommended future research focus on the assessment of the complex genetic background of
cognitive phenotypes in schizophrenia, including the involvement of multiple susceptibility genes
and gene–environmental interactions. It was further recommended that researchers use multiple
combinations of research techniques for measuring cognitive phenotypes, such as by acquiring
functional brain images during neuropsychological testing. This may ‘improve reliability and
resolution of cognitive phenotypes in schizophrenia, thereby increasing power for molecular
genetic studies’ (Zinkstok et al., 2007, p. 7).
Szöke and colleagues (2006) mentioned that the inconsistencies in genotypic effect on
cognitive variation may be accounted for by: a) false negative results due to low statistical power,
b) false positive results or c) true genetic variability (p. 7). However, despite the inconsistencies in
results, the analysis of more complex interaction models of cognitive endophenotypes and
candidate genes may lead to more consistent positive results (Szöke et al., 2006).
So far, this thesis has reviewed longitudinal high-risk (see Chapter 2), birth cohort studies
(see Chapter 3) and genetic liability to schizophrenia (see Chapter 4). The literature on the
neurodevelopmental indicators of schizophrenia has found consistent findings related to subtle
neurocognitive, psychological and psychomotor differences in children who later developed
schizophrenia. Further, genetic studies of schizophrenia have provided evidence (ranging from
weak to moderate) for associations of SNPs with both specific and general subtle cognitive
impairments. However, the findings of genetic studies are not consistent. Failures to replicate
findings are a major limitation. Further, this review did not explore non-familial genetic risk in
schizophrenia. This may include de novo mutations including rare duplications and deletions.
Lack of consistency across these genetic studies is a major limitation pertaining to genetic liability
of schizophrenia.
Despite this, given the accumulated research evidence indicating the presence of PEs in
the general population (see Chapter 1), this thesis argues that if PEs represent an early expression
of later vulnerability to adult schizophrenia, they will share similar endophenotypes and
developmental risk factors with schizophrenia. Further, guided by genetic aspects of

CHILDHOOD DEVELOPMENT FACTORS AND RISK OF PSYCHOTIC EXPERIENCES 83
schizophrenia, PEs should also be associated with a selection of known genetic markers for
schizophrenia.
This thesis aims to contribute to the understanding of PEs and their relation to known
childhood developmental indicators of schizophrenia. However, before presenting a series of
empirical studies, Chapter 5 introduces the ALSPAC, which has been used as the data source for
this research. Specifically, the following chapter reviews all ALSPAC published studies that have
presented finding using PEs in early adolescence as the main outcome variable. Chapter 5
concludes by briefly commenting on the gaps in the literature, which are subsequently addressed
in the empirical studies in Chapters 7–12.
CHILDHOOD DEVELOPMENT FACTORS AND RISK OF PSYCHOTIC EXPERIENCES 84
Chapter 5: Childhood Developmental Factors and Risk of Non-
Clinical Psychotic-Like Symptoms in 12-Year-Olds: A Systematic
Review of All ALSPAC Studies
5.1 Introduction
The ALSPAC is a population-based, pre-birth cohort (Golding, 1990), and is also known
as ‘Children of the Nineties’ (Golding, 2004). This study was conducted at the University of
Bristol in the UK, and was the result of five years of planning and piloting (Golding, 2004;
Pembrey, 2004). The overall objectives of the study were to understand the developmental
pathways in which physical and social environments interact over time with genetic inheritance to
affect health, behaviour and development in infancy, childhood and then into adulthood (Golding,
1990, 2004).
The ALSPAC study recruited pregnant women with expected dates of delivery between 1
April 1991 and 31 December 1992 from the Avon area, which is approximately 120 miles west of
London. The Avon area (total population 1 million) includes Bristol as a major city, with a
population of 0.5 million, and its surrounding small towns, villages and farming communities. The
Avon area was chosen as it had the advantage of being a defined geographic area with services
centralised around Bristol (Golding, 1990). Further, it had a relatively low level of outward
migration and a mixture of different social backgrounds, housing types and urban and rural areas
comparable to those in the rest of the UK (Golding, 1990).
The ALSPAC participating families have provided a substantial amount of genetic and
environmental information over the years. This significant resource has assisted researchers from
all over the world to investigate a wide range of health outcomes. Currently, ALSPAC studies are
presenting findings using PEs or psychotic-like symptoms (PLIKS)7 in early adolescence as the
7PLIKS is an equivalent term to PEs. However, due to all previously published studies having used the term
CHILDHOOD DEVELOPMENT FACTORS AND RISK OF PSYCHOTIC EXPERIENCES 85
main outcome variable.
The aim of this chapter is to review8 all ALPSAC published studies that have presented
findings using PLIKS as the main outcome variable. This chapter concludes by briefly
commenting on the gaps in the literature, which will then be addressed in the subsequent
empirical studies.
5.2 Method
5.2.1 Literature search procedure.
Key terms such as ‘non-clinical psychotic like symptoms’, ‘psychotic experiences’ and
‘ALSPAC birth cohort’ were applied in Scopus, Medline, Pubmed, Ovid, Psychinfo and PsychLit
electronic databases. These databases were searched at the end of February 2012. Potentially
relevant articles (English language) were reviewed. Citations from relevant articles were
scrutinised to locate additional relevant articles. Additional searches were undertaken in the
published list of ALSPAC studies since the early 1990s (www.alpac.bris.ac.uk) to locate studies
with PLIKS as an outcome variable.
5.2.2 Inclusion and exclusion criteria.
In this review, it was required that studies were (a) using data from ALSPAC and (b) had
PLIKS as the outcome variable. Eleven published studies fulfilled the inclusion criteria. The
included studies examined various maternal and childhood factors in relation to risk of PLIKS.
The findings were categorised into common themes. The social cognitive domain/theme referred
to studies examining childhood emotion recognition, intellectual profiles, attributional style and
autistic traits and risk of PLIKS. The study of childhood bullying and PEs was categorised as the
peer victimisation domain. Further, maternal adverse events during pregnancy, folate deficiency,
analgesics and drugs exposures and fetal physical growth were categorised as prenatal factors and
risk of PLIKS. Finally, family history of schizophrenia was reviewed in relation to PLIKS.
PLIKS, this term will also be used in this chapter to mean both PLIKS and PEs.
8Hameed, M. A., Lewis, A., Zammit, S., & Lewis, G (2013). Childhood developmental factors and risk of non-
clinical psychotic-like symptoms in 12-year-olds: A systematic review of all ALSPAC studies. Manuscript in
preparation
CHILDHOOD DEVELOPMENT FACTORS AND RISK OF PSYCHOTIC EXPERIENCES 86
5.3 Results
5.3.1 Overview of the Avon Longitudinal Study of Parents and Children.
The ALSPAC is a population-based, pre-birth cohort recruited from all pregnant women
resident in three former (Avon) Health Districts with an expected date of delivery between 1 April
1991 and 31 December 1992. The cohort has been described in detail previously (Golding, 2004;
Pembrey, 2004). The ALSPAC birth cohort consists of 14 541 pregnancies that resulted in 14 062
live births; 13 988 infants were still alive at 1 year. The ALSPAC aimed to examine and
understand the multiple physical, psychological, cognitive and social factors that may interact
over time with genetic inheritance to affect health, behaviour and development in infancy,
childhood and then into adulthood (Golding, 2004).
Parents of the study children have been completing regular postal questionnaires about
their child’s health and development since birth. In addition, all the children have been invited to
attend annual assessment clinics since the age of 7 years. At these clinics, various psychological
and physical assessments were conducted through face-to-face interviews. As part of the annual
ALSPAC assessment clinic at mean age 12.9 (95% CI = 12.5–13.3 years), 6790 children (44.6%
of the original sample) completed the PLIKS interview. To date, the ALSPAC birth cohort study
has published findings on the association of various childhood and maternal factors in relation to
risk of PLIKS.
5.3.2 Outcome variable: Psychotic-like symptoms.
PLIKS were measured at the ALSPAC clinic using the PLIKS semi-structured face- to-
face interview. The PLIKS interview consisted of 12 core items covering the past 6 month’s
occurrence of hallucinations (visual and auditory); delusions (delusions of being spied on,
persecution, thoughts being read, reference, control, grandiose ability and other unspecified
delusions); and experiences of thought interference (thought broadcasting, insertion and
withdrawal).
For these core items, seven stem questions were derived from the Diagnostic Interview
Schedule for Children–IV (DISC–IV) and 5 stems from sections 17–19 of the Schedules for
Clinical Assessment in Neuropsychiatry version 2.0 (SCAN 2.0), modified slightly after piloting.
CHILDHOOD DEVELOPMENT FACTORS AND RISK OF PSYCHOTIC EXPERIENCES 87
The PLIKS interview started with an introductory set of questions on sleep (nightmares, night
terrors and sleepwalking) to accustom the child to probes for unusual experiences, and then
proceeded with the 12 core questions.
The coding of all items followed the glossary definitions, assessment and rating rules set
out for SCAN. The items were assessed as not present, suspected or definitely present with an
average value of inter-rater reliability of 0.72 (Horwood et al., 2008). This review presents the
results of a common classification of PLIKS in all studies defined as broad category ‘suspected or
definite’ (13.7%, n = 881, 95% CI = 12.8–14.5) in comparison to PLIKS not present. (Chapter 7
provides detailed descriptive statistics of, for example, the sample, participant characteristics and
frequency of PLIKS core components).
5.3.3 Childhood social cognitive profiles and risk of PLIKS.
5.3.3.1. Emotion recognition.
Thompson and colleagues (2011) investigated the association between childhood facial
emotion recognition accuracy and PLIKS in early adolescence. Facial emotion recognition was
assessed at age 8 years in the cohort by the Diagnostic Analysis of Non- Verbal Accuracy
(DANVA). Controlling for confounding variables (e.g., socio- demographics, child’s IQ and
childhood psychiatric disorder), the result of the study revealed no significant increase in
likelihood of reporting any PLIKS, either in relation to the total DANVA error score or for the
error scores for the individual emotions of fear, sadness, anger and happiness.
However, the children with high total DANVA error scores had a lower IQ (M = 99.4, SD
= 17.6) than did the children with low total DANVA error scores (M = 105.7, SD = 15.7); the
odds ratio of this difference was statistically significant (OR = 0.98; 95% CI = 0.97–0.98, p <
0.001). Contrary to that study’s research hypothesis and the previous findings reported in the
literature, poor facial emotion recognition at age 8 was not associated with an increased risk of
PLIKS in early adolescence (Thompson, Sullivan, Heron et al., 2011).
5.3.3.2. Intellectual profile.
The study by Horwood and colleagues (2008) focused on the association of IQ scores
measured by WISC-III at age eight and PLIKS at age 12. The data revealed that lower IQ score
CHILDHOOD DEVELOPMENT FACTORS AND RISK OF PSYCHOTIC EXPERIENCES 88
was more frequent in children with low birth weight, whose mothers were of manual social class
(UK classification), had less education and who lived in renting households in single-parent
families. In addition, low IQ was more common in children who were victims of bullying and
whose mothers reported higher Strengths and Difficulties Questionnaire (SDQ) scores.
The researchers of this study adjusted the results for confounding variables such as social
class, housing tenure, gender, birth weight, family composition, maternal education, urban/rural
residence, family history of psychiatric disorder, bullying (overt and relative) and Strengths and
Difficulties Questionnaire total score (Horwood and colleagues, 2008). After adjustment, the
results showed a non-linear association between IQ score and PLIKS, such that only the children
with below average IQ scores had an increased risk of reporting symptoms. An IQ score of less
than 79 was associated with an 55% increase in the risk of reporting PLIKS after adjusting for the
confounding variables (adjusted OR = 1.55, 95% CI =1.00–2.39).
The researchers also independently examined the association of verbal and performance
IQ with PLIKS. The results showed a correlation of 0.50 between verbal and performance IQ
scores. There was a stronger association between verbal IQ and PLIKS even after adjustment for
performance IQ scores (verbal IQ score linear term, OR=0.60, 95% CI = 0.38–0.95), but no
association between PLIKS and performance IQ score after adjustment for verbal IQ
(performance IQ, OR=0.86, 95% CI = 0.55–1.34). According to these findings, verbal IQ
appeared to be more important than performance IQ in relation to risk of reported PLIKS
(Horwood et al., 2008).
5.3.3.3. Attribution style.
Thompson and colleagues (2011) examined the association between locus of control
(LOC) assessed at age 8 years (using Childhood Nowicki-Strickland Internal External
questionnaire) and likelihood of reporting PLIKS in early adolescence. The statistical analyses
were adjusted for a range of socio-demographic variables, including child’s ethnic background,
parental social class based on the higher of the mother or partner’s occupational social class (using
the 1991 Office of Population Census and Statistics [OPCS] classification; Office of Population
Censuses and Surveys, 1991 and dichotomised into manual and non-manual) and
CHILDHOOD DEVELOPMENT FACTORS AND RISK OF PSYCHOTIC EXPERIENCES 89
maternal/paternal education (O-level or more v. less than O level, where O levels were the
standard school-leaving qualifications, taken around age 16 years in the UK). In addition, child’s
IQ at age 8 was considered as a potential covariate.
The adjusted logistic regression results revealed that externalised LOC was associated with
an increased risk of reporting suspected or definite PLIKS (OR = 1.77, 95% CI = 1.50–2.10, p =
.001). The findings of this study provided support for externalised attribution bias as a potential
vulnerability marker for psychosis. However, it is not clear whether this is specific to a particular
psychotic symptom or a general cognitive risk factor for all psychotic symptoms.
5.3.3.4. Autistic traits.
The aim of the study conducted by Bevan Jones and colleagues (2012) was to assess
whether children with early autistic traits (social interaction and communication problems, and
restricted, repetitive interests and behaviours) were more likely to report PLIKS. In this study, the
primary predictor variable was autistic traits in children aged 7 to 8 years (assessed using the
Development and Well-Being Assessment [DAWBA] Parent Interview. Specifically, the
researchers focused on the presence of these traits before the age of 3 years that were still present
at the ages of 7 and 8 years. Table 5.1 shows an increase in the odds of having suspected or
definite PLIKS in children whose mothers expressed concerns about their speech development
problems at 3 years of age (adjusted OR = 1.58, 95% CI = 1.19–2.10).
However, early maternal concerns about ritualistic behaviours and social interactions were
not a significant predictor of PLIKS. These results marginally changed when adjusting for
potential socio-demographic variables (e.g., parental social class, income support, education and
housing).
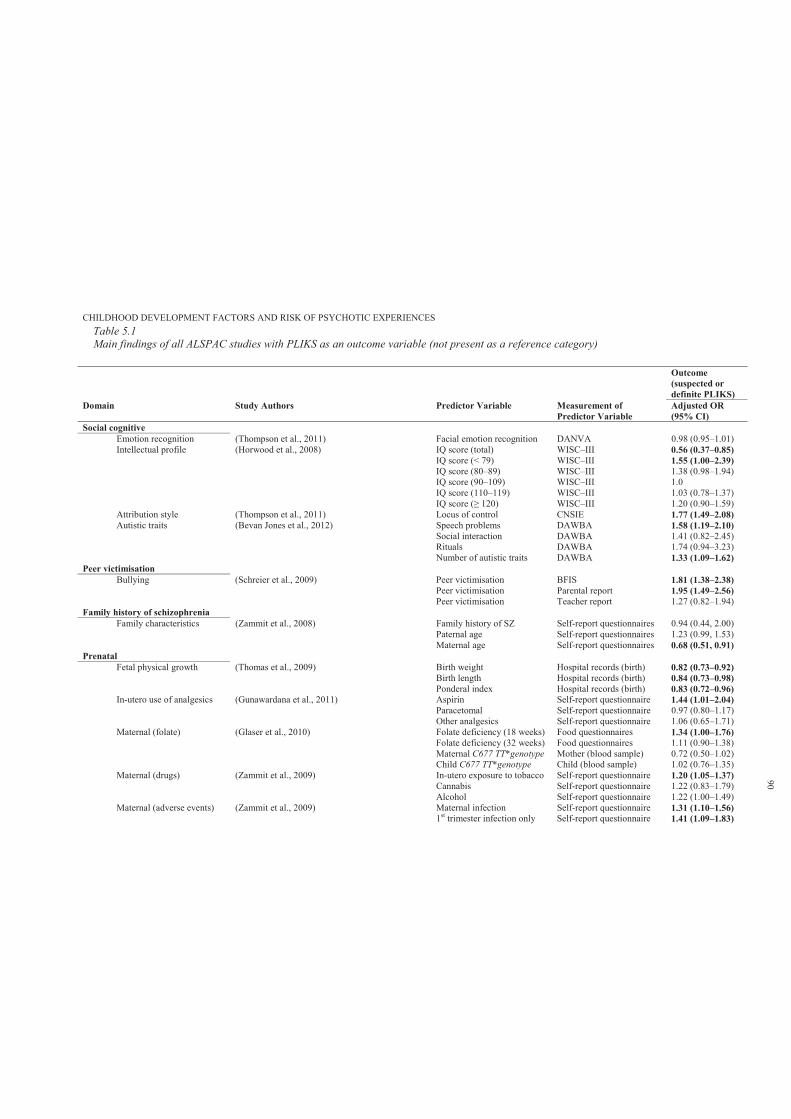
CHILDHOOD DEVELOPMENT FACTORS AND RISK OF PSYCHOTIC EXPERIENCESTable 5.1Main findings of all ALSPAC studies with PLIKS as an outcome variable (not present as a reference category)
Outcome (suspected or definite PLIKS)
Domain Study Authors Predictor Variable Measurement of Predictor Variable
Adjusted OR (95% CI)
Social cognitiveEmotion recognition (Thompson et al., 2011) Facial emotion recognition DANVA 0.98 (0.95–1.01)Intellectual profile (Horwood et al., 2008) IQ score (total) WISC–III 0.56 (0.37–0.85)
IQ score (< 79) WISC–III 1.55 (1.00–2.39)IQ score (80–89) WISC–III 1.38 (0.98–1.94)IQ score (90–109) WISC–III 1.0IQ score (110–119) WISC–III 1.03 (0.78–1.37)
WISC–III 1.20 (0.90–1.59)Attribution style (Thompson et al., 2011) Locus of control CNSIE 1.77 (1.49–2.08)Autistic traits (Bevan Jones et al., 2012) Speech problems DAWBA 1.58 (1.19–2.10)
Social interaction DAWBA 1.41 (0.82–2.45)Rituals DAWBA 1.74 (0.94–3.23)Number of autistic traits DAWBA 1.33 (1.09–1.62)
Peer victimisationBullying (Schreier et al., 2009) Peer victimisation BFIS 1.81 (1.38–2.38)
Peer victimisation Parental report 1.95 (1.49–2.56)Peer victimisation Teacher report 1.27 (0.82–1.94)
Family history of schizophrenia Family characteristics (Zammit et al., 2008) Family history of SZ Self-report questionnaires 0.94 (0.44, 2.00)
Paternal age Self-report questionnaires 1.23 (0.99, 1.53)Maternal age Self-report questionnaires 0.68 (0.51, 0.91)
PrenatalFetal physical growth (Thomas et al., 2009) Birth weight Hospital records (birth) 0.82 (0.73–0.92)
Birth length Hospital records (birth) 0.84 (0.73–0.98)Ponderal index Hospital records (birth) 0.83 (0.72–0.96)
In-utero use of analgesics (Gunawardana et al., 2011) Aspirin Self-report questionnaire 1.44 (1.01–2.04)Paracetomal Self-report questionnaire 0.97 (0.80–1.17)Other analgesics Self-report questionnaire 1.06 (0.65–1.71)
Maternal (folate) (Glaser et al., 2010) Folate deficiency (18 weeks) Food questionnaires 1.34 (1.00–1.76)Folate deficiency (32 weeks) Food questionnaires 1.11 (0.90–1.38)Maternal C677 TT*genotype Mother (blood sample) 0.72 (0.50–1.02)Child C677 TT*genotype Child (blood sample) 1.02 (0.76–1.35)
Maternal (drugs) (Zammit et al., 2009) In-utero exposure to tobacco Self-report questionnaire 1.20 (1.05–1.37)Cannabis Self-report questionnaire 1.22 (0.83–1.79)Alcohol Self-report questionnaire 1.22 (1.00–1.49)
Maternal (adverse events) (Zammit et al., 2009) Maternal infection Self-report questionnaire 1.31 (1.10–1.56)1st trimester infection only Self-report questionnaire 1.41 (1.09–1.83)
90
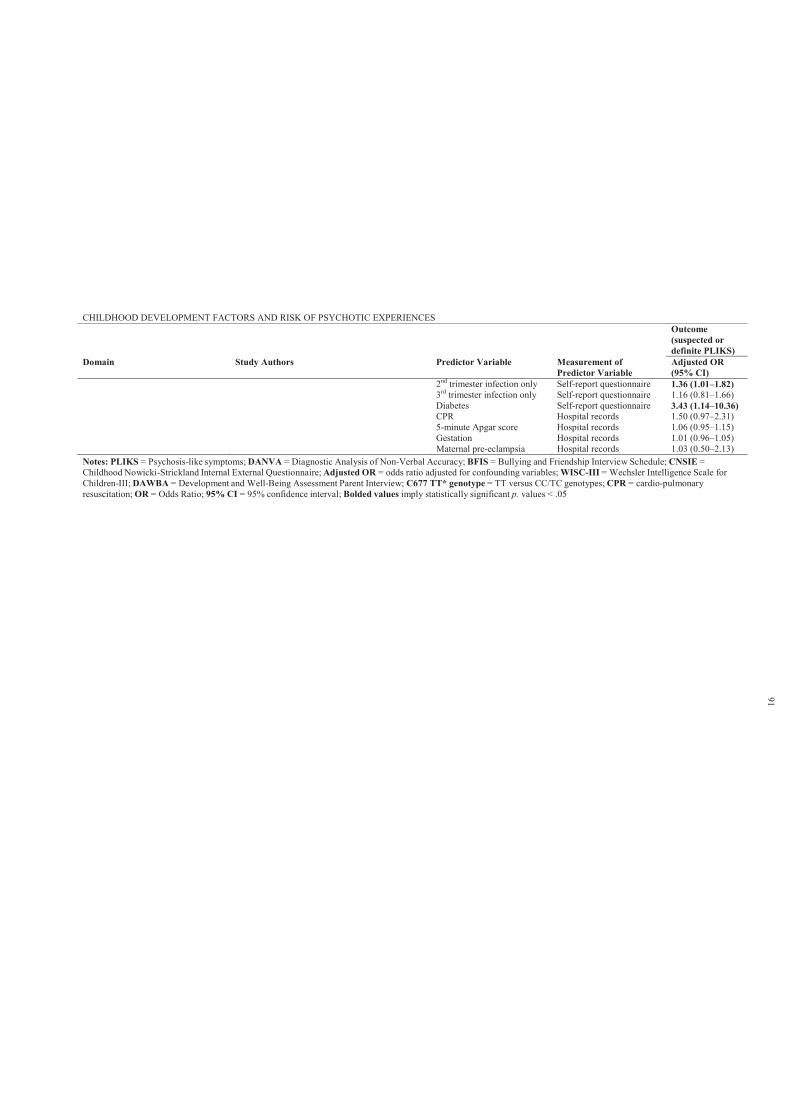
CHILDHOOD DEVELOPMENT FACTORS AND RISK OF PSYCHOTIC EXPERIENCESOutcome (suspected or definite PLIKS)
Domain Study Authors Predictor Variable Measurement of Predictor Variable
Adjusted OR (95% CI)
2nd trimester infection only Self-report questionnaire 1.36 (1.01–1.82)3rd trimester infection only Self-report questionnaire 1.16 (0.81–1.66)Diabetes Self-report questionnaire 3.43 (1.14–10.36)CPR Hospital records 1.50 (0.97–2.31)5-minute Apgar score Hospital records 1.06 (0.95–1.15)Gestation Hospital records 1.01 (0.96–1.05)Maternal pre-eclampsia Hospital records 1.03 (0.50–2.13)
Notes: PLIKS = Psychosis-like symptoms; DANVA = Diagnostic Analysis of Non-Verbal Accuracy; BFIS = Bullying and Friendship Interview Schedule; CNSIE =Childhood Nowicki-Strickland Internal External Questionnaire; Adjusted OR = odds ratio adjusted for confounding variables; WISC-III = Wechsler Intelligence Scale forChildren-III; DAWBA = Development and Well-Being Assessment Parent Interview; C677 TT* genotype = TT versus CC/TC genotypes; CPR = cardio-pulmonaryresuscitation; OR = Odds Ratio; 95% CI = 95% confidence interval; Bolded values imply statistically significant p. values < .05
91
CHILDHOOD DEVELOPMENT FACTORS AND RISK OF PSYCHOTIC EXPERIENCES 92
5.3.4 Childhood peer victimisation and risk of PLIKS.
5.3.4.1. Bullying.
Schreier and colleagues (2009) investigated whether peer victimisation is associated with
increased risk of reporting PLIKS. According to previous definitions, the researchers defined peer
victimisation as when a student is exposed to negative actions by other students with the intention
to hurt. Bullying as a repeated action over time involves an imbalance in either real or perceived
power. The Bullying and Friendship Interview Schedule was administered when the child was at 8
and 10 years of age. In addition, parents and teachers reported peer victimisation in a single item
included in the Strengths and Difficulties Questionnaire. The risk of PLIKS was found to increase
about 2-fold (OR =1.94; 95% CI = 1.54–2.44) among victims of bullying at ages 8 and/or 10
years. This result was adjusted for prior psychopathology, family adversity or child’s IQ.
In comparison, when using mother and teacher reports of child victimisation, the
associations was stronger (OR = 4.60; 95% CI = 3.24–6.50) when victimisation was chronic or
severe. These finding support the hypothesis that childhood bullying victimisation (at age 8 and
10) is a moderate to strong predictor of PLIKS at early adolescence (age 12.9 years).
5.3.5 Prenatal factors and risk of PLIKS.
5.3.5.1. Maternal (adverse events).
The neurodevelopmental model of schizophrenia proposes that ‘neural insults from
embryonic development through childhood and adolescence all play a causal role in the onset of
this disorder’ (Zammit et al., 2009, p. 4). Zammit and colleagues (2009) investigated whether
adverse events during pregnancy (maternal infection, diabetes or pre- eclampsia) and fetal early
development (gestational age, perinatal cardio-pulmonary resuscitation or 5-minute Apgar score)
were associated with risk of PLIKS.
The researchers adjusted the analyses for potential confounding variables (Zammit et al.,
2009). These confounding variables were a priori selected based on previous literature. In this
study, a family adversity index was used that covered early parenthood (maternal age < 20 years
at first child birth), residential status, financial difficulties, parent educational qualifications,
family size, social support, maternal relationship with partner, maternal affective disorder,
CHILDHOOD DEVELOPMENT FACTORS AND RISK OF PSYCHOTIC EXPERIENCES 93
parental substance abuse and involvement with crime. Table 5.1 shows that risk of PLIKS was
associated with maternal infection during pregnancy and maternal diabetes. However, there was
no association between need for resuscitation, 5- minute Apgar score, gestational age or pre-
eclampsia and risk of reporting suspected or definite PLIKS. Nonetheless, the overall results
imply that adverse biological events during pregnancy and early fetal development may lead to an
increased risk of PLIKS.
5.3.5.2. Maternal folate deficiency.
Glaser and colleagues (2010) investigated perinatal maternal folate-related exposures at 18
and 32 weeks of gestation and risk of offspring’s PLIKS in the ALSPAC birth cohort at the age of
12. In addition, these researchers examined the association of maternal and child MTHFR C677
TT versus CC/TC genotype with PLIKS at age 12. The researchers reported that MTHFR C677
TT variation confers susceptibility to psychosis, although there appears to be considerable study
heterogeneity (Allelic odds ratio (OR): I2 = 52% to 57%; Allen et al., 2008; Shi et al., 2008, cited
in Glaser et al., 2010). The genotypes in mothers (mothers of children with suspected or definite
PLIKS: p = 0.11; mothers of controls: p = 0.86) and children (suspected or definite PLIKS: p =
0.49; controls: p = 0.63) adhered to the Hardy–Weinberg equilibrium, reaching a call rate of
95.2% and 93.8%, respectively.
The statistical analyses were adjusted for potential maternal confounders (parity, age at
birth of the study child, cigarette smoking and alcohol consumption during the first three months
of pregnancy, family history of depression and education), occupational social class, housing
tenure and offspring gender. The results showed that only maternal folate supplementation at 18
weeks increased the odds of PLIKS in children (OR = 1.34; 95% CI = 1.00–1.76, p = 0.047).
However, the overall high-risk folate deficiency score during pregnancy was not related to
children’s PLIKS (OR = 0.92, 95% CI = 0.75–1.12, p = 0.40; sex specific p = 0.71).
The genetic association analysis revealed a relationship between maternal MTHFR C667
TT (versus CC/TC genotypes) and PLIKS, such that children of homozygous TT mothers had
decreased odds of PLIKS (OR = 0.72; 95% CI = 0.50–1.02, p = 0.06). This association was also
found to be sex specific: it was further reduced in boys (OR = 0.44, 95% CI = 0.22–0.79; sex-
CHILDHOOD DEVELOPMENT FACTORS AND RISK OF PSYCHOTIC EXPERIENCES 94
specific p = 0.029). However, with regard to child genotype, there was no evidence for a
relationship between child genotype and PLIKS, or sex- specific child genotype effects (p = 0.62).
Similarly, there was no evidence of an interaction or combined effect of genetics and folate
deficiency on child PLIKS (OR = 0.95, 95% CI = 0.78–1.15).
5.3.5.3. Maternal (analgesics exposure).
Gunawardana and colleagues (2011) investigated the relationship between maternal use of
analgesics (aspirin, paracetamol and other analgesics such as codeine or anadin, mogadon or other
sleeping tablets and valium or other tranquilisers) during pregnancy and the occurrence of PLIKS
in their offspring at the age of 12. The results showed a strong association between maternal use
of analgesics (none, aspirin, paracetamol, other and mixed) and risk of PLIKS at age 12 ( 2= 15.3,
df = 4, p = 0.004). However, the risk of PLIKS was different for each of the analgesics studied.
The results showed that increasing frequency of aspirin use during pregnancy was
associated with an increased risk of PLIKS in the offspring (OR =1.53, 95% CI = 1.16–2.01).
However, this was slightly reduced after adjustment for confounding variables (adjusted OR =
1.44, 95% CI = 1.08–1.92). Risk of PLIKS was highest in the children of mothers who used
aspirin most days or daily (adjusted OR= 2.79, 95% CI = 1.27–6.07). The OR was reduced to 2.66
(95% CI = 1.20–5.89) following adjustment for obstetric complications. Paracetamol and other
analgesic use during pregnancy was not associated with risk of reported PLIKS (Gunawardana et
al., 2011).
5.3.5.4. Maternal (drug exposure).
Zammit et al. (2009) ascertained the relationship between maternal use of tobacco,
cannabis or alcohol during pregnancy with risk of offspring PLIKS at age 12. The researchers
considered various socio-demographic variables as potential confounding variables; in addition,
analgesic use during pregnancy was controlled for in the data analyses. The results of the study
showed a significant association between maternal tobacco use during pregnancy and offspring
risk of PLIKS at age 12; the adjusted linear trend across four smoking categories (none, 1–9, 10–
19 a cigarettes per day) was 1.20 (95% CI = 1.05–1.37, p = 0.007). The children of
mothers who used tobacco equal to or greater than 20 cigarettes per day had the highest risk of
CHILDHOOD DEVELOPMENT FACTORS AND RISK OF PSYCHOTIC EXPERIENCES 95
suspected or definite PLIKS (adjusted OR = 1.84, 95% CI =1.12–3.03).
Similar findings were obtained for alcohol use during pregnancy, with the highest risk of
offspring PLIKS associated with maternal use of equal to or greater than 22 units of alcohol per
week (adjusted OR = 2.58, 95% CI = 1.09–6.11). However, this finding became non-significant
after adjusting for covariates (adjusted OR = 2.40, 95% CI = 0.99–5.83). Maternal cannabis use
was not associated with offspring suspected or definite PLIKS in the unadjusted or adjusted
analysis. Overall, these findings suggest that the risk factors for development of PLIKS may
operate during early development.
5.3.5.5. Fetal physical growth.
A study by Thomas and colleagues (2009) examined the association of body size at birth
and at age 7.5 years with PLIKS in 12-year-olds. This study revealed that as birth weight, birth
length and ponderal index increase, the odds of PLIKS at age 12 decline. Indeed, as can be seen in
Table 5.1, there was an 18% reduction in the odds of PLIKS in relation to a one standard
deviation increase in birth weight in models controlling for age and gestation (adjusted OR = 0.82,
95% CI = 0.73–0.92, p = 0.001). Similar findings were found in relation to birth height and
ponderal index. In addition, there was a significant positive relationship between birth weight and
birth length (r = 0.79, p < 0.001). However, the measures of weight, height and adiposity at age
7.5 (adjusting for age and gender) had no association with reported PLIKS (Thomas et al., 2009).
5.3.6 Family history of schizophrenia and risk of PLIKS.
5.3.6.1. Family characteristics.
Zammit and colleagues (2008) used ALSPAC data about family history of schizophrenia,
depression and socio-demographic variables (obtained by self-report questionnaires) in
ascertaining their specificity in the prediction of suspected or definite PLIKS. A family history of
schizophrenia was defined as present if parents reported that either they or their biological parents
(study child’s grandparents) had suffered from schizophrenia. The results were adjusted for
parental age (or age of other parent), parental education, highest parental social class, income
support, housing type and single status of mother. Although, no evidence was found of an
association between the presence of family history of schizophrenia and children’s PLIKS
CHILDHOOD DEVELOPMENT FACTORS AND RISK OF PSYCHOTIC EXPERIENCES 96
(adjusted OR= 0.94, 95% = CI 0.44, 2.00; p = 0.880), family history of depression was associated
with an increased risk of PLIKS (adjusted OR=1.28, 95% CI = 1.04, 1.57; p = 0.018). In addition,
while the results showed no association between paternal age and PLIKS, there was weak
evidence suggesting that younger maternal age (adjusted OR per 10-year age increase = 0.62, 95%
CI = 0.47–0.82; p = 0.001) significantly predicted suspected or definite PLIKS (Zammit et al.,
2008).
5.4 Discussion
This review identified 11 studies that examined the association of childhood and maternal
factors with risk of reported PLIKS in the ALSPAC birth cohort. The results presented the
adjusted odds ratios of reporting suspected or definite PLIKS in relation to childhood social
cognition and cognitive profiles, family history of psychopathology and maternal perinatal events.
No evidence was found linking family history of schizophrenia and PLIKS. This is not
consistent with HR findings reviewed in Chapter 2. This may imply that PEs may not be useful
marker of schizophrenia risk. In addition, these experiences do not represent a clinical diagnosis
and are not an indication for clinical intervention. However, like depressive symptoms, psychotic
symptoms are on a continuum of severity and show a linear relationship with declining health and
mental health which suggests that psychotic symptoms in adolescence are of interest as a risk
factor in models of developmental psychopathology and also as a direct indicator of impaired
functioning (Nuevo et al., 2012).
In contrast, the association of cognitive abilities (e.g., intellectual profiles, attribution style
and emotion recognition) in childhood and manifestation of PLIKS in early adolescence is
consistent with the HR and birth cohort findings outlined in Chapters 2 and 3. In addition, the
reported finding that higher speech problems significantly predict PLIKS supports the findings
regarding the speech and language functioning of children who later develop schizophrenia
reported in Chapter 3. Overall, these findings are compatible with the neurodevelopmental model
of schizophrenia discussed in Chapter 1.
However, while PLIKS refers to non-clinical symptoms in early adolescence, such
experiences are primary symptoms in diagnosis for any psychotic disorder. In addition, there is
CHILDHOOD DEVELOPMENT FACTORS AND RISK OF PSYCHOTIC EXPERIENCES 97
some evidence for the continuity of PEs from early adolescence to adulthood, as reported by
Poulton et al. (2000), who found that self-reported PLIKS at age 11 years predicted
schizophreniform diagnosis (Diagnostic Interview Schedule for DSM-IV) at age 26 years with an
odds ratio of 16.4 (95% CI = 3.9–67.8) for strong symptoms and 5.1 (95% CI = 1.7–18.3) for
weak symptoms of PLIKS (see Chapter 1 for more details).
The main strengths of ALSPAC studies are the large sample size, population-based cohort
design, the use of prospective, repeated measurements and the research high quality control in the
measurement of PLIKS (inter-rater reliability, k = 0.72) (Horwood et al., 2008). This design is
likely to minimise the risk of recall or information biases in the data. However, while all reviewed
studies used data from ALSPAC, which is a large cohort with substantial detailed information,
missing data due to attrition was a common problem.
Nonetheless, the overall findings of the present and previous reviews support the
proposition that the origins of PLIKS in early adolescence and schizophrenia in adulthood can be
traced to early infancy and childhood developmental domains of functioning. This has several
theoretical implications. First, early adolescent PLIKS may share similar childhood
neurodevelopmental indicators to schizophrenia. Secondly, PLIKS may be associated with known
genetic markers of schizophrenia. Thirdly, if PLIKS reflects a transitional stage for adult onset
psychotic-related conditions, then research efforts should focus on the development and
evaluation of early preventative interventions for children with elevated risk of developing
psychotic symptoms, and arguably schizophrenia.
This review has identified gaps in the literature relating to childhood indicators of PLIKS.
No previous work has examined the relationship between child literacy, attention, motor, social
communication skills and risk of PLIKS in adolescence. In addition, no study has tested
trajectories of change in early childhood developmental skills and PLIKS. Further, to the
researcher’s knowledge, no study has examined patterns of performance over time in relation to
PLIKS. Using performance over time as a predictor enables testing of whether consistently lower
levels of performance or decline in ability is the better predictor of PLIKS. Further, no study has
yet explored the predictive value of a section of known genetic markers of schizophrenia in
CHILDHOOD DEVELOPMENT FACTORS AND RISK OF PSYCHOTIC EXPERIENCES 98
relation to risk of PLIKS.
This thesis aims to address these gaps in the literature by exploring the longitudinal
relationships in a birth cohort between the above developmental domains and risk of reporting
PLIKS in early adolescence. This thesis argues that if PLIKS has similar childhood
neurodevelopmental indicators to schizophrenia, then it may represent a vulnerability to adult
onset schizophrenia. If research evidence supports this proposition, then researchers should focus
on the development and evaluation of early preventative interventions for children with elevated
risk of developing PLIKS, and arguably schizophrenia. Therefore, the current thesis aims to
present an original examination of childhood neurodevelopmental indicators of PLIKS in early
adolescence.
5.5 Aims and hypotheses of proceeding empirical studies
The proceeding chapters comprise six empirical studies. Five of these studies use data
from the ALSPAC population cohort study (UK), while the sixth is a preliminary pilot trial of a
social cognitive enhancement programme for typically developing children recruited from public
primary schools in Geelong, Australia.
5.5.1 Study 1: Childhood literacy skills.
While a number of prospective cohort studies (see Chapter 3) have examined various
aspects of linguistic competence across development as predictors of adult onset psychotic
disorders, no studies have examined childhood linguistic abilities and risk of reporting PEs in
early adolescents.
This study is the first to use data from ALSPAC to examine the prediction of PEs from
childhood performance on general literacy tasks. It was hypothesised that experience of
adolescent PEs would be associated with poor antecedent literacy skills. In addition, it was
hypothesised that deteriorating literacy skills over time would be associated with experience of
PEs. Gender specific patterns of association are also examined, given that such effects have been
previously reported (Welham et al., 2010).
It was additionally hypothesised that risk of reporting persistent PEs over time increases as
a function of poor childhood literacy skills. It was hypothesised that the measurement of literacy
CHILDHOOD DEVELOPMENT FACTORS AND RISK OF PSYCHOTIC EXPERIENCES 99
skills would distinguish between non-psychotic, decreasing, intermittent and persistent classes of
PEs, with the persistent class associated with poor childhood literacy skills.
5.5.2 Study 2: Childhood attention skills.
A review of current literature has failed to identify studies that have examined childhood
attention and inhibitory control skills in relation to risk of reporting PEs in early adolescent. The
study of attentional and inhibitory control skills in relation to PEs during adolescence may serve a
preventative function for children with elevated risk for psychotic symptoms.
The aim of this study was to examine the association between childhood performance on
attention tasks and risk of PEs in early adolescence. It was hypothesised that impaired
performance in attentional skills during childhood would increase the risk of reporting PEs. In
addition, it was hypothesised that deteriorating attention skills over time would be associated with
experience of PEs. Higher attentional problems were also hypothesised to be associated with
greater risk of reporting PEs.
Similarly, it was hypothesised that risk of reporting persistent PEs over time would
increase as a function of poor childhood attentional skills. It was expected that measurements of
attentional skills would distinguish between non-psychotic, decreasing, intermittent and persistent
classes of PEs, with the persistent class associated with poor attentional skills. Further, higher
attentional problems were expected to be associated with greater risk of persistently reporting PEs
over time.
5.5.3 Study 3: Childhood motor skills.
Chapter 2 found that children of parents presenting with schizophrenia showed subtle
differences in their childhood neurological and motor profiles. However, relatively few studies
have examined the relationship between childhood motor skills and PEs. This study aimed to
provide a better understanding of PEs in children, and the relationship with childhood motor
skills.
It was hypothesised that relative to the group unaffected by PEs, experience of adolescent
PEs would be associated with childhood motor impairments. Further, it was hypothesised that
those with childhood motor difficulties would be more likely to have persistent PEs over time.
CHILDHOOD DEVELOPMENT FACTORS AND RISK OF PSYCHOTIC EXPERIENCES 100
5.5.4 Study 4: Trajectories of early childhood developmental skills.
While a number of longitudinal HR (children of parents presenting with schizophrenia)
and birth cohort studies have examined infant developmental milestones as predictors of adult
onset schizophrenia (see Chapters 2 and 3), relatively few studies have examined early childhood
developmental skills and PEs in early adolescence.
The aim of this investigation was to examine the association of declining patterns in early
childhood developmental skills across the first four years of life and PEs in early adolescence. It
was hypothesised that relative to those with improving trend of performance, those with
deteriorating developmental skills over time would have increase risk of PEs.
5.5.5 Study 5: Genotypic variation and childhood cognitive profiles.
The selective review of genetic studies in Chapter 4 provided evidence (ranging from
weak to moderate) for associations between major susceptibility genes and schizophrenia (e.g.,
NRG1, DTNBP1, COMT and DISC1). In addition, Chapter 4 selectively reviewed some studies
that have found an association between specific SNPs and cognitive profiles in individuals with
diagnosed schizophrenia. However, these findings are not consistent, and failure to replicate
findings is a major limitation in this field of research.
To the researcher’s knowledge, no previous work has examined the independent effect of
genotypic variations (DTNBP1, NRG1 and DISC1) on the presence of PEs in early adolescence.
Further, a search of the literature failed to identify studies that have examined the joint interaction
effect between genotypic and cognitive variation in the prediction of PEs in early adolescence.
Guided by past research on the association of susceptibility genes and genotypic and
cognitive variation in schizophrenia, the current preliminary study’s aims to 2-fold. First, it
examines a number of individuals endorsing definite PEs in relation to DTNBP1, NRG1 and
DISC1 genotypes. Second, it assesses the independent and joint relationship between genetic risk
indicators and child cognitive functioning in the prediction of definite PEs in early adolescence.
This preliminary study hypothesised that experience of adolescent PEs would be
associated with genotypic variations in the DTNBP1, DISC1 and NRG1 genes. It was also
hypothesised that experience of adolescent PEs would be associated with low average childhood
CHILDHOOD DEVELOPMENT FACTORS AND RISK OF PSYCHOTIC EXPERIENCES 101
cognitive skills (literacy factor, verbal, performance and full scale IQ). Further, it was
hypothesised that the interactive effect between genetic risk indicators and low average childhood
cognitive skills would be more influential on PEs than would genetic risk indicators or low
average cognitive skills alone.
5.5.6 Study 6: Pilot trial of a social cognitive enhancement programme.
This study shifts the focus of the thesis towards an investigation of the benefits of a
computer-aided social cognitive enhancement programme for primary school aged children. This
would have implications for early preventative interventions for psychotic symptoms. The aim of
this study was to develop, administer and evaluate the efficacy and feasibility of a computer-aided
social cognitive programme designed to enhance specific neurocognitive and social cognitive
domains of functioning.
It was hypothesised that participation in the computer-aided social cognitive programme
would be associated with moderate and significant improvements in neurocognitive and social
cognition measurements. It was expected that this trial would form the basis and guide the
development of early preventative social-cognitive interventions for those with an elevated risk of
developing PEs, and arguably schizophrenia.
The following chapter presents a detailed description of the research methods used for the
studies that follow in Chapters 7–11. The method used in the pilot trial is presented in Chapter 12.
CHILDHOOD DEVELOPMENT FACTORS AND RISK OF PSYCHOTIC EXPERIENCES 102
Chapter 6: Research methods
6.1 Introduction
This chapter provides a detailed description of the ALSPAC sample, participant
characteristics, primary and secondary outcome variables and potential covariates. Further, it
provides a general description of each study’s predictors and statistical analyses. Detailed
description of relevant predictor variables, statistical manipulation and analyses is also provided
within each of the proceeding chapters pertaining to the individual studies.
6.2 Method
6.2.1 ALSPAC sample.
The ALSPAC is a population trans-generational prospective observational study designed
to ascertain the effects of a wide range of factors predictive of child, adolescent and adult health
outcomes (Boyd et al., 2012). ALSPAC recruited women resident in Avon, UK, with expected
dates of delivery between 1 April 1991 and 31 December 1992. The study cohort consisted of 14
541 pregnancies.
The parents have been completing regular postal questionnaires about various aspects of
their child’s health and development since birth. The children have attended annual assessment
clinics since age 7 years (Boyd et al., 2012; Fraser et al., 2012). However, due to attrition and
non-responses the sample sizes in this study differ according to the time point of the data
examined. Ethical approval for the studies was obtained from the ALSPAC Ethics and Law
Committee and the Local Research Ethics Committee (UK; see Appendix 6.A) and the Deakin
University Human Research Ethics Committee (Australia; see Appendix 6.B).
6.2.2 Participants.
Studies 1–5 examined data from 6790 children (45.9% of the original sample) from the
ALSPAC cohort who participated in the PLIKS semi-structured interview at mean age 12.9 (95%
CHILDHOOD DEVELOPMENT FACTORS AND RISK OF PSYCHOTIC EXPERIENCES 103
CI = 12.5–13.3 years). Based on this interview, PEs9 were classified as not present (n = 5862,
86.3%), suspected (n = 544, 8.0%) or definitely present (n = 384, 5.7%).
6.2.3 Measures.
6.2.3.1. (I) Primary outcome variable: Psychotic experiences (interview).
PEs were measured at the ALSPAC clinic using the PLIKS semi-structured face-to- face
interview (Horwood et al., 2008) (Appendix 6.C). The PLIKS interview consisted of 12 core items
enquiring about the participants’ experiences of hallucinations (visual and auditory); delusions
(being spied on, persecution, thoughts being read, reference, control, grandiose ability and other
unspecified delusions); and experiences of thought interference (thought broadcasting, insertion
and withdrawal) over the previous 6 months. Tables 6.1 and 6.2 show the frequencies of the
PLIKS core components and behavioural observations from the interview.
For these core items, seven stem questions were derived from the DISC–IV (Shaffer,
Fisher, Lucas, Dulcan & Schwab-Stone, 2000) and five from sections 17–19 of the SCAN 2.0
(WHO, 1994), modified slightly after piloting. The coding of all items followed the glossary
definitions, assessment and rating rules set out for SCAN. The items were assessed as not present,
suspected or definitely present, with an average value for inter- rater reliability of 0.72
(Horwood et al., 2008). In the following studies, present symptoms were only included in the
score if not attributable to sleep, fever or substance use; otherwise, they were coded as absent. The
primary outcome selected for investigation by the present study was the presence of either
suspected or definite PEs, with not present as a reference category. However, whether the
association of childhood developmental skills was stronger for definite as opposed to suspected
PEs was also explored.
6.2.3.2. (II) Secondary outcome variable: Trajectories of psychotic experiences
(questionnaire).
Child-completed PEs questionnaires based on the PLIKS interviews (Horwood et al.,
2008) were applied at 4 time points (mean ages 11.5, 13, 14 and 16.5 years), to enquire about the
9 As mentioned in Chapter 5, PLIKS is an equivalent term to PEs. In the remainder of this thesis, due to suggestions
made by editors of peer-reviewed journals, we will use the latter term (PEs) throughout this thesis.
CHILDHOOD DEVELOPMENT FACTORS AND RISK OF PSYCHOTIC EXPERIENCES 104
presence, level of conviction (‘definitely’ or ‘maybe’), past-year frequency (‘none’, ‘< once per
month’ or ‘ ly’) and context of experiences of visual and auditory hallucinations. The
questionnaire also asked children about their beliefs about being spied upon, the use of special
powers by others to read their thoughts, being sent special messages or being controlled by a
special power. Table 6.3 shows the frequencies of the PEs core components by trajectories of
change in the self-reported PEs questionnaires.
Latent class growth analysis was used by Thapar et al. (2012) to derive the trajectories of
change in self-reported PEs. This analysis revealed an optimal solution with four classes. The
largest class included individuals with a very low probability of reporting PEs at any time-point
(non-psychotic, n = 6399; 87.3%). The second largest included those who reported PEs
intermittently (intermittent; n = 727; 9.9%). The individuals who reported PEs throughout the four
time points were classified as persistent (persistent; n = 34; 0.5%). The last class was classified as
individuals who reported experiencing PEs during adolescence, but with decreasing levels during
late adolescence (decreasing; n = 171; 2.1%). The average latent class probability for each class
was 0.90, 0.77, 0.87 and 0.55, respectively. In the proceeding studies, these latent classes are used
as secondary outcome variables, with non-psychotic as a reference category.
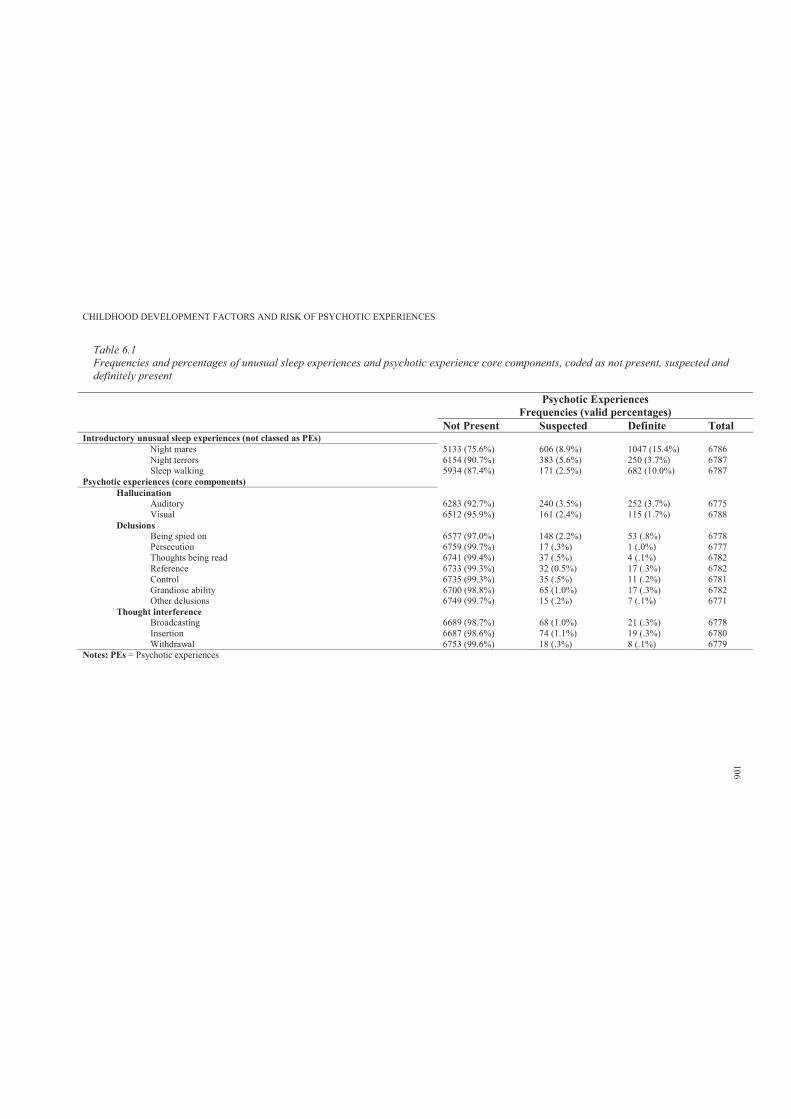
CHILDHOOD DEVELOPMENT FACTORS AND RISK OF PSYCHOTIC EXPERIENCES
Table 6.1Frequencies and percentages of unusual sleep experiences and psychotic experience core components, coded as not present, suspected and definitely present
Psychotic ExperiencesFrequencies (valid percentages)
Not Present Suspected Definite TotalIntroductory unusual sleep experiences (not classed as PEs)
Night mares 5133 (75.6%) 606 (8.9%) 1047 (15.4%) 6786Night terrors 6154 (90.7%) 383 (5.6%) 250 (3.7%) 6787Sleep walking 5934 (87.4%) 171 (2.5%) 682 (10.0%) 6787
Psychotic experiences (core components) Hallucination
Auditory 6283 (92.7%) 240 (3.5%) 252 (3.7%) 6775Visual 6512 (95.9%) 161 (2.4%) 115 (1.7%) 6788
DelusionsBeing spied on 6577 (97.0%) 148 (2.2%) 53 (.8%) 6778Persecution 6759 (99.7%) 17 (.3%) 1 (.0%) 6777Thoughts being read 6741 (99.4%) 37 (.5%) 4 (.1%) 6782Reference 6733 (99.3%) 32 (0.5%) 17 (.3%) 6782Control 6735 (99.3%) 35 (.5%) 11 (.2%) 6781Grandiose ability 6700 (98.8%) 65 (1.0%) 17 (.3%) 6782Other delusions 6749 (99.7%) 15 (.2%) 7 (.1%) 6771
Thought interferenceBroadcasting 6689 (98.7%) 68 (1.0%) 21 (.3%) 6778Insertion 6687 (98.6%) 74 (1.1%) 19 (.3%) 6780Withdrawal 6753 (99.6%) 18 (.3%) 8 (.1%) 6779
Notes: PEs = Psychotic experiences
106
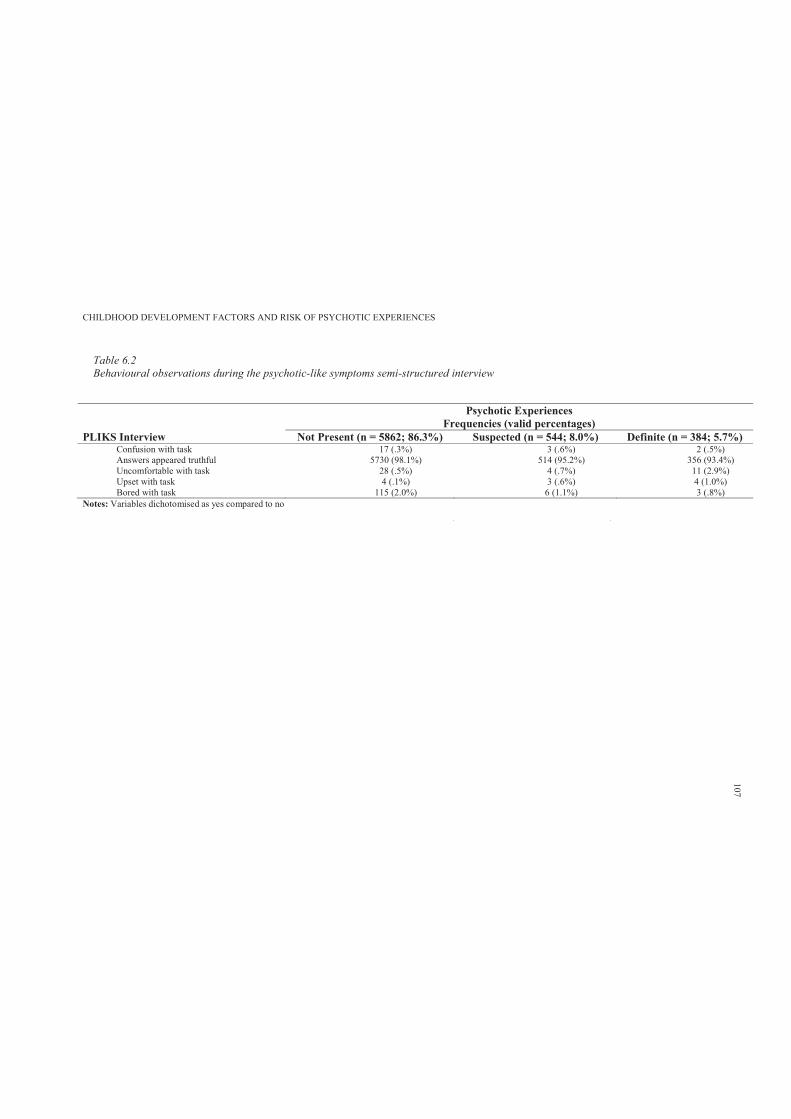
CHILDHOOD DEVELOPMENT FACTORS AND RISK OF PSYCHOTIC EXPERIENCES
Table 6.2Behavioural observations during the psychotic-like symptoms semi-structured interview
Psychotic ExperiencesFrequencies (valid percentages)
PLIKS Interview Not Present (n = 5862; 86.3%) Suspected (n = 544; 8.0%) Definite (n = 384; 5.7%)Confusion with task 17 (.3%) 3 (.6%) 2 (.5%)Answers appeared truthful 5730 (98.1%) 514 (95.2%) 356 (93.4%)Uncomfortable with task 28 (.5%) 4 (.7%) 11 (2.9%)Upset with task 4 (.1%) 3 (.6%) 4 (1.0%)Bored with task 115 (2.0%) 6 (1.1%) 3 (.8%)
Notes: Variables dichotomised as yes compared to no
107
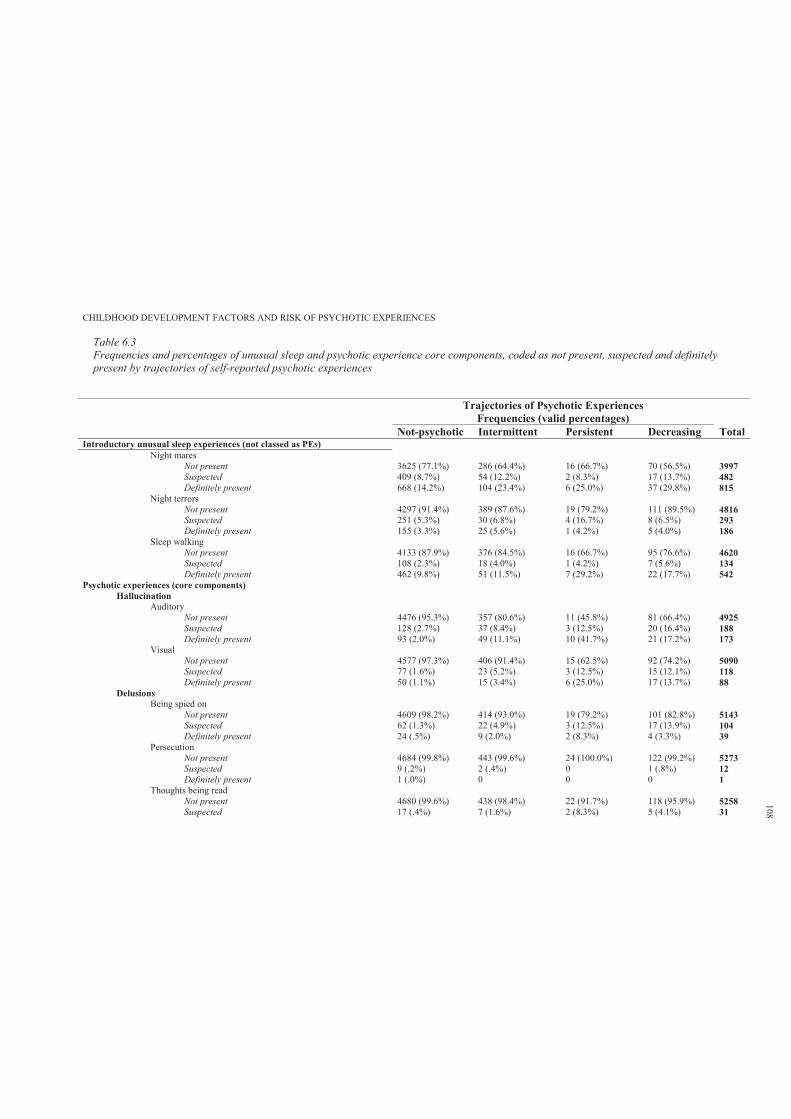
CHILDHOOD DEVELOPMENT FACTORS AND RISK OF PSYCHOTIC EXPERIENCES
Table 6.3Frequencies and percentages of unusual sleep and psychotic experience core components, coded as not present, suspected and definitely present by trajectories of self-reported psychotic experiences
Trajectories of Psychotic ExperiencesFrequencies (valid percentages)
Not-psychotic Intermittent Persistent Decreasing Total Introductory unusual sleep experiences (not classed as PEs)
Night maresNot present 3625 (77.1%) 286 (64.4%) 16 (66.7%) 70 (56.5%) 3997Suspected 409 (8.7%) 54 (12.2%) 2 (8.3%) 17 (13.7%) 482Definitely present 668 (14.2%) 104 (23.4%) 6 (25.0%) 37 (29.8%) 815
Night terrorsNot present 4297 (91.4%) 389 (87.6%) 19 (79.2%) 111 (89.5%) 4816Suspected 251 (5.3%) 30 (6.8%) 4 (16.7%) 8 (6.5%) 293Definitely present 155 (3.3%) 25 (5.6%) 1 (4.2%) 5 (4.0%) 186
Sleep walking Not present 4133 (87.9%) 376 (84.5%) 16 (66.7%) 95 (76.6%) 4620Suspected 108 (2.3%) 18 (4.0%) 1 (4.2%) 7 (5.6%) 134Definitely present 462 (9.8%) 51 (11.5%) 7 (29.2%) 22 (17.7%) 542
Psychotic experiences (core components) Hallucination
AuditoryNot present 4476 (95.3%) 357 (80.6%) 11 (45.8%) 81 (66.4%) 4925Suspected 128 (2.7%) 37 (8.4%) 3 (12.5%) 20 (16.4%) 188Definitely present 93 (2.0%) 49 (11.1%) 10 (41.7%) 21 (17.2%) 173
VisualNot present 4577 (97.3%) 406 (91.4%) 15 (62.5%) 92 (74.2%) 5090Suspected 77 (1.6%) 23 (5.2%) 3 (12.5%) 15 (12.1%) 118Definitely present 50 (1.1%) 15 (3.4%) 6 (25.0%) 17 (13.7%) 88
DelusionsBeing spied on
Not present 4609 (98.2%) 414 (93.0%) 19 (79.2%) 101 (82.8%) 5143Suspected 62 (1.3%) 22 (4.9%) 3 (12.5%) 17 (13.9%) 104Definitely present 24 (.5%) 9 (2.0%) 2 (8.3%) 4 (3.3%) 39
PersecutionNot present 4684 (99.8%) 443 (99.6%) 24 (100.0%) 122 (99.2%) 5273Suspected 9 (.2%) 2 (.4%) 0 1 (.8%) 12Definitely present 1 (.0%) 0 0 0 1
Thoughts being readNot present 4680 (99.6%) 438 (98.4%) 22 (91.7%) 118 (95.9%) 5258Suspected 17 (.4%) 7 (1.6%) 2 (8.3%) 5 (4.1%) 31
108
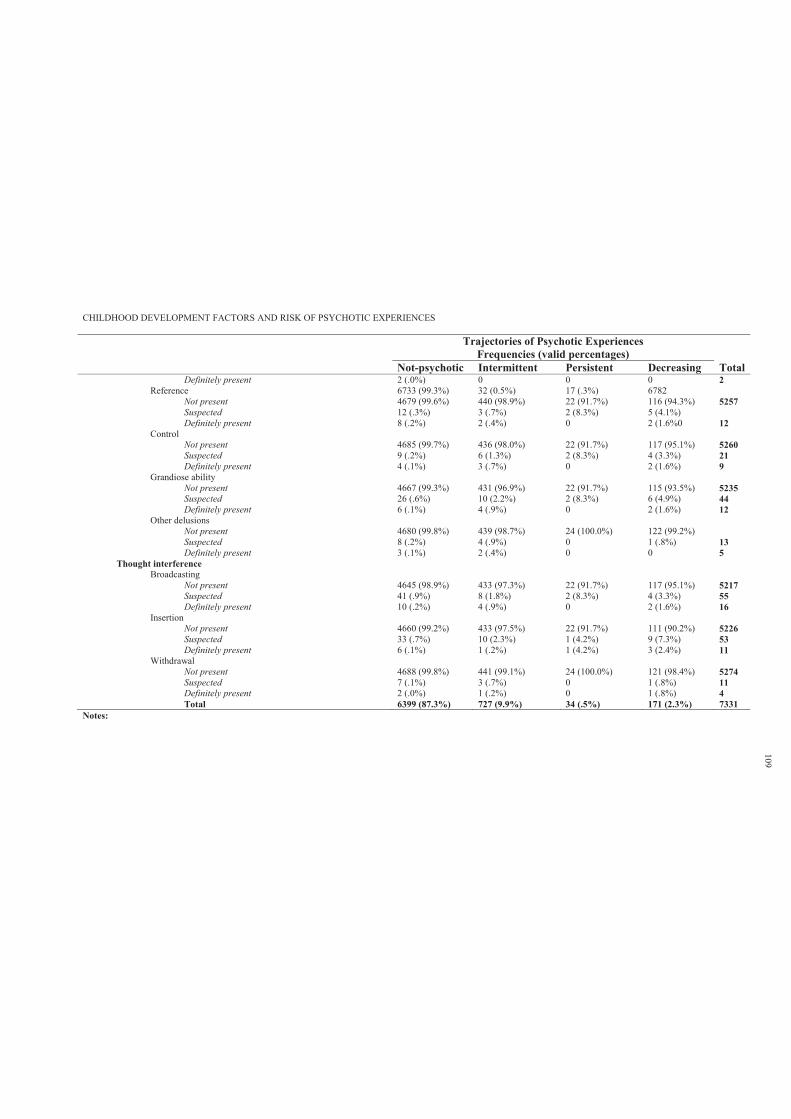
CHILDHOOD DEVELOPMENT FACTORS AND RISK OF PSYCHOTIC EXPERIENCES
Trajectories of Psychotic ExperiencesFrequencies (valid percentages)
Not-psychotic Intermittent Persistent Decreasing Total Definitely present 2 (.0%) 0 0 0 2
Reference 6733 (99.3%) 32 (0.5%) 17 (.3%) 6782Not present 4679 (99.6%) 440 (98.9%) 22 (91.7%) 116 (94.3%) 5257Suspected 12 (.3%) 3 (.7%) 2 (8.3%) 5 (4.1%)Definitely present 8 (.2%) 2 (.4%) 0 2 (1.6%0 12
ControlNot present 4685 (99.7%) 436 (98.0%) 22 (91.7%) 117 (95.1%) 5260Suspected 9 (.2%) 6 (1.3%) 2 (8.3%) 4 (3.3%) 21Definitely present 4 (.1%) 3 (.7%) 0 2 (1.6%) 9
Grandiose abilityNot present 4667 (99.3%) 431 (96.9%) 22 (91.7%) 115 (93.5%) 5235Suspected 26 (.6%) 10 (2.2%) 2 (8.3%) 6 (4.9%) 44Definitely present 6 (.1%) 4 (.9%) 0 2 (1.6%) 12
Other delusionsNot present 4680 (99.8%) 439 (98.7%) 24 (100.0%) 122 (99.2%)Suspected 8 (.2%) 4 (.9%) 0 1 (.8%) 13Definitely present 3 (.1%) 2 (.4%) 0 0 5
Thought interferenceBroadcasting
Not present 4645 (98.9%) 433 (97.3%) 22 (91.7%) 117 (95.1%) 5217Suspected 41 (.9%) 8 (1.8%) 2 (8.3%) 4 (3.3%) 55Definitely present 10 (.2%) 4 (.9%) 0 2 (1.6%) 16
InsertionNot present 4660 (99.2%) 433 (97.5%) 22 (91.7%) 111 (90.2%) 5226Suspected 33 (.7%) 10 (2.3%) 1 (4.2%) 9 (7.3%) 53Definitely present 6 (.1%) 1 (.2%) 1 (4.2%) 3 (2.4%) 11
WithdrawalNot present 4688 (99.8%) 441 (99.1%) 24 (100.0%) 121 (98.4%) 5274Suspected 7 (.1%) 3 (.7%) 0 1 (.8%) 11Definitely present 2 (.0%) 1 (.2%) 0 1 (.8%) 4Total 6399 (87.3%) 727 (9.9%) 34 (.5%) 171 (2.3%) 7331
Notes:
109
CHILDHOOD DEVELOPMENT FACTORS AND RISK OF PSYCHOTIC EXPERIENCES 110
6.2.4 Predictor variables.
6.2.4.1. Study 1: Childhood literacy skills.
Literacy skills were measured during the ALSPAC annual assessment clinics. The literacy
sessions (known as WORD session) took approximately 20 minutes to perform, and were
conducted by trained psychologists and speech therapists. The WORD sessions were repeated at
7, 8 and 9 years (detailed description is provided in Chapter 7).
6.2.4.2. Study 2: Childhood attention skills.
An adapted version of Tests of Everyday Attention for Children (TEACh) (Robertson,
Ward, Ridgeway & Nimmo-Smith, 1996) was used to measure selective attention and motor
control, divided attention and attentional control during the ALSPAC annual assessment clinics at
8 and 11 years. The attention sessions took approximately 20 minutes to perform, and were
conducted by trained psychologists. In addition, inhibitory control skills were assessed by the
computerised Stop Signal Task (Logan, Cowan & Davis, 1984) during an annual assessment
clinic at 10 years. At their child’s mean age of 13.10 years, a self-report version of the DAWBA
(Goodman, Ford, Richards, Gatward & Meltzer, 2000) was completed by ALSPAC mothers,
providing information regarding the child’s attentional problems (further details are provided in
Chapter 8).
6.2.4.3. Study 3: Childhood motor skills.
Specific subtests of the Movement Assessment Battery for Children (M-ABC) for age
band 2 (7–8 years) were used to assess childhood motor competence (Henderson & Sugden, 1992)
(further details are provided in Chapter 9).
6.2.4.4. Study 4: Trajectories of early childhood developmental skills.
A battery of questions completed by mothers (infant at 6, 18, 30 and 42 months) elicited
information from the Denver Developmental Screening Test (Frankenburg & Dodds, 1967)
relating to fine, gross motor, social and communication skills (further details are provided in
Chapter 10).
CHILDHOOD DEVELOPMENT FACTORS AND RISK OF PSYCHOTIC EXPERIENCES 111
6.2.4.5. Study 5: Genotypic variation and cognitive profiles.
Childhood literacy and cognitive profiles were assessed during the ALSPAC annual
clinics. Genotyping was performed by KBioscience (http://www.kbioscience.co.uk ); SNPs were
genotyped using the KASP-SNP genotyping system. KASP is a competitive allele- specific
polymerase chain reaction incorporating a fluorescent resonance energy transfer quencher cassette
(for more information see http://www.kbioscience.co.uk/reagents/KASP.html; further details are
provided in Chapter 11).
6.2.4.6. Study 6: Pilot trial of a social cognitive enhancement programme.
This preliminary pilot trial sought to ascertain the efficacy and feasibility of a computer-
aided social cognitive enhancement programme for primary school age children (further details
are provided in Chapter 12)
6.2.5 Covariates.
A number of child- and parent-related factors were considered as potential confounders
that might affect PE outcomes. Child’s birth weight was obtained from hospital birth records and
questionnaires during pregnancy were used to collect information on child’s gender and ethnicity
(Caucasian versus non-Caucasian), maternal marital status (never married, married or
separated/divorced), home ownership (owned/mortgage or rent), residential status (urban v. rural),
occupational and educational qualifications (UK classification) and family history of psychiatric
problems. Child’s total IQ score was assessed using the Wechsler Intelligence Scale for Children
at mean age 8 years.
These variables may be considered as potential confounders, and data analyses might need
to be adjusted accordingly. However, adjusting the analyses for all these variables leads to
substantial loss of sample size due to missing data. Therefore, these covariates were examined in
relation to PEs and significant variables were considered as potential covariates in subsequent
analyses (see Tables 6.4 and 6.5).
6.2.6 Sample characteristics.
Child demographic characteristics and intellectual profile were examined between the PEs
not present versus the PEs suspected or definitely present group using binary logistic regression.
CHILDHOOD DEVELOPMENT FACTORS AND RISK OF PSYCHOTIC EXPERIENCES 112
The results are reported in Table 6.4 using odds ratios for analysis of each subgroup and the Chi
square test for an overall difference. Those with suspected or definite PEs were more likely to be
female and have a lower IQ. However, the distribution of child ethnicity, birth weight and parental
residential status and family history of psychiatric problems were not different between the PEs
groupings. Gender and total IQ were adjusted for in subsequent analyses.
Table 6.4 also shows that the odds of reporting PEs decreased (OR = .73, 95% CI = .61–
.88) in relation to maternal residential status (owned) and in relation to the married marital status.
Further, the overall cross tabulation of mother’s highest education revealed a significant
difference by PEs grouping. Maternal residential, marital and educational statuses were included
as potential covariates in subsequent analyses.
Similarly, child demographic characteristics and intellectual profile were examined
between trajectories of PEs over time. The results are reported in Table 6.5 using the Chi square
test for overall class differences. Table 6.5 shows that individuals reporting intermittent, persistent
and decreasing PEs over time were more likely to be female. Although the group with persistent
PEs over time had slightly lower IQ scores (M = 103.33, SD = 14.82) than did the non-psychotic
class (M = 106.18, SD = 16.19), this difference was not statistically significant (F (3) = .838, p =
.473). In addition, the distribution of child ethnicity, birth weight and parental family history of
psychiatric problems was not different between PEs classes.
Table 6.5 also shows that the distribution of maternal residential, education, marital, and
occupation status differed by trajectories of PEs. However, only paternal occupation was different
between PEs classes. Child’s gender, maternal residential, marital, education, occupation status
and paternal occupational status were included as potential covariates in subsequent analyses of
trajectories of change in self-reported PEs.
6.2.7 Statistical analyses.
In this thesis, the strategy for data analysis was decided prior to examination of the data.
Binary and multinomial logistic regression was used to examine the relationship between
predictor variables and likelihood of reporting PEs, and the same analyses were repeated after
adjustment for confounding variables. The group with no psychotic symptoms was classified as a

CHILDHOOD DEVELOPMENT FACTORS AND RISK OF PSYCHOTIC EXPERIENCES 113
reference category in all statistical analyses. (Further relevant details are provided in the relevant
chapters for each study.)
While some peer reviewers may suggest and prefer using ordinal logistic regression, in
this thesis, binominal and multinomial regression were chosen for two reasons. First, to be
consistent with other studies published on this dataset (refer to Chapter 5 for more details).
Secondly, logistic odds ratios are easier for readers to interpret as compared to those in ordinal
models. In the latter case, the interpretation becomes more difficult for the reader as ordinal model
parameter estimates provide confidence intervals with both negative and positive values. This
would imply different meanings. (Further details are provided in each of the proceeding chapters.)
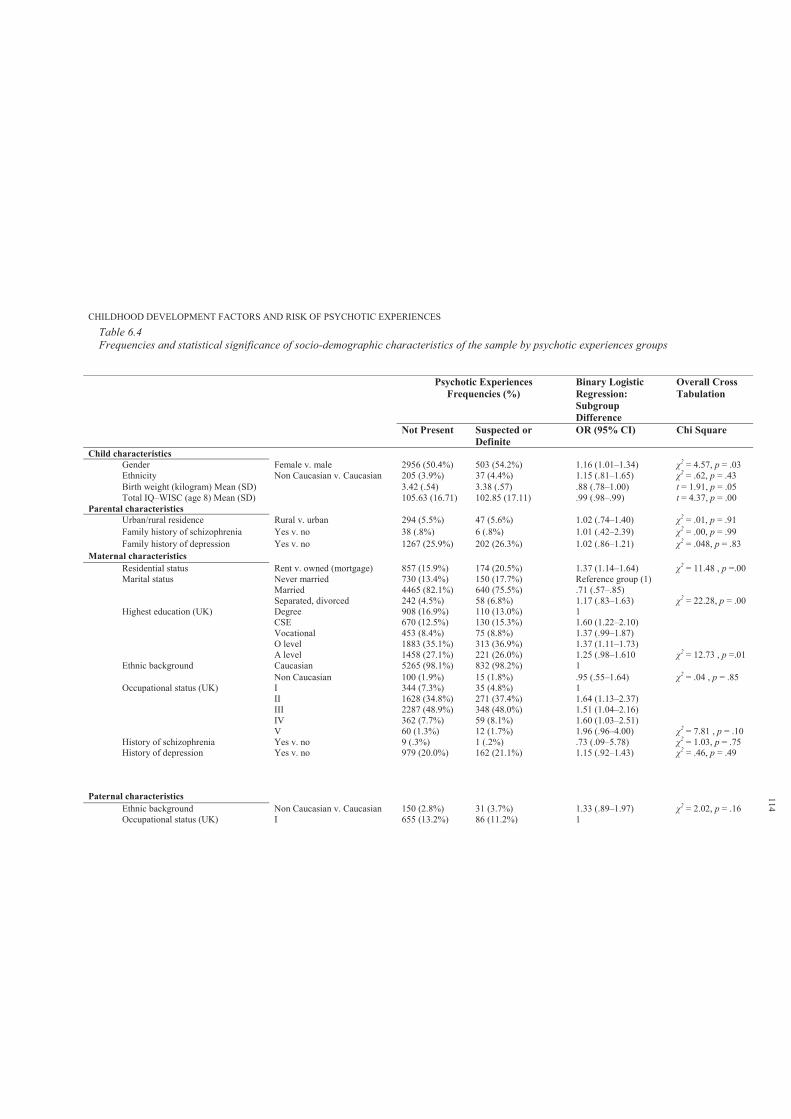
CHILDHOOD DEVELOPMENT FACTORS AND RISK OF PSYCHOTIC EXPERIENCES
Table 6.4Frequencies and statistical significance of socio-demographic characteristics of the sample by psychotic experiences groups
Psychotic ExperiencesFrequencies (%)
Binary Logistic Regression: Subgroup Difference
Overall Cross Tabulation
Not Present Suspected or Definite
OR (95% CI) Chi Square
Child characteristics Gender Female v. male 2956 (50.4%) 503 (54.2%) 1.16 (1.01–1.34) 2 = 4.57, p = .03Ethnicity Non Caucasian v. Caucasian 205 (3.9%) 37 (4.4%) 1.15 (.81–1.65) 2 = .62, p = .43Birth weight (kilogram) Mean (SD) 3.42 (.54) 3.38 (.57) .88 (.78–1.00) t = 1.91, p = .05Total IQ–WISC (age 8) Mean (SD) 105.63 (16.71) 102.85 (17.11) .99 (.98–.99) t = 4.37, p = .00
Parental characteristics Urban/rural residence Rural v. urban 294 (5.5%) 47 (5.6%) 1.02 (.74–1.40) 2 = .01, p = .91Family history of schizophrenia Yes v. no 38 (.8%) 6 (.8%) 1.01 (.42–2.39) 2 = .00, p = .99Family history of depression Yes v. no 1267 (25.9%) 202 (26.3%) 1.02 (.86–1.21) 2 = .048, p = .83
Maternal characteristics Residential status Rent v. owned (mortgage) 857 (15.9%) 174 (20.5%) 1.37 (1.14–1.64) 2 = 11.48 , p =.00Marital status Never married 730 (13.4%) 150 (17.7%) Reference group (1)
Married 4465 (82.1%) 640 (75.5%) .71 (.57–.85)Separated, divorced 242 (4.5%) 58 (6.8%) 1.17 (.83–1.63) 2 = 22.28, p = .00
Highest education (UK) Degree 908 (16.9%) 110 (13.0%) 1CSE 670 (12.5%) 130 (15.3%) 1.60 (1.22–2.10)Vocational 453 (8.4%) 75 (8.8%) 1.37 (.99–1.87)O level 1883 (35.1%) 313 (36.9%) 1.37 (1.11–1.73)A level 1458 (27.1%) 221 (26.0%) 1.25 (.98–1.610 2 = 12.73 , p =.01
Ethnic background Caucasian 5265 (98.1%) 832 (98.2%) 1Non Caucasian 100 (1.9%) 15 (1.8%) .95 (.55–1.64) 2 = .04 , p = .85
Occupational status (UK) I 344 (7.3%) 35 (4.8%) 1II 1628 (34.8%) 271 (37.4%) 1.64 (1.13–2.37)III 2287 (48.9%) 348 (48.0%) 1.51 (1.04–2.16)IV 362 (7.7%) 59 (8.1%) 1.60 (1.03–2.51)V 60 (1.3%) 12 (1.7%) 1.96 (.96–4.00) 2 = 7.81 , p = .10
History of schizophrenia Yes v. no 9 (.3%) 1 (.2%) .73 (.09–5.78) 2 = 1.03, p = .75History of depression Yes v. no 979 (20.0%) 162 (21.1%) 1.15 (.92–1.43) 2 = .46, p = .49
Paternal characteristics Ethnic background Non Caucasian v. Caucasian 150 (2.8%) 31 (3.7%) 1.33 (.89–1.97) 2 = 2.02, p = .16Occupational status (UK) I 655 (13.2%) 86 (11.2%) 1
114
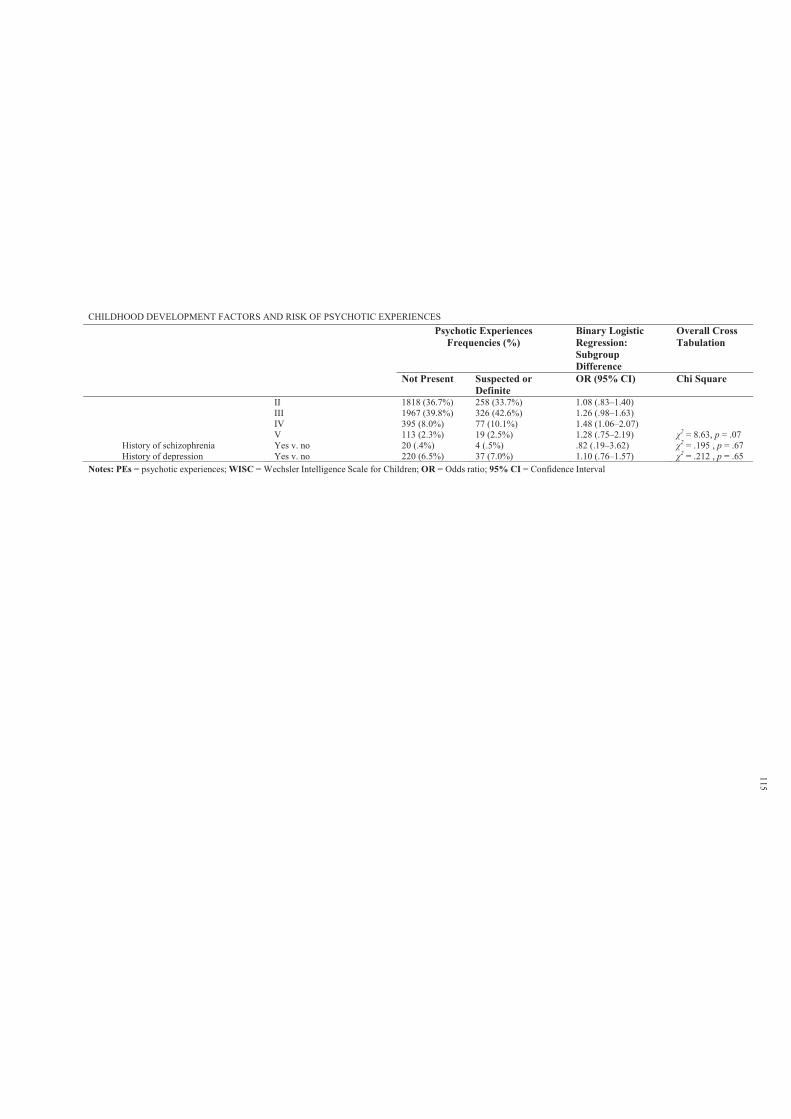
CHILDHOOD DEVELOPMENT FACTORS AND RISK OF PSYCHOTIC EXPERIENCESPsychotic Experiences
Frequencies (%)Binary Logistic Regression: Subgroup Difference
Overall Cross Tabulation
Not Present Suspected or Definite
OR (95% CI) Chi Square
II 1818 (36.7%) 258 (33.7%) 1.08 (.83–1.40)III 1967 (39.8%) 326 (42.6%) 1.26 (.98–1.63)IV 395 (8.0%) 77 (10.1%) 1.48 (1.06–2.07)V 113 (2.3%) 19 (2.5%) 1.28 (.75–2.19) 2 = 8.63, p = .07
History of schizophrenia Yes v. no 20 (.4%) 4 (.5%) .82 (.19–3.62) 2 = .195 , p = .67History of depression Yes v. no 220 (6.5%) 37 (7.0%) 1.10 (.76–1.57) 2 = .212 , p = .65
Notes: PEs = psychotic experiences; WISC = Wechsler Intelligence Scale for Children; OR = Odds ratio; 95% CI = Confidence Interval
115
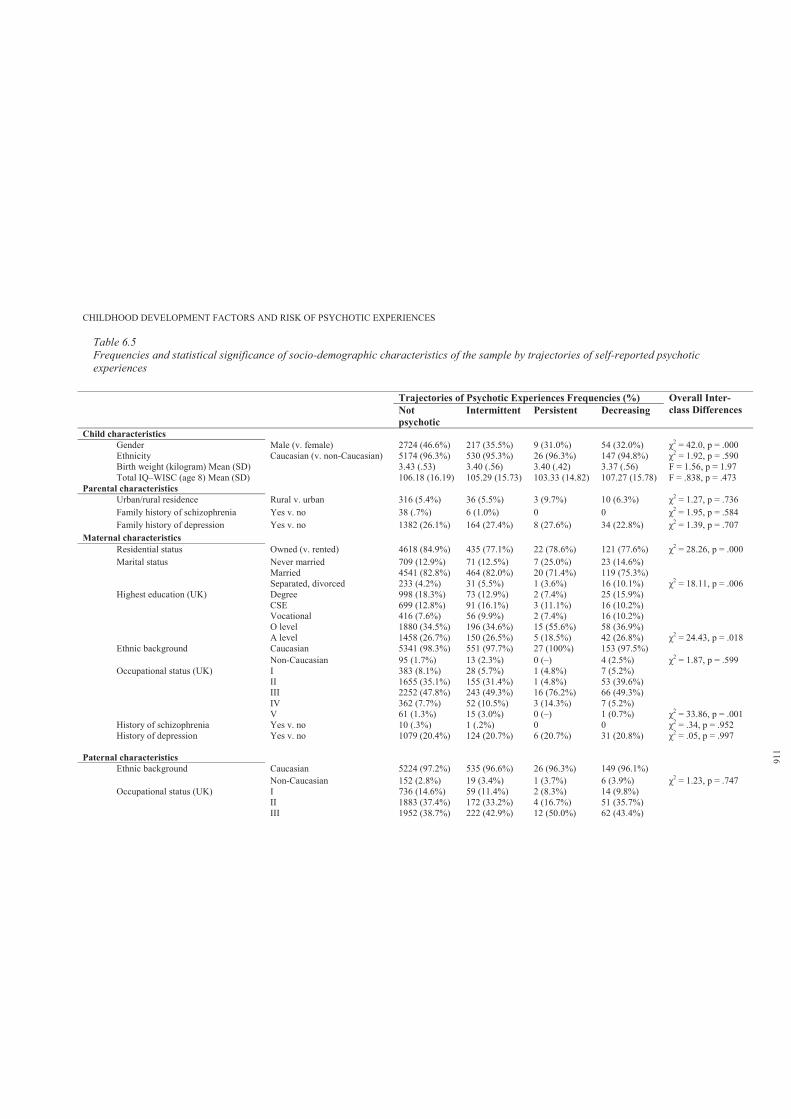
CHILDHOOD DEVELOPMENT FACTORS AND RISK OF PSYCHOTIC EXPERIENCES
Table 6.5Frequencies and statistical significance of socio-demographic characteristics of the sample by trajectories of self-reported psychotic experiences
Trajectories of Psychotic Experiences Frequencies (%) Overall Inter-class Differences Not
psychotic Intermittent Persistent Decreasing
Child characteristicsGender Male (v. female) 2724 (46.6%) 217 (35.5%) 9 (31.0%) 54 (32.0%) 2 = 42.0, p = .000Ethnicity Caucasian (v. non-Caucasian) 5174 (96.3%) 530 (95.3%) 26 (96.3%) 147 (94.8%) 2 = 1.92, p = .590Birth weight (kilogram) Mean (SD) 3.43 (.53) 3.40 (.56) 3.40 (.42) 3.37 (.56) F = 1.56, p = 1.97Total IQ–WISC (age 8) Mean (SD) 106.18 (16.19) 105.29 (15.73) 103.33 (14.82) 107.27 (15.78) F = .838, p = .473
Parental characteristics Urban/rural residence Rural v. urban 316 (5.4%) 36 (5.5%) 3 (9.7%) 10 (6.3%) 2 = 1.27, p = .736Family history of schizophrenia Yes v. no 38 (.7%) 6 (1.0%) 0 0 2 = 1.95, p = .584Family history of depression Yes v. no 1382 (26.1%) 164 (27.4%) 8 (27.6%) 34 (22.8%) 2 = 1.39, p = .707
Maternal characteristics Residential status Owned (v. rented) 4618 (84.9%) 435 (77.1%) 22 (78.6%) 121 (77.6%) 2 = 28.26, p = .000Marital status Never married 709 (12.9%) 71 (12.5%) 7 (25.0%) 23 (14.6%)
Married 4541 (82.8%) 464 (82.0%) 20 (71.4%) 119 (75.3%)Separated, divorced 233 (4.2%) 31 (5.5%) 1 (3.6%) 16 (10.1%) 2 = 18.11, p = .006
Highest education (UK) Degree 998 (18.3%) 73 (12.9%) 2 (7.4%) 25 (15.9%)CSE 699 (12.8%) 91 (16.1%) 3 (11.1%) 16 (10.2%)Vocational 416 (7.6%) 56 (9.9%) 2 (7.4%) 16 (10.2%)O level 1880 (34.5%) 196 (34.6%) 15 (55.6%) 58 (36.9%)A level 1458 (26.7%) 150 (26.5%) 5 (18.5%) 42 (26.8%) 2 = 24.43, p = .018
Ethnic background Caucasian 5341 (98.3%) 551 (97.7%) 27 (100%) 153 (97.5%)Non-Caucasian 95 (1.7%) 13 (2.3%) 0 (–) 4 (2.5%) 2 = 1.87, p = .599
Occupational status (UK) I 383 (8.1%) 28 (5.7%) 1 (4.8%) 7 (5.2%)II 1655 (35.1%) 155 (31.4%) 1 (4.8%) 53 (39.6%)III 2252 (47.8%) 243 (49.3%) 16 (76.2%) 66 (49.3%)IV 362 (7.7%) 52 (10.5%) 3 (14.3%) 7 (5.2%)V 61 (1.3%) 15 (3.0%) 0 (–) 1 (0.7%) 2 = 33.86, p = .001
History of schizophrenia Yes v. no 10 (.3%) 1 (.2%) 0 0 2 = .34, p = .952History of depression Yes v. no 1079 (20.4%) 124 (20.7%) 6 (20.7%) 31 (20.8%) 2 = .05, p = .997
Paternal characteristics Ethnic background Caucasian 5224 (97.2%) 535 (96.6%) 26 (96.3%) 149 (96.1%)
Non-Caucasian 152 (2.8%) 19 (3.4%) 1 (3.7%) 6 (3.9%) 2 = 1.23, p = .747Occupational status (UK) I 736 (14.6%) 59 (11.4%) 2 (8.3%) 14 (9.8%)
II 1883 (37.4%) 172 (33.2%) 4 (16.7%) 51 (35.7%)III 1952 (38.7%) 222 (42.9%) 12 (50.0%) 62 (43.4%)
116
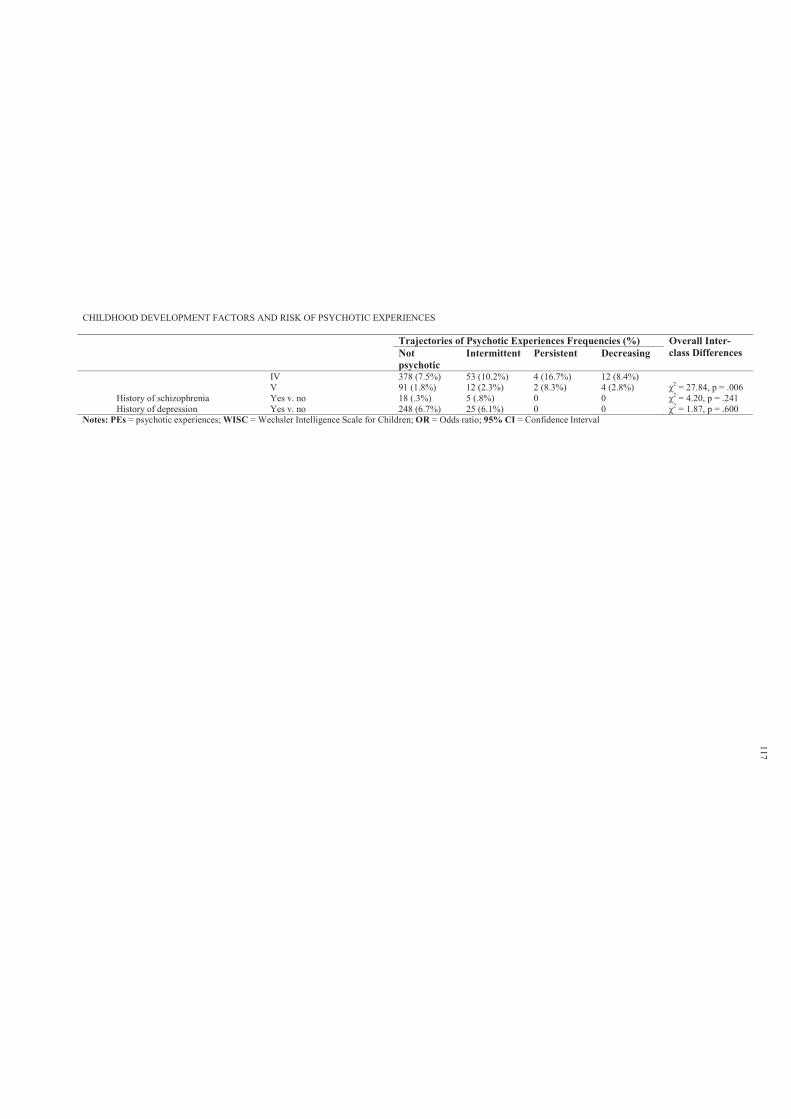
CHILDHOOD DEVELOPMENT FACTORS AND RISK OF PSYCHOTIC EXPERIENCES
Trajectories of Psychotic Experiences Frequencies (%) Overall Inter-class Differences Not
psychotic Intermittent Persistent Decreasing
IV 378 (7.5%) 53 (10.2%) 4 (16.7%) 12 (8.4%)V 91 (1.8%) 12 (2.3%) 2 (8.3%) 4 (2.8%) 2 = 27.84, p = .006
History of schizophrenia Yes v. no 18 (.3%) 5 (.8%) 0 0 2 = 4.20, p = .241History of depression Yes v. no 248 (6.7%) 25 (6.1%) 0 0 2 = 1.87, p = .600
Notes: PEs = psychotic experiences; WISC = Wechsler Intelligence Scale for Children; OR = Odds ratio; 95% CI = Confidence Interval
117
CHILDHOOD DEVELOPMENT FACTORS AND RISK OF PSYCHOTIC EXPERIENCES 118
Chapter 7: Study 1: Childhood Literacy Skills
7.1 Introduction
Given the clear relationship between psychotic symptoms and linguistic functioning, there
has been longstanding interest in the development of the speech and language abilities of children
that go on to develop schizophrenia. While a number of prospective cohort studies (see Chapter 3)
have examined various aspects of linguistic competence across development as predictors of adult
onset schizophrenia, no studies have examined childhood linguistic abilities and risk of reporting
PEs in early adolescents.
This study10 used data from ALSPAC, which collected data on the literacy skills of
children at ages 7 and 9 years. It was hypothesised that experience of adolescent PEs would be
associated with poor antecedent literacy skills, and further that deteriorating literacy skills over
time would be associated with experience of PEs. Gender specific patterns of association were
also examined, given that such effects have been previously reported in the literature (Welham et
al., 2010).
Further, it was hypothesised that the risk of reporting persistent PEs over time increases as
a function of poor antecedent literacy skills. It was hypothesised that measurement of literacy
skills would distinguish between non-psychotic, decreasing, intermittent and persistent classes of
PEs, with the persistent class associated with poor antecedent literacy skills.
7.2 Method
7.2.1 Sample.
Sample characteristics are described in Section 6.2.6.
10 Hameed, M. A., Lewis, A., Sullivan, S. & Zammit, S. (2012). Child literacy and psychotic experiences in early
adolescence: findings from the ALSPAC study. Schizophrenia Research (SCHRES-D-12–00595R1); accepted on 23
December 2012. This article is included in Appendix 7.A.
CHILDHOOD DEVELOPMENT FACTORS AND RISK OF PSYCHOTIC EXPERIENCES 119
7.2.2 Participants.
Participants’ details are provided in Section 6.2.2.
7.2.3 Measures.
7.2.3.1. Primary outcome.
The primary outcome was the presence of either suspected or definite PEs, with the not
present group as a reference category (see Section 6.2.3).
7.2.3.2. Secondary outcome.
Latent class growth analysis was used by Thapar et al. (2012) to derive the trajectories of
change in self-reported PEs at four time points (mean ages 11.5, 13, 14 and 16.5 years). This
analysis revealed an optimal solution with four classes (non-psychotic, n = 6399; 87.3%;
intermittent, n = 727; 9.9%; persistent, n = 34; 0.5%; and decreasing, n = 171; 2.1%). These
classes were used as secondary outcome variables (see Section 6.2.3).
7.2.3.3. Literacy skills.
Literacy skills were measured during ALSPAC annual assessment clinics. The literacy
session (known as WORD session) took approximately 20 minutes to perform, and was conducted
by trained psychologists and speech therapists. The WORD session was repeated at 7 and 9 years.
In addition, Wechsler Objective Language Dimensions (WOLD; Rust, 1996) were used to
measure listening comprehension and oral expression at 8 years.
7.2.3.4. Spelling (age 7 and 9)
A series of 15 words were chosen specifically for 7-year-old (e.g., chin, brought,
telephone) and 9-year-old (e.g., smoke, baseball, emotion) children after piloting on several
hundred children in Oxford and London (Bryant & Nunes, personal communication). The 15
words were put in order of increasing difficulty according to the results from the pilot trial. For
each word, the member of staff first read the word out loud on its own to the child, then used it in
a specific sentence incorporating the word, and finally alone again. The child was asked to write
down the spelling of the word even if he or she thought they were just guessing. The tester
recorded whether the child got each spelling correct or incorrect or whether the child did not
attempt the spelling because he or she did not know it. Scores reflect the total number of words
CHILDHOOD DEVELOPMENT FACTORS AND RISK OF PSYCHOTIC EXPERIENCES 120
spelt correctly.
7.2.3.5. Test of basic reading (age 7 & 9).
Basic reading at age 7 was assessed using the basic reading subtest of the WORD (Rust,
Golombok & Trickey, 1993). A series of four pictures (each with four simple words underneath)
and 48 unconnected words were used to assess decoding and word reading, respectively. The
child was asked to point to the word that correctly named the picture.
The child was then asked to read aloud the series of 48 unconnected words, which
increased in difficulty. The reading task was stopped: (a) after the child had made six consecutive
errors, (b) if requested by the child or (c) if the member of staff thought it was appropriate.
Basic reading (real and non-real words) at age 9 was assessed by asking the child to read
out loud 10 real words (e.g., huge, union, unusual), followed by 10 non-real words (e.g., duter,
uningest, smape). Both the words and non-words were selected from a larger selection of words
taken from research conducted in Oxford (Nunes, Bryant & Olsson, 2003). The test–retest
reliability of this test after four months was .80, with a correlation of r =.85 with the Schonell
Word Reading Task (Schonell & Goodacre, 1971) and r =.81 with the word spelling. The non-
word reading task has a test–retest reliability after four months of .73 and a correlation of r =.73
and r =.77 with the reading and spelling tasks, respectively.
7.2.3.6. Test of reading skills and comprehension (age 9).
The revised Neale Analysis of Reading Ability (NARA-II) provided an assessment of text
reading at 9 years (Neale, 1997). In this test, the participants read aloud short passages of stories,
generating a rate (passages read per minute) and an accuracy score. In addition, their answers to a
series of comprehension questions generated a reading comprehension score.
7.2.3.7. Listening comprehension and oral expression.
Two subtests of the WOLD (Rust, 1996) were used to measure listening comprehension
and oral expression.
7.2.4 Covariates.
Detailed descriptions of the potential covariates are provided in Section 6.2.5.
CHILDHOOD DEVELOPMENT FACTORS AND RISK OF PSYCHOTIC EXPERIENCES 121
7.2.5 Data manipulation and statistical analyses.
All raw literacy scores were transformed to standardised z-scores. Descriptive statistics
were used to describe the pattern of performance in measurements of literacy skills by PEs
grouping. Binary and multinomial logistic regression was then used to examine the relationship
between the literacy skill measurements and likelihood of reporting PEs, and the same analyses
were repeated after adjustment for the confounding variables listed as covariates above. In
assessing the odds of reporting PEs in relation to antecedent literacy performance, this association
was the combination of both the suspected and definitely present PEs in reference to not present
(primary outcome; binary logistic regression). The odds were then examined independently for
each PEs group in reference to the not present group (secondary outcome; multinomial logistic
regression).
Since the spelling task was repeated at two time points, the researcher wanted to examine
the prediction of PEs from trajectories of performance over time, including consistently low
versus decline in performance. Using standard approaches to categorise performance over time in
reference to baseline scores (e.g., high, average and low) by partitioning the data based on +/- 2
standard deviations from the mean or percentile ranks was problematic for two reasons. First,
literacy scores at time 1 and time 2 are positively correlated (one variable contains partial
information about the other). Secondly, in repeated measures, there is a tendency to regress
towards the ‘true’ mean (Tu & Gilthorpe, 2007).
Therefore, this study used principal component analysis (PCA) as a means of transforming
the original spelling variables to derive two uncorrelated (orthogonal) scores to avoid nuisances
associated with collinearity (Massy, 1965). PCA is a multivariate statistical technique used for
various purposes such as dimension reduction in exploratory data analysis and for making
predictive models (e.g., neural networks, pattern recognition and time series prediction) (Tipping
& Bishop, 1999). PCA is also closely related to factor analysis, but it is the simplest
dimensionality reduction technique. It accomplishes this reduction and simplification of complex
datasets by identifying uncorrelated directions, called principal components, along which the
variation in the data is maximal (Jeffers, 1967, 1981; Tipping & Bishop, 1999).
CHILDHOOD DEVELOPMENT FACTORS AND RISK OF PSYCHOTIC EXPERIENCES 122
When using PCA as a preserving dimensionality technique (as for this study), there is no
error term, as there is no loss of information by definition of the procedure and its related
assumptions (Laurens, West, Murray & Hodgins, 2008). By entering time 1 and time 2 measures
into a PCA, it is possible to derive two uncorrelated components. The first component extracted is
the one that explains the greatest possible percentage of the total variability (average score over
the two time points). However, the second component represents a linear combination of the two
variables, which is uncorrelated with the first component and, within this constraint, explains the
maximum amount of leftover variance (change score).
In this study, two fixed principal components with orthogonal (varimax) rotation were
used for total score of spelling at time 1 and 2; the two components were saved as standardised
regression scores. The variance-reduction criteria was the widely-used Kaiser- Guttman criterion
of eigenvalue (Kaiser, 1960). However, for this study, irrespective of eigenvalues, the
second principal component was of direct interest, since this study used dimension-preserving
PCA as a transformation that avoids collinearity problems. Indeed, examples from multiple
disciplines illustrate the importance of components that accounted for as low as .06 per cent of the
variance in original variables (Hill, Thomas & Johnson, 1977; Hotelling, 1957; Jolliffe, 1982;
Massy, 1965; Smith & Campbell, 1980)
For the spelling task, repeated at age 7 and 9 years, PCA yielded a first (eigenvalue = 1.73,
percentage of variance = 86.57) and a second component (eigenvalue = .27, percentage of
variance = 13.43) reflecting average and change scores between the two time points, respectively.
The saved standardised two components were then used as continuous predictors in subsequent
binary and multinomial logistic regression to assess their relationship in prediction of reporting
PEs with and without adjustments for potential confounding variables. To examine the sex-
specific effects, interactions between literacy measures and gender were also tested.
7.3 Results
7.3.1 Participants and missing data.
A total of 6790 (44.6%) children from the ALSPAC cohort completed the PLIKS semi-
structured interview at mean age 12. The remaining 8360 (55.4%) children did not attend the
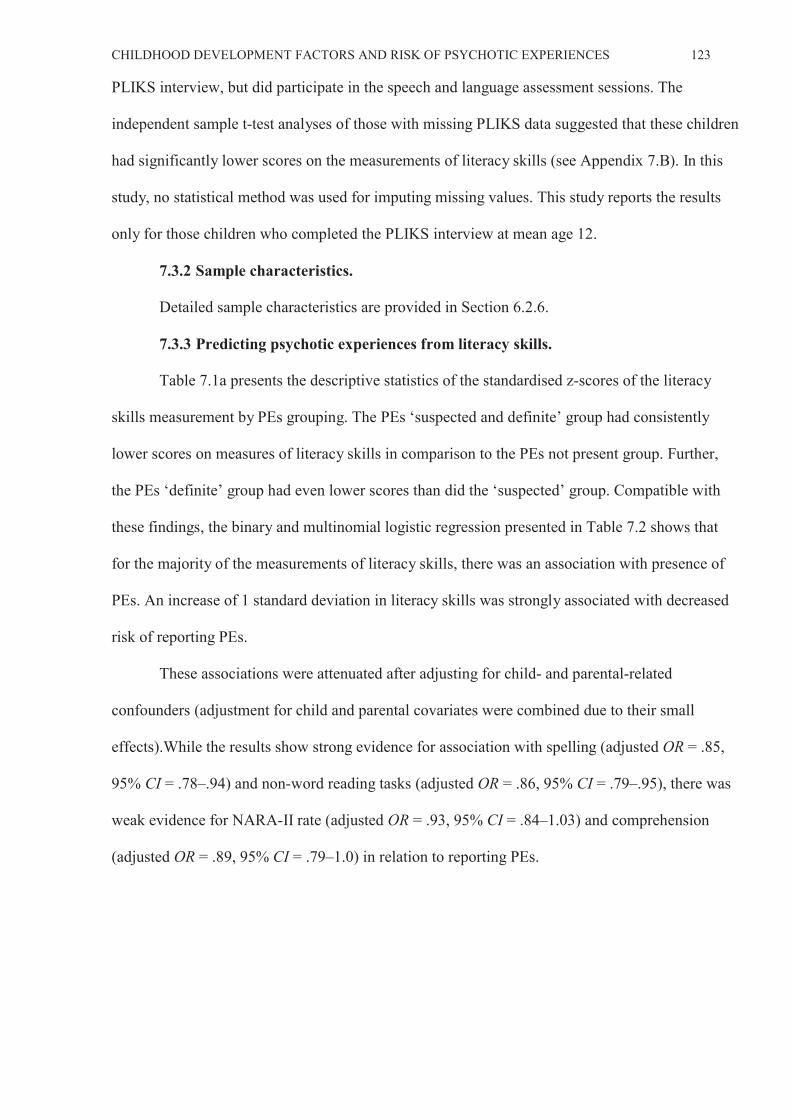
CHILDHOOD DEVELOPMENT FACTORS AND RISK OF PSYCHOTIC EXPERIENCES 123
PLIKS interview, but did participate in the speech and language assessment sessions. The
independent sample t-test analyses of those with missing PLIKS data suggested that these children
had significantly lower scores on the measurements of literacy skills (see Appendix 7.B). In this
study, no statistical method was used for imputing missing values. This study reports the results
only for those children who completed the PLIKS interview at mean age 12.
7.3.2 Sample characteristics.
Detailed sample characteristics are provided in Section 6.2.6.
7.3.3 Predicting psychotic experiences from literacy skills.
Table 7.1a presents the descriptive statistics of the standardised z-scores of the literacy
skills measurement by PEs grouping. The PEs ‘suspected and definite’ group had consistently
lower scores on measures of literacy skills in comparison to the PEs not present group. Further,
the PEs ‘definite’ group had even lower scores than did the ‘suspected’ group. Compatible with
these findings, the binary and multinomial logistic regression presented in Table 7.2 shows that
for the majority of the measurements of literacy skills, there was an association with presence of
PEs. An increase of 1 standard deviation in literacy skills was strongly associated with decreased
risk of reporting PEs.
These associations were attenuated after adjusting for child- and parental-related
confounders (adjustment for child and parental covariates were combined due to their small
effects).While the results show strong evidence for association with spelling (adjusted OR = .85,
95% CI = .78–.94) and non-word reading tasks (adjusted OR = .86, 95% CI = .79–.95), there was
weak evidence for NARA-II rate (adjusted OR = .93, 95% CI = .84–1.03) and comprehension
(adjusted OR = .89, 95% CI = .79–1.0) in relation to reporting PEs.
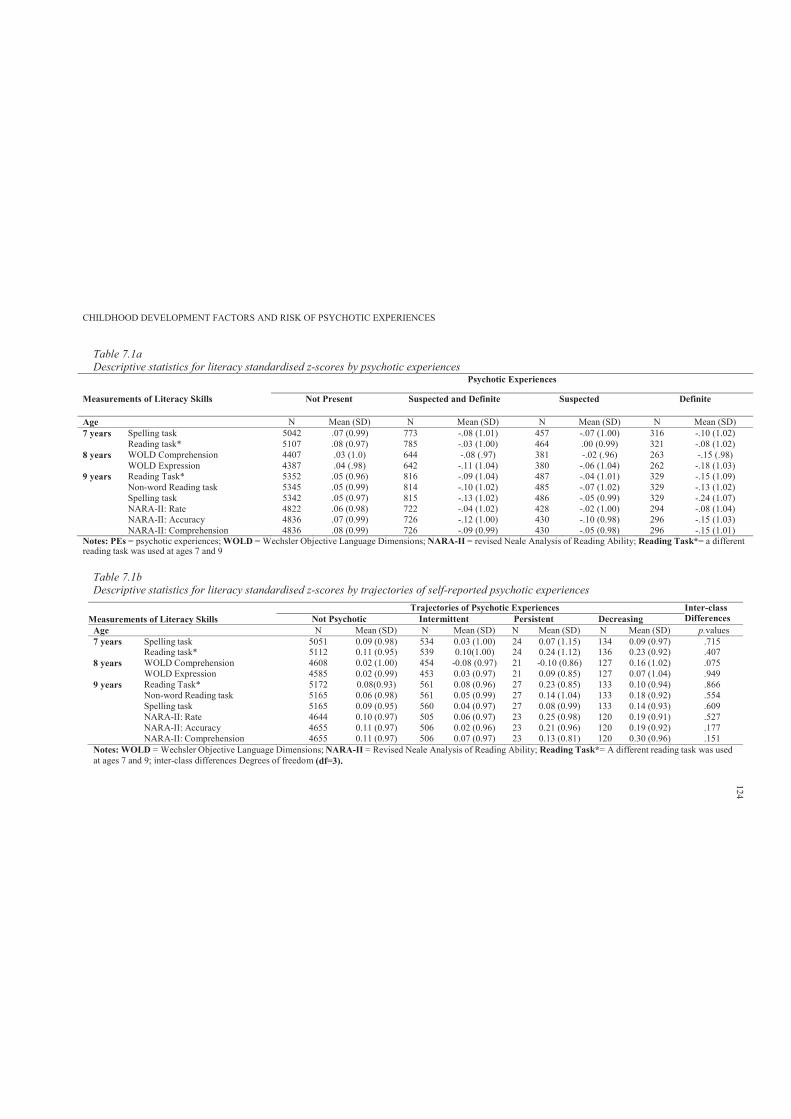
CHILDHOOD DEVELOPMENT FACTORS AND RISK OF PSYCHOTIC EXPERIENCES
Table 7.1aDescriptive statistics for literacy standardised z-scores by psychotic experiences
Psychotic Experiences
Measurements of Literacy Skills Not Present Suspected and Definite Suspected Definite
Age N Mean (SD) N Mean (SD) N Mean (SD) N Mean (SD)7 years Spelling task 5042 .07 (0.99) 773 -.08 (1.01) 457 -.07 (1.00) 316 -.10 (1.02)
Reading task* 5107 .08 (0.97) 785 -.03 (1.00) 464 .00 (0.99) 321 -.08 (1.02)8 years WOLD Comprehension 4407 .03 (1.0) 644 -.08 (.97) 381 -.02 (.96) 263 -.15 (.98)
WOLD Expression 4387 .04 (.98) 642 -.11 (1.04) 380 -.06 (1.04) 262 -.18 (1.03)9 years Reading Task* 5352 .05 (0.96) 816 -.09 (1.04) 487 -.04 (1.01) 329 -.15 (1.09)
Non-word Reading task 5345 .05 (0.99) 814 -.10 (1.02) 485 -.07 (1.02) 329 -.13 (1.02)Spelling task 5342 .05 (0.97) 815 -.13 (1.02) 486 -.05 (0.99) 329 -.24 (1.07)NARA-II: Rate 4822 .06 (0.98) 722 -.04 (1.02) 428 -.02 (1.00) 294 -.08 (1.04)NARA-II: Accuracy 4836 .07 (0.99) 726 -.12 (1.00) 430 -.10 (0.98) 296 -.15 (1.03)NARA-II: Comprehension 4836 .08 (0.99) 726 -.09 (0.99) 430 -.05 (0.98) 296 -.15 (1.01)
Notes: PEs = psychotic experiences; WOLD = Wechsler Objective Language Dimensions; NARA-II = revised Neale Analysis of Reading Ability; Reading Task*= a differentreading task was used at ages 7 and 9
Table 7.1bDescriptive statistics for literacy standardised z-scores by trajectories of self-reported psychotic experiences
Trajectories of Psychotic Experiences Inter-class Differences Measurements of Literacy Skills Not Psychotic Intermittent Persistent Decreasing
Age N Mean (SD) N Mean (SD) N Mean (SD) N Mean (SD) p.values7 years Spelling task 5051 0.09 (0.98) 534 0.03 (1.00) 24 0.07 (1.15) 134 0.09 (0.97) .715
Reading task* 5112 0.11 (0.95) 539 0.10(1.00) 24 0.24 (1.12) 136 0.23 (0.92) .4078 years WOLD Comprehension 4608 0.02 (1.00) 454 -0.08 (0.97) 21 -0.10 (0.86) 127 0.16 (1.02) .075
WOLD Expression 4585 0.02 (0.99) 453 0.03 (0.97) 21 0.09 (0.85) 127 0.07 (1.04) .9499 years Reading Task* 5172 0.08(0.93) 561 0.08 (0.96) 27 0.23 (0.85) 133 0.10 (0.94) .866
Non-word Reading task 5165 0.06 (0.98) 561 0.05 (0.99) 27 0.14 (1.04) 133 0.18 (0.92) .554Spelling task 5165 0.09 (0.95) 560 0.04 (0.97) 27 0.08 (0.99) 133 0.14 (0.93) .609NARA-II: Rate 4644 0.10 (0.97) 505 0.06 (0.97) 23 0.25 (0.98) 120 0.19 (0.91) .527NARA-II: Accuracy 4655 0.11 (0.97) 506 0.02 (0.96) 23 0.21 (0.96) 120 0.19 (0.92) .177NARA-II: Comprehension 4655 0.11 (0.97) 506 0.07 (0.97) 23 0.13 (0.81) 120 0.30 (0.96) .151
Notes: WOLD = Wechsler Objective Language Dimensions; NARA-II = Revised Neale Analysis of Reading Ability; Reading Task*= A different reading task was usedat ages 7 and 9; inter-class differences Degrees of freedom (df=3).
124
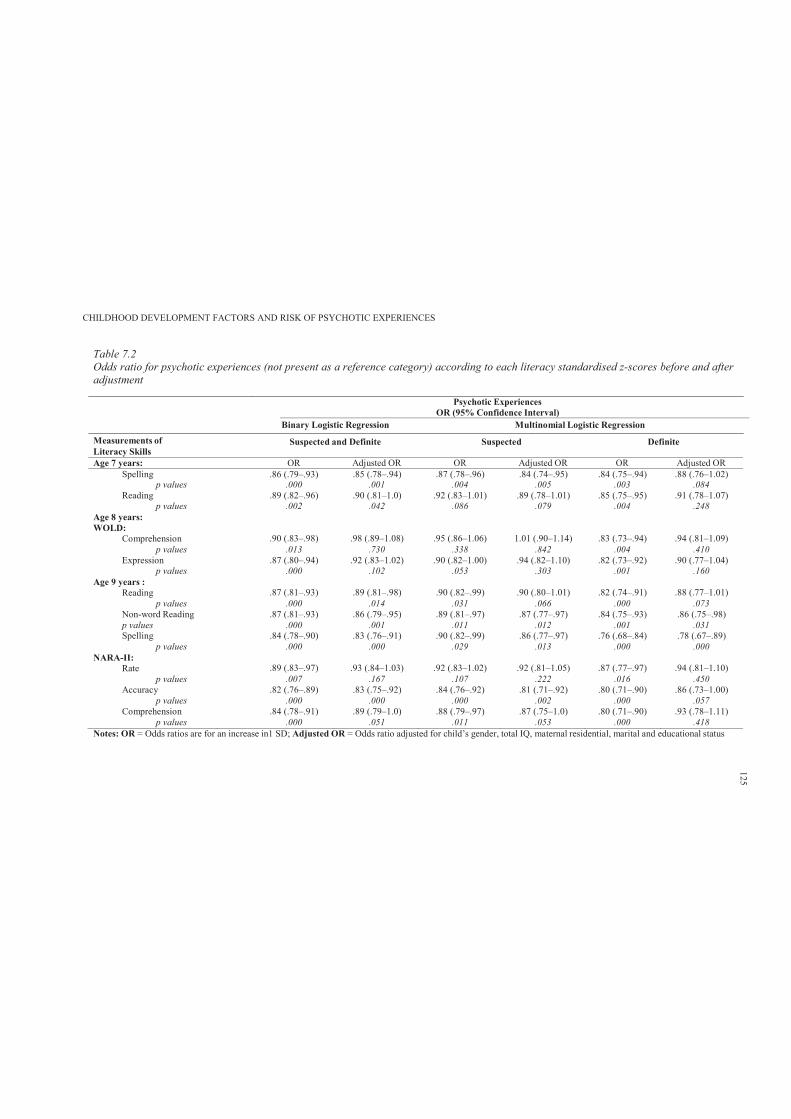
CHILDHOOD DEVELOPMENT FACTORS AND RISK OF PSYCHOTIC EXPERIENCES
Table 7.2Odds ratio for psychotic experiences (not present as a reference category) according to each literacy standardised z-scores before and after adjustment
Measurements ofLiteracy Skills
Psychotic ExperiencesOR (95% Confidence Interval)
Binary Logistic Regression Multinomial Logistic Regression
Suspected and Definite Suspected Definite
Age 7 years: OR Adjusted OR OR Adjusted OR OR Adjusted ORSpelling .86 (.79–.93) .85 (.78–.94) .87 (.78–.96) .84 (.74–.95) .84 (.75–.94) .88 (.76–1.02)
p values .000 .001 .004 .005 .003 .084Reading .89 (.82–.96) .90 (.81–1.0) .92 (.83–1.01) .89 (.78–1.01) .85 (.75–.95) .91 (.78–1.07)
p values .002 .042 .086 .079 .004 .248Age 8 years:WOLD:
Comprehension .90 (.83–.98) .98 (.89–1.08) .95 (.86–1.06) 1.01 (.90–1.14) .83 (.73–.94) .94 (.81–1.09)p values .013 .730 .338 .842 .004 .410
Expression .87 (.80–.94) .92 (.83–1.02) .90 (.82–1.00) .94 (.82–1.10) .82 (.73–.92) .90 (.77–1.04)p values .000 .102 .053 .303 .001 .160
Age 9 years :Reading .87 (.81–.93) .89 (.81–.98) .90 (.82–.99) .90 (.80–1.01) .82 (.74–.91) .88 (.77–1.01)
p values .000 .014 .031 .066 .000 .073Non-word Reading .87 (.81–.93) .86 (.79–.95) .89 (.81–.97) .87 (.77–.97) .84 (.75–.93) .86 (.75–.98)p values .000 .001 .011 .012 .001 .031Spelling .84 (.78–.90) .83 (.76–.91) .90 (.82–.99) .86 (.77–.97) .76 (.68–.84) .78 (.67–.89)
p values .000 .000 .029 .013 .000 .000NARA-II:
Rate .89 (.83–.97) .93 (.84–1.03) .92 (.83–1.02) .92 (.81–1.05) .87 (.77–.97) .94 (.81–1.10)p values .007 .167 .107 .222 .016 .450
Accuracy .82 (.76–.89) .83 (.75–.92) .84 (.76–.92) .81 (.71–.92) .80 (.71–.90) .86 (.73–1.00)p values .000 .000 .000 .002 .000 .057
Comprehension .84 (.78–.91) .89 (.79–1.0) .88 (.79–.97) .87 (.75–1.0) .80 (.71–.90) .93 (.78–1.11)p values .000 .051 .011 .053 .000 .418
Notes: OR = Odds ratios are for an increase in1 SD; Adjusted OR = Odds ratio adjusted for child’s gender, total IQ, maternal residential, marital and educational status
125
CHILDHOOD DEVELOPMENT FACTORS AND RISK OF PSYCHOTIC EXPERIENCES 126
Further, the analysis of the literacy skills and trajectories of self-reported PEs revealed that
relative to the non-psychotic class, those with persistent and intermittent PEs over time reported
lower scores on the WOLD comprehension task (M = -0.10, SD = 0.86; M = -0.08, SD = 0.97
respectively). However, these were weak associations (persistent PEs OR = .88, 95% CI = .57–
1.36; and intermittent PEs OR = .91, 95% CI = .82–.99). Table 7.1b shows no inter-class
differences for the remaining measurements of literacy skills.
7.3.4 Predicting psychotic experiences from changes in literacy performance over
time.
Table 7.3a shows that both a consistently low average (adjusted OR = .88, 95% CI = .81–
.96) and a declining pattern of performance (adjusted OR = .89, 95% CI = .81–.98) were
associated with suspected and definite PEs. However, further analyses revealed that while the
consistently low pattern of performance in spelling over time was associated with reporting
definite PEs (adjusted OR = .80, 95% CI = .70–.91), a declining pattern was only associated with
suspected PEs (adjusted OR = .84, 95% CI = .74–.94). Table 7.3b shows that those with persistent
PEs over time were likely to have similar patterns of performance in reference to non-psychotic
class. Neither consistently low average, nor a declining pattern of performance was associated
with persistent PEs.
7.3.5 Gender specific effects.
Associations between literacy skills and PEs were not found to differ according to gender
for seven of the eight measures examined (see Table 7.4a). The exception was spelling ability at
age 9, where poorer spelling was associated with a greater odds of PEs in females than in males
(interaction adjusted OR = 1.27, 95% CI = 1.07–1.49). There was also no evidence that the
association between change in spelling performance differed across gender, though poorer average
spelling performance was more strongly associated with odds of PEs in females compared to
males (interaction OR = 1.28, 95% CI = 1.08–1.51).
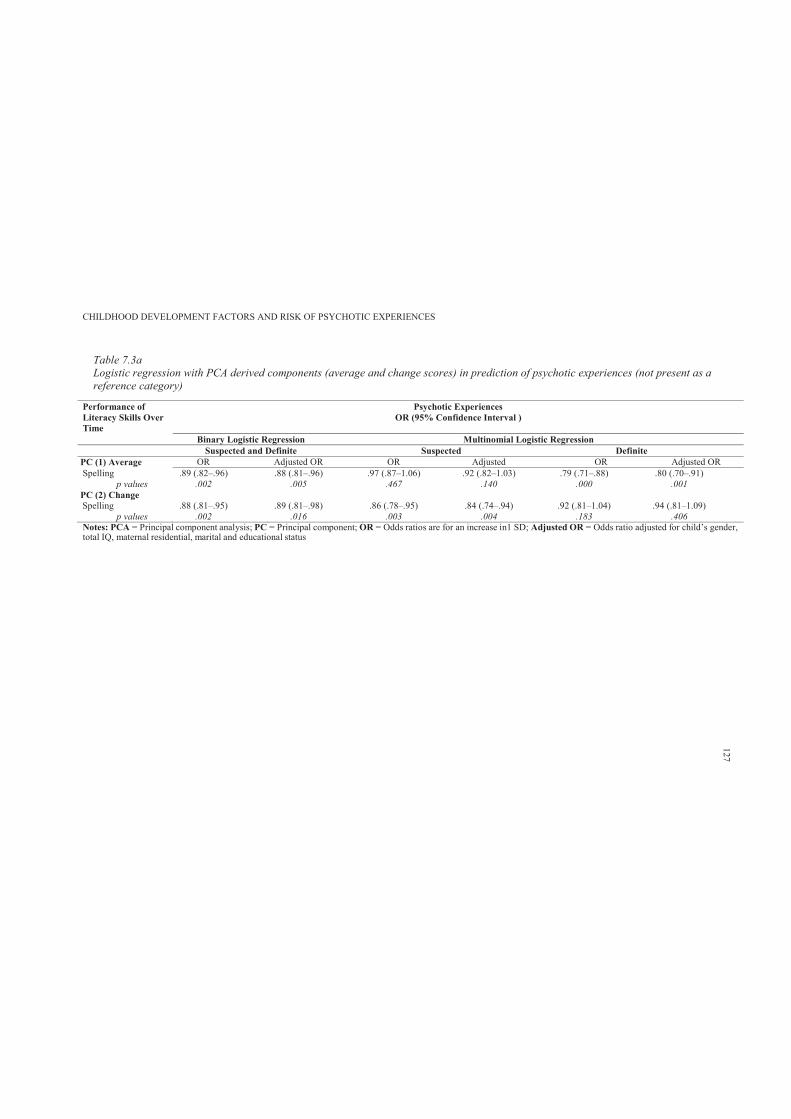
CHILDHOOD DEVELOPMENT FACTORS AND RISK OF PSYCHOTIC EXPERIENCES
Table 7.3aLogistic regression with PCA derived components (average and change scores) in prediction of psychotic experiences (not present as a reference category)
Performance of Literacy Skills Over Time
Psychotic ExperiencesOR (95% Confidence Interval )
Binary Logistic Regression Multinomial Logistic Regression Suspected and Definite Suspected Definite
PC (1) Average OR Adjusted OR OR Adjusted OR Adjusted ORSpelling .89 (.82–.96) .88 (.81–.96) .97 (.87–1.06) .92 (.82–1.03) .79 (.71–.88) .80 (.70–.91)
p values .002 .005 .467 .140 .000 .001 PC (2) ChangeSpelling .88 (.81–.95) .89 (.81–.98) .86 (.78–.95) .84 (.74–.94) .92 (.81–1.04) .94 (.81–1.09)
p values .002 .016 .003 .004 .183 .406Notes: PCA = Principal component analysis; PC = Principal component; OR = Odds ratios are for an increase in1 SD; Adjusted OR = Odds ratio adjusted for child’s gender,total IQ, maternal residential, marital and educational status
127
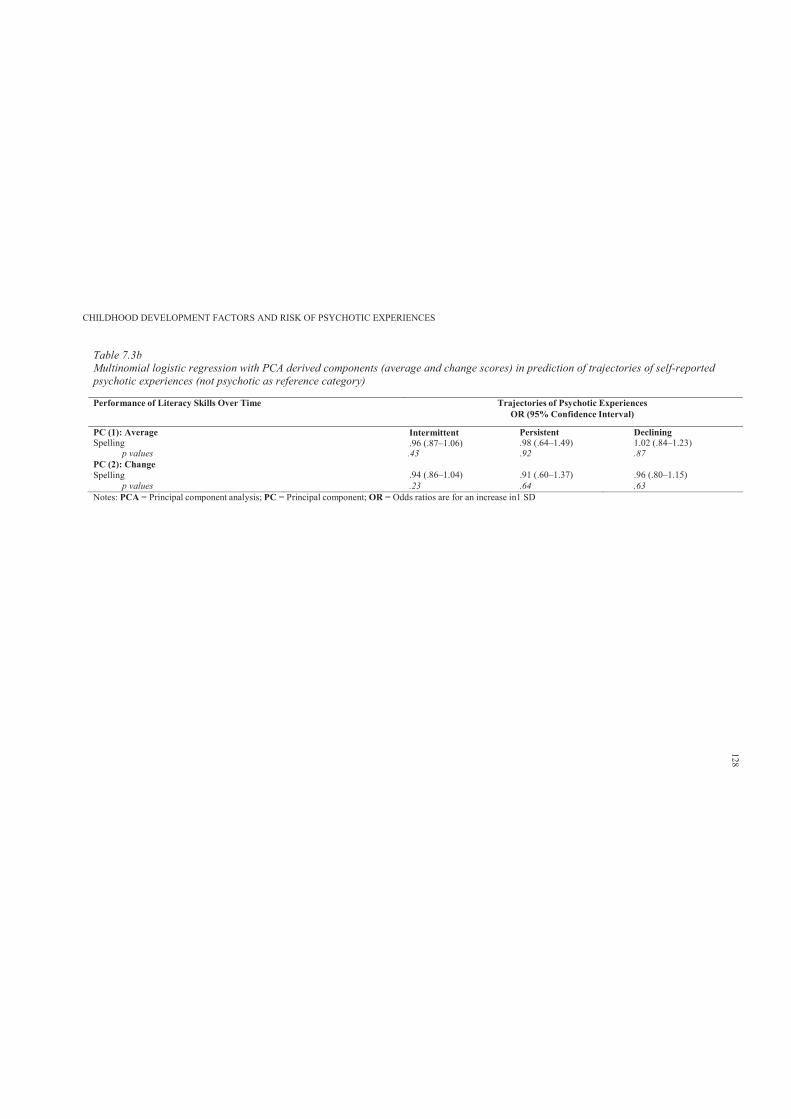
CHILDHOOD DEVELOPMENT FACTORS AND RISK OF PSYCHOTIC EXPERIENCES
Table 7.3bMultinomial logistic regression with PCA derived components (average and change scores) in prediction of trajectories of self-reported psychotic experiences (not psychotic as reference category)
Performance of Literacy Skills Over Time Trajectories of Psychotic ExperiencesOR (95% Confidence Interval)
PC (1): AverageSpelling
Intermittent.96 (.87–1.06)
Persistent.98 (.64–1.49)
Declining1.02 (.84–1.23)
p values .43 .92 .87PC (2): ChangeSpelling .94 (.86–1.04) .91 (.60–1.37) .96 (.80–1.15)
p values .23 .64 .63Notes: PCA = Principal component analysis; PC = Principal component; OR = Odds ratios are for an increase in1 SD
128
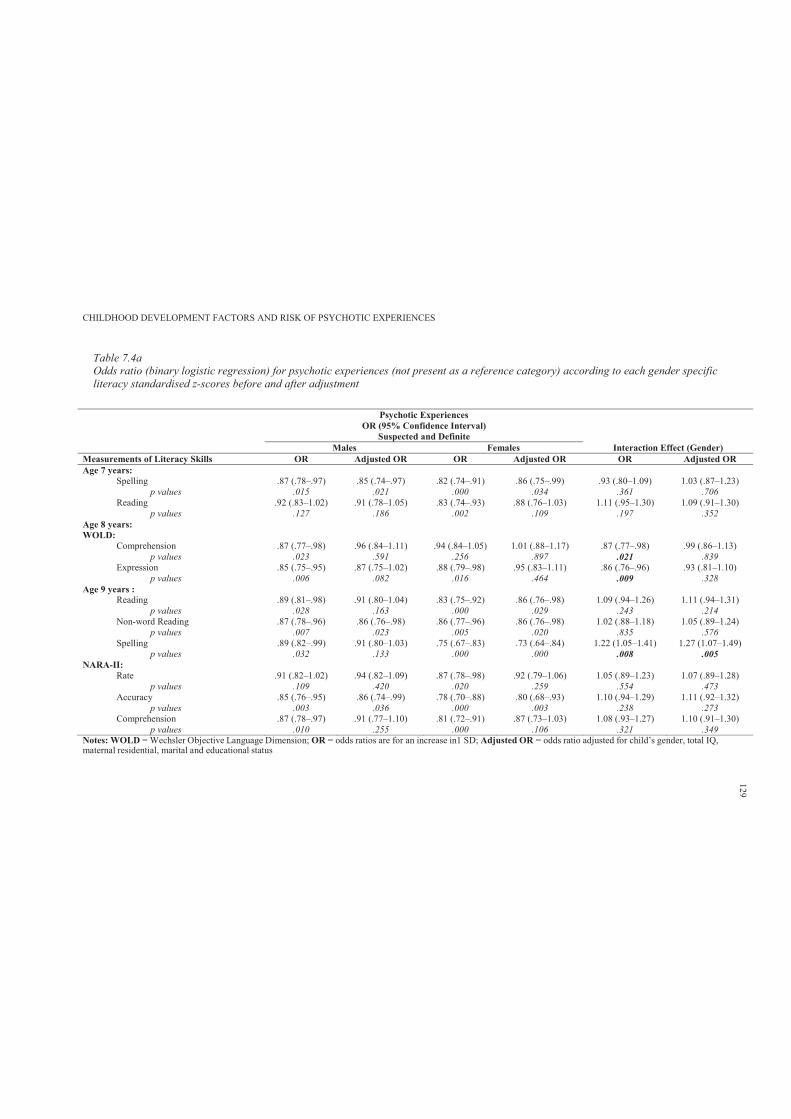
CHILDHOOD DEVELOPMENT FACTORS AND RISK OF PSYCHOTIC EXPERIENCES
Table 7.4aOdds ratio (binary logistic regression) for psychotic experiences (not present as a reference category) according to each gender specific literacy standardised z-scores before and after adjustment
Notes: WOLD = Wechsler Objective Language Dimension; OR = odds ratios are for an increase in1 SD; Adjusted OR = odds ratio adjusted for child’s gender, total IQ, maternal residential, marital and educational status
Psychotic ExperiencesOR (95% Confidence Interval)
Suspected and Definite Males Females Interaction Effect (Gender)
Measurements of Literacy Skills OR Adjusted OR OR Adjusted OR OR Adjusted OR Age 7 years:
Spelling .87 (.78–.97) .85 (.74–.97) .82 (.74–.91) .86 (.75–.99) .93 (.80–1.09) 1.03 (.87–1.23)p values .015 .021 .000 .034 .361 .706
Reading .92 (.83–1.02) .91 (.78–1.05) .83 (.74–.93) .88 (.76–1.03) 1.11 (.95–1.30) 1.09 (.91–1.30)p values .127 .186 .002 .109 .197 .352
Age 8 years:WOLD:
Comprehension .87 (.77–.98) .96 (.84–1.11) .94 (.84–1.05) 1.01 (.88–1.17) .87 (.77–.98) .99 (.86–1.13)p values .023 .591 .256 .897 .021 .839
Expression .85 (.75–.95) .87 (.75–1.02) .88 (.79–.98) .95 (.83–1.11) .86 (.76–.96) .93 (.81–1.10)p values .006 .082 .016 .464 .009 .328
Age 9 years :Reading .89 (.81–.98) .91 (.80–1.04) .83 (.75–.92) .86 (.76–.98) 1.09 (.94–1.26) 1.11 (.94–1.31)
p values .028 .163 .000 .029 .243 .214Non-word Reading .87 (.78–.96) .86 (.76–.98) .86 (.77–.96) .86 (.76–.98) 1.02 (.88–1.18) 1.05 (.89–1.24)
p values .007 .023 .005 .020 .835 .576Spelling .89 (.82–.99) .91 (.80–1.03) .75 (.67–.83) .73 (.64–.84) 1.22 (1.05–1.41) 1.27 (1.07–1.49)
p values .032 .133 .000 .000 .008 .005NARA-II:
Rate .91 (.82–1.02) .94 (.82–1.09) .87 (.78–.98) .92 (.79–1.06) 1.05 (.89–1.23) 1.07 (.89–1.28)p values .109 .420 .020 .259 .554 .473
Accuracy .85 (.76–.95) .86 (.74–.99) .78 (.70–.88) .80 (.68–.93) 1.10 (.94–1.29) 1.11 (.92–1.32)p values .003 .036 .000 .003 .238 .273
Comprehension .87 (.78–.97) .91 (.77–1.10) .81 (.72–.91) .87 (.73–1.03) 1.08 (.93–1.27) 1.10 (.91–1.30)p values .010 .255 .000 .106 .321 .349
129
CHILDHOOD DEVELOPMENT FACTORS AND RISK OF PSYCHOTIC EXPERIENCES 130
Similarly, there was no evidence that associations between literacy skills and trajectories
of PEs differed according to gender (see Tables 7.4b and 7.4c). However, while females with a
declining pattern of PEs were more likely to have higher scores on the NARA-II comprehension
task (adjusted OR = 1.16, 95% CI = 1.02–1.33), females with intermittent PEs over time were
more likely to have lower scores on the WOLD comprehension task than were males (adjusted OR
= .92, 95% CI = .86–.98).
7.4 Discussion
This study was the first to use prospectively collected data from ALSPAC to examine the
association between child literacy skills and PEs in early adolescence. The hypothesis that the risk
of reporting PEs increases as a function of poor antecedent literacy skills was supported. The
results also supported the hypothesis that both a consistently low and a declining pattern of
literacy performance over time would be associated with experience of PEs. This study’s findings
do not support those of Welham and colleagues (2010), who found that a relative decline in
speech predicts psychotic disorders specifically in male participants.
Further, the hypothesis that the risk of reporting persistent PEs over time increases as a
function of poor antecedent literacy skills was not supported. The results did not support the
hypothesis that measurements of literacy skills would distinguish between non- psychotic,
decreasing, intermittent and persistent classes of PEs, with persistent class associated with lower
literacy skills (detailed discussion is provided in Section 13.1.1).
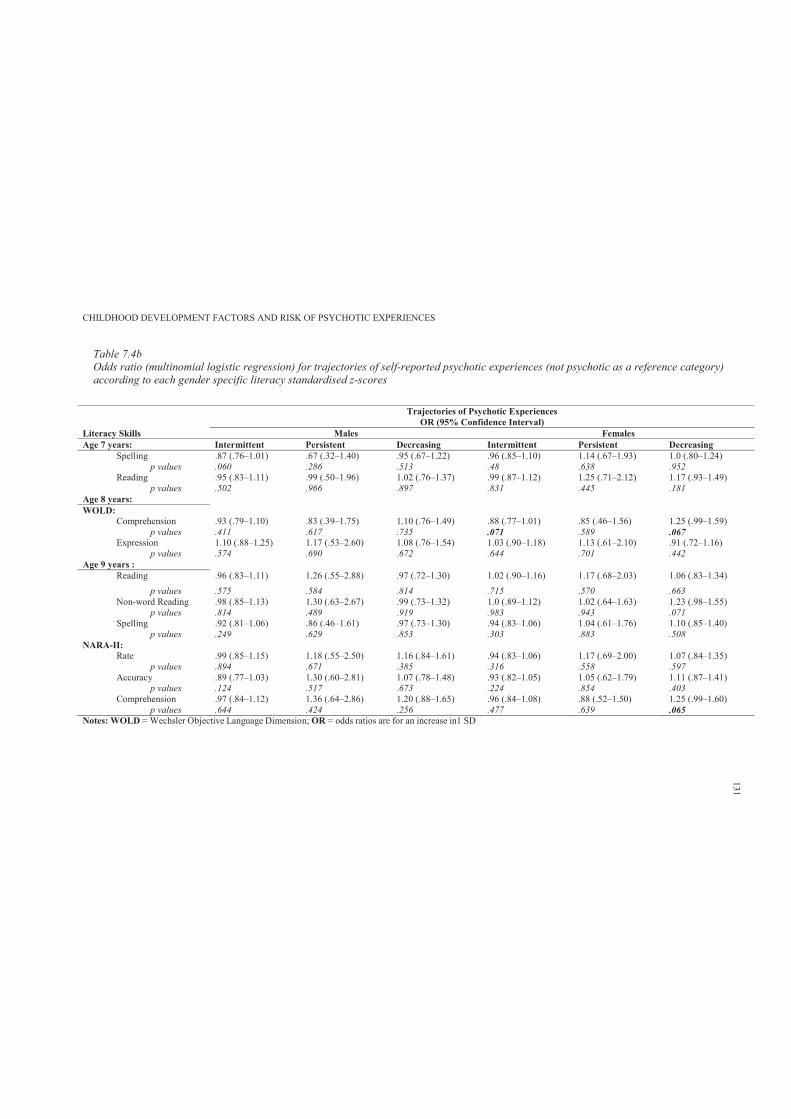
CHILDHOOD DEVELOPMENT FACTORS AND RISK OF PSYCHOTIC EXPERIENCES
Table 7.4bOdds ratio (multinomial logistic regression) for trajectories of self-reported psychotic experiences (not psychotic as a reference category)according to each gender specific literacy standardised z-scores
Notes: WOLD = Wechsler Objective Language Dimension; OR = odds ratios are for an increase in1 SD
Trajectories of Psychotic ExperiencesOR (95% Confidence Interval)
Literacy Skills Males Females Age 7 years: Intermittent Persistent Decreasing Intermittent Persistent Decreasing
Spelling .87 (.76–1.01) .67 (.32–1.40) .95 (.67–1.22) .96 (.85–1.10) 1.14 (.67–1.93) 1.0 (.80–1.24)p values .060 .286 .513 .48 .638 .952
Reading .95 (.83–1.11) .99 (.50–1.96) 1.02 (.76–1.37) .99 (.87–1.12) 1.25 (.71–2.12) 1.17 (.93–1.49)p values .502 .966 .897 .831 .445 .181
Age 8 years:WOLD:
Comprehension .93 (.79–1.10) .83 (.39–1.75) 1.10 (.76–1.49) .88 (.77–1.01) .85 (.46–1.56) 1.25 (.99–1.59)p values .411 .617 .735 .071 .589 .067
Expression 1.10 (.88–1.25) 1.17 (.53–2.60) 1.08 (.76–1.54) 1.03 (.90–1.18) 1.13 (.61–2.10) .91 (.72–1.16)p values .574 .690 .672 .644 .701 .442
Age 9 years :Reading .96 (.83–1.11) 1.26 (.55–2.88) .97 (.72–1.30) 1.02 (.90–1.16) 1.17 (.68–2.03) 1.06 (.83–1.34)
p values .575 .584 .814 .715 .570 .663Non-word Reading .98 (.85–1.13) 1.30 (.63–2.67) .99 (.73–1.32) 1.0 (.89–1.12) 1.02 (.64–1.63) 1.23 (.98–1.55)
p values .814 .489 .919 .983 .943 .071Spelling .92 (.81–1.06) .86 (.46–1.61) .97 (.73–1.30) .94 (.83–1.06) 1.04 (.61–1.76) 1.10 (.85–1.40)
p values .249 .629 .853 .303 .883 .508NARA-II:
Rate .99 (.85–1.15) 1.18 (.55–2.50) 1.16 (.84–1.61) .94 (.83–1.06) 1.17 (.69–2.00) 1.07 (.84–1.35)p values .894 .671 .385 .316 .558 .597
Accuracy .89 (.77–1.03) 1.30 (.60–2.81) 1.07 (.78–1.48) .93 (.82–1.05) 1.05 (.62–1.79) 1.11 (.87–1.41)p values .124 .517 .673 .224 .854 .403
Comprehension .97 (.84–1.12) 1.36 (.64–2.86) 1.20 (.88–1.65) .96 (.84–1.08) .88 (.52–1.50) 1.25 (.99–1.60)p values .644 .424 .256 .477 .639 .065
131
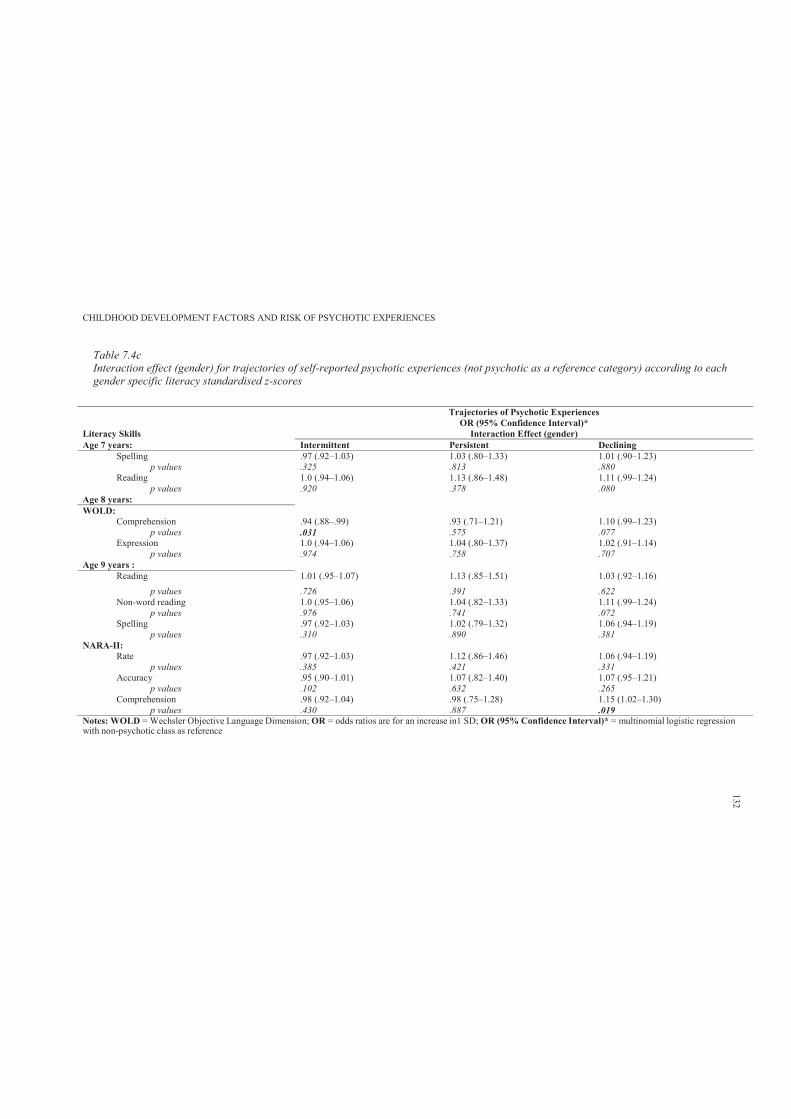
CHILDHOOD DEVELOPMENT FACTORS AND RISK OF PSYCHOTIC EXPERIENCES
Table 7.4cInteraction effect (gender) for trajectories of self-reported psychotic experiences (not psychotic as a reference category) according to each gender specific literacy standardised z-scores
Notes: WOLD = Wechsler Objective Language Dimension; OR = odds ratios are for an increase in1 SD; OR (95% Confidence Interval)* = multinomial logistic regressionwith non-psychotic class as reference
Trajectories of Psychotic ExperiencesOR (95% Confidence Interval)*
Literacy Skills Interaction Effect (gender)Age 7 years: Intermittent Persistent Declining
Spelling .97 (.92–1.03) 1.03 (.80–1.33) 1.01 (.90–1.23)p values .325 .813 .880
Reading 1.0 (.94–1.06) 1.13 (.86–1.48) 1.11 (.99–1.24)p values .920 .378 .080
Age 8 years:WOLD:
Comprehension .94 (.88–.99) .93 (.71–1.21) 1.10 (.99–1.23)p values .031 .575 .077
Expression 1.0 (.94–1.06) 1.04 (.80–1.37) 1.02 (.91–1.14)p values .974 .758 .707
Age 9 years :Reading 1.01 (.95–1.07) 1.13 (.85–1.51) 1.03 (.92–1.16)
p values .726 .391 .622Non-word reading 1.0 (.95–1.06) 1.04 (.82–1.33) 1.11 (.99–1.24)
p values .976 .741 .072 Spelling .97 (.92–1.03) 1.02 (.79–1.32) 1.06 (.94–1.19)
p values .310 .890 .381NARA-II:
Rate .97 (.92–1.03) 1.12 (.86–1.46) 1.06 (.94–1.19)p values .385 .421 .331
Accuracy .95 (.90–1.01) 1.07 (.82–1.40) 1.07 (.95–1.21)p values .102 .632 .265
Comprehension .98 (.92–1.04) .98 (.75–1.28) 1.15 (1.02–1.30)p values .430 .887 .019
132

CHILDHOOD DEVELOPMENT FACTORS AND RISK OF PSYCHOTIC EXPERIENCES 133
Chapter 8: Study 2: Childhood Attention Skills
8.1 Introduction
Given the clear relationship between adult onset schizophrenia and cognitive impairments,
there has been longstanding interest in the cognitive profiles of children at risk of developing
schizophrenia. Chapter 2 reviewed various aspects of childhood cognition at different
developmental periods as predictors of adult onset schizophrenia. This review found that children
of parents presenting with schizophrenia had subtle differences in the cognitive domain of
functioning, particularly as regards attention and information processing. However, relatively few
studies have examined childhood attention skills in children with elevated risk for schizophrenia.
Further, to this researcher’s knowledge, no study has examined childhood attention and inhibitory
control skills in relation to risk of reporting PEs in early adolescence. The study of attentional and
inhibitory control skills in relation to PEs during adolescence may serve a preventative function
for children with elevated risk of psychotic symptoms.
The aim of this study11 was to draw on data from ALSPAC to examine prediction of PEs
in early adolescence by childhood performance on attention and inhibitory tasks. It was
hypothesised that impaired performance in attentional skills during childhood would increase risk
of reporting PEs. In addition, it was hypothesised that deteriorating attention skills over time
would be associated with experience of PEs. Further, it was hypothesised that higher attentional
problems would be associated with greater risk of reporting PEs.
8.2 Method
8.2.1 Sample.
The sample characteristics are described in Section 6.2.6.
11 Hameed, M. A., Lewis, A., Sullivan, S., & Zammit, S. (26 – 28 September 2013). Attention skills and psychotic-
like-symptoms in a non-clinical population: Results from the ALSPAC birth cohort. Main findings presented at the
4th European Conference on Schizophrenia Research, Berlin, Germany
CHILDHOOD DEVELOPMENT FACTORS AND RISK OF PSYCHOTIC EXPERIENCES 134
8.2.2 Participants.
Participants’ details are provided in Section 6.2.2.
8.2.3 Measures.
8.2.3.1. Primary outcome.
The primary outcome was presence of PEs, with the not present group as a reference
category (detailed description is provided in Section 6.2.3).
8.2.3.2. Secondary outcome.
The trajectories of change in self-reported PEs were used as secondary outcome variables
(detailed description is provided in Section 6.2.3).
8.2.3.3. Attention skills.
An adapted version of TEACh (Robertson et al., 1996) was used to measure selective,
divided attention and attentional control during ALSPAC annual assessment clinics at 8 and 11
years. The attention sessions took approximately 20 minutes to perform, and were conducted by
trained psychologists. All attention scores from TEACh were recorded as time taken in seconds.
Therefore, higher scores reflected poorer performance (i.e., longer time taken to achieve the
required task).
I. Selective attention and motor control: Sky search task
The child was introduced to the task as ‘playing some outer space games’. The tester
explained that there were many spaceships, which always travelled around in pairs, and that in
some pairs the two spaceships were identical, while in some pairs the two spaceships were
different. The tester illustrated the former by circling a pair that was identical, roughly and
quickly. The child was first asked to work through a practice sheet and circle the identical pairs as
quickly as possible, but not missing any out. The child was asked to tick a box on the sheet to
indicate that he or she had circled all the identical pairs he or she could find. Errors during the
practice were not recorded. After the practice, a larger sheet was presented to the child containing
more pairs of spaceships (twenty of which were identical), and the child was asked to do the same.
The time taken was recorded in seconds.
CHILDHOOD DEVELOPMENT FACTORS AND RISK OF PSYCHOTIC EXPERIENCES 135
Further, the above task for selective attention was repeated without the non-identical pairs
of spaceships, such that only twenty identical pairs remained (but in a different array from the first
sheet). The aim of this task was to identify how quickly the child was at this motor task, so that
motor performance could be controlled for. In this study, the adjusted main score (adjusted for
motor speed) was used.
II. Divided attention: Dual task
The selective attention task was repeated. However, the child was also asked to count the
number of spaceship noises played together in series of differing lengths throughout the task. This
task was also preceded by a practice attempt and difficulties with the procedure were discussed
with the child. As for the previous task, the emphasis was on the speed of circling all the identical
pairs of spaceships, without missing any out. However, this time, at the end of each sequence of
spaceship noises, the child also had to tell the tester how many spaceships sounds he or she heard.
The time taken to complete the task was recorded in seconds.
III. Attentional control: Opposite worlds task
The opposite worlds sub-task from the TEACh is a type of Stroop task, where the child is
required to give a verbal response that contradicts the visual information he or she is given. The
child was shown a trail made up of the numbers 1 and 2 (with 24 numbers in total). In the ‘same
world’ (control) condition, he or she had to read the numbers out as they were, as quickly as
possible (while the tester kept his or her finger next to each in the trail until the child had read it
correctly). In the ‘opposite world’ condition, the child had to inhibit a pre-potent (very familiar)
response, and call out ‘two’ when he or she reached a 1 and ‘one’ when he or she reached a 2 (and
again, the tester kept his or her finger by the number until the child had given the correct
response). The child was given a demonstration of each condition and had a practice attempt at
each before being reminded of the rules. There were four test trials: a same world trial, followed
by two opposite world trials and finishing with another same world trial.
This study used the mean time taken (in seconds) for the same world condition (calculated
from the same world trials) and the mean time taken for the opposite world condition (calculated
from the opposite world trials).

CHILDHOOD DEVELOPMENT FACTORS AND RISK OF PSYCHOTIC EXPERIENCES 136
8.2.3.4. Inhibitory control skills.
Inhibitory control skills were assessed by the computerised Stop Signal Task (Logan et al.,
1984) during an annual assessment clinic at 10 years. This task observes the child’s ability to
inhibit a body movement that has already been requested using a computerised measure of
impulsivity, the Stop Signal Task. The child sat in front of a computer monitor and their two index
fingers were placed in two stimulus boxes, one labelled X and one labelled O. Two types of trials
were performed, primary task trials and stop signal trials.
I. Primary task trial
In this task, the child was asked to fixate on a small smiley face presented in the centre of
the computer screen. An X or O would then be presented on the screen and the child had to press
the corresponding button as quickly as possible. Thirty trials were completed (15 X’s and 15 O’s).
The computer calculated a mean reaction time for the task. These trials familiarised the child with
the task.
II. Stop signal task trial
This task was identical to the primary task, but a bleep was heard (stop signal) randomly
after the X or O appeared (the go signal). If the bleep was not heard, the child was asked to press
the corresponding button according to what was presented on screen. When the bleep was
sounded, the child had to refrain from pressing the response button, therefore inhibiting the
stimulus response. The bleep sounded on random trials at 150 ms or 250 ms before the child’s
reaction time (as calculated in the primary task trials). This second block of trials consisted of 24
practice trials, comprising 8 primary task trials and 16 stop signal trials (five at each of the two
intervals). Two further blocks of trials were completed: the experimental blocks. These blocks
consisted of a 48 trials: 32 without bleeps, and 16 with bleeps.
According to Handley et al. (2004) the primary measures of performance for this task are
accuracy on the primary trial, stop signal trials and mean reaction time. These measures were used
in prediction of PEs.
8.2.3.5. Attention skills (questionnaire).
The child’s primary carer, usually the mother, completed self-administered postal
CHILDHOOD DEVELOPMENT FACTORS AND RISK OF PSYCHOTIC EXPERIENCES 137
questionnaires about themselves and their child’s development, environmental exposures and
health outcomes approximately every 6 months from birth to age 7 years and every year thereafter
(questionnaires are available at the ALSPAC website at http://www.bristol.ac.uk/alspac/sci-
com/quests/). These questionnaires were compiled and designed by the ALSPAC study team.
At the child’s mean age of 13.10 years, a self-report version of the DAWBA (Goodman et
al., 2000) was completed by ALSPAC mothers. The DAWBA evaluates information from
multiple sources such as a parent interview, an interview for young people aged 11 or more, a
teacher questionnaire and a computer-assisted clinical diagnostic rating based on the interviews
and questionnaires to generate ICD-10 and DSM-IV psychiatric diagnoses on 5–l6-year-olds. The
present study used only data from the attention section of the DAWBA self-report version.
8.2.4 Covariates.
Detailed description of covariates is presented in Section 6.2.5.
8.2.5 Data manipulation and statistical analyses.
8.2.5.1. Attention skills scores (assessment).
All attention scores were recorded as time taken in seconds. Descriptive statistics were
used to describe the pattern of attention ability by PEs groups and trajectories. Higher scores
reflected poorer performance (longer time taken to achieve the required task).
Binary and multinomial logistic regression was then used to examine the relationship
between these abilities and PEs.
Further, due to the problems of repeated measures when examining change (Tu &
Gilthorpe, 2007), the change in attention skills over time was examined by applying PCA to
measures of both time points. These identified two factors, where factor 1 represented the average
performance across both time points and factor 2 represented change (refer to Section 7.2.5 for
further details). These factors were used as continuous variables in prediction of PEs.
8.2.5.2. Attention skills scores (questionnaire).
In this study, the researcher evaluated the internal consistency and explored the factor
structure of the parent self-report DAWBA (attention section, 21 items). Satisfactory reliability,
with a 0.94 Cronbach’s alpha coefficient, was obtained for all 21 items. Exploratory factor
CHILDHOOD DEVELOPMENT FACTORS AND RISK OF PSYCHOTIC EXPERIENCES 138
analysis using maximum likelihood with oblimin rotation revealed a Kaiser-Meyer-Olkin (KMO)
statistic of .96 and a significant Bartlett test of sphericity, supporting the existence of an
underlying factor structure.
Three factors emerged with eigenvalues greater than 1 (cumulative % of variance =
63.43). Table 8.4 shows the three-factor solution. Factor 1 was closely related to cognitive and
behavioural distractibility (eigenvalue = 10.09, % of variance = 48.04). Factor 2 included items
related to cognitive and behavioural overactivity (eigenvalue = 2.10, % of variance = 9.97). Factor
3 included items related to being impulsive (eigenvalue = 1.14, % of variance = 5.42). Higher
scores on these factors reflected greater problems respectively. The saved standardised factor
scores were then used as continuous predictors of PEs using binary and multinomial logistic
regression with and without adjustment for covariates.
8.3 Results
8.3.1 Participants and missing data.
A total of 6790 (44.6%) children from the ALSPAC cohort completed the PLIKS semi-
structured interview at mean age 12. The other 8360 (55.4%) children did not attend the PLIKS
interview, but some had participated in the attention and inhibitory skills assessment sessions. The
independent sample t-test analyses revealed no major differences in measurements of attention
and inhibitory control skills for those with missing PLIKS data (see Appendix 8.A). In this study,
no statistical method was used for imputing missing values. This study reports the results only for
children who completed the PLIKS interview at mean age 12.
8.3.2 Sample characteristics.
Detailed description of sample characteristics is provided in Section 6.2.6.
8.3.3 Predicting psychotic experiences from childhood attention skills.
Table 8.1a presents the descriptive statistics for the measurements of attention and
inhibitory control skills by PEs groups. The results show that for the majority of the attention
control skills measured at 8 years, the suspected and definite group had considerably higher scores
(longer time taken to achieve the required task) than did the not present group. Further, the
definite group had even higher scores than those with suspected PEs. Those with suspected or
CHILDHOOD DEVELOPMENT FACTORS AND RISK OF PSYCHOTIC EXPERIENCES 139
definite PEs had considerably higher scores on the divided attention task (M = 128.82, SD =
46.61) than did the not present group (M = 123.56, SD = 43.33). In addition, the definite group
had even higher scores on the divided attention task (M = 131.35, SD = 49.07) than those with
suspected PEs (M = 127.05, SD = 44.79).
Table 8.2a shows that for the majority of the measurements of attention control skills,
there was an association with presence of PEs. These associations were attenuated after adjusting
for child- and parental-related confounders (adjustment for child- and parental-covariates were
combined due to their small effects). While the results show some evidence of association for the
divided attention (adjusted OR = 1.00, 95% CI = 1.00–1.01, p = .030) and same world attentional
control tasks (adjusted OR = 1.04, 95% CI = 1.01– 1.08, p =.017), there was weak evidence for
the remaining measurements of attentional control skills.
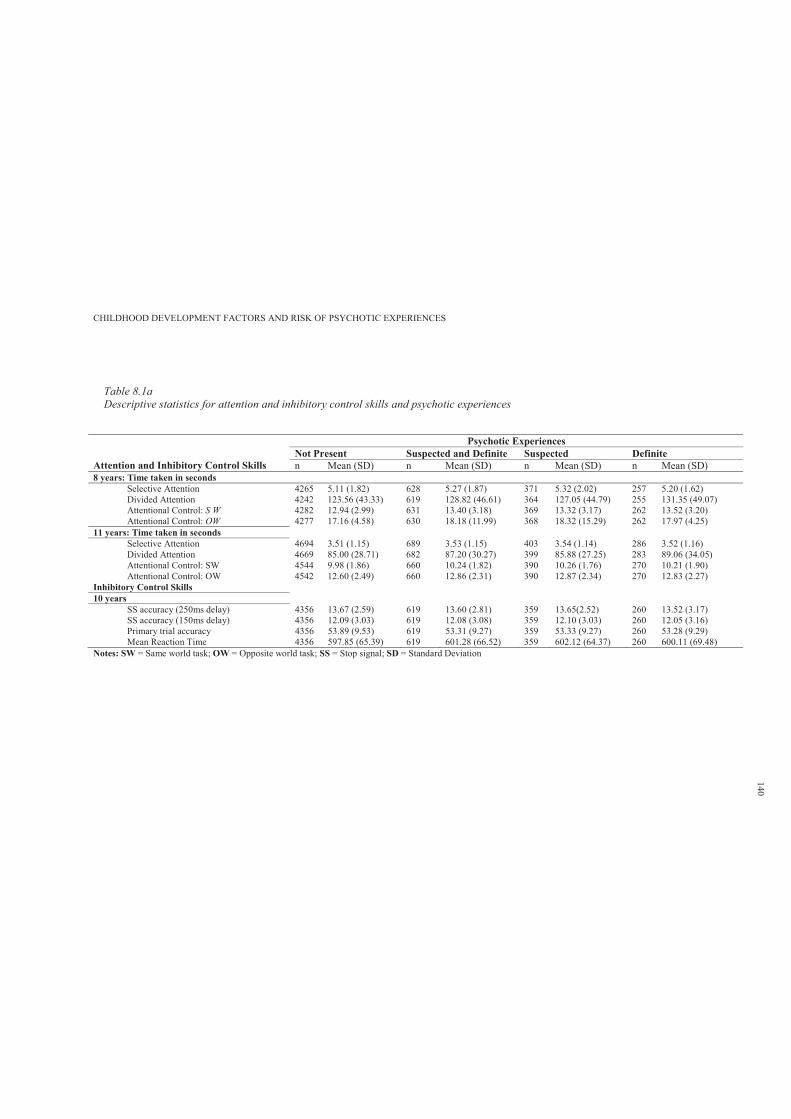
CHILDHOOD DEVELOPMENT FACTORS AND RISK OF PSYCHOTIC EXPERIENCES
Table 8.1aDescriptive statistics for attention and inhibitory control skills and psychotic experiences
Psychotic Experiences
Attention and Inhibitory Control Skills Not Present Suspected and Definite Suspected Definiten Mean (SD) n Mean (SD) n Mean (SD) n Mean (SD)
8 years: Time taken in secondsSelective Attention 4265 5.11 (1.82) 628 5.27 (1.87) 371 5.32 (2.02) 257 5.20 (1.62)Divided Attention 4242 123.56 (43.33) 619 128.82 (46.61) 364 127.05 (44.79) 255 131.35 (49.07)Attentional Control: S W 4282 12.94 (2.99) 631 13.40 (3.18) 369 13.32 (3.17) 262 13.52 (3.20)Attentional Control: OW 4277 17.16 (4.58) 630 18.18 (11.99) 368 18.32 (15.29) 262 17.97 (4.25)
11 years: Time taken in seconds Selective Attention 4694 3.51 (1.15) 689 3.53 (1.15) 403 3.54 (1.14) 286 3.52 (1.16)Divided Attention 4669 85.00 (28.71) 682 87.20 (30.27) 399 85.88 (27.25) 283 89.06 (34.05)Attentional Control: SW 4544 9.98 (1.86) 660 10.24 (1.82) 390 10.26 (1.76) 270 10.21 (1.90)Attentional Control: OW 4542 12.60 (2.49) 660 12.86 (2.31) 390 12.87 (2.34) 270 12.83 (2.27)
Inhibitory Control Skills 10 years
SS accuracy (250ms delay) 4356 13.67 (2.59) 619 13.60 (2.81) 359 13.65(2.52) 260 13.52 (3.17)SS accuracy (150ms delay) 4356 12.09 (3.03) 619 12.08 (3.08) 359 12.10 (3.03) 260 12.05 (3.16)Primary trial accuracy 4356 53.89 (9.53) 619 53.31 (9.27) 359 53.33 (9.27) 260 53.28 (9.29)Mean Reaction Time 4356 597.85 (65.39) 619 601.28 (66.52) 359 602.12 (64.37) 260 600.11 (69.48)
Notes: SW = Same world task; OW = Opposite world task; SS = Stop signal; SD = Standard Deviation
140
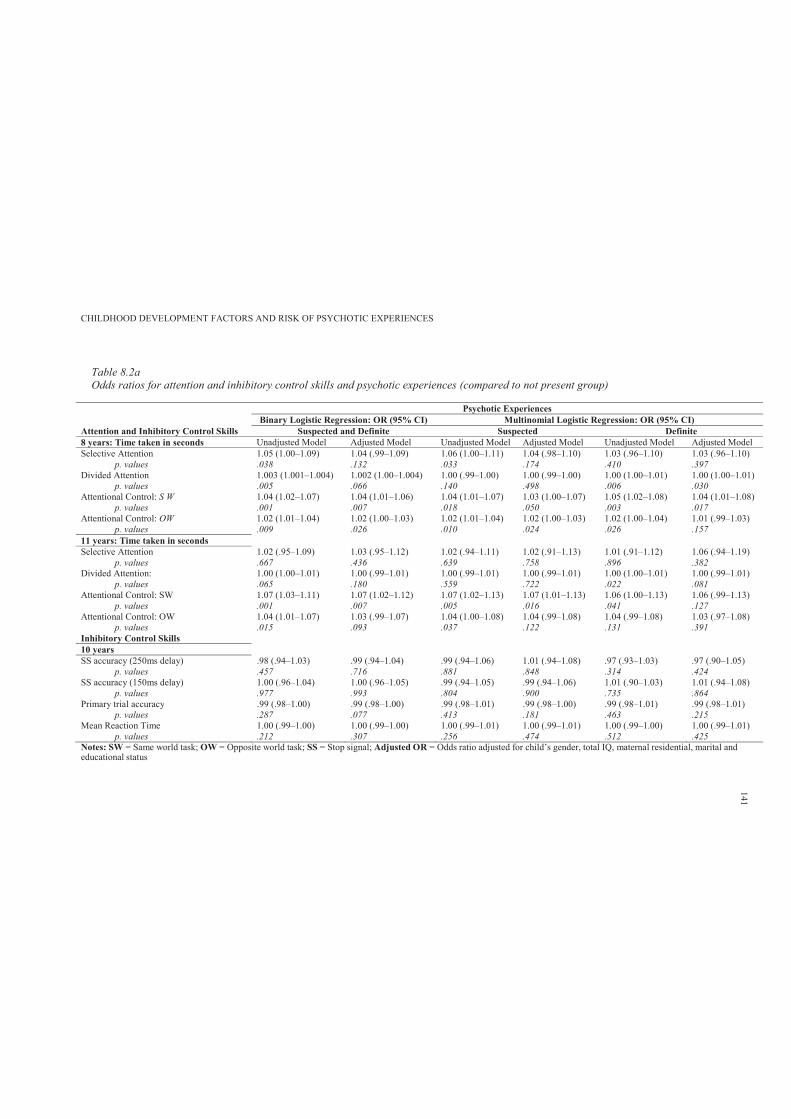
CHILDHOOD DEVELOPMENT FACTORS AND RISK OF PSYCHOTIC EXPERIENCES
Table 8.2aOdds ratios for attention and inhibitory control skills and psychotic experiences (compared to not present group)
Psychotic ExperiencesBinary Logistic Regression: OR (95% CI) Multinomial Logistic Regression: OR (95% CI)
Attention and Inhibitory Control Skills Suspected and Definite Suspected Definite8 years: Time taken in seconds Unadjusted Model Adjusted Model Unadjusted Model Adjusted Model Unadjusted Model Adjusted Model Selective Attention 1.05 (1.00–1.09) 1.04 (.99–1.09) 1.06 (1.00–1.11) 1.04 (.98–1.10) 1.03 (.96–1.10) 1.03 (.96–1.10)
p. values .038 .132 .033 .174 .410 .397Divided Attention 1.003 (1.001–1.004) 1.002 (1.00–1.004) 1.00 (.99–1.00) 1.00 (.99–1.00) 1.00 (1.00–1.01) 1.00 (1.00–1.01)
p. values .005 .066 .140 .498 .006 .030Attentional Control: S W 1.04 (1.02–1.07) 1.04 (1.01–1.06) 1.04 (1.01–1.07) 1.03 (1.00–1.07) 1.05 (1.02–1.08) 1.04 (1.01–1.08)
p. values .001 .007 .018 .050 .003 .017Attentional Control: OW 1.02 (1.01–1.04) 1.02 (1.00–1.03) 1.02 (1.01–1.04) 1.02 (1.00–1.03) 1.02 (1.00–1.04) 1.01 (.99–1.03)
p. values .009 .026 .010 .024 .026 .15711 years: Time taken in seconds Selective Attention 1.02 (.95–1.09) 1.03 (.95–1.12) 1.02 (.94–1.11) 1.02 (.91–1.13) 1.01 (.91–1.12) 1.06 (.94–1.19)
p. values .667 .436 .639 .758 .896 .382Divided Attention: 1.00 (1.00–1.01) 1.00 (.99–1.01) 1.00 (.99–1.01) 1.00 (.99–1.01) 1.00 (1.00–1.01) 1.00 (.99–1.01)
p. values .065 .180 .559 .722 .022 .081Attentional Control: SW 1.07 (1.03–1.11) 1.07 (1.02–1.12) 1.07 (1.02–1.13) 1.07 (1.01–1.13) 1.06 (1.00–1.13) 1.06 (.99–1.13)
p. values .001 .007 .005 .016 .041 .127Attentional Control: OW 1.04 (1.01–1.07) 1.03 (.99–1.07) 1.04 (1.00–1.08) 1.04 (.99–1.08) 1.04 (.99–1.08) 1.03 (.97–1.08)
p. values .015 .093 .037 .122 .131 .391Inhibitory Control Skills 10 yearsSS accuracy (250ms delay) .98 (.94–1.03) .99 (.94–1.04) .99 (.94–1.06) 1.01 (.94–1.08) .97 (.93–1.03) .97 (.90–1.05)
p. values .457 .716 .881 .848 .314 .424SS accuracy (150ms delay) 1.00 (.96–1.04) 1.00 (.96–1.05) .99 (.94–1.05) .99 (.94–1.06) 1.01 (.90–1.03) 1.01 (.94–1.08)
p. values .977 .993 .804 .900 .735 .864Primary trial accuracy .99 (.98–1.00) .99 (.98–1.00) .99 (.98–1.01) .99 (.98–1.00) .99 (.98–1.01) .99 (.98–1.01)
p. values .287 .077 .413 .181 .463 .215Mean Reaction Time 1.00 (.99–1.00) 1.00 (.99–1.00) 1.00 (.99–1.01) 1.00 (.99–1.01) 1.00 (.99–1.00) 1.00 (.99–1.01)
p. values .212 .307 .256 .474 .512 .425Notes: SW = Same world task; OW = Opposite world task; SS = Stop signal; Adjusted OR = Odds ratio adjusted for child’s gender, total IQ, maternal residential, marital andeducational status
141
CHILDHOOD DEVELOPMENT FACTORS AND RISK OF PSYCHOTIC EXPERIENCES 142
Moreover, the results indicated that at age 11 years, relative to those with no PEs, those
with suspected and definite PEs had similar attentional control scores. There was no evidence of
association for selective, divided and attentional control in relation to reporting PEs. Similarly,
none of the stop signals inhibitory tasks were associated with greater risk of reporting PEs.
Further, the analysis of attention skills and trajectories of PEs revealed no significant
differences between the non-psychotic, intermittent, persistent and decreasing classes of PEs. The
descriptive statistics and odds ratios presented in Tables 8.1b and 8.2b, respectively, showed no
association between attentional and inhibitory control skills with persistent PEs over time.
However, only the decreasing class of PEs over time were found to have higher scores on the
opposite world attentional control task (adjusted OR = 1.02, 95% CI = 1.00–1.04, p = .013).
8.3.4 Predicting psychotic experiences from changes in attention performance over
time.
Table 8.3a shows that a consistently high average performance (reflecting poorer
performance, as longer time was taken to achieve the required task) in the selective attention
(adjusted OR = 1.09, 95% CI = 1.00–1.18, p = .050) and same world tasks of the attentional
control domain (adjusted OR = 1.11, 95% CI = 1.02–1.21, p = .020) were associated with PEs
‘suspected and definite.’ Further, only a declining pattern of performance in the opposite world
task of the attention control domain was associated with PEs (adjusted OR = 1.08, 95% CI = 1.00
– 1.17, p = .040). However, for the majority of the attention measurements, neither a consistently
high average (reflecting poor performance), nor a declining pattern of performance was associated
with PEs in early adolescence.
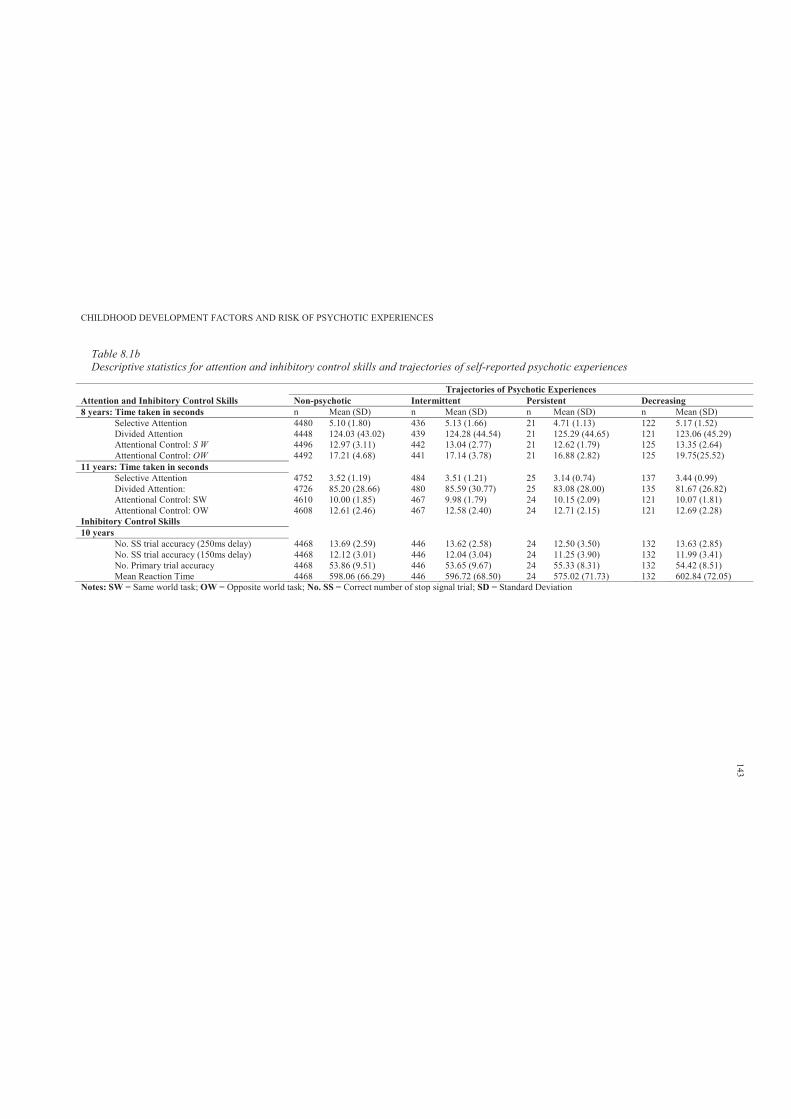
CHILDHOOD DEVELOPMENT FACTORS AND RISK OF PSYCHOTIC EXPERIENCES
Table 8.1bDescriptive statistics for attention and inhibitory control skills and trajectories of self-reported psychotic experiences
Trajectories of Psychotic Experiences
Attention and Inhibitory Control Skills Non-psychotic Intermittent Persistent Decreasing 8 years: Time taken in seconds n Mean (SD) n Mean (SD) n Mean (SD) n Mean (SD)
Selective Attention 4480 5.10 (1.80) 436 5.13 (1.66) 21 4.71 (1.13) 122 5.17 (1.52)Divided Attention 4448 124.03 (43.02) 439 124.28 (44.54) 21 125.29 (44.65) 121 123.06 (45.29)Attentional Control: S W 4496 12.97 (3.11) 442 13.04 (2.77) 21 12.62 (1.79) 125 13.35 (2.64)Attentional Control: OW 4492 17.21 (4.68) 441 17.14 (3.78) 21 16.88 (2.82) 125 19.75(25.52)
11 years: Time taken in seconds Selective Attention 4752 3.52 (1.19) 484 3.51 (1.21) 25 3.14 (0.74) 137 3.44 (0.99)Divided Attention: 4726 85.20 (28.66) 480 85.59 (30.77) 25 83.08 (28.00) 135 81.67 (26.82)Attentional Control: SW 4610 10.00 (1.85) 467 9.98 (1.79) 24 10.15 (2.09) 121 10.07 (1.81)Attentional Control: OW 4608 12.61 (2.46) 467 12.58 (2.40) 24 12.71 (2.15) 121 12.69 (2.28)
Inhibitory Control Skills 10 years
No. SS trial accuracy (250ms delay) 4468 13.69 (2.59) 446 13.62 (2.58) 24 12.50 (3.50) 132 13.63 (2.85)No. SS trial accuracy (150ms delay) 4468 12.12 (3.01) 446 12.04 (3.04) 24 11.25 (3.90) 132 11.99 (3.41)No. Primary trial accuracy 4468 53.86 (9.51) 446 53.65 (9.67) 24 55.33 (8.31) 132 54.42 (8.51)Mean Reaction Time 4468 598.06 (66.29) 446 596.72 (68.50) 24 575.02 (71.73) 132 602.84 (72.05)
Notes: SW = Same world task; OW = Opposite world task; No. SS = Correct number of stop signal trial; SD = Standard Deviation
143
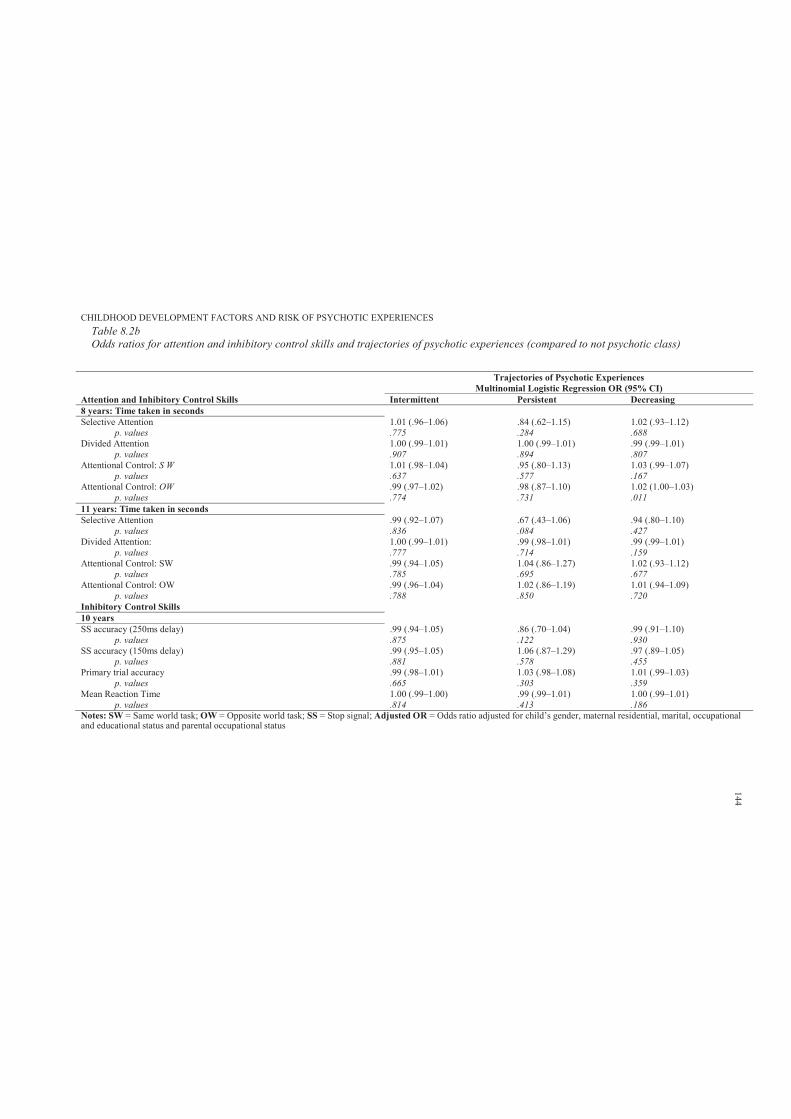
CHILDHOOD DEVELOPMENT FACTORS AND RISK OF PSYCHOTIC EXPERIENCESTable 8.2bOdds ratios for attention and inhibitory control skills and trajectories of psychotic experiences (compared to not psychotic class)
Trajectories of Psychotic ExperiencesMultinomial Logistic Regression OR (95% CI)
Attention and Inhibitory Control Skills Intermittent Persistent Decreasing8 years: Time taken in secondsSelective Attention 1.01 (.96–1.06) .84 (.62–1.15) 1.02 (.93–1.12)
p. values .775 .284 .688Divided Attention 1.00 (.99–1.01) 1.00 (.99–1.01) .99 (.99–1.01)
p. values .907 .894 .807Attentional Control: S W 1.01 (.98–1.04) .95 (.80–1.13) 1.03 (.99–1.07)
p. values .637 .577 .167Attentional Control: OW .99 (.97–1.02) .98 (.87–1.10) 1.02 (1.00–1.03)
p. values .774 .731 .01111 years: Time taken in seconds Selective Attention .99 (.92–1.07) .67 (.43–1.06) .94 (.80–1.10)
p. values .836 .084 .427Divided Attention: 1.00 (.99–1.01) .99 (.98–1.01) .99 (.99–1.01)
p. values .777 .714 .159Attentional Control: SW .99 (.94–1.05) 1.04 (.86–1.27) 1.02 (.93–1.12)
p. values .785 .695 .677Attentional Control: OW .99 (.96–1.04) 1.02 (.86–1.19) 1.01 (.94–1.09)
p. values .788 .850 .720Inhibitory Control Skills 10 yearsSS accuracy (250ms delay) .99 (.94–1.05) .86 (.70–1.04) .99 (.91–1.10)
p. values .875 .122 .930SS accuracy (150ms delay) .99 (.95–1.05) 1.06 (.87–1.29) .97 (.89–1.05)
p. values .881 .578 .455Primary trial accuracy .99 (.98–1.01) 1.03 (.98–1.08) 1.01 (.99–1.03)
p. values .665 .303 .359Mean Reaction Time 1.00 (.99–1.00) .99 (.99–1.01) 1.00 (.99–1.01)
p. values .814 .413 .186Notes: SW = Same world task; OW = Opposite world task; SS = Stop signal; Adjusted OR = Odds ratio adjusted for child’s gender, maternal residential, marital, occupationaland educational status and parental occupational status
144
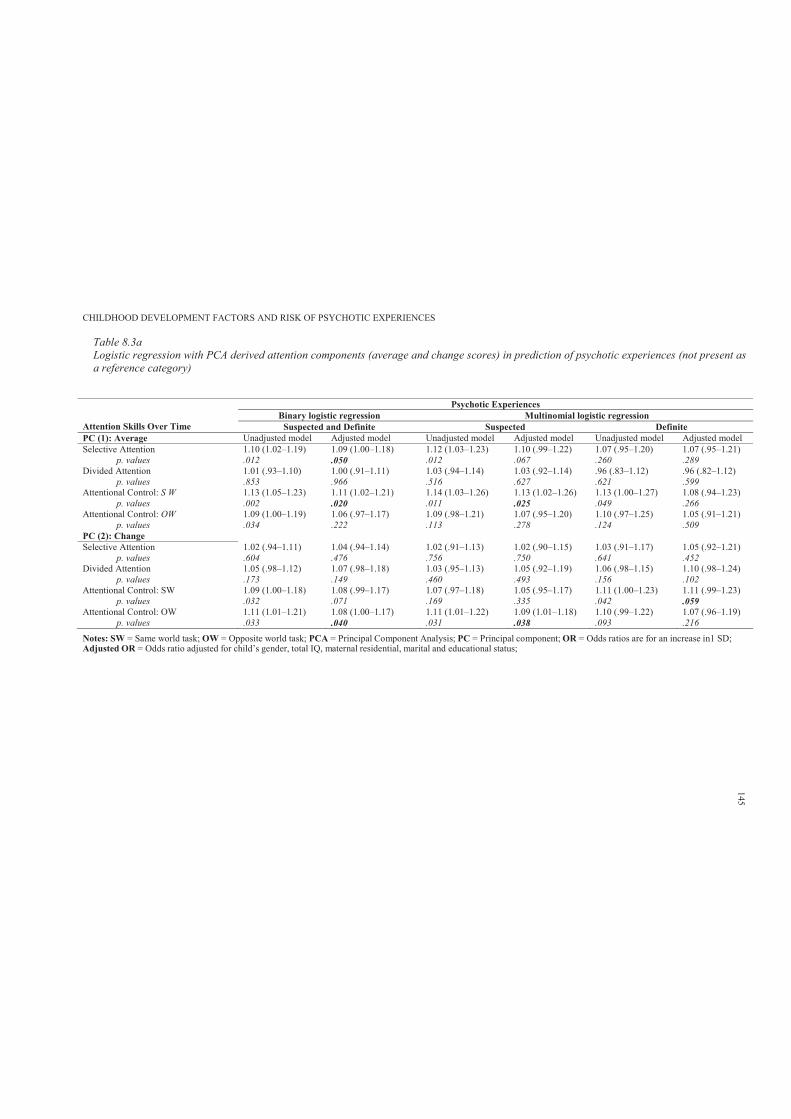
CHILDHOOD DEVELOPMENT FACTORS AND RISK OF PSYCHOTIC EXPERIENCES
Table 8.3aLogistic regression with PCA derived attention components (average and change scores) in prediction of psychotic experiences (not present as a reference category)
Psychotic Experiences
Attention Skills Over Time Binary logistic regression Multinomial logistic regression
Suspected and Definite Suspected DefinitePC (1): Average Unadjusted model Adjusted model Unadjusted model Adjusted model Unadjusted model Adjusted model Selective Attention 1.10 (1.02–1.19) 1.09 (1.00–1.18) 1.12 (1.03–1.23) 1.10 (.99–1.22) 1.07 (.95–1.20) 1.07 (.95–1.21)
p. values .012 .050 .012 .067 .260 .289Divided Attention 1.01 (.93–1.10) 1.00 (.91–1.11) 1.03 (.94–1.14) 1.03 (.92–1.14) .96 (.83–1.12) .96 (.82–1.12)
p. values .853 .966 .516 .627 .621 .599Attentional Control: S W 1.13 (1.05–1.23) 1.11 (1.02–1.21) 1.14 (1.03–1.26) 1.13 (1.02–1.26) 1.13 (1.00–1.27) 1.08 (.94–1.23)
p. values .002 .020 .011 .025 .049 .266Attentional Control: OW 1.09 (1.00–1.19) 1.06 (.97–1.17) 1.09 (.98–1.21) 1.07 (.95–1.20) 1.10 (.97–1.25) 1.05 (.91–1.21)
p. values .034 .222 .113 .278 .124 .509PC (2): Change Selective Attention 1.02 (.94–1.11) 1.04 (.94–1.14) 1.02 (.91–1.13) 1.02 (.90–1.15) 1.03 (.91–1.17) 1.05 (.92–1.21)
p. values .604 .476 .756 .750 .641 .452Divided Attention 1.05 (.98–1.12) 1.07 (.98–1.18) 1.03 (.95–1.13) 1.05 (.92–1.19) 1.06 (.98–1.15) 1.10 (.98–1.24)
p. values .173 .149 .460 .493 .156 .102Attentional Control: SW 1.09 (1.00–1.18) 1.08 (.99–1.17) 1.07 (.97–1.18) 1.05 (.95–1.17) 1.11 (1.00–1.23) 1.11 (.99–1.23)
p. values .032 .071 .169 .335 .042 .059Attentional Control: OW 1.11 (1.01–1.21) 1.08 (1.00–1.17) 1.11 (1.01–1.22) 1.09 (1.01–1.18) 1.10 (.99–1.22) 1.07 (.96–1.19)
p. values .033 .040 .031 .038 .093 .216
Notes: SW = Same world task; OW = Opposite world task; PCA = Principal Component Analysis; PC = Principal component; OR = Odds ratios are for an increase in1 SD;Adjusted OR = Odds ratio adjusted for child’s gender, total IQ, maternal residential, marital and educational status;
145
CHILDHOOD DEVELOPMENT FACTORS AND RISK OF PSYCHOTIC EXPERIENCES 146
Table 8.3b shows the odds ratios associated with reporting PEs in relation to attention
performance over time. No association was found between persistent PEs and a consistently high
average (reflecting worse performance) or a declining pattern of attention performance over time.
8.3.5 Predicting psychotic experiences from DAWBA attention standardised factor
scores.
Table 8.4 shows the three-factor solution of the DAWBA attention section. Factors one
(eigenvalue = 10.09, % of variance = 48.04), two (eigenvalue = 2.10, % of variance = 9.97) and
three (eigenvalue = 1.14, % of variance = 5.42) were labelled distractibility, overactivity and
impulsivity, respectively. Higher scores on these factors reflected a greater tendency towards the
particular factor.
Table 8.5a shows that those with suspected or definite PEs had higher scores on the
distractibility and impulsivity factors than did the not present group. Further, the definite group
had even higher scores on the distractibility factor than did those with suspected PEs. Table 8.6a
shows evidence of an association between distractibility (adjusted OR = 1.32, 95% CI = 1.21–
1.43) and impulsivity (adjusted OR = 1.12, 95% CI = 1.02–1.22) and suspected and definite PEs.
The results showed no association between overactivity and greater risk of reporting PEs.
Further analysis revealed that individuals in the intermittent, persistent and decreasing
class of PEs had a higher score on the distractibility and impulsivity factors as compared to
individuals in the non-psychotic class (see Table 8.5b). However, only those with a decreasing
pattern of PEs over time were found to exhibit higher scores on the overactivity factor (M = .17,
SD = 1.50) as compared to the non-psychotic class (M = .00, SD = 0.95). This difference was not
statistically significant (adjusted OR = 1.02, 95% CI = .80–1.28).
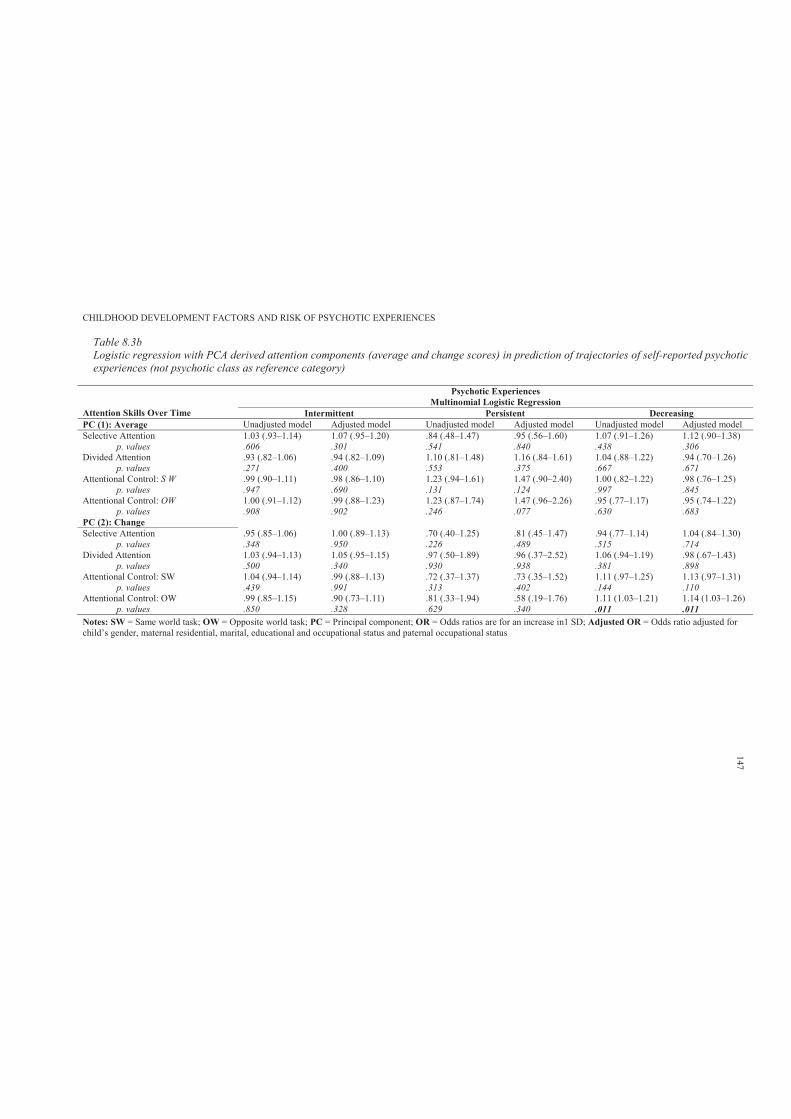
CHILDHOOD DEVELOPMENT FACTORS AND RISK OF PSYCHOTIC EXPERIENCES
Table 8.3bLogistic regression with PCA derived attention components (average and change scores) in prediction of trajectories of self-reported psychotic experiences (not psychotic class as reference category)
Psychotic Experiences
Attention Skills Over Time Multinomial Logistic Regression
Intermittent Persistent DecreasingPC (1): Average Unadjusted model Adjusted model Unadjusted model Adjusted model Unadjusted model Adjusted model Selective Attention 1.03 (.93–1.14) 1.07 (.95–1.20) .84 (.48–1.47) .95 (.56–1.60) 1.07 (.91–1.26) 1.12 (.90–1.38)
p. values .606 .301 .541 .840 .438 .306Divided Attention .93 (.82–1.06) .94 (.82–1.09) 1.10 (.81–1.48) 1.16 (.84–1.61) 1.04 (.88–1.22) .94 (.70–1.26)
p. values .271 .400 .553 .375 .667 .671Attentional Control: S W .99 (.90–1.11) .98 (.86–1.10) 1.23 (.94–1.61) 1.47 (.90–2.40) 1.00 (.82–1.22) .98 (.76–1.25)
p. values .947 .690 .131 .124 .997 .845Attentional Control: OW 1.00 (.91–1.12) .99 (.88–1.23) 1.23 (.87–1.74) 1.47 (.96–2.26) .95 (.77–1.17) .95 (.74–1.22)
p. values .908 .902 .246 .077 .630 .683PC (2): Change Selective Attention .95 (.85–1.06) 1.00 (.89–1.13) .70 (.40–1.25) .81 (.45–1.47) .94 (.77–1.14) 1.04 (.84–1.30)
p. values .348 .950 .226 .489 .515 .714Divided Attention 1.03 (.94–1.13) 1.05 (.95–1.15) .97 (.50–1.89) .96 (.37–2.52) 1.06 (.94–1.19) .98 (.67–1.43)
p. values .500 .340 .930 .938 .381 .898Attentional Control: SW 1.04 (.94–1.14) .99 (.88–1.13) .72 (.37–1.37) .73 (.35–1.52) 1.11 (.97–1.25) 1.13 (.97–1.31)
p. values .439 .991 .313 .402 .144 .110Attentional Control: OW .99 (.85–1.15) .90 (.73–1.11) .81 (.33–1.94) .58 (.19–1.76) 1.11 (1.03–1.21) 1.14 (1.03–1.26)
p. values .850 .328 .629 .340 .011 .011Notes: SW = Same world task; OW = Opposite world task; PC = Principal component; OR = Odds ratios are for an increase in1 SD; Adjusted OR = Odds ratio adjusted for child’s gender, maternal residential, marital, educational and occupational status and paternal occupational status
147
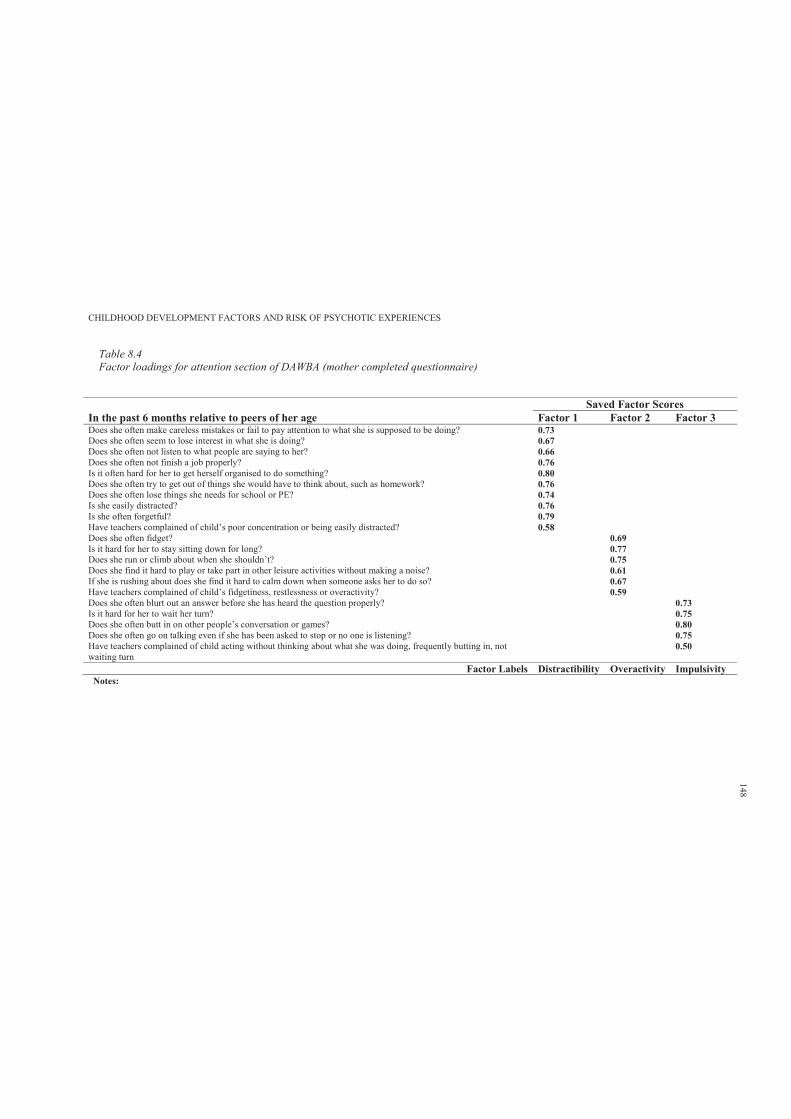
CHILDHOOD DEVELOPMENT FACTORS AND RISK OF PSYCHOTIC EXPERIENCES
Table 8.4Factor loadings for attention section of DAWBA (mother completed questionnaire)
Saved Factor ScoresIn the past 6 months relative to peers of her age Factor 1 Factor 2 Factor 3 Does she often make careless mistakes or fail to pay attention to what she is supposed to be doing? 0.73Does she often seem to lose interest in what she is doing? 0.67Does she often not listen to what people are saying to her? 0.66Does she often not finish a job properly? 0.76Is it often hard for her to get herself organised to do something? 0.80Does she often try to get out of things she would have to think about, such as homework? 0.76Does she often lose things she needs for school or PE? 0.74Is she easily distracted? 0.76Is she often forgetful? 0.79Have teachers complained of child’s poor concentration or being easily distracted? 0.58Does she often fidget? 0.69Is it hard for her to stay sitting down for long? 0.77Does she run or climb about when she shouldn’t? 0.75Does she find it hard to play or take part in other leisure activities without making a noise? 0.61If she is rushing about does she find it hard to calm down when someone asks her to do so? 0.67Have teachers complained of child’s fidgetiness, restlessness or overactivity? 0.59Does she often blurt out an answer before she has heard the question properly? 0.73Is it hard for her to wait her turn? 0.75Does she often butt in on other people’s conversation or games? 0.80Does she often go on talking even if she has been asked to stop or no one is listening? 0.75Have teachers complained of child acting without thinking about what she was doing, frequently butting in, not waiting turn
0.50
Factor Labels Distractibility Overactivity Impulsivity Notes:
148
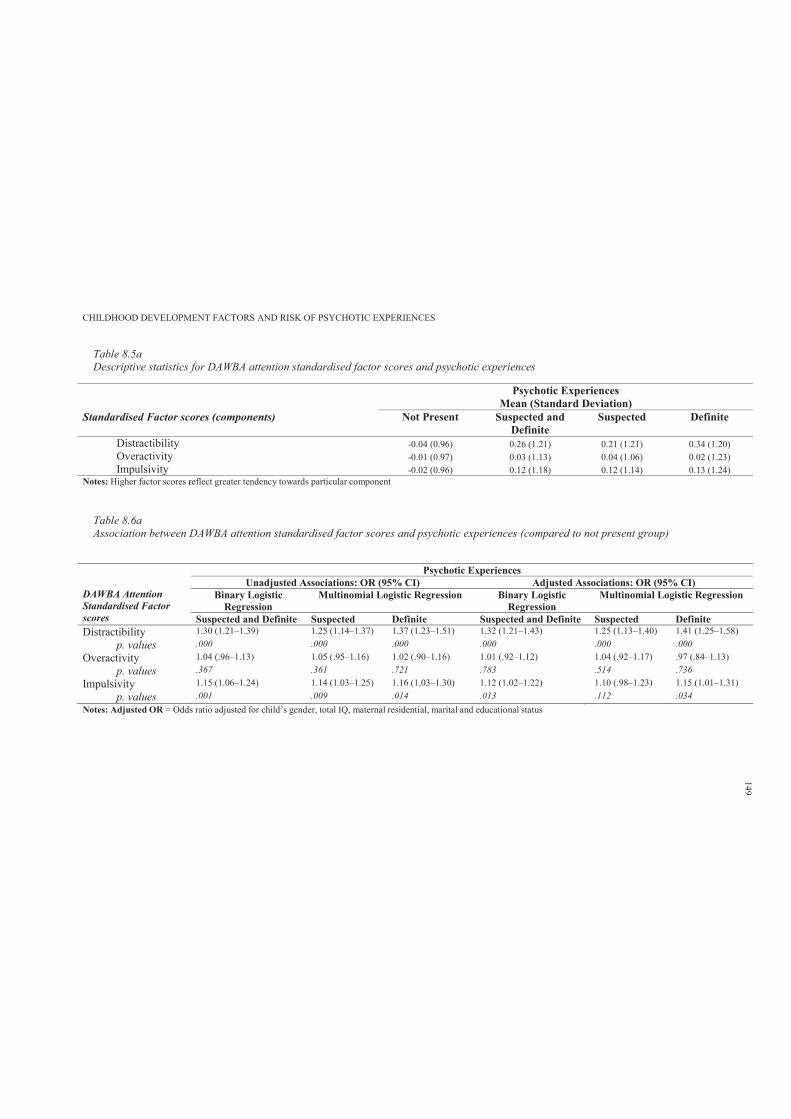
CHILDHOOD DEVELOPMENT FACTORS AND RISK OF PSYCHOTIC EXPERIENCES
Table 8.5aDescriptive statistics for DAWBA attention standardised factor scores and psychotic experiences
Psychotic ExperiencesMean (Standard Deviation)
Standardised Factor scores (components) Not Present Suspected and Definite
Suspected Definite
Distractibility -0.04 (0.96) 0.26 (1.21) 0.21 (1.21) 0.34 (1.20)Overactivity -0.01 (0.97) 0.03 (1.13) 0.04 (1.06) 0.02 (1.23)Impulsivity -0.02 (0.96) 0.12 (1.18) 0.12 (1.14) 0.13 (1.24)
Notes: Higher factor scores reflect greater tendency towards particular component
Table 8.6aAssociation between DAWBA attention standardised factor scores and psychotic experiences (compared to not present group)
DAWBA Attention Standardised Factor scores
Psychotic ExperiencesUnadjusted Associations: OR (95% CI) Adjusted Associations: OR (95% CI)
Binary Logistic Regression
Multinomial Logistic Regression Binary Logistic Regression
Multinomial Logistic Regression
Suspected and Definite Suspected Definite Suspected and Definite Suspected Definite Distractibility 1.30 (1.21–1.39) 1.25 (1.14–1.37) 1.37 (1.23–1.51) 1.32 (1.21–1.43) 1.25 (1.13–1.40) 1.41 (1.25–1.58)
p. values .000 .000 .000 .000 .000 .000Overactivity 1.04 (.96–1.13) 1.05 (.95–1.16) 1.02 (.90–1.16) 1.01 (.92–1.12) 1.04 (.92–1.17) .97 (.84–1.13)
p. values .367 .361 .721 .783 .514 .736Impulsivity 1.15 (1.06–1.24) 1.14 (1.03–1.25) 1.16 (1.03–1.30) 1.12 (1.02–1.22) 1.10 (.98–1.23) 1.15 (1.01–1.31)
p. values .001 .009 .014 .013 .112 .034Notes: Adjusted OR = Odds ratio adjusted for child’s gender, total IQ, maternal residential, marital and educational status
149
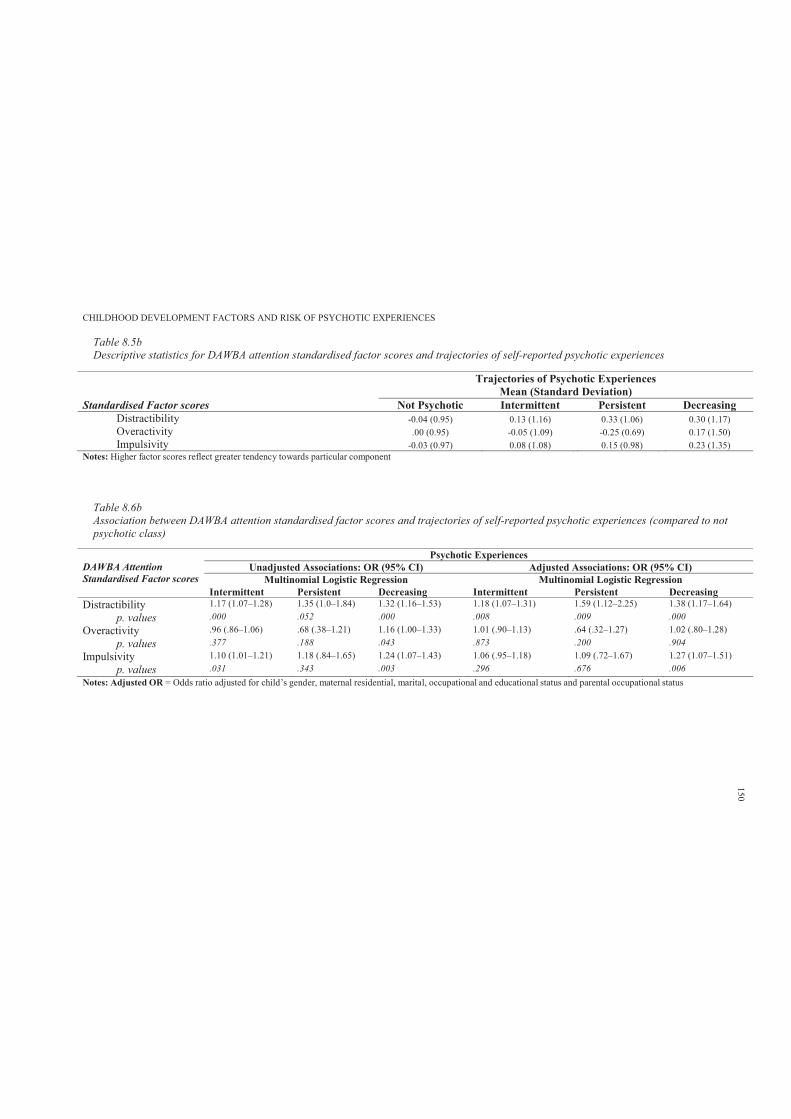
CHILDHOOD DEVELOPMENT FACTORS AND RISK OF PSYCHOTIC EXPERIENCES
Table 8.5bDescriptive statistics for DAWBA attention standardised factor scores and trajectories of self-reported psychotic experiences
Trajectories of Psychotic ExperiencesMean (Standard Deviation)
Standardised Factor scores Not Psychotic Intermittent Persistent Decreasing Distractibility -0.04 (0.95) 0.13 (1.16) 0.33 (1.06) 0.30 (1.17)Overactivity .00 (0.95) -0.05 (1.09) -0.25 (0.69) 0.17 (1.50)Impulsivity -0.03 (0.97) 0.08 (1.08) 0.15 (0.98) 0.23 (1.35)
Notes: Higher factor scores reflect greater tendency towards particular component
Table 8.6bAssociation between DAWBA attention standardised factor scores and trajectories of self-reported psychotic experiences (compared to not psychotic class)
DAWBA Attention Standardised Factor scores
Psychotic ExperiencesUnadjusted Associations: OR (95% CI) Adjusted Associations: OR (95% CI)
Multinomial Logistic Regression Multinomial Logistic Regression Intermittent Persistent Decreasing Intermittent Persistent Decreasing
Distractibility 1.17 (1.07–1.28) 1.35 (1.0–1.84) 1.32 (1.16–1.53) 1.18 (1.07–1.31) 1.59 (1.12–2.25) 1.38 (1.17–1.64)p. values .000 .052 .000 .008 .009 .000
Overactivity .96 (.86–1.06) .68 (.38–1.21) 1.16 (1.00–1.33) 1.01 (.90–1.13) .64 (.32–1.27) 1.02 (.80–1.28)p. values .377 .188 .043 .873 .200 .904
Impulsivity 1.10 (1.01–1.21) 1.18 (.84–1.65) 1.24 (1.07–1.43) 1.06 (.95–1.18) 1.09 (.72–1.67) 1.27 (1.07–1.51)p. values .031 .343 .003 .296 .676 .006
Notes: Adjusted OR = Odds ratio adjusted for child’s gender, maternal residential, marital, occupational and educational status and parental occupational status
150
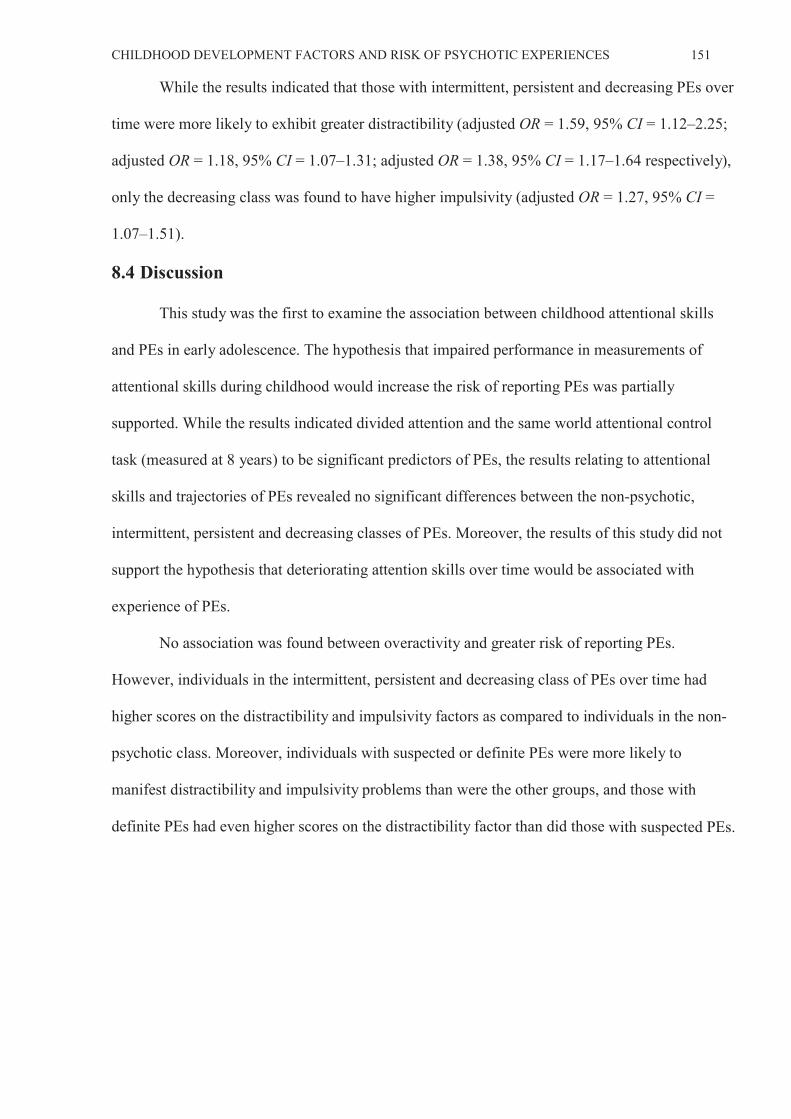
CHILDHOOD DEVELOPMENT FACTORS AND RISK OF PSYCHOTIC EXPERIENCES 151
While the results indicated that those with intermittent, persistent and decreasing PEs over
time were more likely to exhibit greater distractibility (adjusted OR = 1.59, 95% CI = 1.12–2.25;
adjusted OR = 1.18, 95% CI = 1.07–1.31; adjusted OR = 1.38, 95% CI = 1.17–1.64 respectively),
only the decreasing class was found to have higher impulsivity (adjusted OR = 1.27, 95% CI =
1.07–1.51).
8.4 Discussion
This study was the first to examine the association between childhood attentional skills
and PEs in early adolescence. The hypothesis that impaired performance in measurements of
attentional skills during childhood would increase the risk of reporting PEs was partially
supported. While the results indicated divided attention and the same world attentional control
task (measured at 8 years) to be significant predictors of PEs, the results relating to attentional
skills and trajectories of PEs revealed no significant differences between the non-psychotic,
intermittent, persistent and decreasing classes of PEs. Moreover, the results of this study did not
support the hypothesis that deteriorating attention skills over time would be associated with
experience of PEs.
No association was found between overactivity and greater risk of reporting PEs.
However, individuals in the intermittent, persistent and decreasing class of PEs over time had
higher scores on the distractibility and impulsivity factors as compared to individuals in the non-
psychotic class. Moreover, individuals with suspected or definite PEs were more likely to
manifest distractibility and impulsivity problems than were the other groups, and those with
definite PEs had even higher scores on the distractibility factor than did those with suspected PEs.
CHILDHOOD DEVELOPMENT FACTORS AND RISK OF PSYCHOTIC EXPERIENCES 152
Chapter 9: Study 3: Childhood Motor Skills
9.1 Introduction
The research literature indicates that children of parents presenting with schizophrenia
show subtle differences in multiple developmental indices, including on their neurological and
motor profiles (see Chapter 2). While childhood motor difficulties may be associated with
increased risk of schizophrenia, their relation to PEs in early adolescence has been insufficiently
studied. Indeed, to the researcher’s knowledge, no study has yet examined the association of
childhood motor skills and PEs. It is argued that if PEs represent an early vulnerability to
schizophrenia, then they would share similar childhood neurodevelopmental indicators (e.g.,
motor difficulties) with schizophrenia.
The aim of this study12 was to examine the association between childhood motor skills and
PEs in early adolescence. This would considerably add to the emerging literature that children
with motor difficulties throughout developmental periods (reflecting neurodevelopmental
impairment) may have an increased risk of PEs, and arguably schizophrenia. It was hypothesised
that relative to the group unaffected by PEs, experience of adolescent PEs would be associated
with childhood motor difficulties. Further, it was hypothesised that those with childhood motor
difficulties would be more likely to have persistent PEs over time.
9.2 Method
9.2.1 Sample.
The sample characteristics are described in Section 6.2.6.
9.2.2 Participants.
Participants’ details are provided in Section 6.2.2.
12 Hameed, M. A., Lingam, R., Zammit, S., Lewis, A. J. & Sullivan, S. (2013). Childhood motor skills and psychotic
experiences in adolescence: Results from the ALSPAC study. Manuscript in preparation
CHILDHOOD DEVELOPMENT FACTORS AND RISK OF PSYCHOTIC EXPERIENCES 153
9.2.3 Measures.
9.2.3.1. Primary outcome.
The primary outcome was the presence of either suspected or definite PEs, with the not
present group as a reference category (detailed description is provided in Section 6.2.3).
9.2.3.2. Secondary outcome.
The trajectories of change in self-reported PEs were used as the secondary outcome
variables (detailed description is provided in Section 6.2.3).
9.2.3.3. Childhood motor skills.
The M-ABC (Henderson & Sugden, 1992) for age band two (7–8 years) was used to
assess participants’ motor competency. While the M-ABC for age band two consists of eight tasks
within three domains: manual dexterity, ball skills and balance (static and dynamic), due to time
constraints, only specific subtests from each domain (threading lace and placing pegs; bean bags;
and heel to toe walking) were used, respectively.
As per the M-ABC manual, practice trials were given on each task before the child
performed a number of trials on the task, with the child’s best performance on each task taken as
the test score. In addition, the raw performance score for each item was converted into a scaled
score ranging from 0 to 5, with lower scores indicating better performance. These scores were
then summed to produce a total score ranging from 0 to 40, with high scores indicating poor
performance. However, total score was not available due to incomplete M-ABC assessment.
9.2.4 Covariates
Detailed description is provided in Section 6.2.5.
9.2.5 Data manipulation and statistical analyses
The total motor impairment score was not available, since only specific items of M- ABC
were used. Scaled scores for individual M-ABC items ranged from 0 to 5. According to
Henderson and Sugden (1992), scaled scores of 0 and 1 together indicate a relative lack of motor
difficulties; scores of 2 and 3 reflect borderline; and scores 4 and 5 reflect definite motor
difficulties. Three categories were computed (no motor difficulties, borderline and definite
difficulties) and these were used as categorical predictors of PEs using binary and multinomial
CHILDHOOD DEVELOPMENT FACTORS AND RISK OF PSYCHOTIC EXPERIENCES 154
logistic regression.
9.3 Results
9.3.1 Sample characteristics.
Detailed description of sample characteristics is provided in Section 6.2.6.
9.3.2 Participants and missing data.
A total of 6790 (44.6%) children from the ALSPAC cohort completed the PLIKS semi-
structured interview at mean age 12. A further 8360 (55.4%) children did not attend the PLIKS
interview, but some had participated in the motor skills assessment session. Appendix 9.A shows
the frequency distribution and significant statistics of motor categories for those who had and had
not completed the PLIKS interview. The distribution of motor impairments showed no difference
according to whether a PLIKS interview had been completed. However, 20 (2.6%) participants
who did not complete the PLIKS interview were found to have borderline difficulties with the
heel to toe walking task as compared to 54 (1.2%) participants who completed the PLIKS
interview (over all cross tabulation: 2 = 8.717, p = .013). In this study, missing values were not
computed; the results are based on only those children who completed the PLIKS interview and
questionnaires.
9.3.3 Predicting suspected and definite PEs from childhood motor skills.
Table 9.1a shows the frequencies and percentages of the motor difficulty categories for the
M-ABC items according to PEs groups. Table 9.2a shows that relative to the not present group,
those with suspected or definite PEs were more likely to have motor difficulties with: (a) manual
dexterity (definite difficulties with the placing pegs M-ABC item; adjusted OR = 2.73, 95% CI =
1.22–6.13); (b) ball skills (borderline difficulties with the bean bags M-ABC item; adjusted OR =
1.35, 95% CI = 1.08–1.70); and (c) dynamic balance (borderline difficulties with the heel to toe
walking M-ABC item; adjusted OR = 2.39, 95% CI = 1.10–5.19). Further, those with definite PEs
were more likely to have borderline motor difficulties with the bean bags item of the M-ABC
(adjusted OR = 1.42, 95 % CI = 1.01–1.99). However, while those with definite PEs were more
likely to have borderline motor difficulties with the heel to toe walking item of the M-ABC
(adjusted OR = 4.77, 95% CI = 2.00–11.38), those with suspected PEs were more likely to have
CHILDHOOD DEVELOPMENT FACTORS AND RISK OF PSYCHOTIC EXPERIENCES 155
definite difficulties with the placing pegs item (adjusted OR = 4.24, 95% CI = 1.82–9.89).
9.3.4 Predicting persistent PEs over time from childhood motor skills.
Table 9.1b shows the frequencies and percentages of the motor difficulty categories for the
M-ABC items according to trajectories of PEs over time. Relative to the non- psychotic class,
33.3% of those with persistent PEs over time were found to have definite difficulties with the
threading lace task. Further, 36.8% of those with persistent PEs were found to have borderline
difficulties with the bean bags task, and 5.9% with the heel to toe walking task of the M-ABC.
However, as Table 9.2b shows, while a moderate association was found for those with intermittent
and borderline PEs (adjusted OR = 1.45, 95% CI = 1.10–1.91) and definite PEs (adjusted OR =
1.75, 95% CI = 1.17–2.62) for bean bags task- related motor difficulties, there was weak evidence
of association for heel to toe walking task difficulties and persistent PEs (adjusted OR = 8.57,
95% CI = .96–76.77).
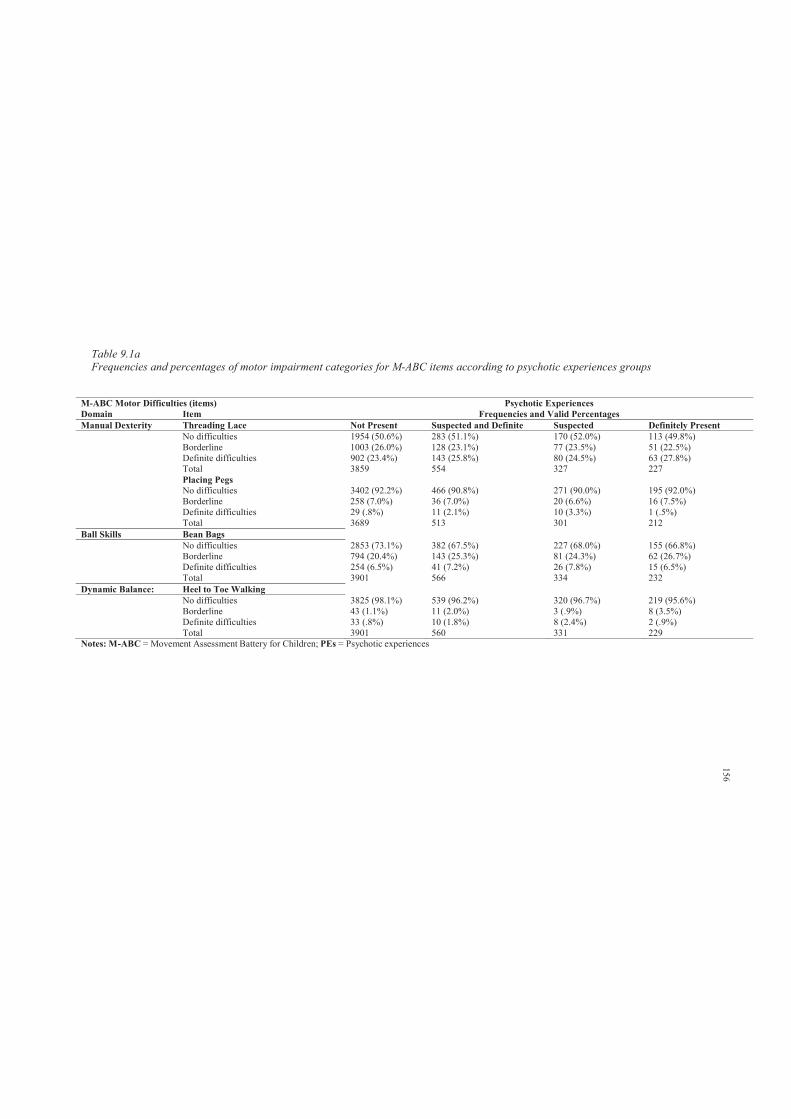
Table 9.1aFrequencies and percentages of motor impairment categories for M-ABC items according to psychotic experiences groups
M-ABC Motor Difficulties (items) Psychotic ExperiencesDomain Item Frequencies and Valid Percentages Manual Dexterity Threading Lace Not Present Suspected and Definite Suspected Definitely Present
No difficulties 1954 (50.6%) 283 (51.1%) 170 (52.0%) 113 (49.8%)Borderline 1003 (26.0%) 128 (23.1%) 77 (23.5%) 51 (22.5%)Definite difficulties 902 (23.4%) 143 (25.8%) 80 (24.5%) 63 (27.8%)Total 3859 554 327 227Placing Pegs No difficulties 3402 (92.2%) 466 (90.8%) 271 (90.0%) 195 (92.0%)Borderline 258 (7.0%) 36 (7.0%) 20 (6.6%) 16 (7.5%)Definite difficulties 29 (.8%) 11 (2.1%) 10 (3.3%) 1 (.5%)Total 3689 513 301 212
Ball Skills Bean Bags No difficulties 2853 (73.1%) 382 (67.5%) 227 (68.0%) 155 (66.8%)Borderline 794 (20.4%) 143 (25.3%) 81 (24.3%) 62 (26.7%)Definite difficulties 254 (6.5%) 41 (7.2%) 26 (7.8%) 15 (6.5%)Total 3901 566 334 232
Dynamic Balance: Heel to Toe Walking No difficulties 3825 (98.1%) 539 (96.2%) 320 (96.7%) 219 (95.6%)Borderline 43 (1.1%) 11 (2.0%) 3 (.9%) 8 (3.5%)Definite difficulties 33 (.8%) 10 (1.8%) 8 (2.4%) 2 (.9%)Total 3901 560 331 229
Notes: M-ABC = Movement Assessment Battery for Children; PEs = Psychotic experiences
156
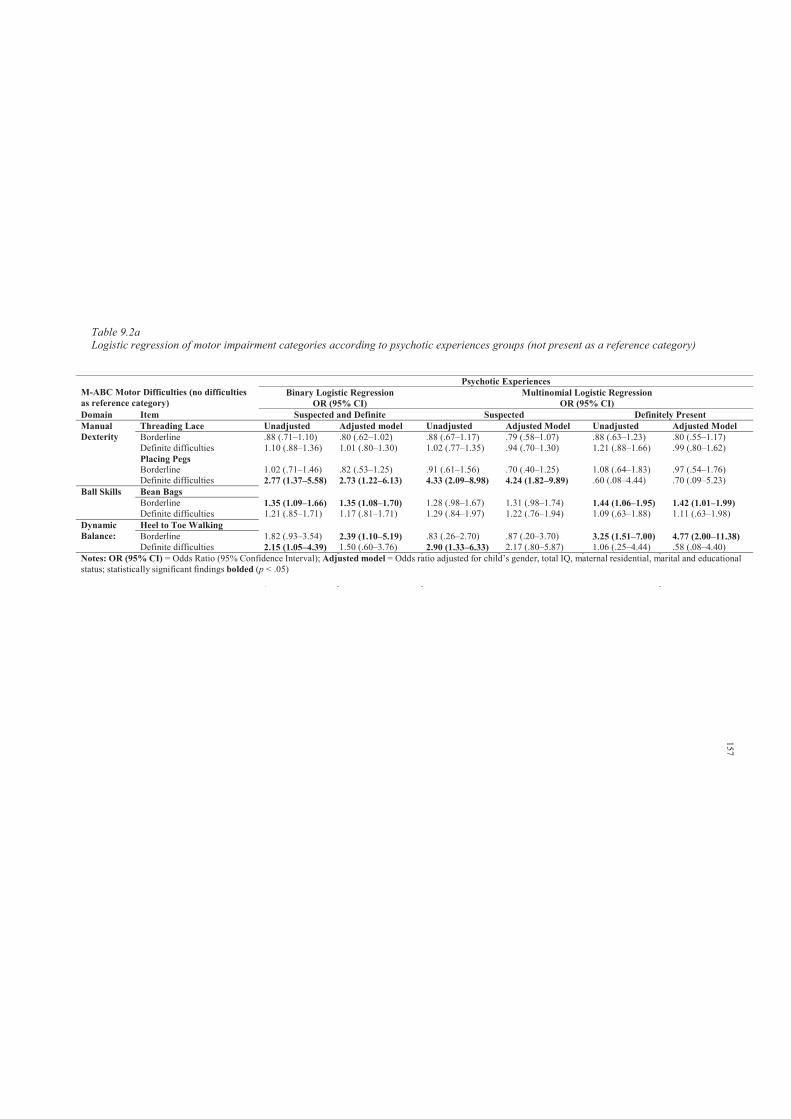
Table 9.2aLogistic regression of motor impairment categories according to psychotic experiences groups (not present as a reference category)
M-ABC Motor Difficulties (no difficulties as reference category)
Psychotic ExperiencesBinary Logistic Regression
OR (95% CI)Multinomial Logistic Regression
OR (95% CI) Domain Item Suspected and Definite Suspected Definitely PresentManual Dexterity
Threading Lace Unadjusted Adjusted model Unadjusted Adjusted Model Unadjusted Adjusted Model Borderline .88 (.71–1.10) .80 (.62–1.02) .88 (.67–1.17) .79 (.58–1.07) .88 (.63–1.23) .80 (.55–1.17)Definite difficulties 1.10 (.88–1.36) 1.01 (.80–1.30) 1.02 (.77–1.35) .94 (.70–1.30) 1.21 (.88–1.66) .99 (.80–1.62)Placing Pegs Borderline 1.02 (.71–1.46) .82 (.53–1.25) .91 (.61–1.56) .70 (.40–1.25) 1.08 (.64–1.83) .97 (.54–1.76)Definite difficulties 2.77 (1.37–5.58) 2.73 (1.22–6.13) 4.33 (2.09–8.98) 4.24 (1.82–9.89) .60 (.08–4.44) .70 (.09–5.23)
Ball Skills Bean Bags Borderline 1.35 (1.09–1.66) 1.35 (1.08–1.70) 1.28 (.98–1.67) 1.31 (.98–1.74) 1.44 (1.06–1.95) 1.42 (1.01–1.99)Definite difficulties 1.21 (.85–1.71) 1.17 (.81–1.71) 1.29 (.84–1.97) 1.22 (.76–1.94) 1.09 (.63–1.88) 1.11 (.63–1.98)
Dynamic Balance:
Heel to Toe Walking Borderline 1.82 (.93–3.54) 2.39 (1.10–5.19) .83 (.26–2.70) .87 (.20–3.70) 3.25 (1.51–7.00) 4.77 (2.00–11.38)Definite difficulties 2.15 (1.05–4.39) 1.50 (.60–3.76) 2.90 (1.33–6.33) 2.17 (.80–5.87) 1.06 (.25–4.44) .58 (.08–4.40)
Notes: OR (95% CI) = Odds Ratio (95% Confidence Interval); Adjusted model = Odds ratio adjusted for child’s gender, total IQ, maternal residential, marital and educationalstatus; statistically significant findings bolded (p < .05)
157
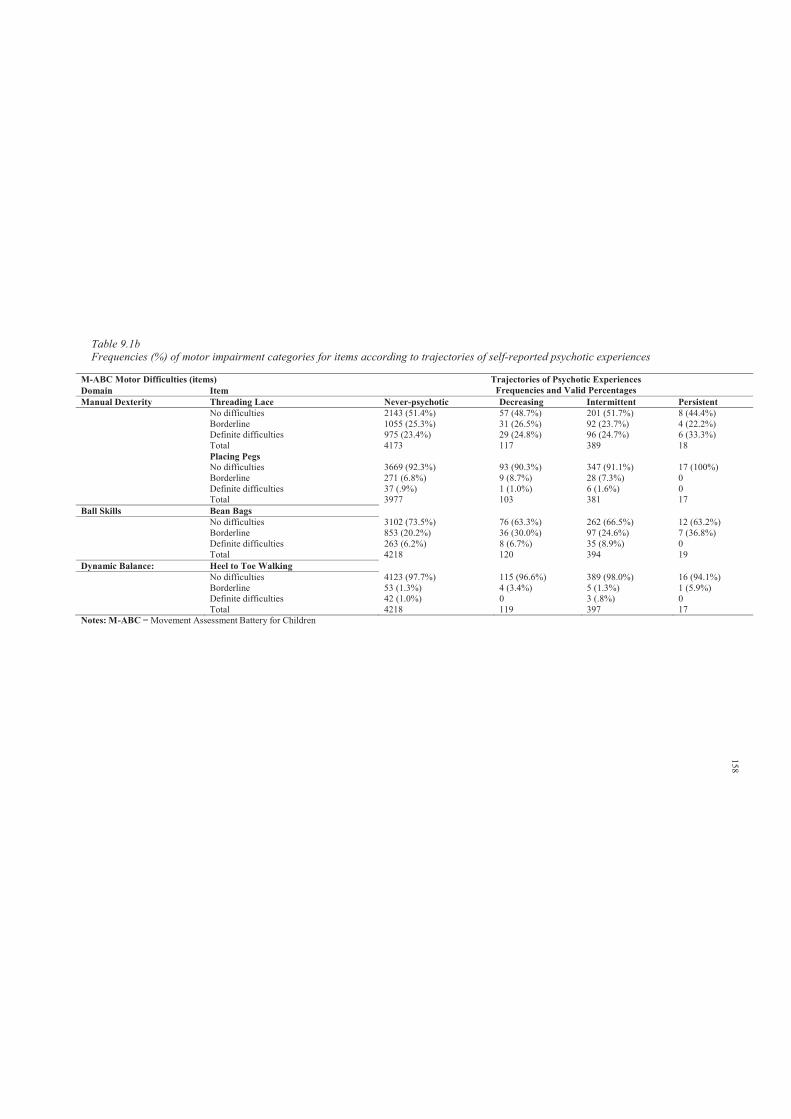
Table 9.1bFrequencies (%) of motor impairment categories for items according to trajectories of self-reported psychotic experiences
M-ABC Motor Difficulties (items) Trajectories of Psychotic ExperiencesFrequencies and Valid Percentages Domain Item
Manual Dexterity Threading Lace Never-psychotic Decreasing Intermittent PersistentNo difficulties 2143 (51.4%) 57 (48.7%) 201 (51.7%) 8 (44.4%)Borderline 1055 (25.3%) 31 (26.5%) 92 (23.7%) 4 (22.2%)Definite difficulties 975 (23.4%) 29 (24.8%) 96 (24.7%) 6 (33.3%)Total 4173 117 389 18Placing Pegs No difficulties 3669 (92.3%) 93 (90.3%) 347 (91.1%) 17 (100%)Borderline 271 (6.8%) 9 (8.7%) 28 (7.3%) 0Definite difficulties 37 (.9%) 1 (1.0%) 6 (1.6%) 0Total 3977 103 381 17
Ball Skills Bean Bags No difficulties 3102 (73.5%) 76 (63.3%) 262 (66.5%) 12 (63.2%)Borderline 853 (20.2%) 36 (30.0%) 97 (24.6%) 7 (36.8%)Definite difficulties 263 (6.2%) 8 (6.7%) 35 (8.9%) 0Total 4218 120 394 19
Dynamic Balance: Heel to Toe Walking No difficulties 4123 (97.7%) 115 (96.6%) 389 (98.0%) 16 (94.1%)Borderline 53 (1.3%) 4 (3.4%) 5 (1.3%) 1 (5.9%)Definite difficulties 42 (1.0%) 0 3 (.8%) 0Total 4218 119 397 17
Notes: M-ABC = Movement Assessment Battery for Children
158
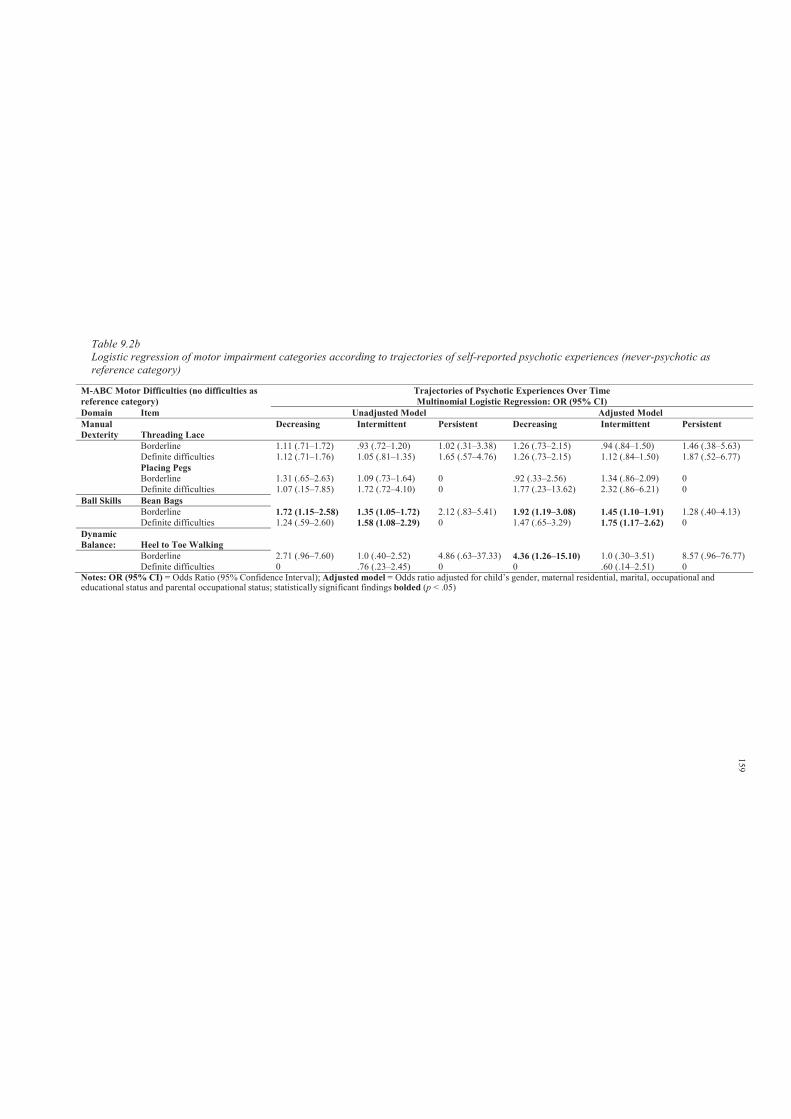
Table 9.2bLogistic regression of motor impairment categories according to trajectories of self-reported psychotic experiences (never-psychotic as reference category)
M-ABC Motor Difficulties (no difficulties as reference category)
Trajectories of Psychotic Experiences Over Time Multinomial Logistic Regression: OR (95% CI)
Domain Item Unadjusted Model Adjusted Model Manual Dexterity Threading Lace
Decreasing Intermittent Persistent Decreasing Intermittent Persistent
Borderline 1.11 (.71–1.72) .93 (.72–1.20) 1.02 (.31–3.38) 1.26 (.73–2.15) .94 (.84–1.50) 1.46 (.38–5.63)Definite difficulties 1.12 (.71–1.76) 1.05 (.81–1.35) 1.65 (.57–4.76) 1.26 (.73–2.15) 1.12 (.84–1.50) 1.87 (.52–6.77)Placing Pegs Borderline 1.31 (.65–2.63) 1.09 (.73–1.64) 0 .92 (.33–2.56) 1.34 (.86–2.09) 0Definite difficulties 1.07 (.15–7.85) 1.72 (.72–4.10) 0 1.77 (.23–13.62) 2.32 (.86–6.21) 0
Ball Skills Bean Bags Borderline 1.72 (1.15–2.58) 1.35 (1.05–1.72) 2.12 (.83–5.41) 1.92 (1.19–3.08) 1.45 (1.10–1.91) 1.28 (.40–4.13)Definite difficulties 1.24 (.59–2.60) 1.58 (1.08–2.29) 0 1.47 (.65–3.29) 1.75 (1.17–2.62) 0
Dynamic Balance: Heel to Toe Walking
Borderline 2.71 (.96–7.60) 1.0 (.40–2.52) 4.86 (.63–37.33) 4.36 (1.26–15.10) 1.0 (.30–3.51) 8.57 (.96–76.77)Definite difficulties 0 .76 (.23–2.45) 0 0 .60 (.14–2.51) 0
Notes: OR (95% CI) = Odds Ratio (95% Confidence Interval); Adjusted model = Odds ratio adjusted for child’s gender, maternal residential, marital, occupational andeducational status and parental occupational status; statistically significant findings bolded (p < .05)
159
CHILDHOOD DEVELOPMENT FACTORS AND RISK OF PSYCHOTIC EXPERIENCES 160
9.4 Discussion
This study was the first to examine the association between childhood motor skills and
PEs in early adolescence. The hypothesis that childhood motor difficulties would increase the risk
of reporting PEs was partially supported. This study found weak to moderate evidence of
association between childhood motor difficulties and increased risk of reporting PEs in early
adolescence.
The hypothesis that those with the highest levels of childhood motor difficulties
(borderline or definite motor difficulties) would be more likely to have persistent PEs over time
was not supported. However, some evidence was found of an association between childhood
motor difficulties and risk of having intermittent PEs over time.
CHILDHOOD DEVELOPMENT FACTORS AND RISK OF PSYCHOTIC EXPERIENCES 161
Chapter 10: Study 4: Trajectories of Early Childhood Developmental
Skills
10.1 Introduction
There is an emerging body of prospective data examining the association of early
childhood developmental factors and risk of adult onset schizophrenia (the focus of Chapters 2
and 3). While a number of longitudinal HR (children of parents presenting with schizophrenia)
and birth cohort studies have examined infant developmental milestones as predictors of
schizophrenia, relatively few studies have examined early childhood developmental skills and risk
of PEs in early adolescence.
The aim of this investigation13 was to study the association between early childhood
development in the first four years of life (fine, gross motor, social and communication skills) and
PEs in early adolescence. To our knowledge, this is the first study to examine the prediction of
PEs in early adolescence by trajectories of early childhood developmental skills. The aim of this
investigation is to examine the association of declining patterns in early childhood developmental
skills across the first four years of life and PEs in early adolescence. It was hypothesised that
relative to those with improving trend of performance, those with deteriorating developmental
skills over time would have increase risk of PEs.
10.2 Method
10.2.1 Sample.
The sample characteristics are described in Section 6.2.6.
10.2.2 Participants.
Participants’ details are provided in Section 6.2.2.
13 Hameed, M. H., Lingam, R., Zammit, S., Lewis, A. J. & Sullivan, S. (2013). Trajectories of early childhood
developmental skills and early adolescent psychotic experiences: Results from the ALSPAC study. Manuscript in
preparation.
CHILDHOOD DEVELOPMENT FACTORS AND RISK OF PSYCHOTIC EXPERIENCES 162
10.2.3 Measures.
10.2.3.1. Primary outcome.
The primary outcome was the presence of either suspected or definite PEs, with the not
present group as a reference category (detailed description is provided in Section 6.2.3).
10.2.3.2. Secondary outcome.
The trajectories of change in self-reported PEs were used as secondary outcome variables
(detailed description is provided in Section 6.2.3).
10.2.3.3. Infant developmental skills.
Child development was measured using a parentally reported scale developed by
ALSPAC, including items from the Denver Developmental Screening Test-II (Frankenburg &
Dodds, 1967). The Denver-II is a developmental screening tool used to assess whether children
have reached age-appropriate milestones. The items selected were those shown to be most
predictive of abnormality; they were adapted for research after piloting and discussion with focus
groups. The scale has been widely used in the ALSPAC, and comparison with the Griffiths
Developmental Scale (Griffiths, 1984) administered by a trained member of staff to a
representative sub-sample of the cohort (n = 1045) at 18 months gave a correlation coefficient of
0.54 (p < 0·0001) (Hibbeln et al., 2007).
Four developmental scales were developed to assess the four domains of child
development: gross motor, fine motor, communication and social skills. Each age appropriate
developmental skill was scored as 2 if the child was reported to have completed the skill often, 1
if the skill had been completed only once or twice and 0 if the child had not completed the skill
yet. Fine motor skills, gross motor and social skills were assessed using age appropriate questions
at four time points (at 6, 18, 30 and 42 months) and communication was assessed twice (at 6 and
18 months). Items such as ‘my baby looks at older people’s faces’, ‘he puts his hands together’,
‘when a bell rings he moves or makes a noise’, and ‘in a sitting position he can keep his head
steady’ reflected social, fine, communication and gross motor skills at 6 months, respectively.
10.2.4 Covariates.
Detailed description is provided in Section 6.2.5.
CHILDHOOD DEVELOPMENT FACTORS AND RISK OF PSYCHOTIC EXPERIENCES 163
10.2.5 Data manipulation and statistical analyses.
10.2.5.1. Primary analyses.
All raw DDST – II scores were standardised to a mean of 0 and standard deviation of 1 (z-
scores). Descriptive statistics were used to describe performance in developmental skills at 6, 18,
30 and 42 months by PEs grouping. Binary and multinomial logistic regression was then used to
examine the relationship between measurements of developmental skills and likelihood of
reporting PEs.
Further, the researcher also summed item scores to create an average continuous score for
each developmental domain. Binary and multinomial logistic regression was used to assess the
association between these average developmental scores and risk of reporting PEs in early
adolescence.
10.2.5.2. Secondary analyses.
From a theoretical perspective, heterogeneity of developmental growth trajectories (or
distinct classes) may exist within the larger population (Jung & Wickrama, 2007). Indeed, Jung
and Wickrama state that “describing an entire population using a single pattern of development
over time is oversimplifying the complex growth patterns that describe continuity and change
among members of different groups” (2007, p. 303). Therefore, since acquisition of
developmental skills such as motor milestones is more likely characterised by individual
variations in development at each time point and over time, and timing relative to acquisition of
other milestones (Atun-Einy, Berger, & Scher, 2012), a latent class growth analysis (LCGA)
(mixture modelling approach) was applied using Mplus (Muthén & Muthén, 2010) to derive
trajectories of change in developmental skills during the first four years of life.
Trajectories of change in fine and gross motor and social skills were derived. The optimum
number of classes or trajectories was determined using statistical fit indices (highest entropy
value, lowest Bayesian Information Criteria (BIC), non-significant Lo- Mendell-Rubin
Likelihood Ratio Test) comparing the current model with a model with one less class (Jung &
Wickrama, 2007; Nylund, Asparouhov, & Muthén, 2007).

CHILDHOOD DEVELOPMENT FACTORS AND RISK OF PSYCHOTIC EXPERIENCES 164
Communication skills were only measured at two time points (6 and 18 months) therefore
an alternative method was used to examine prediction of PEs from trajectories of performance
over time including consistently low vs. decline in communication skills. Principal component
analysis (PCA) was used as a mean of transforming the original communication variables to
derive two uncorrelated (orthogonal) scores in order to avoid collinearity (Massy, 1965). A
detailed explanation of this statistical technique is provided elsewhere (Hameed, Lewis, Sullivan,
& Zammit, 2013).
Two fixed principal components with orthogonal (varimax) rotation for total
communication score at 6 and 18 months were generated and saved as standardised regression
scores. PCA yielded a first (eigenvalue = 1.26, percentage of variance = 63.14) and a second
component (eigenvalue = .74, percentage of variance = 36.86) reflecting average and change score
between the two time points respectively. The saved standardised 2 components were used as
continuous predictors in subsequent logistic regression models to assess their association with PEs
with and without adjustments for potential confounding variables.
10.3 Results
10.3.1 Participants and missing data.
A total of 6790 (44.6%) children from the ALSPAC cohort completed the PLIKS semi-
structured interview at mean age 12. A further 8360 (55.4%) children did not attend the PLIKS
interview, but had available data from the DDST-II. The independent sample t- test analyses
(using the average scores over time) of those with missing PLIKS data suggested that these
children had relatively higher scores on the measurements of developmental skills (see Appendix
10.A).
Further, since DDST-II domains were repeated over time, the researcher also examined
missing data using a general linear model (mixed factorial design) to compare DDST-II scores at
each time point between those with and without PLIKS data. While this revealed no significant
differences on gross motor, social and communication skills, those without PLIKS data were more
likely to have lower average fine motor skills scores at each time point (F (1, 7944) = 5.87, p =
.015). In this study, no statistical method for imputing missing values was used. This study reports
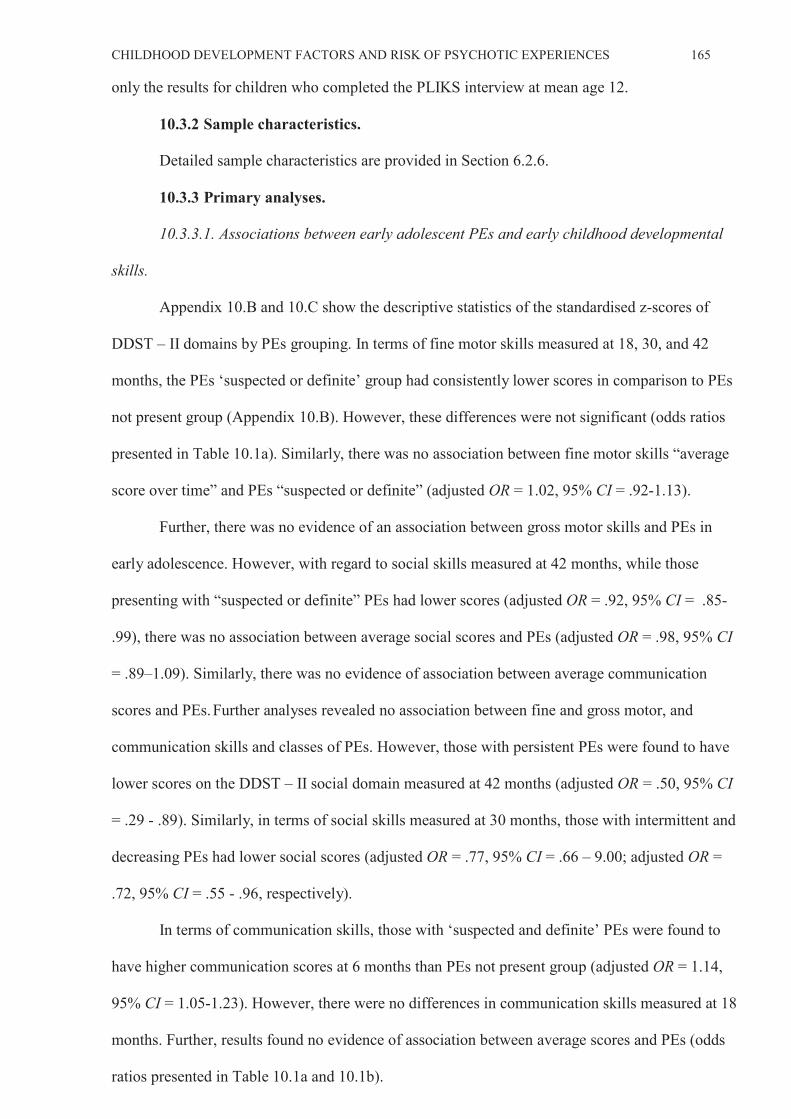
CHILDHOOD DEVELOPMENT FACTORS AND RISK OF PSYCHOTIC EXPERIENCES 165
only the results for children who completed the PLIKS interview at mean age 12.
10.3.2 Sample characteristics.
Detailed sample characteristics are provided in Section 6.2.6.
10.3.3 Primary analyses.
10.3.3.1. Associations between early adolescent PEs and early childhood developmental
skills.
Appendix 10.B and 10.C show the descriptive statistics of the standardised z-scores of
DDST – II domains by PEs grouping. In terms of fine motor skills measured at 18, 30, and 42
months, the PEs ‘suspected or definite’ group had consistently lower scores in comparison to PEs
not present group (Appendix 10.B). However, these differences were not significant (odds ratios
presented in Table 10.1a). Similarly, there was no association between fine motor skills “average
score over time” and PEs “suspected or definite” (adjusted OR = 1.02, 95% CI = .92-1.13).
Further, there was no evidence of an association between gross motor skills and PEs in
early adolescence. However, with regard to social skills measured at 42 months, while those
presenting with “suspected or definite” PEs had lower scores (adjusted OR = .92, 95% CI = .85-
.99), there was no association between average social scores and PEs (adjusted OR = .98, 95% CI
= .89–1.09). Similarly, there was no evidence of association between average communication
scores and PEs.Further analyses revealed no association between fine and gross motor, and
communication skills and classes of PEs. However, those with persistent PEs were found to have
lower scores on the DDST – II social domain measured at 42 months (adjusted OR = .50, 95% CI
= .29 - .89). Similarly, in terms of social skills measured at 30 months, those with intermittent and
decreasing PEs had lower social scores (adjusted OR = .77, 95% CI = .66 – 9.00; adjusted OR =
.72, 95% CI = .55 - .96, respectively).
In terms of communication skills, those with ‘suspected and definite’ PEs were found to
have higher communication scores at 6 months than PEs not present group (adjusted OR = 1.14,
95% CI = 1.05-1.23). However, there were no differences in communication skills measured at 18
months. Further, results found no evidence of association between average scores and PEs (odds
ratios presented in Table 10.1a and 10.1b).
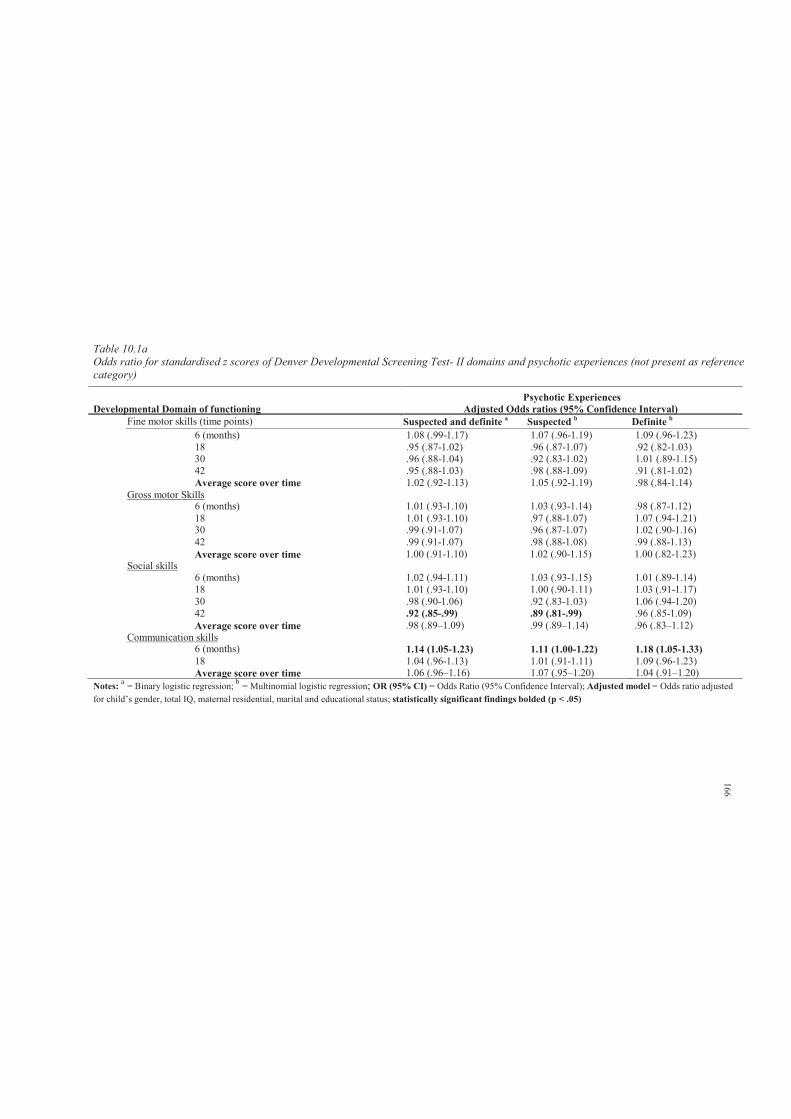
6 (months) 1.14 (1.05-1.23) 1.11 (1.00-1.22) 1.18 (1.05-1.33)18 1.04 (.96-1.13) 1.01 (.91-1.11) 1.09 (.96-1.23)Average score over time 1.06 (.96–1.16) 1.07 (.95–1.20) 1.04 (.91–1.20)
Table 10.1aOdds ratio for standardised z scores of Denver Developmental Screening Test- II domains and psychotic experiences (not present as reference category)
Psychotic ExperiencesDevelopmental Domain of functioning Adjusted Odds ratios (95% Confidence Interval)
Fine motor skills (time points) Suspected and definite a Suspected b Definite b
6 (months) 1.08 (.99-1.17) 1.07 (.96-1.19) 1.09 (.96-1.23)18 .95 (.87-1.02) .96 (.87-1.07) .92 (.82-1.03)30 .96 (.88-1.04) .92 (.83-1.02) 1.01 (.89-1.15)42 .95 (.88-1.03) .98 (.88-1.09) .91 (.81-1.02)Average score over time 1.02 (.92-1.13) 1.05 (.92-1.19) .98 (.84-1.14)
Gross motor Skills6 (months) 1.01 (.93-1.10) 1.03 (.93-1.14) .98 (.87-1.12)18 1.01 (.93-1.10) .97 (.88-1.07) 1.07 (.94-1.21)30 .99 (.91-1.07) .96 (.87-1.07) 1.02 (.90-1.16)42 .99 (.91-1.07) .98 (.88-1.08) .99 (.88-1.13)Average score over time 1.00 (.91-1.10) 1.02 (.90-1.15) 1.00 (.82-1.23)
Social skills6 (months) 1.02 (.94-1.11) 1.03 (.93-1.15) 1.01 (.89-1.14)18 1.01 (.93-1.10) 1.00 (.90-1.11) 1.03 (.91-1.17)30 .98 (.90-1.06) .92 (.83-1.03) 1.06 (.94-1.20)42 .92 (.85-.99) .89 (.81-.99) .96 (.85-1.09)Average score over time .98 (.89–1.09) .99 (.89–1.14) .96 (.83–1.12)
Communication skills
Notes: a = Binary logistic regression; b = Multinomial logistic regression; OR (95% CI) = Odds Ratio (95% Confidence Interval); Adjusted model = Odds ratio adjusted for child’s gender, total IQ, maternal residential, marital and educational status; statistically significant findings bolded (p < .05)
166
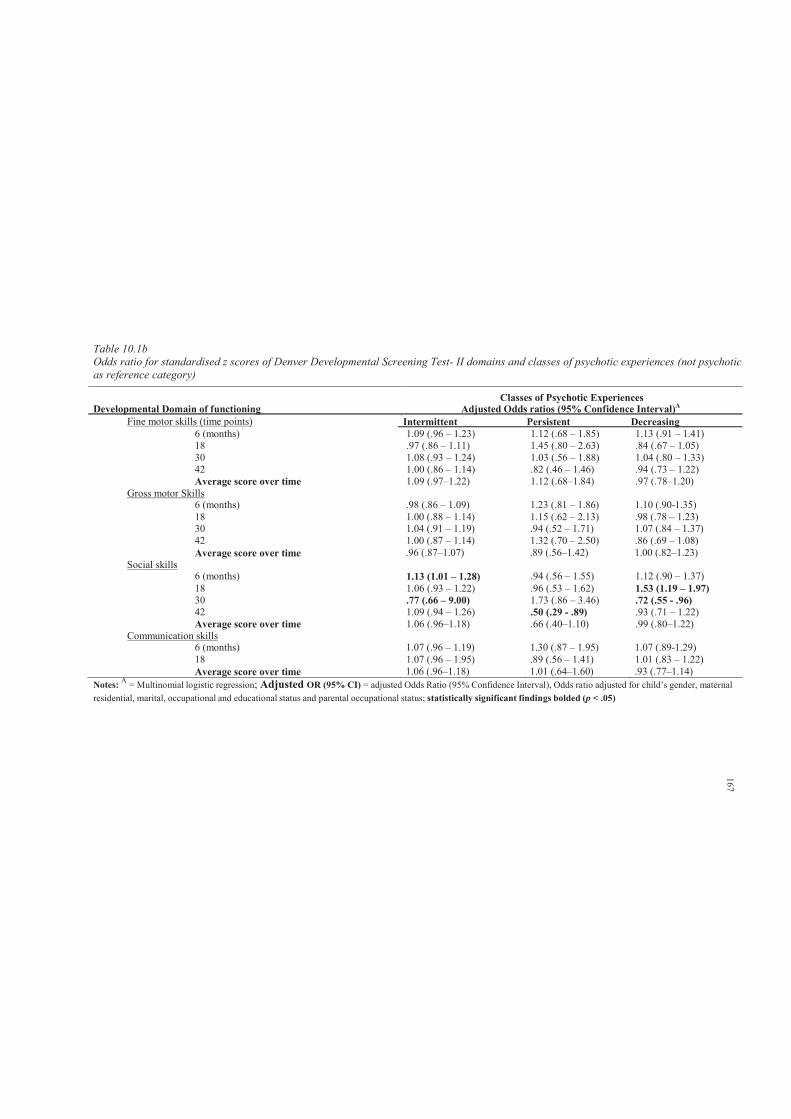
Table 10.1bOdds ratio for standardised z scores of Denver Developmental Screening Test- II domains and classes of psychotic experiences (not psychotic as reference category)
Classes of Psychotic ExperiencesDevelopmental Domain of functioning Adjusted Odds ratios (95% Confidence Interval)A
Fine motor skills (time points) Intermittent Persistent Decreasing 6 (months) 1.09 (.96 – 1.23) 1.12 (.68 – 1.85) 1.13 (.91 – 1.41)18 .97 (.86 – 1.11) 1.45 (.80 – 2.63) .84 (.67 – 1.05)30 1.08 (.93 – 1.24) 1.03 (.56 – 1.88) 1.04 (.80 – 1.33)42 1.00 (.86 – 1.14) .82 (.46 – 1.46) .94 (.73 – 1.22)Average score over time 1.09 (.97–1.22) 1.12 (.68–1.84) .97 (.78–1.20)
Gross motor Skills6 (months) .98 (.86 – 1.09) 1.23 (.81 – 1.86) 1.10 (.90-1.35)18 1.00 (.88 – 1.14) 1.15 (.62 – 2.13) .98 (.78 – 1.23)30 1.04 (.91 – 1.19) .94 (.52 – 1.71) 1.07 (.84 – 1.37)42 1.00 (.87 – 1.14) 1.32 (.70 – 2.50) .86 (.69 – 1.08)Average score over time .96 (.87–1.07) .89 (.56–1.42) 1.00 (.82–1.23)
Social skills6 (months) 1.13 (1.01 – 1.28) .94 (.56 – 1.55) 1.12 (.90 – 1.37)18 1.06 (.93 – 1.22) .96 (.53 – 1.62) 1.53 (1.19 – 1.97)30 .77 (.66 – 9.00) 1.73 (.86 – 3.46) .72 (.55 - .96)42 1.09 (.94 – 1.26) .50 (.29 - .89) .93 (.71 – 1.22)Average score over time 1.06 (.96–1.18) .66 (.40–1.10) .99 (.80–1.22)
Communication skills6 (months) 1.07 (.96 – 1.19) 1.30 (.87 – 1.95) 1.07 (.89-1.29)18 1.07 (.96 – 1.95) .89 (.56 – 1.41) 1.01 (.83 – 1.22)Average score over time 1.06 (.96–1.18) 1.01 (.64–1.60) .93 (.77–1.14)
Notes: A = Multinomial logistic regression; Adjusted OR (95% CI) = adjusted Odds Ratio (95% Confidence Interval), Odds ratio adjusted for child’s gender, maternal residential, marital, occupational and educational status and parental occupational status; statistically significant findings bolded (p < .05)
167
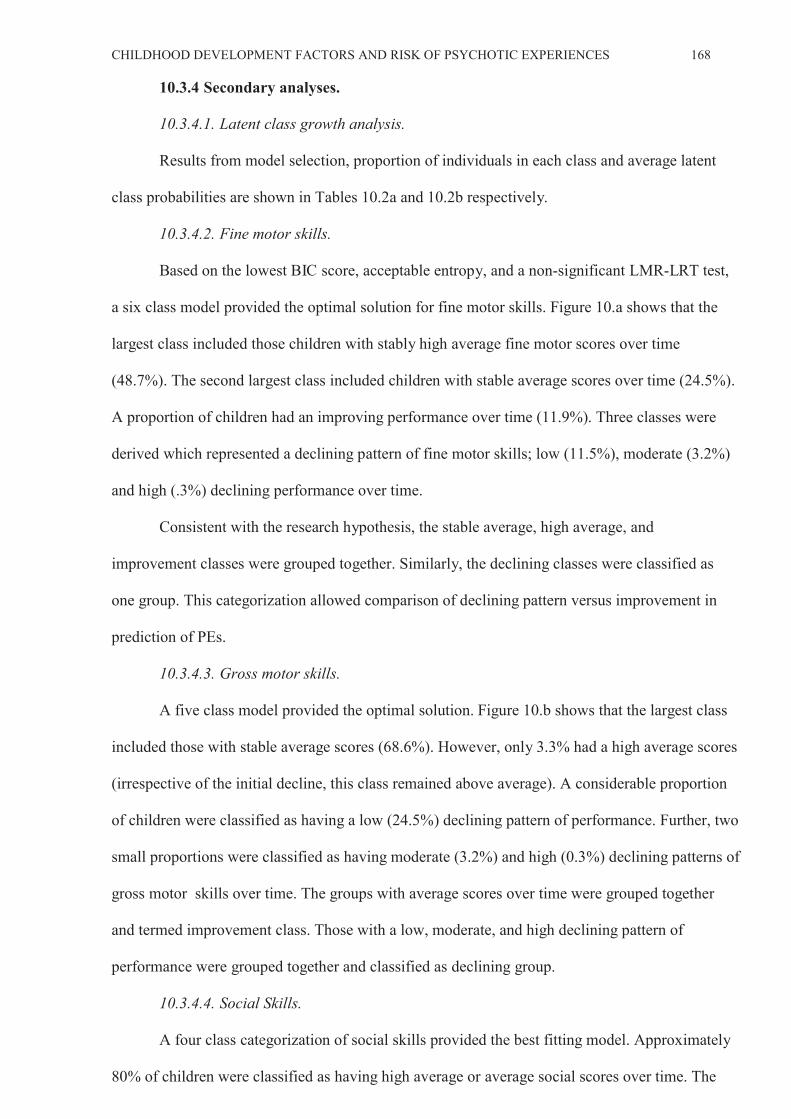
CHILDHOOD DEVELOPMENT FACTORS AND RISK OF PSYCHOTIC EXPERIENCES 168
10.3.4 Secondary analyses.
10.3.4.1. Latent class growth analysis.
Results from model selection, proportion of individuals in each class and average latent
class probabilities are shown in Tables 10.2a and 10.2b respectively.
10.3.4.2. Fine motor skills.
Based on the lowest BIC score, acceptable entropy, and a non-significant LMR-LRT test,
a six class model provided the optimal solution for fine motor skills. Figure 10.a shows that the
largest class included those children with stably high average fine motor scores over time
(48.7%). The second largest class included children with stable average scores over time (24.5%).
A proportion of children had an improving performance over time (11.9%). Three classes were
derived which represented a declining pattern of fine motor skills; low (11.5%), moderate (3.2%)
and high (.3%) declining performance over time.
Consistent with the research hypothesis, the stable average, high average, and
improvement classes were grouped together. Similarly, the declining classes were classified as
one group. This categorization allowed comparison of declining pattern versus improvement in
prediction of PEs.
10.3.4.3. Gross motor skills.
A five class model provided the optimal solution. Figure 10.b shows that the largest class
included those with stable average scores (68.6%). However, only 3.3% had a high average scores
(irrespective of the initial decline, this class remained above average). A considerable proportion
of children were classified as having a low (24.5%) declining pattern of performance. Further, two
small proportions were classified as having moderate (3.2%) and high (0.3%) declining patterns of
gross motor skills over time. The groups with average scores over time were grouped together
and termed improvement class. Those with a low, moderate, and high declining pattern of
performance were grouped together and classified as declining group.
10.3.4.4. Social Skills.
A four class categorization of social skills provided the best fitting model. Approximately
80% of children were classified as having high average or average social scores over time. The

CHILDHOOD DEVELOPMENT FACTORS AND RISK OF PSYCHOTIC EXPERIENCES 169
two other classes included children with low-moderate (16.8%) and high (3.3%) declining social
scores over time. Similarly, the former two classes were grouped and termed improvement class.
Those with declining pattern of scores over time were grouped together and classified as declining
class.
The derived classes (declining and improving) were used as categorical predictors of PEs
using logistic regression with and without adjustment for potential confounding variables.
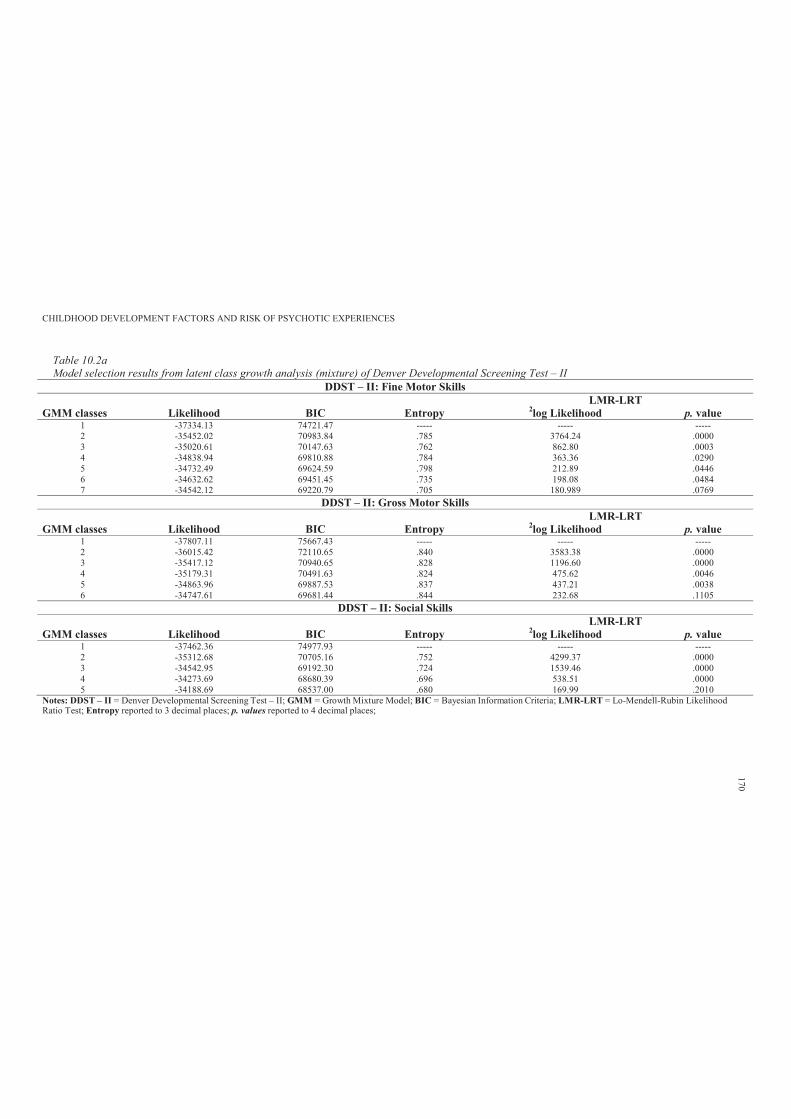
CHILDHOOD DEVELOPMENT FACTORS AND RISK OF PSYCHOTIC EXPERIENCES
Table 10.2aModel selection results from latent class growth analysis (mixture) of Denver Developmental Screening Test – II
DDST – II: Fine Motor Skills LMR-LRT
GMM classes Likelihood BIC Entropy 2log Likelihood p. value1 -37334.13 74721.47 ----- ----- -----2 -35452.02 70983.84 .785 3764.24 .00003 -35020.61 70147.63 .762 862.80 .00034 -34838.94 69810.88 .784 363.36 .02905 -34732.49 69624.59 .798 212.89 .04466 -34632.62 69451.45 .735 198.08 .04847 -34542.12 69220.79 .705 180.989 .0769
DDST – II: Gross Motor SkillsLMR-LRT
GMM classes Likelihood BIC Entropy 2log Likelihood p. value1 -37807.11 75667.43 ----- ----- -----2 -36015.42 72110.65 .840 3583.38 .00003 -35417.12 70940.65 .828 1196.60 .00004 -35179.31 70491.63 .824 475.62 .00465 -34863.96 69887.53 .837 437.21 .00386 -34747.61 69681.44 .844 232.68 .1105
DDST – II: Social SkillsLMR-LRT
GMM classes Likelihood BIC Entropy 2log Likelihood p. value1 -37462.36 74977.93 ----- ----- -----2 -35312.68 70705.16 .752 4299.37 .00003 -34542.95 69192.30 .724 1539.46 .00004 -34273.69 68680.39 .696 538.51 .00005 -34188.69 68537.00 .680 169.99 .2010
Notes: DDST – II = Denver Developmental Screening Test – II; GMM = Growth Mixture Model; BIC = Bayesian Information Criteria; LMR-LRT = Lo-Mendell-Rubin LikelihoodRatio Test; Entropy reported to 3 decimal places; p. values reported to 4 decimal places;
170
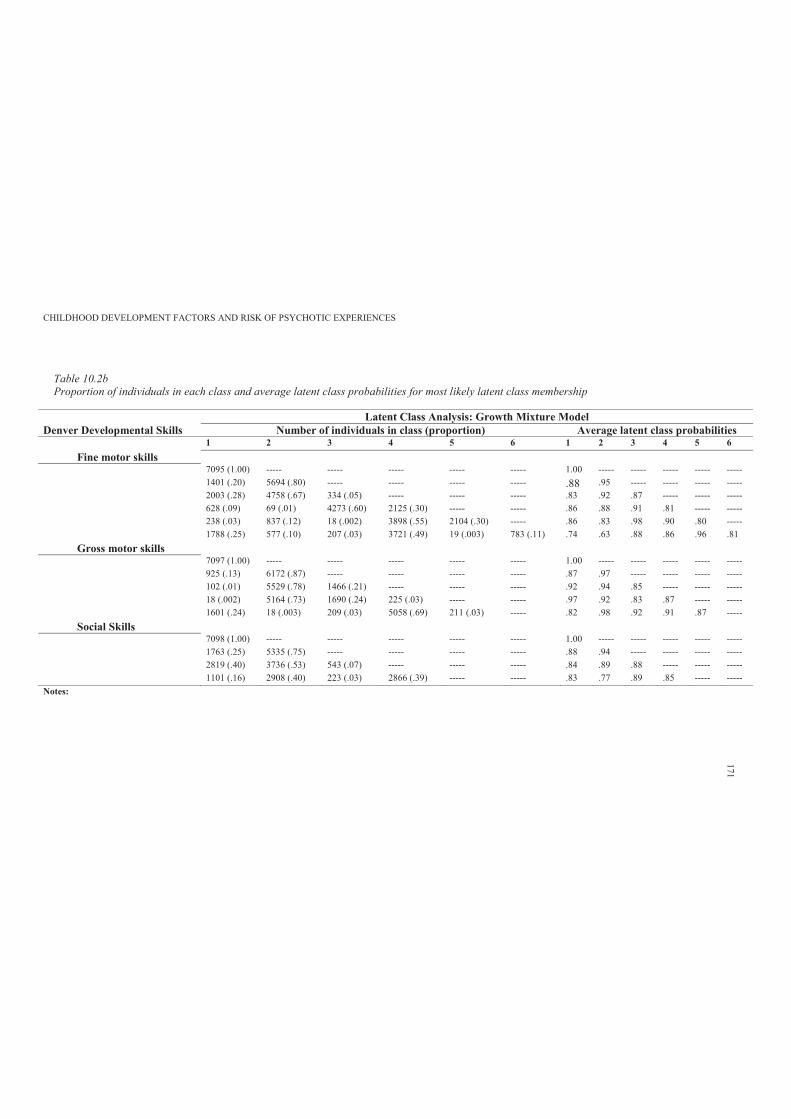
CHILDHOOD DEVELOPMENT FACTORS AND RISK OF PSYCHOTIC EXPERIENCES
Table 10.2bProportion of individuals in each class and average latent class probabilities for most likely latent class membership
Latent Class Analysis: Growth Mixture Model Denver Developmental Skills Number of individuals in class (proportion) Average latent class probabilities
1 2 3 4 5 6 1 2 3 4 5 6Fine motor skills
7095 (1.00) ----- ----- ----- ----- ----- 1.00 ----- ----- ----- ----- -----1401 (.20) 5694 (.80) ----- ----- ----- ----- .88 .95 ----- ----- ----- -----2003 (.28) 4758 (.67) 334 (.05) ----- ----- ----- .83 .92 .87 ----- ----- -----628 (.09) 69 (.01) 4273 (.60) 2125 (.30) ----- ----- .86 .88 .91 .81 ----- -----238 (.03) 837 (.12) 18 (.002) 3898 (.55) 2104 (.30) ----- .86 .83 .98 .90 .80 -----1788 (.25) 577 (.10) 207 (.03) 3721 (.49) 19 (.003) 783 (.11) .74 .63 .88 .86 .96 .81
Gross motor skills7097 (1.00) ----- ----- ----- ----- ----- 1.00 ----- ----- ----- ----- -----925 (.13) 6172 (.87) ----- ----- ----- ----- .87 .97 ----- ----- ----- -----102 (.01) 5529 (.78) 1466 (.21) ----- ----- ----- .92 .94 .85 ----- ----- -----18 (.002) 5164 (.73) 1690 (.24) 225 (.03) ----- ----- .97 .92 .83 .87 ----- -----1601 (.24) 18 (.003) 209 (.03) 5058 (.69) 211 (.03) ----- .82 .98 .92 .91 .87 -----
Social Skills7098 (1.00) ----- ----- ----- ----- ----- 1.00 ----- ----- ----- ----- -----1763 (.25) 5335 (.75) ----- ----- ----- ----- .88 .94 ----- ----- ----- -----2819 (.40) 3736 (.53) 543 (.07) ----- ----- ----- .84 .89 .88 ----- ----- -----1101 (.16) 2908 (.40) 223 (.03) 2866 (.39) ----- ----- .83 .77 .89 .85 ----- -----
Notes:
171
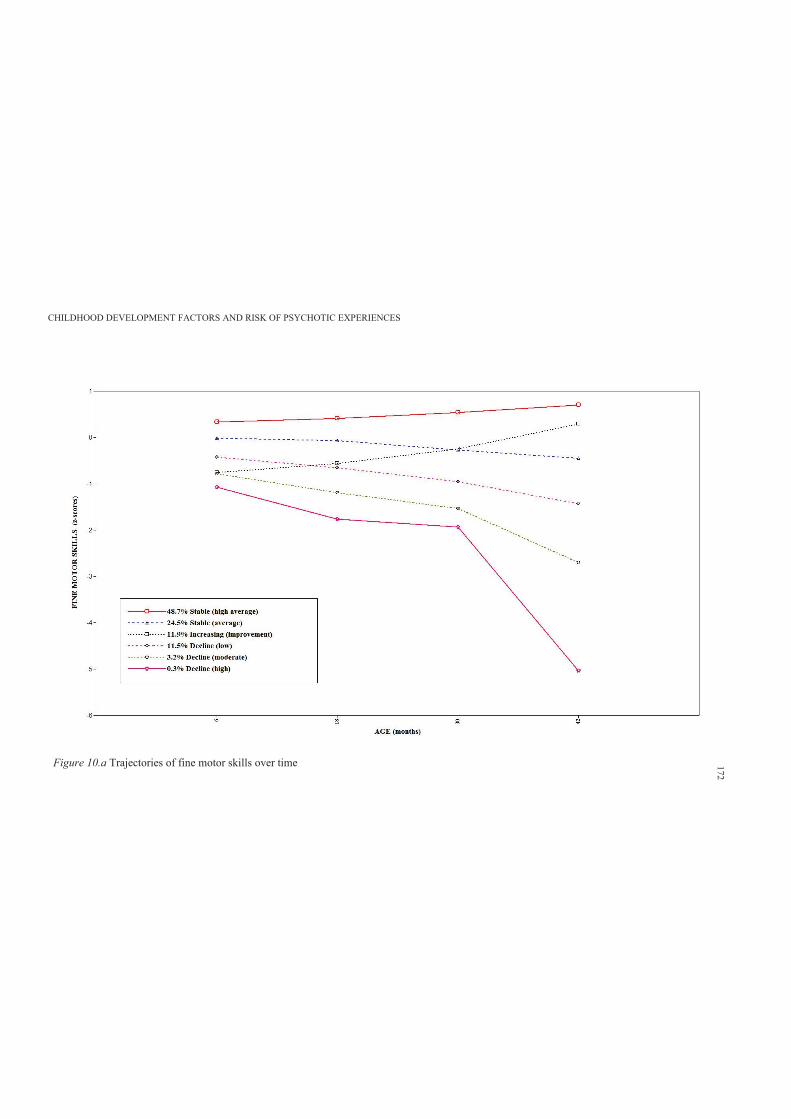
CHILDHOOD DEVELOPMENT FACTORS AND RISK OF PSYCHOTIC EXPERIENCES
Figure 10.a Trajectories of fine motor skills over time 172
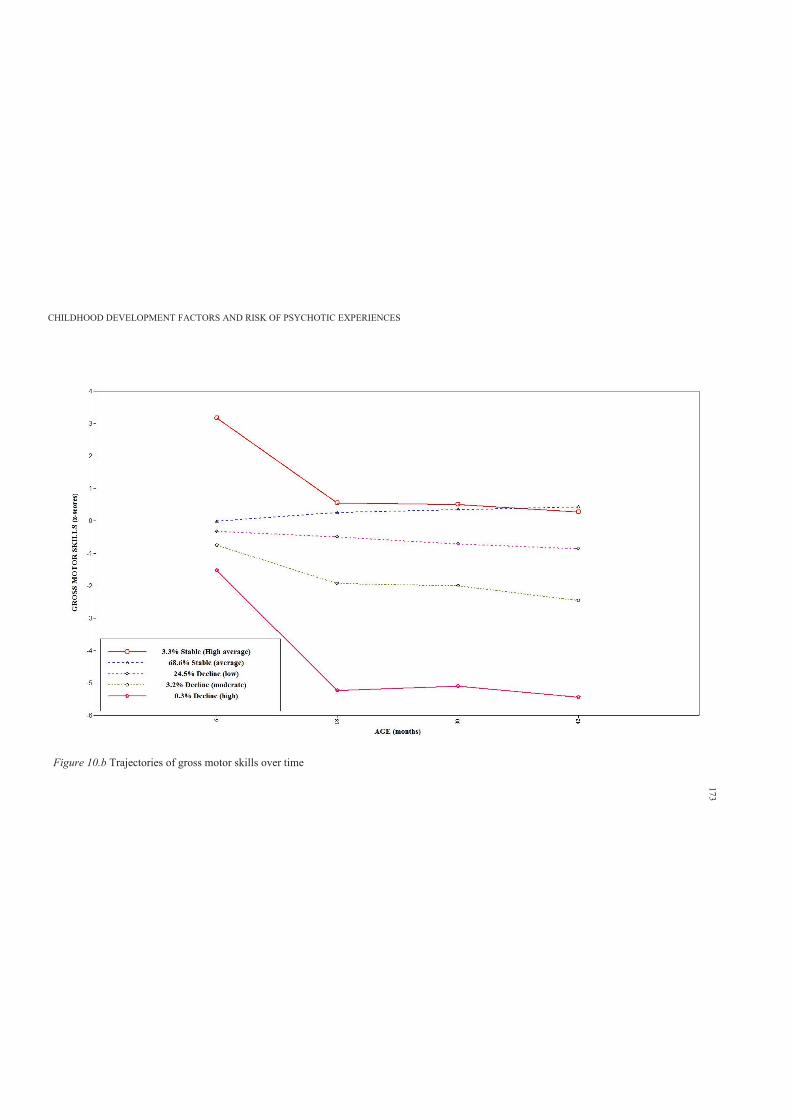
CHILDHOOD DEVELOPMENT FACTORS AND RISK OF PSYCHOTIC EXPERIENCES
Figure 10.b Trajectories of gross motor skills over time
173
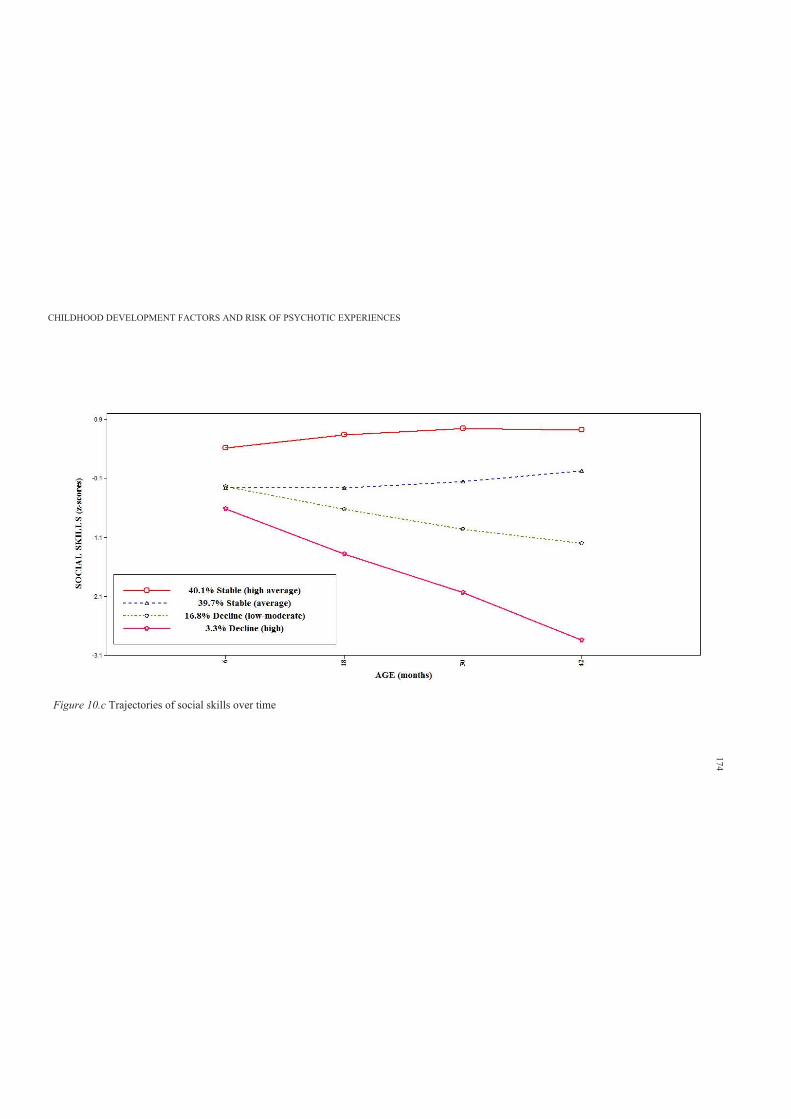
CHILDHOOD DEVELOPMENT FACTORS AND RISK OF PSYCHOTIC EXPERIENCES
Figure 10.c Trajectories of social skills over time
174
CHILDHOOD DEVELOPMENT FACTORS AND RISK OF PSYCHOTIC EXPERIENCES 175
10.3.4.5. Associations between early adolescent PEs and early childhood developmental
trajectories
Table 10.3a shows the frequencies and percentages of fine, gross motor and social
trajectories (improvement and decline) by PEs groupings. Further Table 10.3b shows the odds
ratios for decline versus improvement in early childhood developmental domains and PEs (not
present as reference category).
In terms of fine motor skills, Table 10.3a shows that in comparison to PEs not present
group (n = 655, 14.1%), those with suspected or definite PEs, had higher frequency of declining
fine motor skills over time (n = 110, 15.5%) and those with definite PEs had even higher
frequency of declining fine motor skills (n = 50, 17.3%). However, Table 10.3b shows that
these differences were not significant.
Further, there was no evidence of an association between declining gross motor skills
and PEs in early adolescence. Indeed, 170 (24.0%) of those with ‘suspected or definite’ PEs
were classified as having a declining trend of gross motor skills in comparison to those without
PEs (n = 1198, 25.8%; adjusted OR = .91, 95% CI = .74-1.14).
In terms of trajectories of social skills, only those with ‘suspected’ PEs were more likely
to have a declining pattern of social skills over time (adjusted OR = 1.28, 95% CI = 1.10-1.92)
(Table 10.3b).
Consistent with previous chapters, the researcher also examined the association of
trajectories of early childhood developmental skills and classes of PEs. Table 10.4a shows the
frequencies and percentages of fine, gross motor and social trajectories (improvement and
decline) by classes of PEs. Further Table 10.4b shows the odds ratios for decline versus
improvement in early childhood developmental domains and classes of PEs (not psychotic as
reference category). The results found no association between declining pattern of performance
and classes of PEs.
In terms of communication performance over time, Table 10.5a shows no evidence that
a consistently low average communication skills is associated with increased risk of ‘suspected
or definite’ PEs (adjusted OR = .99, 95% CI = .90 – 1.08). Indeed, the results found that relative

CHILDHOOD DEVELOPMENT FACTORS AND RISK OF PSYCHOTIC EXPERIENCES 176
to 6 months assessment, those with ‘suspected or definite’ PEs were more likely to have higher
communication scores at 18 months (adjusted OR = 1.12, 95% CI = 1.03 – 1.22) than those
without PEs.
However, Table 10.5b shows no evidence that a consistently low average or declining
communication skills is associated with classes of PEs.
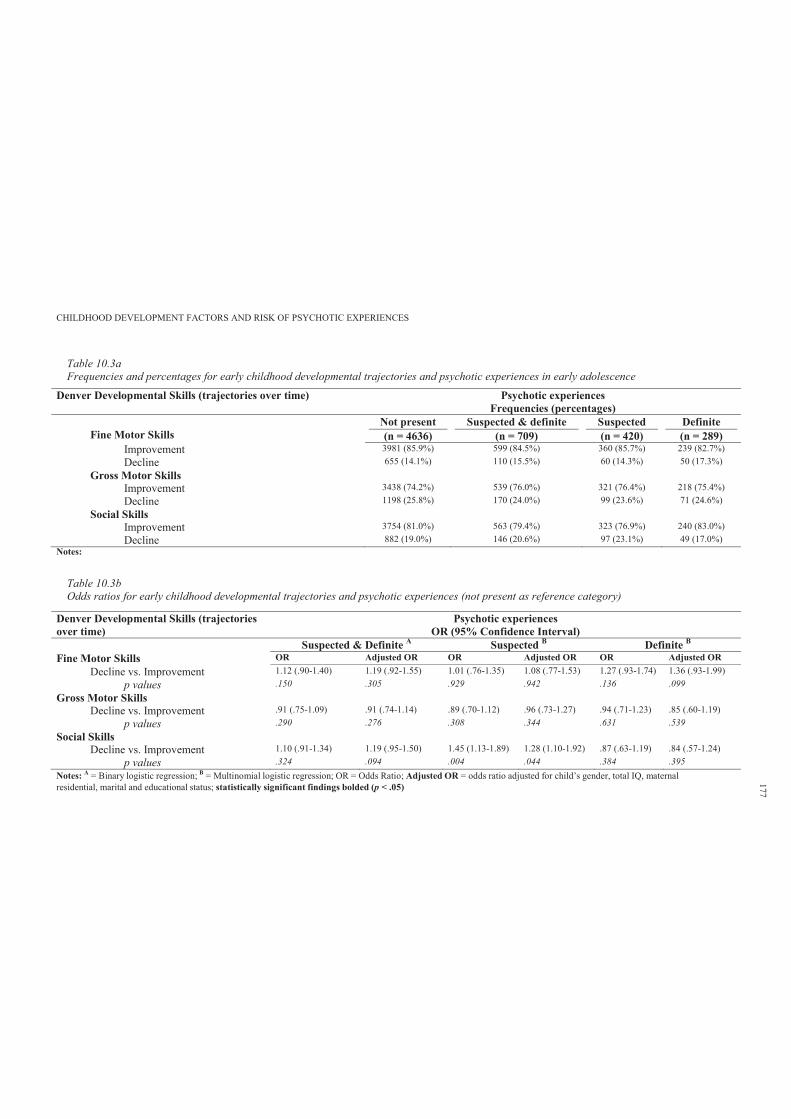
CHILDHOOD DEVELOPMENT FACTORS AND RISK OF PSYCHOTIC EXPERIENCES
Table 10.3aFrequencies and percentages for early childhood developmental trajectories and psychotic experiences in early adolescence
Denver Developmental Skills (trajectories over time) Psychotic experiencesFrequencies (percentages)
Fine Motor Skills Not present(n = 4636)
Suspected & definite(n = 709)
Suspected(n = 420)
Definite(n = 289)
Improvement 3981 (85.9%) 599 (84.5%) 360 (85.7%) 239 (82.7%)Decline 655 (14.1%) 110 (15.5%) 60 (14.3%) 50 (17.3%)
Gross Motor SkillsImprovement 3438 (74.2%) 539 (76.0%) 321 (76.4%) 218 (75.4%)Decline 1198 (25.8%) 170 (24.0%) 99 (23.6%) 71 (24.6%)
Social Skills Improvement 3754 (81.0%) 563 (79.4%) 323 (76.9%) 240 (83.0%)Decline 882 (19.0%) 146 (20.6%) 97 (23.1%) 49 (17.0%)
Notes:
Table 10.3bOdds ratios for early childhood developmental trajectories and psychotic experiences (not present as reference category)
Denver Developmental Skills (trajectories over time)
Psychotic experiencesOR (95% Confidence Interval)
Suspected & Definite A Suspected B Definite B
Fine Motor Skills OR Adjusted OR OR Adjusted OR OR Adjusted ORDecline vs. Improvement 1.12 (.90-1.40) 1.19 (.92-1.55) 1.01 (.76-1.35) 1.08 (.77-1.53) 1.27 (.93-1.74) 1.36 (.93-1.99)
p values .150 .305 .929 .942 .136 .099Gross Motor Skills
Decline vs. Improvement .91 (.75-1.09) .91 (.74-1.14) .89 (.70-1.12) .96 (.73-1.27) .94 (.71-1.23) .85 (.60-1.19)p values .290 .276 .308 .344 .631 .539
Social Skills Decline vs. Improvement 1.10 (.91-1.34) 1.19 (.95-1.50) 1.45 (1.13-1.89) 1.28 (1.10-1.92) .87 (.63-1.19) .84 (.57-1.24)
p values .324 .094 .004 .044 .384 .395Notes: A = Binary logistic regression; B = Multinomial logistic regression; OR = Odds Ratio; Adjusted OR = odds ratio adjusted for child’s gender, total IQ, maternal residential, marital and educational status; statistically significant findings bolded (p < .05)
177
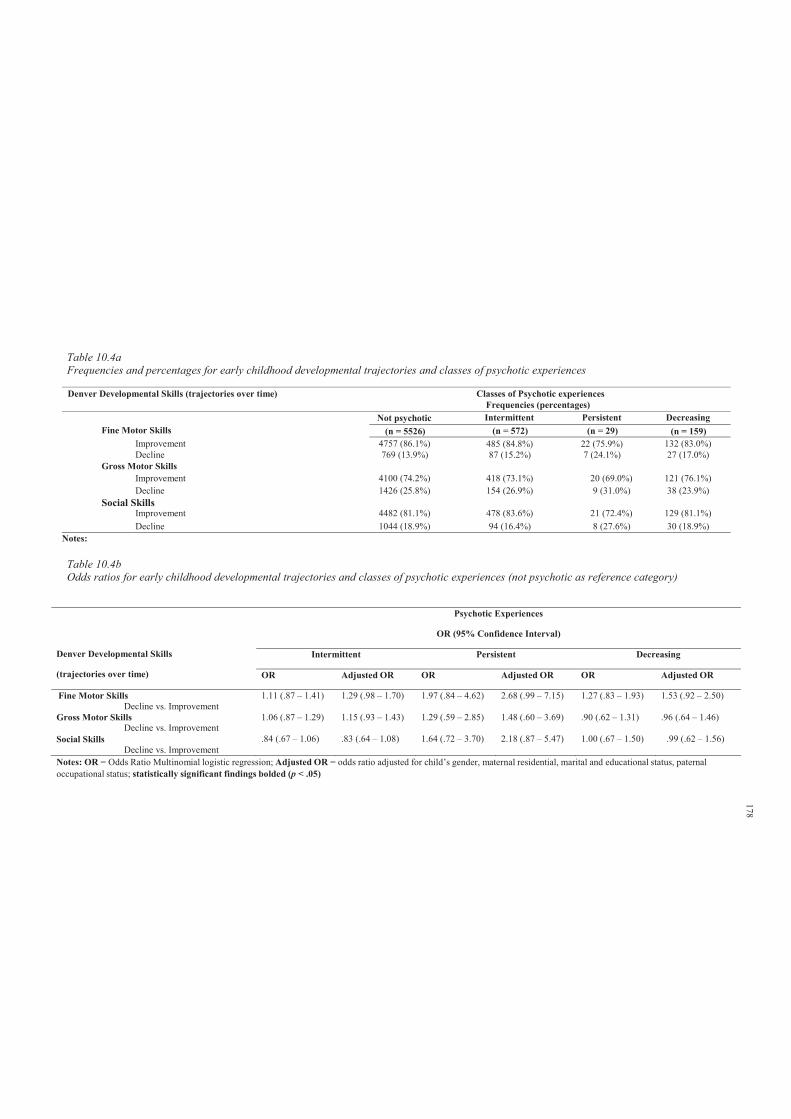
Denver Developmental Skills (trajectories over time) Classes of Psychotic experiences Frequencies (percentages)
Not psychotic Intermittent Persistent DecreasingFine Motor Skills (n = 5526) (n = 572) (n = 29) (n = 159)
Improvement 4757 (86.1%) 485 (84.8%) 22 (75.9%) 132 (83.0%)Decline 769 (13.9%) 87 (15.2%) 7 (24.1%) 27 (17.0%)
Gross Motor SkillsImprovement 4100 (74.2%) 418 (73.1%) 20 (69.0%) 121 (76.1%)Decline 1426 (25.8%) 154 (26.9%) 9 (31.0%) 38 (23.9%)
Improvement 4482 (81.1%) 478 (83.6%) 21 (72.4%) 129 (81.1%)Decline 1044 (18.9%) 94 (16.4%) 8 (27.6%) 30 (18.9%)
Notes:
Table 10.4aFrequencies and percentages for early childhood developmental trajectories and classes of psychotic experiences
Social Skills
Table 10.4bOdds ratios for early childhood developmental trajectories and classes of psychotic experiences (not psychotic as reference category)
Denver Developmental Skills
(trajectories over time)
Psychotic Experiences
OR (95% Confidence Interval)
Intermittent Persistent Decreasing
OR Adjusted OR OR Adjusted OR OR Adjusted OR
Fine Motor SkillsDecline vs. Improvement
1.11 (.87 – 1.41) 1.29 (.98 – 1.70) 1.97 (.84 – 4.62) 2.68 (.99 – 7.15) 1.27 (.83 – 1.93) 1.53 (.92 – 2.50)
Gross Motor SkillsDecline vs. Improvement
1.06 (.87 – 1.29) 1.15 (.93 – 1.43) 1.29 (.59 – 2.85) 1.48 (.60 – 3.69) .90 (.62 – 1.31) .96 (.64 – 1.46)
Social SkillsDecline vs. Improvement
.84 (.67 – 1.06) .83 (.64 – 1.08) 1.64 (.72 – 3.70) 2.18 (.87 – 5.47) 1.00 (.67 – 1.50) .99 (.62 – 1.56)
Notes: OR = Odds Ratio Multinomial logistic regression; Adjusted OR = odds ratio adjusted for child’s gender, maternal residential, marital and educational status, paternal occupational status; statistically significant findings bolded (p < .05)
178
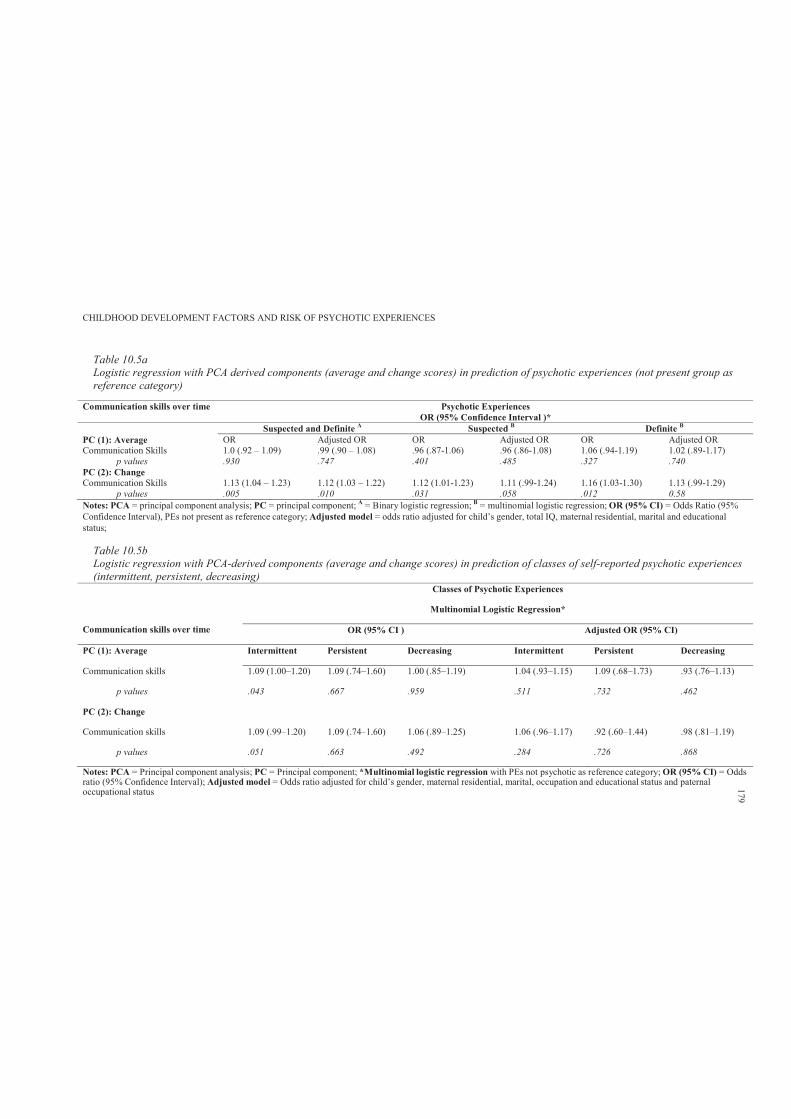
CHILDHOOD DEVELOPMENT FACTORS AND RISK OF PSYCHOTIC EXPERIENCES
Table 10.5aLogistic regression with PCA derived components (average and change scores) in prediction of psychotic experiences (not present group as reference category)
Communication skills over time Psychotic Experiences OR (95% Confidence Interval )*
Suspected and Definite A Suspected B Definite B
PC (1): Average OR Adjusted OR OR Adjusted OR OR Adjusted ORCommunication Skills 1.0 (.92 – 1.09) .99 (.90 – 1.08) .96 (.87-1.06) .96 (.86-1.08) 1.06 (.94-1.19) 1.02 (.89-1.17)
p values .930 .747 .401 .485 .327 .740PC (2): ChangeCommunication Skills 1.13 (1.04 – 1.23) 1.12 (1.03 – 1.22) 1.12 (1.01-1.23) 1.11 (.99-1.24) 1.16 (1.03-1.30) 1.13 (.99-1.29)
p values .005 .010 .031 .058 .012 0.58Notes: PCA = principal component analysis; PC = principal component; A = Binary logistic regression; B = multinomial logistic regression; OR (95% CI) = Odds Ratio (95%Confidence Interval), PEs not present as reference category; Adjusted model = odds ratio adjusted for child’s gender, total IQ, maternal residential, marital and educationalstatus;
Table 10.5bLogistic regression with PCA-derived components (average and change scores) in prediction of classes of self-reported psychotic experiences(intermittent, persistent, decreasing)
Classes of Psychotic Experiences
Communication skills over time
Multinomial Logistic Regression*
OR (95% CI ) Adjusted OR (95% CI)
PC (1): Average Intermittent Persistent Decreasing Intermittent Persistent Decreasing
Communication skills 1.09 (1.00–1.20) 1.09 (.74–1.60) 1.00 (.85–1.19) 1.04 (.93–1.15) 1.09 (.68–1.73) .93 (.76–1.13)
p values .043 .667 .959 .511 .732 .462
PC (2): Change
Communication skills 1.09 (.99–1.20) 1.09 (.74–1.60) 1.06 (.89–1.25) 1.06 (.96–1.17) .92 (.60–1.44) .98 (.81–1.19)
p values .051 .663 .492 .284 .726 .868
Notes: PCA = Principal component analysis; PC = Principal component; *Multinomial logistic regression with PEs not psychotic as reference category; OR (95% CI) = Oddsratio (95% Confidence Interval); Adjusted model = Odds ratio adjusted for child’s gender, maternal residential, marital, occupation and educational status and paternaloccupational status 179

CHILDHOOD DEVELOPMENT FACTORS AND RISK OF PSYCHOTIC EXPERIENCES 180
10.4 Discussion
As far as the author is aware, this was the first study to examine the association between
trajectories of change in child’s developmental skills over the first four years of life and PEs
in early adolescence. The hypothesis that decline in developmental skills would increase risk
of PEs was not supported. However, there was weak evidence of an association with changing
communication skills and declining social skills.
CHILDHOOD DEVELOPMENT FACTORS AND RISK OF PSYCHOTIC EXPERIENCES 181
Chapter 11: Study 5: Genotypic Variation and Childhood Cognitive
Profiles
11.1 Introduction
The reviewed genetic studies in Chapter 4 provided evidence (ranging from weak to
moderate) for associations between the major susceptibility genes (e.g., NRG1, DTNBP1, COMT,
DISC1) and schizophrenia. In addition, Chapter 4 selectively reviewed some studies on the
association of specific SNPs with cognitive profiles in individuals presenting with schizophrenia.
However, the findings of those studies were not consistent and suffered from the major limitation
of failure to replicate findings. In addition, Chapter 5 showed that the MTHFR 677 TT genotype
(versus CC/TC) was not associated with non- clinical PEs in the ALSPAC cohort.
This study uses child genetic and cognitive profile data from ALSPAC. Childhood literacy
skills (at 7 and 9 years) and intellectual profiles (at 8 years) were assessed during the ALPSAC
annual clinics. Child literacy is argued to be a good candidate for investigation as a predictor of
later PEs because it provides a general domain marker of numerous aspects of speech and
language development (see Chapter 7). In addition, verbal, performance and full scale IQ provide
a good representation of a child’s intellectual profile.
Further, to the researcher’s knowledge, no previous work has examined the independent
effect of genotypic variations (DTNBP1, NRG1 and DISC1) on the presence of PEs in early
adolescence. Moreover, no previous work has examined the joint interaction effect between
genotypic and cognitive variation in prediction of PEs in early adolescence.
Directed by findings from genetic association studies (see Chapter 4), this preliminary
study aims to examine genotypic variations in the DTNBP1, DISC1 and NRG1 genes and risk of
reporting PEs. This study also investigates the interactive effects of a genotypic risk indicator and
low-average cognitive skills on PEs.
The researcher hypothesised that experience of adolescent PEs would be associated with
CHILDHOOD DEVELOPMENT FACTORS AND RISK OF PSYCHOTIC EXPERIENCES 182
genotypic variations in the DTNBP1, DISC1 and NRG1 genes. It was also hypothesised that
experience of adolescent PEs would be associated with low average childhood cognitive skills
(literacy; verbal, performance and full scale IQ). Further, it was hypothesised that the interactive
effect of a genetic risk indicator and low average cognitive skills would be more influential on
PEs than either a genetic risk indicator or low average cognitive skills alone.
11.2 Method
11.2.1 Sample.
The sample characteristics are described in Section 6.2.6.
11.2.2 Participants.
Participants’ details are provided in Section 6.2.6.
11.2.3 Measures.
11.2.3.1. Primary outcome.
PEs were measured at the ALSPAC clinic using the PLIKS semi-structured face-to- face
interview. This has been described in detail in Section 6.2.3.
11.2.3.2. Secondary outcome.
The four classes (trajectories) of change in self-reported PEs (non-psychotic, n = 6399;
87.3%; intermittent, n = 727; 9.9%; persistent, n = 34; 0.5%; and decreasing, n = 171; 2.1%) were
used as secondary outcome variables (detailed description is provided in Section 6.2.3).
11.2.3.3. Literacy skills.
Literacy skills (spelling, basic reading skills and comprehension) were measured during
ALSPAC annual assessment clinics (for more details refer to Chapter 7).
11.2.3.4. Intellectual profile.
Children’s intellectual functioning was assessed by WISC at mean age 8 years.
11.2.3.5. DTNBP1, DISC1 and NRG1 genotypes.
Genotyping was performed by KBioscience (http://www.kbioscience.co.uk ); SNPs were
genotyped using the KASP-SNP genotyping system. KASP is a competitive allele- specific
polymerase chain reaction incorporating a fluorescent resonance energy transfer quencher cassette
(detailed information is provided at http://www.kbioscience.co.uk/reagents/KASP.html).
CHILDHOOD DEVELOPMENT FACTORS AND RISK OF PSYCHOTIC EXPERIENCES 183
11.2.4 Covariates.
Detailed description is provided in Section 6.2.5.
11.2.5 Data manipulation and statistical analyses.
11.2.5.1. Genetic analysis.
The number of individuals endorsing PEs in relation to DTNBP1, DISC and NRG1
genotypes was examined using frequency distribution. Logistic regression was used to
calculate odds ratios and 95% confidence intervals for association between DTNBP1,
DISC1, NRG1 genotypes and PEs.14
11.2.5.2. Literacy factor.
Measurements of literacy skills were highly positively correlated (see Appendix 11.A).
Factor analysis was used to derive a composite factor representing childhood literacy skills.
The KMO Measure of Sampling Adequacy revealed a satisfactory fit of the data for factor
analysis (.93). The first extracted component representing literacy skills accounted for 73.21% of
the variation in the original measurements of literacy skills (eigenvalue = 5.86). The proceeding
components had eigenvalues considerably lower than 1 (a widely used variance-reduction criteria
is the Kaiser-Guttman criterion of eigenvalue aiser, 1960). The saved standardised
literacy component was then categorised as low (score SD of the mean) and above low
average (score SD of the mean) and used as a categorical predictor in subsequent analyses in
relation to PEs.
11.2.5.3. Intellectual factor.
Verbal, performance and full-scale IQ score were categorised as low ( SD of the mean)
and above low average ( SD of the mean) and used in subsequent analyses in relation to PEs.
The direct effect of low average childhood cognitive skills on PEs was examined using binary and
multinomial logistic regression.
14 The genetic analysis in this study is limited to examination of single genotypes in relation to PEs. Hardy- Weinberg
equilibrium and haplotype analyses were not conducted due to non-access to specialised genetic software such as
GENECOUNTING and PLINK. These issues are discussed in Section 13.1.5.
CHILDHOOD DEVELOPMENT FACTORS AND RISK OF PSYCHOTIC EXPERIENCES 184
11.2.5.4. Additive model of interaction.
For this study, binary variables representing presence or absence of low average cognitive
profile and genotypic risk indicators were combined to define four empirical conditions. These
were:
Group 0: absence of both low average cognitive profile and genotypic risk indicator
(reference group);
Group 1: presence of genotypic risk indicator only;
Group 2: presence of low average cognitive profile only; and
Group 3: presence of both genotypic risk indicator and low average cognitive profile (joint
effects) (Lewis & Olsson, 2011).
This allowed comparison of risk estimates between independent and joint exposure effect.
The odds ratio for interaction effects was calculated by comparing risk associated with
joint exposure to both a genotypic risk indicator and a low average cognitive profile (Group 3)
with risk associated with neither factor (Group 0; reference category). However, importantly, joint
exposure does prevent separate contributions from either genotypic risk indicators or low average
cognitive profile in isolation (Lewis & Olsson, 2011).
To generate the percentage of risk attributable to the joint action of genotypic risk
indicators and low average cognitive profile, the expected risk for no interaction was calculated
by adding risks associated with genotypic risk indicator (Group 1) and low average cognitive
profile (Group 2) and subtracting the background risk (Group 0).
The difference between the expected risk for no interaction and the observed risk for joint
exposure was then divided by the observed risk for joint exposure to represent the percentage of
the risk attributable to the joint action of both exposures (Lewis & Olsson, 2011). Interaction is
notable when the percentage of risk attributable to joint interaction exceeds 30% (Rothman,
Greenland & Lash, 2008).
Within each exposure level, this study estimated the positive predictive value (PPV) and
the attributable risk percentage (AR%). PVV is the probability of PEs given exposure status. It
provides information of value for prediction of individual level risk (Lewis & Olsson, 2011).
CHILDHOOD DEVELOPMENT FACTORS AND RISK OF PSYCHOTIC EXPERIENCES 185
AR% is the proportion of individuals with PEs within a particular exposure level that is
attributable to having that exposure (Lewis & Olsson, 2011).
11.3 Results
11.3.1 DTNBP1, NRG1 and DISC1 genotypes and psychotic experiences.
Table 11.1a shows the distribution of endorsing PEs in relation to the DTNBP1, NRG1
and DISC1 genotypes. The results show a statistically significant effect (OR = 1.40, 95% CI =
1.04–1.89, p = .029) for only DTNBP1 (rs4715984); with greater frequency of G:A alleles
overrepresented in the definite PEs group (20.9% compared to 15.8% and 13.9% in the PEs not
present and suspected group, respectively). In addition, the combined rare homozygotes to the
heterozygotes (G:A + A:A) revealed a p value of .055 and was found to be overrepresented
(21.3%) in the definite PEs as compared to the not present group (16.8%).
Further, those with suspected PEs were found to have greater frequencies of NRG1
(nrg221533) C:T genotypes (52.2%, OR = 1.26, 95% CI = 1.01–1.56) than did those with definite
(46.2%) and not present PEs (47.0%). In addition, Table 11.1b shows that DISC1 (rs6675281)
T:T genotypes were overrepresented in those with suspected PEs (OR = 1.86, 95% CI = 1.02–
3.38).
Table 11.1c shows the distribution of trajectories of change in self-reported PEs over time
in relation to the DTNBP1, NRG1 and DISC1 genotypes. The results showed no evidence of
association between persistent PEs over time and the DTNBP1, NRG1, DISC1 genotypes.
However, while greater frequency of the combined rare homozygotes (G:A + A:A, DTNBP1
[rs4715984]) was observed in those with persistent PEs over time (29.2%) as compared to the
non-psychotic group (16.6%), this overrepresentation was not statistically significant (OR = 2.08,
95% CI = .86–5.02).
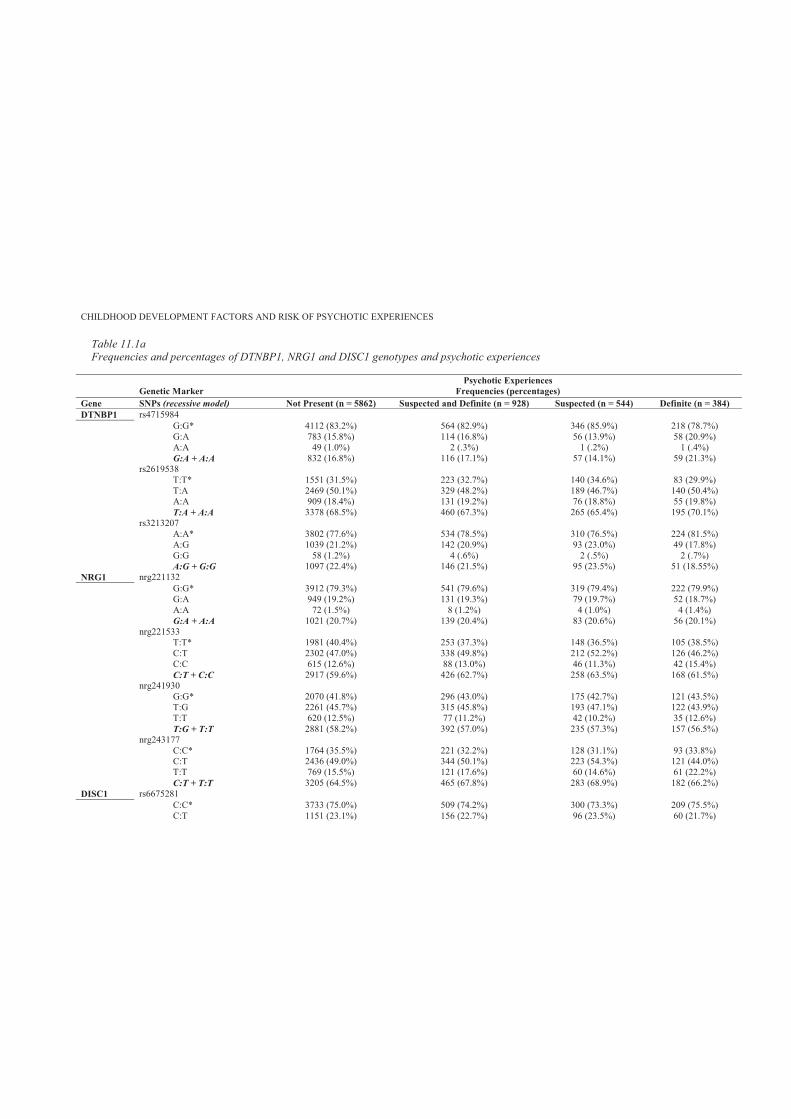
CHILDHOOD DEVELOPMENT FACTORS AND RISK OF PSYCHOTIC EXPERIENCES
Table 11.1aFrequencies and percentages of DTNBP1, NRG1 and DISC1 genotypes and psychotic experiences
Genetic Marker Psychotic Experiences
Frequencies (percentages)Gene SNPs (recessive model) Not Present (n = 5862) Suspected and Definite (n = 928) Suspected (n = 544) Definite (n = 384)DTNBP1 rs4715984
G:G* 4112 (83.2%) 564 (82.9%) 346 (85.9%) 218 (78.7%)G:A 783 (15.8%) 114 (16.8%) 56 (13.9%) 58 (20.9%)A:A 49 (1.0%) 2 (.3%) 1 (.2%) 1 (.4%)G:A + A:A 832 (16.8%) 116 (17.1%) 57 (14.1%) 59 (21.3%)
rs2619538T:T* 1551 (31.5%) 223 (32.7%) 140 (34.6%) 83 (29.9%)T:A 2469 (50.1%) 329 (48.2%) 189 (46.7%) 140 (50.4%)A:A 909 (18.4%) 131 (19.2%) 76 (18.8%) 55 (19.8%)T:A + A:A 3378 (68.5%) 460 (67.3%) 265 (65.4%) 195 (70.1%)
rs3213207A:A* 3802 (77.6%) 534 (78.5%) 310 (76.5%) 224 (81.5%)A:G 1039 (21.2%) 142 (20.9%) 93 (23.0%) 49 (17.8%)G:G 58 (1.2%) 4 (.6%) 2 (.5%) 2 (.7%)A:G + G:G 1097 (22.4%) 146 (21.5%) 95 (23.5%) 51 (18.55%)
NRG1 nrg221132G:G* 3912 (79.3%) 541 (79.6%) 319 (79.4%) 222 (79.9%)G:A 949 (19.2%) 131 (19.3%) 79 (19.7%) 52 (18.7%)A:A 72 (1.5%) 8 (1.2%) 4 (1.0%) 4 (1.4%)G:A + A:A 1021 (20.7%) 139 (20.4%) 83 (20.6%) 56 (20.1%)
nrg221533T:T* 1981 (40.4%) 253 (37.3%) 148 (36.5%) 105 (38.5%)C:T 2302 (47.0%) 338 (49.8%) 212 (52.2%) 126 (46.2%)C:C 615 (12.6%) 88 (13.0%) 46 (11.3%) 42 (15.4%)C:T + C:C 2917 (59.6%) 426 (62.7%) 258 (63.5%) 168 (61.5%)
nrg241930G:G* 2070 (41.8%) 296 (43.0%) 175 (42.7%) 121 (43.5%)T:G 2261 (45.7%) 315 (45.8%) 193 (47.1%) 122 (43.9%)T:T 620 (12.5%) 77 (11.2%) 42 (10.2%) 35 (12.6%)T:G + T:T 2881 (58.2%) 392 (57.0%) 235 (57.3%) 157 (56.5%)
nrg243177C:C* 1764 (35.5%) 221 (32.2%) 128 (31.1%) 93 (33.8%)C:T 2436 (49.0%) 344 (50.1%) 223 (54.3%) 121 (44.0%)T:T 769 (15.5%) 121 (17.6%) 60 (14.6%) 61 (22.2%)C:T + T:T 3205 (64.5%) 465 (67.8%) 283 (68.9%) 182 (66.2%)
DISC1 rs6675281C:C* 3733 (75.0%) 509 (74.2%) 300 (73.3%) 209 (75.5%)C:T 1151 (23.1%) 156 (22.7%) 96 (23.5%) 60 (21.7%)
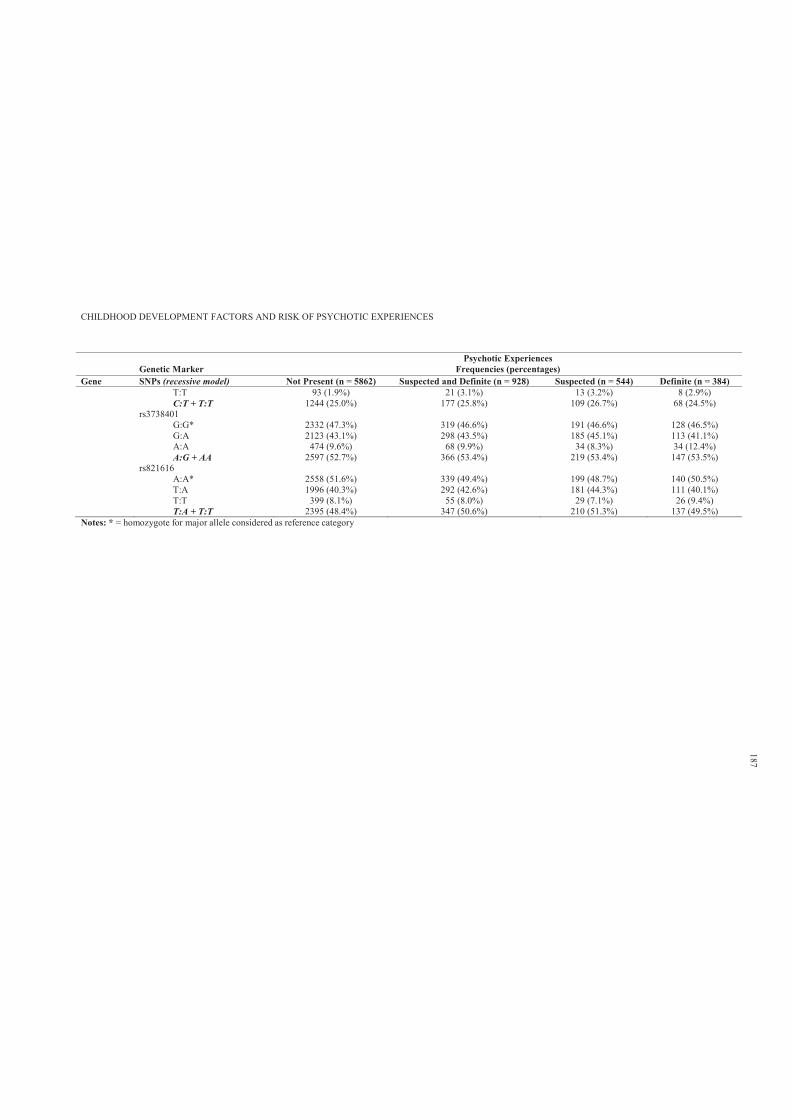
CHILDHOOD DEVELOPMENT FACTORS AND RISK OF PSYCHOTIC EXPERIENCES
Genetic Marker Psychotic Experiences
Frequencies (percentages)Gene SNPs (recessive model) Not Present (n = 5862) Suspected and Definite (n = 928) Suspected (n = 544) Definite (n = 384)
T:T 93 (1.9%) 21 (3.1%) 13 (3.2%) 8 (2.9%)C:T + T:T 1244 (25.0%) 177 (25.8%) 109 (26.7%) 68 (24.5%)
rs3738401G:G* 2332 (47.3%) 319 (46.6%) 191 (46.6%) 128 (46.5%)G:A 2123 (43.1%) 298 (43.5%) 185 (45.1%) 113 (41.1%)A:A 474 (9.6%) 68 (9.9%) 34 (8.3%) 34 (12.4%)A:G + AA 2597 (52.7%) 366 (53.4%) 219 (53.4%) 147 (53.5%)
rs821616A:A* 2558 (51.6%) 339 (49.4%) 199 (48.7%) 140 (50.5%)T:A 1996 (40.3%) 292 (42.6%) 181 (44.3%) 111 (40.1%)T:T 399 (8.1%) 55 (8.0%) 29 (7.1%) 26 (9.4%)T:A + T:T 2395 (48.4%) 347 (50.6%) 210 (51.3%) 137 (49.5%)
Notes: * = homozygote for major allele considered as reference category
187
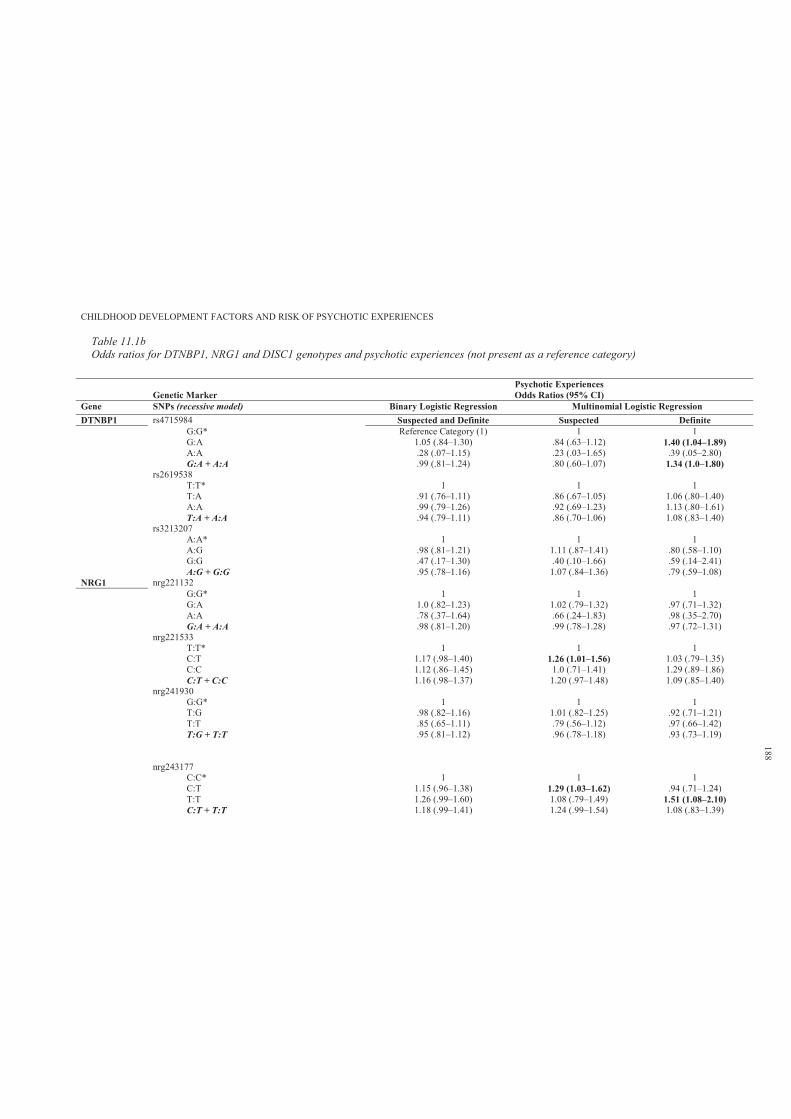
CHILDHOOD DEVELOPMENT FACTORS AND RISK OF PSYCHOTIC EXPERIENCES
Table 11.1bOdds ratios for DTNBP1, NRG1 and DISC1 genotypes and psychotic experiences (not present as a reference category)
Genetic Marker Psychotic ExperiencesOdds Ratios (95% CI)
Gene SNPs (recessive model) Binary Logistic Regression Multinomial Logistic RegressionDTNBP1 rs4715984 Suspected and Definite Suspected Definite
G:G* Reference Category (1) 1 1G:A 1.05 (.84–1.30) .84 (.63–1.12) 1.40 (1.04–1.89)A:A .28 (.07–1.15) .23 (.03–1.65) .39 (.05–2.80)G:A + A:A .99 (.81–1.24) .80 (.60–1.07) 1.34 (1.0–1.80)
rs2619538T:T* 1 1 1T:A .91 (.76–1.11) .86 (.67–1.05) 1.06 (.80–1.40)A:A .99 (.79–1.26) .92 (.69–1.23) 1.13 (.80–1.61)T:A + A:A .94 (.79–1.11) .86 (.70–1.06) 1.08 (.83–1.40)
rs3213207A:A* 1 1 1A:G .98 (.81–1.21) 1.11 (.87–1.41) .80 (.58–1.10)G:G .47 (.17–1.30) .40 (.10–1.66) .59 (.14–2.41)A:G + G:G .95 (.78–1.16) 1.07 (.84–1.36) .79 (.59–1.08)
NRG1 nrg221132G:G* 1 1 1G:A 1.0 (.82–1.23) 1.02 (.79–1.32) .97 (.71–1.32)A:A .78 (.37–1.64) .66 (.24–1.83) .98 (.35–2.70)G:A + A:A .98 (.81–1.20) .99 (.78–1.28) .97 (.72–1.31)
nrg221533T:T* 1 1 1C:T 1.17 (.98–1.40) 1.26 (1.01–1.56) 1.03 (.79–1.35)C:C 1.12 (.86–1.45) 1.0 (.71–1.41) 1.29 (.89–1.86)C:T + C:C 1.16 (.98–1.37) 1.20 (.97–1.48) 1.09 (.85–1.40)
nrg241930G:G* 1 1 1T:G .98 (.82–1.16) 1.01 (.82–1.25) .92 (.71–1.21)T:T .85 (.65–1.11) .79 (.56–1.12) .97 (.66–1.42)T:G + T:T .95 (.81–1.12) .96 (.78–1.18) .93 (.73–1.19)
nrg243177C:C* 1 1 1C:T 1.15 (.96–1.38) 1.29 (1.03–1.62) .94 (.71–1.24)T:T 1.26 (.99–1.60) 1.08 (.79–1.49) 1.51 (1.08–2.10)C:T + T:T 1.18 (.99–1.41) 1.24 (.99–1.54) 1.08 (.83–1.39)
188
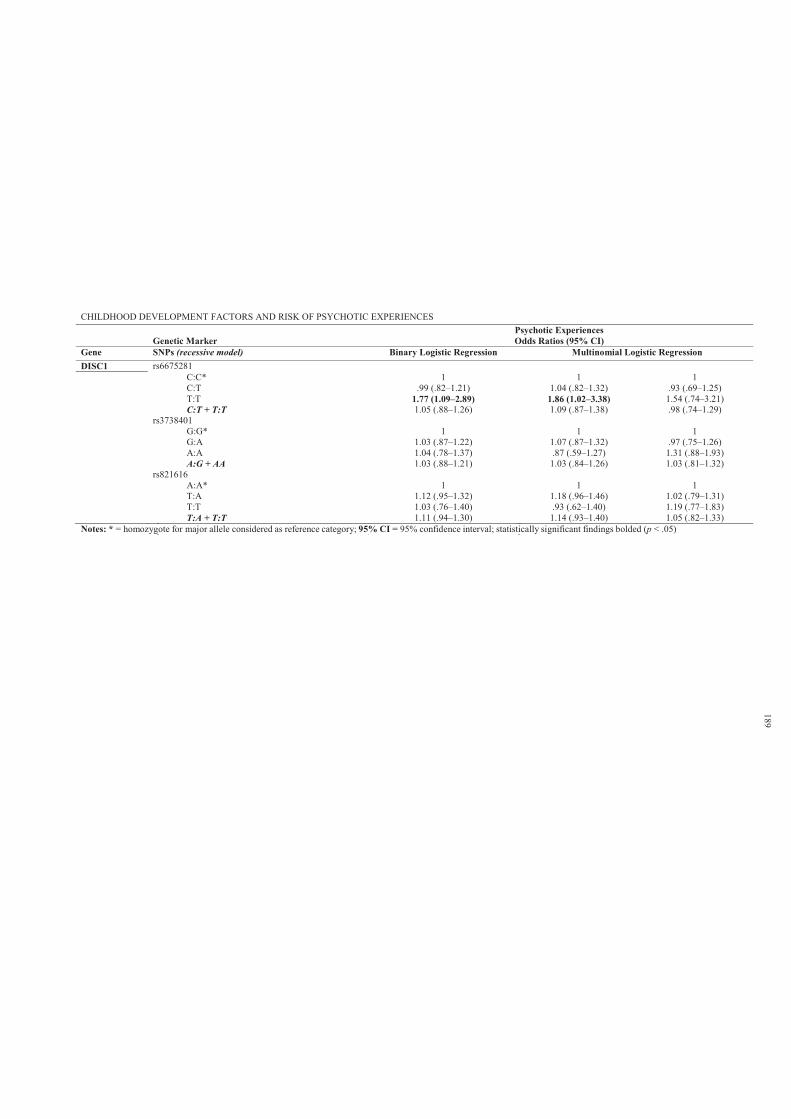
CHILDHOOD DEVELOPMENT FACTORS AND RISK OF PSYCHOTIC EXPERIENCES
Genetic Marker Psychotic ExperiencesOdds Ratios (95% CI)
Gene SNPs (recessive model) Binary Logistic Regression Multinomial Logistic RegressionDISC1 rs6675281
C:C* 1 1 1C:T .99 (.82–1.21) 1.04 (.82–1.32) .93 (.69–1.25)T:T 1.77 (1.09–2.89) 1.86 (1.02–3.38) 1.54 (.74–3.21)C:T + T:T 1.05 (.88–1.26) 1.09 (.87–1.38) .98 (.74–1.29)
rs3738401G:G* 1 1 1G:A 1.03 (.87–1.22) 1.07 (.87–1.32) .97 (.75–1.26)A:A 1.04 (.78–1.37) .87 (.59–1.27) 1.31 (.88–1.93)A:G + AA 1.03 (.88–1.21) 1.03 (.84–1.26) 1.03 (.81–1.32)
rs821616A:A* 1 1 1T:A 1.12 (.95–1.32) 1.18 (.96–1.46) 1.02 (.79–1.31)T:T 1.03 (.76–1.40) .93 (.62–1.40) 1.19 (.77–1.83)T:A + T:T 1.11 (.94–1.30) 1.14 (.93–1.40) 1.05 (.82–1.33)
Notes: * = homozygote for major allele considered as reference category; 95% CI = 95% confidence interval; statistically significant findings bolded (p < .05)
189
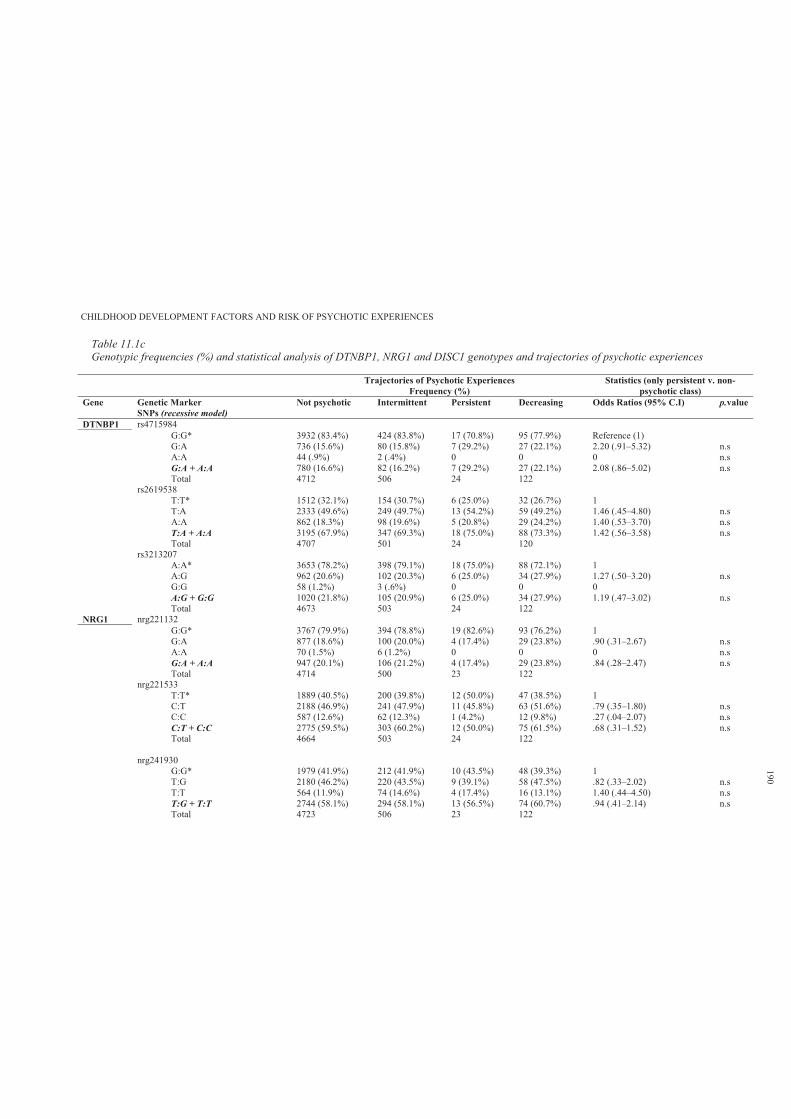
CHILDHOOD DEVELOPMENT FACTORS AND RISK OF PSYCHOTIC EXPERIENCES
Table 11.1cGenotypic frequencies (%) and statistical analysis of DTNBP1, NRG1 and DISC1 genotypes and trajectories of psychotic experiences
Trajectories of Psychotic ExperiencesFrequency (%)
Statistics (only persistent v. non-psychotic class)
Gene Genetic MarkerSNPs (recessive model)
Not psychotic Intermittent Persistent Decreasing Odds Ratios (95% C.I) p.value
DTNBP1 rs4715984G:G* 3932 (83.4%) 424 (83.8%) 17 (70.8%) 95 (77.9%) Reference (1) G:A 736 (15.6%) 80 (15.8%) 7 (29.2%) 27 (22.1%) 2.20 (.91–5.32) n.sA:A 44 (.9%) 2 (.4%) 0 0 0 n.s G:A + A:A 780 (16.6%) 82 (16.2%) 7 (29.2%) 27 (22.1%) 2.08 (.86–5.02) n.sTotal 4712 506 24 122
rs2619538T:T* 1512 (32.1%) 154 (30.7%) 6 (25.0%) 32 (26.7%) 1T:A 2333 (49.6%) 249 (49.7%) 13 (54.2%) 59 (49.2%) 1.46 (.45–4.80) n.s A:A 862 (18.3%) 98 (19.6%) 5 (20.8%) 29 (24.2%) 1.40 (.53–3.70) n.s T:A + A:A 3195 (67.9%) 347 (69.3%) 18 (75.0%) 88 (73.3%) 1.42 (.56–3.58) n.s Total 4707 501 24 120
rs3213207A:A* 3653 (78.2%) 398 (79.1%) 18 (75.0%) 88 (72.1%) 1A:G 962 (20.6%) 102 (20.3%) 6 (25.0%) 34 (27.9%) 1.27 (.50–3.20) n.s G:G 58 (1.2%) 3 (.6%) 0 0 0A:G + G:G 1020 (21.8%) 105 (20.9%) 6 (25.0%) 34 (27.9%) 1.19 (.47–3.02) n.s Total 4673 503 24 122
NRG1 nrg221132G:G* 3767 (79.9%) 394 (78.8%) 19 (82.6%) 93 (76.2%) 1G:A 877 (18.6%) 100 (20.0%) 4 (17.4%) 29 (23.8%) .90 (.31–2.67) n.sA:A 70 (1.5%) 6 (1.2%) 0 0 0 n.s G:A + A:A 947 (20.1%) 106 (21.2%) 4 (17.4%) 29 (23.8%) .84 (.28–2.47) n.s Total 4714 500 23 122
nrg221533T:T* 1889 (40.5%) 200 (39.8%) 12 (50.0%) 47 (38.5%) 1C:T 2188 (46.9%) 241 (47.9%) 11 (45.8%) 63 (51.6%) .79 (.35–1.80) n.s C:C 587 (12.6%) 62 (12.3%) 1 (4.2%) 12 (9.8%) .27 (.04–2.07) n.s C:T + C:C 2775 (59.5%) 303 (60.2%) 12 (50.0%) 75 (61.5%) .68 (.31–1.52) n.s Total 4664 503 24 122
nrg241930G:G* 1979 (41.9%) 212 (41.9%) 10 (43.5%) 48 (39.3%) 1T:G 2180 (46.2%) 220 (43.5%) 9 (39.1%) 58 (47.5%) .82 (.33–2.02) n.s T:T 564 (11.9%) 74 (14.6%) 4 (17.4%) 16 (13.1%) 1.40 (.44–4.50) n.s T:G + T:T 2744 (58.1%) 294 (58.1%) 13 (56.5%) 74 (60.7%) .94 (.41–2.14) n.s Total 4723 506 23 122
190
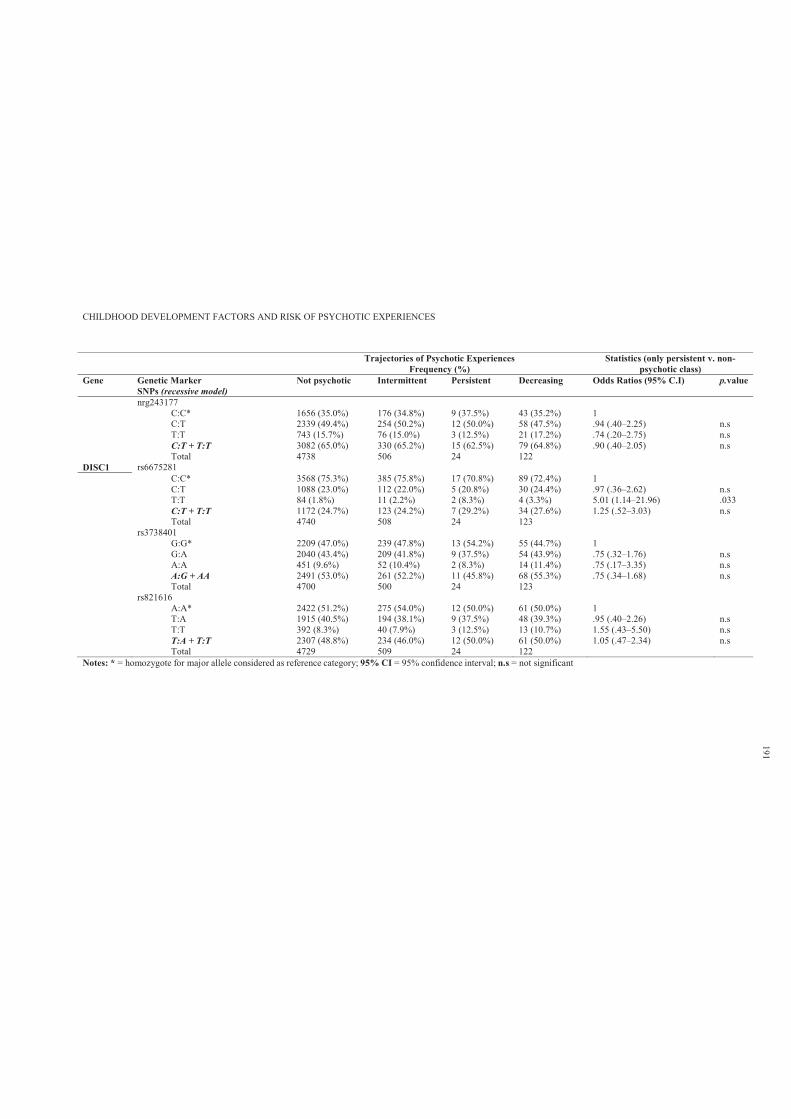
CHILDHOOD DEVELOPMENT FACTORS AND RISK OF PSYCHOTIC EXPERIENCES
Trajectories of Psychotic ExperiencesFrequency (%)
Statistics (only persistent v. non-psychotic class)
Gene Genetic MarkerSNPs (recessive model)
Not psychotic Intermittent Persistent Decreasing Odds Ratios (95% C.I) p.value
nrg243177C:C* 1656 (35.0%) 176 (34.8%) 9 (37.5%) 43 (35.2%) 1C:T 2339 (49.4%) 254 (50.2%) 12 (50.0%) 58 (47.5%) .94 (.40–2.25) n.s T:T 743 (15.7%) 76 (15.0%) 3 (12.5%) 21 (17.2%) .74 (.20–2.75) n.s C:T + T:T 3082 (65.0%) 330 (65.2%) 15 (62.5%) 79 (64.8%) .90 (.40–2.05) n.s Total 4738 506 24 122
DISC1 rs6675281C:C* 3568 (75.3%) 385 (75.8%) 17 (70.8%) 89 (72.4%) 1C:T 1088 (23.0%) 112 (22.0%) 5 (20.8%) 30 (24.4%) .97 (.36–2.62) n.s T:T 84 (1.8%) 11 (2.2%) 2 (8.3%) 4 (3.3%) 5.01 (1.14–21.96) .033C:T + T:T 1172 (24.7%) 123 (24.2%) 7 (29.2%) 34 (27.6%) 1.25 (.52–3.03) n.s Total 4740 508 24 123
rs3738401G:G* 2209 (47.0%) 239 (47.8%) 13 (54.2%) 55 (44.7%) 1G:A 2040 (43.4%) 209 (41.8%) 9 (37.5%) 54 (43.9%) .75 (.32–1.76) n.s A:A 451 (9.6%) 52 (10.4%) 2 (8.3%) 14 (11.4%) .75 (.17–3.35) n.s A:G + AA 2491 (53.0%) 261 (52.2%) 11 (45.8%) 68 (55.3%) .75 (.34–1.68) n.s Total 4700 500 24 123
rs821616A:A* 2422 (51.2%) 275 (54.0%) 12 (50.0%) 61 (50.0%) 1T:A 1915 (40.5%) 194 (38.1%) 9 (37.5%) 48 (39.3%) .95 (.40–2.26) n.s T:T 392 (8.3%) 40 (7.9%) 3 (12.5%) 13 (10.7%) 1.55 (.43–5.50) n.s T:A + T:T 2307 (48.8%) 234 (46.0%) 12 (50.0%) 61 (50.0%) 1.05 (.47–2.34) n.s Total 4729 509 24 122
Notes: * = homozygote for major allele considered as reference category; 95% CI = 95% confidence interval; n.s = not significant
191
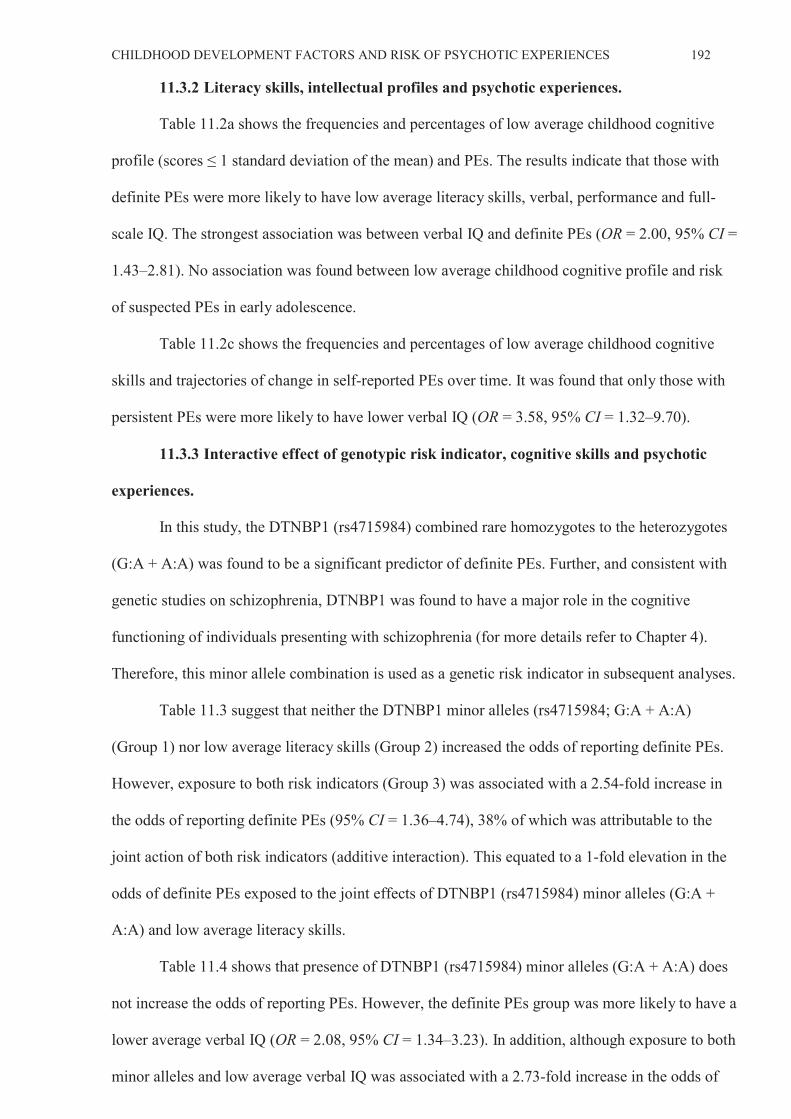
CHILDHOOD DEVELOPMENT FACTORS AND RISK OF PSYCHOTIC EXPERIENCES 192
11.3.2 Literacy skills, intellectual profiles and psychotic experiences.
Table 11.2a shows the frequencies and percentages of low average childhood cognitive
profile (scores andard deviation of the mean) and PEs. The results indicate that those with
definite PEs were more likely to have low average literacy skills, verbal, performance and full-
scale IQ. The strongest association was between verbal IQ and definite PEs (OR = 2.00, 95% CI =
1.43–2.81). No association was found between low average childhood cognitive profile and risk
of suspected PEs in early adolescence.
Table 11.2c shows the frequencies and percentages of low average childhood cognitive
skills and trajectories of change in self-reported PEs over time. It was found that only those with
persistent PEs were more likely to have lower verbal IQ (OR = 3.58, 95% CI = 1.32–9.70).
11.3.3 Interactive effect of genotypic risk indicator, cognitive skills and psychotic
experiences.
In this study, the DTNBP1 (rs4715984) combined rare homozygotes to the heterozygotes
(G:A + A:A) was found to be a significant predictor of definite PEs. Further, and consistent with
genetic studies on schizophrenia, DTNBP1 was found to have a major role in the cognitive
functioning of individuals presenting with schizophrenia (for more details refer to Chapter 4).
Therefore, this minor allele combination is used as a genetic risk indicator in subsequent analyses.
Table 11.3 suggest that neither the DTNBP1 minor alleles (rs4715984; G:A + A:A)
(Group 1) nor low average literacy skills (Group 2) increased the odds of reporting definite PEs.
However, exposure to both risk indicators (Group 3) was associated with a 2.54-fold increase in
the odds of reporting definite PEs (95% CI = 1.36–4.74), 38% of which was attributable to the
joint action of both risk indicators (additive interaction). This equated to a 1-fold elevation in the
odds of definite PEs exposed to the joint effects of DTNBP1 (rs4715984) minor alleles (G:A +
A:A) and low average literacy skills.
Table 11.4 shows that presence of DTNBP1 (rs4715984) minor alleles (G:A + A:A) does
not increase the odds of reporting PEs. However, the definite PEs group was more likely to have a
lower average verbal IQ (OR = 2.08, 95% CI = 1.34–3.23). In addition, although exposure to both
minor alleles and low average verbal IQ was associated with a 2.73-fold increase in the odds of
CHILDHOOD DEVELOPMENT FACTORS AND RISK OF PSYCHOTIC EXPERIENCES 193
reporting PEs (95% CI = 1.22–6.09), only 11% was attributable to the joint action of both factors
(additive interaction). This equated to a .30- fold elevation in the odds of reporting PEs.
Table 11.5 shows that DTNBP1 (rs4715984) minor alleles (G:A + A:A) and low average
performance IQ were overrepresented in those with definite PEs. However, there was no evidence
of an additive interaction. Further, Table 11.6 shows that both DTNBP1 (rs4715984) minor alleles
(G:A + A:A) and low average total IQ were overrepresented in those with definite PEs, but only
the latter increased the odds of PEs (OR = 2.14, 95% CI = 1.46–3.13). Moreover, although
exposure to both factors (Group 3) was associated with a 2.54-fold increase in the odds of
reporting PEs (95% CI = 1.25–5.17), only a very small percentage (.02%) was attributable to the
joint action of both risk factors (additive interaction).
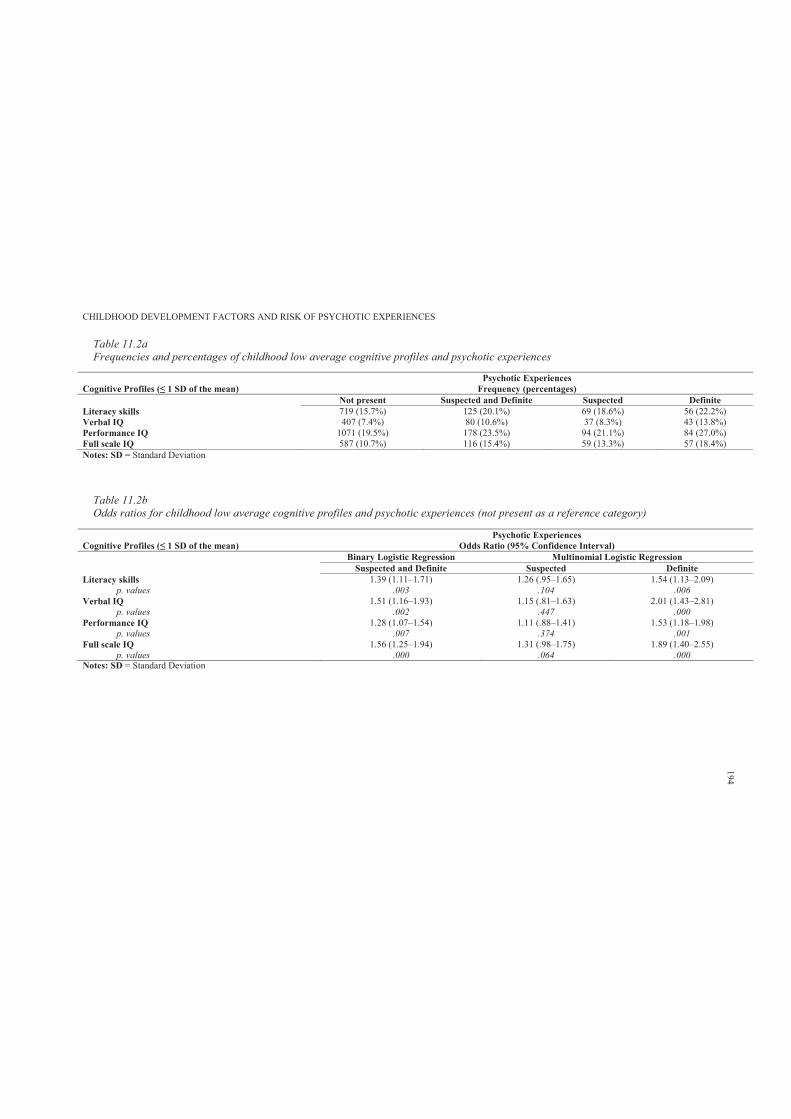
CHILDHOOD DEVELOPMENT FACTORS AND RISK OF PSYCHOTIC EXPERIENCES
Table 11.2aFrequencies and percentages of childhood low average cognitive profiles and psychotic experiences
Psychotic ExperiencesFrequency (percentages)
Not present Suspected and Definite Suspected DefiniteLiteracy skills 719 (15.7%) 125 (20.1%) 69 (18.6%) 56 (22.2%)Verbal IQ 407 (7.4%) 80 (10.6%) 37 (8.3%) 43 (13.8%)Performance IQ 1071 (19.5%) 178 (23.5%) 94 (21.1%) 84 (27.0%)Full scale IQ 587 (10.7%) 116 (15.4%) 59 (13.3%) 57 (18.4%)Notes: SD = Standard Deviation
Table 11.2bOdds ratios for childhood low average cognitive profiles and psychotic experiences (not present as a reference category)
Cognitive Profiles (Psychotic Experiences
Odds Ratio (95% Confidence Interval) Binary Logistic Regression Multinomial Logistic Regression
Suspected and Definite Suspected DefiniteLiteracy skills 1.39 (1.11–1.71) 1.26 (.95–1.65) 1.54 (1.13–2.09)
p. values .003 .104 .006Verbal IQ 1.51 (1.16–1.93) 1.15 (.81–1.63) 2.01 (1.43–2.81)
p. values .002 .447 .000Performance IQ 1.28 (1.07–1.54) 1.11 (.88–1.41) 1.53 (1.18–1.98)
p. values .007 .374 .001Full scale IQ 1.56 (1.25–1.94) 1.31 (.98–1.75) 1.89 (1.40–2.55)
p. values .000 .064 .000Notes: SD = Standard Deviation
194
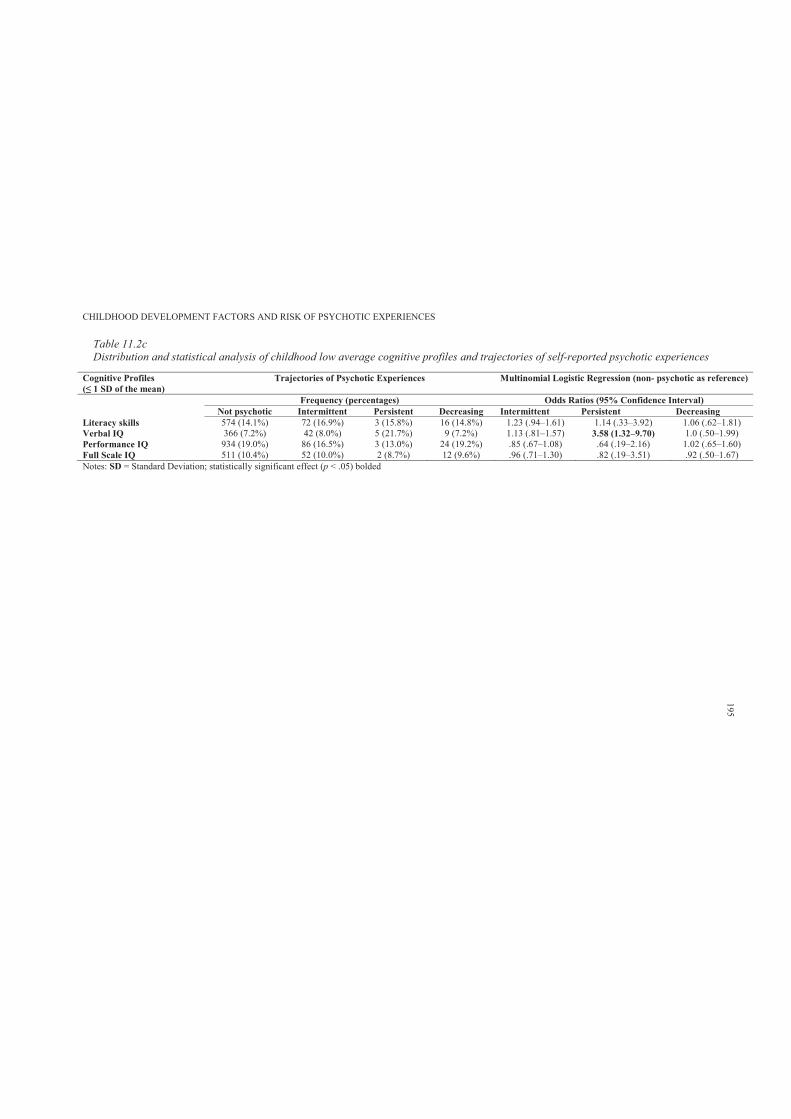
CHILDHOOD DEVELOPMENT FACTORS AND RISK OF PSYCHOTIC EXPERIENCES
Table 11.2cDistribution and statistical analysis of childhood low average cognitive profiles and trajectories of self-reported psychotic experiences
Cognitive Profiles Trajectories of Psychotic Experiences Multinomial Logistic Regression (non- psychotic as reference)
Frequency (percentages) Odds Ratios (95% Confidence Interval) Not psychotic Intermittent Persistent Decreasing Intermittent Persistent Decreasing
Literacy skills 574 (14.1%) 72 (16.9%) 3 (15.8%) 16 (14.8%) 1.23 (.94–1.61) 1.14 (.33–3.92) 1.06 (.62–1.81)Verbal IQ 366 (7.2%) 42 (8.0%) 5 (21.7%) 9 (7.2%) 1.13 (.81–1.57) 3.58 (1.32–9.70) 1.0 (.50–1.99)Performance IQ 934 (19.0%) 86 (16.5%) 3 (13.0%) 24 (19.2%) .85 (.67–1.08) .64 (.19–2.16) 1.02 (.65–1.60)Full Scale IQ 511 (10.4%) 52 (10.0%) 2 (8.7%) 12 (9.6%) .96 (.71–1.30) .82 (.19–3.51) .92 (.50–1.67)Notes: SD = Standard Deviation; statistically significant effect (p < .05) bolded
195
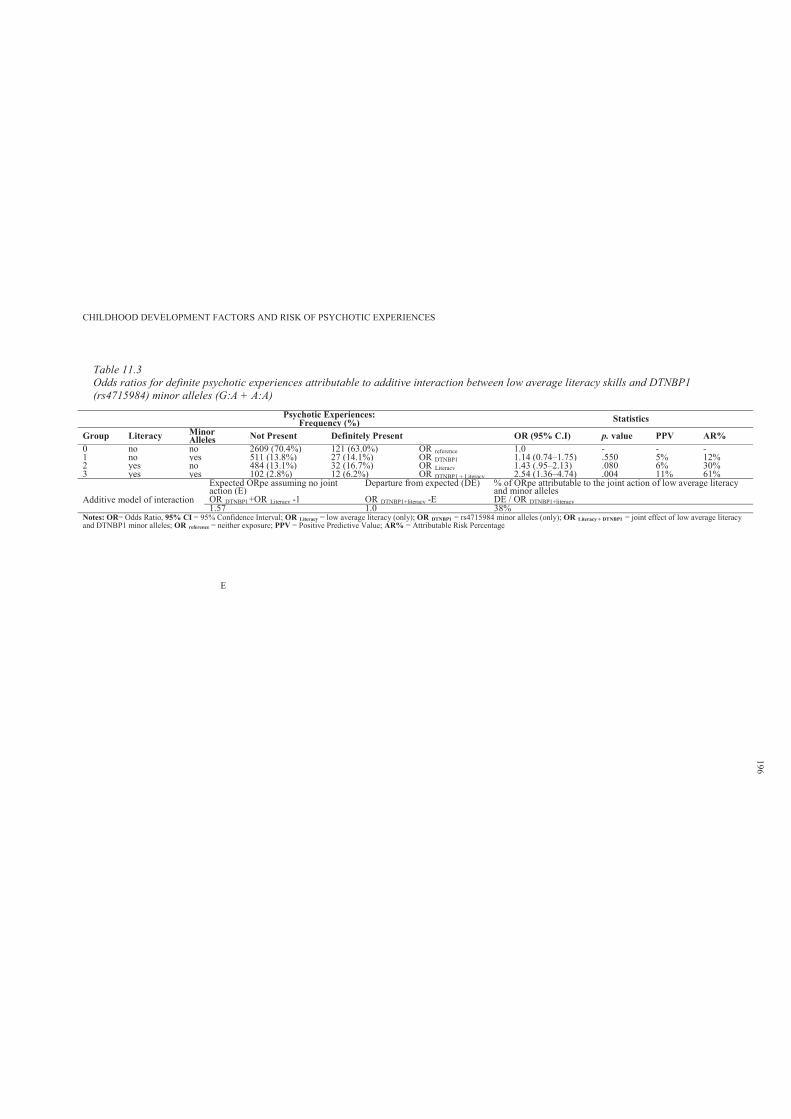
CHILDHOOD DEVELOPMENT FACTORS AND RISK OF PSYCHOTIC EXPERIENCES
Table 11.3Odds ratios for definite psychotic experiences attributable to additive interaction between low average literacy skills and DTNBP1 (rs4715984) minor alleles (G:A + A:A)
Psychotic Experiences:Frequency (%) Statistics
Group Literacy Minor Alleles Not Present Definitely Present OR (95% C.I) p. value PPV AR%
0 no no 2609 (70.4%) 121 (63.0%) OR reference 1.0 - - -1 no yes 511 (13.8%) 27 (14.1%) OR DTNBP1 1.14 (0.74–1.75) .550 5% 12%2 yes no 484 (13.1%) 32 (16.7%) OR Literacy 1.43 (.95–2.13) .080 6% 30%3 yes yes 102 (2.8%) 12 (6.2%) OR DTNBP1 + Literacy 2.54 (1.36–4.74) .004 11% 61%
Additive model of interaction
Expected ORpe assuming no joint action (E)
Departure from expected (DE) % of ORpe attributable to the joint action of low average literacy and minor alleles
OR DTNBP1+OR Literacy -1 OR DTNBP1+literacy -E DE / OR DTNBP1+literacy1.57 1.0 38%
Notes: OR= Odds Ratio, 95% CI = 95% Confidence Interval; OR Literacy = low average literacy (only); OR DTNBP1 = rs4715984 minor alleles (only); OR Literacy + DTNBP1 = joint effect of low average literacy and DTNBP1 minor alleles; OR reference = neither exposure; PPV = Positive Predictive Value; AR% = Attributable Risk Percentage
E
196
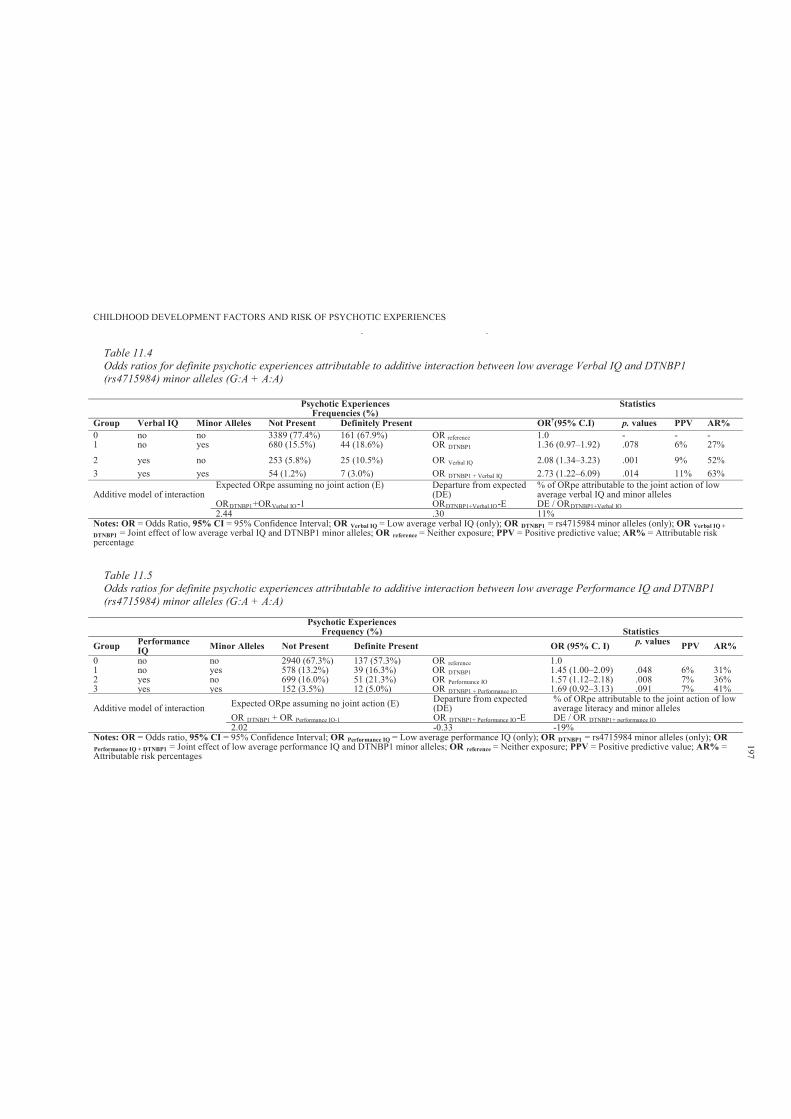
CHILDHOOD DEVELOPMENT FACTORS AND RISK OF PSYCHOTIC EXPERIENCES
Table 11.4Odds ratios for definite psychotic experiences attributable to additive interaction between low average Verbal IQ and DTNBP1 (rs4715984) minor alleles (G:A + A:A)
Notes: OR = Odds Ratio, 95% CI = 95% Confidence Interval; OR Verbal IQ = Low average verbal IQ (only); OR DTNBP1 = rs4715984 minor alleles (only); OR Verbal IQ + DTNBP1 = Joint effect of low average verbal IQ and DTNBP1 minor alleles; OR reference = Neither exposure; PPV = Positive predictive value; AR% = Attributable risk percentage
Table 11.5Odds ratios for definite psychotic experiences attributable to additive interaction between low average Performance IQ and DTNBP1 (rs4715984) minor alleles (G:A + A:A)
Psychotic ExperiencesFrequency (%) Statistics
Group Performance IQ Minor Alleles Not Present Definite Present OR (95% C. I) p. values PPV AR%
0 no no 2940 (67.3%) 137 (57.3%) OR reference 1.01 no yes 578 (13.2%) 39 (16.3%) OR DTNBP1 1.45 (1.00–2.09) .048 6% 31%2 yes no 699 (16.0%) 51 (21.3%) OR Performance IQ 1.57 (1.12–2.18) .008 7% 36%3 yes yes 152 (3.5%) 12 (5.0%) OR DTNBP1 + Performance IQ 1.69 (0.92–3.13) .091 7% 41%
Additive model of interaction Expected ORpe assuming no joint action (E) Departure from expected (DE)
% of ORpe attributable to the joint action of low average literacy and minor alleles
OR DTNBP1 + OR Performance IQ-1 OR DTNBP1+ Performance IQ-E DE / OR DTNBP1+ performance IQ2.02 -0.33 -19%
Notes: OR = Odds ratio, 95% CI = 95% Confidence Interval; OR Performance IQ = Low average performance IQ (only); OR DTNBP1 = rs4715984 minor alleles (only); OR Performance IQ + DTNBP1 = Joint effect of low average performance IQ and DTNBP1 minor alleles; OR reference = Neither exposure; PPV = Positive predictive value; AR% =Attributable risk percentages
Psychotic ExperiencesFrequencies (%)
Statistics
Group Verbal IQ Minor Alleles Not Present Definitely Present OR†(95% C.I) p. values PPV AR%0 no no 3389 (77.4%) 161 (67.9%) OR reference 1.0 - - -1 no yes 680 (15.5%) 44 (18.6%) OR DTNBP1 1.36 (0.97–1.92) .078 6% 27%
2 yes no 253 (5.8%) 25 (10.5%) OR Verbal IQ 2.08 (1.34–3.23) .001 9% 52%3 yes yes 54 (1.2%) 7 (3.0%) OR DTNBP1 + Verbal IQ 2.73 (1.22–6.09) .014 11% 63%
Additive model of interactionExpected ORpe assuming no joint action (E) Departure from expected
(DE)% of ORpe attributable to the joint action of low average verbal IQ and minor alleles
ORDTNBP1+ORVerbal IQ-1 ORDTNBP1+Verbal IQ-E DE / ORDTNBP1+Verbal IQ2.44 .30 11%
197
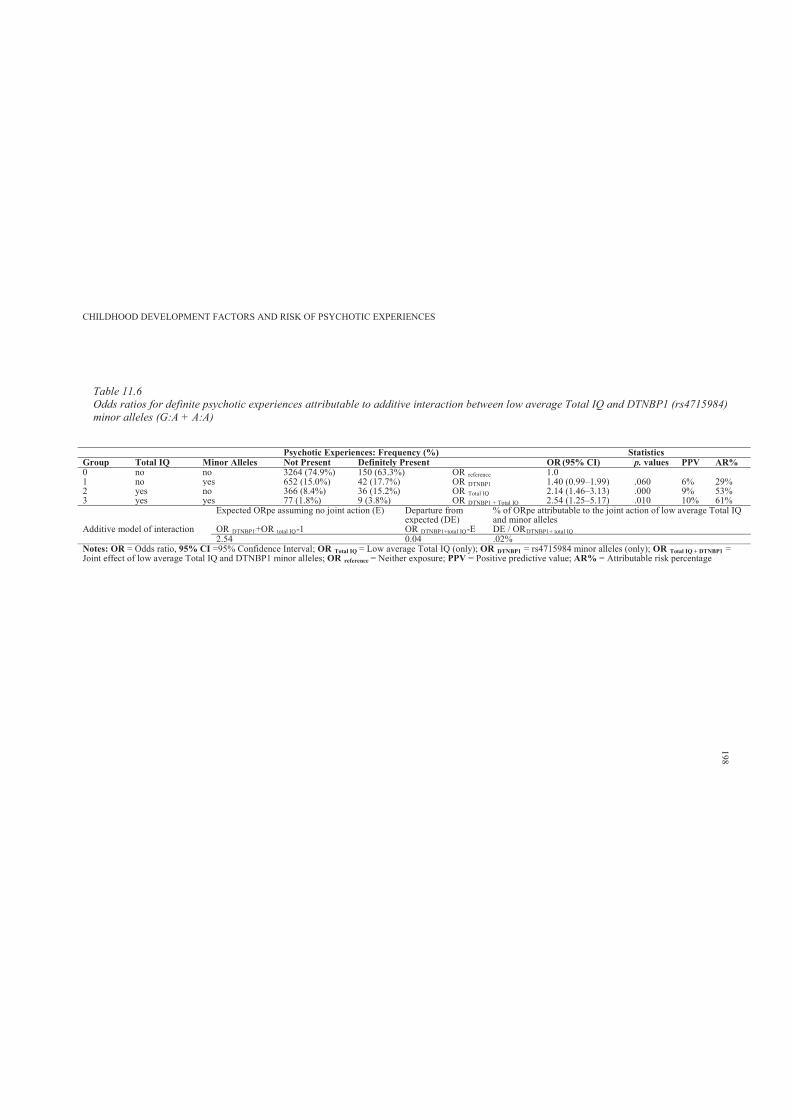
CHILDHOOD DEVELOPMENT FACTORS AND RISK OF PSYCHOTIC EXPERIENCES
Table 11.6Odds ratios for definite psychotic experiences attributable to additive interaction between low average Total IQ and DTNBP1 (rs4715984)minor alleles (G:A + A:A)
Psychotic Experiences: Frequency (%) StatisticsGroup Total IQ Minor Alleles Not Present Definitely Present OR (95% CI) p. values PPV AR%0 no no 3264 (74.9%) 150 (63.3%) OR reference 1.01 no yes 652 (15.0%) 42 (17.7%) OR DTNBP1 1.40 (0.99–1.99) .060 6% 29%2 yes no 366 (8.4%) 36 (15.2%) OR Total IQ 2.14 (1.46–3.13) .000 9% 53%3 yes yes 77 (1.8%) 9 (3.8%) OR DTNBP1 + Total IQ 2.54 (1.25–5.17) .010 10% 61%
Additive model of interaction
Expected ORpe assuming no joint action (E) Departure from expected (DE)
% of ORpe attributable to the joint action of low average Total IQ and minor alleles
OR DTNBP1+OR total IQ-1 OR DTNBP1+total IQ-E DE / ORDTNBP1+ total IQ2.54 0.04 .02%
Notes: OR = Odds ratio, 95% CI =95% Confidence Interval; OR Total IQ = Low average Total IQ (only); OR DTNBP1 = rs4715984 minor alleles (only); OR Total IQ + DTNBP1 =Joint effect of low average Total IQ and DTNBP1 minor alleles; OR reference = Neither exposure; PPV = Positive predictive value; AR% = Attributable risk percentage
198
CHILDHOOD DEVELOPMENT FACTORS AND RISK OF PSYCHOTIC EXPERIENCES 199
11.4 Discussion
This study examined the distribution of endorsing PEs in relation to the DTNBP1, NRG1
and DISC1 genotypes. This study also examined the association of childhood cognitive profiles
and PEs in early adolescence. Further, the interactive effect of genotypic risk indicators and low
average cognitive skills was explored in relation to presence of definite PEs.
The results indicated weak evidence for genotypic variations in the DTNBP1, DISC1 and
NRG1 genes and adolescent PEs. While DTNBP1 (rs4715984) combined rare homozygotes to the
heterozygotes (G:A + A:A) was predictive of definite PEs, the NRG1 (nrg221533) C:T and
DISC1 (rs6675281) T:T genotypes were significant predictors of suspected PEs. Thus, the
hypothesis that risk of reporting PEs would increase with low average childhood cognitive skills
(literacy and intelligence) was supported. Those endorsing definite PEs were more likely to have
low average literacy skills, verbal, performance and full scale IQ.
Further, there was weak evidence to support the hypothesis that the interactive effect of
genotypic risk indicators and low average cognitive skills would be more influential on PEs than
genetic risk indicators or low average cognitive skills working alone. Exposure to both DTNBP1
(rs4715984) minor alleles (G:A + A:A) and low average literacy skills was associated with an
increase in the odds of reporting definite PEs. However, only very small percentages were
attributable to the joint action of exposure to minor alleles and low average verbal, performance
and full scale IQ.
CHILDHOOD DEVELOPMENT FACTORS AND RISK OF PSYCHOTIC EXPERIENCES 200
Chapter 12: Study 6: Pilot Trial of a Social Cognitive Enhancement
Programme
12.1 Introduction
In this chapter, the thesis shifts the theme of investigation to an evaluation of the benefits
of social cognitive programmes for children. This thesis argues that understanding the benefits of
computer-aided social cognitive programmes may guide and provide the basis for the
development of early preventative interventions for children with elevated risk of developing
psychotic symptoms, and arguably schizophrenia.
Various types of programmes have been designed to target aspects of social perception and
language impairments with different populations. This chapter will briefly review some of the
studies that have evaluated the efficacy and feasibility of computer- aided programmes designed
to enhance children’s social and cognitive skills. This will include the justification and rationale
of using computer-assisted strategies to enhance children’s social and cognitive skills. This
chapter will then present the findings related to an exploratory pilot trial of the
neuropsychological benefits of a computer-aided social cognitive enhancement programme in
typically developing primary school age children.
Beaumont and Sofronoff (2008) evaluated the efficacy and feasibility of a multi-
component social skills enhancement programme for children with Asperger’s syndrome (AS),
titled The Junior Detective Training Program. This 7-week programme included a computer
game, small group sessions, parent training sessions and teacher handouts. Forty- nine children
(aged 7.5 to 11.7 years) with AS were randomly assigned to the intervention (n = 26) or wait-list
control (n = 23) conditions. The computer game was designed to teach children skills in emotion
recognition, emotion regulation and social interaction.
Relative to the control group, programme participants showed greater improvements in
social skills over the course of the intervention, as indicated by parent-report measures. Results
CHILDHOOD DEVELOPMENT FACTORS AND RISK OF PSYCHOTIC EXPERIENCES 201
revealed a significant main effect of time (F (2, 45) = 17.80, p < .001, 2 = .44) and a significant
group × time interaction effect (F (2, 45) = 13.14, p < .001, 2 = .37).
Teacher-report data also confirmed that children receiving the intervention made
significant improvements in social functioning from pre- (M = 29.22, SD = 10.92) to post-
treatment (M = 37.90, SD = 10.55) (F (1, 18) = 38.50, p < .001, 2 = .68). However, authors
questioned the clinical significance of these findings, since these scores remained close to one and
a half standard deviations below the normative mean (M = 52.28, SD = 10.09) at post-treatment.
Further treatment group participants were better able than controls to suggest appropriate
emotion-management strategies for story characters at post-intervention than at pre-intervention
(F (2, 45) = 10.13, p < .001, 2 = .31) (Beaumont & Sofronoff, 2008). However, there was no
difference between intervention and control children on the facial expression and body-posture
recognition measures (F (2, 45) = 1.16, p > .32, 2 = .05).
Nevertheless, in this study, some methodological issues should be noted. For example, the
researchers did not partition intervention, developmental and practice effects, and relied on proxy
evaluation (teacher and parent), hence questioning their claim that children at five-months post-
intervention maintained treatment gains. Nevertheless, Beaumont and Sofronoff (2008) provided
substantial evidence regarding the potential use of computer cognitive enhancement programs for
children with special needs (e.g., children with developmental delays or special cognitive and
psychological needs).
In another study, Boivin and colleagues (2010) evaluated the feasibility and
neuropsychological and psychosocial benefits of Captain’s Log computerised cognitive
rehabilitation therapy (CCRT) in African children presenting with HIV. This study supported a
conceptual model for the positive neuroplasticity benefit of CCRT. Sixty Ugandan children
between the ages of 6 and 16 years with HIV (23 were on antiretroviral treatments) were
randomly recruited from a pool of 83 children receiving home-based health care through Child
Health Advocacy International in the Kayunga town region. Thirty-two were assigned to 10
sessions of CCRT training, configured for attention, memory and learning skills, while the
remaining 28 were placed in the no treatment control group. These children presented with
CHILDHOOD DEVELOPMENT FACTORS AND RISK OF PSYCHOTIC EXPERIENCES 202
pervasive neurocognitive impairment at baseline, as measured by the Kaufman Assessment
Battery for Children (2nd ed., KABC–2; Kaufman & Kaufman, 2004). In addition, cognitive
ability was assessed before and after training using the Cogstate computerised neuropsychological
test (Darby, Maruff, Collie & McStephen, 2002).
The children who received the CCRT intervention showed greater improvement on
Cogstate Maze Learning (mean difference = -.07, SE = .02, p = .001) and the card detection task
of simple attention (mean difference = .07, SE = .02, p = .01). However, no support was obtained
for the hypothesis that there would be significant benefit for the intervention children on the
Cogstate One-Back Learning and One-Card Learning tasks.
The researchers suggested that the results should be interpreted cautiously, as there was no
active control group. Thus, the effect may be ascribed to the intervention, simple exposure to the
computer or to practice (Boivin et al., 2010).
Computer-aided social cognitive programmes have also been presented to children with
ADHD (Klingberg et al., 2005). Over 2002–2003, Klingberg and colleagues conducted a
multicentre, randomised controlled, double blind trial to ascertain the effect on improving
working memory (WM) of computerised, systematic practice of WM tasks in children with
ADHD. Fifty-three children with ADHD, aged 7 to 12 years, not on stimulant medication, were
randomly assigned to either the treatment computer program for training WM or a control
programme for a 5-week period. The main outcome measure was the span-board task, which is a
visuospatial WM task (Wechsler, 1981). In addition, digit span from the WISC-III testing battery
was used to measure verbal WM, the Stroop interference task was used to measure response
inhibition (Lezak, 1995), and the Raven’s Colored Progressive Matrices (Raven, 1995) was used
to measure nonverbal reasoning ability.
The programme consisted of performing WM tasks implemented via a computer program
(RoboMemo, Cogmed Cognitive Medical Systems AB, Stockholm, Sweden). The results revealed
that the treatment group improved significantly more than did the control group on visuospatial
WM, response inhibition, verbal WM, complex reasoning and for parents’ ratings of ADHD
symptoms (inferential statistics not specified).
CHILDHOOD DEVELOPMENT FACTORS AND RISK OF PSYCHOTIC EXPERIENCES 203
Further, the specific mechanisms underlying training-induced improvements of language
skills were investigated with a computerised intervention program (Stevens, Fanning, Coch,
Sanders & Neville, 2008). The research question focused on whether six weeks of high-intensity
(100 min per day) training with a computerised intervention program (Fast For Word; FFW),
designed to improve language skills, would also influence neural mechanisms of selective
auditory attention previously shown to be deficient in children with specific language impairment
(SLI).
Twenty children received computerised training, including eight children diagnosed with
SLI (FFW-LI) and 12 children with typically developing language (FFW-TD). An additional 13
children with typically developing language received no specialised training but were tested and
retested after a comparable period to control for maturational and test– retest effects. All children
were 6 to 8 years old, with a mean age of 7.6 years. Before and after training, children completed
an electrophysiological assessment (event-related potentials or ERPs) of selective auditory
attention using the receptive and expressive subscales of the standardised Clinical Evaluation of
Language Fundamentals -3 (CELF-3).The ERPs reflected changes in the electrical activity of the
brain in response to specific events (reported in V).
Thus, evidence was found of increased effects of selective attention on early sensorineural
processing (ERPs) following training, with the FFW-LI group showing a +1.4 V increase in the
attention effect (t (6) = -3.16, p <.05), and the FFW-TD group showing a trend towards a
significant + 0.7 V increase in the attention effect (t (8) = -1.91, p <.1). Receptive language
scores (but not expressive language scores) also showed increases following FFW training in
children with SLI and TD (t (26) = 4.32, p < .001, Cohen’s d = .91)), while such gains were not
observed in the no treatment control group.
The findings of this study indicated that the neural mechanisms of selective auditory
attention, previously shown to be deficient in children with SLI, may be remediated through
intensive computerised training with FFW, and may accompany improvements on standardised
measures of language functioning such as improved receptive language skills (Stevens et al.,
2008).
CHILDHOOD DEVELOPMENT FACTORS AND RISK OF PSYCHOTIC EXPERIENCES 204
In summary, these findings collectively support the use of computer-aided social cognitive
programmes with different populations. However, these studies also show inconsistencies
regarding the types of effects that can be demonstrated for different programmes. It is likely that
the joint effect of the programmes, child’s development and practice contribute to the findings.
The partial inconsistencies found with regard to the efficacy of the programmes illustrate the need
for further research with the focus on computer-aided social cognitive training with child
populations.
The current study is an exploratory pilot trial that extends the use of computer-aided social
cognitive enhancement programmes for typically developing primary school age children. The
aim of this pilot trial was to develop, administer and evaluate the efficacy and feasibility of a
computer-aided social cognitive enhancement programme, targeted at enhancing the specific
neurocognitive domains of language, social perception and visuospatial processing, as measured
by the Neuropsychological Investigation for Children-II (NEPSY-II) (Brooks, Sherman &
Strauss, 2010).
In addition, this study aimed to explore and assess children’s behavioural functioning, as
measured by the Child Behaviour Checklist (CBCL), and their attribution style, as measured by
the Children’s Attributional Style Interview (CASI) (Conley, Haines, Hilt & Metalsky, 2001). It
was hypothesised that participation in the computer-aided social cognitive programme would be
associated with moderate and significant improvements in neurocognitive and social cognition
measurements. The findings of this study may guide further development of early preventative
interventions for children with elevated risk of developing psychotic symptoms.
12.2 Method
12.2.1 Participants.
Twenty children between the ages of 6 and 12 years participated in this study (M age =
8.36 years, SD = 1.37). Table 12.1 shows the descriptive statistics for the treatment (n = 10) and
control groups (n = 10).
12.2.2 Study design.
A pre-test, programme, post-test design was used. The programme presented 10 children

CHILDHOOD DEVELOPMENT FACTORS AND RISK OF PSYCHOTIC EXPERIENCES 205
with computer activities and educational cards designed to enhance social cognitive skills for
eight one-hour sessions over eight weeks. The efficacy of the programme was measured via pre-
to post- standardised neuropsychological assessment in reference to a typically developing control
group (n = 10). The participants were selected and assigned to treatment and control groups based
on convenience. This was a pilot trial to test the efficacy of the programme, and hence no rigorous
guidelines was adhered when selecting or assigning participants into groups.
All participants were assessed pre- and post- test using five selected subtests of the
NEPSI-II, CBCL parent forms and CASI. The selection of these measurements were based on
previous findings (previous Chapters) that indicated that children at high risk of developing PEs
and arguably schizophrenia, show a wide range of subtle differences in developmental profiles.
12.2.3 Procedures.
Deakin University (Geelong, Australia) granted ethical approval for this study (see
Appendix 12.A). Different strategies were used to recruit participants for the treatment and control
groups. For recruitment of the treatment group, the researcher approached principals of both
private and public primary schools within the Geelong area. Invitation letters were forwarded to
and distributed by schools’ principals (see Appendix 12.B). The invitation letter was also
incorporated in each school’s weekly newsletter. The parents and their children were invited to
participate. Interested families were forwarded study information sheets and parental consent
forms (see Appendices 12.C and 12.D), and pre- assessment was scheduled upon the return of
signed consent forms. The primary caregiver was asked to complete a take home self-report
questionnaire consisting of a demographic survey and the CBCL with regard to the child
participant.
The child participants attended the assessment session prior to the commencement of the
programme. During pre-assessment, children were assessed using five selected subtests of the
NEPSY-II and the CASI. Parents were asked to complete the self-report demographic
questionnaire and CBCL. The computer-aided programme commenced one week after the pre-
assessment session. The program was undertaken through a series of computer and educational
card games that were graded in difficulty according to the child’s level of functioning. These were
CHILDHOOD DEVELOPMENT FACTORS AND RISK OF PSYCHOTIC EXPERIENCES 206
chosen as a training mode to maintain self- motivation. The training site was Deakin University or
the participant’s house (parents had the option to choose).
The treatment group participated in the computer-aided programme for eight one- hour
sessions over eight weeks. Each session began with an introductory session of 5 to10 minutes, in
which the child was acquainted with the computer games, and the major concepts and procedures
were explained. One week following programme completion, the children were individually re-
assessed on the NEPSY-II and CASI. In addition, parents were asked to complete the CBCL
relating to the child participant.
The typically developing control group was recruited via collaboration with a research
team in the Occupational Health and Safety Department at Deakin University. The researcher was
involved in data collection relating to the neuropsychological functioning of children presenting
with autistic conditions and typically developing children involved in a learning program of eight
weeks duration (pre-test, programme and post-test design). This programme also included a
control group (receiving no program) involved in pre- and post-assessment. The NEPSY-II and
CASI assessments were incorporated with other measurements and the data collected from this
control group were used in the present study.
12.2.4 Material.
12.2.4.1. Programme.
The computer-aided social cognitive enhancement programme incorporated multiple inter-
related commercially based computer and educational card games designed to enhance social and
cognitive skills in children. The computer-based activities included Mind-Reading: The
interactive guide to emotions; ISPEEK at School; and the Big Box of Australian Education. The
educational card activity was the What Did You Say? What Do You Mean? educational card
game.
Mind-Reading is a computerised reference work covering the entire spectrum of human
emotions. This software explores over 400 emotions and contains pictures and audio of each
emotion performed by six different people of various ages. It was designed with awareness of the
special needs of children and adults who have difficulties recognising emotional expression in

CHILDHOOD DEVELOPMENT FACTORS AND RISK OF PSYCHOTIC EXPERIENCES 207
others. This program enables the user to study emotions and learn the meanings of facial
expressions and tone of voice. It draws on a comprehensive audio-visual and text database
through its Emotions Library and Game Zones.
The Game Zones of the Mind-Reading program were explored by the treatment
participants. There, they were involved in identifying the six basic emotions on the face and in the
voice through digitalised photos, audio clips and film clips of faces expressing emotions from
various social contexts. In addition, participants were involved in recognising non-verbal gestures
and social norms (e.g., how people are likely to feel in different social situations, eye contact and
emotional intensity). These skills were mainly explored using the Game Zones, rather than Mind-
Reading’s Emotions Library.
ISPEEK at School is a CD-ROM containing 1200 visual communication picture symbols,
designed especially to reflect situations encountered at school (e.g., social skills, school curricula,
work and break times). Participants explored the behavioural and social skills component by
covering themes such as appropriate and inappropriate behaviour, communication, social
boundaries and interpersonal relations.
The Big Box of Australian Education is a computerised game based on various primary
school curricula, and is designed to help children to learn through fun-filled, interactive games,
fun facts, pictures and puzzles. Participants constructed their own pictures (free selection of
pictures of, for example, animals, cars and stars) and solving age appropriate picture puzzles.
What Did You Say? What Do You Mean? is an educational card game that presents 60
common sayings in a fun, illustrated format, and encourages children to understand and play with
metaphorical language. Although designed for children with Asperger’s Syndrome, the cards are
useful for all children. The cards are divided into two types: What Did You Say? cards (e.g., to be
on the ball), which feature the metaphor and a fun illustration of its literal meaning (she’s on the
ball), and corresponding What Do You Mean? Cards, which show the actual meaning of the
saying (to be able to understand and deal with things well).
These commercially based programs were obtained from Jessica Kingsley Publishers
(www.jkp.com/) and Eureka Multimedia (www.eurekamultimedia.com.au). The treatment group
CHILDHOOD DEVELOPMENT FACTORS AND RISK OF PSYCHOTIC EXPERIENCES 208
also participated in drawing activities (e.g., free drawing, draw a person, family and tree). These
were included with the purpose to maintain self-motivation. The programmes had no theoretical
justification, and were not evidence based. The programme was selected primarily on the basis of
previous studies (see subsection 12.1)
12.2.5 Measurements.
12.2.5.1. Neuropsychological Investigation for Children-II.
The NEPSY-II (Korkman, Kirk & Kemp, 2007) is a comprehensive, co-normed and
multidimensional neuropsychological test battery designed for assessing neurocognitive abilities
in pre-schoolers, children and adolescents. It is a flexible battery of 32 subtests (divided into six
theoretically derived domains of cognitive functioning), designed to allow the administration of
specific subtests, groups of subtests or the entire battery.
This study selected five subtests across five domains: Attention and Executive
Functioning, Language, Memory and Learning, Social Perception and Visuospatial Processing.
The five subtests comprised: Auditory Attention, Word Generation, Memory for Faces, Affect
Recognition, and Block Construction. The duration of assessment was approximately 40 minutes.
The NEPSY-II provides four different types of scores. In this study, the primary scores were used
as age-adjusted scaled scores (mean = 10, standard deviation = 3). Descriptions of these subtests
are presented in Appendix 12.E.
12.2.5.2. The Children’s Attributional Style Interview.
The CASI is an interactive interview designed to assess attributional style in children ages
5 and up. Attributional style, as defined by Abramson, Seligman and Teasdale (1978 cited in
Conley et al., 2001), is a cognitive construct concerning people’s beliefs about the causes of
events in their lives and the degree to which these causes are internal or external, stable or
unstable, and global or specific. Prior to the CASI, attributional style measures were not
methodologically appropriate for young children (Conley et al., 2001). Thus, the CASI is the first
to offer a reliable, valid and methodologically appropriate measure of attributional style for use
CHILDHOOD DEVELOPMENT FACTORS AND RISK OF PSYCHOTIC EXPERIENCES 209
with children as young as five years old.15
The CASI is an interactive interview consisting of 16 events, which are divided equally
between positive and negative events (eight of each), and between interpersonal and achievement
events (either of each), thus yielding four events for each combination. Each event is followed by
a prompt for the child’s attribution for the event, and then three questions assessing the
dimensions of internality, stability and globality for his or her particular attribution. The three
questions for each of the 16 events yield 48 items.
The experimenter asks the child for a reason for the event, and then prompts the child to
rate the internality, stability and globality of their attributions on continuous sliding scales. The
experimenter then records the child’s rating on a scoring sheet with a numbered scale (scores of
0–10, with .5 increments). Thus, each score reflects the child’s own rating of the degree of
internality, stability or globality for their given attribution. The CASI takes between 30 and 45
minutes to administer. The CASI interview questionnaire and data sheet are included in Appendix
12.F.
12.2.5.3. Child Behaviour Checklist (CBCL).
The 2001 Child Behaviour Checklist for Ages 6–18 (CBCL/6–18) was completed by the
participants’ caregivers. The CBCL/6–18 yields scores on internalising, externalising and total
problems, as well as scores on DSM-IV-related scales.
12.2.5.4. Demographic questionnaire.
The demographic questionnaire contained questions about the child’s age, gender and
number of siblings, and questions about the child’s parents, including their age, residence, income,
education and marital status.
12.3 Results
12.3.1 Sample characteristics.
Child and parental demographic characteristics were examined between the treatment and
control groups. Table 12.1 shows that the distribution of child and parental characteristics was not
15 CASI test materials were obtained directly from the original authors/developers
CHILDHOOD DEVELOPMENT FACTORS AND RISK OF PSYCHOTIC EXPERIENCES 210
different between the groups.
12.3.2 Neuropsychological Investigation for Children-II.
Table 12.2 shows the descriptive and inferential statistics for the NEPSY-II at pre- and
post-test. The data were analysed using a 2 (groups) × 2 (pre- and post-test) mixed design analysis
of variance. No interaction between time and programme for found for any of the domains of the
NEPSY-II. On average, children in the control group showed just as much improvement over time
as did the children that participated in the programme. However, separate analyses for within the
treatment and control groups showed that, while both groups had considerable improvement in
Block Construction over time, the improvement for the treatment group was significant (F (1, 9) =
16.00, p = .003, partial = .640).
12.3.3 Child behaviour checklist.
The decline in CBCL internalised, externalised and total problems from pre- to post-
assessment was similar for the treatment and control groups. All participants had CBCL T scores
within the normal range before and after the programme. While the results revealed that both the
treatment and control groups had a decreasing pattern in CBCL T scores over time, there were no
significant interaction effects (see Table 12.3).
12.3.4 Children’s attributional style interview.
Several subscales were derived from the CASI. The full positive events subscale (sum of
24 ratings on a 10-point scale—eight internality, eight stability and eight globality—for positive
events) and the full negative events subscale (sum of 24 ratings— eight internality, eight stability
and eight globality—for negative events) range from 0 to 240, with higher scores reflecting a
greater tendency towards the particular attribution. Similarly, the full CASI score (composite for
positive and negative events) ranges from 0 to 240, with lower scores indicating a greater
tendency towards depressive attributional style.
The generality for negative events subscale (sum of 16 ratings—eight stability and eight
globality—for negative events) and the generality for positive events subscale (sum of 16
ratings—eight stability and eight globality—for positive events) range from 0 to 160, with high
scores reflecting high attribution dimensions for both. In addition, the internality, stability and

CHILDHOOD DEVELOPMENT FACTORS AND RISK OF PSYCHOTIC EXPERIENCES 211
globality subscales were calculated for each of the positive and negative events. These subscale
scores range from 0 to 80, with higher scores reflecting a greater tendency towards the particular
attribution.
In this study, both the treatment and control groups had a higher CASI-Generality Positive
Score than CASI-Generality Negative Score. This reflects the participants’ tendency towards
higher positive generality. However, Table 12.4 shows that this was not statistically significant.
None of the CASI subscales had a significant interaction effect.
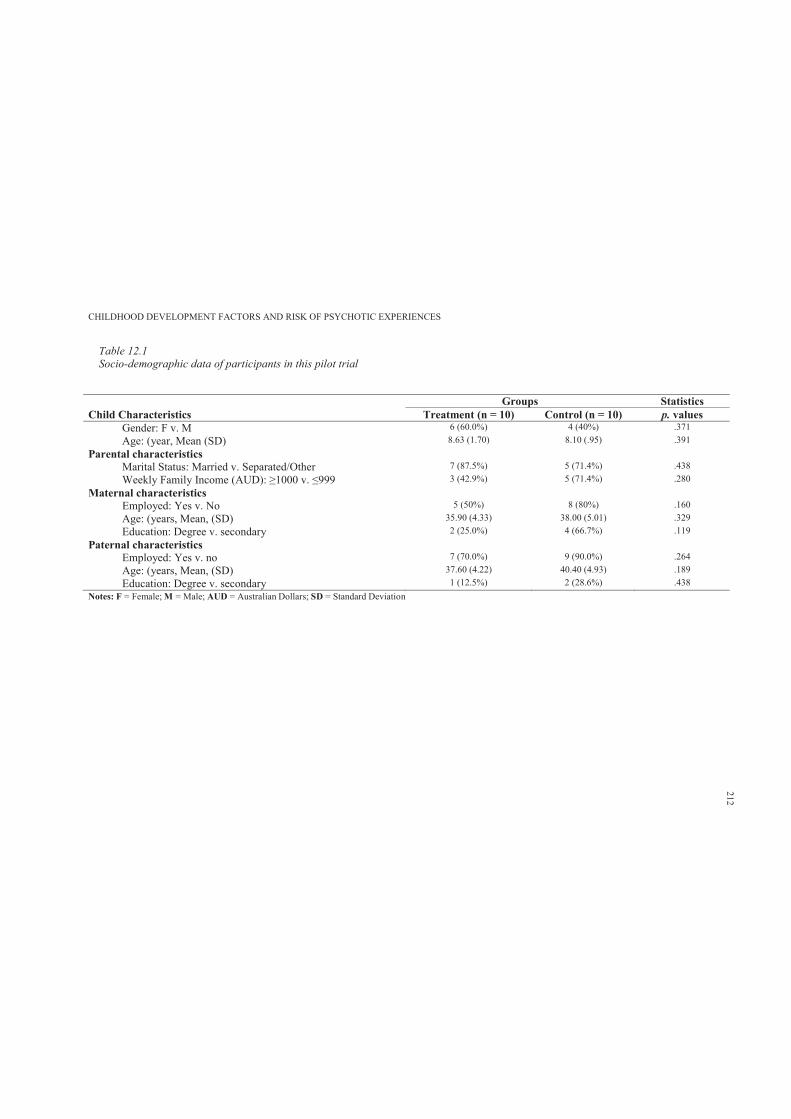
CHILDHOOD DEVELOPMENT FACTORS AND RISK OF PSYCHOTIC EXPERIENCES
Table 12.1Socio-demographic data of participants in this pilot trial
Groups StatisticsChild Characteristics Treatment (n = 10) Control (n = 10) p. values
Gender: F v. M 6 (60.0%) 4 (40%) .371Age: (year, Mean (SD) 8.63 (1.70) 8.10 (.95) .391
Parental characteristics Marital Status: Married v. Separated/Other 7 (87.5%) 5 (71.4%) .438Weekly Family Income (AUD): 3 (42.9%) 5 (71.4%) .280
Maternal characteristics Employed: Yes v. No 5 (50%) 8 (80%) .160Age: (years, Mean, (SD) 35.90 (4.33) 38.00 (5.01) .329Education: Degree v. secondary 2 (25.0%) 4 (66.7%) .119
Paternal characteristics Employed: Yes v. no 7 (70.0%) 9 (90.0%) .264Age: (years, Mean, (SD) 37.60 (4.22) 40.40 (4.93) .189Education: Degree v. secondary 1 (12.5%) 2 (28.6%) .438
Notes: F = Female; M = Male; AUD = Australian Dollars; SD = Standard Deviation
212
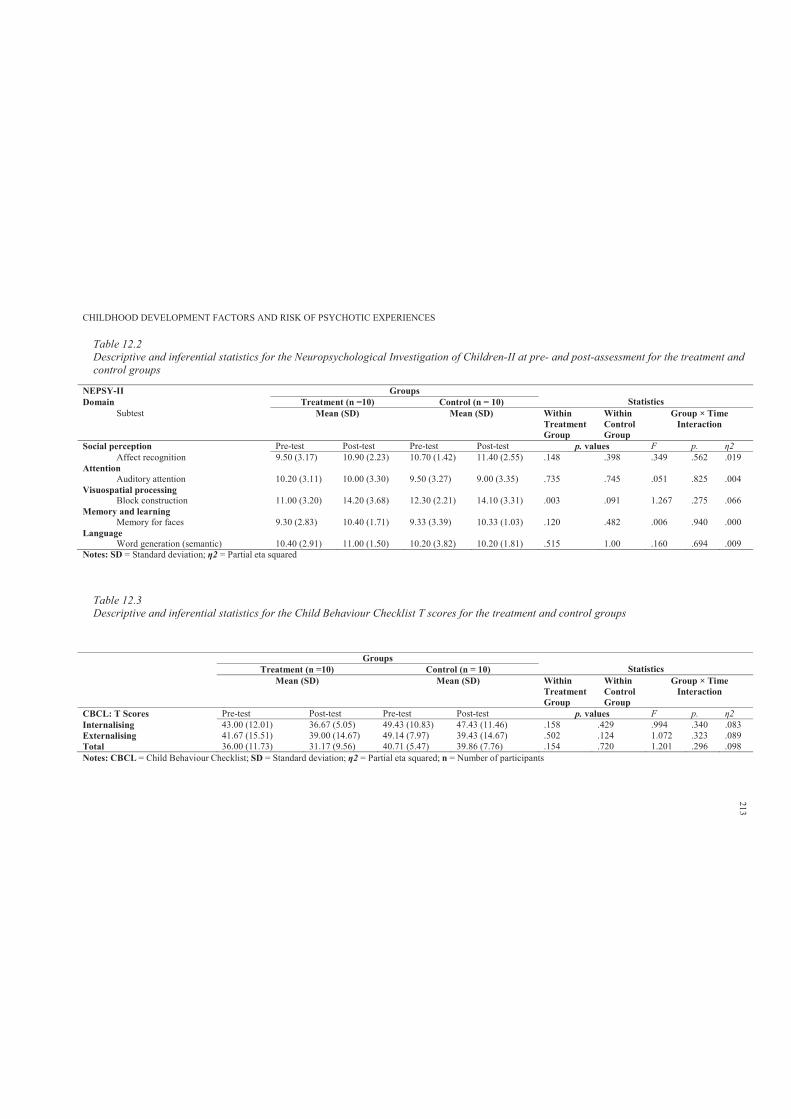
CHILDHOOD DEVELOPMENT FACTORS AND RISK OF PSYCHOTIC EXPERIENCES
Table 12.2Descriptive and inferential statistics for the Neuropsychological Investigation of Children-II at pre- and post-assessment for the treatment and control groups
NEPSY-II Groups StatisticsDomain Treatment (n =10) Control (n = 10)
Subtest Mean (SD) Mean (SD) Within Treatment Group
Within Control Group
Group × Time Interaction
Social perception Pre-test Post-test Pre-test Post-test p. values F p.Affect recognition 9.50 (3.17) 10.90 (2.23) 10.70 (1.42) 11.40 (2.55) .148 .398 .349 .562 .019
Attention Auditory attention 10.20 (3.11) 10.00 (3.30) 9.50 (3.27) 9.00 (3.35) .735 .745 .051 .825 .004
Visuospatial processing Block construction 11.00 (3.20) 14.20 (3.68) 12.30 (2.21) 14.10 (3.31) .003 .091 1.267 .275 .066
Memory and learning Memory for faces 9.30 (2.83) 10.40 (1.71) 9.33 (3.39) 10.33 (1.03) .120 .482 .006 .940 .000
Language Word generation (semantic) 10.40 (2.91) 11.00 (1.50) 10.20 (3.82) 10.20 (1.81) .515 1.00 .160 .694 .009
Notes: SD = Standard deviation; 2 = Partial eta squared
Table 12.3Descriptive and inferential statistics for the Child Behaviour Checklist T scores for the treatment and control groups
Groups StatisticsTreatment (n =10) Control (n = 10)
Mean (SD) Mean (SD) Within Treatment Group
Within Control Group
Group × Time Interaction
CBCL: T Scores Pre-test Post-test Pre-test Post-test p. values F p.Internalising 43.00 (12.01) 36.67 (5.05) 49.43 (10.83) 47.43 (11.46) .158 .429 .994 .340 .083Externalising 41.67 (15.51) 39.00 (14.67) 49.14 (7.97) 39.43 (14.67) .502 .124 1.072 .323 .089Total 36.00 (11.73) 31.17 (9.56) 40.71 (5.47) 39.86 (7.76) .154 .720 1.201 .296 .098Notes: CBCL = Child Behaviour Checklist; SD = Standard deviation; 2 = Partial eta squared; n = Number of participants
213
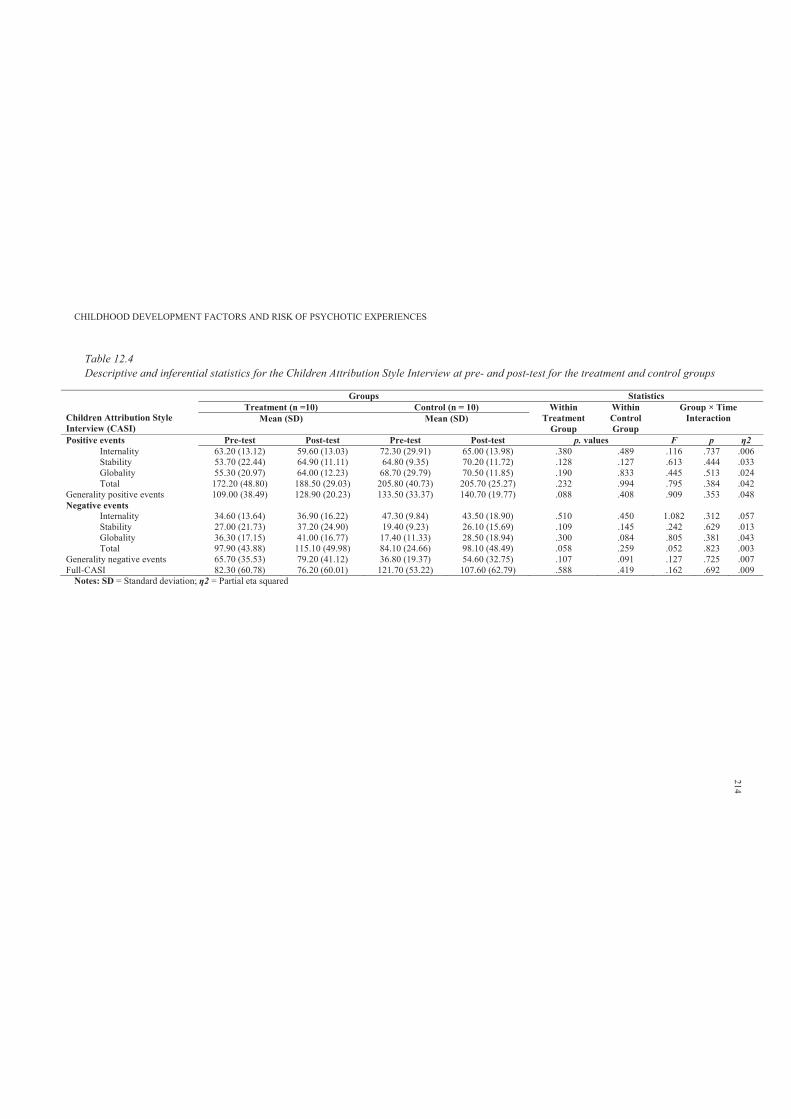
CHILDHOOD DEVELOPMENT FACTORS AND RISK OF PSYCHOTIC EXPERIENCES
Table 12.4Descriptive and inferential statistics for the Children Attribution Style Interview at pre- and post-test for the treatment and control groups
Children Attribution Style Interview (CASI)
Groups StatisticsTreatment (n =10) Control (n = 10) Within
Treatment Group
Within Control Group
Group × Time InteractionMean (SD) Mean (SD)
Positive events Pre-test Post-test Pre-test Post-test p. values F pInternality 63.20 (13.12) 59.60 (13.03) 72.30 (29.91) 65.00 (13.98) .380 .489 .116 .737 .006Stability 53.70 (22.44) 64.90 (11.11) 64.80 (9.35) 70.20 (11.72) .128 .127 .613 .444 .033Globality 55.30 (20.97) 64.00 (12.23) 68.70 (29.79) 70.50 (11.85) .190 .833 .445 .513 .024Total 172.20 (48.80) 188.50 (29.03) 205.80 (40.73) 205.70 (25.27) .232 .994 .795 .384 .042
Generality positive events 109.00 (38.49) 128.90 (20.23) 133.50 (33.37) 140.70 (19.77) .088 .408 .909 .353 .048Negative events
Internality 34.60 (13.64) 36.90 (16.22) 47.30 (9.84) 43.50 (18.90) .510 .450 1.082 .312 .057Stability 27.00 (21.73) 37.20 (24.90) 19.40 (9.23) 26.10 (15.69) .109 .145 .242 .629 .013Globality 36.30 (17.15) 41.00 (16.77) 17.40 (11.33) 28.50 (18.94) .300 .084 .805 .381 .043Total 97.90 (43.88) 115.10 (49.98) 84.10 (24.66) 98.10 (48.49) .058 .259 .052 .823 .003
Generality negative events 65.70 (35.53) 79.20 (41.12) 36.80 (19.37) 54.60 (32.75) .107 .091 .127 .725 .007Full-CASI 82.30 (60.78) 76.20 (60.01) 121.70 (53.22) 107.60 (62.79) .588 .419 .162 .692 .009
Notes: SD = Standard deviation; 2 = Partial eta squared
214
CHILDHOOD DEVELOPMENT FACTORS AND RISK OF PSYCHOTIC EXPERIENCES 215
Further, higher scores on the CASI-Full Positive Scale compared to CASI-Full Negative
Scale further illustrate the tendency of children in this study towards positive attribution. In
addition, both the treatment and control groups were more likely to attribute positive events, rather
than negative events, to themselves (high internality). Similarly, higher stability and globality
scores were achieved for positive events as compared to negative events.
12.4 Discussion
This exploratory pilot trial extended the use of computer-aided cognitive enhancement
programmes with typically developing children. This study found that relative to the control
group, the treatment group did not show consistently better performance on the selected subtests
of the NEPSY-II. The decline in CBCL internalised, externalised and total problems from pre- to
post-assessment were similar for both the treatment and control groups. All participants had
internal, external and total problems T scores within the normal range before and after the
program. In addition, the participants had a greater tendency towards higher positive attribution.
However, contrary to the expected hypotheses, the results indicated that participation in
this computer-aided programme was not associated with significant improvements in
neurocognitive and social cognition measurements. The treatment and control groups showed
similar trends of improvements over time.
CHILDHOOD DEVELOPMENT FACTORS AND RISK OF PSYCHOTIC EXPERIENCES 216
Chapter 13: Discussion and Conclusion
13.1 Discussion
This chapter will present a detailed discussion of the original empirical studies presented
in Chapters 7 through 12. Each study will be discussed using the following structure:
I. Originality and general statement of the results
II. Comparison to previous research
III. Strengths and limitations of the study
IV. Possible alternative explanations of the results
This chapter will then discuss the research applications and implications of all studies with
reference to translational research. The discussion of the research applications and implications
stemming from this research will be partitioned into two major themes of discussion. The first
focuses on translational research for psychotic experiences and schizophrenia, while the second
focuses on early preventative interventions. This second major theme is further subdivided into
two sub-themes: 1) psychological intervention models in schizophrenia, and 2) early identification
and intervention for psychotic symptoms. These sections will also discuss the challenges and
obstacles that may impede the translation of current research findings into early preventative
interventions.
This chapter will argue that, from a translational research perspective, there is a substantial
need for early identification of children and adolescents at high risk of developing psychotic
symptoms, and arguably schizophrenia. This implies that children with elevated risk may
participate in interventions earlier and at optimal developmental stages to prevent the onset of
subsequent psychopathology and disability (Wang, Heinssen, Oliveri, Wagner & Goodman,
2009). Theoretically, early preventative interventions may draw from psychological intervention
models in schizophrenia. This chapter concludes by briefly re-iterating the thesis’ original
contributions to knowledge and its main findings, and suggesting areas that require further
CHILDHOOD DEVELOPMENT FACTORS AND RISK OF PSYCHOTIC EXPERIENCES 217
research.
13.1.1 Study 1: Childhood literacy skills.
This study was the first to examine the association of child literacy skills and risk of
adolescent PEs. The hypothesis that the risk of reporting PEs increases as a function of poor
childhood literacy skills was supported. The results also supported the hypothesis that both a
consistently low and a declining pattern of literacy performance over time would be associated
with experience of PEs. However, the findings did not support those of Welham and colleagues
(2010), who found that relative decline in speech predicts psychotic disorders specifically in male
participants.
Further, the hypothesis that the risk of reporting persistent PEs over time increases as a
function of poor childhood literacy skills was not supported. The results did not support the
hypothesis that measurements of literacy skills would distinguish between non- psychotic,
decreasing, intermittent and persistent classes of PEs, with the persistent class associated with
lower literacy skills.
The overall results of this study have added some clarity to previous findings (Bearden et
al., 2000; Cannon et al., 2002; Jones et al., 1994). They can also be seen as contributing to an
increasing body of research indicating that speech and language problems during childhood are
predictive of schizophrenia-related conditions in adulthood. However, several studies have found
that PEs are relatively common in non-clinical populations and that they do not necessarily
develop into psychotic disorders (Bijl, Ravelli & van Zessen, 1998; Hanssen, Bak, Bijl,
Vollebergh & van Os, 2005; Jenkins et al., 1997; van Os et al., 2000).
Nevertheless, there is some evidence for the continuity of PEs from early adolescence to
adulthood, as reported by Poulton et al. (2000), who found that self- reported PEs at age 11 years
(DISC for DSM-III) predicted schizophreniform diagnosis (DSM-IV) at age 26 years, with an
odds ratio of 16.4 (95% CI = 3.9—67.8) for strong symptoms and 5.1 (95% CI = 1.7–18.3) for
weak symptoms of PEs. This leaves open the possibility that anomalies in the development of
speech and language could be specifically associated with the experience of psychotic symptoms
in adolescence, without such experiences necessarily being associated with a path leading to
CHILDHOOD DEVELOPMENT FACTORS AND RISK OF PSYCHOTIC EXPERIENCES 218
schizophrenia (Kaymaz et al., 2012; Murray & Jones, 2012; Varghese et al., 2011).
In terms of the second major prediction, the results confirmed the expectation that decline
in literacy performance over time would be associated with increased likelihood of reporting PEs.
However, average score was also associated with PEs, and was of a similar magnitude to
association for change. Moreover, the findings did not support those of Welham and colleagues
(2010): that relative decline in speech predicts psychotic disorders specifically in male
participants. These findings provide partial support for the neurodevelopmental model of
schizophrenia, in which it is hypothesised that the onset of psychotic symptoms in adolescence is
preceded by a gradual decline in cognitive and linguistic performance over childhood.
However, to be more confident of this, a longer period of repeated measurement of
linguistic performance is required across several developmental stages. It is unknown whether
such a pattern of increased risk of PEs with declining performance: (a) occurs across other
domains of psychological development and/or (b) is accompanied by a progressive and
neurodegenerative course. Additional research is needed using neuroimaging techniques and
assessing deterioration in cognitive and linguistic abilities over time.
The results of this study need to be interpreted with caution owing to several limitations.
More than 50% of the total participants in this study did not complete the PLIKS interview, and
had poorer performance on the measurements of literacy skills. Therefore, given the results of this
study, a great proportion of these children might have had suspected or definite PEs or been
classified as having a speech/language impairment. It should be noted that if those with PEs and
those with language problems were both more likely to be lost to sample attrition, then the current
findings would be underestimating the true relationship. Further, speech and language functioning
is only one domain that may contribute to the development of PEs and this study did not examine
other childhood domains of functioning in association with PEs.
Despite these limitations, the findings of this study imply that speech and language
performance during childhood can be considered as one cognitive profile differentiating children
with and without PEs. Although the findings showed that there was an association between
presence of PEs and the majority of the measurements of literacy skills, the strongest evidence
CHILDHOOD DEVELOPMENT FACTORS AND RISK OF PSYCHOTIC EXPERIENCES 219
was for associations between spelling and non-word reading at age 9 and definite PEs. However,
within the context of the wide range of other risk factors identified for schizophrenia, it seems
unlikely that child literacy in itself is a key causal factor in the pathogenesis of schizophrenia
(Jones et al., 1994). Instead, consistent with neurodevelopmental models of the casual mechanism
leading to schizophrenia, language deficits are more likely to reflect a broader pathological
process (Condray, 2005).
The origins of the neurodevelopmental processes behind schizophrenia are most likely to
be in the pre- and perinatal period, reflecting genetic and/or epigenetic factors occurring very
early in development in relation to features of the inutero environment (Rapoport, Giedd &
Gogtay, 2012). This is consistent with other cohort studies that have prospectively assessed the
literacy, speech and language functioning of children of a wide range of ages that were later
diagnosed with schizophrenia.
However, the extent and magnitude to which childhood speech and language impairments
(a) persist throughout adolescence and adulthood, and (b) are predictive of adult onset of
schizophrenia remains unknown. In addition, association may be confounded by genetic factors
that affect both childhood literacy and PEs, or whether childhood literacy functioning in itself is
associated with PEs.
Further, in this study, maternal residential, marital and educational status was different
between the groups with and without PEs. This may imply that children with PEs have been
socially disadvantaged, preventing them from receiving the necessary education and thus literacy
skills. Alternatively, they could have experienced more stress, trauma or other environmental
events that may have interfered with their obtaining the required literacy skills (Noel, Peterson &
Jesso, 2008).
In addition, it is feasible that poor reading skills at age 7 and 9 years may strongly predict
lower educational outcomes at age 12 years, which could contribute to stress and poor self-esteem
(Bennett, Weigel & Martin, 2002). It is thought that even mild anxiety and depression may
contribute to endorsement of PEs. One method to explore this alternative hypothesis would be to
adjust the model for variables related to anxiety and depression at age 12 to focus on the predicted
CHILDHOOD DEVELOPMENT FACTORS AND RISK OF PSYCHOTIC EXPERIENCES 220
hypothesis. Therefore, it is recommended that future researchers focus on these alternative
explanations of PEs.
In terms of PEs assessment, the PLIKS interview was a robust measure of psychotic
symptoms and there is now a substantial body of research findings reporting the use of this
measure. The PLIKS interview has been reported to have ‘very good’ and ‘fair’ inter-rater and
test–retest reliability, respectively (Horwood et al., 2008). Trained interviewers conducted the
interview, and semi-structured interviews are likely to be more valid approaches for assessing PEs
than structured instruments, as they allow cross-questioning of the kind used in clinical practice.
However, measurement errors can occur using any instrument.
13.1.2 Study 2: Childhood attention skills.
To the researcher’s knowledge, this was the first study to examine the association between
childhood attentional skills and PEs in early adolescence. The hypothesis that lower performance
in measurements of attentional skills during childhood would increase the risk of reporting PEs
was partially supported. The findings demonstrated that lower performance in the domains of
divided attention and attentional controls was associated with higher risk of later development of
PEs. However, results relating to attentional skills and trajectories of PEs revealed no significant
differences between the non-psychotic, intermittent, persistent and decreasing classes of PEs.
In this study, divided and attention control appeared related to risk of reporting PEs in
early adolescence. Generally, previous high-risk (HR) longitudinal studies have found that
children of parents presenting with schizophrenia were more likely to have impaired attentional
skills (Erlenmeyer-Kimling & Cornblatt, 1978; Erlenmeyer-Kimling et al., 2000; Neale et al.,
1984). While in this study sustained attention and reaction times were not associated with PEs, in
the McMaster-Waterloo (Asarnow et al., 1977) and New York HR projects (Cornblatt &
Erlenmeyer-Kimling, 1985), the children of mothers presenting with schizophrenia performed
poorly on selective attention tasks under conditions of cognitive distractions.
These findings provide some support for the predictive value of lower childhood
attentional skills as a vulnerability marker for PEs and schizophrenia. In terms of cognitive
deficits, HR longitudinal studies (Chapter 2) found that attention and information processing
CHILDHOOD DEVELOPMENT FACTORS AND RISK OF PSYCHOTIC EXPERIENCES 221
across time points were among the most important predictors of schizophrenia
(Erlenmeyer-Kimling & Cornblatt, 1987b). Cognitive deficits, such as inattention, poor
executive functioning and working memory deficits, makes up one of the three broad categories of
schizophrenic symptoms – (with the other two being positive symptoms and negative symptoms).
Unlike psychotic symptoms in these later two domains which are often episodic, cognitive deficits
have been shown to occur prior to the onset of schizophrenia and to persist across the course of
the illness (Wilson & Terry, 2010).
Current estimates are that clinically significant cognitive deficits occur in at least 70% of
patients with schizophrenia and this account for a substantial amount of the conditions functional
impairment (Green, Kern, Braff, & Mintz, 2000). The HR findings of persistent low performance
in particularly attention and information processing suggests early abnormal brain development
which effects brain maturation in an accumulating fashion.
The researcher can hypothesise that as a child develops more complex cognitive and social
cognitive capacities, an underlying vulnerability in information processing may impose
progressively greater difficulties, to the point of contributing to the specific feature of
schizophrenia thought of loose associations or “cognitive slipping” evident in narrative
incoherence, and positive productions of magical or odd thinking, all further contributing to social
difficulties once a child reaches middle to late childhood. These speculations require further
investigation but it is particularly notable that both cognitive and social deficiencies could be the
domains most amenable to early preventative intervention for children with elevated risk of
developing PEs, and arguably schizophrenia.
Further, information processing inefficiency (e.g., measured by digit symbol coding task)
has been found as the central feature of cognitive deficits in schizophrenia (Dickinson, Ramsey &
Gold, 2007). Information processing inefficiency and cognitive deficits in schizophrenia are
moderated by several factors including antipsychotic medication dosage (Knowles, David &
Reichenberg, 2010); however, none of the children in the ALSPAC sample had ever taken
psychotropic medications. Therefore, while this study did not examine information processing,
this construct deserves further investigation in relation to risk of reporting PEs.
CHILDHOOD DEVELOPMENT FACTORS AND RISK OF PSYCHOTIC EXPERIENCES 222
The results relating to patterns of change over time in attention skills and PEs did not
support the hypothesis of deteriorating patterns of attention skills. Nevertheless, to the
researcher’s knowledge, this is the first study to examine patterns of change in attention skills and
PEs. While no evidence was found of association, this could be due to practice effects or cognitive
development, causing children to perform better on the follow-up test.
Further, it is unknown whether a deteriorating pattern of attention abilities occurs prior to
or after the emergence of PEs. Future research may consider examining attention abilities
longitudinally, to capture data from prior to and after clinical diagnosis of individuals at elevated
risk of PEs. Such research may provide further clarification regarding the neurodegenerative
model of schizophrenia.
Additionally, while results relating to attentional problems found that those with suspected
or definite PEs were more likely to manifest distractibility and impulsivity problems, there was no
association between overactivity and greater risk of reporting PEs. Further, those with definite
PEs had higher scores on the distractibility factor than did those with suspected PEs. Similarly,
individuals with intermittent, persistent and decreasing PEs over time had higher scores on the
distractibility and impulsivity factors compared to individuals in the non-psychotic class.
However, it is unknown as to why the decreasing class of PEs showed similar trends of attentional
problems.
These findings are consistent with the longitudinal HR research literature. The
Copenhagen HR study found that whereas HR individuals who experienced predominantly
negative symptoms were rated by school teachers as passive, socially isolated and unresponsive to
praise during childhood and adolescence; those with predominantly positive symptoms were rated
as overactive, impulsive, distractible and aggressive (Cannon et al., 1990).
Overall, attentional problems related to distractibility, impulsivity and overactivity might
reflect a broader social-cognitive impairment. The Helsinki HR study revealed that HR children
(children of parents presenting with schizophrenia) were more likely to show emotional symptoms
and social inhibition during their early childhood and school years, respectively (Niemi et al.,
2005). Further, problems in social adjustment at age 5–6 years (OR = 4.51, 95% CI = 0.99–20.6; p
CHILDHOOD DEVELOPMENT FACTORS AND RISK OF PSYCHOTIC EXPERIENCES 223
= 0.052) and emotional symptoms at school age (OR = 2.88, 95% CI = 0.99—8.34; p = 0.051)
tended to predict later development of any type of psychotic disorder (Niemi et al., 2005).
These findings demonstrate the importance of childhood social cognitive functioning and
risk of PEs and schizophrenia. It appears that specific domains such as social withdrawal,
aggression, overactivity, irritability and impulsivity may be the target of preventative
interventions designed to enhance social and interpersonal skills.
While this study used prospectively collected data from ALSPAC (including large number
of children followed longitudinally), there were limitations when interpreting the results. The
primary outcome variable of PEs was measured via the PLIKS interview. However, PLIKS is not
a diagnostic measure and it does not reflect any psychiatric or functional outcome. Researchers
examining clinical symptoms in children and adolescents have used alternative interviews such as
the Schedule for Affective Disorders and Schizophrenia for School Aged Children (K-SADS;
Birmaher et al., 2009) and the Children’s Interview for Psychiatric Syndromes/Parent-Children’s
Interview for Psychiatric Syndromes (ChIPS/PChIPS) (Weller, Weller, Fristad, Rooney &
Schecter, 2000). Nonetheless, PLIKS the interview is a robust measure of PEs and there is now a
substantial body of literature reporting the use of this measure (see Chapter 5).
This study focused on non-clinical PEs and not psychotic disorders. However, such
experiences are an integral part of a diagnosis for psychotic conditions, and are associated with
considerable adverse outcomes in social achievement and functioning (Rössler et al., 2007).
Further, PEs in childhood are associated with psychotic disorders (e.g., schizophreniform) in adult
life (Poulton et al., 2000). Therefore, this study provides further insight into understanding the
specific cognitive deficits that may place children at higher risk of developing psychotic
symptoms. While the predictive value of the findings are weak (small effect sizes), these findings
may assist in better understanding the cognitive mechanisms associated with increased risk of
PEs, and in turn inform potential early preventative interventions.
While the overall findings support the proposition that childhood attentional skills are
related to PEs, there are alternative explanations. It may be argued that, although the results were
adjusted for several confounding variables including total IQ, this does not rule out subtle
CHILDHOOD DEVELOPMENT FACTORS AND RISK OF PSYCHOTIC EXPERIENCES 224
attention impairments as related to more general cognitive deficits such as lowered IQ or even as
secondary to a socially disadvantaged environment (see discussion to Study 1 in Section 13.1.1).
Further, the issues of specificity and sensitivity of effects were not addressed adequately in
this study. Hence, the findings are questionable. From the standpoint of specificity, it is not clear
as to (a) how many attention effects remained after co-varying out WISC scores only, and (b)
whether the more attention-related subtests of the WISC (e.g., digit span, letter-number
sequencing and cancellation) would have differed more between PEs groups than the TEACh or
Stop Signal Tasks used in this study.
13.1.3 Study 3: Childhood motor skills.
This study was the first to examine the association between childhood motor skills and
PEs in early adolescence. This study found some evidence of association between childhood
motor difficulties and increased risk of reporting PEs in early adolescence. The hypothesis that
those with persistent PEs over time would have higher childhood motor difficulties was not
supported. However, evidence was found of an association between childhood motor difficulties
and risk of having intermittent PEs over time.
In relation to previous research, the results of this study were partially consistent with
longitudinal HR research findings. Chapter 2 found consistent evidence that HR children were
characterized by problems in motor development (Marcus et al., 1987; McNeil et al., 1993). This
is broadly consistent with an impairment in dopamine function- with similar motor issues also
found in cases of Parkinson disease and more recently identified as a feature of Autism (Dowd,
Rinehart, & McGinley, 2010). Motor development is likely to have some interaction with other
psychosocial aspects of development; often motor impairments in children are associated with
social cognitive factors such as lack of confidence, low self-esteem, and social challenges
(Henderson & Sugden, 1992). It is possible that the association of motor difficulties and PEs (and
arguably schizophrenia) may reflect a wider problem extending to social-cognitive and
interpersonal difficulties.
However, neither this study nor any other ALSPAC study (see Chapter 5) has examined
measurements of an individual’s overall DI, such as fluctuating and directional asymmetry, MPAs
CHILDHOOD DEVELOPMENT FACTORS AND RISK OF PSYCHOTIC EXPERIENCES 225
and atypical handedness. While this study examined childhood motor competency, assessment of
domains reflecting DI would have provided further clarifications regarding developmental
predictors of PEs. It remains unclear as to whether PEs share similar endophenotypes (e.g., MPA)
and developmental risk factors (e.g., neurological and neuromotor profiles) with psychotic
disorders such as schizophrenia. Currently, there are insufficient studies to have addressed this
limitation.
Despite the limitations, on interpreting the results of the present study, the following
alternative explanations can be considered. Fonseca-Pedrero et al. (2011) suggested that the
neurodevelopmental changes due to the maturational processes of adolescence may contribute to
the expression of schizotypal traits and depressive symptoms during this period. Since this study
used the PLIKS interview, conducted as part of the annual ALSPAC assessment clinic at mean
age 12.9 (95% CI = 12.5—13.3 years), it is possible that the reported PEs reflect underlying
developmental and maturational changes and be part of normal brain maturation (Fonseca-Pedrero
et al., 2011) rather than a sign of disorder.
Further, it has been suggested that motor difficulties in children rarely occur in isolation.
Generally, subtle motor impairments in children are associated with social cognitive factors such
as lack of confidence, low self-esteem, underachievement in school and loneliness (Henderson &
Sugden, 1992). In this study, the association between motor difficulties and PEs might reflect a
wider problem, extending to social and interpersonal difficulties. Indeed, assessment of childhood
motor competency in conjunction with social cognitive functioning may enhance sensitivity and
specificity in the detection of individuals at risk for schizophrenia-spectrum disorders (Fonseca-
Pedrero et al., 2011).
From an early preventative intervention perspective, the M-ABC manual emphasises that
child’s cognitive, affective and motor abilities dynamically interact and guide behaviour
(Henderson & Sugden, 1992). It has been suggested that a cognitive–motor approach to
intervention recognises that children’s competencies are ‘inextricably linked that in educational or
clinical practice they should not be separated’ (Henderson & Sugden, 1992, p. 127). Therefore, an
effective preventative intervention should incorporate and aim to enhance the child’s
CHILDHOOD DEVELOPMENT FACTORS AND RISK OF PSYCHOTIC EXPERIENCES 226
psychosocial, cognitive and motor competencies. An integrated programme is more likely to
benefit children with elevated risk of PEs than a narrowly focused intervention.
13.1.4 Study 4: Trajectories of early childhood developmental skills.
To the researcher’s knowledge, this was the first study to examine the association between
the trajectories of change in children’s developmental skills over the first four years of life (e.g.,
gross and fine motor development, social interaction and communication skills) and PEs in early
adolescence. Relative to the group unaffected by PEs, those with suspected PEs were found to
have a declining pattern of social skills over time. However no association was found between
consistently low average or declining patterns of communication skills over time and risk of
suspected or definite PEs. In addition, decline in early childhood fine and gross motor skills were
not associated with increased risk of suspected or definite PEs.
The findings of this study are not consistent with previous prospective cohort studies (see
Chapters 2 and 3) that have investigated early childhood developmental risk factors for
schizophrenia in adulthood. Previous research has reported an association between delay in early
language development (e.g., before 3 years of age) and later development of schizophrenia (Jones
et al., 1994) and schizophreniform disorder (Cannon et al., 2002). A delay in early motor
development was identified prospectively in children aged 1 year (Isohanni et al., 2001) and two
years (Jones et al., 1994) that later developed schizophrenia.
The findings of this study do not support the neurodevelopmental model of psychosis.
While, this model appears to be applicable to studies where both schizophrenia and PEs are used
as the outcome variable, in this study, developmental domains were not predictive of PEs. In
addition, our examination of declining patterns of performance over time was not associated with
PEs. So it would seem that these findings of declining performance are not consistent with a
neurodegenerative model of schizophrenia. The inconsistency of findings with High-Risk and
birth cohort studies may imply that PEs in childhood and adolescence may not share a common
pathway with schizophrenia, suggesting probable differences between psychotic phenomena in
children and adults.
CHILDHOOD DEVELOPMENT FACTORS AND RISK OF PSYCHOTIC EXPERIENCES 227
The main strengths of this study were the large sample size, the prospective design,
repeated recording of the developmental variables and the quality control in place in the
measurement of psychotic-like symptoms (with a very good inter-rater reliability, k = 0.72)
(Horwood et al., 2008). This design minimises the risk of recall or information biases in the data.
Further, this study was the first to explore and examine trajectories of change in the self-reported
DDST-II (fine, gross motor and social domains) and risk of PEs in early adolescence.
However, while this study used a list of potential covariates such as socio- demographic
variables, there may be other confounders that should have been included, such as cannabis use
(despite the age of the children, cannabis use cannot be completely ruled out, and may have a
significant effect on the emergence of PEs in the young children) (McGrath et al., 2010). It might
also have been useful to include data on children’s risk of abuse or neglect (Read et al., 2005) and
data on children’ social care (children with a slower development could have received early social
care, which may potentially have attenuated the risk of emergence of PEs). This study also did not
consider other possible traumatic events such as death of a family member (Morgan et al., 2007).
One major limitation of this study was that due to the large numbers of children assessed,
ALSPAC relied on parental report to score their child’s developmental profiles. However, the
ALSPAC developmental questionnaire had good correlation with the Griffiths Developmental
Scale, which was rated by independent professionals. Attrition was another major limitation, as it
is in the majority of large longitudinal studies.
However, despite inconsistent findings with previous research, there are alternative
explanations that warrant further discussion. First, it is possible that subtle differences in early
childhood developmental skills (e.g., fine, gross motor, social and communication skills) may
become evident later in development (e.g., late childhood or adolescence), and that these later
deficits may be related to risk of PEs. These developmental skills in individuals at risk of
developing PEs may have been acquired ‘normally’ early in life, but then gradually declined over
childhood/adolescence. However, there is currently no evidence to support this hypothesis.
Secondly, the assessment of early childhood developmental skills used in this study (parental
report of DDST-II) may not be sensitive enough to detect any differences in developmental
CHILDHOOD DEVELOPMENT FACTORS AND RISK OF PSYCHOTIC EXPERIENCES 228
domains.
13.1.5 Study 5: Child genotype and cognitive profiles.
This preliminary study examined the distribution of endorsing definite PEs in relation to
the DTNBP1, NRG1 and DISC1 genotypes. This study also examined the association of
childhood cognitive profiles and PEs in early adolescence. Further, the interactive effect of
genotypic risk indicators and low average cognitive skills was explored in relation to presence of
definite PEs. This study was the first to examine these domains in relation to risk of PEs in early
adolescence.
Overall, the hypothesis that experience of adolescent PEs would be associated with
genotypic variations in the DTNBP1, DISC1 and NRG1 genes was not supported. While the
results showed no evidence of association between PEs and any of the NRG1 and DISC1
genotypes, greater frequency of DTNBP1 (rs4715984) G:A alleles were found to be
overrepresented in those endorsing definite PEs. In addition, the combined rare homozygotes to
the heterozygotes (G:A + A:A) were also found to be overrepresented in the definite PEs as
compared to the not present group. However, no evidence of association between persistent PEs
over time and any of the DTNBP1, NRG1 or DISC1 genotypes was found.
In relation to previous research, the overall findings of this study were not compatible with
research on susceptibility genes for schizophrenia-related conditions (Petryshen et al., 2004;
Pulver et al., 1994; Seshadri et al., 2010; Stefansson et al., 2002). While this study found some
evidence of association between DTNBP1 genotypic variation and PEs, further research is
required to assess allelic expression directly, and haplotype analysis should be conducted to
investigate the combined effect of two or more SNPs on PEs. These analyses would require
specialised genetic association analysis software such as UNPHASED
(http://unphased.sourceforge.net/), GENECOUNTING (http://www.mrc-
epid.cam.ac.uk/~jinghua.zhao/software.htm) or PLINK
(http://pngu.mgh.harvard.edu/~purcell/plink/).
Since haplotypes consist of multiple SNPs located on the same chromosome, and these
tend to be inherited together, they have been suggested to be in closer linkage disequilibrium (LD)
CHILDHOOD DEVELOPMENT FACTORS AND RISK OF PSYCHOTIC EXPERIENCES 229
with a casual variant than any single SNP. For this reason, they may enhance the coverage value
of the genotypes over single SNP analysis (Stram & Seshan, 2012, p. 423). Haplotype association
analyses tend to focus on (a) fine mapping, to localise a susceptibility gene via LD with adjacent
genetic markers; and/or (b) the influence that the entire haplotype has on a particular
phenotype/trait (Schaid, Rowland, Tines, Jacobson & Poland, 2002).
From a biological function perspective, analyses of haplotypes are more plausible than
single SNPs effects. Unlike this study, which examined only single genotypes, haplotypes in a
gene may cause several amino acid changes in the ultimate protein product. The joint effect of
these amino acid changes would have a much larger influence on the function of the protein
product than any single amino acid change. This emphasises the importance of examining
candidate genes by SNP haplotyping (Schaid et al., 2002).
Further, research methods based on haplotype association analysis ‘can be more powerful
than those based on single markers in association studies of mapping complex disease genes …
since the former fully exploits LD information from multiple markers’ (Liu, Zhang & Zhao, 2008,
pp. 336–337). This study was limited to single SNP genotypic analysis. However, future research
should focus on determining haplotypes by using pedigree analysis or molecular haplotyping
using specialised genetic analysis software (Schaid et al., 2002).
Failure to replicate findings related to the genetics of schizophrenia is a major limitation in
investigating this phenomenon to date. Hotta et al. (2011) found no evidence of association
between DISC1 genotypic variation (SNPs rs751229, rs3738401, rs821597 and rs821616) in
Japanese individuals presenting with schizophrenia as compared to NCs. On the other hand, there
is some evidence of association between the DTNBP1 gene on chromosome 6p and schizophrenia
(Bray et al., 2005; Fallgatter et al., 2010). Indeed, DTNBP1 has been suggested to modify
glutamatergic neurotransmission in the human brain, thereby influencing prefrontal cortex
function and associated cognitive processes (Fallgatter et al., 2010).
In reference to previous studies of susceptibility genes of schizophrenia (see Chapter 4),
the overall findings of the present study indicate that schizophrenia and PEs are unlikely to be
caused by a single gene (Lenzenweger, 2006). As yet, no studies have conclusively found a direct
CHILDHOOD DEVELOPMENT FACTORS AND RISK OF PSYCHOTIC EXPERIENCES 230
association between a single gene and schizophrenia. This stands in contrast to Meehl’s general
single-locus model, which suggests that schizotaxia, a condition arising from a single gene
(‘schizogene’) may give rise to phenotypic schizotypy, and possibly schizophrenia (Lenzenweger,
2006; Meehl, 1962, 1989).
While Meehl’s single gene theory incorporates the role of other factors, the multifactorial-
threshold model posits that multiple genetic factors are involved in schizophrenia liability and that
they may act additively. In some individuals, it may be likely that the number of factors crosses a
threshold, beyond which they result in the eventual development of schizophrenia (Gottesman &
Shields, 1967). Under the multifactorial-threshold model, environmental factors (e.g., birth
complications, negative environments and stressful life events) may act either protectively or
detrimentally, raising or lowering the threshold for phenotypic expression and thus affecting the
degree of risk for development of the disorder.
In terms of the second prediction, the results revealed that those endorsing definite PEs
were more likely to have low average literacy skills, verbal, performance and full scale IQs in
childhood. However, only low average verbal IQ was associated with persistent PEs over time.
These findings are compatible with previous longitudinal HR research. The Stony Brook HR
project, for example, showed that offspring of parents presenting with schizophrenia had ‘low
verbal productivity, inadequate patterns of cohesion between ideas, and unclear and ambiguous
references to previously mentioned ideas’ (Weintraub, 1987, p. 444). Similarly, the Boston and
Providence NCPP HR study found a significant main effect of parental schizophrenia diagnosis on
child IQ at age seven; the low IQ of children of parents presenting with schizophrenia remained
significant after controlling for potential confounding variables (Goldstein et al., 2000, p. 327). In
ALSPAC studies, regardless of family history of schizophrenia, those experiencing PEs were
more likely to have lower childhood cognitive profiles.
However, childhood cognitive, language and literacy development are related to duration
of schooling, which is related to age of the cohort member. Therefore, since the ALSPAC cohort
was followed during a variable period, the predictor variables ought to be adjusted for age-at-
testing. In addition, early educational variables often have a month of birth effect (Crawford,
CHILDHOOD DEVELOPMENT FACTORS AND RISK OF PSYCHOTIC EXPERIENCES 231
Dearden & Meghir, 2010), and are not necessarily due to any obstetric or prenatal exposure, but
simply related to age cut-offs for commencing school. It is likely that in this study, those assessed
at a younger age performed worse than did their older peers.
In terms of the third prediction, the hypothesis was partially supported that the interactive
effect of genotypic risk indicators and low average cognitive skills (literacy and intelligence)
would be more influential on PEs than genetic risk indicators or low average cognitive skills
alone. Exposure to both DTNBP1 (rs4715984) minor alleles (G:A + A:A) and low average
literacy skills was associated with an increase in the odds of reporting PEs. However, very small
percentages were attributable to the joint action of exposure to minor alleles and low average
verbal, performance and full scale IQ.
To the researcher’s best knowledge, this study was the first to examine the interactive
effect of genotypic risk indicators and low average cognitive antecedents of PEs. However, the
overall findings are compatible with previous research examining the association of DTNBP1
SNPs and intellectual functioning in individuals presenting with schizophrenia. Zinkstok and
colleagues (2007) found that individuals with their first episode of schizophrenia or a related
psychotic disorder had significantly lower verbal, performance and total IQ scores as compared to
NCs. Further, the rs760761, rs2619522 and rs2619538 SNPs of the DTNBP1 gene showed
significant association with full-scale IQ scores in those presenting with schizophrenia, their
siblings and NCs (Zinkstok et al., 2007). However, unlike the present study, which only assessed
single SNPs, previous researchers have examined the association of genetic risk haplotypes,
cognitive variation and schizophrenia (Burdick et al., 2007; Donohoe et al., 2007).
13.1.6 Study 6: Pilot trial of a social cognitive enhancement programme.
This exploratory pilot trial extended the use of computer-aided cognitive enhancement
programmes with typically developing children. Contrary to the research hypothesis, the results
indicated that participation in this computer-aided programme was not associated with significant
improvements in neurocognitive and social cognition measurements. On average, both the
treatment and control groups showed similar trends of improvements over time.
In this study, the decline in CBCL internalised, externalised and total problems from pre-
CHILDHOOD DEVELOPMENT FACTORS AND RISK OF PSYCHOTIC EXPERIENCES 232
to post-assessment was similar for both the treatment and control groups. All participants had
internal, external and total problem T scores within the normal range before and after the
programme. Further, with regard to the CASI interview, both the treatment and control groups had
similar attribution styles.
Although this study found inconsistent results with previous findings (Beaumont &
Sofronoff, 2008; Boivin et al., 2010; Klingberg et al., 2005; Stevens et al., 2008), it had the
advantage of using standardised measurements to assess improvements over time. In the study by
Beaumont and Sofronoff (2008), the children participating in the social skills programme showed
greater improvements in emotion recognition, emotion regulation and social interaction as
assessed by parent-report measures. However, it can be argued that the efficacy of this programme
remains questionable since parental measurements may be confounded with subjective
evaluations of their children. The present study evaluated the efficacy of the programme via pre
and post standardised measurements. Although there may have been minor qualitative
improvements (as perceived by the participant or parents, this was not assessed), the children’s
improvements over time were similar for the treatment and control groups.
In this study, several methodological issues relating to screening tests and sample
characteristics may also have confounded the results. Sample characteristics such as small sample
size, non-random selection, allocation of participants to treatment and control groups and
inclusion of only typically developing children may have confounded the results.
In this study, participants were purposefully selected and allocated to treatment and control
groups (comprising only typically developing children). The selection method of the participants
addressed the potential impact that differences in the dependent variables may be due to the
differences between the control and treatment groups rather than the effect of the programme.
Indeed, if participants were randomly assigned to the control or treatment group, then the threat
would be minimal or non-existent because the available participants would have an equally likely
chance of being selected for the treatment or control group.
In addition, this study may be considered underpowered due to its small sample size; the
results may have underestimated the significance of the programme. Moreover, lack of social
CHILDHOOD DEVELOPMENT FACTORS AND RISK OF PSYCHOTIC EXPERIENCES 233
cognitive screening tests may have contributed to having a treatment group with consistently
lower baseline scores on the NEPSY-II subtests than the control group. In addition to this, follow-
up assessment can be an important indicator of internal validity, especially in research evaluating
the neuropsychological benefits of social cognitive enhancement programmes. This study did not
include any follow-up assessment of participants. Indeed, follow-up of the participants over a
longer period is necessary to assess the long-term effect of such programmes.
The computer-aided social cognitive programme used for this study comprised
commercially based computerised games and educational card activities. However, the extent to
which these activities were theoretically or empirically based is questionable.
This programme did not incorporate any research-purposed activities derived from social
and cognitive theoretical perspectives. Thus, the design of a multi-dimensional programme that
incorporates both commercialised and non-commercialised activities that are both theoretically
and empirically based would be more likely to benefit children than the present programme.
Activities that focus on particular social cognitive developments would have a greater likelihood
of benefiting and meeting the needs of children at elevated risk of developing psychopathological
conditions (e.g., offspring of parents with schizophrenia or children screened positive for
psychotic experiences).
Although, no significant effect of using computer-aided social cognitive programmes was
found, it is argued that children with elevated risk of developing psychotic experiences, and
arguably schizophrenia, may benefit from programmes designed specifically to target and activate
particular social cognitive domains. Computer-aided social cognitive programmes may be
designed with a focus on early preventative interventions. Children that exhibit difficulties in
social interactions may engage in social activities in a virtual environment, before gradually
applying their new skills to social settings.
13.2 Research applications and implications
The previous sections of this chapter provided detailed discussion of the empirical studies
presented in Chapters 7 through 12. This section aims to discuss the research applications and
implications drawn from these studies, which are here categorised into two major themes of
CHILDHOOD DEVELOPMENT FACTORS AND RISK OF PSYCHOTIC EXPERIENCES 234
discussion.
The first major theme focuses on translational research for PEs and schizophrenia. This
section provides a definition of translational research and discusses the applications and
implications of the research findings with reference to translational research. This section also
discusses the challenges and obstacles that may impede the translation of current research findings
to clinical research and practice. This section concludes by identifying the gaps in translational
research of the early identification of individuals at high risk, and the development of early
preventative interventions.
The second major theme focuses on early preventative interventions. This major theme is
further subdivided into two sub-themes: 1) psychological intervention models in schizophrenia,
and 2) early identification and intervention for psychotic symptoms. This section also discusses
the challenges and obstacles in early preventative interventions. Finally, it presents a conceptual
model for risk estimation research in schizophrenia and PEs.
13.2.1 Translational research for psychotic experiences and schizophrenia.
“Translational research is urgently needed to turn basic scientific
discoveries into widespread health gains and nowhere are these needs
greater than in conditions such as schizophrenia and other psychotic
disorders” (Wang et al., 2009, p. 204).
Translational research includes two inter-related areas of research: T1 and T2 (Woolf,
2008). T1 refers to the application of research findings derived from basic sciences to develop
new methods of diagnosis, produce new drugs, devices and treatment options and perform first
trials with human participants. T2 translates clinical research findings to everyday clinical practice
and health decision making (Woolf, 2008).
The development of neuroleptic medications as a treatment for schizophrenia and an
increasing understanding of their biological mechanisms have significantly contributed to current
understandings of the pathophysiologic processes associated with schizophrenia (Cohen & Insel,
2008). However, only a proportion of individuals with schizophrenia receiving antipsychotic
medications achieve either short or long-term recovery from psychotic episodes (Wang et al.,
CHILDHOOD DEVELOPMENT FACTORS AND RISK OF PSYCHOTIC EXPERIENCES 235
2009).
Further, despite large health care expenditures on clinical trials and the development of
innovative pharmacological treatments, in the United States, the vast majority of individuals
presenting with psychotic disorders such as schizophrenia are inadequately treated and experience
poor outcomes (Wang et al., 2009). While there has been substantial refinement in antipsychotic
medications through minimising their side effects as observed with earlier agents, little progress
has been made in ameliorating the cognitive and social cognitive deficits associated with
schizophrenia (Cohen & Insel, 2008).
This thesis found that the accumulated research evidence shows that cognitive and social
cognitive deficits predate the development of schizophrenia in adulthood. Chapters 2 and 3
reviewed the literature on childhood neurodevelopmental predictors of schizophrenia. These
chapters found that impaired childhood cognitive and social functioning have been repeatedly and
robustly detected and associated with the development of schizophrenia in adulthood. Similarly,
this thesis found strong evidence for literacy, cognitive and attention skills in childhood as
predictive of adolescent PEs. The consistency of these findings with those found in the review
conducted of HR and birth cohort studies suggests that measurement of PEs in early adolescence
may represent a risk factor for the development of schizophrenia.
Further, the consistency of research findings related to childhood neurodevelopmental
indicators of schizophrenia and PEs imply that PEs and schizophrenia may share similar cognitive
developmental mechanisms. However, if there is little progress made to target cognitive and social
cognitive deficits in schizophrenia (Cohen & Insel, 2008), currently there is no identifiable
research effort towards early preventative interventions for children with elevated risk for
psychotic symptoms.
Lower performance on literacy, cognitive and attention skills tests during childhood as
predictive of PEs in early adolescence supports a neurodevelopmental model. This model is
applicable to both schizophrenia and PEs. Further, association of declining patterns of
performance over time and adolescents’ PEs is consistent with a neurodegenerative model of
schizophrenia. The theoretical implications of these findings suggest that early deficits in multiple
CHILDHOOD DEVELOPMENT FACTORS AND RISK OF PSYCHOTIC EXPERIENCES 236
developmental domains may impair functioning in a gradual declining pattern over time leading to
PEs in adolescence, and arguably schizophrenia in adulthood. However, research support for this
argument is subject to investigation of association between presence of PEs in early adolescence
and risk of developing schizophrenia in adulthood.
From a clinical perspective, early detection of psychotic symptoms requires the application
of valid screening measures and assessment procedures. However, several issues may limit the
application of measurements in clinical early detection settings. Issues such as poor psychometric
properties, instrument availability, training requirements for clinicians, specificity and sensitivity
to detect changes in clinical states, applicability to clinical populations and lack of practicality in
clinical settings (e.g., test procedures may be too long) may limit the application of these
measurements in clinical practice (Cohen & Insel, 2008).
Collectively, these issues have been referred to as both scientific and sociological
obstacles that may impede the translation of advances in cognitive psychology and cognitive
neuroscience to clinical research and practice (Cohen & Insel, 2008). Nevertheless, basic
cognitive neuroscience models have substantially explained core mechanisms of attention,
memory, ToM, affect recognition and other higher cognitive deficits in schizophrenia (Ochsner,
2008), and these may be the primary contributor to loss of social and occupational function
(Cohen & Insel, 2008).
There is a substantial need for T1 research to develop and evaluate treatments for
individuals presenting with schizophrenia and psychotic conditions. However, a major
improvement in translational research will necessarily involve early identification of individuals at
high risk. In this way, early preventative interventions could be tried earlier and at optimal
developmental stages, to prevent subsequent psychopathology and reduce the severity of disability
(Wang et al., 2009).
Evidence from studies examining childhood neurodevelopmental indicators of
schizophrenia and PEs can guide strategies for the early identification of individuals at high risk
of developing psychotic symptoms. In this thesis, the literature reviews and ALSPAC empirical
studies had a common aim of examining the childhood developmental variables associated with
CHILDHOOD DEVELOPMENT FACTORS AND RISK OF PSYCHOTIC EXPERIENCES 237
the development of schizophrenia and PEs, respectively. The identified developmental domains of
functioning may be considered as risk factors associated with PEs and schizophrenia.
A risk factor in this context is defined as a variable that precedes and is associated with a
health-related outcome (Kraemer, Lowe & Kupfer, 2005). Kraemer et al. identified three
components to risk research: estimation, evaluation and management. While risk estimation
involves research attempts to identify variables associated with a health outcome, risk evaluation
aims to evaluate whether results from risk estimation research can be applied in real population
and clinical settings (Kraemer et al., 2005). Following from this, risk management aims to assess
how to manage results from risk estimation research.
Risk estimation research may identify malleable (modifiable) or fixed (non- modifiable)
risk factors associated with a particular health outcome such as schizophrenia (Kraemer et al.,
2005). Therefore, from a translational research perspective, the development and evaluation of
efficacious early preventative interventions for individuals at high risk of developing psychotic
symptoms, and arguably schizophrenia, is dependent on basic risk factor research. This would
involve efforts to distinguish modifiable versus non-modifiable risk factors, with the former being
the direct target of preventative interventions (Kraemer et al., 2005). Indeed, accurate
identification of both modifiable and non-modifiable risk factors is important for the early
identification of individuals at elevated risk of developing psychotic symptoms and schizophrenia.
In this thesis, the study of literacy, cognitive, attention, motor and social skills contributed
to understanding the developmental pathways towards PEs by testing whether these childhood
developmental domains were associated with PEs in early adolescence. These studies were among
many that have focused on the identification of developmental indicators of schizophrenia and
PEs, and this growing body of work is applicable to the development of preventative
interventions.
However, this field of research requires considerable translational work if that goal is to be
fulfilled. A number of neurodevelopmental domains are emerging that, possibly in combination
with emerging genetic risk markers, could potentially be used to define an intervention target
group comprising children with a highly elevated risk of developing schizophrenia. Should such a
CHILDHOOD DEVELOPMENT FACTORS AND RISK OF PSYCHOTIC EXPERIENCES 238
group be reliably identifiable, it will be important to have developed and evaluated preventative
interventions directed towards addressing the social, linguistic and emotional processing abilities
of that target group.
13.2.2 Early preventative intervention.
In an effort to improve long-term outcomes for individuals presenting with schizophrenia
and related psychotic disorders, recent research has increasingly focused on the early
identification of psychotic symptoms and early intervention in schizophrenia- related conditions
(Bosanac, Patton & Castle, 2010; Marshall & Rathbone, 2011; Nordentoft, Jeppesen, Petersen,
Bertelsen & Thorup, 2009). This thesis argues that, just as early identification and interventions in
schizophrenia are a realistic and justifiable goal in research with far-reaching implications for
schizophrenia prevention (Knowles & Sharma, 2004, p. 595), so too are early preventative
interventions for children with elevated risk of developing psychotic symptoms. From a clinical
and theoretical perspective, early preventative interventions may draw from psychological
intervention models of schizophrenia.
13.2.3 Psychological intervention models of schizophrenia.
A variety of psychological intervention models of schizophrenia have been proposed
drawing on traditional cognitive, behavioural, psychodynamic or systemic interventions (Lewis,
2008). Neurocognitive remediation, for example, has recently been applied to schizophrenia. This
intervention model is based on principles of neuroplasticity and is informed by
neuropsychological rehabilitation models (Saperstein & Medalia, 2012). Cognitive remediation
for schizophrenia has been shown to improve neurocognition and psychosocial outcomes with
effect sizes in the moderate range (Barlati, De Peri, Deste, Fusar-Poli & Vita, 2012; Saperstein &
Medalia, 2012).
Using a systematic literature review and meta-analytical techniques, a recent study by the
researcher and others16 reviewed the efficacy of studies that have employed a specified treatment
programme to ameliorate ToM deficits in schizophrenia. Eight studies consisting of 131
16 Hameed, M. A., Lewis, A. J., Lum, J. & Thorneycroft, S. (2013). Social cognitive remediation for schizophrenia: A
meta-analytic review. Manuscript in preparation.
CHILDHOOD DEVELOPMENT FACTORS AND RISK OF PSYCHOTIC EXPERIENCES 239
individuals presenting with schizophrenia and 102 control participants were aggregated from
relevant databases. While results of change in ToM ability after social cognitive intervention for
individuals presenting with schizophrenia gave Cohen’s d =.91 (95% CI = .31–1.50, p = .003), the
overall effect size of change for the control participants was considerably smaller in magnitude
(pooled estimated Cohen’s d = .13, 95% CI = -.26–.51).
Guided by psychological intervention models of schizophrenia, this thesis argues that early
preventative interventions are justifiable research attempts to ameliorate neurocognitive deficits in
children with elevated risk of developing psychotic symptoms. This thesis found an association
between PEs in early adolescence and patterns of childhood developmental profiles in adult onset
schizophrenia. PEs may thus represent a vulnerability and risk factor for later development of
schizophrenia-related conditions. While future research is required to assess the association
between PEs in early adolescence and incidence of schizophrenia-related conditions in adulthood,
this thesis argues that, despite the ethical dilemmas (e.g., stigmatisations) involved, research
efforts towards early detection methods and preventative interventions offer an opportunity for
substantial improvements in the neurocognitive deficits of children with elevated risk of
developing psychotic symptoms.
However, in discussing early detection and prevention strategies, one would also need to
consider the issue of cost-effectiveness. In addition, one would also need to consider the question
as to whether PEs are an adequately sensitive predictor of psychosis to warrant substantial
investment in preventive interventions – in other words will the “number needed to treat” warrant
this approach?
13.2.4 Early identification and intervention for psychotic symptoms.
Marshall and Rathbone (2011) argue that early intervention in schizophrenia comprises
two elements: early detection and phase-specific treatment, and that these are different from
standard care. While early intervention has been established as a therapeutic approach in America,
Europe and Australasia, there is limited research evidence as to the extent to which early detection
and phase-specific treatments are effective strategies (Marshall & Rathbone, 2011). Nevertheless,
it has been proposed that early intervention in schizophrenia is justified to (a) minimise negative
CHILDHOOD DEVELOPMENT FACTORS AND RISK OF PSYCHOTIC EXPERIENCES 240
personal and social impact of prolonged periods of untreated symptoms, and (b) improve
treatment outcomes (Nordentoft et al., 2009).
Marshall and Rathbone (2011) conducted a meta-analytic review of 18 randomised control
trials (n = 941) designed to prevent progression to psychosis in individuals showing prodromal
symptoms or to improve outcomes for those with first episode psychosis. These intervention
studies were mostly small and undertaken by pioneering researchers with many methodological
limitations. Since the studies were not similar in prevention strategies, they were examined
separately.
A randomised controlled trial (RCT) focused on prevention of psychosis for individuals
with prodromal symptoms. Neither olanzapine (n = 60, relative risk [RR] conversion to psychosis
= 0.58, 95% CI = 0.3–1.2) nor cognitive behavioural therapy (CBT; n = 60, RR conversion to
psychosis = 0.50, 95% CI = 0.2–1.7) were found to have much effect. A risperidone plus CBT and
specialised team did show benefits over a specialised team alone at 6 months (n = 59, RR
conversion to psychosis = 0.27, CI = 0.1–0.9). However, phase-specific CBT for suicidality had
little effect (n = 56, RR suicide = 0.81, 95% CI = 0.05–12.26). Overall, this review revealed
inconclusive evidence as to whether individuals in the prodrome phase of psychosis are likely to
benefit from early intervention (Marshall & Rathbone, 2011).
Moreover, it is argued that the feasibility of early psychosocial interventions is
questionable for two reasons. First, schizophrenia is considered a highly heritable disorder
(Nieratschker et al., 2010) with multiple genes involved in the dopaminergic system or pathways.
Secondly, it seems contradictory to treat a condition with biological origins with psychological
interventions.
Kapur (2003) addresses this apparent contradiction of treating a disorder with biological
origins with psychological interventions by providing a framework linking biology,
phenomenology and pharmacology in schizophrenia. In his paper entitled ‘Psychosis as a state of
aberrant salience’, Kapur (2003) extended the dopamine hypothesis in an attempt to explain how
this over-activity of dopamine may result in positive symptoms of schizophrenia. This paper
discussed the typical role of dopamine in mediating appropriate motivational salience to stimuli,
CHILDHOOD DEVELOPMENT FACTORS AND RISK OF PSYCHOTIC EXPERIENCES 241
and suggested that dysregulation of the dopaminergic system results in the aberrant assignment of
salience to insignificant or non-contextually relevant environmental stimuli and internal events.
Kapur (2003) posited that hallucinations are the direct result of this aberrant salience on
internal events, such as thoughts, images and memories, and environmental stimuli. Aberrant
salience may also explain some of the accounts of individuals in the prodromal phase of
schizophrenia, which describe a heightened sense of awareness and perception and a sense that
small things seem to be incredibly significant and important. Kapur proposed that delusions are
formed as the result of a person’s attempts to make sense of these experiences of aberrant
salience. This, he argues, provides an explanation for the variation in clinical presentation across
individuals and cultures; while the underlying chemical dysregulation is the same, individual
delusions vary and reflect psychodynamic themes relevant to individuals and their cultures.
An implication of Kapur’s (2003) theory is that, while anti-psychotic medications may
diminish aberrant salience, they do not act on the beliefs developed because of those experiences.
As such, he proposes a combination of pharmacotherapy alongside psychological therapy to
address delusional belief systems and the wider effects these can have on a person’s cognitive
schemas.
While Kapur’s (2003) explanation of psychosis is a theoretical model, it provides a means
for linking together the understanding of psychotic symptoms at a biological level with the
psychological or phenomenological accounts of individual’s actual experiences. This is
potentially a very useful psycho-educational tool for children with elevated risk of developing
psychotic experiences, and arguably schizophrenia.
As previously stated, just as early identification and interventions in schizophrenia are a
realistic and justifiable goal in research with far-reaching implications for schizophrenia
prevention (Knowles & Sharma, 2004, p. 595), the same could be said for early preventative
interventions for children with elevated risk of developing psychotic symptoms. However, from a
translational research perspective, the development of early preventative interventions remains
dependent upon further basic risk estimation research. Indeed, further basic cognitive
neuroscience research is required to examine and identify modifiable risk factors (main effects)
CHILDHOOD DEVELOPMENT FACTORS AND RISK OF PSYCHOTIC EXPERIENCES 242
and moderating and mediating pathways (interaction effects), and to identify common variables
that may have a mutual effect on candidate risk factors and schizophrenia outcomes. A conceptual
model of vulnerability pathways proposed for anxiety disorders has been updated and applied to
psychotic experiences and schizophrenia research (Zvolensky, Schmidt, Bernstein & Keough,
2006). Figure 13.1 shows a graphical illustration of these candidate risk factors’ main and
interaction effects.
While in this thesis the literature reviews of longitudinal HR and birth cohort studies (see
Chapters 2 and 3, respectively) focused on the direct effect of childhood developmental risk
factors and schizophrenia, there were no findings relating to moderation, mediation processes or
the possibility of a third variable mutually influencing risk factors and outcome variables.
Similarly, in this thesis, although the results from ALSPAC studies were adjusted for potential
confounding variables, the findings were limited to the direct influence of literacy, cognitive,
attention, motor, social, communication skills, genotypic variations and risk of reporting PEs in
early adolescence.
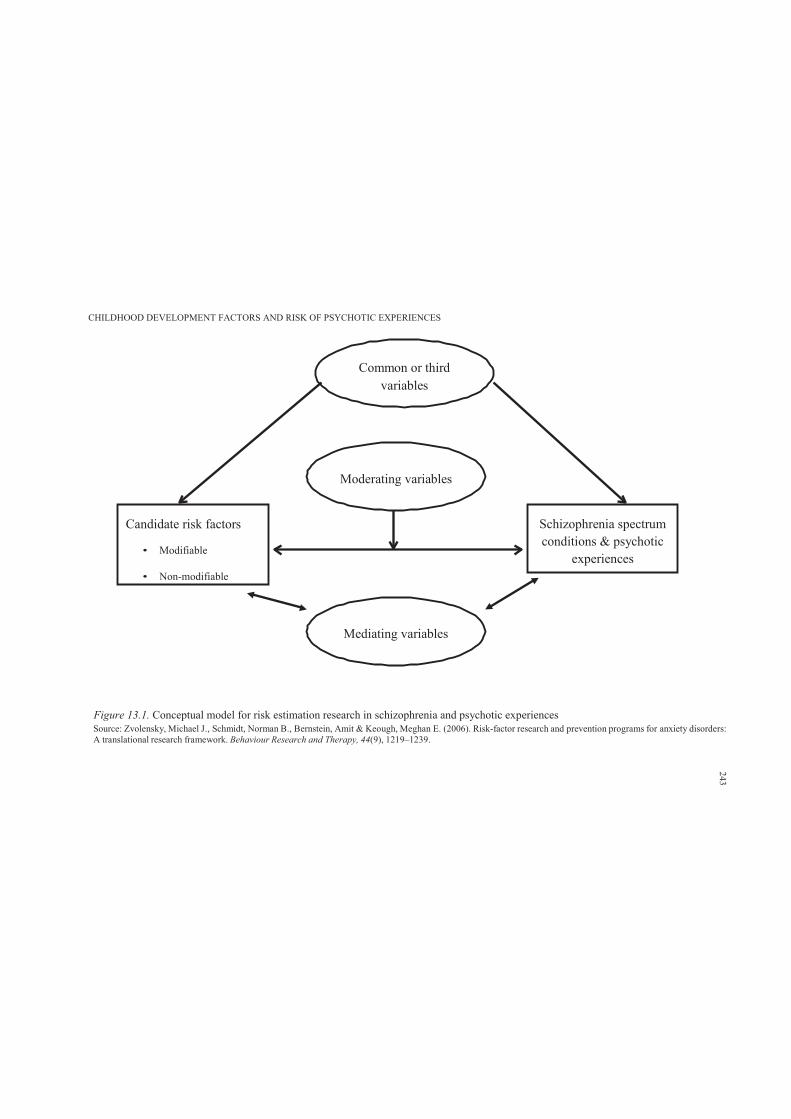
CHILDHOOD DEVELOPMENT FACTORS AND RISK OF PSYCHOTIC EXPERIENCES
Common or thirdvariables
Moderating variables
Candidate risk factors
• Modifiable
• Non-modifiable
Schizophrenia spectrum conditions & psychotic
experiences
Mediating variables
Figure 13.1. Conceptual model for risk estimation research in schizophrenia and psychotic experiencesSource: Zvolensky, Michael J., Schmidt, Norman B., Bernstein, Amit & Keough, Meghan E. (2006). Risk-factor research and prevention programs for anxiety disorders:A translational research framework. Behaviour Research and Therapy, 44(9), 1219–1239.
243
CHILDHOOD DEVELOPMENT FACTORS AND RISK OF PSYCHOTIC EXPERIENCES 244
While the development of early preventative interventions for application in the earliest
stages of any kind of mental disorder may prevent or reduce the development of psychopathology
later in life, further basic risk estimation research is required to assess the contribution of
moderating and mediating variables in PEs and schizophrenia. In addition, it is recommended that
future research focus on identifying common variables that might have a mutual impact on risk
and outcome variables. Indeed, from a translational research perspective, clarifying these
pathways would enhance the development of early preventative interventions designed to target
those particular domains of functioning most associated with the development of PEs and
schizophrenia.
13.3 Thesis’ Original Contribution to Knowledge
This thesis addressed a significant gap in the research by being the first investigation to
examine child literacy, attention, cognitive, motor, social, communication skills and risk of PEs in
early adolescence. Further, this thesis was the first to examine the association between patterns of
performance over time in relation to the likelihood of reporting PEs. In addition, this thesis
investigated the association of a selection of known genetic markers of schizophrenia and risk of
reported PEs. Finally, it evaluated the benefits of using computer-aided social cognitive
programmes for children. This shift in focus aimed to provide preliminary research evidence
regarding the feasibility of using computer-aided social cognitive programmes for children with
elevated risk of developing psychotic symptoms, and arguably schizophrenia.
Overall, this thesis contributed to understanding PEs and their relation to known childhood
neurodevelopmental indicators of schizophrenia. The overall inferences drawn from the empirical
studies imply that it might be possible to predict developmental patterns associated with a
pathway towards psychotic symptoms, and arguably schizophrenia. From a clinical perspective,
the development of valid screening measures and assessment procedures will have significant
diagnostic and therapeutic implications.
Results from the empirical studies may be used as a guide in the early detection of
psychotic symptoms and the development of preventative interventions. The PLIKS interview
used in ALPSAC studies is a robust measure of PEs in children and adolescents. While this is a
CHILDHOOD DEVELOPMENT FACTORS AND RISK OF PSYCHOTIC EXPERIENCES 245
non-clinical measure of PEs, it arguably serves as a valid screening measure for children with
elevated risk of developing psychotic symptoms, and possibly schizophrenia. However, evidence
supporting this argument can only come from further examination of the association between PEs
and incidence of schizophrenia in adulthood.
Nevertheless, this thesis demonstrated that PEs share similar patterns of association with
childhood developmental indicators of schizophrenia. The consistency of findings may suggest
that measurement of PEs in early adolescence may be an important marker of risk for the
development of schizophrenia. Therefore, the identified childhood developmental factors
associated with PEs at key points in child development may add substantially to research efforts
towards early preventative interventions.
However, since PEs and schizophrenia have a low prevalence rate, efforts to prevention
are most likely to be directed towards the development of selective prevention interventions where
a group with a strong possibility of developing the disorder is offered an intervention prior to the
onset of symptoms of the target disorder. Therefore the current thesis offer a great deal to
researchers interested in early detection of children who are likely to develop PEs, and arguably
schizophrenia. Such researchers will require the application of valid and practical screening and
assessment measures and across all of the developmental domains identified in this thesis.
However, this field of research requires considerable translational work if the goal of
prevention is to be progressed. A number of neurodevelopmental domains are emerging that,
possibly in combination with emerging genotypes or other biomarkers of risk, could potentially be
used to define an intervention target group comprising children with a highly elevated risk of
developing schizophrenia. Should such a group be reliably identifiable, it will be important to
have developed and evaluated preventative interventions directed towards addressing the social,
cognitive and emotional processing abilities of these children.
13.4 Summary, Conclusion, and Future Research Directions
This thesis contributed significantly to understanding the childhood developmental factors
associated with PEs in early adolescence. It used prospective data from the ALSPAC to examine
literacy, attention, cognitive, motor, social and communication skills in children who later
CHILDHOOD DEVELOPMENT FACTORS AND RISK OF PSYCHOTIC EXPERIENCES 246
completed the PLIKS interview at a mean age of 12.9 (95% CI = 12.5–13.3 years). In addition,
patterns of performance over time were examined in relation to risk of reporting PEs. Finally, this
thesis examined the predictive value of a selection of known genetic markers of schizophrenia in
relation to risk of PEs.
Five empirical studies examined data from 6,790 (45.6% of the original ALSPAC sample)
children who participated in the PLIKS semi-structured interview. Overall, while the results found
strong evidence of an association between PEs and literacy, cognitive and attention skills, there
was only weak to moderate evidence for the predictive value of motor, social and communication
skills in childhood and PEs in early adolescence. Further, a selection of known genetic markers of
schizophrenia was found not to be associated with risk of PEs.
This thesis then shifted its focus of investigate the neuropsychological benefits of
computer-aided social cognitive enhancement programmes for use with typically developing
children. While research-based evidence on this issue is inconsistent, this thesis argued that
understanding the benefits of such programmes might contribute substantially to the development
of targeted interventions for children and individuals from the general population with high risk of
developing psychotic symptoms, and arguably schizophrenia.
While the overall results of the pilot trial did not support the benefits of using computer-
aided programmes for this purpose with children, it was argued that children at risk of developing
psychotic symptoms might still benefit from targeted programmes that draw from psychological
intervention models in schizophrenia.
This thesis thus contributed to the understanding of the developmental pathways towards
PEs by testing whether childhood developmental skills are associated with PEs experienced in
early adolescence. The focus of this thesis was on developmental precursors to psychotic
symptoms. The findings of this thesis implied that aspects of both the neurodevelopmental and
neurodegenerative models might be involved in the development of psychotic symptoms. Overall,
results indicated that an early insult in development plays an important role in the origins of
schizophrenia. Therefore, isolating exactly what this is will obviously be a key finding in the field.
Finally, this thesis demonstrated that it might be possible to predict childhood

CHILDHOOD DEVELOPMENT FACTORS AND RISK OF PSYCHOTIC EXPERIENCES 247
developmental patterns associated with a pathway towards psychotic symptoms, and arguably
schizophrenia. Therefore, the development of valid screening measures and assessment
procedures, and preventive interventions, are well worth developing and evaluating.
CHILDHOOD DEVELOPMENT FACTORS AND RISK OF PSYCHOTIC EXPERIENCES 248
References
Amminger, G. P., Pape, S., Rock, D., Roberts, S. A., Ott, S. L., Squires-Wheeler, E., . . .
Erlenmeyer-Kimling, L. (1999). Relationship between childhood behavioral disturbance
and later schizophrenia in the New York High-Risk Project. The American Journal of
Psychiatry, 156(4), 525–530.
Andrea, Mechelli, Paolo, Fusar-Poli, Diana, Prata, Sergio Alessandro, Papagni, Stefania, Tognin,
Joseph, Kambeitz, . . . Philip, McGuire. (2012). Genetic Vulnerability to Psychosis and
Cortical Function: Epistatic Effects between DAAO and G72. Current Pharmaceutical
Design, 18(4), 510–517.
Asarnow, J. F. (1988). Children at risk for schizophrenia: Converging lines of evidence.
Schizophrenia Bulletin, 14(4), 613–631.
Asarnow, R. F., Steffy, R. A., MacCrimmon, D. & Cleghorn, J. M. (1977). An attentional
assessment of foster children at risk for schizophrenia. Journal of Abnormal Psychology,
86(3), 267–275.
Atun-Einy, O., Berger, S. E. & Scher, A. (2012). Pulling to stand: Common trajectories and
individual differences in development. Developmental Psychobiology, 54(2), 187–198.
Barlati, Stefano, De Peri, Luca, Deste, Giacomo, Fusar-Poli, Paolo & Vita, Antonio. (2012).
Cognitive Remediation in the Early Course of Schizophrenia: A Critical Review. Current
Pharmaceutical Design, 18(4), 534–541.
Barnow, S., Arens, E. A., Sieswerda, S., Dinu-Biringer, R., Spitzer, C. & Lang, S. (2010).
Borderline personality disorder and psychosis: A review. Current Psychiatry Report,
12(3), 186–195.
Bearden, C. E., Rosso, I. M., Hollister, J. M., Sanchez, L. E., Hadley, T. & Cannon, T. D. (2000).
A prospective cohort study of childhood behavioral deviance and language abnormalities
as predictors of adult schizophrenia. Schizophrenia Bulletin, 26(2), 395–410.
Beaumont, R. & Sofronoff, K. (2008). A multi-component social skills intervention for children
CHILDHOOD DEVELOPMENT FACTORS AND RISK OF PSYCHOTIC EXPERIENCES 249
with Asperger syndrome: The Junior Detective Training Program. Journal of Child
Psychology and Psychiatry, 49(7), 743–753.
Bennett, K. K., Weigel, D. J. & Martin, S. S. (2002). Children’s acquisition of early literacy skills:
Examining family contributions. Early Childhood Research Quarterly, 17(3), 295–317.
Bevan Jones, R., Thapar, A., Lewis, G. & Zammit, S. (2012). The association between early
autistic traits and psychotic experiences in adolescence. Schizophrenia Research, 135(1–
3), 164–169.
Bijl, R. V., Ravelli, A. & van Zessen, G. (1998). Prevalence of psychiatric disorder in the general
population: results of the Netherlands Mental Health Survey and Incidence Study
(NEMESIS). Social Psychiatry and Psychiatric Epidemiology, 33(12), 587–595.
Bilder, R. M. , Volavka, J. , Czobor, P. , Malhotra, A. K. , Kennedy, J. L. , Ni, X. , . . . Lieberman,
J. A. . (2002). Neurocognitive correlates of the COMT Val158Met polymorphism in
chronic schizophrenia. Society of Biological Psychiatry, 52, 701–707.
Birmaher, B., Ehmann, M., Axelson, D. A., Goldstein, B. I., Monk, K., Kalas, C., . . . Brent, D. A.
(2009). Schedule for affective disorders and schizophrenia for school- age children (K-
SADS-PL) for the assessment of preschool children: A preliminary psychometric study.
Journal of Psychiatric Research 43(7), 680–686.
Bleuler, Eugen. (1950). Dementia praecox or the group of schizophrenias. Oxford, England:
International Universities Press.
Boivin, M. J., Busman, R. A., Parikh, S. M., Bangirana, P., Page, C. F., Opoka, R. O. & Giordani,
B. (2010). A pilot study of the neuropsychological benefits of computerized cognitive
rehabilitation in Ugandan children With HIV. Neuropsychology, 24(5), 667–673.
Bosanac, P., Patton, G. C. & Castle, D. J. (2010). Early intervention in psychotic disorders: Faith
before facts. Psychological Medicine, 40(3), 353–358.
Boyd, Andy, Golding, Jean, Macleod, John, Lawlor, Debbie A, Fraser, Abigail, Henderson, John,
. . . Davey Smith, George. (2012). Cohort Profile: The ‘Children of the 90s’—the index
offspring of the Avon Longitudinal Study of Parents and Children. International Journal
of Epidemiology, 1–17.
CHILDHOOD DEVELOPMENT FACTORS AND RISK OF PSYCHOTIC EXPERIENCES 250
Bray, N. J., Preece, A., Williams, N. M., Moskvina, V., Buckland, P. R., Owen, M. J. &
O’Donovan, M. C. (2005). Haplotypes at the dystrobrevin binding protein 1 (DTNBP1)
gene locus mediate risk for schizophrenia through reduced DTNBP1 expression. Human
Molecular Genetics, 14(14), 1947–1954.
Bray, Nicholas J., Preece, Anna, Williams, Nigel M., Moskvina, Valentina, Buckland, Paul R.,
Owen, Michael J. & O’Donovan, Michael C. (2005). Haplotypes at the dystrobrevin
binding protein 1 (DTNBP1) gene locus mediate risk for schizophrenia through reduced
DTNBP1 expression. Human Molecular Genetics, 14(14), 1947–1954.
Brooks, B. L., Sherman, E. M. S. & Strauss, E. (2010). Test review: NEPSY-II: A developmental
neuropsychological assessment, second edition. Child Neuropsychology, 16, 80–101.
Bruijnzeel, D. & Tandon, R. (2011). The concept of schizophrenia: From the 1850s to the DSM-5.
Psychiatric Annals, 41(5), 289–295.
Burdick, K. E., Goldberg, T. E., Funke, B., Bates, J. A., Lencz, T., Kucherlapati, R. & Malhotra,
A. K. (2007). DTNBP1 genotype influences cognitive decline in schizophrenia.
Schizophrenia Research, 89(1–3), 169–172.
Byrne, M., Hodges, A., Grant, E., Owens, D. C. & Johnstone, E. C. (1999). Neuropsychological
assessment of young people at high genetic risk for developing schizophrenia compared
with controls: Preliminary findings of the Edinburgh High Risk Study (EHRS).
Psychological Medicine, 29(05), 1161–1173.
Cannon, M., Byrne, M., Cassidy, B., Larkin, C., Horgan, R., Sheppard, N.P. & O’Callaghan, E.
(1995). Prevalence and correlates of mixed-handedness in schizophrenia. Psychiatry
Research, 59(1–2), 119–125.
Cannon, M., Caspi, A., Moffitt, T. E., Harrington, H., Taylor, A., Murray, R. M. & Poulton, R.
(2002). Evidence for early-childhood, pan-developmental impairment specific to
schizophreniform disorder: Results from a longitudinal birth cohort. Archives of General
Psychiatry, 59(5), 449–456.
Cannon, M., Moffitt, T. E., Caspi, A., Murray, R. M., Harrington, H. & Poulton, R. (2006).
Neuropsychological performance at the age of 13 years and adult schizophreniform
CHILDHOOD DEVELOPMENT FACTORS AND RISK OF PSYCHOTIC EXPERIENCES 251
disorder: Prospective birth cohort study. The British Journal of Psychiatry, 189(Nov),
463–464.
Cannon, T. D., Bearden, C. E., Hollister, J. M., Rosso, I. M., Sanchez, L. E. & Hadley, T. (2000).
Childhood cognitive functioning in schizophrenia patients and their unaffected siblings: a
prospective cohort study. Schizophrenia Bulletin, 26(2), 379–393.
Cannon, T. D., Mednick, S. A. & Parnas, J. (1990). Antecedents of predominantly negative- and
predominantly positive-symptom schizophrenia in a high-risk population. Archives of
General Psychiatry, 47(7), 622–632.
Cannon, T. D., Mednick, S. A., Parnas, J., Schulsinger, F., Praestholm, J. & Vestergaard, A.
(1993). Developmental brain abnormalities in the offspring of schizophrenic mothers. I.
Contributions of genetic and perinatal factors. Archives of General Psychiatry, 50(7), 551–
564.
Cannon, T. D., Mednick, S. & Parnas, J. (1989). Genetic and perinatal determinants of structural
brain deficits in schizophrenia. Archives of General Psychiatry, 46, 883–889.
Cardno, A. G. & Gottesman, I. (2000). Twin Studies of Schizophrenia: From Bow-and- Arrow
Concordances to Star Wars Mx and Functional Genomics. American Journal of Medical
Genetics, 97(1), 12–17.
Clarke, M. C., Harley, M. & Cannon, M. (2006). The role of obstetric events in schizophrenia.
Schizophrenia Bulletin, 32(1), 3–8.
Cohen, J. D. & Insel, T. R. (2008). Cognitive neuroscience and schizophrenia: Translational
research in need of a translator. Biological Psychiatry, 64(1), 2–3.
Condray, R. (2005). Language disorder in schizophrenia as a developmental learning disorder.
Schizophrenia Research, 73(1), 5–20.
Conley, C. S., Haines, B. A., Hilt, L. M. & Metalsky, G. I. (2001). The children’s attributional
style interview: Developmental tests of cognitive diathesis-stress theories of depression.
Journal of Abnormal Child Psychology, 29(5), 445–463.
Cornblatt, B. A. & Erlenmeyer-Kimling, L. (1985). Global attentional deviances as a marker of
risk for schizophrenia: Specificity and predictive validity. Journal of Abnormal
CHILDHOOD DEVELOPMENT FACTORS AND RISK OF PSYCHOTIC EXPERIENCES 252
Psychology, 94, 470–486.
Cornblatt, B., Obuchowski, M., Roberts, S., Pollack, S. & Erlenmeyer-Kimling, L. (1999).
Cognitive and behavioral precursors of schizophrenia. Developmental Psychopathology,
11(3), 487–508.
Craddock, N., O’Donovan, M. C. & Owen, M. J. (2006). Genes for schizophrenia and bipolar
disorder? Implications for psychiatric nosology. Schizophrenia Bulletin, 32(1), 9–16.
Crawford, C., Dearden, L. & Meghir, C. (2010). When you are born matters: The impact of date
of birth on educational outcomes in England: IFS working papers.
Csernansky, J. G. (2007). Neurodegeneration in schizophrenia: evidence from in vivo
neuroimaging studies. Scientific World Journal, 7, 135–143.
Dalzell, T. G. (2007). Eugen Bleuler 150: Bleuler’s reception of Freud. History of Psychiatry,
18(4), 471–482.
Deep-Soboslay, Amy, Hyde, Thomas M., Callicott, Joseph P., Lener, Marc S., Verchinski, Beth
A., Apud, José A., . . . Elvevåg, Brita. (2010). Handedness, heritability, neurocognition
and brain asymmetry in schizophrenia. Brain, 133(10), 3113–3122.
DeLisi, L. E. (2008). The concept of progressive brain change in schizophrenia: implications for
understanding schizophrenia. Schizophrenia Bulletin, 34(2), 312–321. doi:
10.1093/schbul/sbm164 [pii]
Dhossche, D., Ferdinand, R., Van Der Ende, J., Hofstra, M. B. & Verhulst, F. (2002). Diagnostic
outcome of self-reported hallucinations in a community sample of adolescents.
Psychological Medicine, 32(4), 619–627.
Dickinson, D., Ramsey, M. E. & Gold, J. M. (2007). Overlooking the obvious: A meta- analytic
comparison of digit symbol coding tasks and other cognitive measures in schizophrenia.
Archives of General Psychiatry, 64(5), 532–542.
Done, D. J., Leinonen, E., Crow, T. J. & Sacker, A. (1998). Linguistic performance in children
who develop schizophrenia in adult life. Evidence for normal syntactic ability. The British
Journal of Psychiatry, 172(2), 130–135.
Donohoe, G, Morris, DW, Clarke, S, McGhee, KA, Schwaiger, S, Nangle, JM, . . . Corvin, A.
CHILDHOOD DEVELOPMENT FACTORS AND RISK OF PSYCHOTIC EXPERIENCES 253
(2007). Variance in neurocognitive performance is associated with dysbindin-1 in
schizophrenia: a preliminary study. Neuropsychologia, 45, 454—458.
Dowd, A. M., Rinehart, N. J., & McGinley, J. (2010). Motor function in children with autism:
Why is this relevant to psychologists? Clinical Psychologist, 14(3), 90-96.
Dragovic, M. & Hammond, G. (2005). Handedness in schizophrenia: A quantitative review of
evidence. Acta Psychiatrica Scandinavica, 111(6), 410–419.
Dwork, A. J., Mancevski, B. & Rosoklija, G. (2007). White matter and cognitive function in
schizophrenia. The International Journal of Neuropsychopharmacology 10(4), 513–536.
Dworkin, R. H., Cornblatt, B. A., Friedmann, R., Kaplansky, L. M., Lewis, J. A., Rinaldi, A., . . .
Erlenmeyer-Kimling, L. (1993). Childhood precursors of affective vs. social deficits in
adolescents at risk for schizophrenia. Schizophrenia Bulletin, 19(3), 563–577.
Egan, M. F., Goldberg, T. E. , Kolachana, B. S., Callicott, J. H. , Mazzanti, C. M. , Straub, R. E. ,
. . . Weinberger, D. R. . (2001). Effect of COMT Val108/158 Met genotype on frontal lobe
function and risk for schizophrenia. Neurobiology, 98(12), 6917–6922.
Erlenmeyer-Kimling, L. & Cornblatt, B. (1978). Attentional measures in a study of children at
high-risk for schizophrenia. Journal of Psychiatric Research, 14(1–4), 93–98.
Erlenmeyer-Kimling, L. & Cornblatt, B. (1987a). High-risk research in schizophrenia: A
summary of what has been learned. Journal of Psychiatric Research, 21(4), 401–411.
Erlenmeyer-Kimling, L. & Cornblatt, B. (1987b). The New York High-Risk Project: A follow-up
report. Schizophrenia Bulletin, 13, 451–461.
Erlenmeyer-Kimling, L., Hans, S., Ingraham, L., Marcus, J., Wynne, L., Rehman, A., . . .
Auerbach, J. (2005). Handedness in children of schizophrenic parents: Data from three
high-risk studies. Behavior Genetics, 35(3), 351–358.
Erlenmeyer-Kimling, L., Rock, D., Roberts, S. A., Janal, M., Kestenbaum, C., Cornblatt, B., . . .
Gottesman, II. (2000). Attention, memory, and motor skills as childhood predictors of
schizophrenia-related psychoses: The New York High-Risk Project. The American Journal
of Psychiatry, 157(9), 1416–1422.
Escamilla, M., Hare, E., Dassori, A. M., Peralta, J. M., Ontiveros, A., Nicolini, H., . . . Almasy, L.
CHILDHOOD DEVELOPMENT FACTORS AND RISK OF PSYCHOTIC EXPERIENCES 254
(2009). A schizophrenia gene locus on chromosome 17q21 in a new set of families of
Mexican and central american ancestry: evidence from the NIMH Genetics of
schizophrenia in latino populations study. American Journal of Psychiatry, 166(4), 442–
449.
Fallgatter, A. J., Ehlis, A. C., Herrmann, M. J., Hohoff, C., Reif, A., Freitag, C. M. & Deckert, J.
(2010). DTNBP1 (dysbindin) gene variants modulate prefrontal brain function in
schizophrenic patients—support for the glutamate hypothesis of schizophrenias. Genes,
Brain and Behavior, 9(5), 489–497.
Faraone, S. V., Taylor, L. & Tsuang, M. T. (2002). The molecular genetics of schizophrenia: An
emerging consensus. Expert Reviews in Molecular Medicine, 4(14), 1–13.
Fatemi, S. H. & Folsom, T. D. (2009). The neurodevelopmental hypothesis of schizophrenia,
revisited. Schizophr Bull, 35(3), 528–548.
Fish, B. (1987). Infant predictors of the longitudinal course of schizophrenic development.
Schizophrenia Bulletin, 13(3), 395–409.
Fish, B., Marcus, J., Hans, S. L. , Auerbach, J. G. & Perdue, S. (1992). Infants at risk for
schizophrenia: Sequelae of a genetic neurointegrative defect. Archives of General
Psychiatry, 49, 221–235.
Flint, J. & Munafò, M. R. (2007). The endophenotype concept in psychiatric genetics.
Psychological Medicine, 37(2), 163–180.
Fonseca-Pedrero, E., Paino, M., Lemos-Giráldez, S. & Muñiz, J. (2011). Schizotypal traits and
depressive symptoms in nonclinical adolescents. Comprehensive Psychiatry, 52(3), 293–
300.
Frankenburg, W. K. & Dodds, J. B. (1967). The Denver Developmental Screening Test. The
Journal of Pediatrics, 71(2), 181–191.
Fraser, Abigail, Macdonald-Wallis, Corrie, Tilling, Kate, Boyd, Andy, Golding, Jean, Davey
Smith, George, . . . Lawlor, Debbie A. (2012). Cohort Profile: The Avon Longitudinal
Study of Parents and Children: ALSPAC mothers cohort. International Journal of
Epidemiology, 1–14.
CHILDHOOD DEVELOPMENT FACTORS AND RISK OF PSYCHOTIC EXPERIENCES 255
Fusar-Poli, P. & Politi, P. (2008). Paul Eugen Bleuler and the birth of schizophrenia (1908).
American Journal of Psychiatry, 165(11), 1407.
Garmezy, N. & Devine, V. (1984). Project Competence: The Minnesota studies of children
vulnerable to psychopathology. In N. F. Watt, E. J. Anthony, L. C. Wynne & J. E. Rolf
(Eds.), Children at Risk for Schizophrenia. A Longitudinal Perspective (pp. 289–303).
New York: Cambridge University Press.
Garnefski, Nadia, Van Den Kommer, Tessa, Kraaij, Vivian, Teerds, Jan, Legerstee, Jeroen
& Onstein, Evert. (2002). The relationship between cognitive emotion regulation strategies and
emotional problems: comparison between a clinical and a non- clinical sample. European
Journal of Personality, 16(5), 403–420.
Geddes, J. R. (1999). Prenatal and perinatal and perinatal risk factors for early onset
schizophrenia, affective psychosis, and reactive psychosis. BMJ, 318(7181), 426.
Geddes, J. R. & Lawrie, S. M. (1995). Obstetric complications and schizophrenia: a meta-
analysis. British Journal of Psychiatry, 167(6), 786–793.
Gilman, Sander L. (1988). Disease and representation: Images of illness from madness to AIDS:
Cornell University Press Ithaca, NY.
Glaser, B., Ades, A.E., Lewis, S., Emmet, P., Lewis, G., Davey Smith, G. & Zammit, S. (2010).
Perinatal folate-related exposures and risk of psychotic symptoms in the ALSPAC birth
cohort. Schizophrenia Research, 120(1–3), 177–183.
Golding, J. (2004). The Avon Longitudinal Study of Parents and Children (ALSPAC)—study
design and collaborative opportunities. European Journal of Endocrinology, 151, 119–
123.
Goldstein, J. M., Seidman, L. J., Buka, S. L., Horton, N. J., Donatelli, J. L., Rieder, R. O. &
Tsuang, M. T. (2000). Impact of genetic vulnerability and hypoxia on overall intelligence
by age 7 in offspring at high risk for schizophrenia compared with affective psychoses.
Schizophrenia Bulletin, 26(2), 323–334.
Golembo-Smith, S., Schiffman, J., Kline, E., Sørensen, H. J., Mortensen, E. L., Stapleton, L., . . .
Mednick, S. (2012). Premorbid multivariate markers of neurodevelopmental instability in
CHILDHOOD DEVELOPMENT FACTORS AND RISK OF PSYCHOTIC EXPERIENCES 256
the prediction of adult schizophrenia-spectrum disorder: A high-risk prospective
investigation. Schizophrenia Research, 139(1–3), 129–135.
Goodman, R. (1988). Are complications of pregnancy and birth causes of schizophrenia?
Developmental Medicine & Child Neurology, 30(3), 391–395.
Goodman, R., Ford, T., Richards, H., Gatward, R. & Meltzer, H. (2000). The Development and
Well-Being Assessment: Description and initial validation of an integrated assessment of
child and adolescent psychopathology. Journal of Child Psychology and Psychiatry, 41(5),
645–655.
Goodman, S. H. (1987). Emory university project on children of disturbed parents. Schizophrenia
Bulletin, 13(3), 412–423.
Gottesman, I. I. (1991). Schizophrenia genesis: The origins of madness. New York: W. H.
Freeman and Company.
Gottesman, I. I. & Gould, T. D. (2003). The nndophenotype concept in psychiatry: Ethmology and
strategic intentions. American Journal of Psychiatry, 160(4), 636– 645.
Gottesman, I. I. & Shields, J. (1967). A polygenic theory of schizophrenia. Proceedings of the
National Academy of Sciences, 58(1), 199–205.
Gottesman, I. I., Shields, J. & Hanson, D. R. (1982). Schizophrenia: The epigenetic puzzle. New
York: Cambridge University Press.
Gourion, D., Goldberger, C., Bourdel, M. C., Jean Bayle, F., Loo, H. & Krebs, M. O. (2004).
Minor physical anomalies in patients with schizophrenia and their parents: Prevalence and
pattern of craniofacial abnormalities. Psychiatry Research, 125(1), 21–28.
Green, M. F., Kern, R. S., Braff, D. L., & Mintz, J. (2000). Neurocognitive deficits and functional
outcome in schizophrenia. Schizophrenia Bulletin, 26(1), 119-136.
Green, M. F. & Leitman, D. I. (2008). Social cognition in schizophrenia. Schizophrenia Bulletin,
34(4), 670–672.
Green, M. F., Penn, D. L., Bentall, R., Carpenter, W. T., Gaebel, W., Gur, R. C., . . . Heinssen, R.
(2008). Social cognition in schizophrenia: an NIMH workshop on definitions, assessment,
and research opportunities. Schizophrenia Bulletin, 34(6), 1211–1220.
CHILDHOOD DEVELOPMENT FACTORS AND RISK OF PSYCHOTIC EXPERIENCES 257
Green, M. F., Satz, P., Gaier, D. J., Ganzell, S. & Kharabi, F. (1989). Minor physical anomalies in
schizophrenia. Schizophrenia Bulletin, 15(1), 91–99.
Green, M. F. & William, P. (2010). Social cognition in schizophrenia. Current Directions in
Psychological Science, 19(4), 243–248.
Gunawardana, L., Zammit, S., Lewis, G., Gunnell, D., Hollis, C., Wolke, D. & Harrison, G.
(2011). Examining the association between maternal analgesic use during pregnancy and
risk of psychotic symptoms during adolescence. Schizophrenia Research, 126, 220–225.
Hafner, H. (2004). Schizophrenia: Still Kraepelin’s dementia praecox? Epidemiologia e
psichiatria social, 13(2), 99–112.
Hallmayer, J., Kalaydjieva, L., Badcock, J., Dragovic, M., Howell, S., Michie, P. T., . . .
Jablensky, A. (2005). Genetic evidence for a distinct subtype of schizophrenia
characterized by pervasive cognitive deficit. American Journal of Human Genetetics, 77,
468—476.
Handley, Simon J., Capon, A., Beveridge, M., Dennis, I. & Evans, J. St B. T. (2004). Working
memory, inhibitory control and the development of children’s reasoning. Thinking &
Reasoning, 10(2), 175–195.
Hans, S. L., Auerbach, J. G., Asarnow, J. R., Styr, B. & Marcus, J. (2000). Social adjustment of
adolescents at risk for schizophrenia: The Jerusalem Infant Development Study. Journal of
the American Academy of Child & Adolescent Psychiatry, 39(11), 1406–1414.
Hans, S. L., Marcus, J., Nuechterlein, K.H., Asarnow, R.F., Styr, B. & Auerbach, J.G. (1999).
Neurobehavioral deficits at adolescence in children at risk for schizophrenia: The
Jerusalem Infant Development Study. Archives of General Psychiatry, 56(8), 741.
Hanssen, M., Bak, M., Bijl, R., Vollebergh, W. & van Os, J. (2005). The incidence and outcome
of subclinical psychotic experiences in the general population. British Journal of Clinical
Psycholology, 44(Pt 2), 181–191.
Harrington, Leigh, Siegert, Richard & McClure, John. (2005). Theory of mind in schizophrenia:
A critical review. Cognitive Neuropsychiatry 10(4), 249–286.
Hashimoto, Ryota, Hattori, Satoko, Chiba, Sachie, Yagasaki, Yuki, Okada, Takeya, Kumamaru,
CHILDHOOD DEVELOPMENT FACTORS AND RISK OF PSYCHOTIC EXPERIENCES 258
E. M. I., . . . Kunugi, Hiroshi. (2006). Susceptibility genes for schizophrenia. Psychiatry
and Clinical Neurosciences, 60, S4–S10.
Henderson, S. E. & Sugden, D. A. (1992). Movement assessment battery for children: Manual
San Antonio, TX: Psychological Corporation.
Hibbeln, J. R., Davis, J. M., Steer, C., Emmett, P., Rogers, I., Williams, C. & Golding, J. (2007).
Maternal seafood consumption in pregnancy and neurodevelopmental outcomes in
childhood (ALSPAC study): An observational cohort study. The Lancet, 369(9561), 578–
585.
Hill, R. C., Thomas, B. F. & Johnson, S. R. (1977). Component selection norms for principal
components regression. Communications in Statistics—Theory and Methods, 6(4), 309–
334.
Hill, S. K., Reilly, J. L., Harris, M. S., Rosen, C., Marvin, R. W., Deleon, O. & Sweeney, J. A.
(2009). A comparison of neuropsychological dysfunction in first-episode psychosis
patients with unipolar depression, bipolar disorder, and schizophrenia. Schizophrenia
Research, 113(2–3), 167–175.
Ho, B. C., Wassink, T. H., O’Leary, D. S., Sheffield, V. C. & Andreasen, N. C. (2005). Catechol-
O-methyl transferase Val158Met gene polymorphism in schizophrenia: working memory,
frontal lobe MRI morphology and frontal cerebral blood flow. Molecular Psychiatry,
10(3), 229, 287–298.
Horwood, J., Salvi, G., Thomas, K., Duffy, L., Gunnell, D., Hollis, C., . . . Harrison, G. (2008). IQ
and non-clinical psychotic symptoms in 12-year-olds: Results from the ALSPAC birth
cohort. The British Journal of Psychiatry, 193(3), 185–191.
Hotelling, Harold. (1957). The relations of the newer multivariate statistical methods to factor
analysis. British Journal of Statistical Psychology, 10(2), 69–79.
Hotta, Yuri, Ohnuma, Tohru, Hanzawa, Ryo, Shibata, Nobuto, Maeshima, Hitoshi, Baba, Hajime,
. . . Arai, Heii. (2011). Association study between Disrupted-in- Schizophrenia-1 (DISC1)
and Japanese patients with treatment-resistant schizophrenia (TRS). Progress in Neuro-
Psychopharmacology and Biological Psychiatry, 35(2), 636–639.
CHILDHOOD DEVELOPMENT FACTORS AND RISK OF PSYCHOTIC EXPERIENCES 259
Ingraham, L. J., Kugelmass, S., Frenkel, E., Nathan, M. & Mirsky, A. F. (1995). Twenty- five-
year followup of the Israeli high-risk study: Current and lifetime psychopathology.
Schizophrenia Bulletin, 21(2), 183–192.
Isohanni, I., Jones, P. B., Moilanen, K., Rantakallio, P., Veijola, J., Oja, H., . . . Jarvelin, M. R.
(2001). Early developmental milestones in adult schizophrenia and other psychosis: A 31-
year follow-up of the Northern Finland 1966 Birth Cohort. Schizophrenia Research, 52, 1–
19.
Isohanni, M., Jones, P., Kemppainen, L., Croudace, T., Isohanni, I., Veijola, J., . . . Rantakallio, P.
(2000). Childhood and adolescent predictors of schizophrenia in the Northern Finland
1966 birth cohort—a descriptive life-span model. European Archives of Psychiatry and
Clinical Neuroscience, 250(6), 311–319.
Jeffers, J. N. R. . (1967). Two case studies in the application of principal component analysis.
Applied Statistics, 16(3), 225–236.
Jeffers, J. N. R. . (1981). Investigation of alternative regressions: Some practical examples.
Journal of the Royal Statistical Society. Series D (The Statistician), 30(2), 79–88. Jenkins,
R. , Bebbington, P. , Brugha, T. , Farrell, M. , GIll, B., Lewis, G., . . . Petticrew, M. .
(1997). The National Psychiatric Morbidity Surveys of Great Britain—strategy and
methods. Psychological Medicine, 27(04), 765–774.
Johnstone, E. C., Abukmeil, S.S., Byrne, M., Clafferty, R., Grant, E., Hodges, A., . . . Owens, G.
C. (2000). Edinburgh high risk study—findings after four years: demographic, attainment
and psychopathological issues. Schizophrenia Research, 46(1), 1–15.
Johnstone, E. C., Ebmeier, K. P., Miller, P., Owens, D. G. & Lawrie, S. M. (2005). Predicting
schizophrenia: findings from the Edinburgh High-Risk Study. The British Journal of
Psychiatry 186, 18–25.
Jolliffe, I. T. (1982). A note on the use of principal components in regression. Applied Statistics,
31(3), 300–303.
Jones, P., Rodgers, B., Murray, R. & Marmot, M. (1994). Child developmental risk factors for
adult schizophrenia in the British 1946 birth cohort. The Lancet, 344(8934), 1398–1402.
CHILDHOOD DEVELOPMENT FACTORS AND RISK OF PSYCHOTIC EXPERIENCES 260
Jung, T. & Wickrama, KAS. (2007). An introduction to latent class growth analysis and growth
mixture modeling. Social and Personality Psychology Compass, 2(1), 302–317.
Kaiser, H. F. . (1960). The Application of Electronic Computers to Factor Analysis. Educational
and Psychological Measurement, 20(1), 141–151.
Kapur, S. (2003). Psychosis as a state of aberrant salience: a framework linking biology,
phenomenology, and pharmacology in schizophrenia. American Journal of Psychiatry,
160(1), 13–23.
Kirkbride, J. B., Susser, E., Kundakovic, M., Kresovich, J. K., Davey Smith, G., & Relton, C. L.
(2012). Prenatal nutrition, epigenetics and schizophrenia risk: Can we test causal effects?
Epigenomics, 4(3), 303-315.
Kaymaz, N., Drukker, M., Lieb, R., Wittchen, H. U., Werbeloff, N. & Weiser, M. (2012). Do
subthreshold psychotic experiences predict clinical outcomes in unselected non- help-
seeking population-based samples? A systematic review and meta-analysis, enriched with
new results. Psycholological Medicine, Jan 20, 1–15.
Kempton, M. J., Stahl, D., Williams, S. C. R. & DeLisi, L. E. (2010). Progressive lateral
ventricular enlargement in schizophrenia: A meta-analysis of longitudinal MRI studies.
Schizophrenia Research, 120(1–3), 54–62.
Keshavan, M. (1999). Development, disease and degeneration in schizophrenia: A unitary
pathophysiological model. Journal of Psychiatric Research, 33(6), 513–521.
Keshavan, M. & Hogarty, G. E. (1999). Brain maturational processes and delayed onset in
schizophrenia. Development and Psychopathology, 11(03), 525–543.
Keshavan, M. S., Diwadkar, V. A., Montrose, D. M., Rajarethinam, R. & Sweeney, J. A. (2005).
Premorbid indicators and risk for schizophrenia: A selective review and update.
Schizophrenia Research, 79(1), 45–57.
Kirov, G, Ivanov, D, Williams, NM, Preece, A, Nikolov, I, Milev, R, . . . Owen, MJ. (2004).
Strong evidence for association between the dystrobrevin binding protein 1 gene
(DTNBP1) and schizophrenia in 488 parent-offspring trios from Bulgaria. Biological
Psychiatry, 55, 971—975.
CHILDHOOD DEVELOPMENT FACTORS AND RISK OF PSYCHOTIC EXPERIENCES 261
Klingberg, T., Ferneli, E., Olesen, P. J., Johnson, M., Gustafson, P., Dahlstrom, K., . . .
Westerberg, H. (2005). Computerised training of working memory in children with
ADHD: A randomised controlled trial. Journal of American Academic Child and
Adolescence Psychiatry, 42(2), 177–186.
Knowles, E.E.M., David, A.S. & Reichenberg, A. (2010). Processing speed deficits in
schizophrenia: Reexamining the evidence. American Journal of Psychiatry, 167(7), 828–
835.
Knowles, L. & Sharma, T. (2004). Identifying vulnerability markers in prodromal patients: A step
in the right direction for schizophrenia prevention. CNS Spectrums, 9(8), 595–602.
Koelkebeck, K., Pedersen, A., Suslow, T., Kueppers, K. A., Arolt, V. & Ohrmann, P. (2010).
Theory of Mind in first-episode schizophrenia patients: Correlations with cognition and
personality traits. Schizophrenia Research, 119(1–3), 115–123.
Korkman, M., Kirk, U. & Kemp, S. (2007). NEPSY–Second edition (NEPSY II). San Antonio:
The Psychological Corporation.
Kraemer, H.C., Lowe, K.K. & Kupfer, D.J. (2005). To your health: How to understand what
research tells us about risk: Oxford University Press, USA.
Kraepelin, E. (1904). Lectures on clinical psychiatry: New York, NY, US: William Wood & Co.
xiii.
Langdon, Robyn, Corner, Tonia, McLaren, Jen, Ward, Philip B. & Coltheart, Max. (2006).
Externalizing and personalizing biases in persecutory delusions: The relationship with
poor insight and theory-of-mind. Behaviour Research and Therapy, 44(5), 699–713.
Laurens, K. R. , Hodgins, S. , Maughan, B. , Murray, R. M. , Rutter, M. L. & Taylor, E. A.
(2007). Community screening for psychotic-like experiences and other putative
antecedents of schizophrenia in children aged 9–12 years. Schizophrenia Research, 90(1–
3), 130–146.
Laurens, K. R., West, S. A., Murray, R. M. & Hodgins, S. (2008). Psychotic-like experiences and
other antecedents of schizophrenia in children aged 9–12 years: a comparison of ethnic
and migrant groups in the United Kingdom. Psychological Medicine, 38(08), 1103–1111.
CHILDHOOD DEVELOPMENT FACTORS AND RISK OF PSYCHOTIC EXPERIENCES 262
Lawrie, S. M., Whalley, H., Kestelman, J. N., Abukmeil, S. S., Byrne, M., Hodges, A., . . .
Johnstone, E. C. (1999). Magnetic resonance imaging of brain in people at high risk of
developing schizophrenia. The Lancet, 353(9146), 30–33.
Lenzenweger, M. F. (2006). Schizotaxia, schizotypy, and schizophrenia: Paul E. Meehl’s
blueprint for the experimental psychopathology and genetics of schizophrenia. Journal of
Abnormal Psychology, 115(2), 195–200.
Lewis, A. J. . (2008). Neuropsychological deficit and psychodynamic defense models of
schizophrenia: towards an integrated model. In J. Gleeson, E. Killackey & H. Krstev
(Eds.), Psychotherapies for the psychoses: Theoretical, cultural and clinical integration
(pp. 52–69): Routledge.
Lewis, A. J. & Olsson, C. A. (2011). Early life stress and child temperament style as predictors of
childhood anxiety and depressive symptoms: Findings from the Longitudinal Study of
Australian Children. Depression Research and Treatment, 2011, 9.
Lieberman, Jeffrey A. (1999). Is schizophrenia a neurodegenerative disorder? a clinical and
neurobiological perspective. Biological Psychiatry, 46(6), 729–739.
Lincoln, Tania, Mehl, Stephanie, Exner, Cornelia, Lindenmeyer, Johannes & Rief, Winfried.
(2010). Attributional style and persecutory delusions. Evidence for an event independent
and state specific external-personal attribution bias for social situations. Cognitive Therapy
and Research, 34(3), 297–302.
Liu, N., Zhang, K. & Zhao, H. (2008). Haplotype-Association Analysis. Advances in Genetics, 60,
335–405.
Logan, Gordon D., Cowan, William B. & Davis, Kenneth A. (1984). On the ability to inhibit
simple and choice reaction time responses: A model and a method. Journal of
Experimental Psychology: Human Perception and Performance, 10(2), 276–291.
Mandal, Manas K., Pandey, Rakesh & Prasad, Akhouri B. (1998). Facial expressions of emotions
and schizophrenia: A review. Schizophrenia Bulletin, 24(3), 399–412.
Marcus, J., Auerbach, J. , Wilkinson, L. & Burack, C. M. (1981). Infants at risk for schizophrenia:
The Jerusalem Infant Development Study. Archives of General Psychiatry, 38(6), 703–
CHILDHOOD DEVELOPMENT FACTORS AND RISK OF PSYCHOTIC EXPERIENCES 263
713.
Marcus, J., Hans, S. L., Auerbach, J. G. & Auerbach, A. G. (1993). Children at risk for
schizophrenia: The Jerusalem infant development study. II. Neurobehavioral deficits at
school age. Archives of General Psychiatry, 50, 797–809.
Marcus, J., Hans, S. L., Nagler, S., Auerbach, J. G., Mirsky, A. F. & Aubrey, A. (1987). Review
of the NIMH Israeli Kibbutz-City Study and the Jerusalem Infant Development Study.
Schizophrenia Bulletin, 13(3), 425–438.
Marcus, J., Hans, S., Lewow, E., Wilkinson, L. & Burack, C. M. (1985). Neurological findings in
high-risk children: Childhood assessment and 5-year followup. Schizophrenia Bulletin,
11(1), 85–100.
Markow, T. A. (1992). Genetics and developmental stability: An integrative conjecture on
aetiology and neurobiology of schizophrenia. Psychological Medicine, 22(02), 295–305.
Markow, T. A. & Wandler, K. (1986). Fluctuating dermatoglyphic asymmetry and the genetics of
liability to schizophrenia. Psychiatry Research, 19(4), 323–328.
Marshall, M. & Rathbone, J. (2011). Early intervention for psychosis. Schizophrenia Bulletin,
37(6), 1111–1114.
Martin, James A. & Penn, David L. (2002). Attributional style in schizophrenia: An investigation
in outpatients with and without persecutory delusions. Schizophrenia Bulletin, 28(1), 131–
141.
Massy, William F. (1965). Principal Components Regression in Exploratory Statistical Research.
Journal of the American Statistical Association, 60(309), 234–256. McGrath, J. J., van Os,
J., Hoyos, C., Jones, P. B., Harvey, I. & Murray, R. M. (1995).
Minor physical anomalies in psychoses: Associations with clinical and putative aetiological
variables. Schizophrenia Research, 18(1), 9–20.
McGue, M, Gottesman, II & Rao, DC. (1983). The transmission of schizophrenia under a
multifactorial threshold model. American Journal of Human Genetics, 35(6), 1161.
McGuire, P. K. & Shah, G. M. S. (1993). Increased blood flow in Broca’s area during auditory
hallucinations in schizophrenia. Lancet, 342(8873), 703.
CHILDHOOD DEVELOPMENT FACTORS AND RISK OF PSYCHOTIC EXPERIENCES 264
McNeil, T. F., Harty, B., Blennow, G. & Cantor-Graae, E. (1993). Neuromotor deviation in
offspring of psychotic mothers: A selective developmental deficiency in two groups of
children at heightened psychiatric risk? Journal of Psychiatric Research, 27(1), 39–54.
McNeil, T. F. & Kaij, L. (1987). Swedish high-risk study: Sample characteristics at age 6.
Schizophrenia Bulletin, 13(3), 373–381.
Mednick, S. A., Parnas, J. & Schulsinger, F. (1987). The copenhagen high-risk project, 1962–86.
Schizophrenia Bulletin, 13(3), 485–495.
Meehl, P. E. (1962). Schizotaxia, schizotypy, schizophrenia. American Psychologist, 17(12), 827–
838.
Meehl, P. E. (1989). Schizoataxia revisited. Archives of General Psychiatry, 46, 935—944.
Miller, G.A. & Rockstroh, B. (2013). Endophenotypes in psychopathology Research:
where do we stand? Annual Review of Clinical Psychology, 9(1).
Mirsky, A. F., Kugelmass, S., Ingraham, L. J., Frenkel, E. & Nathan, M. (1995). Overview and
summary: Twenty-five-year followup of high-risk children. Schizophrenia Bulletin, 21(2),
227–239.
Moritz, S., Woodward, T. S., Burlon, M., Braus, D. F. & Andresen, B. (2007). Attributional style
in schizophrenia: Evidence for a decreased sense of self- causation in currently paranoid
patients. Cognitive Therapy & Research, 31(3), 371–383.
Mulle, Jennifer Gladys. (2012). Schizophrenia genetics: progress, at last. Current Opinion in
Genetics & Development, 22(3), 238–244.
Murphy, K C & Owen, M J. (1996). Minor physical anomalies and their relationship to the
aetiology of schizophrenia. The British Journal of Psychiatry, 168(2), 139–142.
Murray, G. K. & Jones, P. B. (2012). Psychotic symptoms in young people without psychotic
illness: Mechanisms and meaning. British Journal of Psychiatry, 201(1), 4–6.
Murray, Robin M., O’Callaghan, Eadbhard, Castle, David J. & Lewis, Shon W. (1992). A
Neurodevelopmental Approach to the Classification of Schizophrenia. Schizophrenia
Bulletin, 18(2), 319–332.
Muthén, LK & Muthén, BO. (2010). Mplus software (Version 6). Los Angeles, CA: Muthén &
CHILDHOOD DEVELOPMENT FACTORS AND RISK OF PSYCHOTIC EXPERIENCES 265
Muthén.
Neale, J. M., Winters, K. C. & Weintraub, S. (1984). Information processing deficits in children at
high risk for schizophrenia. In N. F. Watt, E. J. Anthony, L. Wynne & J. E. Rolf (Eds.),
Children at risk for schizophrenia: A longitudinal perspective (pp. 264–278). New York:
Cambridge University Press.
Neale, M. D. (1997). Neale Analysis of Reading Ability—Revised. Windsor: NFER-Nelson.
Niemi, L. T., Suvisaari, J. M., Haukka, J. K. & Lonnqvist, J. K. (2005). Childhood
predictors of future psychiatric morbidity in offspring of mothers with psychotic disorder:
Results from the Helsinki High-Risk Study. The British Journal of Psychiatry, 186, 108–
114.
Niemi, L. T., Suvisaari, J. M., Haukka, J. K., Wrede, G. & Lonnqvist, J. K. (2004). Cumulative
incidence of mental disorders among offspring of mothers with psychotic disorder. Results
from the Helsinki High-Risk Study. The British Journal of Psychiatry, 185, 11–17.
Niemi, L. T., Suvisaari, J. M., Tuulio-Henriksson, A. & Lonnqvist, J. K. (2003). Childhood
developmental abnormalities in schizophrenia: Evidence from high-risk studies.
Schizophrenia Research, 60(2–3), 239–258.
Nicodemus, K., Marenco, S., Batten, A., Vakkalanka, R., Egan, M., Straub, R., & Weinberger, D.
(2008). Serious obstetric complications interact with hypoxia- regulated/vascular-
expression genes to influence schizophrenia risk. Molecular Psychiatry, 13(9), 873-877.
Niendam, T. A., Bearden, C. E., Rosso, I. M., Sanchez, L. E., Hadley, T., Nuechterlein, K. H. &
Cannon, T. D. (2003). A prospective study of childhood neurocognitive functioning in
schizophrenic patients and their siblings. American Journal of Psychiatry, 160(11), 2060–
2062.
Nieratschker, V., Nothen, M. M. & Rietschel, M. (2010). New genetic findings in schizophrenia:
Is there still room for the dopamine hypothesis of schizophrenia? Frontiers in Behavioral
Neuroscience, 4(May), 23.
Noel, M., Peterson, C. C. & Jesso, B. (2008). The relationship of parenting stress and child
temperament to language development among economically disadvantaged preschoolers.
CHILDHOOD DEVELOPMENT FACTORS AND RISK OF PSYCHOTIC EXPERIENCES 266
Journal of Child Language, 35(4), 823–843.
Nordentoft, M., Jeppesen, P., Petersen, L., Bertelsen, M. & Thorup, A. (2009). The rationale for
early intervention in schizophrenia and related disorders. Early Intervention in Psychiatry,
3, S3–S7.
Nuevo, R., Chatterji, S., Verdes, E., Naidoo, N., Arango, C. & Ayuso-Mateos, J. L. (2012). The
continuum of psychotic symptoms in the general population: A cross-national study.
Schizophrenia Bulletin, 38(3), 475–485.
Nunes, Terezinha, Bryant, Peter & Olsson, Jenny. (2003). Learning morphological and
phonological spelling rules: An intervention study. Scientific Studies of Reading, 7(3),
289–307.
Nylund, K.L., Asparouhov, T. & Muthén, B.O. (2007). Deciding on the number of classes in
latent class analysis and growth mixture modeling: A Monte Carlo simulation study.
Structural Equation Modeling, 14(4), 535–569.
O’Connor, M., Harris, J. M., McIntosh, A. M., Owens, D. G., Lawrie, S. M. & Johnstone, E. C.
(2009). Specific cognitive deficits in a group at genetic high risk of schizophrenia.
Psychological Medicine, 6(March), 1–7.
O’Tuathaigh, C. M., Desbonnet, L., Moran, P. M. & Waddington, J. L. (2012). Susceptibility
genes for schizophrenia: Mutant models, endophenotypes and psychobiology. Current
Topics in Behavioral Neurosciences, 12, 209–250.
Ochsner, K. N. (2008). The social-emotional processing stream: Five core constructs and their
translational potential for schizophrenia and beyond. Biological Psychiatry, 64(1), 48–61.
Olin, S. , John, R. S. & Mednick, S. A. (1995). Assessing the predictive value of teacher reports in
a high risk sample for schizophrenia: a ROC analysis. Schizophrenia Research, 16(1), 53–
66.
Olin, S. & Mednick, S. A. (1996). Risk factors of psychosis: Identifying vulnerable populations
premorbidly. Schizophrenia Bulletin, 22(2), 223–240.
Osler, M., Lawlor, D. A. & Nordentoft, M. (2007). Cognitive function in childhood and early
adulthood and hospital admission for schizophrenia and bipolar disorders in Danish men
CHILDHOOD DEVELOPMENT FACTORS AND RISK OF PSYCHOTIC EXPERIENCES 267
born in 1953. Schizophrenia Research, 92(1–3), 132–141.
Owens, D. G. & Johnstone, E. C. (2006). Precursors and prodromata of schizophrenia: Findings
from the Edinburgh High Risk Study and their literature context. Psychological Medicine,
36(11), 1501–1514.
Parnas, J., Cannon, T. D. , Jacobsen, B. , Schulsinger, H. , Schulsinger, F. & Mednick, S. A.
(1993). Lifetime DSM-III-R diagnostic outcomes in the offspring of schizophrenic
mothers: Results from the copenhagen high-risk study. Archives of General Psychiatry,
50(9), 707–714.
Parnas, J., Schulsinger, F., Schulsinger, H., Mednick, S. & Teasdale, T. W. (1982). Behavioral
precursors of schizophrenia spectrum: A prospective study. Archives of General
Psychiatry, 39, 658–664.
Parnas, J., Schulsinger, F., Teasdale, T. W., Schulsinger, H., Feldman, P. M & Mednick, S. A.
(1982). Perinatal complications and clinical outcome within the schizophrenia spectrum.
The British Journal of Psychiatry, 140(4), 416–420.
Pembrey, M. (2004). The Avon Longitudinal Study of Parents and Children (ALSPAC): a
resource for genetic epidemiology. European Journal of Endocrinology, 151, 125–129.
Perez-Neri, I., Ramirez-Bermudez, J., Montes, S. & Rios, C. (2006). Possible mechanisms of
neurodegeneration in schizophrenia. Neurochemical Research, 31(10), 1279–1294.
Petryshen, T. L., Middleton, F. A., Kirby, A., Aldinger, K. A., Purcell, S., Tahl, A. R., . . . Sklar,
P. (2004). Support for involvement of neuregulin 1 in schizophrenia pathophysiology.
Moleclular Psychiatry, 10(4), 366–374.
Polanczyk, G., Moffitt, T. E. , Arseneault, L., Cannon, M., Ambler, A., Keefe, R. S., . . . Caspi, A.
(2010). Etiological and clinical features of childhood psychotic symptoms: Results from a
birth cohort. Archives of General Psychiatry, 67(4), 328–338.
Poletti, Sara, Radaelli, Daniele, Cavallaro, Roberto, Bosia, Marta, Lorenzi, Cristina, Pirovano,
Adele, . . . Benedetti, Francesco. (2012). Catechol-O-methyltransferase (COMT) genotype
biases neural correlates of empathy and perceived personal distress in schizophrenia.
Comprehensive Psychiatry, article in press.
CHILDHOOD DEVELOPMENT FACTORS AND RISK OF PSYCHOTIC EXPERIENCES 268
Poulton, R., Caspi, A., Moffitt, T. E., Cannon, M., Murray, R. & Harrington, H. (2000).
Children’s self-reported psychotic symptoms and adult schizophreniform disorder: a 15-
year longitudinal study. Archives of General Psychiatry, 57(11), 1053–1058. Preti, A.,
Sardu, C. & Piga, A. (2007). Mixed-handedness is associated with the reporting of
psychotic-like beliefs in a non-clinical Italian sample. Schizophrenia Research, 92(1–3),
15–23.
Pulver, Ann E., Karayiorgou, Maria, Wolyniec, Paula S., Lasseter, Virginia K., Kasch, Laura,
Nestadt, Gerald, . . . Childs, Barton. (1994). Sequential strategy to identify a susceptibility
gene for schizophrenia: Report of potential linkage on chromosome 22q12-q13.1: Part 1.
American Journal of Medical Genetics, 54(1), 36–43.
Randall, Fiona, Corcoran, Rhiannon, Day, Jennifer & Bentall, Richard. (2003). Attention, theory
of mind, and causal attributions in people with persecutory delusions: A preliminary
investigation. Cognitive Neuropsychiatry 8(4), 287–294.
Rapoport, J. L., Addington, A. M., Frangou, S. & Psych, M. R. C. (2005). The
neurodevelopmental model of schizophrenia: update 2005. Molecular Psychiatry, 10(5),
434–449.
Rapoport, J. L., Giedd, J. N. & Gogtay, N. (2012). Neurodevelopmental model of schizophrenia:
Update 2012. Molecular Psychiatry, 17(12), 1228–1238.
Reichenberg, A. & Harvey, P. D. (2007). Neuropsychological impairments in schizophrenia:
Integration of performance-based and brain imaging findings. Psychological Bulletin,
133(5), 833–858.
Rieder, R. O., Broman, S. H. & Rosenthal, D. (1977). The offspring of schizophrenics: II.
Perinatal factors and IQ. Archives of General Psychiatry, 34, 789–799. Robertson, Ian H.,
Ward, Tony, Ridgeway, Valerie & Nimmo-Smith, Ian. (1996). The structure of normal
human attention: The Test of Everyday Attention. Journal of the International
Neuropsychological Society, 2(06), 525–534.
Rolf, J. E. (1972). The social and academic competence of children vulnerable to schizophrenia
and other behavior pathologies. Journal of Abnormal Psychology, 80(3), 225–243.
CHILDHOOD DEVELOPMENT FACTORS AND RISK OF PSYCHOTIC EXPERIENCES 269
Rosa, A., Peralta, V., Cuesta, M. J. , Zarzuela, A. , Serrano, F. , Martínez-Larrea, A. & Fañanás,
L. . (2004). New evidence of association between COMT gene and prefrontal
neurocognitive function in healthy individuals from sibling pairs discordant for psychosis.
The American Journal of Psychiatry, 161, 1110–1112.
Rosa, A., van Os, J., Fananas, L., Barrantes, N., Caparros, B., Gutierrez, B. & Obiols, J. (2000).
Developmental instability and schizotypy. Schizophrenia Research, 43(2–3), 125–134.
Rössler, Wulf, Riecher-Rössler, Anita, Angst, Jules, Murray, Robin, Gamma, Alex, Eich,
Dominque, . . . Gross, Vladeta Ajdacic. (2007). Psychotic experiences in the general
population: A twenty-year prospective community study. Schizophrenia Research, 92(1–
3), 1–14.
Rothman, K. J., Greenland, S. & Lash, T.L. (2008). Modern epidemiology: Lippincott Williams &
Wilkins.
Rust, J. ( 1996). Wechsler Objective Language Dimensions: Manual. London, UK: The
Psychological Corporation.
Rust, J., Golombok, S. & Trickey, G. (1993). WORD, Wechsler Objective Reading Dimensions
Manual: Psychological Corporation.
Sameroff, A., Barocas, R. & Seifer, R. (1984). The early development of children born to
mentally ill women. In N. F. Watt, E. J. Anthony, L. Wynne & J. E. Rolf (Eds.), Children
at risk for schizophrenia: A longitudinal perspective. New York: Cambridge University
Press.
Sameroff, A., Seifer, R., Zax, M. & Barocas, R. (1987). Early indicators of developmental risk:
Rochester longitudinal study. Schizophrenia Bulletin, 13(3), 383–394.
Saperstein, Alice M. & Medalia, Alice. (2012). The empirical basis for the practice of cognitive
remediation for schizophrenia. Neuropsychiatry, 2(2), 101–109.
Saykin, A. J., Shtasel, D. L., Gur, R. E., Kester, D. B., Mozley, L. H., Stafiniak, P & Gur, R. C.
(1994). Neuropsychological deficits in neuroleptic naive patients with first- episode
schizophrenia. Archives of General Psychiatry, 51(2), 124–131.
Schaid, Daniel J., Rowland, Charles M., Tines, David E., Jacobson, Robert M. & Poland, Gregory
CHILDHOOD DEVELOPMENT FACTORS AND RISK OF PSYCHOTIC EXPERIENCES 270
A. (2002). Score tests for association between traits and haplotypes when linkage phase is
ambiguous. The American Journal of Human Genetics, 70(2), 425–434.
Schiffman, J., Ekstrom, M., LaBrie, J., Schulsinger, F., Sorensen, H. & Mednick, S. (2002).
Minor physical anomalies and schizophrenia spectrum disorders: a prospective
investigation. American Journal of Psychiatry, 159(2), 238–243.
Schiffman, Jason, Pestle, Sarah, Mednick, Sara, Ekstrom, Morten, Sorensen, Holger & Mednick,
Sarnoff. (2005). Childhood laterality and adult schizophrenia spectrum disorders: a
prospective investigation. Schizophrenia Research, 72(2–3), 151–160.
Schreier, A., Wolke, D, Thomas, K., Horwood, J., Hollis, C., Gunnell, D., . . . Harrison, G.
(2009). Prospective study of peer victimization in childhood and psychotic symptoms in a
nonclinical population at age 12 years. Archives of General Psychiatry, 66(5), 527–536.
Schubert, E. W. & McNeil, T. F. (2003). Prospective study of adult mental disturbance in
offspring of women with psychosis. Archives of General Psychiatry, 60(5), 473–480.
Schubert, E.W. & McNeil, T.F. (2004). Prospective study of neurological abnormalities in
offspring of women with psychosis: Birth to adulthood. American Journal of Psychiatry,
161(6), 1030–1037.
Seshadri, Saurav, Kamiya, Atsushi, Yokota, Yukako, Prikulis, Ingrid, Kano, Shin-ichi, Hayashi-
Takagi, Akiko, . . . Sawa, Akira. (2010). Disrupted-in-Schizophrenia-1 expression is
regulated by -site amyloid precursor protein cleaving enzyme-1– neuregulin cascade.
Proceedings of the National Academy of Sciences, 107(12), 5622–5627.
Shaffer, David, Fisher, Prudence, Lucas, Christopher P., Dulcan, Mina K. & Schwab- Stone,
Mary E. (2000). NIMH Diagnostic Interview Schedule for Children Version IV (NIMH
DISC-IV): Description, Differences From Previous Versions, and Reliability of Some
Common Diagnoses. Journal of the American Academy of Child & Adolescent Psychiatry,
39(1), 28–38.
Sivkov, S. T. & Akabaliev, V. H. (2003). Minor physical anomalies in schizophrenic patients and
normal controls. Psychiatry, 66(3), 222–233.
Sivkov, S. T. & Akabaliev, V. H. (2004). Discriminating value of total minor physical anomaly
CHILDHOOD DEVELOPMENT FACTORS AND RISK OF PSYCHOTIC EXPERIENCES 271
score on the Waldrop physical anomaly scale between schizophrenia patients and normal
control subjects. Schizophrenia Bulletin, 30(2), 361–366.
Smith, G. & Campbell, F. . (1980). A Critique of Some Ridge Regression Methods. Journal of the
American Statistical Association, 75(369), 74–81.
Sohlberg, S. C. (1985). Personality and neuropsychological perfromance of high-risk children.
Schizophrenia Bulletin, 11(1), 48–60.
Sohlberg, S. C. & Yaniv, S. (1985). Social adjustment and cognitive perfromance of high- risk
children. Schizophrenia Bulletin, 11(1), 61–65.
Stefansson, H., Petursson, H., Sigurdsson, E., Steinthorsdottir, V., Bjornsdottir, S., Sigmundsson,
T., . . . Stefansson, K. (2002). Neuregulin 1 and Susceptibility to Schizophrenia. The
American Journal of Human Genetics, 71(4), 877–892.
Stevens, C., Fanning, J., Coch, D., Sanders, L. & Neville, H. (2008). Neural mechanisms of
selective auditory attention are enhanced by computerized training: Electrophysiological
evidence from language-impaired and typically developing children. Brain Research,
1205, 55–69.
Stram, D.O. & Seshan, V.E. (2012). Multi-SNP haplotype analysis methods for association
analysis. Methods in Molecular Biology (Clifton, NJ), 850, 423–452.
Strauss, G. P., Allen, D. N., Miski, P., Buchanan, R. W., Kirkpatrick, B. & Carpenter Jr, W. T.
(2012). Differential patterns of premorbid social and academic deterioration in deficit and
nondeficit schizophrenia. Schizophrenia Research, 135(1–3), 134–138.
Sullivan, P. F., Kendler, K. S. & Neale, M. C. (2003). Schizophrenia as a complex trait: Evidence
from a meta-analysis of twin studies. Archives of General Psychiatry, 60(12), 1187–1192.
Szöke, A. , Schürhoff, F. , Méary, A. , Mathieu, F. , Chevalier, F. , Trandafir, A. , . . . Leboyer, M.
. (2006). Lack of influence of COMT and NET genes variants on executive functions in
schizophrenic and bipolar patients, their first-degree relatives and controls. American
Journal of Medical Genetics, 141B(5), 504–512.
Thapar, A., Heron, J., Jones, R. B., Owen, M. J., Lewis, G. & Zammit, S. (2012). Trajectories of
change in self-reported psychotic-like experiences in childhood and adolescence.
CHILDHOOD DEVELOPMENT FACTORS AND RISK OF PSYCHOTIC EXPERIENCES 272
Schizophrenia Research, 140(1–3), 104–109.
Thomas, K., Harrison, G., Zammit, S., Lewis, G., Horwood, J., Heron, J., . . . Gunnell, D. .
(2009). Association of measures of fetal and childhood growth with non-clinical psychotic
symptoms in 12-year-olds: the ALSPAC cohort. The British Journal of Psychiatry, 194,
521–526.
Thompson, A., Sullivan, S, Heron, J., Thomas, K., Zammit, S., Horwood, J., . . . Harrison, G.
(2011). Childhood facial emotion recognition and psychosis-like symptoms in a
nonclinical population at 12 years of age: Results from the ALSPAC birth cohort.
Cognitive Neuropsychiatry 16(2), 136–157.
Thompson, A., Sullivan, S., Lewis, G., Zammit, S., Heron, J., Horwood, J., . . . Harrison, G.
(2011). Association between locus of control in childhood and psychotic symptoms in
early adolescence: Results from a large birth cohort. Cognitive Neuropsychiatry 16(5),
385–402.
Tienari, P., Sorri, A., Lahti, L., Naarala, M., Wahlberg, K. E., Moring, J., . . . Wynne, L. (1987).
Genetic and psychosocial factors in schizophrenia: The Finnish Adoptive Family Study.
Schizophrenia Bulletin, 13(3), 477–484.
Tienari, P., Wahlberg, K.E. & Wynne, L.C. (2006). Finnish adoption study of schizophrenia:
Implications for family interventions. Families, Systems & Health, 24(4), 442.
Tienari, P., Wynne, L. C., Sorri, A., Lahti, I., Laksy, K., Moring, J., . . . Wahlberg, K. E. (2004).
Genotype-environment interaction in schizophrenia-spectrum disorder. Long-term follow-
up study of Finnish adoptees. The British Journal of Psychiatry, 184, 216–222.
Tipping, Michael E. & Bishop, Christopher M. (1999). Probabilistic Principal Component
Analysis. Journal of the Royal Statistical Society: Series B (Statistical Methodology),
61(3), 611–622.
Tu, Yu-Kang & Gilthorpe, M. S. (2007). Revisiting the relation between change and initial value:
A review and evaluation. Statistics in Medicine, 26(2), 443–457.
Van den Stock, Jan, de Jong, Sjakko J., Hodiamont, Paul P. G. & de Gelder, Beatrice. (2011).
Perceiving emotions from bodily expressions and multisensory integration of emotion cues
CHILDHOOD DEVELOPMENT FACTORS AND RISK OF PSYCHOTIC EXPERIENCES 273
in schizophrenia. Social Neuroscience, 6(5–6), 537–547.
Van Dongen, S. & Gangestad, S. W. (2011). Human fluctuating asymmetry in relation to health
and quality: A meta-analysis. Evolution and Human Behavior, 32(6), 380–398.
van Os, J., Hanssen, M., Bijl, R. V. & Ravelli, A. (2000). Strauss (1969) revisited: A psychosis
continuum in the general population? Schizophrenia Research, 45(1–2), 11–20.
Varghese, D., Scott, J., Welham, J., Bor, W., Najman, J., O’Callaghan, M., . . . McGrath, J.
(2011). Psychotic-like experiences in major depression and anxiety disorders: A
population-based survey in young adults. Schizophrenia Bulletin, 37(2), 389–393.
Verdoux, H. & van Os, J. (2002). Psychotic symptoms in non-clinical populations and the
continuum of psychosis. Schizophrenia Research, 54(1–2), 59–65.
Walker, E., Shapiro, D., Esterberg, M. & Trotman, H. (2010). Neurodevelopment and
schizophrenia. Current Directions in Psychological Science, 19(4), 204–208.
Walshe, M., McDonald, C., Taylor, M., Zhao, J., Sham, P., Grech, A., . . . Murray, R. M. (2005).
Obstetric complications in patients with schizophrenia and their unaffected siblings. The
Journal of the Association of European Psychiatrists, 20(1), 28–34.
Wang, P. S., Heinssen, R., Oliveri, M., Wagner, A. & Goodman, W. (2009). Bridging bench and
practice: Translational research for schizophrenia and other psychotic disorders. The
American College of Neuropsychopharmacology, 34(1), 204–212.
Watt, N. F., Grubb, T. W. & Erlenmeyer-Kimling, L. (1982). Social, emotional, and intellectual
behavior at school among children at high risk for schizophrenia. Journal of Consulting
and Clinical Psycholology, 50(2), 171–181.
Weinberg, S. M., Jenkins, E. A., Marazita, M. L. & Maher, B. S. (2007). Minor physical
anomalies in schizophrenia: A meta-analysis. Schizophrenia Research, 89(1–3), 72–85.
Weinberger, D. R. (1986). The pathogenesis of schizophrenia: A neurodevelopmental theory.
Handbook of Schizophrenia, 1, 397–406.
Weintraub, S. (1987). Risk factors in schizophrenia: the Stony Brook High-Risk Project.
Schizophrenia Bulletin, 13(3), 439–450.
Weintraub, S. & Neale, J. M. (1984). The Stony Brook High-Risk Project. In N. F. Watt, E. J.
CHILDHOOD DEVELOPMENT FACTORS AND RISK OF PSYCHOTIC EXPERIENCES 274
Anthony, L. C. Wynne & J. E. Rolf (Eds.), Children at risk for schizophrenia: A
longitudinal perspective. New York: Cambridge University Press.
Welham, J., Scott, J., Williams, G. M., Najman, J. M., Bor, W., O’Callaghan, M. & McGrath, J.
(2010). The antecedents of non-affective psychosis in a birth-cohort, with a focus on
measures related to cognitive ability, attentional dysfunction and speech problems. Acta
Psychiatrica Scandinavica, 121(4), 273–279.
Weller, E. B., Weller, R. A., Fristad, M. A., Rooney, M. T. & Schecter, J. (2000). Children’s
Interview for Psychiatric Syndromes (ChIPS). Journal of the American Academy of Child
& Adolescent Psychiatry, 39(1), 76–84.
Wilson, C., & Terry, A. V. (2010). Neurodevelopmental animal models of schizophrenia: Role in
novel drug discovery and development. Clinical Schizophrenia & Related Psychoses, 4(2),
124-137.
WHO. (1994). Schedules for Clinical Assessment in Neuropsychiatry: American Psychiatric
Research.
Wood, S. J., Pantelis, C., Yung, A. R., Velakoulis, D. & McGorry, P. D. (2009). Brain changes
during the onset of schizophrenia: Implications for neurodevelopmental theories. The
Medical Journal of Australia, 190(4 Suppl), S10–13.
Woodward, N. D., Jayathilake, K. & Meltzer, H. Y. (2007). COMT val108/158met genotype,
cognitive function, and cognitive improvement with clozapine in schizophrenia.
Schizophrenia Research, 90(1–3), 86–96.
Woolf, S. H. (2008). THe meaning of translational research and why it matters. The Journal of
The American Medical Association, 299(2), 211–213.
Worland, J., Janes, C.L., Anthony, E.J., McGinnis, M. & Cass, L. (1984). St. Louis Risk Research
Project: Comprehensive progress report of experimental studies. Worland, J., Lander, H.
CHILDHOOD DEVELOPMENT FACTORS AND RISK OF PSYCHOTIC EXPERIENCES 275
& Hesselbrock, V. (1979). Psychological evaluation of clinical disturbance in children at
risk for psychopathology. Journal of Abnormal Psychology, 88(1), 13–26.
Wrede, G., Mednick, S. A., Huttunen, M. O. & Nilsson, C. G. (1984). Pregnancy and delivery
complications in the births of an unselected series of Finnish children with schizophrenic
mothers: II. In N. F. Watt, E. J. Anthony, L. C. Wynne & J. E. Rolf (Eds.), Children at
risk for schizophrenia: A longitudinal perspective (pp. 482–514). New York: Cambridge
University Press.
Wynne, L. C., Cole, E. & Perkins, P. (1987). University of Rochester child and family study: Risk
research in progress. Schizophrenia Bulletin, 13(3), 463–476.
Yeo, R. A., Gangestad, S. W., Edgar, C. & Thoma, R. J. (1999). The evolutionary genetic
underpinnings of schizophrenia: The developmental instability model. Schizophrenia
Research, 39(3), 197–206.
Yeo, R. A., Gangestad, S. W. & Thoma, R. J. (2007). Developmental instability and individual
variation in brain development: Implications for the origin of neurodevelopmental
disorders. Current Directions in Psychological Science, 16(5), 245–249.
Zammit, S., Horwood, J., Thompson, A., Thomas, K., Menezes, P., Gunnell, D., . . . Harrison, G.
(2008). Investigating if psychosis-like symptoms are associated with family history of
schizophrenia or paternal age in the ALSPAC birth cohort. Schizophrenia Research,
104(1–3), 279–286.
Zammit, S., Odd, D., Horwood, J., Thompson, A., Thomas, K., Menezes, P., . . . Harrison, G.
(2009). Investigating whether adverse prenatal and perinatal events are associated with
non-clinical psychotic symptoms at age 12 years in the ALSPAC birth cohort.
Psychological Medicine, 39 (9), 1457-1467.
Zammit, S., Thomas, K., Thompson, A., Horwood, J., Menezes, P., Gunnell, D., . . . Harrison, G.
(2009). Maternal tobacco, cannabis and alcohol use during pregnancy and risk of
adolescent psychotic symptoms in offspring. The British Journal of Psychiatry, 195, 294–
300.
Zinkstok, J., de Wilde, O., van Amelsvoort, T., Tanck, M., Baas, F. & Linszen, D. (2007).

CHILDHOOD DEVELOPMENT FACTORS AND RISK OF PSYCHOTIC EXPERIENCES 276
Association between the DTNBP1 gene and intelligence: a case-control study in young
patients with schizophrenia and related disorders and unaffected siblings. Behavioral and
Brain Functions, 3(1), 3–19.
Zvolensky, Michael J., Schmidt, Norman B., Bernstein, Amit & Keough, Meghan E. (2006).
Risk-factor research and prevention programs for anxiety disorders: A translational
research framework. Behaviour Research and Therapy, 44(9), 1219–1239.
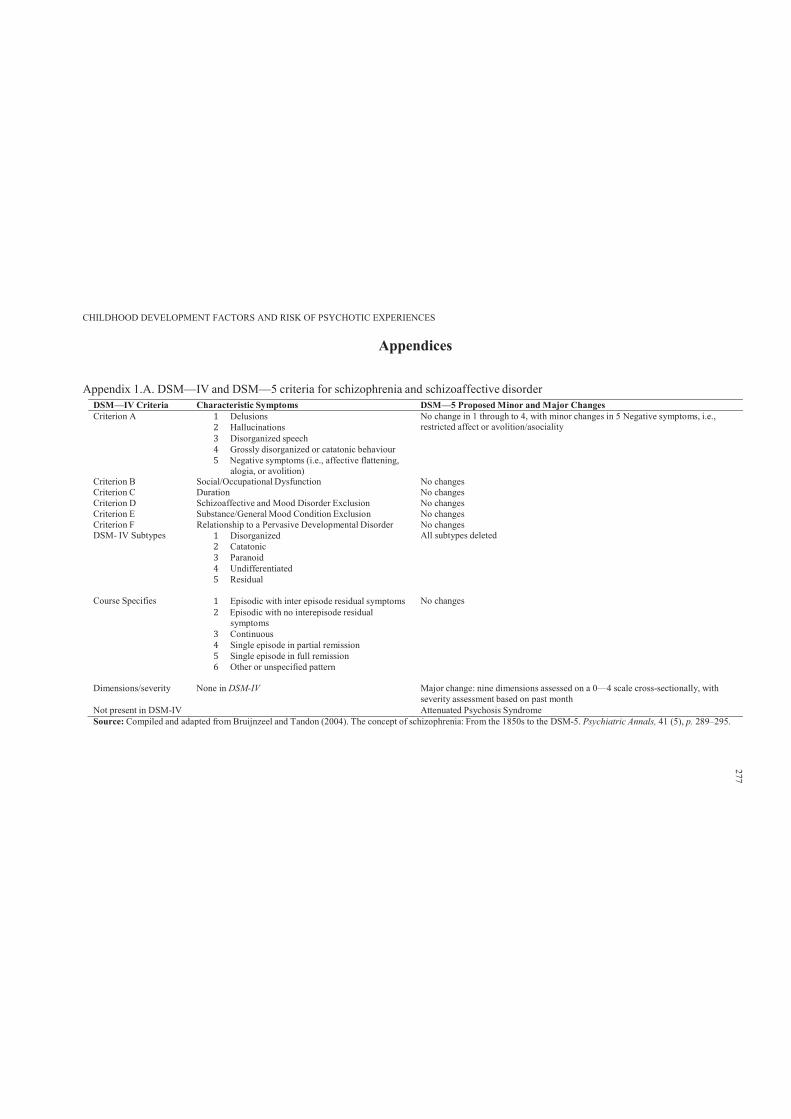
CHILDHOOD DEVELOPMENT FACTORS AND RISK OF PSYCHOTIC EXPERIENCES
Appendices
Appendix 1.A. DSM—IV and DSM—5 criteria for schizophrenia and schizoaffective disorderDSM—IV Criteria Characteristic Symptoms DSM—5 Proposed Minor and Major ChangesCriterion A 1 Delusions2 Hallucinations3 Disorganized speech4 Grossly disorganized or catatonic behaviour5 Negative symptoms (i.e., affective flattening,
alogia, or avolition)
No change in 1 through to 4, with minor changes in 5 Negative symptoms, i.e.,restricted affect or avolition/asociality
Criterion B Social/Occupational Dysfunction No changesCriterion C Duration No changesCriterion D Schizoaffective and Mood Disorder Exclusion No changesCriterion E Substance/General Mood Condition Exclusion No changesCriterion F Relationship to a Pervasive Developmental Disorder No changesDSM- IV Subtypes 1 Disorganized2 Catatonic3 Paranoid4 Undifferentiated5 Residual
All subtypes deleted
Course Specifies 1 Episodic with inter episode residual symptoms2 Episodic with no interepisode residual symptoms3 Continuous4 Single episode in partial remission5 Single episode in full remission6 Other or unspecified pattern
No changes
Dimensions/severity None in DSM-IV Major change: nine dimensions assessed on a 0—4 scale cross-sectionally, with severity assessment based on past month
Not present in DSM-IV Attenuated Psychosis SyndromeSource: Compiled and adapted from Bruijnzeel and Tandon (2004). The concept of schizophrenia: From the 1850s to the DSM-5. Psychiatric Annals, 41 (5), p. 289–295.
277

CHILDHOOD DEVELOPMENT FACTORS AND RISK OF PSYCHOTIC EXPERIENCES 278
Appendix 6.A. ALSPAC Research Proposal and Ethics Approval
From: Katie Green [[email protected]]
Sent: Tuesday, 11 October 2011 2:49 AM
To: MOHAJER ABBASS HAMEED; [email protected]
Cc: Stanley Zammit; [email protected]; [email protected]; AndrewLewis
Subject: Re: ALSPAC Research Proposal (Deakin University Melbourne Australia)
Dear Mohajer,
The Executive committee met on 6th October and are pleased to approve your proposal.
The reference number is B1255, please quote this on all correspondence.
I have copied in Kate Northstone who will be in touch to assign a data buddy to help with the data.
This proposal will incur a Data Buddy Fee, which is a set amount of £702, please could you provide me with a name and address to send the invoice to?
Please also note that I will be monitoring the proposals process and I would thereforeappreciate any updates regarding the project.
Best Wishes
Katie
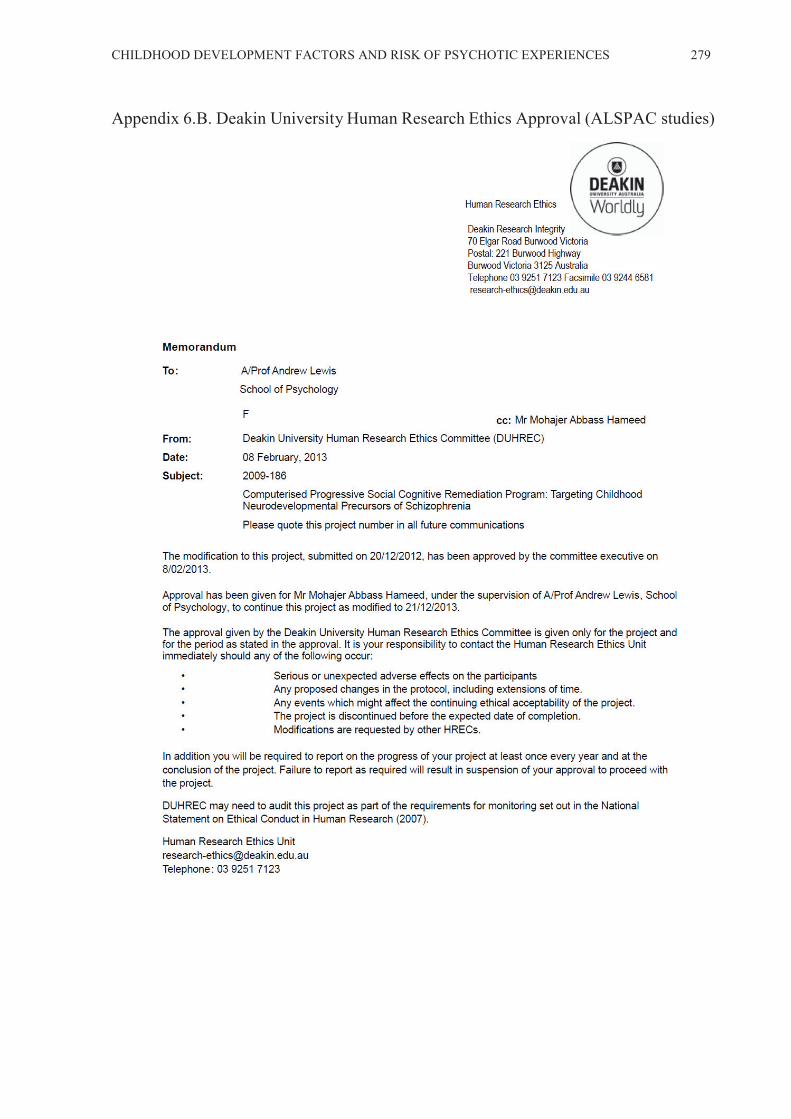
CHILDHOOD DEVELOPMENT FACTORS AND RISK OF PSYCHOTIC EXPERIENCES 279
Appendix 6.B. Deakin University Human Research Ethics Approval (ALSPAC studies)
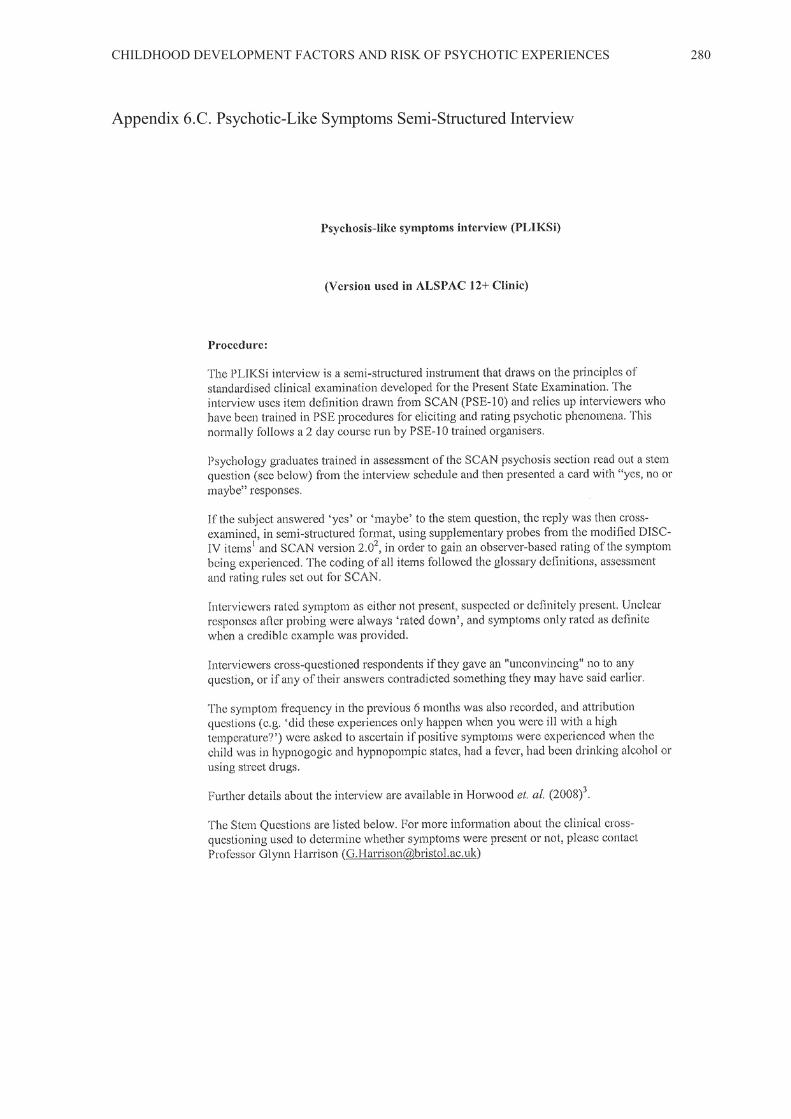
CHILDHOOD DEVELOPMENT FACTORS AND RISK OF PSYCHOTIC EXPERIENCES 280
Appendix 6.C. Psychotic-Like Symptoms Semi-Structured Interview

CHILDHOOD DEVELOPMENT FACTORS AND RISK OF PSYCHOTIC EXPERIENCES 281
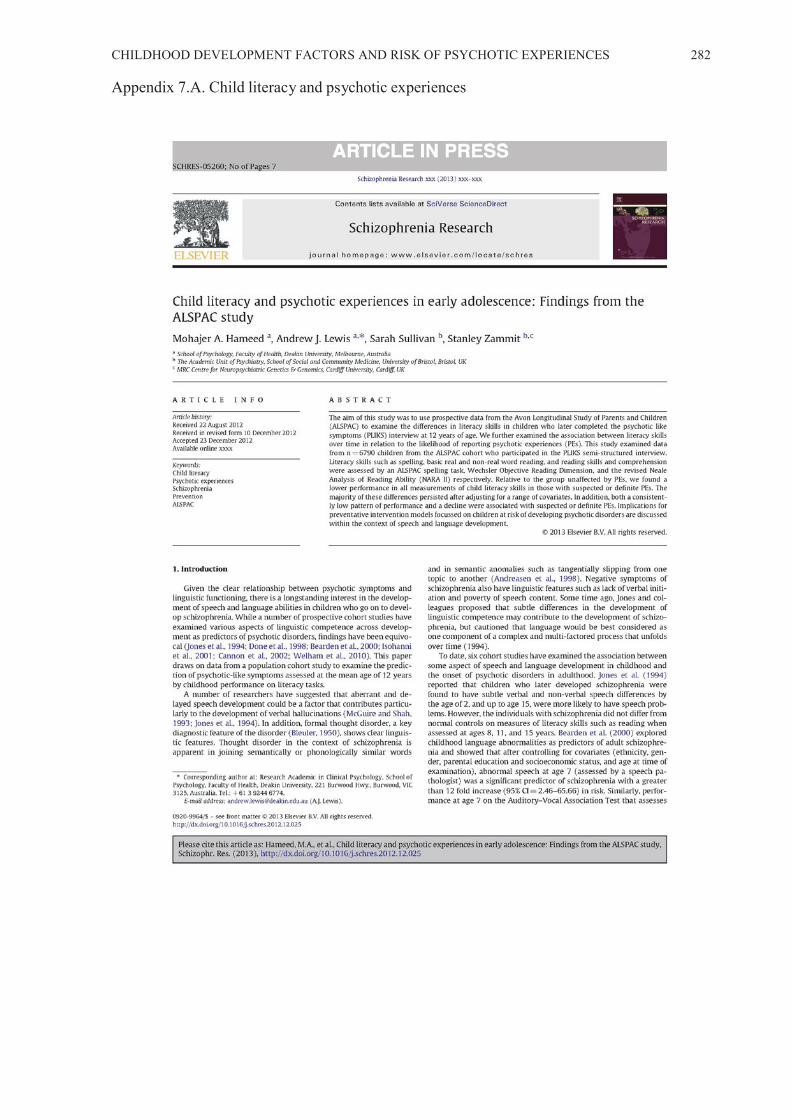
CHILDHOOD DEVELOPMENT FACTORS AND RISK OF PSYCHOTIC EXPERIENCES 282
Appendix 7.A. Child literacy and psychotic experiences
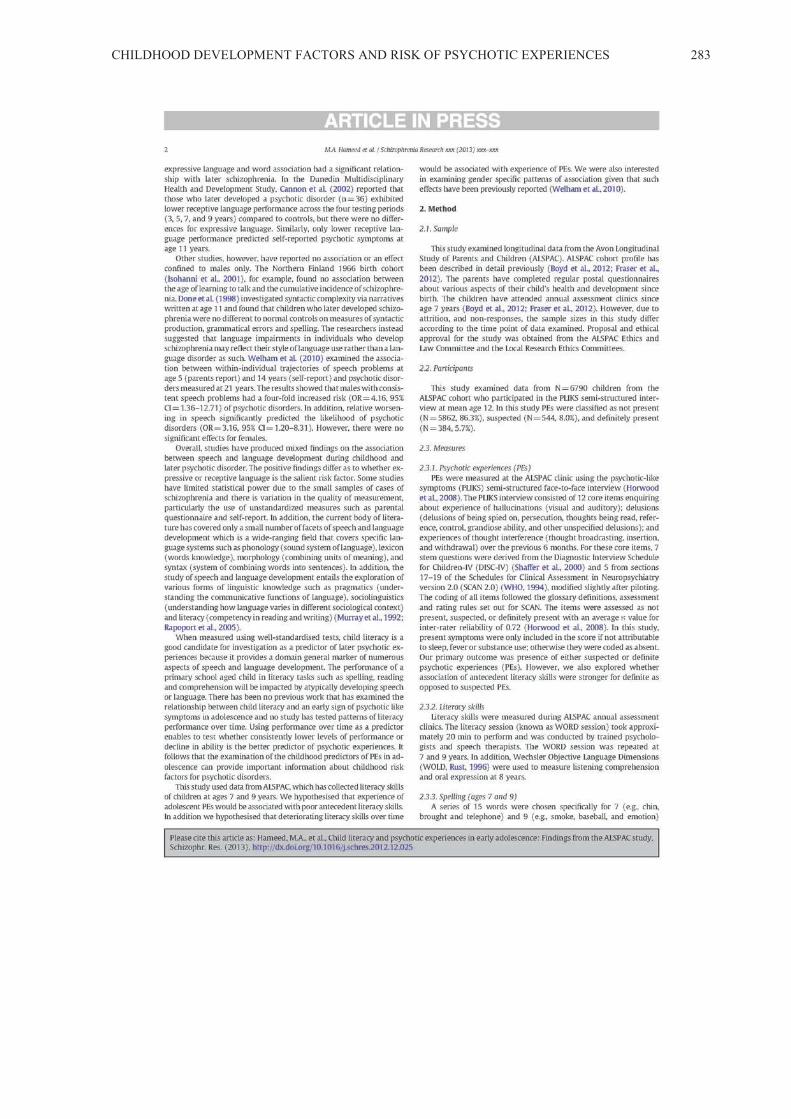
CHILDHOOD DEVELOPMENT FACTORS AND RISK OF PSYCHOTIC EXPERIENCES 283
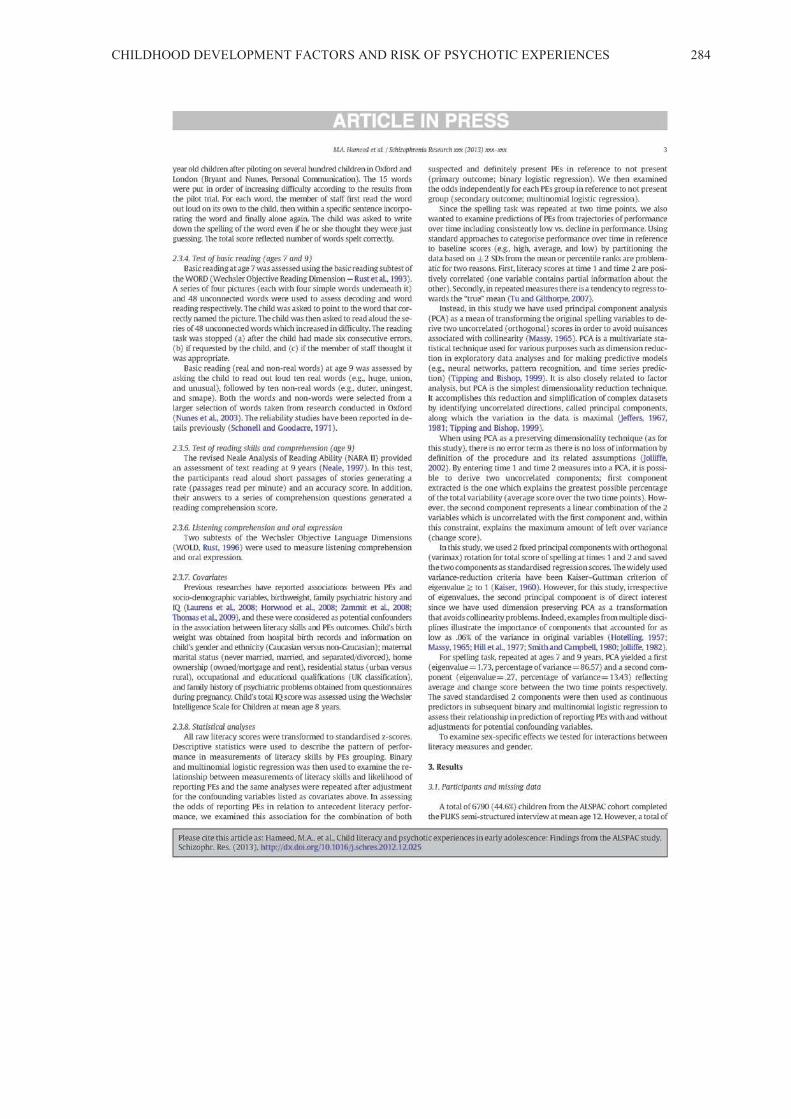
CHILDHOOD DEVELOPMENT FACTORS AND RISK OF PSYCHOTIC EXPERIENCES 284
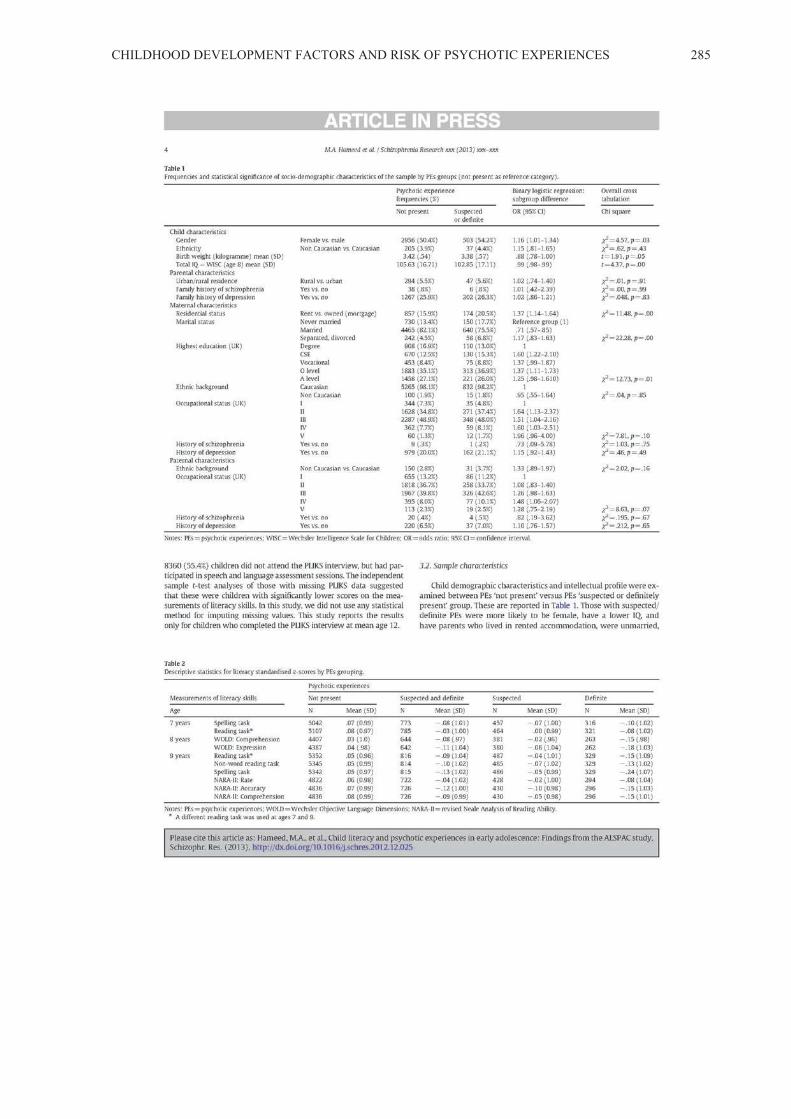
CHILDHOOD DEVELOPMENT FACTORS AND RISK OF PSYCHOTIC EXPERIENCES 285
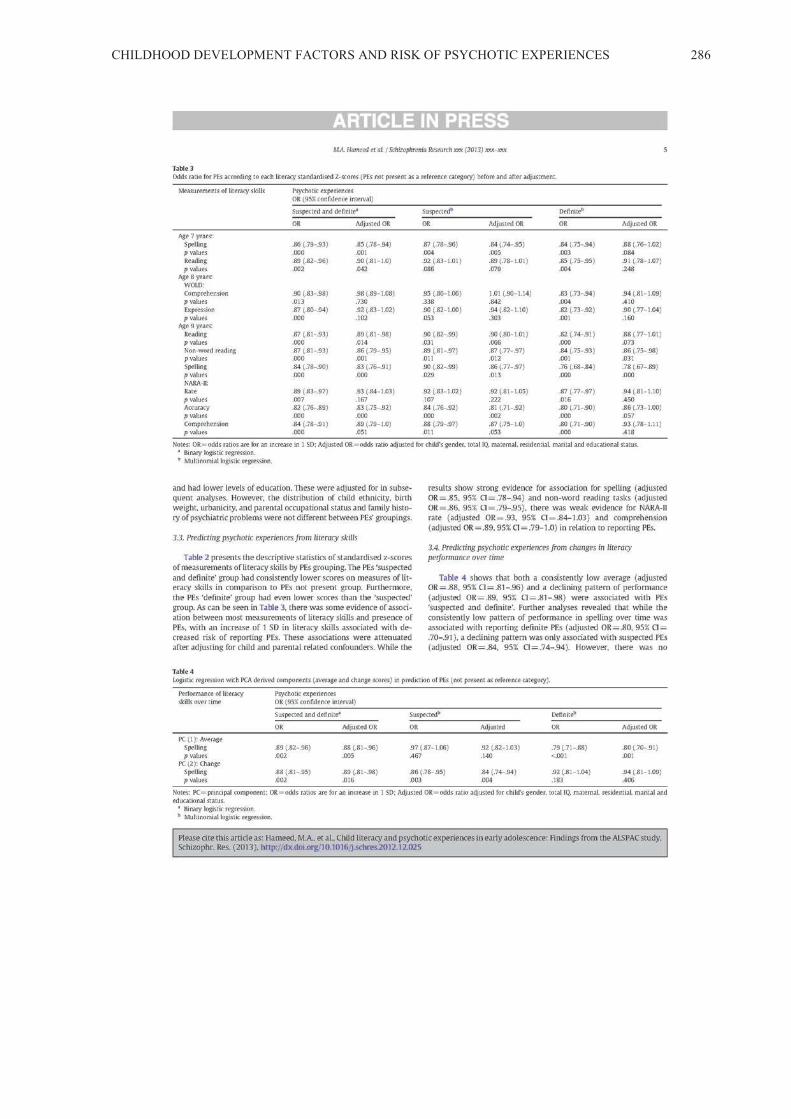
CHILDHOOD DEVELOPMENT FACTORS AND RISK OF PSYCHOTIC EXPERIENCES 286
CHILDHOOD DEVELOPMENT FACTORS AND RISK OF PSYCHOTIC EXPERIENCES 287
CHILDHOOD DEVELOPMENT FACTORS AND RISK OF PSYCHOTIC EXPERIENCES 288
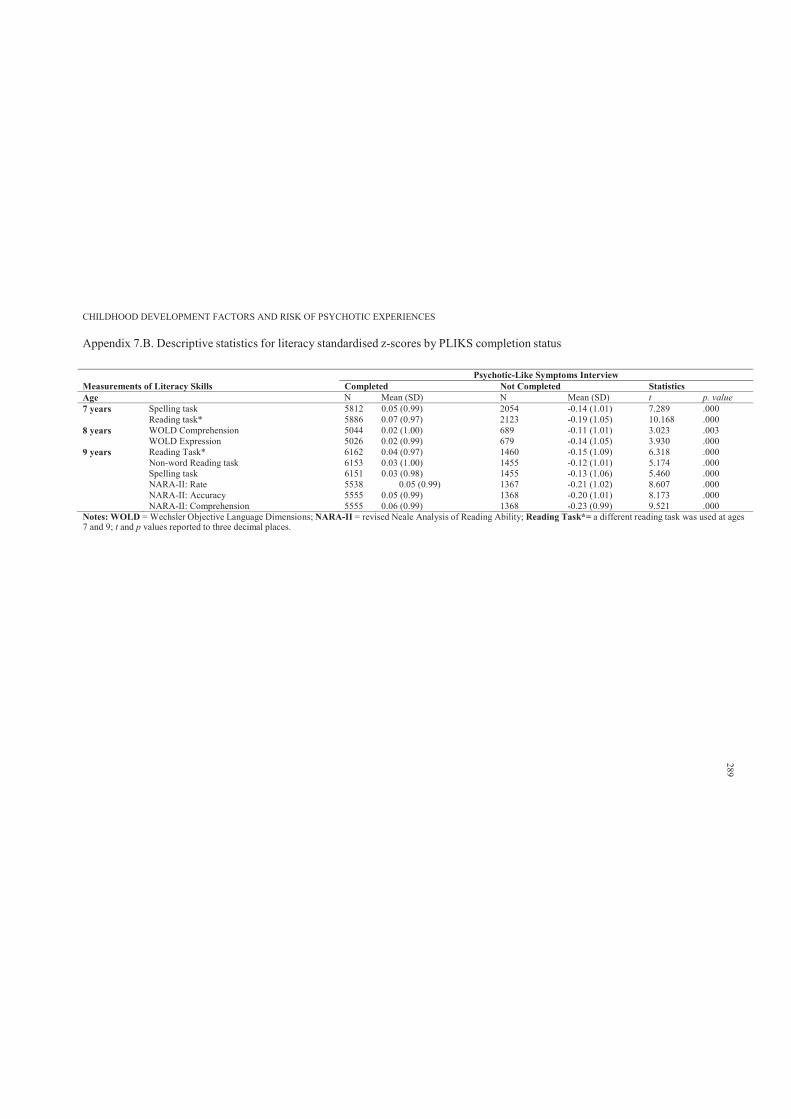
CHILDHOOD DEVELOPMENT FACTORS AND RISK OF PSYCHOTIC EXPERIENCES
Appendix 7.B. Descriptive statistics for literacy standardised z-scores by PLIKS completion status
Psychotic-Like Symptoms Interview Measurements of Literacy Skills Completed Not Completed StatisticsAge N Mean (SD) N Mean (SD) t p. value7 years Spelling task 5812 0.05 (0.99) 2054 -0.14 (1.01) 7.289 .000
Reading task* 5886 0.07 (0.97) 2123 -0.19 (1.05) 10.168 .0008 years WOLD Comprehension 5044 0.02 (1.00) 689 -0.11 (1.01) 3.023 .003
WOLD Expression 5026 0.02 (0.99) 679 -0.14 (1.05) 3.930 .0009 years Reading Task* 6162 0.04 (0.97) 1460 -0.15 (1.09) 6.318 .000
Non-word Reading task 6153 0.03 (1.00) 1455 -0.12 (1.01) 5.174 .000Spelling task 6151 0.03 (0.98) 1455 -0.13 (1.06) 5.460 .000NARA-II: Rate 5538 0.05 (0.99) 1367 -0.21 (1.02) 8.607 .000NARA-II: Accuracy 5555 0.05 (0.99) 1368 -0.20 (1.01) 8.173 .000NARA-II: Comprehension 5555 0.06 (0.99) 1368 -0.23 (0.99) 9.521 .000
Notes: WOLD = Wechsler Objective Language Dimensions; NARA-II = revised Neale Analysis of Reading Ability; Reading Task*= a different reading task was used at ages7 and 9; t and p values reported to three decimal places.
289
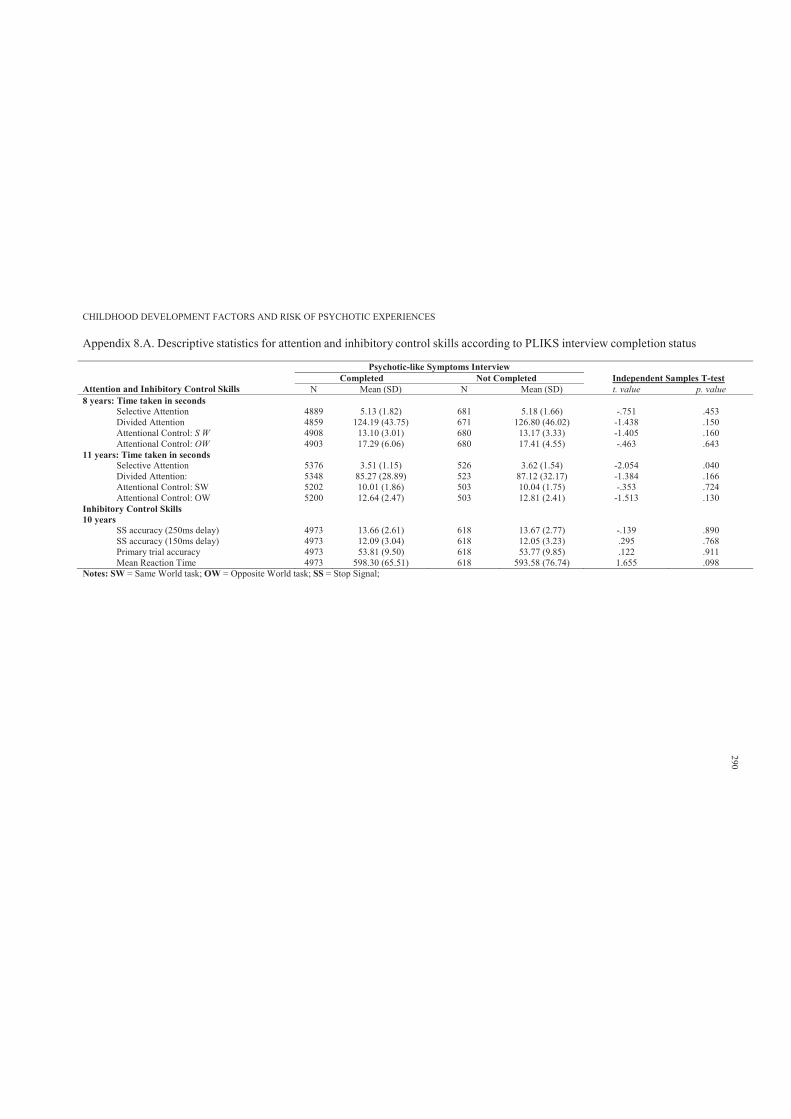
CHILDHOOD DEVELOPMENT FACTORS AND RISK OF PSYCHOTIC EXPERIENCES
Appendix 8.A. Descriptive statistics for attention and inhibitory control skills according to PLIKS interview completion status
Psychotic-like Symptoms Interview
Attention and Inhibitory Control Skills Completed Not Completed Independent Samples T-test
N Mean (SD) N Mean (SD) t. value p. value8 years: Time taken in seconds
Selective Attention 4889 5.13 (1.82) 681 5.18 (1.66) -.751 .453Divided Attention 4859 124.19 (43.75) 671 126.80 (46.02) -1.438 .150Attentional Control: S W 4908 13.10 (3.01) 680 13.17 (3.33) -1.405 .160Attentional Control: OW 4903 17.29 (6.06) 680 17.41 (4.55) -.463 .643
11 years: Time taken in seconds Selective Attention 5376 3.51 (1.15) 526 3.62 (1.54) -2.054 .040Divided Attention: 5348 85.27 (28.89) 523 87.12 (32.17) -1.384 .166Attentional Control: SW 5202 10.01 (1.86) 503 10.04 (1.75) -.353 .724Attentional Control: OW 5200 12.64 (2.47) 503 12.81 (2.41) -1.513 .130
Inhibitory Control Skills 10 years
SS accuracy (250ms delay) 4973 13.66 (2.61) 618 13.67 (2.77) -.139 .890SS accuracy (150ms delay) 4973 12.09 (3.04) 618 12.05 (3.23) .295 .768Primary trial accuracy 4973 53.81 (9.50) 618 53.77 (9.85) .122 .911Mean Reaction Time 4973 598.30 (65.51) 618 593.58 (76.74) 1.655 .098
Notes: SW = Same World task; OW = Opposite World task; SS = Stop Signal;
290

CHILDHOOD DEVELOPMENT FACTORS AND RISK OF PSYCHOTIC EXPERIENCES
Appendix 9.A. Frequencies, percentages, and statistical significance of motor impairment scores for those with and without completePLIKS interview
M-ABC Motor Difficulties (items) PLIKS InterviewDomain Item Frequencies (%) Statistical SignificanceManual Dexterity Threading Lace Completed Not Completed Overall Cross Tabulation
No difficulties 2236 (50.7%) 404 (52.3%)Borderline 1130 (25.6%) 179 (23.2%)Definite difficulties 1044 (23.7%) 189 (24.5%)Total 4410 772 2 = 2.067, p = .356Placing PegsNo difficulties 3867 (92.1%) 674 (92.3%)Borderline 292 (7.0%) 45 (6.2%)Definite difficulties 39 (0.9%) 11 (1.5%)Total 4198 730 2 = 2.619, p = .270
Ball Skills Bean BagsNo difficulties 3232 (72.4%) 575 (73.8%)Borderline 937 (21.0%) 153 (19.6%)Definite difficulties 295 (6.6%) 51 (6.5%)Total 4464 779 2 = .767, p = .682
Dynamic Balance: Heel to Toe WalkingNo difficulties 4361 (97.8%) 754 (96.4%)Borderline 54 (1.2%) 20 (2.6%)Definite difficulties 42 (0.9%) 8 (1.0%)Total 4457 782 2 = 8.717, p = .013
Notes: PLIKS = Psychotic-Like-Symptoms Interview
291
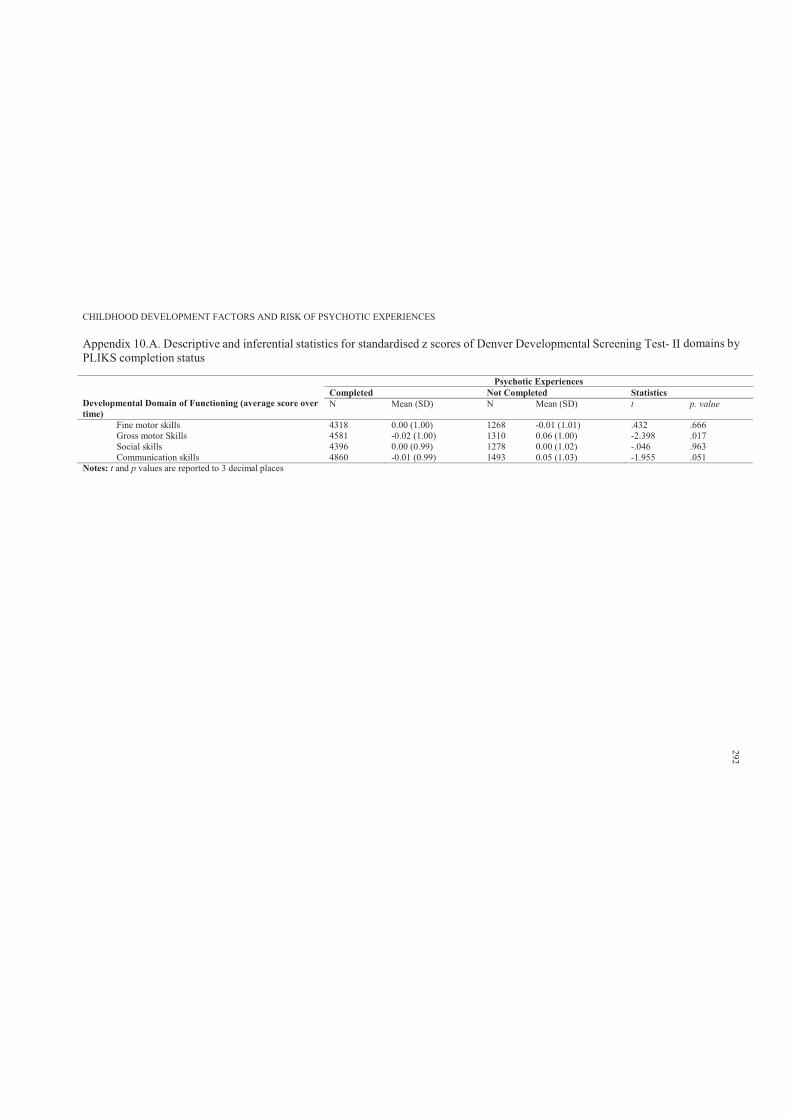
CHILDHOOD DEVELOPMENT FACTORS AND RISK OF PSYCHOTIC EXPERIENCES
Appendix 10.A. Descriptive and inferential statistics for standardised z scores of Denver Developmental Screening Test- II domains byPLIKS completion status
Developmental Domain of Functioning (average score over time)
Psychotic ExperiencesCompleted Not Completed Statistics N Mean (SD) N Mean (SD) t p. value
Fine motor skills 4318 0.00 (1.00) 1268 -0.01 (1.01) .432 .666Gross motor Skills 4581 -0.02 (1.00) 1310 0.06 (1.00) -2.398 .017Social skills 4396 0.00 (0.99) 1278 0.00 (1.02) -.046 .963Communication skills 4860 -0.01 (0.99) 1493 0.05 (1.03) -1.955 .051
Notes: t and p values are reported to 3 decimal places
292
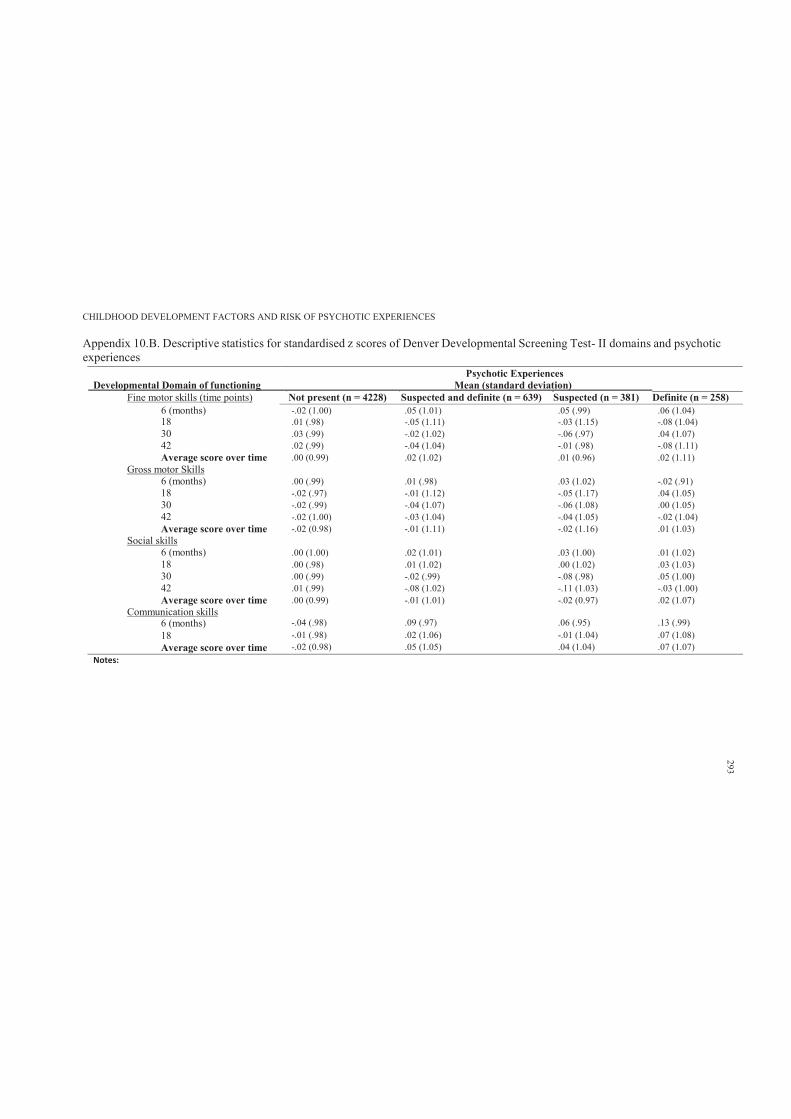
CHILDHOOD DEVELOPMENT FACTORS AND RISK OF PSYCHOTIC EXPERIENCES
Appendix 10.B. Descriptive statistics for standardised z scores of Denver Developmental Screening Test- II domains and psychotic experiences
Psychotic ExperiencesDevelopmental Domain of functioning Mean (standard deviation)
Fine motor skills (time points) Not present (n = 4228) Suspected and definite (n = 639) Suspected (n = 381) Definite (n = 258)6 (months) -.02 (1.00) .05 (1.01) .05 (.99) .06 (1.04)18 .01 (.98) -.05 (1.11) -.03 (1.15) -.08 (1.04)30 .03 (.99) -.02 (1.02) -.06 (.97) .04 (1.07)42 .02 (.99) -.04 (1.04) -.01 (.98) -.08 (1.11)Average score over time
Gross motor Skills6 (months)
.00 (0.99)
.00 (.99)
.02 (1.02)
.01 (.98)
.01 (0.96)
.03 (1.02)
.02 (1.11)
-.02 (.91)18 -.02 (.97) -.01 (1.12) -.05 (1.17) .04 (1.05)30 -.02 (.99) -.04 (1.07) -.06 (1.08) .00 (1.05)42 -.02 (1.00) -.03 (1.04) -.04 (1.05) -.02 (1.04)Average score over time
Social skills6 (months)
-.02 (0.98)
.00 (1.00)
-.01 (1.11)
.02 (1.01)
-.02 (1.16)
.03 (1.00)
.01 (1.03)
.01 (1.02)18 .00 (.98) .01 (1.02) .00 (1.02) .03 (1.03)30 .00 (.99) -.02 (.99) -.08 (.98) .05 (1.00)42 .01 (.99) -.08 (1.02) -.11 (1.03) -.03 (1.00)Average score over time
Communication skills.00 (0.99) -.01 (1.01) -.02 (0.97) .02 (1.07)
6 (months) -.04 (.98) .09 (.97) .06 (.95) .13 (.99)18 -.01 (.98) .02 (1.06) -.01 (1.04) .07 (1.08)Average score over time -.02 (0.98) .05 (1.05) .04 (1.04) .07 (1.07)
Notes:
293
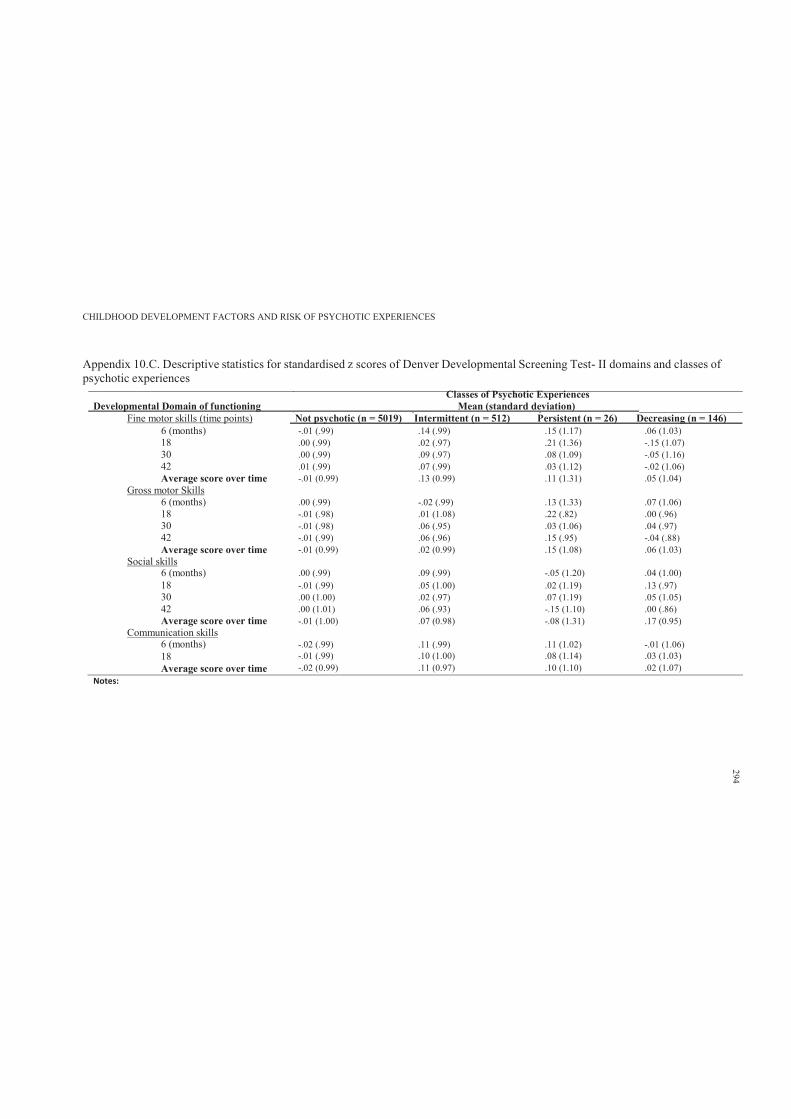
CHILDHOOD DEVELOPMENT FACTORS AND RISK OF PSYCHOTIC EXPERIENCES
Appendix 10.C. Descriptive statistics for standardised z scores of Denver Developmental Screening Test- II domains and classes of psychotic experiences
Classes of Psychotic ExperiencesDevelopmental Domain of functioning Mean (standard deviation)
Fine motor skills (time points) Not psychotic (n = 5019) Intermittent (n = 512) Persistent (n = 26) Decreasing (n = 146)6 (months) -.01 (.99) .14 (.99) .15 (1.17) .06 (1.03)18 .00 (.99) .02 (.97) .21 (1.36) -.15 (1.07)30 .00 (.99) .09 (.97) .08 (1.09) -.05 (1.16)42 .01 (.99) .07 (.99) .03 (1.12) -.02 (1.06)Average score over time
Gross motor Skills6 (months)
-.01 (0.99)
.00 (.99)
.13 (0.99)
-.02 (.99)
.11 (1.31)
.13 (1.33)
.05 (1.04)
.07 (1.06)18 -.01 (.98) .01 (1.08) .22 (.82) .00 (.96)30 -.01 (.98) .06 (.95) .03 (1.06) .04 (.97)42 -.01 (.99) .06 (.96) .15 (.95) -.04 (.88)Average score over time
Social skills-.01 (0.99) .02 (0.99) .15 (1.08) .06 (1.03)
6 (months) .00 (.99) .09 (.99) -.05 (1.20) .04 (1.00)18 -.01 (.99) .05 (1.00) .02 (1.19) .13 (.97)30 .00 (1.00) .02 (.97) .07 (1.19) .05 (1.05)42 .00 (1.01) .06 (.93) -.15 (1.10) .00 (.86)Average score over time -.01 (1.00) .07 (0.98) -.08 (1.31) .17 (0.95)
Communication skills6 (months) -.02 (.99) .11 (.99) .11 (1.02) -.01 (1.06)18 -.01 (.99) .10 (1.00) .08 (1.14) .03 (1.03)Average score over time -.02 (0.99) .11 (0.97) .10 (1.10) .02 (1.07)
Notes:
294
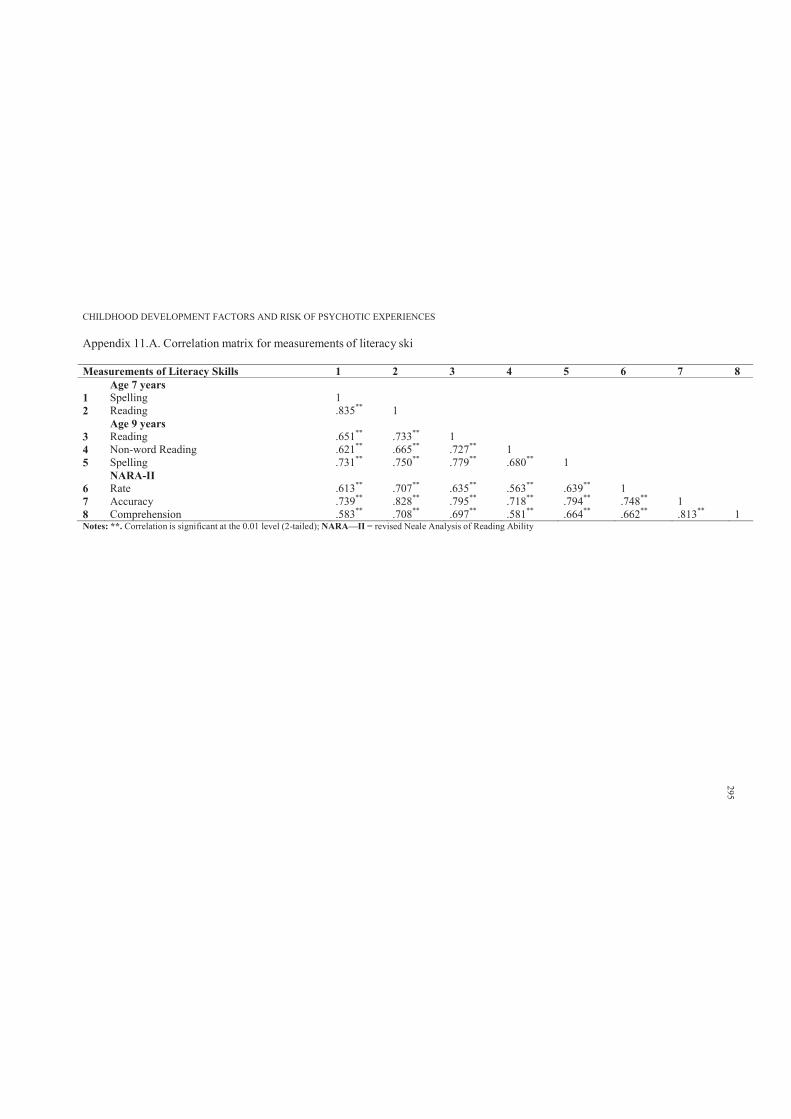
CHILDHOOD DEVELOPMENT FACTORS AND RISK OF PSYCHOTIC EXPERIENCES
Appendix 11.A. Correlation matrix for measurements of literacy ski
Measurements of Literacy Skills 1 2 3 4 5 6 7 8Age 7 years
1 Spelling 12 Reading .835** 1
Age 9 years 3 Reading .651** .733** 14 Non-word Reading .621** .665** .727** 15 Spelling .731** .750** .779** .680** 1
NARA-II6 Rate .613** .707** .635** .563** .639** 17 Accuracy .739** .828** .795** .718** .794** .748** 18 Comprehension .583** .708** .697** .581** .664** .662** .813** 1Notes: **. Correlation is significant at the 0.01 level (2-tailed); NARA—II = revised Neale Analysis of Reading Ability
295
CHILDHOOD DEVELOPMENT FACTORS AND RISK OF PSYCHOTIC EXPERIENCES 296
Appendix 12.A. Deakin University Human Research Ethics Approval (pilot trial)
Human Ethics Research
Memorandum
To: A/Prof Andrew Lewis
School of Psychology
F
Office of Research IntegrityResearch Services Division70 Elgar Road Burwood Victoria Postal: 221 Burwood Highway Burwood Victoria 3125 AustraliaTelephone 03 9251 7123 Facsimile 03 9244 6581 [email protected]
cc: Mr Mohajer Abbass Hameed
From:
Date:
Deakin University Human Research Ethics Committee (DU-HREC)
21 May, 2010
Subject: 2009-186
Computerised Progressive Social Cognitive Remediation Program: Targeting ChildhoodNeurodevelopmental Precursors of Schizophrenia
Please quote this project number in all future communications
The modification to this project, submitted on 30/04/2010 has been approved by the committee executive on21/05/2010.
Approval has been given for Mr Mohajer Abbass Hameed, under the supervision of A/Prof Andrew Lewis,School ofPsychology, to continue this project as modified to 21/12/2012.
The approval given by the Deakin University Human Research Ethics Committee is given only for the project andfor the period as stated in the approval. It is your responsibility to contact the Human Research Ethics Unitimmediately should any of the following occur:
• Serious or unexpected adverse effects on the participants• Any proposed changes in the protocol, including extensions of time.• Any events which might affect the continuing ethical acceptability of the project.• The project is discontinued before the expected date of completion.• Modifications are requested by other HREC's.
In addition you will be required to report on the progress of your project at least once every year and at theconclusion of the project. Failure to report as required will result in suspension of your approval to proceed withthe project.
DU-HREC may need to audit this project as part of the requirements for monitoring set out in the NationalStatement on Ethical Conduct in Human Research (2007).
Human Research Ethics [email protected]: 03 9251 7123

CHILDHOOD DEVELOPMENT FACTORS AND RISK OF PSYCHOTIC EXPERIENCES 297
Appendix 12.B. Pilot trial invitation flyer
Deakin University Research Project*Melbourne Burwood and Geelong Waterfront Campus Victoria
Dear Parents
We have educational cards and computer games designed to
enhance children’s social and cognitive skills
Is your child between the age of 5 and 12?
If yes; we would like to invite your child in this program
For further details please contact
Mr Mohajer Abbass Hameed on
0404 248 156
Thank you
*Optional Home-Based Study
(Victoria)

CHILDHOOD DEVELOPMENT FACTORS AND RISK OF PSYCHOTIC EXPERIENCES 298
Appendix 12.C. Parental consent and plain language statement
DEAKIN UNIVERSITYPLAIN LANGUAGE STATEMENT
TO: Parents
Plain Language Statement
Date: 15/10/2009
Full Project Title: A Pilot Trial of a Computerised Progressive Social CognitiveProgram for Children
Principal Researcher: Associate Professor Andrew Lewis
Student Researcher: Mr. Mohajer Abbass Hameed
Associate Researcher(s): Mr. Mohajer Abbass Hameed
CHILDHOOD DEVELOPMENT FACTORS AND RISK OF PSYCHOTIC EXPERIENCES
We (Andrew Lewis and Mohajer Abbass Hameed) are doing this study to see if we can
improve your child’s social and cognitive skills. We have computer games for your child to
play with, and we want to see if your child gets better on some social and cognitive tests.
The tests are not like school tests; your child will do what he or she can do, and there is
no right or wrong answer.
1. Your Consent
We invite you and your child with an age of anywhere between 6 to 12 year old to
participate.
This Plain Language Statement tells you much information about the research project. It
explains to you as openly and clearly as possible all the procedures involved in this
project before you decide whether or not to take part in it.
Please read this Plain Language Statement carefully. Feel free to ask questions about any
information in the document. You may also wish to discuss the project with a relative or
friend or your local health worker. Feel free to do this.
Once you understand what the project is about and if you agree to take part in it, you will
be asked to sign the Consent Form. By signing the Consent Form, you indicate that you
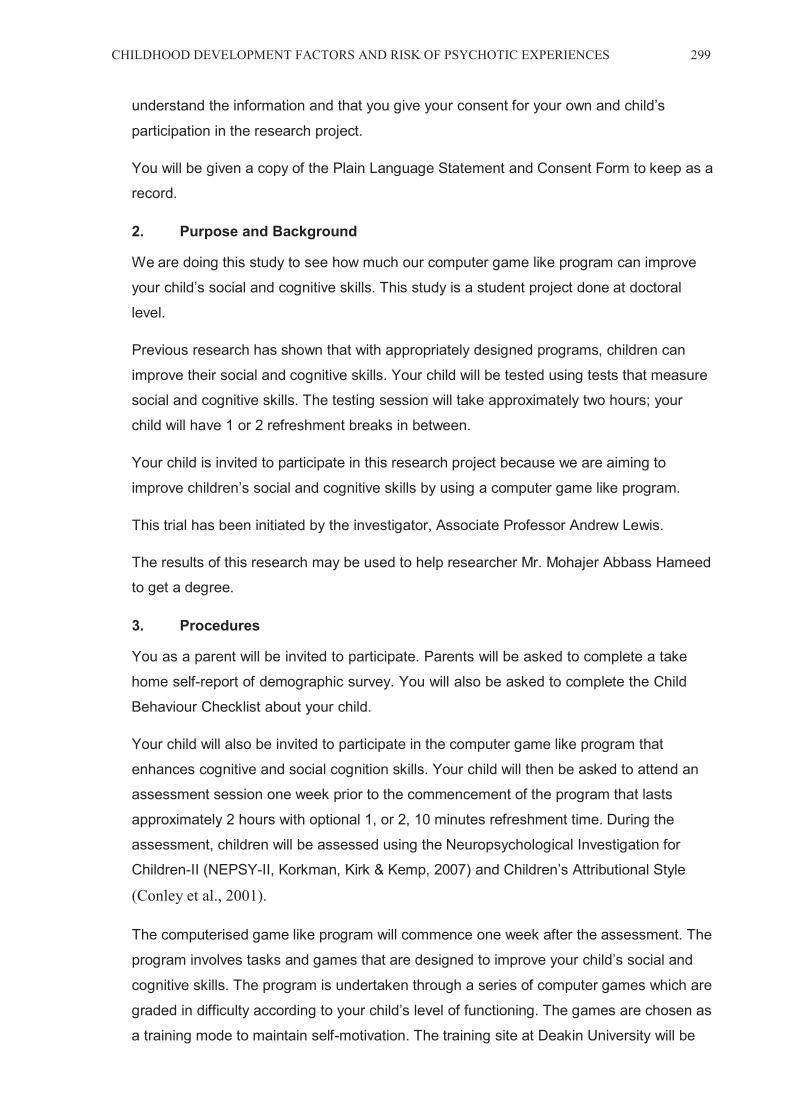
CHILDHOOD DEVELOPMENT FACTORS AND RISK OF PSYCHOTIC EXPERIENCES 299
understand the information and that you give your consent for your own and child’s
participation in the research project.
You will be given a copy of the Plain Language Statement and Consent Form to keep as a
record.
2. Purpose and Background
We are doing this study to see how much our computer game like program can improve
your child’s social and cognitive skills. This study is a student project done at doctoral
level.
Previous research has shown that with appropriately designed programs, children can
improve their social and cognitive skills. Your child will be tested using tests that measure
social and cognitive skills. The testing session will take approximately two hours; your
child will have 1 or 2 refreshment breaks in between.
Your child is invited to participate in this research project because we are aiming to
improve children’s social and cognitive skills by using a computer game like program.
This trial has been initiated by the investigator, Associate Professor Andrew Lewis.
The results of this research may be used to help researcher Mr. Mohajer Abbass Hameed
to get a degree.
3. Procedures
You as a parent will be invited to participate. Parents will be asked to complete a take
home self-report of demographic survey. You will also be asked to complete the Child
Behaviour Checklist about your child.
Your child will also be invited to participate in the computer game like program that
enhances cognitive and social cognition skills. Your child will then be asked to attend an
assessment session one week prior to the commencement of the program that lasts
approximately 2 hours with optional 1, or 2, 10 minutes refreshment time. During the
assessment, children will be assessed using the Neuropsychological Investigation for
Children-II (NEPSY-II, Korkman, Kirk & Kemp, 2007) and Children’s Attributional Style
(Conley et al., 2001).
The computerised game like program will commence one week after the assessment. The
program involves tasks and games that are designed to improve your child’s social and
cognitive skills. The program is undertaken through a series of computer games which are
graded in difficulty according to your child’s level of functioning. The games are chosen as
a training mode to maintain self-motivation. The training site at Deakin University will be
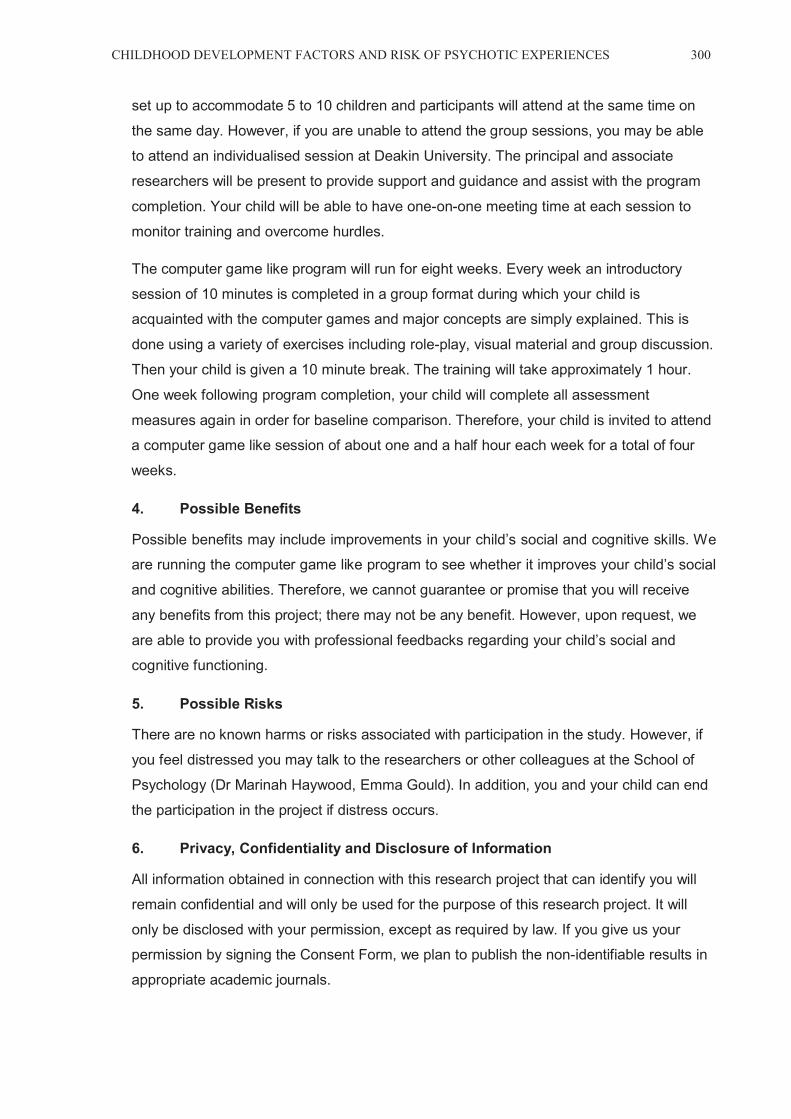
CHILDHOOD DEVELOPMENT FACTORS AND RISK OF PSYCHOTIC EXPERIENCES 300
set up to accommodate 5 to 10 children and participants will attend at the same time on
the same day. However, if you are unable to attend the group sessions, you may be able
to attend an individualised session at Deakin University. The principal and associate
researchers will be present to provide support and guidance and assist with the program
completion. Your child will be able to have one-on-one meeting time at each session to
monitor training and overcome hurdles.
The computer game like program will run for eight weeks. Every week an introductory
session of 10 minutes is completed in a group format during which your child is
acquainted with the computer games and major concepts are simply explained. This is
done using a variety of exercises including role-play, visual material and group discussion.
Then your child is given a 10 minute break. The training will take approximately 1 hour.
One week following program completion, your child will complete all assessment
measures again in order for baseline comparison. Therefore, your child is invited to attend
a computer game like session of about one and a half hour each week for a total of four
weeks.
4. Possible Benefits
Possible benefits may include improvements in your child’s social and cognitive skills. We
are running the computer game like program to see whether it improves your child’s social
and cognitive abilities. Therefore, we cannot guarantee or promise that you will receive
any benefits from this project; there may not be any benefit. However, upon request, we
are able to provide you with professional feedbacks regarding your child’s social and
cognitive functioning.
5. Possible Risks
There are no known harms or risks associated with participation in the study. However, if
you feel distressed you may talk to the researchers or other colleagues at the School of
Psychology (Dr Marinah Haywood, Emma Gould). In addition, you and your child can end
the participation in the project if distress occurs.
6. Privacy, Confidentiality and Disclosure of Information
All information obtained in connection with this research project that can identify you will
remain confidential and will only be used for the purpose of this research project. It will
only be disclosed with your permission, except as required by law. If you give us your
permission by signing the Consent Form, we plan to publish the non-identifiable results in
appropriate academic journals.

CHILDHOOD DEVELOPMENT FACTORS AND RISK OF PSYCHOTIC EXPERIENCES 301
In any publication, information will be provided in such a way that you cannot be identified.
Only pooled data will be analysed in all data analysis and no individually based
information will be reported.
In accordance with the Freedom of Information Act 1982 (Vic), you have the right to
access and to request correction of information held about you by Deakin University.
The collected information will be physically stored in a locked cabinet; the data will be
coded and any identifiable information removed.
7. New Information Arising During the Project
During the research project, new information about the risks and benefits of the project
may become known to the researchers. If this occurs, you will be told about this new
information. This new information may mean that you can no longer participate in this
research. If this occurs, the person(s) supervising the research will stop your participation.
In all cases, you will be offered all available care to suit your needs and medical condition.
8. Results of Project
The results of the project will be coded and in non-identifiable format. The study may be
subject to publication.
9. Further Information or Any Problems
If you require further information or if you have any problems concerning this project (for
example, any side effects), you can contact the principal researcher Associate Professor
Andrew Lewis. The researchers responsible for this project are Associate Professor
Andrew Lewis and Mr. Mohajer Abbass Hameed.
10. Complaints
If you have any complaints about any aspect of the project, the way it is being conducted
or any questions about your rights as a research participant, then you may contact:
The Manager, Office of Research Integrity, Deakin University, 221 Burwood Highway,
Burwood Victoria 3125, Telephone: 9251 7129, Facsimile: 9244 6581; research-
Please quote project number EC [2009–186] -2008.
11. Participation is Voluntary
Participation in any research project is voluntary. If you do not wish to take part you are
not obliged to. If you decide to take part and later change your mind, you are free to
withdraw from the project at any stage.

CHILDHOOD DEVELOPMENT FACTORS AND RISK OF PSYCHOTIC EXPERIENCES 302
Your decision of whether to take part or not to take part, or to take part and then withdraw,
will not affect your relationship with the researchers or your relationship with Deakin
University.
Before you make your decision, a member of the research team will be available so that
you can ask any questions you have about the research project. You can ask for any
information you want. Sign the Consent Form only after you have had a chance to ask
your questions and have received satisfactory answers.
If you decide to withdraw from this project, please notify a member of the research team
before you withdraw. This notice will allow that person or the research supervisor to inform
you if there are any health risks or special requirements linked to withdrawing.
12. Reimbursement for your costs
You will not be paid for your participation in this trial. However, refreshments will be
provided.
13. Ethical Guidelines
This project will be carried out according to the National Statement on Ethical Conduct in
Research Involving Humans (June 1999) produced by the National Health and Medical
Research Council of Australia. This statement has been developed to protect the interests
of people who agree to participate in human research studies.
The ethical aspects of this research project have been approved by the Human Research
Ethics Committee of Deakin University.
14. Injury
In the event that you suffer an injury as a result of participating in this research project,
hospital care and treatment will be provided by the public health service at no extra cost to
you.

CHILDHOOD DEVELOPMENT FACTORS AND RISK OF PSYCHOTIC EXPERIENCES 303
DEAKIN UNIVERSITYCONSENT FORMTO: Parents
Consent Form
Parents to Keep
Date: 20102009
Site: Deakin University
Full Project Title: A Pilot Trial of a Computerised Progressive Social Cognitive Program
for Children
I have read and I understand the Plain Language Statement version x dated 20/10/2009.
I have had an opportunity to ask questions and I am satisfied with the answers I have
received.
I freely agree to participate in this project according to the conditions in the Plain
Language Statement.
I will be given a copy of the Plain Language Statement and Consent Form to keep.
I understand that the researcher has agreed not to reveal my identity and personal details
if information about this project is published or presented in any public form.
Participant’s Name (printed) . . . . . . . . . . . . . . . . . . . . . . . . . . . . . . . . . . . . . . . . . .
. .
Signature Date
Name of Witness to Participant’s Signature (printed) . . . . . . . . . . . . . . . . . . . . . . . . . .
.
Signature Date
Declaration by researcher*: I have given a verbal explanation of the research project, its
procedures and risks and I believe that the participant has understood that explanation.
Researcher’s Name (printed) Associate Professor Andrew Lewis & Mr. Mohajer Abbass
Hameed.
Signature Date
* A senior member of the research team must provide the explanation and provision of
information concerning the research project.
Note: All parties signing the Consent Form must date their own signature.

CHILDHOOD DEVELOPMENT FACTORS AND RISK OF PSYCHOTIC EXPERIENCES 304
I have read and I understand the Plain Language Statement version x dated 20/10/2009.
I have had an opportunity to ask questions and I am satisfied with the answers I have
received.
I freely agree to participate in this project according to the conditions in the Plain
Language Statement.
I will be given a copy of the Plain Language Statement and Consent Form to keep.
I understand that the researcher has agreed not to reveal my identity and personal details
if information about this project is published or presented in any public form.
Participant’s Name (printed) ……………………………………………………
Signature Date
Name of Witness to Participant’s Signature (printed) ………………………………………
Signature Date
Declaration by researcher*: I have given a verbal explanation of the research project, its
procedures and risks and I believe that the participant has understood that explanation.
Researcher’s Name (printed) Associate Professor Andrew Lewis & Mr. Mohajer Abbass
Hameed
Signature Date
* A senior member of the research team must provide the explanation and provision of
information concerning the research project.
Note: All parties signing the Consent Form must date their own signature.

CHILDHOOD DEVELOPMENT FACTORS AND RISK OF PSYCHOTIC EXPERIENCES 305
DEAKIN UNIVERSITY
Future Participation
TO: Parents
Future Participation Form (researchers to keep)
Date: 20/10/2009
Site: Deakin University
Would you like to be contacted for participation in the second stage of this study? Please
tick the appropriate box:
Yes I would like to be contacted for participation in the second stage of this study
No I would not like to be contacted for participation in the second stage of this
study
Name …………………………………………………….........................
Phone number....................................................................................................
Residential address..............................................................................................
Signature Date
CHILDHOOD DEVELOPMENT FACTORS AND RISK OF PSYCHOTIC EXPERIENCES 306
REVOCATION OF CONSENT FORM
(To be used for participants who wish to withdraw from the project.)
DEAKIN UNIVERSITYPLAIN LANGUAGE STATEMENT AND CONSENT FORM
TO: Parent Participants
Revocation of Consent Form (participants to keep)
Revocation of Consent Form
Full Project Title: A Pilot Trial of a Computerised Progressive Social CognitiveProgram for Children
I hereby wish to WITHDRAW my consent to participate in the research proposal named
above and understand that such withdrawal WILL NOT jeopardise my relationship with
Deakin University.
Participant’s Name (printed) …………………………………………………….
Signature Date
CHILDHOOD DEVELOPMENT FACTORS AND RISK OF PSYCHOTIC EXPERIENCES 307
REVOCATION OF CONSENT FORM
(To be used for participants who wish to withdraw from the project.)
DEAKIN UNIVERSITYPLAIN LANGUAGE STATEMENT AND CONSENT FORM TO: Parent Participants
Revocation of Consent Form (researchers to keep)
Revocation of Consent Form
Full Project Title: A Pilot Trial of a Computerised Progressive Social CognitiveProgram for Children
I hereby wish to WITHDRAW my consent to participate in the research proposal named
above and understand that such withdrawal WILL NOT jeopardise my relationship with
Deakin University.
Participant’s Name (printed) …………………………………………………….
Signature Date

CHILDHOOD DEVELOPMENT FACTORS AND RISK OF PSYCHOTIC EXPERIENCES 308
Appendix 12.D. Children consent and plain language statement
DEAKIN UNIVERSITYPLAIN LANGUAGE STATEMENT
TO: Children
Plain Language Statement
Date: 15/10/2009
Full Project Title: A Pilot Trial of a Computerised Progressive Social CognitiveProgram for Children
Principal Researcher: Associate Professor Andrew Lewis
Student Researcher: Mr. Mohajer Abbass Hameed
Associate Researcher(s): Mr. Mohajer Abbass Hameed
1. Why are we doing this study?
We (Andrew Lewis and Mohajer Abbass Hameed) are doing this study to see if we can improve your social and cognitive skills. We have computer games for you to play with, and we want to see if you get better on some social and cognitive tests. The tests are not like school tests, you do what you can do, and there is no right or wrong answer. You just tell me what you can tell me and do what you can do.
2. It is up to you to do the tests and the computer gamesWe would like you to do the computer games and do some tests to see if your social and cognitive skills have got better.
Here, we give you all the information you need to know. It tells you things about what youare going to do. It is up to you to do this, and you can stop anytime you like.
You can ask me any questions you like; you can also talk to your parents.
When you know and understand what you are doing, you can tell me or tell your parentthat you want to do the computer game like tasks.
3. What you going to do?We are doing this study to see how much our computer game like program can improveyour social and cognitive skills. This study is a student project done at doctoral level.
You going to do some tests, but they are not like school tests, there is no right or wrong answer, you just tell me or do what you can do. We also would like your school teacher tofill in a form for us.
So before you start playing on the computer, I do some tests that take about 2 to three can hours. You will have some breaks in between and you get some biscuits, chocolates and fruit drinks for free. Then a week later, you come back to do the computer games for

CHILDHOOD DEVELOPMENT FACTORS AND RISK OF PSYCHOTIC EXPERIENCES 309
about one hour. We do this for four weeks. Then you do the same tests you did before the computer games.
4. How you going to do this study?You come here to do some tests, not like school test, you tell me or do what you can do. This takes about 2 hours, but you have some recess time.
A week after, you come back to do the computer games for about 1 hour, for 8 times; so one time every week. Before you do the games, I show you how to do them and you can always ask me questions. After you finish all the computer games, you do the same test that you did before the computer games.
So when you do the testing or the computer games, you can ask me any questions youlike; it is also ok to stop for 5 or 10 minutes and then come back to do the tests or thecomputer games.
5. What do I get from doing this?The computer games may help you get better skills that are good when you play withother children, at school or even when doing homework.
6. What if I feel tired?You can tell me that I am feeling tired and want to take a break or go home and comeback later; it is ok to tell me.
7. Will other people know me by my name?It is only me that will know you; no other person will know you. When you finish this, no one will know your name.
Anything you tell me will not be told to other people; what you say and do will be just between me and you and we keep all the information in a locked cabinet and no one other than me will have access to them.
8. What will happen to my test results?The test results will be put together and no one will know your name or test results. Evenif the results get written on a paper, no one will know you.
9. What if I have questions?Anytime during the study, you can ask me any question you like, you can talk to Andrew or Mohajer, or even to your parents.

CHILDHOOD DEVELOPMENT FACTORS AND RISK OF PSYCHOTIC EXPERIENCES 310
10. Can I choose if I want to be in the study?Nobody will be upset if you do not want to be in the study. We are going to talk to your parents/guardians and you should talk to them about it too. You can choose whether youwant to do this or not. If you choose to do it, and later wanted to stop, that is also ok.
11. Will I get paid for choosing to be in this study?You will not be paid for doing this study, but we will give some refreshments.
12. What will happen if I feel tired?If you feel tired or need to see a doctor when you do this study, then we will arrange adoctor to see you for free.
13. ComplaintsIf you have any complaints about any aspect of the project, the way it is being conductedor any questions about your rights as a research participant, then you may contact:
The Manager, Office of Research Integrity, Deakin University, 221 Burwood Highway,Burwood Victoria 3125, Telephone: 9251 7129, Facsimile: 9244 6581; [email protected].
Please quote project number EC [2009–186] -2008.
14. Ethical GuidelinesThis project will be carried out according to the National Statement on Ethical Conduct inResearch Involving Humans (June 1999) produced by the National Health and Medical Research Council of Australia. This statement has been developed to protect the interestsof people who agree to participate in human research studies.
The ethical aspects of this research project have been approved by the Human ResearchEthics Committee of Deakin University.

CHILDHOOD DEVELOPMENT FACTORS AND RISK OF PSYCHOTIC EXPERIENCES 311
DEAKIN UNIVERSITYAssent FORM
TO: Children
Assent Form (participants to keep)
Date: 20/10/2009
Site: Deakin University
Full Project Title: A Pilot Trial of a Computerised Progressive Social CognitiveProgram for Children
I have read and I understand the Plain Language Statement version x dated x and also explained to me by the researchers.
I have had an opportunity to ask questions and I am satisfied with the answers I havereceived.
I freely agree to participate in this project according to the conditions in the PlainLanguage Statement.
I will be given a copy of the Plain Language Statement and Consent Form to keep.
I understand that the researcher has agreed not to reveal my identity and personal detailsif information about this project is published or presented in any public form.
Participant’s Name (printed) ……………………………………………………
Signature Date
Name of Witness to Participant’s Signature (printed) ………………………………………
Signature Date
Declaration by researcher*: I have given a verbal explanation of the research project, itsprocedures and risks and I believe that the participant has understood that explanation.
Researcher’s Name (printed) Associate Professor Andrew Lewis & Mr. MOHAJERABBASS HAMEED
Signature Date
* A senior member of the research team must provide the explanation and provision of information concerning the research project.
Note: All parties signing the Consent Form must date their own signature.

CHILDHOOD DEVELOPMENT FACTORS AND RISK OF PSYCHOTIC EXPERIENCES 312
DEAKIN UNIVERSITYAssent FORM
TO: Children
Assent Form (researchers to keep)
Date: 20/10/2009
Site: Deakin University
Full Project Title: A Pilot Trial of a Computerised Progressive Social CognitiveProgram for Children
I have read and I understand the Plain Language Statement version x dated x and also explained to me by the researchers.
I have had an opportunity to ask questions and I am satisfied with the answers I havereceived.
I freely agree to participate in this project according to the conditions in the PlainLanguage Statement.
I will be given a copy of the Plain Language Statement and Consent Form to keep.
I understand that the researcher has agreed not to reveal my identity and personal detailsif information about this project is published or presented in any public form.
Participant’s Name (printed) ……………………………………………………
Signature Date
Name of Witness to Participant’s Signature (printed) ………………………………………
Signature Date
Declaration by researcher*: I have given a verbal explanation of the research project, itsprocedures and risks and I believe that the participant has understood that explanation.
Researcher’s Name (printed): Associate Professor Andrew Lewis & Mr. MOHAJERABBASS HAMEED
Signature Date
* A senior member of the research team must provide the explanation and provision of information concerning the research project.
Note: All parties signing the Consent Form must date their own signature.

CHILDHOOD DEVELOPMENT FACTORS AND RISK OF PSYCHOTIC EXPERIENCES 313
DEAKIN UNIVERSITYFuture Participation
To: Children
Future Participation Form (researchers to keep)
Date: 20/10/2009
Site: Deakin University
Would you like to be contacted for participation in the second stage of this study? Please tick the appropriate box:
Yes I would like to be contacted for participation in the second stage of this study
No I would not like to be contacted for participation in the second stage of thisstudy
Name …………………………………………………….........................
Phone number....................................................................................................
Residential address..............................................................................................
Signature Date

CHILDHOOD DEVELOPMENT FACTORS AND RISK OF PSYCHOTIC EXPERIENCES 314
REVOCATION OF CONSENT FORM
(To be used for participants who wish to withdraw from the project.)
DEAKIN UNIVERSITYPLAIN LANGUAGE STATEMENT AND CONSENT FORM
TO: Participants (Children)
Participants to keep
Revocation of Consent Form
Full Project Title: A Pilot Trial of a Computerised Progressive Social CognitiveProgram for Children
I hereby wish to WITHDRAW my consent to participate in the research proposal namedabove and understand that such withdrawal WILL NOT jeopardise my relationship withDeakin University.
Participant’s Name (printed) …………………………………………………….
Signature Date
CHILDHOOD DEVELOPMENT FACTORS AND RISK OF PSYCHOTIC EXPERIENCES 315
REVOCATION OF CONSENT FORM
(To be used for participants who wish to withdraw from the project.)
DEAKIN UNIVERSITYPLAIN LANGUAGE STATEMENT AND CONSENT FORM
TO: Participants (children)
Researchers to keep
Revocation of Consent Form
Full Project Title: A Pilot Trial of a Computerised Progressive Social CognitiveProgram for Children
I hereby wish to WITHDRAW my consent to participate in the research proposal namedabove and understand that such withdrawal WILL NOT jeopardise my relationship withDeakin University.
Participant’s Name (printed) …………………………………………………….
Signature Date
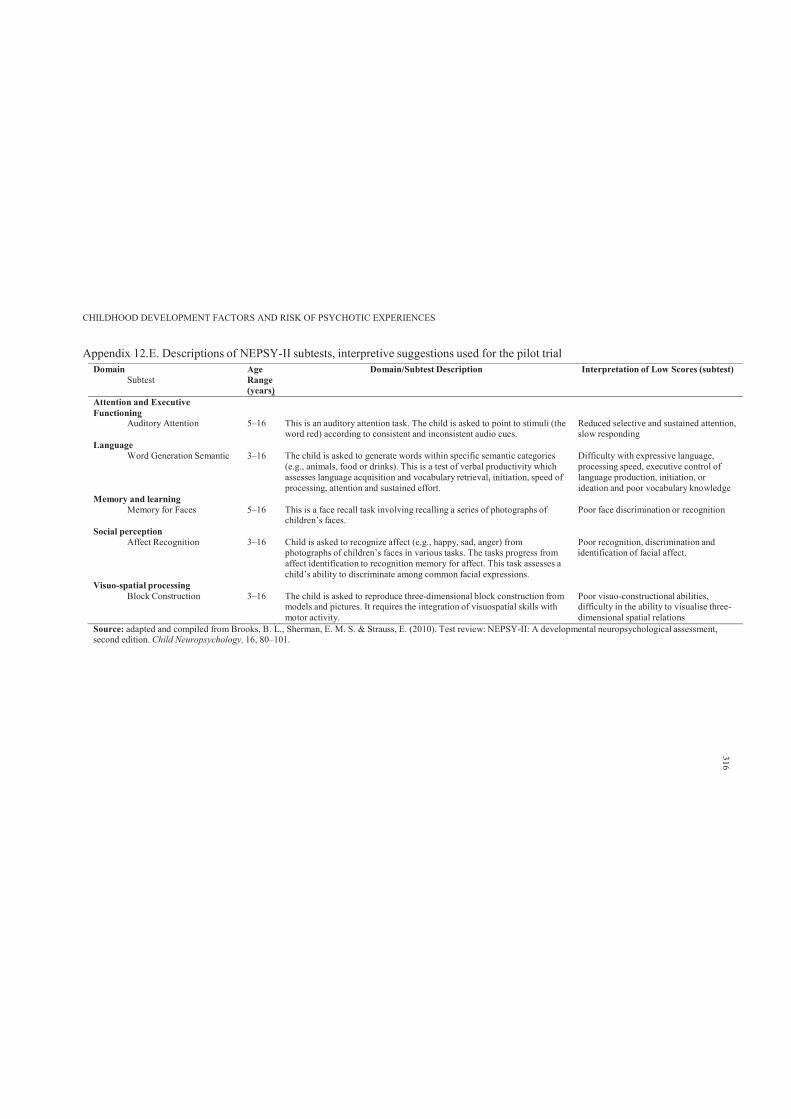
CHILDHOOD DEVELOPMENT FACTORS AND RISK OF PSYCHOTIC EXPERIENCES
Appendix 12.E. Descriptions of NEPSY-II subtests, interpretive suggestions used for the pilot trialDomain
SubtestAgeRange(years)
Domain/Subtest Description Interpretation of Low Scores (subtest)
Attention and ExecutiveFunctioning
Auditory Attention 5–16 This is an auditory attention task. The child is asked to point to stimuli (theword red) according to consistent and inconsistent audio cues.
Reduced selective and sustained attention,slow responding
LanguageWord Generation Semantic 3–16 The child is asked to generate words within specific semantic categories
(e.g., animals, food or drinks). This is a test of verbal productivity which assesses language acquisition and vocabulary retrieval, initiation, speed ofprocessing, attention and sustained effort.
Difficulty with expressive language,processing speed, executive control of language production, initiation, orideation and poor vocabulary knowledge
Memory and learningMemory for Faces 5–16 This is a face recall task involving recalling a series of photographs of
children’s faces.Poor face discrimination or recognition
Social perceptionAffect Recognition 3–16 Child is asked to recognize affect (e.g., happy, sad, anger) from
photographs of children’s faces in various tasks. The tasks progress fromaffect identification to recognition memory for affect. This task assesses achild’s ability to discriminate among common facial expressions.
Poor recognition, discrimination andidentification of facial affect.
Visuo-spatial processingBlock Construction 3–16 The child is asked to reproduce three-dimensional block construction from
models and pictures. It requires the integration of visuospatial skills withmotor activity.
Poor visuo-constructional abilities,difficulty in the ability to visualise three-dimensional spatial relations
Source: adapted and compiled from Brooks, B. L., Sherman, E. M. S. & Strauss, E. (2010). Test review: NEPSY-II: A developmental neuropsychological assessment,second edition. Child Neuropsychology, 16, 80–101.
316
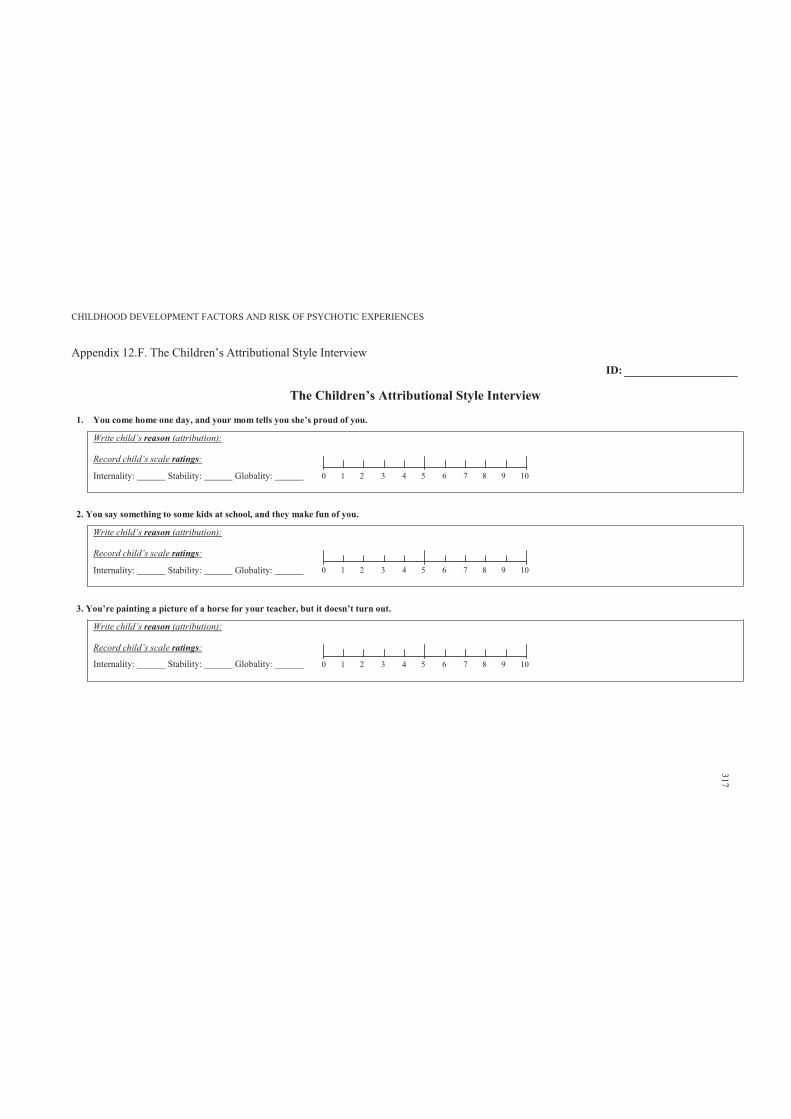
CHILDHOOD DEVELOPMENT FACTORS AND RISK OF PSYCHOTIC EXPERIENCES
Appendix 12.F. The Children’s Attributional Style InterviewID:
The Children’s Attributional Style Interview
1. You come home one day, and your mom tells you she’s proud of you.
Write child’s reason (attribution):
Record child’s scale ratings:
Internality: Stability: Globality: 0 1 2 3 4 5 6 7 8 9 10
2. You say something to some kids at school, and they make fun of you.
Write child’s reason (attribution):
Record child’s scale ratings:
Internality: Stability: Globality: 0 1 2 3 4 5 6 7 8 9 10
3. You’re painting a picture of a horse for your teacher, but it doesn’t turn out.
Write child’s reason (attribution):
Record child’s scale ratings:
Internality: Stability: Globality: 0 1 2 3 4 5 6 7 8 9 10
317
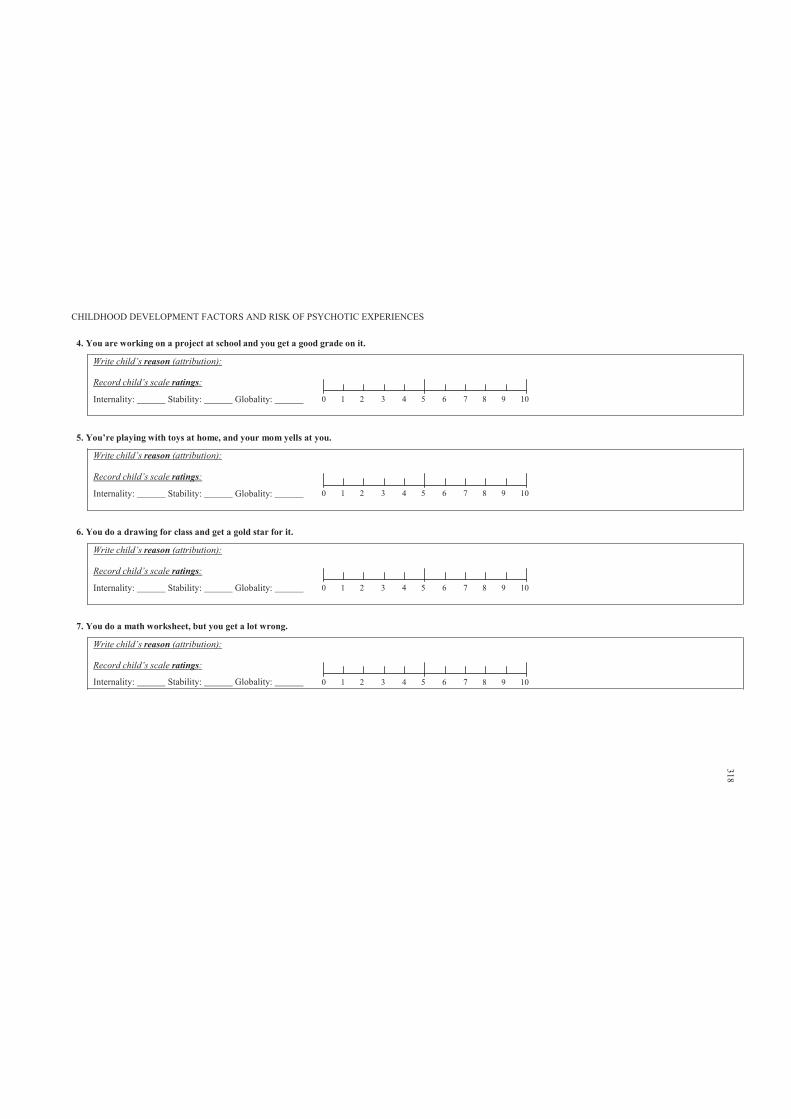
CHILDHOOD DEVELOPMENT FACTORS AND RISK OF PSYCHOTIC EXPERIENCES
4. You are working on a project at school and you get a good grade on it.
Write child’s reason (attribution):
Record child’s scale ratings:
Internality: Stability: Globality: 0 1 2 3 4 5 6 7 8 9 10
5. You’re playing with toys at home, and your mom yells at you.
Write child’s reason (attribution):
Record child’s scale ratings:
Internality: Stability: Globality: 0 1 2 3 4 5 6 7 8 9 10
6. You do a drawing for class and get a gold star for it.
Write child’s reason (attribution):
Record child’s scale ratings:
Internality: Stability: Globality: 0 1 2 3 4 5 6 7 8 9 10
7. You do a math worksheet, but you get a lot wrong.
Write child’s reason (attribution):
Record child’s scale ratings:
Internality: Stability: Globality: 0 1 2 3 4 5 6 7 8 9 10
318
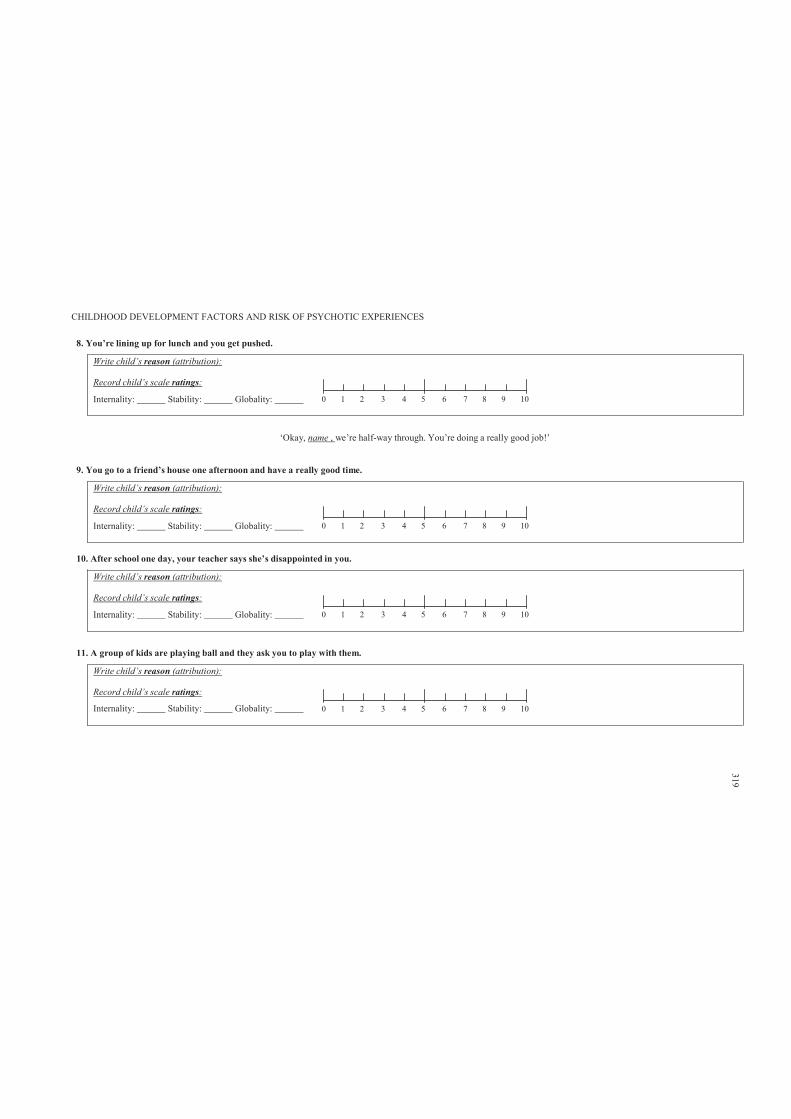
CHILDHOOD DEVELOPMENT FACTORS AND RISK OF PSYCHOTIC EXPERIENCES
8. You’re lining up for lunch and you get pushed.
Write child’s reason (attribution):
Record child’s scale ratings:
Internality: Stability: Globality: 0 1 2 3 4 5 6 7 8 9 10
‘Okay, name , we’re half-way through. You’re doing a really good job!’
9. You go to a friend’s house one afternoon and have a really good time.
Write child’s reason (attribution):
Record child’s scale ratings:
Internality: Stability: Globality: 0 1 2 3 4 5 6 7 8 9 10
10. After school one day, your teacher says she’s disappointed in you.
Write child’s reason (attribution):
Record child’s scale ratings:
Internality: Stability: Globality: 0 1 2 3 4 5 6 7 8 9 10
11. A group of kids are playing ball and they ask you to play with them.
Write child’s reason (attribution):
Record child’s scale ratings:
Internality: Stability: Globality: 0 1 2 3 4 5 6 7 8 9 10
319
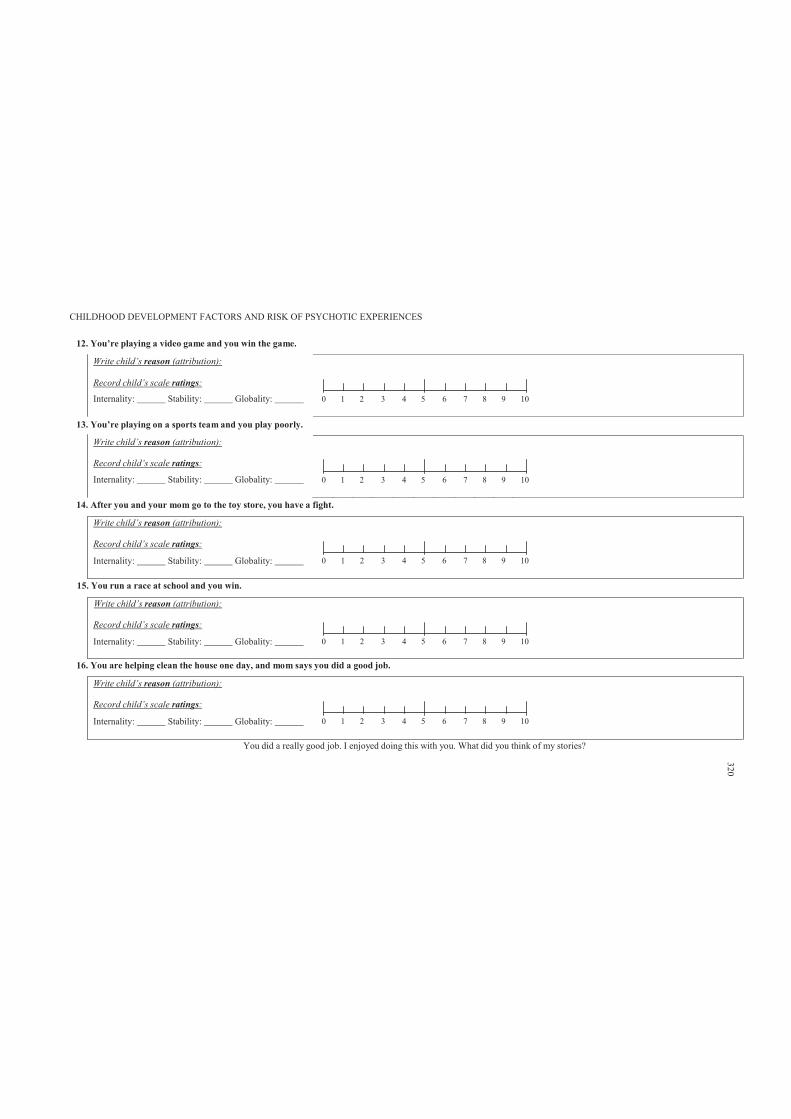
CHILDHOOD DEVELOPMENT FACTORS AND RISK OF PSYCHOTIC EXPERIENCES
12. You’re playing a video game and you win the game.
Write child’s reason (attribution):
Record child’s scale ratings:
Internality: Stability: Globality: 0 1 2 3 4 5 6 7 8 9 10
13. You’re playing on a sports team and you play poorly.
Write child’s reason (attribution):
Record child’s scale ratings:
Internality: Stability: Globality: 0 1 2 3 4 5 6 7 8 9 10
14. After you and your mom go to the toy store, you have a fight.
Write child’s reason (attribution):
Record child’s scale ratings:
Internality: Stability: Globality: 0 1 2 3 4 5 6 7 8 9 10
15. You run a race at school and you win.
Write child’s reason (attribution):
Record child’s scale ratings:
Internality: Stability: Globality: 0 1 2 3 4 5 6 7 8 9 10
16. You are helping clean the house one day, and mom says you did a good job.
Write child’s reason (attribution):
Record child’s scale ratings:
Internality: Stability: Globality: 0 1 2 3 4 5 6 7 8 9 10
You did a really good job. I enjoyed doing this with you. What did you think of my stories?
320