Embed Size (px)
Citation preview

'
Report No. 9557-CHA
ChinaStatistical System in TransitionSeptember 22, 1992
China and Mongolia Department MICRC)FICHE COPY
East Asia and Pacific Region
Office of the VicePresident,DEC Title: STATISTICAL SYSTEM IN TRANSITI'
Author: RAJARAM, A.Extt. :82464 Room: Dept.:AS3C0
FOR OFFICIAL USE ONLY
U
Document of the World Bank
This document has a restricted distribution and may be used by recipientsonly in the performance of their official duties. Its contents may not otherwise
be disclosed without World Bank authorization.
Pub
lic D
iscl
osur
e A
utho
rized
Pub
lic D
iscl
osur
e A
utho
rized
Pub
lic D
iscl
osur
e A
utho
rized
Pub
lic D
iscl
osur
e A
utho
rized

CURRENCY EQUIVALENTS
(As of June 31, 1992)Currency Unit - Yuan (Y)
$1.00 - Y 5.46Y 1.00 - $0.19
FISCAL YEAR
January 1 - December 31
ABEREVIATIONS AND ACRONYMS
AFA - Accumulation of Fixed AssetsCPI - Consumer Price IndexDRC - Development Research CenterESCAP - Economic and Social Commission for Asia and the PacificEUROSTAT - Statistical Office of the European CommunityFIFO - First-In/First-OutGDP - Gross Domestic ProductGFCF - Gross Fixed Capital FormationGSO - Gross Social OutputGVAO - Gross Value of Agricultural OutputGVIO - Gross Value of Industrial OutputICP - International Comparisons ProjectI-0 - Input-OutputISIC - International Standard Industrial ClassificationMPS - Material Product SystemNMP - Nst Material ProductNVA - Net Value AddedOG - Own-GrainRPI - Retail Price IndexSNA - System of National AccountsSPC - State Planning Commissioi,SPB - State Price BureauSRC - System Reform CommissionSSB - State Statistical BureauTVE - Township and Village Enterprise

FOR OMCIUL USE ONLY
CHrNA
STATISTICAL SYSTBM IN TRANSITION
Preface
This report is based on the findings of a mission comprised of R.Chander (Statistical Advisor, DECVP, Mission Leader), Michael Ward (PrincipalEconomist, EAlCO), Mete Durdag (Senior Economist, EA2CO), Albert Keidel(Consultant), and KC. Yeh (Consultant), which visited China fromNovember 4-20, 1990. Shahid Yusuf (Lead Economist, EA2DR) joined the missionfor the first week while Chen Xingdong (EA2CH) assisted the mission in thefield. Benjamin King (Consultant) prepared background documentation for useby the mission members. Anand Rajaram (Economist, EA2CO) assisted with thepreparation of this report.
The mission was hosted by a team led by Mr. Long Rua, Director,Systems and Methods Department, State Statistical Bureau (SSB). The missionmet with various departments of SSB in Beijing and with officials of the StatePlanning Commission, the Development Research Center, State Price Bureau,Ministry of Foreign Economic Relations and Trade, the Academy of SocialSciences, and the Systems Reform Commission. The mission visited Chongqingand met with officials of the Municipal Statistical Bureau and the CountyStatistical Offices. The mission wishes to record its thanks to officials ofSSB for arrangements that allowed fruitful and constructive discussions.
The report reflects comments received from the Chinese authoritieson the discussion draft.
This document ha a restricted distribution and may be used by recipients only in the performance Iof their official duties. Its contents may not otherwise be disclosed without World Bank authorization.

- I -
STATISTICAL SYSTEM IN TRANSITIO
Table of Contnst
EXECUTIE Som . S**000 0**90 0 00 0 * 0 0 0 IV
Ao* IntroductiMon , . . . . . . * . * * . * * *0 * * * * * 1so Brief History. . . . . . . . .0 .a . * .0. * . . . 3Co Features of Chinal's Statistical System . . .0 . a * . . 5D. Agenda,fortheture .. ......... a.... v7R. Structu thReport ..............a .. 10
I. NIC. ACCOWtS In Cj= MRICES .. . . . . ... . . 11
AD Introduction t . . o . . . . . . . .. . . *. . . . . . 11B. Structure of the Statistical System . . . . . . . . . . 11
C. Chinals System of National Accounting . . . . .0. .. . 12D. ector Production and Incom. . . . . .. . . a. . . 24soFinal Expenditure Accounts . .o . . . . . ... . . .. . 34
III. U SElISECaR . . . . . .* * * * * * * * * * * *0 * * * 39
A' Introduction . . . . . . . . . . . . . . . . . . . . . . 39
a. Concepts and Hthods e o .. . . . . . . . . . .. .. . 39Co Coverage Issues . . . . . . . . .. .. . . ... . . . 45Dv Valuation Issues .. . . * . . . . . . ...... .a. .. ..... 47
IV. CHN'S RICE SYSTEm AND NATIONA ACO ATGgK= MCI$ . o o -0 .*.0.0. .S . . .0.*.0. 00 0S 0 S 0 * 0 49
Ao Prices in China . . . . . . . . . . . . . . . . . . . . SoD. Official Constant Prices, Compoar,abole Prices,g end
Def lators * * o * * * * * * 0 0 0 0 0 0 0 0 * * * 0 * 0 52C. Measureoet at Constant Pricos .O . a . a . . . . . . . 54
V. CEIICES 0 5 0 0 0 0 0 0 0 0 e * 0 0 a 0 0 a 0* 0 0 0 0 0 59
A* Introduction * * 0 * * * 0 * * * * * * o 0 0o 0 a 0 * * 59B. Chbna'c Price survey* *. * . .* * * 0 * * 0* * * * * * 59C. Role of the State Price3 uresu. o o oo*oo. . 63D. China'e Price Indices . . . . . . ooooooe * . . 64
S. Conclusion .0. .* * * * * 0 * 0 * 0 * * 0 * * 0 0 0 0 0 69

- ii -
Page No.
Vl* HOUSEHOLD SURVEYS . . . . . . . . . . . . . . . . . . . . . 70
A. Introduction . . . . . . . . . . . . . . . . . . . . . 70B. Rural Household Survey History . . . . . . . . . . . . 71C. Urban Household Survey History . . . . . . . . . . . . . 72D. General Survey Administration . . . . . . . . . . . . 74E. Samplings Rural Household Survey . . . . . . . . . . . 76P. Samplings Urban Household Survey . . . . . . . . . . . 77G. Urban Survey Coverage .. ................ 9 9 .9 9 99 78H. Own-Grain Population Size Estimates and Implications
for Analysis .**. . . . . . * * * * * . . . * . . 81I. Survey Content and Uasge ... . . . . . . . . . . . . . 83
VII. Q*UANTITATIVE ISSUES RELATED TO SSB's GDP ANDGROWT MEASURES . . ... .. .. .. .. .. .. .. .. * * * *. . . 85
A* Introduction 9 * . . . . . . .a . . * . . . . . . . . . 85B. Issues Important for Single-Year GDP Measurement
Corrections . . . . . . . * . . . . * . * . . . . . . . 87C. Adjustments to Historical Growth Trends . . . . . . . . 95D. A Proposal for Quantitative Estimates for
Apparent Biases .*.9.9.9.... **9**9 ... ... ......... 99
VIII. ASSESSMENT OF THE NEW SYSTEM OF ACCOUNTS . . . . . . . . . . 101
A. Introduction .. .* * * * .. * * * * * * ... * * * * * 101B. Creation of China's Hybrid System . . . . . . . . . . . 101C. Design cf the Full Hybrid System. ........... 102D. Structure of the Full Hybrid System . . . . . . . . . . 103Z. Features of the Hybrid System . . . . . . . . . . . . . 104F. The Next Phases for China's Hybrid System . . . .. . . 106
IX. ORGANIZATION AND TECHNICAL ASSISTANCE . . . . . . . . . . . 116
TABLES IN TEXT
2.1 Output (Value Added (GDP)] .. . . . . . . . 22
3.1 China: Output and Employment In the Service Sector,1952-89, Selected Years . . . . . . . . . . . . . a . . . 43
3.2 Gross Value Added, The Service Sector, 1987 . . . . . . . 443.3 Subsidies and Losses (1984) . . . . . . . . . . . . . . . 484.1 Price Deflation Methods by Sector . . . . . . . . . . . . 55
5.1 China's 1988 Price Indices . . . . . . . . . . . . . . . . 65
6.1 Chongqing Urban and "Nonagricultural" Populations . . . . 80

- iii -
TABLES IN TEXT (cont'd)
8.1 GDP by Industrzal Origin . . . . . . . . . . . . . . . . . 1118.2 CDP by Institutional Sectors . . . . . . . . . . . . . . . 1128.3 GDP by Social Sectors . . . . . . . . . . . . . . . . . 1138.4 Calculation of GDP by the Distribution Method . . . . . . 1148.5 GDP by End Use . . . . . . . . . . . . . . . . . . . . . . 115
GUMRT IN TSX
9.1 China's Statistical System . . . . . . . . . . . . . . . . 1219.2 State Statistical Bureau Organization Chart . . . . . . . 122

-iv -
cia
STATISTICAL MYSTEM IN TRANSITION
Execu&tIv Sunnelr
A. Over2ri
i. The tjA for Accelerated Statistical Lqfg.g. China has recentlybegun systematic and far-reaching statistical refoi-.s designed to accommodateits incraeingly market-oriented economy. The current phase of these statis-tical reforms has led to the introduction of survey methods to supplement fullreporting. In addition, China has attempted to modify its national accountingframework. A "Hybrid System" is the process of development that builds uponthe Material Product System incorporating Information on nonmaterial spheroactivities to calculate aggregates that approximate those In the UN's Systemof National Accounts. This repr-sonts a marked lmprovement over earlier adhoc reform arrang e0nt and shows considerable ingenuity in combiningproreform and International conventions. Given the scale and complexity ofChina's economy and statistical needs, the Rybrid System is en ambitious andchallnging program. However, the Hybrid System suffers from a variety ofshortcomings and may be insufficiently responsive to China's evolvingcircumstances, much less ChIna's future needs as economic reforms unfold.
ii. Long- and Short-term Transitions. China's statistical system iscurrently in transition--in two senses. In a long-term sonse, the system liIn transition from Its pre-1978 desigA to an eventual Chinese version of theUnited Nations' System of National Accounts (SNA), the basis of moet statis-tical system In use worldwide. The Material Product System previously in userelied heavily on the administrative collection of data recorded in a plan-oriented format and ignored nonmaterial sphere activities., The SNA, on theother hand, encompasses all economic activit_ioo. China's long-term reformgoal is an "SNA with Chinese characteriatica," and this statistical transitionis epected to lat at leat another ten years. Over the short term, China'ssystem is in transition from a system of ad hoc reforms introduced In the1980. to the Hybrid Systm's full Implewntation, scheduled for 1995. TheChInese see this as a necessary stage in the longer-term development of an"SEA w1th Chinese characteristics."
iII. Currnt e fos In Relation to SEA Standards. Chinese documentationfrequently refers to the Hybrid Systm itself as the "Chinese SNA," but theHybrid system falls short of SNA standards in four important respects* First,although the Hybrid System's national accounting framework hs introduced manySNA elemets missing In the IPS, the combination of activity classificationsand sector categories Is incomplete and lacks the versatility of SNA classifi-cation functionally oriented for a market economy. Second, data collectionchonnels underplinnig the Rybrid Systm are administrative and hierarhbleal,requiring partil data aggregation at lower levels in the statistical systemand resulting In lower reliability and higher cost then in a survey-orientedcollection system. Third, data In the Hybrid System are based almost entirely

-v -
on UPS statistical concepts at the grassroots collection level, relyinglargely on plan-oriented physical indicators and much le on market-orientedfinancial indicators, rasulting in distortions in reporting for some sectors,especially services. Finally, the Hybrid System Is based on pricing, valua-tion and reporting conventions which misrepresent actual levels of usefuleconomic activity in a variety of aector&, such as housing and in-kindemployee benefits. Subsequent reforms need to address all of thesesbortcomings before China can enjoy the greater accuracy and flexibilitypromised by the SNA.
iv. RoPortina of Out2ut, Income. and Final Use. Overall, China'snational accounts underreport output, income, and final use for many importantsectors because of (a) scope limitations to data collection, (b) distortionsin recording during grassrooto data compilation, (c) conceptual misrepresenta-tions of actual subsidy payments, and (d) insufficient value imputation tosubsidized free or low-cost transactions. Some of these influences trigger amultiplier effect, becuase higher household consumption valuation, for exam-ple, implies higher labor cost valuation for every ector in the economy. Inaddition to underreporting CUP components In current prices for any givenyear, SSB's present methods also exaggerate China's real growth rate--in largepart because CNP price deflator. rely on UPS concepts and underreport theimpact of price changes, resulting in insufficient corrections for inflation.Many of these issues will becoma more important as economic reforma--espe-ciall!' price reforms--continue, leading to even larger distortions.
v. pomesticallv-Funded Reforms and International Assistance. Recog-nizing the inertia of China's traditional statistical system and acknowledgingthe need for continuity with accustomed methodologies, this report recommendsa parallel two-track design to reforms beyond the Hybrid System. One trackwould continue to improve Hybrid System coverage through existing administra-tive and ad hoc survey channels, and a second track would develop--among otherchanges--independent SNA measures based on concepts and techniques thatreflect market-oriented financial data to measure output, income, and finaluse. The recommended program depends critically on a domestically-fundedlarge-scale modernization program supplemented by compatible internationalprovision of expertise, training, and computer technology.
B. a_tional Accounts
vi. Intesration of "Material" and "Nonmaterial" Variables. China's NPSnational accounts by definition report only "material" output and consumption,which ie to say, only output of physical commodities and those services makingdirect contribution to the production of physical commodities. At the sametime, UPS definitions treat depreciation as an intermediate-input category.National income by these definitions is reflected as Net Material Product(NMP), which it reports by sector of origin as well as final use categories,and which it measures in current prices, along with historical index numbersshowing real growth. The Hybrid System reports output In "nonmaterial"service-industry sectors such as health care, education, passenger transport,government administration, and residential housing. The Hybrid systemcombines nonmaterial services with UHF and depreciation satimtes to form itsofficially reported GNP statistics, which regularly appear by sector oforigin--but not by sector of use--measured In current prices, together with

- vi -
index numbers for historical real grow-th. Hybrid System estimates oi China'sGNP are thus largely an elaborate formalization of ad hoc calculations earlierin the 1980s, which estimates GNP by attaching depreciation and nonmaterialoutput estimates to measures of NMP generated mainly by traditional NP3methoda.
vii. Sources of Discrgnancv. The presently compiled GDP accounts byfinal-use category reflect internal inconsistencies and reporting distortions.In general, data collection presently underreports output and incomi, so thatwhen aggregnte estimates for these variables are combined with demand forintermediate production inputs, remaining output might be insufficient toaccount for the scale of goods consumed by households and government or usedfor investment and net exports. As a result, a discrepancy arises betweenofficially reported GNP and what would be obtained if shortcomings in thescope of data collection methods and valuation conventions were connected.
viii. Concern over the scope of coverage is greatest in sectors mostaffected by reforms, such as rural services, township and village enterprises,and services produced by the unofficial "floating" labor force of rural-urbanmigrants. In addition, with the breakup of administrative reporting throughthe commune system and with the conversion of agriculture to a householdproduction basis, reliability of farm output reporting has deteriorated. Farmreporting inconsistencies are most serious for grain, vegetables, and animalhusbandry. This report recommends--in addition to long-term ref!orms in datacollection methods--that in the short term, SSB make satisfactory estimates ofthe degree of underreporting by sector and incorporate these estimates intosubsequent GlYP statistics.
ix. Pricing and Undervaluation. A second major cause of underreportedGNP is the low valuation which Chinese prices and subsidy conventions assignto many act±vities--such as free enterprise housing and other benefits. MPSconventions also result in misr6porting of output in an industrial sector whenit belongs in a service sector. For example, commercial real estate servicesand most residential housing services have insignificant valuation. A secondmajor cause of GNP discrapancies arises from misinterpretation of governmentsubsidies, which appear in national accounts as compensation for (negative)enterprise losses rather than as government demand for (positive) output whichis subsequently distributed as public goods and services. These and otherconventions result in insufficient value imputations to economic activitieswhich have grown rapidly in their own right and which have indirect multiplierinfluences on the valuation of virtually all other sectors in the economy.
x. Implications for Real Growth. While present practices, on balance,tend to underreport current-priced GNP in any single year, other conventio-'and distortions result in overreporting for real economic growth. Theprincipal causes of overreported real growth are the too-low inflationmeasures used to construct GNP deflators. Consequently, a portion of reportedreal output growth is in fact due to inflation. In some cases, the datacollected are meant to measure real growth directly--using administratively-set "constant" prices--unsophisticated practices have reported current-priceddata instead. Finally, real growth exaggeration can be serious in sectorswith a preponderance of new products or in which unsalable inventory is being

- vii -
written down. Fuller implementation of SNA conventions would significantlyreduce such distortions in real growth rate accounting.
C. Data Sources and Collection
xi. Hig;h Potential for Improvement. MPS concepts and procedures con-tinu, to dr%minate data recording and collection methodologies. For example,full administrative reporting is by far the most important channel for outputstatistics and results in numerous distortions in a variety of sectors.Reliability is further compromised because data recording at the grassrootslevel is still tightly tied to definitions and categories no longer suitablefor China's increasingly profit-oriented economy. Sample surveys are well-developed only for the household sector--and even these have certainsyotematic distortions. For price surveys and indices, ad hoc reforms duringthe 1980s brought major improvements, but the price-reporting system remainsgrounded in MPS categories and on insufficiently robust weighti.ng schemes in asystem with many different prices for the same product. All-told, by far thegreatest potential for statistical system reform is in China's data collectionmethods, which currently are responsible for the most serious shortcomings innational accounting.
xii. Full Administrative Renortina. The principal feature of China'sbasic data collection is its reliance on full administrative reporting formost output statistics. Administrative data collection evolved from China'scentralized system of plan and production management, in that the samestatistics used to evaluate production and performance at the individualmanagement level also served as data for national output aggregates. Fulladministrative reporting has the convenience of speed and low cost for anindustrial system with a few large and centrally managed enterprises. How-ever, in China's rapidly diversifying economy in which the proliferation ofsmaller and more independent units is accelerating, the administrative report-ing system breaks down as its costs of maintenance increase and as incentivesfor underreporting strengthen. Furthermore, the actual data collected tend tooveremphasize physical output measures--a holdover from physical planning--which makes it difficult to check individual reports for internal financialconsistency. Reporting based more heavily on profit, sales and balance sheetdata--according to SNA guidelines--would help alleviate this weakness.
xiii. Household Surveys. SSB's household surveys--both urban and rural--are the principal tools for gauging consumer activity and citizen welfare, andin rural areas they provide critical information on the diversification oflabor and output away from fL ing. In general, China's household samplingtechniques and survey procedures have improved enormously dr. .g the 1980e andrepresent a relatively sophisticated capability. However, as a time wheneconomic reforms are rapidly blurring urban-rural distinctions, the surveyssuffer from their initial design, which treated the surveys mostly as a sourceof information on rolations and differences between rural farm villages andsubsidized urban households. Today, many urban workers remain officiallyregistered in rural areas, and urban household surveys omit them fromconsideration. Furthermore, as late as 1990, neither the urban nor the ruralsurvey provided any coverage of urban households in a third entirely newinmigrant registration category, because such households are outside thetraditional urban subsidy iystem for grain and other necessities. As the

- viii -
number of households in this category has increased, survey descriptions ofurban household life have become increasingly inaccurate. In spite of theseshortcominge, hwever, China's early succesaful experience in strengtheninghousehold survey techniquas provides a valuable base for expanding surveycoverage to other dimensions of the economy, especially to the measurement ofoutput in all sectors.
xiv. Price Statistics. A variety of price statistics to show the impactof inflation on va:ious transactions, including retail sales, urban and ruralhousehold cost of living, and agricultural output are compiled by SSB. Thesampling procedures for collecting price data for goods and services indifferent markets has improved dramatically throughout the 1980s, but becausethe major price indices originated with the prereform MPS system, severalImportant indices are either still under preparation or are unavailable. Themost important needs are for industrial producer price indices, purchased zawmaterial price indices, and construction price indices. However, the mostseriotas distortions in China's price reporting system result from weightswhich overemphasize transactions at subsidized low prices and underemphasizehigher-priced transactions on periodic markets outside the subsidized plansystem. For these and other rei.sons, subsequent phases in China's statisticaltransition should accelerate reform in price data collection and report4ng.
D. Recommendations and TechLical Assistance
3x. Domestic Modernization Proaram. The most important component inlong-term statistical reforms needed to meot SNA standards is a domestically-funded modernization program supplemented with compatible international provi-sion of expertise, training, and equipment. The overriding purpose of themodernization program would be to develop the collection of basic data thatembodies market-oriented concepts. Data collection would emphasize the use ofsurvey techniques based on economic and financial concepts. Design andimplementation of the modernization program should include collaborativecooperation from a wide range of statist-cally-oriented national ministriesand agencies, and one of its principal purposes should be a dramatic reductionin parochial statistical secrecy. This report agrees with SSE on theusefulness of an early seminar to review the many still poorly-understooddimensions of China's statistical system and familiarity with SBA standards.
xvi. Manyower DeveloQment Stratezy. This report recommends that SSBprepare and implement an appropriate training and skill development strategyas the most important part of its modernization program. The manpower devel-opment strategy should concentrate on national accounting, sampling methodolo-gies, and the use of microcomputing technology. Its conceptual orientationshould emphasize SNA principles and standards, and it should draw heavily onexisting materials and programs available from other countries with well-developed SMA systems and from international agencies engaged in statisticalassistance. The manpower development strategy should include programs at allleva_s of t-ie statistical system--but especially at the local level--and inaddition to courses, classes, and seminars it should include foreign studytours and training programs. Technical sophistication at provincial and evenome county-level statistical offices in China is already relatively high, andalthough staff exposure to SEA concepts is in general minimal and insufficient

- Ix -
for subsequent stages In China*' statistical transition, the potential forrapid Improvement Is high.
zWvi. Cgout, Zghnologv China's statistical modernization program*hould Include Improved computer facilities at virtually all levels, espa-claly at regional and local levels. In this reagrd, hovever, the moderniza-tion program most iu diate taok is a full evaluation of oxisting capacity,projected needs, and suitable technologies. Feasibility studies should payespecially careful attention to computational needs at levels below tho cen-tral level, to enable dat. manipulation capacities adequate to benefit fromtho advantages of a fully Integrated data collection network.

STATMST!CAL SYSTEM IN TRANSITION
I OVERVIEW
A. Introdugtion
1.1 Since 1978, China has undertaken statistical system reformsa partof overall market reforms in its centrally planned economy. By 1991, China'.statistical system was in early transition between the original pre-reformsystem ond an eventual 'ystem closely related to those used by most countriesin the world. China'a original national accounting framework--adapted fromthe system used In the Soviet Union--was a version of the wvll-known MaterialProduct System (MPS). It relied on full administrative collection of datarecorded In a plan-oriented NPS conceptual format. The eventual goal ofChina's statistical reforms is a national accounting framework based on theUnited Nations' System of National Accounts (SNA). The SNA relies heavily ondata reported in a market-oriented conceptual format. As part of thetransition to * future national accounting system, China's State StatisticalBureau (tSB) ha .itroduced a useful "hybrid national accounting system" (theHybrid System), which gonerates national accounts summary statistics compati-ble with both HPS and SA. SSB expeeto to complete full Implementation of theHybrid System (the Full Hybrid System) in 1995. In the meantime, SSB hasalready introduced early phases of the Hybrid System (the Early HybridSystem).
1.2 This report reviews China's Hybrid National Accounting System, bothat its current Early Hybrid stage and in its anticipated Full Hybrid form.Both Hybrid Systems are under continuous improvement, and consequently thisreport acknowledges that its concluso'ono reflect incomplete information aboutthe full extent of current Hybrid System development. Nevertheless, whilenoting that 3SB is attempting to develop a practical and complex bridgebetween the IS$ and the SA, this report concludes that the approach suffersfrom several serious weaknesses. For example, data collection methods used tosupport the Hybrid System still depend heavily on HPS institutions andprocedures, resulting in gaps and distortions; the Full Hybrid is unlikely tochange this dependency. Secondly, Hybrid System categories and definitionscontain inconsistencies with the complete SNA which complicate Interpretationof statistical results. Finally, current data reporting is based largely on atraditional HIS price system, which frequently distorts the measurement ofuseful output. In light of these and other difficulties, this reportrecommends additional statistical reforms, which it considers most importantfor the next phase of the transition after 1995--beyond the Full Hybridsystem. As part of a national program to finance these additional statisticalreforms, the report further proposes a program of technical assistance fortraining and equipment.
1.3 In order to appreciate the complexity of China's current statisticalsystem, it is Important to stress that it is only an intermediate stop in thelong transition to global SNA standards. Before economic reforms began in1978, China's statistical system was designed to support the management of a

-2-
planned economy through full administrative data reporting. During China'sfirst 10 years of reforms, between 1978 and 1988, coverage and methodologygradually included surveys and supplementary calculations, until China's MPSframework had a crude makeshift SNA dimension. The system was still almostentirely dependent on administrative data reflecting MPS concepts and report-ing formats. With the design and compilation of a new input-output table for1987, China began development of its Hybrid System, which formalizes earliermakeshift SNA components and introduces many of the easier and less expensivesteps useful for introducing full SNA conventions and standards. Future:3togas in the transition to full SNA coverage will be more time-consuming andmore expensive. They will need to address three dimensions of the statisticalsystem. First, China's Hybrid national accounting framework--its categoriesand sector definitions--needs revision and much fuller elaboration. Second,data collection channels need to reduce their reliance on administrativereporting and significantly increase their use of sample survey reporting.Third, grassroots data recording needs to shift from formats based on MPSplanning concepts to formats based on SNA concepts. Further revisions to theaccounting framework should be relatively easy and inexpensive, but additionalreforms in data collection channels and grassroots recording formats will bemuch more difficult and expensive to introduce.
1.4 In spite of many improvements, data collection methods at the heartof China's Early Hybrid System are still MPS methods reflecting the originalneeds and capabilities of China's pre-1978 economy. At the central level, theState Statistical Bureau (SSB) sets reporting forms and standards and presidesover the collection and compilation of data. Provincial, municipal and localstatistical bureaus each perform a dual role: (i) receiving reports fromlower-level units and supervising supplementary data collection activities,and (ii) aggregating the information for transmission to SSB. Most recordingof statistics is done at the enterprise or production unit level, but foragricultural data since the break-up of China's communes in 1981-83, respon-sibility for basic collection of output information and for its transmittalthrough the statistical chain of command has fallen to village and townshipofficials. As a consequence, China's statistical system is still largelydependent on grassroots statistics originally intended for economic plans andbureaucratic enterprise management. For example, accounting practices at theproduction unit level typically pay close attention to main lMPS variables--such as commodity or "material" output--and under-emphasize the recording of"nonmaterial" service outputs, which are monitored through a system of make-shift surveys and ad hoc reporting forms. Beyond the main statistical systemmanaged by SSB, selected ministries and bureaus maintain parallel channels forgathering data from reporting units at the lowest levels of the system.
1.5 China's current price system presents a major challenge to a mean-ingful implementation of SNA standards because it maintains many of the essen-tial features of pre-1978 prices. The SNA is designed to measure and analyzethe extent of useful economic activity in a society. In other words, pricesand values recorded and totaled under the SNA are assumed to reflect the valueand usefulness to society of underlying output and consumption activities.These prices and values are called "market" prices and "market" values becausethrough market transactions they themselves maintain a balance of supply anddemand. In China, however, although many prices used for reporting outputvalue in both current and comparable prices approximate market values, many

- 3-
others are still centrally monitored and regulated, and a few are set outrightby government agencies. While price regulation and intervention are common inmoat economies, in China certain prices are still sufficiently distorted thatthey misrepresent the extent of economic activity. In some extreme butwidespread cases--such as for housing services--production and consumptionactivities are assigned little or no value at all.
1.6 In terms of China's macroeconomic national accounting framework,both the Early and Full Hybrid systems continue to use MPS aggregates, basedon Marxist-Leninist economic concepts, which it expands to include the mostbasic aggregates of the SNA. In this way, the evolving Hybrid accountingframework still segregates "material output" from "nonmaterial" output,because one is central in the MPS while the other is important in the SNA.Nonmaterial output sectors include a variety of nonmaterial services excludedfrom traditional MPS reporting (see Chapter III for details). Nonproductiveservices are still estimated at the central government level from a variety ofmakeshift reporting extensions and supplementary special-purpose surveys.Other important dimensions of Hybrid national accounting reflect thoincomplete nature of overall economic reforms, its dependence on MPSantecedents, and the financial and time limitations on more thoroughstatistical reforms. The central government still sets many low fixeddepreciation rates, based on historical costs. Many currently generatedsocial and demographic statistics were originally meant to satisfy the state'sneed for information on rural collectivization and delivery of rationed goodsto the cities, and these older statistical traditions impact on thecalculations of national accounting aggregates.
B. Brief History
1.7 The history of China's statistical system is important for under-standing the strength and durability of its MPS foundation. China establishedits statistical system before and during its First Five-Year Plan (1953-57),vhen like most other new economic institutions, it was influenced heavily bymodels adopted by the Soviet Union. Compilation techniques and conceptsadopted were based on Soviet practices. Centralization of statistical work,subordination to planning, adoption of the MPS, the emphasis on quantitativedata, and a strong preference for complete enumeration through admijiistrativereporting were main features of the system. Sample surveys employing proba-bility sampling did not feature in the gathering of data. "Key" and "model"surveys were used to gather data to probe and verify data obtained through thereporting system.
1.8 In the second period (1958-65), with the onset of the Great LeapForward and its aftermath, the statistical system experienced profound shocks.The distortion of statistical reports to meet politically established outputtargets, in the absence of checks and balances for verification of statisticalreports, severely tested the credibility of the system. In the wake of theGreat Leap Forward, legislation was introduced to reaffirm the importance ofaccuracy in statistical reporting. However, the basic organizational struc-ture and the methods of statistical work were not altered.
1.9 The third major period encompassed the Cultural Revolution and itsaftermath (1966-78) when the statistical apparatus was virtually eliminated.

- 4 -
There was no formal organization for gathering data, although some statisticalcompilations continued at the local level. Statistical work was restored in1974 but was, in part, hindered by continuing political uncertainties andchanges, which continued for a period after Mao Zedong's death in 1976. Inthe period immediately following the Cultural Revolution, the estimation ofmissing indicators, adjustment of data, and reconstitution of the reportingsystem were major preoccupations of the statistical authorities. No attemptswere made to change the essential features of the system or the methods usedfor collection of data, which continued to operate through a system of peri-odic reports (of 10 days, 1 month, 3 months, 6 months and annual periods) sentfrom production units.
1.10 The task of restoring the statistical system was signaled by theState Council in October 1979 when it adopted the "Decision on StrengtheningStatistical Work and Improving Statistical Organizations." The SSB wasremoved from the jurisdiction of the State Planning Commission (SPC) andplaced directly under the control of the State Council. However, at thegrassroots level, local government entities and party officials continued toexercise considerable influence over statistical activities. Distortions inreporting and the absence of statistical integrity were issues which emergedto the fore following the exposure of the Dazhai Production Brigade's inflatedreporting of grain output. SSB gained greater control over local-level sta-tistical matters. The expansion on a countrywide basis of SSB-managed samplesurveys using probability sampling techniques of household incomes and pricespermitted SSB to obtain independent data sets which bypassed the reportingsystem, thus providing some independent checks on data quality. SSB's controlover budgets for statistical work at the various levels of government, andinstitution of a system of random checks further strengthened SSB's role. Asignificant step in this context was the enactment of the Statistics Law ofthe People's Republic of China. The law gave SSB the power to control allst.atistical work, to investigate and correct misreporting as well as suspectedviolations of data integrity. It also gave SSB the right to impose legalsanctions.
1.11 The restoration and rehabilitation of the statistical system afterthe upheavals of the Cultural Revolution was largely accomplished by the mid-1980. and involved a series of adjustments and makeshift improvements to thebasic pre-reform system. This phase coincided with the introduction of eco-nomic reforms and restructuring of the economy. SSB responded to new needsfor timely, accurate and more comprehensive data. In terms of emphasis, SSBcommenced work on transforming the MPS aggregates into their corresponding SNAequivalents, in large part to provide international comparability and to sat-isfy the requirements of international donor agencies. Compilation of overallcurrent GDP estimates, along with the construction of a time series, was givenpriority. Since the economic reforms had introduced markets for some prod-ucts, with prices determined in part by market forces, the expanded need forprice statistics was met through the collection of prices in various marketsand the compilation of expanded indices of urban and rural prices. An indus-trial census was carried out in 1986. External trade statistics based on theStandard International Classification of Trade were collected beginning in1981. SSB extended its program of urban and rural surveys of households. Thedissemination of data became an important aspect of SSB's work with regularrelease of statistical bulletins, and the publication of the Yearbook starting

in 1981. Chinese and foreign researchers began to make international compari-sons, and obtain a fuller understanding of Chinese statistical methods.
1.12 SSB also moved ahead in a number of other areas which prepared theway for gradual introduction of the Hybrid System in the early 1990s. Thecompilation of input-output tables for 1981 and 1987 necessitated the collec-tion of new statistical series and interconnected data which<, in turn, led toimprovements in the coverage of the economy, especially in the services sectorwhich was growing rapidly as a consequence of the introduction of market-ori-ented reforms. New mechanisms for gathering information in the agriculturalsector were put in place following the elimination of the commune system. Thegrowth of township and village enterprises (TVEs), operating under relativelyless regulation, posed new challenges for the statistical system, as businessre8isters had to be developed and reporting arrangements put in place for thecollection of data from these medium- and small-scale enterprises outside thetraditional state-owned and urban sollective system. Alongside these changes,SSB began a reexamination of the pure MPS aggregation framework to prepare forits eventual replacement by th6 Hybrid System, that would generate economicaggregates to meet both MPS and SNA prescriptions. This effort continuedthrough 1991, so that by 1992 the Chinese authorities will have a dual systemof national accounting. Even the Full Hybrid System maintains basic MPS fea-tures to satisfy central planning requirements stil: important for managingthe current economic system. The Hybrid System's incorporation of SNA compo-nents, at least in part, is being pursued with two objectives in mind, namelyto provide information for purposes of international comparisons and as a toolfor measuring and monitoring the progress of an increasingly market-orientedeconomy.
1.13 The gains made by China in the statistical field over the pastdecade are indeed impressive and much has been achieved. Yet, much more needsto be done. The challenge in the years ahead is for China to put in place asystem that adequately responds to the changing institutional framework of aneconomy in transition to one with much greater reliance on market forces. Theexisting system of reporting from the grassroots level, through forms usingMPS-related concepts, will need to be modified into a system of questionnairesthat employ basic SEA accounting and economic concepts. In brief, China'sstatistical system, which at present is essentially an expanded bookkeepingsystem, will need to be transformed into a system whose orientation is statis-tical in the sense that it employs appropriate commercial accounting and eco-nomic concepts associated with a market-oriented economy. The transformationmust begin with an overhaul of the national accounting framework going beyondthe changes embodied in the Hybrid System, and proceed to the use of surveysand censuses to supplement administrative reporting.
C. Features of China's Statistical System
1.14 Three features of China's statistical system are most important forevaluating its effectiveness and suitability for a market-oriented economys(i) the formal framework in which final and intermediate national accounts arepresented, (ii) the way that basic data at the lowest level are reported,collected, collated, corrected, and sent to higher offices for aggregation andultimate publication, and (iii) the degree to which the nature of the statis-tical system itself--and especially its data collection arrangements--intro-
- 6 -
duces systematic quality and reporting irregularities. In other words, funda-mental to any judgments about the quality of Chinese statistics is a properunderstanding of how and why the basic numbers are put together at the primarysource of information.
1.15 Altering the National Accountina Framework. In the field ofnational accounts, the SSB has made serious attempts at least to change thepresentation of its measures of China'. development progress. At first, linthe middle 1980., supplementary SNA measures were limited to estimation of GDPand GNP for selected benchmark years. Government officials explained thatearly GNP statistics were based on the application of a crudely estimatedpercentage allowance for nonmaterial services and an adjustment for depreci-ation. Later in the 1980s, GNP was reported in three sectors (primary, sec-ondary, and tertiary) in current- and constant-priced time series going backto 1978. SSB also began reporting labor force statistics according to thesesame three categories. In its national accounting statistic! for 1990, SSBadded additional GNP subsector time series for industry, construction,transport, and commerce.
1.16 In spite of these makeshift adaptations of MPS data to SNA catego-ries in the latter 1980s, the basic underlying system of data organization,existing accounting guidelines and procedures, and standard reporting conven-tions at the enterprise level were altered very little. Nor do plans existto fundamentally change these procedures under the Hybrid System. Productiondata continue to be collected within the context of the traditional require-ments, focusing primarily on material output and physical volume measures.Nonmaterial sectors and service inputs, which are rapidly changing and expand-ing, are insufficiently quantified and covered. Activities outside directstate control and supervision are poorly captured in official statistics.Overall, shortcomings of the current transitional system are of two kindstthose that are random in nature, and those that have a significant skew in onedirection or another. SSB has endeavored to launch new inquiries to meetthese challenges, but more rapid progress will depend on SSB having enhancedauthority and additional resources.
1.17 DeveloDments in Data Collection. In spite of the comprehensivenature of the data collection network inherited by reformers in the 1980s,there were built-in incentives for distorted reporting at the most basic lev-els, incentives which continue to exist. China's MPS before i978 needed acomprehensive standardized statistical reporting system as a management toolon a short-term basis to monitor production inputs and outputs. More thanthis, the system of data collection also served to measure the degree of suc-cess or failure in physical plan fulfillment. In the pre-1978 period, suchregular data reporting rapidly became established as an integral element ofthe overall performance rating of the units concerned.
1.18 Although its data collection methods are going through a complextransition, the SSB still relies heavily on its traditional mainstreem bureau-cratic and plan management reporting procedures because, in principle, thisprocedure promises comprehensive, 100 percent coverage of all economic activi-ties. In recent years with the development of a dual-track statistical systemof surveys and comprehensive reporting, the situation has become more complex,and data collection for critical subsectors has increasingly relied on sample

- 7 -
*urveys. SSB is neverthelesa still guided by the bellef that for planningpurposes the state neods full information on economic activity. It furtherbelieves that, if same units ver- to slip through the not of enterpriseperformance monitoring, statistics would be Incomplete.
1.19 Many opportunities for error in the current systm are random innature. Because local officials and operatora samotmes maodify the data theysubmit to higher authorities and to the 8SB1 and because, further up the lineat the provincial and state levels where the data are compiled, there is noeasy way of discovering the modification, it is difficult to apply objectivemethods to test the reliability of the statistics. Indeed, few report form.are ever queried or returned for checking and revision, uless gaps have beenleft in the schedule. This is not least because 883 itself does not have thecapacity. While the degree of reliability varies according to the type ofdata, key statistics relating to unemployment, sector growth rates and pricemovments are good cases in point where Chinese officials themselves haveraised these concerns.
1.20 Basic Data Collection and Reporting Distortions. In spite of theattraction of comprehensive coverage through administrative reporting, theInextricable linkage between data collected as a basis for policy analysis,and data which report on the fulfillment of government objectives (which inmany Instances have the status of directives) lead* to Incentives and opportu-nity for reporting distortions. Under the circumstances, s*oo and possiblymany producing units will circumvent official Inspection and associated "in-depth* study not so much by meeting their defined goals, but by adjustingtheir books to appear to have done so. They reconcile differences in inputand output levels, or discrepancies between production end sales, for example,by adjuating changes in stocks. In this way, entorprises can paint a betterpicture than justified by their actual performanco. Some production unitsalso alter their records to take maximum advantage of various lvestment andexport Incentives and other subsidies. Thus, under the traditional comprehen-sive data collection system, the nature of the data colloction system itselfpromotes distortions in statistics on both the structure of production and thelevel of output.
1.21 What is more, newly introduced sample survey procedures, aspresently employed, may represent very little improvement over traditionalreporting methods. While allegedly "random," these surveys are often based onthe use of Incomplete sampling frames, mostly generated by the registrationprocess. Furthermore, the extraordinary high survey response rates that havebeen achieved in official surveys which, In most instances, are in the regionof 99 percent of the units chosen (with each unit providing allegedly100 percent full reporting) seem to reflect what are technically known as botha selection bias and a response bias. In China's eircumstances, the role ofofficial enumerators and their direct involvement In thee surveys can also beseen as having either a negative or positive effect on the nature of theresponses obtaind.
D. A enda for the Future
1.22 This report reviews existing statistical procedures and practicesand points out the methodological, conceptual, and computational shortcomings

- 8 -
that currently characterize the compilation of various statistical series. Anattempt is made to indicate how these practices influence the calculation ofnational accounting aggregates in both the MPS and SNA frameworks, includingcurrently published estimates of national income and GDP. This report notesthe distortions that exist in estimates of national output and income andtheir respective components under both MPS and SNA formats. From a macroeco-nomic policy viewpoint, the implications of these output and growth rate dis-tortions are serious enough to warrant a review of the existing nationalaccounts by SSB, acting collaboratively with major state agencies and externalnational accounting experts. Chapter VII contains a number of specific recom-mendations in this regard.
1.23 The report goes on to assess SSB's proposed Full Hybrid System ofnational accounts, which will permit the calculation of both PMP and GDP esti-mates. The report questions how much the Hybrid System will be able to sat-isfy China's desire for a system to serve the needs of a "Socialist Commodity-Planned Economy." It should be noted again that the Hybrid system will retainan MPS orientation at its core. The weaknesses of the NPS, as an organizingframework for national accounting, have been widely recognized by countriesthat have traditionally employed the MPS system. Most of these countries arenow--like China--in the process of adopting the SNA. If China were to treatits Hybrid System as the end-product in its transition to a national account-ing system compatible with widespread market activity, it would be the onlymajor country that intends to retain a core reliance on the MPS approach tonational accounting. This report argues that the Hybrid System will not suf-ficiently articulate China's needs over the longer term, and hence this reportproposes further reforms in the direction of a full SEA--or, at least, a fullSEA with Chinese characteristics.
1.24 Chapter VIII recommends that China eventually adopt the full SNA,because of China's need for a tool for managing its vast and increasinglycomplex economy, and as a basis for improving its development strategy basedon more accurate international comparisons. The report concedes, however,that adoption cf a full SNA framework in the immediate future would be prob-lematic, because present data collection arrangements will not permit such arapid introduction. Reforming the statistical system with all its data col-lection complexities will take time and will, of necessity, have to precedeactions on the national accounting front.
1.25 The report argues that, as its next step, SSB should retain a dualsystem that permits calculations of both MPS and SEA aggregates (such as NetMaterial Product or NMP, as well as GDP). However, GDP calculations should beorganized more systematically within the context of a clearly established setof tables employing well-defined classifications, accounting rules and conven-tions that recognize world standards for the SRA. The report therefore,recommends that SSB move forward in three distinct phases:
(a) review and adjust the presently evolving Hybrid System of nationalaccounts, eliminating systematic distortions as much as possible;
(b) introduce, alongside tte maturing Hybrid accounting system, a paral-lel interim SNA-based set of accounts; SEA-based concepts should be

-9-
embodied in sample surveys and into the administrative collection ofdata; and
(c) fully adopt the SNA at the end of a transition phase spanning fiveto seven years during which SSB should train its staff and introducechanges in the procedures underlying the recording and collection ofprimary data.
1.26 China's long isolation from the international statistical communityand the 1966-76 Cultural Revolution left legacies which, although rapidlydisappearing, are still evident in the statistical system. One of these lega-cies is a general scarcity of highly skilled statistical personnel and ashortage of specialists familiar with the SNA and compatible techniques.Modernization of the statistical system and the introduction of such adifferent approach to statistical work will demand the upgrading of skills.Training, therefore, assumes the highest priority. Given the size of China'sstatistical system and the number of personnel involved, the process of train-ing will take time. A dual approach is required: training senior officials byexposing them to international statistical practices and approaches, whiletraining the bulk of statistical personnel through well-managed in-countryprograms at various levels of the statistical system. Recommendations alongthese lines are outlined in Chapter IX, built around proposals that SSB itselfhas identified in part. International technical cooperation in this regard isessential, and it is recommended that a program--to complement SSB's ownefforts--be developed and funded for this purpose.
1.27 Although SSB has made progress in adopting modern computing technol-ogy, particularly in processing the population census of 1990, existing com-puting capacity is limited. The availability of hardware at the local leval,and at the provincial and county statistical offices, in particular, fallsshort of requirements. It is recommended that additional hardware beinstalled. While SSB itself has computing capacity for aggregating and tabu-lating summary returns from the lower levels of the statistical system, itneeds to enhance its capacity for handling larger volumes of data that willinevitably flow as new surveys and collections are introduced. Furthermore,if the recommendation that SSB receive a selection of original forms, ratherthan just provincially aggregated returns, is adopted, SSB will require alarger computing capacity. For these reasons, it is recommended that SSB seekauthority to acquire additional computing hardware, and, in parallel, developappropriate software.
1.28 The report further argues, however, that a large training and hard-ware acquisition program is possible only if the goverment expends signifi-cant resources to introduce a parallel interim SNA-based data recording andcollection network of the kind described above. Changes in design and comput-ing capacity need to be matched by introduction of a basic and comprehensivesample survey data collection system independent of traditional enterpriseperformance statistics and management personnel. Without investment now in aninterim SNA-based system, China by the end of the century will still find thatits national accounting measures of economic performance provicb insufficientsupport for short-term macro policy and insufficient background informationfor improving longer-term development strategies.

- 10 -
B. Structur. of the Report
1.29 The following chapters examine the MPS-SNA hybrid system of nationalaccounting with a view to identifying its adequacy for macroeconomic policyformulation as well as lntornational comparison. Chapters II and III providea detailed description of the methods used to derive current-price estimatesof GDP and identifies tho problms of valuation and coverage in need of cor-rection. Chapter IV discusses China's price system and the stimation ofnational account at constant prices. Chapter IV is especially significantfor understanding the distortion in measurement of inflation, real growth ofGDP, and growth of its sectoral components. Chapter V reviews construction ofprice indices In China. The design and coverage underlying household survey.is the subject of Chaptor VI. Chapter VII provides an as..essment of the quan-titativo significance of distortions in the various components of China's GDP.This assessment suggests that making appropriate corrections to the measure-ment and coverage errors will, in not, lead to an upward adjustment of theestimate of China"s GDP. On the other hand, estimates of the rate of growthof GDP will tend to be revised downward. Finally, Chapter VIII provides anassessment of the hybrid system of national accounta, and Chapter IX closeswith recommendations for organizational and methodological reform.

- 11 -
II. NATIONAL ACCOUNTS IN CURRENT PRICES
A. Introduction
2.1 This chapter, together with Chapter III on the service sector, pro-vides a review of the current estimation of Gross National Product (GNP) ingurrent prices, one of the moat important aggregate statistics. These twochapters xplain the special features of this Early Hybrid process and itsorigins In China's prereform Material Product System (MPS) methodologies.Theme chapters aloo identify the main drawbacks in China's current-pricenational accounting, many of which result from continued dependence on MPSconcepts and data collection arrangements. In terms of statistical data gath-*ring, the current Early Hybrid System relies heavily on comprehensive report-ing by production units, even though it has added some household, farm, andenterprise survey. In calculations and final statistics, the Early HybridSystem supplements its MPS reporting with basic SNA aggregates, such as GNPand its closely related GDP counterpart, but an MPS orientation continues toset and articulate the Early Hybrid System's national accounts, including itsintrinsic axioma, definitions, classifications, and assumed interrelation-ships.
B. Structure of the Statistical Syste
2.2 The organizational structure of China's statistical system is basedon centralized leadership at the national level, with responsibilities dis-tributed to different levels of the goveramental machinery. Acting under theauthority of the State Council, the central leadership's role is discharged bythe State Statistical Bureau (SSB), which has the overall responsibility fordefining statistical priorities, standards, methodologies and for arrangingthe collrction of statistical information by lower-level entities at the pro-vincial, county and municipal levels. Thus, SSB is in charge of organizing,directing, and coordinating statistical work throughout the nation. At theprovincial level, the Provincial Bureaus perform functions for, and on behalfof, 8SB, but also undertake other statistical tasks that are determined andfunded by Provincial Governments. Local governmental-level bureaus executestatistical programs within their respective jurisdictions and collect datathrough reporting forms from reporting units. These reports are then aggre-gated and the results transmitted to the Provincial Bureaus. The ProvincialBureaus in turn aggregate reports from the local statistical offices for even-tual transmission to SSB. SSB has the responsibility for aggregating reportsreceived, and consolidating survey results, apart from the preparation ofnational accounts. The statistical organization of China is best depictedgraphically. Chart 9.1 shows the interrelationships between various organs ofthe government. SSB's internal organization structure is depicted in Chart9.2.
2.3 Functional Ministries at the central level also play a significantstatistical role. These statistical units in turn have statistical cells atthe provincial and local levels. The data gathering activities of these non-588 statistical agencies are similarly organized as in the mainline gtatisti-cal system managed by 8SB. Although these statistical units are separatelyfunded and managed by the functional ministries, SSB's role is that of provid-

_ 12 -
ing professional and technical guidance to staff in these units at variouslevels of the system. Thus, even though there is a dual-track system inplace, SSB can and does have overall jurisdiction in guiding statistical work,and all staff belonging to the statistical cadre.
2.4 Underpinning the entire statistical system are the staff engaged instatistical work at the enterprise or production unit level. SSB officialsindicated that therc are approximately 70,000 staff engaged in statisticalwork at and above the county lovel. If account is taken of personnel at theenterprise level, there are approximately 800,000 workers in all engaged onstatistical work. This number is considerably enlarged when a special surveyor census is undertaken and it should be noted that since the centraL govern-ment funds the budgetary expenditures of the provincial and local statisticalbureaus, SSB is able to exercise control over statistical operations through-out the nation. However, the provincial bureaus do obtain supplementary fund-ing for those tarks that are to support purely local needs. These supplemen-tary resources are used for special collections on topics not mandated by SSBor for enlarged coverage of reporting units.
C. China's System of National Accounting
(a) Valuation and Pricint
2.5 The legacy of China's pre-1978 MPS valuation framework heavilyinfluences China's Early Hybrid System of national accounting. the NPS frame-work, with its insignificant valuations for many bartered and rationed goodsand with its many state-determined prices, distorts the measurement of econo-mic activity. Some of these distortions, such as the near-zero valuation formany housing services, are obvious and can be fairly easily corrected. Otherdistortions are more subtle and much more difficult to correct, such as thecombination of nonmarket input and output prices in some energy sectors, acombination which often results in official data showing enterprise lossesand large government subsidies. These data misrepresent the contribution ofthese energy sector.; to the national economy and result in a statisticalunderreporting of .htsir corresponding value-added components in GNP. Thefundamental difficulty with relying so heavily on MPS valuation principles isthat although they refer to actual transactions, many transactions in Chinaare not market transactions. That is to say, goods and money change hands inmany transactions, but tbe amounts involved are determined by bureaucraticregulations, and the prices implied by the transactions frequently have littlebearing on the social usefulness of the goods and services involved.
2.6 Controversy over the correspondence between actual price and under-lying value is as old as Economics itself. This theoretical issuese practicalsignificance, however, is rarely as clear-cut as in China. China's prices andvaluation conventions significantly distort officially reported GNP. Butpractical and consistent retmedies are hard to prescribe, and more accuratemeasurements are dependent upon China's gradually unfolding national pricereform. Nevertheless, three pricing dimensions are important for evaluatingChina's national accounts. First, near-zero valuations for many transactionsand low HPS-based estimates for poorly reported sectors are a major source ofdistortion in overall results. Second, subsidy accounting conventions, whichdistort the role of government finance, introduce irregularities in reporting

- 13 -
for some sectors--for example, when they misinteipret (posi.tive) governriatpurchases of output as (negative) government subsidies. Third, the data col-lection process often reports transactions at their actual government-regula-ted prices rather than converting them to values based on more meaningfulmarket-oriented transactions, and as a result, the corresponding GNP compo-nents themselves misrepresent the true extent of economic acrtivity. Questionsof pricing and valuation appear throughout these and subsequent chapters.Chapter VII addresses their possible quantitative signiftcance.
(b) Statistical Catemories gnd Sepqtors
2.7 As noted earlier SSB has endeavored, since the late 19708, to deriveSNA-based estimates of Gross Domestic Product and Groos National Product fromnational accounts based on the MPS by using broad adjustments for elementsthat are excluded from Net Material Product (NMP). These adjustments cover(a) output estimates for those activities that are considered "nonmaterial" inthe MPS and (b) the addition of estimates for depreciation. The latteradjustment is made to obtain "gross" national income measures like GDP and GNP(in contrast to NMe, which is net of depreciation). This makeshift method-ology remains at the heart of China's current estimates of national income,which nevertheless do have significantly more detail and internal consistencythan estimates from earlier phases of China9s statistical transition.
2.8 The present accounts show separate information on both MaterialProduction, recognized by the MPS, and Nonmaterial Production, an Importantpart of the SNA. The two areas are defined as follows:
(a) Material Droduction includes five sectorst agriculture; industry,transportation, construction, and commerce. The dominant materialproduction sectors recognized in the NPS in China are the primaryand secondary sectors (see below).
(b) Nonmaterial Droduction sectors include all kinds of services otherthan commerce and certain personal transport services. It should benoted that commerce is statistically classified as part of the mate-rial production sector. There are many areas where material andnonmaterial services cannot be easily distinguished and hence sepa-rated from each other in practice. Even when measuring output in abranch of industry, particularly in services, the distribution meth-od, i.e., income approach, is used.
2.9 Output, investment projects, and labor are classified as productiveor nonproductive according to whether they are directly related to materialproduction. Productive projects refer to those which increase material pro-duction or that directly serve material production. Nonproductive projectsrefer mainly to such services as residential building services, public ser-vices, and facilities for scientific research, culture, education, and healthcare.
2.10 China's GNP estimates combine both productive and nonproductiveactivity and divide output estimates into three main sectors: the primary(agriculture, animal husbandry and fisheries), the secondary (mining, manufac-turing, water, gas and electricity, and construction) and tertiary (all other)

- 14 -
industries. This section of the report reviews general Early Hybrid Systemmethodologies, whilo subsequent sections focus on individual sectors in moredetail. In considering output estimates for different sectors, the underlyingvaluation procedures and the extent of their coverage have direct and indirecteffects on their ohares of national output. Thea- procedures are especiallyimportant when considering different types of enterprise. Generally, fastergrowing private and collective enterprises are far less well accounted for Intotal output analysis than those in the State sector. As these nonstate-sec-tor operations increase their share of total output, the problem of theiradequate valuation will become increasingly significant.
2.11 Enterprise types and their nonproductive status deserve specialattention because so many MPS-based statistics refer exclusively to state-system productive activities; nonproductive, rural, and other nonstate-systemactivities receive much less emphasis if they appear at all. If a statisticio comprehensive in the SNA sense, it is often refereed to as "of society" or"social," e.g., total investment of soclety, social labor force. The additionof the words "social" or "of society" means tht da;tai nclude all forms ofawnership. For example, "social labor force" includes all employed and self-employed indlviduals by all kinds of ownership units in urban and rural areas,and "social" consumption essentially refers to goods and services collectivelyprovided by enterprises or the state where the specific individual beneficiarycannot be directly identified.
2.12 The Early Hybrid System's major extension beyond the traditional MPSis its addition of information on nonproductive tertiary activities. Thetertiary industry as defined by SSB, however, roughly corresponds to only partof the SNA service sector, and there are important gaps and differences (seeChapter III). The Early Hybrid System tertiary sector comprises four broadcategories of service industries. The first category includes the followingdistributive services: freight and passenger transport, post, tolecommunica-tioas, commerce, food cavuring, material supply, marketing, and storage. Thesecond category consist- of activities serving production and personal con-sumption, such as financial institutions, insurance, geological surveys, tech-nical services, consultative and information services, real estate, publicutilities, and personal services (tourism, hotels, barber shops, bathhou4es,laundry, photo shops, repair shops, and miscellaneous personal services). Thethird category includes the social services, such as oducation, cultural ser-vices.. radio and television broadeasting, research and scientific services,health services, sports and social welfare services. The fourth categoryrelates to public services, including public administration, national defense,police, and political and social organizations.
(c) Data Collection
2.13 China's present national accounts are a significant Improvement overthe pre-1978 MPS accounts and their post-1978 makeshift extensions, and manyof those extensions included new statistical elements and data collectioncategories. Neverthelesa, the overall Early Hybrid system data collectionframework is still based fundamentally on MPS concepts and definitions. As atransitional arrangement, the MPS foundation has a wide variety of importantadvantages, including continuity, reliability, familiarity, and its vast sup-porting network of skilled and trained stutistical personnel. As a foundation

- 15 -
for more useful BRA-oriented national accounts at later stages in the transi-tion, however, the Hybrid data framework is disadvantaged by its MP$ origins.
2.14 The whole approach and emphasis of information compilation in marketeconomies is different from that of a planned economy. It represents a sig-nificant movement away from a data system that focuses primary attevtion onphysical output measurement. The treatment of stocks (inventories)--and theperception of their importance--highlights several of the fundamental differ-ences between IMPS principles and market-oriented SRA philosophies. In theformer, stocks are seen as a source of wealth and a protection against short-ages. Seen in an SNA context, however, any significant change in stock. rep-resents a potentially important signal that may reflect a shift in marketconditions. It indicates a possible switch in the pattern of demand. The twoapproaches therefore lead to entirely different underlying concepts of valua-tion. In the centrally planned and essentially supply-driven case, not incomeand GDP tend to get exaggerated when inventories accumulate; in a market-ori-ented demand-driven system, a portion of the value of unsalable stocks isoften written off and accounted for as a cost, resulting in a reduction inGDP.
2.15 Because of its MPS data foundation, China's national accounts sys-tematically understate real income flows in many areas of output measurement,such as the implied depreciation of capital, the imputations of income fromhome ownership, the value of own-account production by households, and theproduction of services. Even when such gaps are taken into account, the prob-lem is not always satisfactorily resolved because of the prevailing pricedistortione which frequently fail to refl'et relative scarcities in theeconomy. It appears that even a unifori,': consistent "cost-plus" basis ofpricing which might approximate average costs, even if it did not reflectrelative marginal costs, does not function well in China.
2.16 Quite apart from the problem of datermining the appropriate level ofoutput and net income generated by enterpL -as, the data framework has cor-responding difficulties in monitoring chans:_C in prices and production. Asdescribed in more detail in the following sections and chapters, these arisefor methodological as well as for practical s aasurement reasons. This Li notleast because of the different sets of prices .hat prevail for the same prod-uct in different markets.. These different p ices are frequently decreed bypolitical/administrative fiat, rather than being determined by economic for-ces. In addition, for time series analysis, there are problems of coverageinvolving the incorporation of new products as well as new enterprises, espe-cially at the township, village and below-village level. At the same time,the data need to take account of the cost of disposing of worthless goods.These are goods that nobody wants but whose values are nevertheless stillreflected in current output series. In addition, the maintenance of consis-tent and continuous historical series poses problems. This will become pro-gressively more an issue as the government succeeds in steering its economythrough price reform and other economic reforms.
(d) National Accountina Aaareaates
2.17 To understand how current-priced GDP is calculated in China, it isfirst necessary to know how the various aggregates are compiled, since the

- 16 -
traditional material balances still form the basis for its SNA aggregates. Adescription of how Hybrid System estimates are obtained will clarify deficien-cies inherent in the basic data and impli.ed inconsistencies in the resultingaggregates. Apart from a certain amount of self-selective distortion in thebasic data, Chinese authorities explained that thay are not entirely happywith the regular statistical returns coming up through the traditional routefrom the enterprises to the counties, municipalities and provinces. In com-piling national accounts, SSB has encountered problems relating to the avail-ability of statistics in the form needed (specifically with respect to servicesector measurement in all areas of activity), difficulties over the absence ofappropriate classification schemes that are internationally recognized, andgrowing gaps in the dc.ta provided by the provinces, ministries and, especi-ally, TVEs. These issues are further explored in this and the next two chap-ters.
2.18 Responsibility for compiling national accounts aggregates lies withthe SSB's Department of National Economic Balance Statistics (the BalanceBureau). The Balance Bureau gathers statistics from all the other bureaus inSSB and from elsewhere in the government system (usually the Planning Bureausin other Ministries). It uses these data to estimate, correct, and reconcilereported data, combining them into mutually consistent national aggregates andinput-output table components. The Balance Bureau is therefore in a positionto exercise considerable judgment in the process of deriving current-pricedGDP and other national accounting aggregates. This process is summarizedbelow.
Derivation of National Accountin_ Aaarenates in Current Prices
2.19 China's currently published official GNP statistics begin in 1978,but the early figures are mostly estimates extrapolated backwards from base-line studies conducted some years later. The most recent GNP estimates areanchored on the 1987 input-output table as the main reference point. Thistable provides a framework for both consolidating and integrating data fromdiverse sources. It contains the most independent information and providesthe clearest picture of the relationships between sectors. (See below paras.2.35-2.39 for further discussion of China's 1-0 tables.)
2.20 Depending on the activity concerned, national accounting aggregatesare compiled using a combination of three independent approachest the produc-tion, distribution (income), and expenditure approaches. In all materialproduction sectors of the economy, both the production and distribution methodare combined to obtain estimates of value added. Before 1985, the incomemethod--relying mostly on tax records and report forms--was used; but after1985, following the Census of Industry, information in both formats was col-lected at the enterprise level which was responsible itself for calculatingenterprise NMP components. Imbalances at the enterprise level were oftenreflected in adjustments to data on changes in stocks.
2.21 Combined Production and Income A2n1roach, China's GNP statistico arecompiled primarily on an industry of origin basis rather than on a finalexpenditure basis, although this differs by sectors. Given the MPS legacy,value added estimates for primary and secondary sectors are compiled initiallywith the production approach from calculations of the difference between each

- 17 -
sector's Gross Value of Output (GVO) and its cost of material inputs, withnecessary adjustments made for depreciatiov and the treatment of nonmaterialservice outlays and interest charges. In addition, and almost universally forservices, income (distribution) figures from financial statements and taxreturns are often used to compile detailed sector estimates of value added.In essence, therefore, current calculations of China's GNP essentially involvean adjustment to the system's traditional Net Material Product (NMP) value-added measure, since IMP is the summation of material-sector GVOs into GrossSocial Output (GSO) for the nation, from which intermediate consumption esti-mates are then deducted. For the earlier years of China's current GNP timeseries, roughly 13 percent was simply added to corresponding NMP levels toaccount for the not output of the services sector. Presently, however, GNPaggregates include much more detailed estimates of (tertiary) service sectorsubtotals.
The Distribution (Income or Transfer) Approach
2.22 At the core of national aggregate estimates is the v'SO (Gross SocialOutput) of enterprises which, from the perspective of the distribution (valueadded) viewpoint, is equal to the sum of wages, salaries and benefits, profit,taxes, etc , as described below. The main sources of income data are taxreturns, household surveys, and the financial reports of enterprises. Inprinciple, estimates of production and expenditure are also made, respec-tively, by sector in the case of output, and in terms of overall aggregatesfor final expenditure. This approach to net income measurement is used exclu-sively in determining the contribution of the tertiary sector to nationaloutput and is also adopted in those sectors where the estimation of intermedi-ate consumption is problematic. Estimates of GSO at the enterprise level arederived from the followings
Wages and Salaries4 Intermediate inputs of commodities related to production, including
the commodities used in providing "nonproductive" services;+ Benefits to employees (welfare charges, medical care, trade union
activities, etc.)+ Taxes paid to Government and other transfers, less subsidies;* Profit (including, implicitly, interest);* Other miscellaneous charges (such as consumption of nonmaterialso in
record of production).- Gross Social Output
When aggregated across enterprises by industrial sector, the result is GSO forthe economy as a whole.
2.23 In general, prcLits and taxes are derived as a residual at theenterprise level, except in agriculture where profits and taxes are the sum ofagricultural taxes and a comparatively small amount of profits in agriculturalenterprises, and specifically state farms. The main residual is income fromself-employment in agriculture.
2.24 Estimates of the current-priced gross product (output) of an enter-prise are made on the basis of sales or using the so-called "first price"method. The "first price" method in much of agriculture and for Township and

- 18 -
Village Enterprises (TVEs), is the product's or crop's first recorded price ina calender year, which is used for the remainder of that year as the "currentprice" and multiplied by regularly reported physical output statistics col-lected mostly through the traditional reporting network.
2.25 Indirect Taxes and New Products. In addition to the MPS data issuesmentioned above, two methodological problems complicate the measurement ofvalue added in current pr-test the inclusion of indirect taxes in value added,#nd the pricing of new products 1/ As noted earlier, indirect taxes aretreated as a factor payment in SSB's distribution approach. This procedurecreates some difficulties in international comparison. First, it results inpu estimate of value added larger than if it were measured in terms of truefactor cost. Second, because implicit indirect taxes in China are leviedlainly on industrial products rather than agricultural products, the SSB'svaluation procedures overstate industry's share in GDP, compared to what itvould be using factor cost standards. For growth rate analysis, industry'soxaggerated share in GDP is equivalent to over-weighting industrial outputgrowth, which has been much more rapid than for agriculture both over the lastfour decades and In the latter 1980s. This over-weighting results in a GDPgrowth rate higher than would have been the case if the price weights were netof China's Implicit iudirect taxes. The issue is complicated because implicittaxes and subsidies are often indistinguishable from a variety of artificialelements in China's price system.
$.26 Pricing for new products introduces a second set of complications,ihich became a significant concern very early in the reform era. New productsare priced at the average cost of trial production plus 5 to 10 percentprofit ./ Because of diseconomies of scale and the lack of experience atthe initial stage, costs are generally higher than at a subsequent stage whenfull production has commenced. Hence, the prices of new products are ratherhigh. Over time, unit costs decline, but the prices of these products oftenremain at their high initial levels--for two reasons: the enterprise producing',he nw product is reluctant to lower the price because it would reduce over-all profits; and, secondly, the tax authorities oppose a price decline becauseIt would reduce state revenues.3/ This problem became more widespread asreforms deepened in the 1980s.
2.27 In principle, the use of high initial cost estimates to set pricescoupled with declining costs results in a rapidly increasing value added per
1J There are also problems in the SSB's underestimating depreciation and theuse of arbitrary price weights that favor the heavy industries. Theformer practice tends to underestimate, and the latter overestimate thevalue added in heavy industries relative to that in the light industries.To some extent these biases offset each other.
Xu Yi, Chen Baosun, and Liang Wuxia, Problems of Prices Under Socialism(in Chinese), China Public Finance and Economic Publishing House,Beijing, 1982, p. 142.
Hu Changlun, Study of Prices (in Chinese), People's University Press,BeijIng, 1982, p. 48.

- 19 -
unit of output for new products. In physical termo, the growth of new prod-ucts is generally rapid because of the start from a low base. Consequently,where it occurs, a high rate of growth of physical output and an increasinglylarge value added per unit of output combine to yield a rapidly growing netoutput in current prices, This-particular phenomenon often leads to unwantedlnventory build-ups, described above. Some so-called "new products" (of dif-ferent color or size) experience slow sales, but stocks pile up and arereported as new output at full value.
2.28 Traditionally, most new products were found in the machine-buildingindustry. In recent years, howe%er, more new consumer goods have appeared inthe marketplace. In particular, many products produced by rural industrieshave been classified as new by the local authorities to justify higher pricesand to maximize profits. Growth rates for a number of such industries aretherefore probably significantly overstated.
2.29 For the reasons discussed above, the estimates of the share ofIndustry in both NMP and GNP are distorted. The total measures of NMP and GDPare therefore also affected. Estimates of growth of both aggregate measuresand those of the industrial sector are influenced in the same way. It shouldalso be noted that In the absence of "comparable" priced output, the currentpriced values are used in calculating constant price NMP and GDP.
2.30 Depreciation. Treatment of depreciation is another issue importantfor calculation of current-priced GNP. State enterprises are required tomaintain very detailed accounts of depreciation by asset. Depreciation ratesare clearly defined centrally. They are fixed by type of asset and no enter-prise is allowed to alter the rate it is directed to apply. Enterprises arealso not permitted to change the original value of an asset. This is deter-mined by its historical purchase price and affected only by subsequent costsof repair (but not by regular maintenance charges). Information provided byenterprises ls used to derive an average ratio of depreciation to output whichis applied tc other activities and units where output figures are available,but estimates of depreciation are not. In these situations, particularly inthe case of T'E's, indirect methods for calculating depreciation on the basisof estimated value added and derived depreciation: value-added ratios have tobe applied. Annual checks by SSB of enterprise coverage in the late 1980.revealed a growing problem of incomplete data, with missing information fromreturns submitted and missing firms for which such estimation procedures mustbe applied.
2.31 The issues of depreciation accounting in China involve both an ele-ment of stock adjustment, as well as the related adjustment of flow accounts.Part of this may simply be a reflection of applying too long a write-offperiod. First, the valuation of existing capital stock is problematic for anumber of reasons: a substantial proportion of machinery and equipment would,by International standards, be considered obsolete and of zero or negligiblevalue. However, they continue to be reported as part of China's productiveassets and depreciation is recorded on the total. Second, to the degree thatChina's historical pricing system overpriced equipment and machinery, cur-rently-used estimates of capital assets at original value are too high. Bothovervaluation of capital assets and Inadequate recognition of technical and

- 20 -
economic obsolescence lead to overestimated capital stock and exaggerateddepreciation charges.
2.32 A second problem, which would work in the other direction, is thatthe rates used are far below economic rates of depreciation, resulting ininadequate deduction of depreciation. Using such low rates will also resultin the overstatement of the value of the undepreciated asset base. Thisclearly ties in with the problem noted earlier, of assets which ought to havebeen fully depreciated but which are still recorded as having economic value.
2.33 Finally, the use of historical asset cost leads to an underestima-tion of the value of assets in an inflationary situation. In principle,assets should be valued at replacement cost or, alternatively, the undepreci-ated basis ought to be indexed for inflation. Using the historical cost basisleads to an underestimate both of the nominal value of capital stock as wellas a lower-than-appropriate depreciation measure.
2.34 In sum, it is clear that the measurement of capital stock and theaccounting of depreciation result in a complex of conflicting influences anddistortions. In 1979, depreciation constituted only 5.7 percent of GDP inChina, considerably lower than India's 9 percent for the same year.4/ In aninflationary period, such as China experienced in the 1980., the net effectwould have been for both stock and flow measures to be underestimated.
(e) Input-Output Tables
2.35 In recent years, the statistical authorities have prepared threeinput-output (I-0) tables for China, for 1981, 1982, and for 1987. The lat-est, published in late 1991, has been compiled by the Balance Bureau, which isalso responsible for compiling NMP and GNP estimates, flow of fund$s, and esti-mates of different deflators. The Balance Bureau does not rely on the provin-cial level administrations for 1-0 information but gathers the data from otherSSB bureaus and directly from primary sources. Among other objectives, the1-0 interindustry coefficients and sectoral definitions are used to achieveconsistency between published MPS and SNA aggregates. Since the detailed dataneeded to complete the I-0 table cannot be obtained from existing annualseries, additional surveys have to be mounted.
2.36 The 1987 I-0 table is designed to provide a clear picture of therelationships between the 117 sectors identified (including "nonproductiveservices"), with industry accounting for 73 of these sectors.
2.37 It is important to note that the concept of Gross Value of Indus-trial Output (GVIO) defined in the I-0 table is not the same as GVIO used toderive annually reported MPS and SNA aggregates. The main difference lies inthe basis of valuation, because the "state" price does not necessarily mean asubsidized price. These relationships vary by type of enterprise and give riseto distortions in value both between sectors and within sectors, and lead to
4/ For depreciation rates in state-owned enterprises in 1958-88, see StateStatistical Bureau, 1990, p. 31. It is understood that since 1979changes in depreciation have been substantial.

- 21 -
differences in derived 1-0 coefficients. Theoretically, the basis of I-0valuation should be in terms of meaningful producer prices, but SSB valuationmethods in the 1987 I-0 table confound Lmaplicit subsidies, implicit taxes, andprices, resulting in questionable values for many flows and coefficients.The enterprise whose "low" output prices "give" a subsidy to purchasing enter-prises (e.g., a coal producer selling underpriced coal to an electric powerplant) often loses money resulting in a negative not value added. This notonly creates a statistical difficulty but al8o, more importantly, a realinvestment resource constraint for the enterprise concerned. Under the pre-1978 centrally-planned mechanism, investment in particular enterprises wasoften decided less by individual performance than by reference to overallpolicies for a specified product or function. Coal, for example, has beentraditionally subsidized (partly through transfers and partly through very lowcosts of transport), because it is a key raw material. This practice hassurvived to an important degree in China's recent 1-0 work, giving rise to anexaggerated value added in the using industries and a distortion of I-0 coef-ficients.
2.38 In other areas also, the structure of 1-0 coefficients may notreflect the changing structures in output. To the degree that the upperright-hand expenditure (demand) quadrant of the table is inconsistent with theupper left-hand output (supply) quadrant, differences generally result in"changes in stocks," or form part of the statistical discrepancy.
2.39 As can be seen from Table 2.1, many of the discrepancies between the1987 I-0 figures and the national accounts numbers published in the ChinaStatistical Yearbook are relatively minor, and some may be due only to compar-atively more recent estimates being included in the later I-0 format. More tothe point, however, because the basic data in both cases come from the samecollection framework, neither approach provides any independent check on theaccuracy and reliability of the other. It is likely, therefore, that neitherthe officially published national accounting aggregates nor the 1987 I-0 esti-mates sufficiently address the many inherent distortions--both upward anddownward--detailed in other parts of this chapter.
(f) Concerns About China's Present GNP Estimates
2.40 Several Chinese government agencies have described their concernsabout using SSB's official GNP aggregates for some analytical purposes, con-cerns which parallel many topics presented in this report. These agencieswondered whether many new activities were sufficiently covered, and whetherthe activities in the service sector were reported in full scope. Among indi-cators these agencies regard with greatest concern were those relating toproductivity, tax remittances, profit, and efficiency. These agenciesreported that in many cases they felt their concerns stemmed from the influ-ence of enterprise accounting systems on the way data were recorded and aggre-gated at the grassroots level.
2.41 China's State Planning Commission and the Development Research Cen-ter under the State Council, in particular, expressed reservations about cer-tain aspects of current statistical reporting, especially with respect to thevaluation of consumption, stocks, and depreciation, where the current data--even as they meet Hybrid System standards--are still "locked" into the grass-

- 22 -
T7ble 2ii OUTPUT, VALUE-ADDED (GDP)
19871987 "Yearbook"1-0 method S(1) (2) (3) lA
GDP, Total 11,427.0 11,307.0 1.71
Primary, Total 3,202.0 3,204.0 0.19Crops 3,202.0 3,204.0 0.19
Secondary, Total 5,421.4 5,251.6 1.77Industry 4,726.0 4,585.8 1.42Construction 695.4 665.8 0.35
Tertiary, Total 2,800.6 2,851.2 -0.25Distribution, Subtotal 1,155.4 -1.04Freight transport 385.2Passenger trasport 93.9 0.12Telecommunications 44.6Commerce, re-taurant 631.7 -1.16
Production & Consumption-Ralated,Subtotal 1,402.9 1.06Public utilities 73.3 -0.04Finance and insurance 447.5 0.36Real estate 145.5 0.24Others 736.6 0.50
Goverumentlsocial organizations 242.3 -0.26
Investment, Total 4,372.6Depreciation 3,802.6Net fixed investmentInventory change 570.0
Consumption, Total 7,273.2Social consumption 1,329.9Private consumption 5,943.3
ExportsImportsNet exports
la (3) - 'M - PrelIM Data of sXearbook" Rethod) x 1001.11,9307
Sources SSB.

- 23 -
roots HPS data recording concepts. Overall, these agencies believe that GDPha been consistently understated because of underreporting of certain items.At the same time, official inquiries and supplementary surveys which exagger-ate enterprise overvaluation have received disproportionate attention andpublicity.
2.42 Many problems, however, are rooted more in methodological issuesthen in practical issues of measurement. The main problems discussed so farcan be summarized as followas
(a) Houasing Services. Rents, especially of houses occupied by state andstate enterprise employees, are heavily subsidized with most peoplepaying lesa than one tenth of the actual cost (in terms of actualmaintenance, repair and depreciation) of residential propertyupkeep. These payments therefore fall far short of the equivalentmarket rent needed to create a surplus to provide for increasedhousing investment. While homes in the rural areas and in towns aremostly privately built by owners and, therefore, privately occupied(and rarely rented), 80 percent of the housing space in the citiesis owned by the state and let out to tenants at only a nominalcharge. (See Chapter VI for a further discussion.)
(b) Administrative Services. The output of government administrationand the cost of government employment is understated. This isbecause, respectively, the rate of depreciation applied to govern-ment buildings is too low, and because only the salaries of employ-ees (and not their benefits) are included in the official wage bill.
(c) Other Services. Output is not fully measured and the parts measuredare usually undervalued. Estimates of output are also complicatedby the state enterprise practice of providing social welfare ser-vices at the point of output, and including these as intermediateconsumption. (See Chapter III for more details.)
(d) Informal Sector. Activities in the parallel economy or "secondarytier" market, where transactions take place at different prices andoften without government supervision, are probably underreported,because many are outside the direct administrative reporting net-work. Barter trade, which is especially important in the ruralareas, is often weakly represented in statistical reports, and non-farm activities of rural households suffer to some degree from theearly development stages of relevant survey networks.
(a) Constructlon. Costs of building and irrigation works, etc., in therural areas are underreported because although they include thepurchase of materials, they underreDort direct labor charges. Thisconcern especially applies to own-account building and residentialconstruction.
(f) Inmentory Overvaluation. Stock values (and hence available profits)are inflated because slow-moving and unsalable items accumulate inthe end-year balances and are not discarded or written down. Inven-tory overvaluation reflects the influence of state subsidies, which

- 24 -
often encourage output for which there is limited demand, resultingin unsold inventories which are eventually scrapped or removed atlower prices, even though they remain on the books at full initialvalue.
(g) Rural own-account consump'.ion is undervalued because of the applica-tion of lower state prices for the bulk of crops and "periodical"market prices for only a part of farm output. Even though a largeshare of output may not be sold, especially in small farms, data onown-account production and consumption are obtained directly fromaccount books kept regularly by households in the rural householdsurvey. To obtain own-account production, sales and changea instocks in quantity terms are deducted from reported physical output.This component is reported to represent as much as 70 percent oftotal production and consumption of the average rural household.
2.43 Apart from the problems identified above, it is clear that, in asociety in which the data system has historically emphasized physical com-modity flows and focused on quantity rather than value measurements, pricedifferences in a period of reform and transition introduce potential distor-tions into any valuation assessments. Finding the right "weights" to apply tothe array of relevant prices which coexist for the same product at any giventime is difficult. This difficulty is further complicated by clearly observ-able differences in the quality of traded goods.
D. Sector Production and Income
(a) Atriculture
Agriculture: Concepts. Valuation. and Coverage
2.44 Data for calculation of value added in the agricultural sector arecollected though a broad network of statistical workers at every level of therural economy. The data-collection network, however, is still largely basedon agricultural production as it was organized before the sweeping ruralreforms begun in 1979, and there is considerable evidence that the system hasnot been able to keep up vith the rapid reform-induced changes in farm produc-tion management and output mix. This lag in adjustment of methods compromisesvalue added reporting in agriculture.
2.45 Net Value of Agricultural Output--whether for GDP or NHP--is basedon a traditional system of complete enumeration reporting from village-levelunits according to reporting forms jointly designed by SSB and the Ministry ofAgricultute. This system is called the "Village Complete Account of RuralEconomics." Such reporting is supplemented by a variety of surveys, includinga national sample survey of grain yields.
2.46 Value-added itself is in principle calculated through a straightfor-ward "production method," which first obtains the Gross Value of AgriculturalOutput (GVAO) by multiplying physical output by unit prices. Input costs arethen estimated by a variety of methods and subtracted from GVAO to obtain netoutput value. Such computations are done at the local level and, along with a

- 25 -
variety of physical indicators, are then reported to the county-level andprovincial-level statistical offices.
2.47 Measurement of agricultural value added depends critically on thequality of data collection at the village level, and while there are a varietyof quality checks for yields, verification is not as thorough for total culti-vated area, multiple cropping, or planted area under various crops. As aresult, and based on information about the historical origins of estimates forcultivated area, there is a high probability that Chinese crop output isunderreported. Additionally, interviews with SSB officials confirmed thatpricing of agricultural output does not take sufficient account of variationsin product quality, especially for animal products and vegetables, with theresult that output in these categories is also underreported. These problemswill have to be addressed through more up-to-date sample surveys for measure-ment of areas under cultivation.
2.48 Agricultural output is divided into the following five major sectorsand a variety of subsectors:5/
(a) Crops
* Foodgraine* Beans* Economic Crops (cotton, oilseeds, sugar, tobacco)* Vegetables and Melons* Special Crops (tea, silk cocoons, and fruits)* Fodder Crops and green manure crops* Other Crops
(b) Animal Husbandry Production
* Breeding Household Animals (pigs, cattle, etc.)* Raising Small Household Animals (chickens, etc.)* Output of Live Barnyard Animals (eggs, milk and honey)
(c) Aauatic Products
* Artificial Pond Products (fish, shrimp, scallops)* Natural Ocean and Lake Products
(d) Forestry
* Afforestation (seedlings, tree planting etc.)* Timber (logs, bamboo, etc.)* Wood products produced at or below the village
(e) Household Sidelines
* Picking and Gathering (natural medicines etc.)
S/ From the SSB staff handbook: SSB, An Exolanation of Important NationalEconomic Indicators, 1986, Beijing: SSB, pp. 41-45.

26 -
* Hunting* Household Handicrafts Produced for sale
2.49 With only a few exceptions, the gross output values for these cate-gories are calculated by simply multiplying data on physical output by theappropriate unit price (see below). The exceptions to this quantity-timeo-price methodology are items 1.6,6/ 2.1,2/ and 4.1.8/
Physical Crop Output Measures
2.50 Crop output is the basis for estimating agricultural value added,but there are several indications that it may be increasingly underreported asrural economic reforms have diversified the crop output mix and decentralizedthe reporting system just when the commercial environment strengthens incen-tives for underreporting. China's rural crop production and marketing envi-ronment is one where government prices are kept at relatively low levels whilefarmers are required to plant and sell to the government relatively low-pricedcrops such as grain.
2.51 Statistical officials in ChonZqing City explained that householdcontracts have a two-part impact on farmers. First, farm households must payan in-kind tax based on their total cultivated land. Second, they must sell asignificant share of their output to the state at the low state price. Whatis more, the delivery of obligatory crops and taxes is based on differentcontract arrangements. Deliveries at state prices are based on cultivatedland, while the townships mandatory delivery of taxes and output to higheradministrative levels are based on the township's reported total output. Thus,there is a two-stage incentive for underreporting, which is strengthened bythe success of rural farm management and marketing reforms.
2.52 With the spread of rural production and marketing reforms, financialreturns per hectare of land are much higher for commercial crops, vegetablesand meat, especially vegetables and meat sold at higher prices in periodicmarkets. In discussions, both with SSB officials and with local provincialand county-level statistical workers, it was confirmed that no adequate meth-ods exist for confirming planted areas for many crops, and hence there islittle leverage for correcting underreported output. Under China's tax andmarketing system, the burden of verification of planted area and yield datamust rest with the government statistical system. This is a daunting burden,given the strong incentives for underreporting, the weak historical basis for
6/ Calculated by multiplying the total area planted to these crops by anestimate of the per-hectare cost of production.
7/ Calculated by a heterodox method combining increased value on the hoofand value of animals sold; for pigs the measure is one half of the notincrease in year-end pig numbers plus pigs slaughtered during the yearplus net sales of pigs during the year; cattle, sheep and other animalbreeding are valued the same way.
8/ Calculated (Adjusted] by multiplying afforested area by an estimate ofthe per hectare cost of afforestation activities.

- 27 -
many critical measurmenta, including cultivated area, multiple cropping, andplanted area by crop. These concerns are important for all crop., whetherlow-priced grain or high-value vegetables.
2.53 The historical record on area measurement raises some concerns. In1953, not long after the unification of China in 1949, district governmontsunder county supervision carried out an exercise to "check land and aet stan-dards for output" (chatian dingehan), which produced basic data on cultivatedland for each village. In the latter 1970., there were a eorle of minoradjustments to the 1950. measurements, which resulted In little net change.There was no direct measuremant or survey of cultivated land at that time.Finally, after *bolition of comunes and the distribution of land to house-holds under the Household Responsibility System In the early 1980s, individualhouseholds reported their cultivated land for purposes of taxation, but thesefigures showed too little land when compared with earlier data.9/ When theaggregate discrepancies were discovered by county and provincial officials,village cultivated are& data were adjusted to be consistent with the statis-ties from the late 1970s--that is, essentially the original 1953 figures.
2.54 It was further confirmed that, after the nationwide introduction ofthe Household Responsibility System in the early 1980s, farmer reporting ofhousehold output forced a major change in data collection methods. Beforereforms, data were collected directly by commune statistical personnel. Butthe post-reform data collection changes did not provide 8SB with any directverification of cultivated area or planted area. The new system still reliedon intervievw with farmers for determining actual physical output of a widevariety of crops and other products. Beginning in 1982, statistical reportingshifted, from collection of very limited and inadequate data on required grainprocurements and taxes, to use of a 10 percent sample of households. In largevillages, 20 households are selected and in small villages, 15 households. Theselected households are interviewed and requested to report output and yields.
2.55 Total output for the village is thus obtained by applying the samplehousaehold yields to village total for planted area under each crop. In asystem where there is significant government pressure to plant grain and sellto the government at low pricea, this arrangement induces distortions inreports on planted area and output. Little attempt is made to actually mea-sure the area planted, which is in many cases difficult because of the numberof disparate and scattered plots contracted out to the control of a household.With little independent verification of planted area, even by local officials,much less by national agenciel, the chance of significant underreporting ishigh.
2.56 SSB officials felt that, because of stiff penalties for underreport-ing and because there are also incentives to overreport (e 8, state alloca-tions of fertilizer and diesel fuel), underreporting was minimal. But offi-cials also confirmed that they do not have the resources to adequately checkannual data on planted area for crops like grain, much less for planted area
9I This account of the history of land measurement Is taken from interviewswith county-level statistical officials, several of whom had participatedin the original measurement exercise in 1953.

- 28 -
throughout the year for vegetables, which have the highest per hectare valueof any crop.
2.57 Grain output, because of its strategic and political signtficance,is the most carefully monitored agricultural output category. Planted area,yields, and total output as reported are chocked by a major nationwide surveydirectly administered by the S8B. SSB reported that national figures on grainoutput all use the survey yield results, and hence were not always consistentwith provincial grain output data. SSB officials also said that they did aseparate survey to check sample villages for the accuracy of their reportedplanted area in grain. The check reportedly takes the original village reportof planted area, reviews the numbers to see if they are copied and summedaccurately, and then makes an actual survey check of the reported plantedarea. Chongqing City and county officials reported that local checking wasusually limited to paperwork and yield plots, rather than also includingchecks on planted area. In sum, official yield estimaies may give reliablefigures (or even overestimates) of grain yields, but planted area measurementsare insufficiently reviewed to ensure the same degree of confidence in theiraccuracy.
2.58 Vegetable output measures raise concerns about underreporting, notjust because of planted area considerations, but also because of valuationdifficulties for such a very heterogeneous group of products. Quarterly sur-veys provide rough estimates of physical yields (but not planted area) forvarious vegetable crops. Officials commented that physical yields vary tre-mendously depending on when vegetables are harvested. Total planted area forvegetables is collected in surveys only once a year at the end of the year.Physical output for any individual farmer is checked against other data col-lected on the farmer's sales to the government, sales on local markets, andown-consumption within the household. Once again, there is little if anyindependent verification of planted area and hence output for the year as awhole.
2.59 Vegetable output value measuras are )btained by multiplying physicaloutput results by current prices and official comparable prices. For vegeta-bles, the current price is usually the price at the time when the crop "issupposed to be sold," meaning the price at peak harvest time, when the vegeta-bles are valued, as for other crops, at government-published standard "compa-rable" prices based on the year 1980. While there is some problem of pricingnew crop varieties--in which case officials confirmed that they use the cur-rent price as the new comparable price--these cases are few because, even if acrop variety is new to a region, it has a constant price based on its produc-tion in other regions. As a result, comparable-price measures of outputappear not to face the same problems as the output of TVE industry.
2.60 The evolution of measurement methods for vegetable output illus-trates potentially serious underreporting, in addition to important issues ofunderreported planted area. Traditional methods of multiplying physical out-put figures by annual average unit values are frequently insufficient to cap-ture the significant increase in real output resulting from a wider variety offresh vegetables delivered promptly to markets. Such output commands valuepremiums because of inherently better quality and because market incentivesincreasingly stimulate production and sale in nonpeak production seasons.

- 29 -
Agricultural Output Prices
2.61 Gross value of agricultural output is measured with two differentsets of prices: Current prices and so-called comparable or constantprices.10/ Current prices are meant to reflect farmgate prices actuallypaid and received for output, while constant prices are accounting or book-keeping prices used only for purposes of reporting real output value to thegovernment. While there is only very small uncertainty about the use of con-stant prices for agriculture, since the issue of pricing for new productshardly ever arises, there are issues concerning the current prices used.
2.62 SSB instructions require that current prices for any product in agiven calendar year should be calculated by first recording the actual prices(farmgate price) received during various subperiods for every item in a givencategory. These prices are then combined, using physical output quantitiesper subperiod as weights. The current price is thus meant to approximate anaverage unit price, equal to the total annual value sold divided by totalannual physical quantity sold. It appears, however, that actual reportingoften uses shortcut methods, either a "first price" system for determining acalendar year's current price for any given crop or product, or the price inthe first month for which there is output.
2.63 These shortcut methods vaaken the accuracy of reported components incurrent-price gross value of agricultural production, since they introducedistortions for those crops and other products with strong seasonality. The"first price" would possibly be higher than the actual average price paidduring the year, unless peak harvest time is early in the first month. Valua-tion at the "first-price" would thus overstate output value. On the otherhand, in periods of high inflation, as in 1988, the "first price" would belower than the average prevailing price for the rest of the year. The overallimpact of first-price valuation is uncertain, both because of counterbalancingdistortions and because some degree of inflationary mismeasurement would even-tually be picked up by the following year's "first price" for any product.Similarly, there is a concern that peak-harvest pricing, which may be the morecommon procedure, understates current-priced output. This is because reformincentives have encouraged a larger proportion of a crop to be produced in theoff-season, when it is normally scarce and when it can command a higher price.Ultimately, howevet, for measuring real output (corrected for inflation), itmay not matter which price method is used, as long as it is used c-onsistentlyto calculate both current-priced gross output and the deflator applied tocurrent-priced net output (value added).
Aaricultural Input Costs
2.64 Input costs are made up of three broad categories Ill/: (a) costof intermediate materials, (b) depreciation, and (c) other cash expendituresrelated to the production process. For calculation of net value added, these
10/ See Chapter IV on value added in comparable prices in this chapter.
1i/ The description of input cost categories is based on SSB, cited above,pp. 46-49.

- 30 -
general categories are broken into 13 input cost itemat (a) sedes, (b) fod-der, (c) animal breeding costs (especially artificial methods), (d) veterinarycosts, (e) fertilizer, (f) fuel, (g) pesticides and other farm chemicals,(h) electric power used for production, (i) small farm implements (to use forlees than two years), (j) depreciation of fixed assets used in production,(k) material inputs to sideline household handicrafts, (1) production supportservices (equipment repairs, etc.), and (m) other physical inputs.
2.65 Estimation of input costs is based on a variety of techniques. Forexample, the cost of seeds for many crops is based on per hectare applicationestimates and data on total planted area. For fodder costs, per animal con-sumption estimates are multiplied by the average herd size for the year insome cases, and in the case of pigs and chickens, by the number of headslaughtered. Similarly, breeding costs are based on average costs per insemi-nation, while veterinary costs are based either on retail statistics on thesale of medicines or on survey data to determine the per head veterinary costsin a given location. Some costs, such as for electricity use, are obtainedafter deducting for nonproduction household use. Most of the other costsrelated to tools, equipment and household sidelines are based on data col-lected as part of the standard farm production reporting system.
2.66 Items are estimated in value terms at the time of filling out theannual reporting form, at the end of the year. To the degree that input costestimates are based on current prices for the year as a whole, there may be amismatch with "first-price" or peak-harvest prices used to value grossoutput--a mismatch which could result in distortions relating to the realcurrent-priced net output value.
2.67 An additional concern relates to the estimated incidence of inputcosts for specific agricultural subsectors. In one rural county nearChongqing City, Sichuan Province, a total figure for all input costs for allagricultural activities based on sales was used to allocate material inputs tothe five major agricultural subsectors, based on survey information and thejudgment of farmers and cadres in the local statistical office. They acknow-ledged that "traditional wisdom" played an important role In their estimates.While these "traditional wisdom" methodologies may be the best informationavailable in the absence of adequate sample surveys, traditional wisdom isunreliable when there are rapid changes in technology and farm management, asunder reforms. Hence, reliance on traditional wisdom perpetuates the use ofvalue-added shares in gross output which mask the nature of true shifts invalue-added, both by sector and in the aggregate.
2.68 In deflating value-added in agriculture, SSB officials confirmedthat they "double-deflate" agricultural value-added (deflating gross outputmeasures and different inputs), but that they do not have separate input priceindices for the various intermediate consumption items and subsectors in agri-culture. Officials explained that, as a result, they often must rely on onlya few general price indices to serve as deflators for all inputs into allsubsectors.

- 31 -
(b) Industrv
Industry: Concepts. Valuation and Covereas
2 69 Industrial production is defined by SSB to include the followingactivities 12/s (a) extraction of natural resources (including mining,quarrying, and lumber); (b) processing of agricultural products; (c) manufac-ture of industrial products; (d) repair of capital goods; and (a) electricitygeneration and supply, water purification and gas production.
2.70 Because of the exclusion of construction, it is narrower in scopethan coverage for the "secondary" sector in SSB's classification of all eco-nomic activities into primary, secondary and tertiary industries. In terms ofthe coverage of industrial units, establishments of all sizes and types ofownership are genorally included. Special mention must also be made of facto-ries and workshops attached to nonindustrial organizations and rural indus-tries. Examples of the former are factories owned and run by schools,research organizations, administrative units, the armed forces, constructionunits and state farms. Output of these factories and workshops is included inindustrial production if they are production units with Independent accounts,or if they do not have independent accounts but have fixed locations, a workforce of more than ten persons, operate more than three months a year, andproduce for the market.13/
2.71 Rural industries are those operating at or below township and vil-lage levels, including individual operators and specialized farm households i-Irural areas.14/ They are licensed by the local 8ureau of Industrial Com-mercial Administration. However, subsidiary production activity in the homeor family farm is usually not included in industrial production .l/
2.72 To the degree that industrial enterprises provide free services toemployees as benefits, the data collection framework underreports value added
12/ For the Chinese classification of industrial activities and their codenumbers, see Department of Regulations and Systems, State StatisticalBureau, ExDlanations of Major Statistical Indicators of the NationalEconomy (in Chinese), China Statistics Publishing House, Beijing, 1988,Vol. I, pp. 201-249.
13/ Department of Regulations and Systems, 1988, Vol. I, pp. 8-10.
14/ Until the early 1980s the output of village level unita, previously des-ignated "brigade industries," was included In agriculture.
IS/ Gross Output Value of Rural Industry refers to the total output of prod-ucts, expressed in value terms, produced by enterprises of townshipindustry (previously commune industry), village industry (previouslybrigade industry) and industry below village- level (previously productionteam industry, joint sponsored Industry by farmers, and individual indus-try). It includes both the value of finished products and the value ofindustrial operation services provided to other enterprises. Alsoincluded is the value of semifinished products.

- 32 -
in industry. The calculation of value-added by industry in the SSB's EarlyHybrid System SNA-oriented accounts differs from value-added in China's tradi-tional MPS accounts in two respects. The Early Hybrid GDP estimates include,whereas MPS excluded, depreciation charges, reflecting the difference betweengross and net measures of value added. In addition, the Early Hybrid GDPestimates exclude, whereas NMP included, the value of services purchased fromother establishments in the nonmaterial sector, such as research and develop-ment, advertising, banking and insurance. These are fundamental adjustmentsto accommodate SNA standards. In its value-added estimates for the industrialsector, however, the SSB continues to include services which industrial enter-prises provide free of charge to workers and employees, such as health care,job training and reimbursement for business travel. It should be noted thatin a strict application of the SNA methodology, these elements would consti-tute intermediate inputs; they would be excluded from industrial value addedand included in the relevant service-sector value-added accounts.
2.73 The method used to estimate industrial value added (gross of depre-ciation) in all branches of industry except electric power is the "distribu-tion approach," i.e., estimates of the cost of capital used and payments tovarious factors of production (labor income, profit, indirect taxes, interestand miscellaneous charges) are summed to obtain gross value added. Grossval-de added in electricity generation is estimated by the "production method,"i.e., gross value added is treated as a residual by deducting material inputsfrom gross value of output. SSB is now experimenting with both methods for allbranches of industry. In the compilation of the input-output table for 1987,both methods were used.
2.74 Data used in calculating industrial value added (gross of deprecia-tion) are collected through various channels. All industrial enterprises,zexcept some rural industrial units, are required to regularly report theirproduction and financial statistics to SSB and the Ministry of Finance on amonthly, quarterly and annual basis. The major problems with the statisticsfrom these enterprises is not so much the completeness of coverage but thequality of the data. For example, defective products are often reported asoutput even though quality standards are not met. Such practices were report-edly quite prevalent in the early 1980s.16/ Although SSB has significantlyimproved reporting in recent years, many such practices continue. The effectis an overstatement of the gross value of output and gross value added.
2.75 By and large, both the quality and coverage of statistical data forindustrial units at or below the village level are inferior to, and less com-plete than, those above the village level, mainly because their financialrecords are generally incomplete and because there is a large measure ofchange brought about by the coming into being of new enterprises. Ruralindustries below the county level, including collective and individually ownedenterprise., are not usually part of the regular statistical reporting systemdirectly managed by SSB. Their output and other statistics are usually col-lected by other departments, such as the Bureau of Industrial and CoxmercialAdministration and the statistical stations in many towns. These data collec-
16/ Sun Yeh-fang, "Strengthen Statistical Work and Reform the StatisticalSystem," Jinxii Guanli (Economic Mansgement), No. 2, 1981, p. 11-3.

- 33 -
tion shortcomings are Important, because in terms of gross value of output,the township and village industriues and those owned by rural individuals arethe fastest-growing components of the industrial sector (with the exception offoreign-funded enterprises). By 1989, output of these units constituted24 percent of total gross value of industrial output.lZ/ This 24-percentfigure is probably high because of the use of current prices rather than con-stant prices. Nevertheless, even with a smaller weighting, distortions inoutput reporting for these township and village industries affect output esti-mates for the entire industrial sector.
(c) Construction. Transport and Commerce
Construction
2.76 Information on how SSB collects data for the construction sector islimited, but the process seems heavily dependent on China's traditional sta-tistical network. Returns reporting gross output (equivalent to work done)are obtained from the construction companies, and these are cross-checked withinformRtion from investment (acquiring) enterprises. Value added data inconstruction for state enterprises and collectives, are largely based on oldmethods and are obtained by the income approach, using standard ratios ofvalue added to gross investments by state enterprises. However, some stateenterprise investment projects receive subsidized raw materials, so this mea-sure is not always an accurate indicator. Furthermore, this method may not beappropriate for private-sector enterprises and collectives. Where the methodis used for larger state enterprises with subsidized materials, it is likelythat value added is inflated by comparison with other units.
Trans-ort and Communications
2.77 SSB has extended traditional MPS statistical coverage to includepassenger transport, but there are several important concerns about the datacollection system on which estimates by the new sectoral definitions depend.In the prereform scheme of things, the transport sector covered only the car-riage of freight. The main transport subcategories are for air, water androad transport. Even though passenger transport has been added, these twosubaccounts are kept separate in both national accounts and the 1987 input-output table. This separation enables the SSB to continue reporting tradi-tional MPS aggregates at the same time it also generates SNA transport totals.But there are complications. While gross output can be identified by sectorsand separated between freight and passenger traffic, intermediate costs obvi-ously cannot be so easily distinguished. Hence, the ratio of freight to pas-senger gross output is used to estimate net output of freight and passengertransport. Purther, gross output is derived as "ton-kilometers" of goods car-ried times the relevant freight charge, and for the state sector, actual busi-ness records can be used to get the necessary financial data. However, formany rapidly growing private enterprises, only volume measures are available(tons instead of ton-kilometers). Estimates of output value are obtained,
171 State Statistical Bureau, Statistical Yearbook of China 1990, China Sta-tistics Publishing House, Beijing, 1990, p. 412.

- 34 -
therefore, from key surveys I8/ and from tax returns (invariably availableonly for the larger operating concerno). Unfortunately, this procedure tendsto underemphasize a significant and rapidly growing area of "informal" trans-port. SSB mainly depends on the income approach to derive net value added(and hence GNP), but it admits there are many problems in covering water andhighway transport.
2.78 The communications sector in China is essentially still in the handsof state monopoliesa, so collection of post and telecommunications data isstraightforward. Data are obtained directly from the accounts of the relevantgovernment agencies concerned.
Commerce
2.79 Cozmerce is a traditional subsector in the MPS framework, by whichit covered the "material supply system" of wholesale and retail trade (includ-ing the imports and exports of commodities), restaurants, and storage. Sta-tistical reporting continues to be based on MPS concepts. Gross output dataare based on the "margin" for commerce, which is tht purchase value less theproducer's value, minus all transport fees paid to outside operators. Onceagain, coverage for different ownership categories represents the SSB's great-est challenge. For the most part, the data sources used are the comprehensivereports filed by state enterprises. It should be noted that the activities ofrapidly growing small-scale enterprises and vendors are not fully captured.Tax records are used to supplement what surveys exist, but there is some evi-dence of underreporting. Reporting challenges for commerce are typical forthe range of service activities which are growing under the reform programs ofthe past decade. SSB needs to be more thorough in addressing these particulardifficulties. Given the increasing importance of services in the Chineseeconomy, relevant statistical issues are discussed at lensth in Chapter III.
S. Final Exiunditure Accounts
The Exoenditure ApDroach
2.80 Expenditure measures of national income from the demand-utilizationand disposition perspective are also compiled but the information is availableonly at a highly aggregated level. The expenditure aggregate is made up ofconsumption, accumulation, exports less imports of commodities, less wastage.Changes in stocks are included with accumulation of fixed assets. They areseparated between private and commercial assets and include work in progress.There are a number of differences between the terms used in the Early HybridSystem and those understood in the S,.
ConsumDtion
2.81 The consumption component of final demand is divided between (a)private households (separately distinguishing urban and rural entities and, inthe latter case, incorporating subsistence consumption), and (b) social (col-
18/ These are strictly not sample surveys as probability sampling techniquesare not used.

- 35 -
lective) conswuption. In principle, private household consumption as anational accouAting component in final demand should be actual consumption byprivate indiriduals. However, SSB often treats household expenditure ashousehold consumption. But household consumption is not the same as householdexpenditure, for while the former refers only to goods and services for finalprivate use, the latter also incorporates goods purchased by households forintermediate use on the farm or in the home-based enterprise.
2.82 According to the SSB, private household consumption estimates arebased largely on retail sales and agricultural production data, although Sur-vey data are consulted end increasingly incorporated into the results. Giventhe insufficiency of reported data on actual expenditures on housing sectorcosts and profits, housing service components in final consumption are oftenbased on depreciation estimates as a proxy for costs and profits. Deprecia-tion estimates are in general vory low. Because of the extremely low pricesfor moat services consumed by households, and because many such services areprovided free of charge, a large percentage of personal consumption expendi-ture as officially reported is spent on commodities.
2.83 Most of the data relatinr to social consumption are obtained fromthe financial reports of institutions providing services to households. Thesehave two partst (a) social consumption by the whole society (equivalent topure" collective goods like diplomatic services and defense), and (b) a muchsaller range of goods provided within enterprises through such activities asstaff canteens, clinics and kindergartens.
2.84 Social consumption includes institutional sales. Furthermore, ser-vices provided mostly in the workplace by enterprises to employees areincluded in social consumption, if they are collectively provided. If paidfor by individuals, they are included in private household consumption. Somepart of the material cost of these services is included in retail sales, e.g.,food and medicine. The value of many service components of social consump-tion is approximated by reports for depreciation on buildings and equipment(for schools, governmont offices, etc.), and as a result, these componentsturn out to be relatively small. Some residential housing depreciation (e.g.,relating to dormitories) is also classified as social consumption.
Accumulation
2.85 SSB has made changes end improvements to the traditional MPS method-ologies for calculating the accumulation component of final expenditure, basedon an MPS concept called "accumulation of fixed assets" (APA). AFA includeshousing, equipment, vehicles, buildings, as well as certain fees like those ofarchitects, but it is not the same as the conventional SNA definition of"Gross Fixed Capital Formation" (GFCF). The principal difference, concep-tually end in magnitude, between AlA and GFCF is the distinction between netand gross invstment, i. -, depreciation.
2.86 There are other differences between APA and GFCF. First, in prac-ti4e, both aggregates include expenditure on uncompleted buildings and proj-ects, including installed equipment, despite the fact that the NPS normallyincludes these under stocks. Circulating assets include building materialsnot yet used (like the bricks lying around on building sites) and equipment

- 36 -
not yet installed. This assumes that uncompleted projects cannot be trans-ferred to alternative uses and, in this respect, China no longer follows thetraditional MPS concepts in their entirety. The magnitude of these circulat-ing assets in China is not only a statistical concern but also a major problemof economic management.
2.87 The traditional MPS definition of AFA included only outlays thatdirectly gave rise to fixed assets and, hence, architects and legal fees,moving expenses of construction units, training expenses, and royalties werenot included. Although relying heavily on the APA, China's current nationalaccounts have incorporated data from a variety of makeshift supplementarysurveys and collection procedures to fill in these obvious gaps. The break-down of capital construction by nature of work distinguishes between construc-tion, installation, and "other." "Other" in this context is divided intoexpenditures that "do not increase the fixed assets" and those that do. Anumber of other categories increase fixeu assets, such as management, surveyand land costs but these are apparently excluded from the AFA, or at least areneglected. For "housing," and rural housing construction expenditure in par-ticular, SSB uses data on purchased materials and adds an estimate for hiredlabor. The estimates do not include any value of own labor, supplied byhousehold members themselves.
2.88 Three additional categories are included in AFA measures but not inthe SNA's GFCF: simple community-level structures, civil defense works andequipment, and investment in trial products. Military investments such as forequipment and buildings were major expenditure items in the sixties and seven-ties, although less so in the eighties. Regrettably, it was not possible todiscover viven whether these investments are classified as creating productiveor nonproductive capital.
2.89 The accumulation component in final demand accounts includes invest-ment and changes in stocks. Total investment in fixed assets (also calledinvestment in fixed assets for the whole society) includes investment made byall units irrespective of ownership status. For state-owned units, totalinvestment is divided into three categories. Tho two major components arecapital construction and technical updating and transformation. A third cate-gory, other investment in fixed assets, is used to refer to investment notcovered by the first two categories. In principle, capital construction cov-ers new construction and expansion projects, whereas technical updating andtransformation covers renewing, replacing and rebuilding of existing fixedassets or major repairs as defined in the SNA.
2.90 The third subcategory, other investment in fixed assets, includesoil field development projects using special oil field development funds,development and expansion projects in mining and forestry using maintenancefunds, road and bridge construction projects using road tolls, warehouse con-struction of commerce department using simple construction funds, and smallmiscellaneous construction projects and purchases of fixed assets, where"small" means valued in the range Y 20,000-50,000.

- 37 -
Changes in Stocks
2.91 As in the traditional MPS, changes in stocks form part of accumula-tion and are incorporated in a statistic called "accumulation of circulatingfunds." Information on changes in stocks is compiled from the financialreports of enterprises and collected by the SSB's Department of IndustrialStatistics. Commerce data on stocks aro similarly collected. For rural areaactivities, and for agriculture in particular, the SSB's Department of Agri-cultural Statistics is responsible for calculating changes in annual stockswhich are covered in its regular report on "The Basic Economic Situation inthe Rural Areas." This information is supplemented by data on rural enter-prises compiled by the Township Enterprises Bureau in the Ministry of Agricul-ture.
2.92 Data on changes in stocks are apparently derived as differencesbetween end-period book values. On a "first-in-first-out" (FIFO) basis ofstock valuation in the financial accounts, this would normally give rise to anelement of stock appreciation in those cases where an increase in the value ofstocks is influenced by inflation. In China it appears that for many commodi-ties, and especially for those of many state enterprises, the increase in end-period stock values became substantial in the late 1980s, reflecting both theunwillingness of customers to buy outdated, poor-quality products (which accu-mulate because they are unsalable) as well as the significant price increasesthat had occurred. There is apparently an unwillingness on the part of manyenterprises to mark down or write off these stocks (because they representpart of the production target achievement) even though they have lost a greatdeal if not all of their usefulness and value. Many larger state enterprisesapparently recognize the problems of both unwanted goods and stock apprecia-tion and adjust their financial statements accordingly. Nevertheless,national accounting treatment of unsold stocks is a persistent problem inChina in the early 1990s, a problem which is not systematically addressed inthe Early Hybrid System.
Wastaae and "Losses"
2.93 The calculation of final expenditure is based on the MPS concept ofnational income utilized, and hence it excludes certain losses which are notconnected with current production. These are losses and wastage arising fromaccidents, fires, earthquakes, floods and similar events. Other losses con-nected with current production, such as the deterioration or los1 of goodsheld in storage or while being transported, are considered material inputs(even though they may be final products) and so they are already excluded fromthe calculation of national income aggregates, such as NMP and GNP.
Exports and Imports
2.94 Since early in the post-1978 reform period, China's foreign tradeestimates have been based on customs statistics, and in this respect thenational accounts have adopted most of the methods and conventions developedin the early 1980s. The Total Value of Imports and Exports at Customs refersto the value of commodities imported into and exported from China. Thisincludes the actual imports and exports, Imported and exported commoditiesunder the processing and assembling trades, and the imported and exported

- 38 -
comodities end office utilities for 8ino-for.ign joint venture enterprisso,contractual joint ventures and wholly foreign-owned enterprises. AlsoIncluded are materials, supplies and gifts as aid given gratis between govern-ments and by International orgnizations and governments and contributionsmade by overseas Chinese, residents of Hong Kong and Macao and Chinese withforeign citizenship. Imports are calculated on a c.l.f. basis, while exportsare on an f.o.b. basis. The 883 continues to use traditional MPS classifica-tions; these cover only material goods and services. Supplementary data fromthe Bank of China and other sources are used to build aggregates. It shouldalso be noted that an estimate is made for goods brought in by returningmigrant workers, but 88B considers these valuations problematic.
2.95 In sums, in spite of significant improvements over the past decade,final expenditure accounts In the accounting framework are still insuffi-ciently detailed and are often estimated from a varlty of incompatiblesources, which limit their usefulness as independent checks on similarnational accounting statistics gonerated by production and income methods.Like so many parts of China's evolving national accounting system, however,final demand accounts are reaching the limits to Improvement Imposed byChina's data recording and collection arrangments, which represent the mostimportant challenges in the coming evolution of Chin*se national accountingframework beyond the Hybrid 8ystem.

- 39 -
III. THE SERVICE SECTOR
A. Introduction
3.i The rtpid growth of the service sector, under the impetus of econo-mic reforms since 1978, and the expectation of continued rapid service-sectorgrowth in the years ahead, suggest that the next phase in the development ofChina's national accounting system requires a major reevaluation of the con-ceptual and procedural basis for measurement of the service sector.
S. Concepts and Methods
3.2 In the current HPS-based Hybrid System of national accounts beingintroduced in China, the economy is divided into three main sectors: theprimary (agriculture, animal husbandry, and fisheries), the secondary (mining,manufacturing, water, gas, and electricity, and construction), and the ter-tiary (all others) industries.l/ Two different concepts of the tertiarysector have been adopted by the SSB.2/ The first concept, conforms to theUPS framework and excludes "nonmaterial production." It includes only thoseservices which are considered "material" (see Chapter II for coverage). Theoutput of these industries are included in the estimates of Net Material Prod-uct.
3.3 For purposes of estimating GNP as defined in the SNA, the SSB hasadded a second service concept which includes all "nonmaterial" services.Although the second concept is in principle comparable with the service sectorin the SNA accounts, its scope in terms of data coverage is narrower, mainlybecause the statistics for certain industries are either underreported, oronly roughly estimated from benchmark parameters and more aggregate statis-ties. For example, it underreports activity by individuals engaged in tra,a-portation services in the rural areas, private bath houses, and private laun-dry shops--especially those which do not belong to commercial departments orindustrial enterprises. SSB has greatly improved its coverage of these ser-
I/ The SSB formally adopted this system and began compiling statistics ontertiary industry in 1985. See Report by the State Statistical Bureau onDeveloping Statistics for the Tertiary Industrv, document provided by theSSB. An edited version is published in Tongli (Statistics), No. 6, 1985,pp. 1-3. See also Regulations and Systems Bureau, State StatisticalBureau, Exnlanations of Maior Statistical Indices for the National Econ-omv (in Chinese), State Statistical Bureau, Beijing, 1988, Vol. II, pp.355-356; Shaanxi Statistical Bureau, The Tertiary IndustrZ, China Statis-tical Publishing House, Xian, 1988, pp. 141-153; Office of the Input-Output Statistics, State Statistical Bureau, Certain Technical Problemsin Comvilina the Chinese Innut-Out2ut Table, China Statistics PublishingHouse, Beijing, 1988, pp. 1-58. Chinese officials note that the stan-dards in this and other technical materials represent early versions ofthe Hybrid System of national accounts. Improvements have continuedthrough the present.
1/ SSB document cited in Footnote 1.

- 40 -
vice activities, especially in recent years, but their poor coverage Qiroughthe basic MPS data network forces dependence on loe reliable ad hoc esti-mates. Similarly, the earliest implemertations of the Hybrid System under-reported production of such services a. childcare in centers not administratedby the public health department,./ although subsequent improvements areaddressing this issue. These formal irregularities imply that even if subse-quent ad hoc surveys and interpolations provido corrections, they will beheavily influenced by data recording concepts and formats in the MPS-basedcollection system, and as a result, such corrections are at best only a tempo-rary substitute for developing a data collection system which makes a funda-mental break with grassroots NPS data recording formats and concept..
3.4 One of the most vexing service-sector issues Involves services sup-plied "in-house" by enterprises to their employee families. In principle,when services such as education and health are provided by subsidiary units ofmaterial-producing enterprises, they are considered part of the service sec-tor.A/ In practice, however, the treatment of such services is rather com-plicated and sometimes, superficially, inconsistent. A distinction is firstmade between: (1), units with independent profit end loss accounts, and(2) those without. The latter are further segregated into (2a) those servingthe general public and (2b) those servicing directly the enterprises and theirworkers and employees. Traditionally, statistics for service sector itemsincluded in MW only items (1) and (2a).5/ It is not clear whether (2b),welfare services provided "in house" by an enterprise, are charged to inter-mediate consumption (and if so, what part?) or regarded as a transfer out ofthe "value added" surplus.
3.5 Gross value added in current prices for all branches of the servicesector approximating SDA coverage is derived by the income approach, l e , byadding depreciation, labor income, fringe benefits in cash and kind, profits,taxes and miscellaneous charges. For the purpose of compiling input-outputtables, gross value of output for each branch of the service sector is alsoestimated independently. Intermediate inputs are then derived as residuals bydeducting gross value added from gross value of output.
3.6 Estimates of depreciation are based on the stock of fixed assetsvalued at original prices and at depreciation rates set by the state. Capitalstock information is only available for enterprises with independent accounts.Calculations of depreciation for enterprises without such accounts and thosefor nonbusiness units such as schools and government units are estimted bySSB. Major repairs are generally not treated as part of depreciation.6/
3/ Office of Input-Output Statistics, 1988a, pp. 3, 17, 19.
A/ Regulations and Systems Bureau, 1988, p. 361.
5J Ibid, p. 362.
6/ Regulations and Systems Bureau, 1988, p. 359.

- 41 -
The exception is for real estate, where depreciation is defined to includemajor repairs.Z/
3.7 Labor income includes wages end salaries of workers and employeesand the incomes of peasants and other individuals providing serviceso Thebasic source of data for the incomes of workers and employees are regularreports on wages and employment collected by the S8B. Incomes of the indivi-dual businessmen are essentially based on tax information compiled by theMinistry of Finance. FrinMe benefits of workers and employees are calculatedat a stipulated proportion of the total wage bill fixed by the state. Bene-fits funded from an enterprise's operating profits are excluded to avoiddouble counting.
3.8 Profits refer to the operating surplus of enterprises after indirecttaxes but before direct taxes such as income taxes, adjustment taxes and taxon bonuses 8/ Correspondingly, taxes as a component of value added includeonly indirect taxes. Information on profits and taxes of such enterprises asbanks, insurance companies and state-owned transport and tr4lding enterprisesis based on their financial reports. For many other units1 including manyindividual businesses, data are drawn from the tax bureau or the Bureau ofAdministration of Industry and Commerce.
3.9 Interest Davments by an enterprise are not considered a factor pay-ment and hence a transfer out of profits. They are treated as intermediateinputs. For the financial sector as a whole, total revenue consists of inter-est payments received by the financial institutions and interest paymentsreceived by individual savers.
3.10 Miscellaneous charges include payments to individuals (such as perdiem expenses on business trips and subsidies for commuting to work), paymentsto service units within the enterprise (such as trade union expenses, expensesfor workers' training), expenditures in the nature of indirect taxes but whichhave not been included in taxes or operating surplus (such as surcharges onelectricity, special tax on use of fuel oil), and net revenues of the adminis-trative units' subsidiaries providing services.
Statistical and Methodolotical Problems
3.11 As for other sectors, inherent in SSB's accounting for the servicesector are irregularities originating in grassrooto recording concepts, sta-tistical coverage, and data collection methods. These irregularities distortthe estimates of the size of the service sector, the structure of GDP, and therates of growth of the service sector.
3.12 In spite of attempts to measure both material and nonmaterial ser-vices consistent with MPS and SNA needs, data collection for nonmaterial ser-vices is compromised by inherent conceptual problems. Adjustments and exten-sions have only partly rmedied these problem. The conceptual probloms stem
Z/ Office of Input-Output Statistics, 1988a p. 12
8/ Regulations and Systems Bureau, 1988, p. 358

- 42 -
from the original MPS definition of services, which excluded government ser-vices and omitted many common market economic activities which were virtuallynonexistent in China in the two decades prior to 1978, such as many domesticservices and certain business services. Purthermore, as for some servicesprovided directly to employees by subsidiaries of material producing enter-prises, although the makeshift MPS adjustments in the middle 1980s reportedthese to some extent, they treated them as part of the material output of theparent enterprise. Many of these conventions persist in the grassroots datareports and even when there is sufficient information, 8SB must convert theinformation's MPS recording concepts to data with meaning for the SNA. As aresult, reporting at different levels and from different authorities reflectsdifferent interpretations of the data. In general, the data reported in thestatistical yearbooks approach the SNA definition, while those published else-where sometimes conform to the MPS definition.
3.13 In 1989, the SSB estimated gross value added in the service sectorin current prices of Y 41 billion; its share in GDP was 26.5 percent, andtotal employment in the service sector was 99 million (see Table 3.1). Esti-mates of gross value added in 1987 by major components of the service sectorsuggest that 50 percent is in production- and consumption-related services and41 percent is in distribution (see Table 3.2). Service data for selectedyears prior to 1987 as percentages of GDP are also shown in Table 3.3. Thedata in the three tables are not strictly comparable, mainly because of chang-ing statistical coverage.
3.14 It is difficult to determine the scale of the portion of GNP whichis understated due to the exclusion or inadequate reporting of domestic ser-vices and some business services. Fragmentary information suggests that itmay not be nogligible. For example, in Beijing alone, there were about 80,000persons employed in domestic service in 1988, or about 11 workers per thousandpopulation, and the demand fcr such services had been increasing.9/ Giventhe large total urban Chinese population of 287 million in 1988,10/ totalemployment in domestic service could be considerable, even if one allows for alower worker-population ratio in the smaller cities and towns.
3.15 As noted earlier, China's pro-Hybrid MPS-based accounts did notconsider services provided directly to the enterpriseo by their subsidiariesas output of the service sector. Unlike omissions and underreporting for suchitems as domestic service, which biases downmard the size of GDP, misreportingin-house services only distorts the composition of GNP and its sector shares.In-house services include mess halls, childcare centers, medical stations,security guards, fire stations, and residential housing for workers andemployees. SSB efforts to compensate with makeshift ad hoc surveys and col-
2/ Ta Kung Pao (Ta Kung Daily), English edition, May 3, 1984, p. 14; StateStatistical Bureau, Statistical Yearbook of China 1985, (English edi-tion), Economic Information Agency, Hong Kong, 1985, p. 53.
10/ This urban population figure reflects major revisions in SSB'o populationdata which first appeared in the China Statistical yearbook 1991 (page79, Chinese edition) end which reflect new information from the 1990census and new definitions. of urban end non-urban areas.

- 43 -
TablO I3 CHINA: OUTPUT ADD EMPLOIMENT IN THE SERVICE SECTOR,1952-89, SELECTED YEARS
Gross perCent- Value addedTotal age of CDP Indez Employment
(Y billion) (2) (S) (million)
1952 19.2 28.4 - 18.81957 31.7 30.0 - 23.21978 82.4 23.0 100.0 47.11979 82.6 20.6 107.8 49.91980 91.9 20.6 114.3 53.41981 97.4 20.4 122.2 57.61982 103.8 20.0 135.2 59.01983 118.0 20.3 152.3 64.11984 152.7 21.9 178.3 75.41985 211.9 24.8 207.9 81.61986 243.1 25.1 231.0 86.11987 285.1 25.2 260.8 91.11988 357.2 25.5 292.4 97.31989 418.4 26.5 301.0 99.3
"-N" Not available.
Sources: State Statistical Bureau, Zhonggou tongji nainjien 1990, China Sta-tistics Publishing HousO, 1990, pp. 33, 117; State StatisticalBureau, *The Relationship between CNP, Gross Value of Industrial andAgricultural Output and National Income as Reflected In Actual Sta-tistics," Tongji (Statistice), No. 6, 1985, p. 4. Employment refersto year-end totals.
lections have been hampered by limited resource,, resulting in Inadequatecorrection and COverag-.
Estimates for Rousing and Real Estate
3.16 Another sot of problems with estimates of the service-sector relatesto the underlying assumptions and methods used to estimate lncome originatingIn certain distinct components of the servica sector. One specific problem ofome significance is residential housing. Residential housing in China falls
into three categories: those owned and managed by the urban housing adminis-tration department, those oc'id and managed by enterprises and administrativeunits, and owner-occupied houses In the urban and rural areas. The first twocategories account for 8 percent of the total housing space, and ownr-occu-pied dwellings in urban and rural areas account for 3.8 and 88.2 percentrespectively. 8SB3' treatment of the second and third categories of housingresults In underreporting, as dsecribed below.

- 44 -
Table 3.2: GROSS VALUE ADDED, THE SERVICE SECTOR, 1987
Total Percentage(Y billion) (2)
Total 280.06 100.0
Distribution 115.54 41.3Freight transport 38.52 13.7Passenger transport 9.39 3.4Telecommunications 4.46 1.6Commerce 55.39 19.8Restaurants 7.78 2.8
Production and consumption-related ).40.29 50.1Public utilities 7.33 2.6Finance and insurance 44.75 16.0Real estate 14.55 5.2Education, culture, and health services 54.24 19.4Personal cervices 19.42 6.9
Government and social organizations 24.23 8.6
Source: State Statistical Bureau.
3.17 Housing rent ax.J Leal estate value increases are calculated as fol-lows: first, housing administrative authorities directly rent houses to resi-dents and collect rents from them. This is what China's statisticians oftenrefer to as the current "market price" for housing. This part of housing rentis set at a low level as a matter of policy. Revenue Is insufficient to coverthe fixed housing deterioration and repair costs. Value added for this compo-nent of housing is calculated according to the wages of housing managementemployees, estimated depreciation, and the repair costs of the houses in rela-tion to their original construction costs. These components are added to theincreases in real estate values. Second, a shadow rent is calculated forurban and rural private houses according to their assumed depreciation inrelation to their estimated total construction costs. Third, values for hous-ing provided by enterprises, institutions and government are calculatedaccording to the value of depreciation in relation to their (historical) totalconstruction costs. It is difficult in this case to separate the relevantpart of private housing from the fixed assets used for preduction and adminis-trative purposes. Housing depreciation is included therefore, in the valueincreases of fixed assets belonging to enterprises, institutions and govern-ment. Although the value of real estate increases are not o'mitted from theGDP accounts, they are by their nature very low or incorporated elseawhere. AsChina deepens its reforms of housing and prices, the calculation of housingand home ownership will undergo further readjustment, thus gradually resolv-ing the problem of price skewing and distorted sector allocations.

- 45 -
3.18 In the past, SSB did not estimate rental incomes from houses ownedby enterprises or administrative units (such as governments, hospitals, anduniversities),jl/ because it felt that the depreciation on which thesecharges would be based are already accounted for in the parent enterprises,and because it is too difficult and requires too many resources to separatethem out. SSB considers this a problem of GNP sectoral allocation rather thana problem of absolute GNP level. Imputed rent of owner-occupied housesincludes only depreciation of these houses. For some housing categories, SSBassumes that net rental income of owner-occupied housas is zero for purposesof calculating housing service GNP components. The estimate of depreciationof rural houses is also understated because it is based on the depreciationper square meter of state-owned houses in the cities.12/ Since the servicelife of houses in the citles is generally much longer than those in the ruralareas, the use of the same depreciation rate tends to underestimate the depre-ciation of rural houses. The biases due to the assumption of no net rent inowner-occupied houses and the use of too low a depreciation rate for ruralhouses are likely to be sizable, because 92 percent of housing space is owner-occupied, of which houses in the rural areas are predominant. Rural housingconstruction has expanded enormously since reforms began in 1978. If theestimates of housing services are proparly aciusted to eliminate these biases,residential housing would constitute 8-10 percent of GDP, instead of the1.3 percent recorded in 1987. The higher rate would approximate a share ofGDP observed in other countries at a similar level of development.
3.19 Housing valuation is the clearest example of how MPS valuation con-ventions continue to distort GNP measurements, even under the modified systemof accounts. SSB feels that the very low implied housing values should not beadjusted in GNP estimates because these are the actual cost payments in thosehousing transactions where money actually changes hands, and that they there-fore represent the contribution of housing to China's national accounts. Butthis interpretation confuses a nonmarket transaction's actual payment withthat transaction's market value (or useful value), which could be very differ-ent. The SMA seeks to measure the value of economic activity, end it there-fore is interested in what transaction terms would be if they were more hea-vily influenced by market forces. The MPS largely ignored value as a measureof useful activity, because it was designed to monitor a centrally managedeconomy. In other words, SNA standards seek to measure economic activity inways that reflect what its value would be. As China's price reform movesforward, these standards need to be introduced into China's statistical tran-sition as much as possible.
C. Coveraae Issues
3.20 Apart from formal differences in scope between the SNA and SSB'sprocedures, there is the issue of how complete the statistical coverage forthe service sector actually is. This question arises because there are nocontrolling totals for some components of the sector where output statisticsare likely to be incomplete. Transport services in the rural areas is a case
11/ Office of Input-Output Statistics, 1988, p. 11.
121 Ibid.
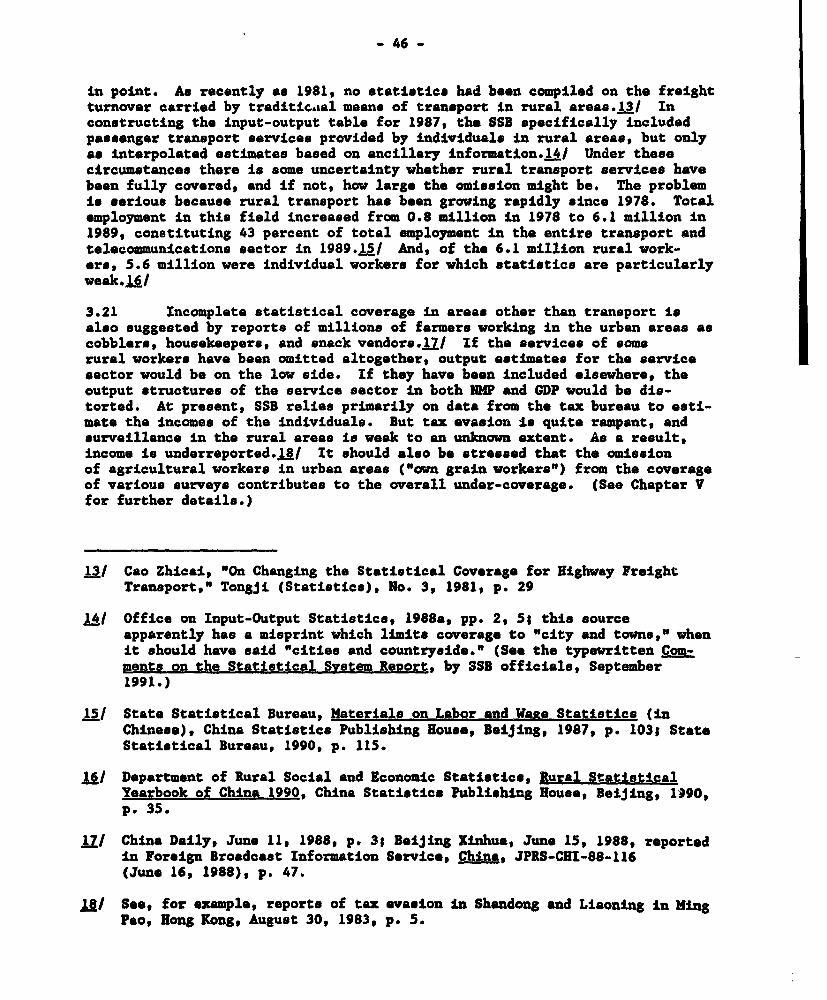
_ 46 -
in point. As recently as 1981, no statistics had been compiled on the freightturnover carried by traditic.tal means of transport in rural areas .3/ Inconstructing the input-output table for 1987, the SSB specifically includedpassenger transport services provided by individuals in rural areas, but onlyas interpolated estimates based on ancillary information.14/ Under thesecircumstances there is some uncertainty whether rural transport services havebeen fully covered, and if not, how large the omission might be. The problemis serious because rural transport has been growing rapidly since 1978. Totalemployment in this field increased from 0.8 million in 1978 to 6.1 million in1989, constituting 43 percent of total employment in the entire transport andtelecommunications sector in 1989 15/ And, of the 6.1 million rural work-ers, 5.6 million vere individual workers for which statistics are particularlyweak.16/
3.21 Incomplete statistical coverage in areas other than transport isalso suggested by reports of millions of farmers working in the urban areas ascobblers, housekeepers, and snack vendors .17 If the services of somerural workers have been omitted altogether, output estimates for the servicesector would be on the low side. If they have been included elsewhere, theoutput structures of the service sector in both NNP and GDP would be dis-torted. At present, SSB relies primarily on data from the tax bureau to esti-mate the incomes of the individuals. But tax evasion is quite rampant, andsurveillance in the rural areas is weak to an unknown extent. As a result,income is underreported .18/ It should also be stressed that the omissionof agricultural workers in urban areas ("own grain workers") from the coverageof various surveys contributes to the overall under-coverage. (See Chapter Vfor further details.)
13/ Cao Zhicai, "On Changing the Statistical Coverage for Highway FreightTransport," Tongji (Statistics), No. 3, 1981, p. 29
141 Office on Input-Output Statistics, 1988a, pp. 2, 5; this sourceapparently has a misprint which limits coverage to "city and towns," whenit should have said "cities and countryside." (See the typewritten Com-ments on the Statistical System Renort, by SSB officials, September1991.)
15/ State Statistical Bureau, Materials on Labor and Wage Statistics (inChinese), China Statistics Publishing House, Beijing, 1987, p. 103; StateStatistical Bureau, 1990, p. 115.
16/ Department of Rural Social and Economic Statistics, Rural StatisticalYearbook of China 1990, China Statistics Publishing House, Beijing, 1990,p. 35.
17/ China Daily, June 11, 1988, p. 3; Beijing Xlinhue, June 15, 1988, reportedin Foreign Broadcast Information Service, China, JPRS-CHI-88-116(June 16, 1988), p. 47.
18/ See, for example, reports of tax evasion in Shandong and Liaoning in MingPao, Hong Kong, August 30, 1983, p. 5.

- 47 -
3.22 Understandably, complete coverage of such a heterogeneous sector asservices is extremely difficult to achieve for any developing country. Theproblem in China is compounded by two additional factors. The first is that,as compiling statistics for services by the 8SB is only a recent undertaking,the data available are rather weak, both in terms of quality and range. Theother factor is that, under the transitional circumstances of the Chineseeconomy, a large number of iudividuals not only hold several jobs but alsooperate as highly mobile business units in the service sector, so that theiractivities are difficult to capture and hence fully record. Thus far, SSB hasmade a great effort to develop and improve the statistics for services inrecent years. Data from the statistical yearbooks for 1988-90 show repeatedrevisions, mostly upwards, presumably because of better statistical coverageas the reporting system develops.
D. Valuation Issues
3.23 A more general systemic rather than a national accounting problem isthat all services in China have been priced too low relative not only to "mar-ket prices" but also to prices of most products in the primary and secondarysectors. (See the extensive comment under Hougint and Real Estate, above.)Under both the fixed-price system and the dual-track pricing system, whereboth fixed prices and market prices coexist, if the fixed price is sot abovethe price that would have cleared the market, involuntary inventory accumula-tion would ensue; and if it is set below the market price, acute shortageswould appear. Judging by some simple and available rough indicators, it canbe concluded that the prices of most services are probably too low. The urbanhousing ohortage is a striking example. About 30 percent of the total numberof households in the nation are in need of new housing. Yet rental levelshave been set so low that they accounted for less than 1 percent of totalconsumption expenditures of the urban population in 1987.19/ This seemsfar too low in comparison to other countries. For example, rent accounted for7 percent of total private consumption in India.Q/ Not only housing, butvirtually all services--especially urban services--are priced below marketprices as a deliberate policy to subsildize consumers. The result is that theunduly small price weights impart a downward bias in the estimates of outputin China's service sector and GDP when compared with those of other countries.The small price weights relative to those of other sectors have also theeffect of overstating GDP growth in the pre-1978 period when the service sec-tor had hardly expanded at all since the 1950., and understating CDP growth inthe post-1978 period when the service sector grew faster than all other sec-tors.
3.24 It is in the services sector in particular that the role of subsi-dies is disguised and yet important. A clear and unambiguous treatment ofthese implicit subsidies, however, is difficult because they take differentforms and are often nested in different branches of industry and types ofenterprises. The evidence of inappropriately low prices is not sufficient to
193 Shaanxi Statistical Bureau, 1988, pp. 97-98, 125.
01 World Bank, China: Socialist Economic Develorm_nt, World Bank,Washington, DC, 1981, Annex A, p. 321 United Nations, 1990, p. 681.

48 -
draw attention to the presence of subsidies. The declining value of cammercean a share of GDP when the economy is expanding fast, both visibly and accord-ing to official account, reflects the peculiar treatment of subsidies forurban food products as negative value added. In reality, food output hasincreased and the delivery of food to a growing urban population has improvedand risen in Importance. Subtracting subsidies from the net value added inthe commerce sector is misleading and, by SNA conventiono, inappropriate. Analternative cost or full supply price needs to be imputed to the subsidizedservice (or item) in question and the difference betweon the enhanced (equiva-lent true "exchange") value and the actual transaction value, or revenuesreceived, treated as an official transfer (paid for out of tax receipts) or anaddition (in kind) to income balanced by an equivalent expenditure outlay.SSB recognizes the problem and is now introducing different valuation proce-dures in its accounts to reflect more explicitly some of the major subsidiesthat exist. Nevertheless, the accounting framework is deeply rooted inChina's traditional low-price subsidy system, and its results--especially inthe service sector--continue distortions from the past. The data on subsidiesprovided in 1984 indicate the approximate size of the losses in the past(Table 3.3).
Table 3 SUBSIDIES AND LOSSES (1984)
Total in Y billion
Housing 21.50Transport 0 04Education and Cultural Services 0.08Medical Services 1.50
23 12

_41) -
IV. CHINA'S PRICE SYSTEM AND NATIONAL ACCOUNTS AT CONSTANT PRICES
4.1 The previous two chapters have reviewed China's present nationalaccounting practices for calculating national product at current prices. Thischapter introduces China's price system and the calculation of national incomeaggregates at constant prices. Its objective is to identify the aources ofdistortion in the estimation of China's constant-price aggregates and theirreal growth rates, and to suggest appropriate improvements.
4.2 As a result of the growing importance of prices and the widespreadsuccess of many price reforms, SSB has strengthened its traditional reportingof price indices and reformed its system for collecting price data. The SSBnow collects a wide variety of farmgate, wholosalo, and retail prices for mosttransactions, and it is beginning to collect and process ex-factory prices andprices for intermediate inputs. Nevertheless, there are a number of concernsabout China's price data and the price and other surveys used to generatethem. Chapter V treats these issues in some detail. Most importantly, theSSB price collection network has only a partial coverage of service prices andcontinues to use posted government prices when these often differ from trans-action prices. In addition, the calculation of price deflators for thenational accounts raise many concerns absent for the basic system of priceindices, concerns which SSB staff agree, bias calculations of real growth.
4.3 The shortcomings in China's price surveys and indices are the resultof the continued partial reliance on a system of data collection and surveysoriginally designed for China's pre-1978 centrally planned economy. Beforereforms, the orientation of China's economic policy, and hence its price sta-tistics, emphasized urban industrialization and the development of a modelsocialist standard of living in urban areas. Before 1978, rural and othernonstate economic activities weri largely considered supportive of and comple-mentary to the urban socialist development program. As a result, under theproreform system the most significant transactions were those within the urbanstate system and between the state urban sector and the complementary nonstaterural economy. Pre-1978 price data therefore emphasized these critical areasof socialist interest; they documented state prices and prices needed ao buyand sell from the farm economy.
4.4 The pre-1978 state-system price statistics and data collection moth-ods were poorly suited for capturing the newer kinds of transactions intro-duced by reforms after 1978, especially transactions in urban areas by nontra-ditional nonstate-system households and transactions in rural areas betweendifferent rural entities. A careful examination of China's price surveys andthe calculation of price indices indicates that, in spite of the progress madein the 1980., by 1990 this fundamental orientation of the price data systemcontinued to result in biased indicator* which, in particular, underestimatethe degree of inflation.
4.5 Economic and political forces necessarily conflict when setting thepace of reform in prices; but, once accepted and underway, prices do change--relatively and absolutely--and such changes require corresponding reforms inthe collection of price data. Until recently, many of China's basic indica-tors were measured in quantity rather than value terms and, while such physi-

- 50 -
cal series are useful for output analysis for sector-by-sector study, theysuffer from being noncomparable, and usually nonaggrogatable. Consequently,critical changes in economic structure could not be observed, Now that anincreasing amount of information is being made available in value terms, it isImportant to compile appropriate price indices to deflate, or otherwiseadjust, existing current value measures in terms of comparable valuesexpressed in constant or base reference prices. How this is best done, andwhat prices are most relevant, is quite an involved question given China'sdetailed item level price system and the closely related complex structure ofsubsidies and indirect taxes. The latter are sometimes variable and difficultto monitor satisfactorily because they are people or situation related ratherthan item specific. There is, furthermore, a problem related to the underly-ing categorization of goods and services that is linked less to their inherentnature than to the actual process of data collection. The existing method ofinformation gathering in China focuses heavily on state-owned enterprises andthis imparts a bias in both the selection and the coverage of output relatedprice series when determining current deflators.
A. Prices in China
4.6 In China, .,he government directly sets prices through its own agen-cies and, in addition, monitors and disciplines prices in other transactions.As a result, there are many different kinds of prices, even for the samegood, which greatly complicate the job of conducting price surveys and compil-ing price indices.
4.7 China's pricing categories and definitions have become less preciseas a result of price reform initiatives and adjustments, but because planningis still important in China, official price classifications remain usefulguides to China's national pricing system and its influence on valuation andmeasures of inflation. In the Chinese price lexicography, there are two majortransaction price categories: plan prices (Jihua jiage) and nonplan prices(fei jihua jiage). Plan prices are all prices associated with transactionswhich are part of the economic plan for a region or the nation. For planprices, there are two major subcategories: "state-set" prices (guojia dingjia) and "state-guided" prices (guojia zhidao jia). State-set prices arefixed at one value, while state-guided prices are allowed to be set by localenterprises and departments within certain ranges set by the state. Nonplanprices are the opposite of plan prices, and have three subcategories: consul-tative prices (xieshang ding jia), negotiated prices (yi jia), and periodicmarket prices (jishi maoyi jia). These are in general decided by the partiesto the transaction, but are subject to government guidelines, and monitoring.
4.8 The lexicography also has names for price types which roughly over-lap with the broad plan/nonplan distinction. In particular, the term "parity"or "par" price (ping jia) is used to indicate the state price. The term"list" price (pai jia) has a very similar usage. In most cases the par orlist price is the "low" prico for a comodity when there is more than oneprice. In contrast to the par or list price, the generally higher price iscalled the "negotiated" price (yi jia), which, when used in this context, hasa broader meaning than its more formal definition as only one of several typesof nonplan prices. When Chinese analysts speak of a two-tiered market for agood, or of two-tiered pricing for that good, they are almost always referring

- 51 -
to the official segmentation of many markets, allowing use of a product's listprice in some transactions and its negotiated price in others. For manyproducts and transactions, this terminology is more accurate than the commonpractice among foreign observers of referring to the two prices as "stateprices" and "market prices," because in spite of official supply-demand sensi-tivities and the heavy influence of market force., a subset, albeit a declin-ing one of so-called market prices are still subject to significant governmentinfluence. To summarize, there aro basically three different types of pricest
(a) Statutory Official Administered Prices. These are list prices(often referred to as "Plan Prices") which are determined by Govern-ment agencies.
(b) Negotiated Prices. These can be adjusted within limits (usually"upper" limits set by government agencies) by the controlling state-or collective-owned unit.
(c) Periodic Market Prices. These are influenced most by market forces(demand and supply), although government agencies often try to set"upper" limits in the interest of social goals such as equity andprice stability.
4.9 Through reforms, forces of supply and demand increasingly influenceall prices in China, but shifts in the significance of some official pricecategories have not been so uniform. For example, "negotiated" prices inChina have rarely been what Western economic theory wouldt call market prices,and Chinese analysts point out that with reforms, ironically, they have becomeeven less so. China's price lexicography notes that with the mid-1980s abo-1iL.lon of mandatory purchasing quotas for most goods and hence the disappear-ance of their related state-set prices, negotiated prices are really no longerjust a "nonplan" category. At times when local conditions have necessitatedrenewed official price Intervention, negotiated prices have become the majorprices for transactions within the plan as well. As a result of this change,and in spite of their traditional status, certain negotiated prices are nowconsidered to be a kind of state-guided price, illustrating how price catego-ries have changed their meaning and significance as the ebb and flow ofreforms have changed the degree to which state authorities directly influencethem or limit their market fluctuations. Most negotiated prices do, however,now clearly follow broad movements in market supply and demand.
4.10 While SSB collects the basic price information and produces priceIndices, the State Price Bureau (SPB) is also responsible for compiling andmonitoring actual prices. SPB combines data from the urban and rural priceindices prepared by SSB with a price index of agricultural products. It alsocollects data in the markets. In addition, SPB compiles data on wholesaleprice changes, prices reported to or through government departments, and spe-cific topic studies (like those relating to the oil sector and transportationcharges). Its main function is to analyze price change at the provincial andmunicipality level where weekly and monthly data are collected. This func-tion, however, is related closely to price surveillance and regulation and tothe determination of whether any reported price increase is "excessive." Inprinciple, therefore, within the present institutional structure, although

- 52 -
decreasing less so in practice, even "free" market price. may be subject tocontrol.
4.11 The SPB indicated that there were various means for controllingprices. In some cases, they are set high to stimulate production, as in thecase of cabbages and other vegetables. In other cases, ration coupons areused to distribute goods at a low monetary price, such as for pork and eggs insome urban areas. For other goods, authorities set maximum ceiling pricesduring certain festival periods and then monitor transactions with teams ofinspectors. For example, this was done for watermelons during the peak summerseason in 1990. Vendors who were found selling watermelons at a price higherthan the ceiling price were fined. For many other products, even though theirprices were "liberated" in the mid-1980s, periods of high inflation such asthose in 1985 and 1988/89 have induced temporarily stricter requirements forreporting price changes to thA SPB. During periods when reporting require-ments are more strictly enforced, the SPB reviews unacceptably high pricechanges, but if there is no response from the SPB after a price change isreported, that means the change has been approved. This requirement to reportall price changes was greatly extended in 1988, following that year's highinflation.
4.12 In measuring changes in such prices over time, and in assessingprice differentials, the SSB, in principle, also takes account of qualitydifferences. Although, in practice, quality adjustments may often be made atthe time of collection, such adjustments depend heavily on the subjectivejudgment of local statistical personnel, and where more careful reportingwould note an effective price decline associated with quality improvement,such practices are irregular, because there are no clear measurement guide-lines or standards to apply. This difficulty is statistically important tonote, however, in order to obtain a fuller understanding of the elementsresponsible for actual price changes.
4.13 In any event, given the complex interaction between price reformsand official price intervention in China, it is difficult to assess the degreeto which China has converted to market pricing. The market most closelyinfluences what one called "periodic market prices." A "periodic market" is aparticular kind of market occurring in both rural and urban settings at regu-lar intervals: in isolated locations once a month, once a week, or once everythree days; and in towns and cities usually every day, but not always all daylong. The official term "periodic market" also refers to road-side vendorsand independent vegetable stand merchants.
B. Official Constant Prices. Comparable Prices, and Deflators
4.14 Not all prices in China are used for transactions. Official "con-stant" prices are accounting prices published in a large set of price booksand used by enterprises and agencies to calculate and report the "value" oftheir output by the same prices from year to year. Since the founding of thePeople's Republic in 1949, there have been four sets of constant prices, andthe SSB has just completed preparation of a fifth set based on average listprices in 1990. "Comparable prices" have a meaning closely related to thatfor "constant prices" and represent a generalization, because real outputbased on "comparable prices" rely on some combination of "constant prices"

- 53 -
linked over long historical periods. In this sense, "comparable" price dataare designed to span any combination of all four "constant" price time peri-ods, although, technically, a shorter data series can also be described asbased on "comparable" price., even if It does not span more than one period.To put it another way, data series based on "comparable" prices are piecedtogether from one or more shorter series based on "constant" prices.
4.15 Official constant prices are fixed by the state and are based onactual prices in benchmark years. The benehmark prices for a certain year,while representative, are not a perfect average of all prices for each goodfor that year. As a result, "official constant prices" contain an arbitraryelement, and output valued in 1980 constant prices, for example, is sligh.lydifferent from the same output valued in 1980 current prices. Nevertheless,because the official constant prices for any benchmark year are agreed on andpublished as value standards in books distributed to each relevant factory orother producing agency, they make possible a convenient measure of outputwhich is comparable both over time and between regions.
4.16 The comparable-price system Was imported from the Soviet Union, and,in addition to measuring national gross output, is an important plan fulfill-ment measurement tool for ministries and departments, For example, the 1980constant price for a particular size of bolt was used by every bolt factory inevery province and town in the country. The official constant-price value ofoutput for that bolt type was combined with the official constant-priced valuefor all other bolts and similar objects to record and report output in thatfactory for detailed categories. By aggregating these statistics, output ofbolts could be compared across different regions and over time.
4.17 Constant prices are especially useful for measuring gross factoryoutput, but much less useful for reporting net output, mainly because pricesfor the great diversity of inputs used cannot be identified. As a result,national totals for real gross output are more dependable than net outputindicators, such as GDP and NN. But problems of pricing new products causeeven constant-priced gross output to accumulate inaccuracies. With the rapidgrowth of the township and village enterprise (TVE) sector in the recent past,a great variety of new products have been valued. In many instances, theseare being valued in current prices in the absence of "official constant"prices in the base year. When estimates of total gross values in constartprices are presented, there is an inevitable mixture of subaggregates that arenot so valued. This has the direct effect of (a) raising output levels for agiven year, and (b) introducing an upward bias In year-to-year growth rates.This practice is not confined to the TVE sector, as new products sold by stateenterprises are similarly valued. The biases are most severe in industries inwhich innovation is greatest, e.g., electronics.
4.18 A further potential source of upward bias in measures of industrialgrowth results from the process of new business formation. For newly eetab-lished enterprises within the collective sector, comparable prices of productsare not known when production begins. In these circumstances, the price pre-vailing at the date the enterprise began production is used in lieu of a com-parable price.

- 54 -
4.19 Even though "official constant prices" are not used In any trans-actiono, they are important for some measures of inflation, such as outputdeflatoro, because such deflators in China are calculated by comparing outputIn current prices with output calculated using "constant prices." In otherwerdo, Chinese procedures often reverse the more normal order of calculation,and rather than using a price deflator to calculate real output from currentprico data, current price data and constant price data are used to calculatean implied deflator. As a result, the accuracy of GDP and other deflator.,and indeed of real output growth, depends on the consistent application ofconstant prices. It is evident upon study that the misuse or corrupted use ofconstant prices has introduced serious inaccuracies in the measurement ofChina's real output growth. Some of these issues are discussed further inparas. 4.23-4.30.
4.20 Comparable prices are also used to carry out the comparative studiesnecessary in economic planning work. The authorities use them to observe andanalyze differences in economic structures as v1ll as changes in sectors, overdifferent time horizons, where each period has a different relative priceystem. The accuracy with which results reflect real changes depends on thescientific comparative methods applied and on the basis on which the compari-sons are made.
4.21 In theory, comparisons of real aggregate values can best be achievedby correcting for price changes in individual subaggrogates and then combiningthese parts to calculate the total. In this way, the composite price indexand trends in development of both total values and component commodities areunified. In practice, however, owing to the complexities of economic activ-ity, the great variety of products available, and the continual emergence ofnew products, it is often extremely difficult to work out such detailed sta-tistics. It usually proves impossible, therefore, to monitor changes In con-stant prices on the basis of such a complete segregation. As a consequence,alternative and loe satisfactory methods prevail. Currently in China, compu-tation of long time series based on "comparable" prices are really chainlinkedconstant price indices with different bases, and the estimation of correspond-ing aggregate values is affected by changing structures and shifting relativeprices. The practice is equivalent to chainlinking detailed price indiceswith different base years and rescaling the result to an early base periodwhen the implicit weights were different. In technical terms, such Paaschechainlinking of sequential Laspeyres-base weighted price indices generallyleads to a lower rate of measured inflation than would be the case if theprice changes had been measured solely against the same base reference period.
C. Measurement at Constant Price
4.22 Chapters II and III discussed how the national accounts in currentprices are compiled and focused specifically on the systemic differencesbetween the UPS and SNA concepts and their respective structure of aggregates.In converting these series into constant prices, other problems have beenencountered, even though SSB has compiled an extensive set of comparableprices for specific base years. While a variety of techniques are applied tospecific situations, Table 4.1 describes the specific methods used for thethree major sectors.
- 55 -
Ml* 4 .. 1. PRICE DEPLATION METHODS BY SECTOR
Agriculture Industry Services
Price Double deflation Single deflation Physical indicatorsAdjustment (including employment,Method and derived price mea-
sures)
Sectors Main crops (grain) Industry Service. (for profit)Applicable Nongrain crops (manufacturing Services (nonprofit)
Animals and Mining)Forestry ConstructionFishing Transport
Techniqu. Gross output at a) NVA at CP + a) Physical outputRP (Physical GVO at CP over Index x estimatedoutput x base OVO at RP time NVA In base yearreference price)LESS inputs at RP b) NVA (base year) b) Employment index x(currently only x GVO at RP estimated NVA Inmaterial inputs over time base year
Nots Double c) NVA at CP (i.e.,deflation methods, Revenue leos costs)similar to those + Increase in pricesused in agriculture, of applicable servi-are also used ces
CP - current pricesKP - constant pricesEVA - Net value addedOVO - Gross value of output
4.23 A significant reporting problem has at times arisen in the treatmentof gross value added by rural (TVE) industries. As discussed In Chapter II,the TYE sector has grown rapidly and any measurement errors would have consid-erable impact on industrial output and GDP measurement. The problem hasresulted from the practice on the part of some enterprises of reporting cur-rent-price values in the place of "constant-price" values. Because of theirlimited statistical xperience, this has usually been true for many industriesat or below village level, where output series In current prices are often notdeflated and are included without change in aggregates supposed to bo at com-parable or constant prices. Another significant issue Is the degree to whichGross Value of Industrial Output (GVIO) deflator. from the slower changingstate sector are used to deflate output of the TVE sector. Since the productsof TVE industries are mostly sold on free ("periodic") markets, and becauseprices on these markets rose more rapidly during 1981-89 than state-product

- 56 -
prices, the unevenness of the deflation procedure has overatated the realgrowth rate of TVE output through much of the 1980s.1/
4.24 More gonerally, an Important issue for industrial value-added sta-tistics is the distortion introduced through the uses of the index of notoutput in comparable prices. Value-added in constant prices for subperiods(1952-57, 1957-70, 1970-80, and 1980-89) is first derived by deflating theseries in current prices by a single deflator for each subperiod. The result-ing individual eerie. in constant prices are then linked together to form achain index in comparable prices for the entire period 1952-89. At each stepof the calculation, the methods used introduce distortions in an upward direc-tion, but the approach can be analyzed as the co=bination of two principalphenomena.
4.25 The first phenomenon has already been mentioned. It is China's useof a single gross output deflator to correct for price changes in a wide rangeof disparate sectoros resulting in underestimating (or overestimating) netvalue added (NVA) in constant prices when input prices rise faster (or slower)than output prices. This is because using an excessively low-valued outputdeflator to deflate inputs exaggerates the amount of input in constant prices,yielding a smaller residual NVA. Ideally, if price deflators for input costsare available and sufficiently accurate, net output in constant prices can beobtained by the double deflation method, with both outputs and inputs deflatedseparately by appropriate deflator., which are often different (and, moreoften than not, divergent). Unfortunately, the limited information on changesin these prices in the industrial sector does not permit a full assessment ofthe net effect of such phenomena on growth measurements. Recent researchstudies (Jefferson, Rawski, and Zheng) have shown that when price indices formaterial inputs to state and collective industry are estimated and when doubledeflation techniques are applied, they have a down%a_rd influence on constantprice estimates of NVA and on growth rate estimates for recent years. Suchresults reflect the situation in many sectors where raw material prices haverisen faster than output prices and hence faster than allowed for by implicitdeflators embedded in calculations used to generate national accounts. Anadditional factor that causes material input prices to rise more quickly thanproduct output prices is that, in the pre-reform period, ex-factory materialprices were the relevant prices. Currently, since many materials pass throughperiodic and negotiated markets, a markup has been added, so that the ex-fac-tory price- are no longer the relevant prices.
4.26 The second phenomenon influencing the official comparable-priceestimate of NVA relates to the upward iistortion that exists in measures ofgross value of industrial output (GVIO) itself. This distortion results fromusing statistical weights which depend on early initial-period prices ratherthan final end-period -rices. One example is the use of 1980 prices to calcu-late weights for 1990 transactions. If Paasche indices of GVIO were computedfor the subperiods (using the prices of the final year as the valuationbasis), the indices would yield growth rates considerably lower than the cor-
1/ For example, prices of consumer goods in the free markets rose at therate of 10 percent per year during 1980-89. They declined during1990/91. State Statistical Bureau, 1990, p. 268.
- 57 -
responding Laspeyres indices calculated by the SSS. This is because theprices of the faster-growing components of industry (e.g., machinery) relativeto those of the slower-growing componento (eog,, textiles) were higher in theearlier year than in the later year. To use the priceu of the earlier year asthe valuation basis assigns a larger weight to a faster-growing component andtherefore results in a higher growth rate than if the prices in the later yearare used. This phenomenon is the familiar Gerschenkron effect. Since all theGVIO indices in constant prices for the subperiods 1952-57, 1958-70, 1971-80and 1980 to date are based on early-year weights, they are all biased upwards.When the constant-price indices for the subperiods are linked together to forma comparable price series for longer periods, as has been done by the SSB, theupward biases are compounded and built into the series for the longer periods.
4.27 The upward bias in the constant-price GVIO output index inevitablyintroduces a corresponding upward bias in constant-price measures of NVA.Thies is because the too-high conotant-price GVIO output index results in atoo-low GVIO price deflator, which is then used to derive NVA in comparableprices. The GVIO price deflator is calculated by dividing the GVIO index incurrent prices for a given year by the (too-high) ¢VIO index in comparableprices, resulting in a deflator that understates industrial price movements,Applying an understated GVIO price deflator to a current-priced NVA seriesresults in sn overstated constant-priced NVA series.
4.28 In general, the biggest pro1lems arise in the services sector. Forconsumer services, SSB uses a price index for services combining both theservice component of the retail price index and the cost of living priceindices for services for, respectively, the urban and rural areas. In thecase of government, the estimated current NVA of public administration anddefense (dominantly wAges and salaries) is divided by the "social consumptionindex" where this is made up ofs (a) household purchases of commodities;(b) purchases by social organizationsa and (c) production materials for agri-cultural production purchased by farmers. This "social consumption index"(which excludes any compoent of wages or salaries) is also used to deflatethe value of service output of nonprofit organizations.
4.29 For financial services, the retail price index combined with anindicator of industrial change is applied (the relative weighting of which isunclear), and for production-related services (and specifically "commerce"),relevant physical volume measures are compiled. An attempt was made to incor-porate an index of changes in interest levels for use in monitoring realfinancial sector operations, but this proved too difficult.
4.30 Additional special difficulties arise in trying to track real struc-tural changess, .e *, changes in not output values in constant prices, becauseof the complications introduced by subsidies. An example can be given bycoal. Coal makes a loss so the government provides a subsidy to output. Whena coal seller or user buys coal directly from the mine, the mine calculatesthe value of its not output (GDP value added) before the receipt of the sub-sidy (to the enterpris). Thp-efore, value added for coal is negative for themine. For the industrial producer, who buys coal at a lower cost because itis subsidizod, however, u- added is higher by the amount of the subsidy.The subsidy to the ane will not be reflected in the enterprises outputreport, but it will be included in the flow of funds. This is clearly mis-
- 58 -
leading and represents a confusion of statistical concepts (what should bedone--to reflect reality) with statistical practice (what is actually done--for data collection convenience).
4.31 In sum, the estimation of constant-price aggregates in Chinainvolves an additional layer of measurement problems over that encountered inestimating the current-price values. These result from the practice of sin-gle-deflation using a gross output deflator, from the greater weight given tofaster-growing Industrioes and, more gonerally, from the use of *comparable"prices, which cause inflation to be underestimated. Correcting these systemicanomalies is critical to understanding the real, as opposed to nominal, sig-nificance of sectoral and macroeconomic developments.

- 59 -
V. pRICE INDICES
5.1 The previous chapter reviewed Chinaa's price system and the calcula-tion of constant-price national accounts. This chapter builds on the previouschapter's description of multi-tier prices and introduces China's system ofprice iudices snd their methods of calculation. China's system of price sur-veys and price indiceo is part of China's rapidly evolving data collection andcompilation systm. While many of its techniques are well developed, as partof the current Early Hybrid statistical system they continue to be applied inan irregular transitional framework still heavily influenced by eorlier MPSstandards and requirements. This chapter's objective is to analyze priceindices and deflators in order to understand both their usefulness and theirweaknesses as measures of inflation and relative price changes. The chapterconcludes that there is significant room for improvement and expansion both inthe generation of price indices and in their fuller use in national incomecalculations.
A. Introduction
5.2 By thoir very nature, China's market economic reforms have givenprices a place of importance they never had in the centrally-planned economy,and, as a result, prices and price indices suddenly became important and con-troversial in the 1980s. As inflation spread through different sectors andregions, measures of inflation became important for evaluating past reformsand designing new policies. Furthermore, while prices once could be gatheredthrough administrative channels from various state commercial units and pur-chasing agencies, reforms introduced a wide variety of transactions and priceswhich only sample price surveys could cover. However, in spite of the prolif-eration of transaction varieties and the frequent reference to "market" trans-actions, certain prices in China do not fully roflect true market values, andas described in the previous chapter, some of the so-called "market" pricesare subject to State Price Bureau (SPB) monitoring whon inflationary pressuresare evident.
B. Chinas' Price Surveys
5.3 China's price survey and index compilation work In the 1980. took aset of minimally functioning price reporting procedures and converted themtnto a well developed system of surveys tailored to mset many of China's tra-ditional statistical noedc and a few of its ad hoc needs as a transitionaleconomy undergoing economic reforms. By 1990, however, in spite of signifi-cant progress, a number of improvements were still envisioned to strengthenthe system, aspecitlly its extension to cover a wider variety of price cate-gories, to Improve information on index weights by considedring nontraditional(so-called *Own-Grain") urban households, and to capture more service andother trnsactions outside the traditional Chinese statistical system's scope.Overall, the major shortcomings of China's price indices are the irregulari-ties introduced by weights which overemphasize commodities and overemphasizeitems covered by list pries* and which underemphasize prices in transactionsusing negotiated and periodic market prices (see Chapter IV for a descriptionof various price catogories).

- 60 -
5.4 China's modern price surveys originated in the early and middle1950., as the Ministry of Commerce gradually combined various ad hoc regionalwholesale price surveys.1/ In 1956 China transferred authority for allprice survey and index work to the central SSB. During the Great Leap Forward(1958-62) and the Cultural Revolution (1966-76)v development of the price-reporting system regressed and struggled to survive. Although restoration ofprice survey work had begun as early as 1973, progrese greatly acceleratedwith the introduction of economic reforms in the late 1970s.
5.5 In 1979, the SSB price survey system consisted of data collectedfrom state commercial establishments on prices and transaction volumes. Atthat time coverage was extended to include three kinds of prices (list prices,negotiated prices, and periodic market prices), which were then used in calcu-lations of the nationwide retail irice index (RPID and cost-of-livina indicesfor urban and rural households. It should be observed that the weights usedto calculate the retail price index were originally based on transactions instate-owned and cooperative stores, but as reforms proceeded the weights grad-ually began also to reflect transactions in other shops and in periodic mar-kets.
5.6 In 1981, in response to the growing complexity of economic reformsand the spread of multiple prices for the same good, the SSB created its urbanand rural household survey teams to strengthen price survey work.2/ Thisformed the basis of new improvements to the expendituLe-based Consumer PriceIndices (CPI) for both urban and rural areas. It also simplified and unifiedits nationwide price data collection methods. In 1982/83, the SSB increasedprice survey manpower and other resources and began to rely even more ondirect survey data for its price information, rather than depending so heavilyon administratively reported prices through the state commercial system infor-mation network. By that time the SSB had realized that government list priceswere lses and less representative of nationwide transaction prices, which wereincreasingly conducted at negotiated and periodic market prices.
5.7 Improvements in urban price data collection continued in the secondhalf of the decade. In 1985-87, the SSB simplified its price reporting formsfrom 12 types of forms to S. It increased emphasis on price information inite urban worker's urban household survey, and it standardized the actualcommodities used in the price collection data nationwide even though most
1/ Most information presented here on the history of China's price surveysand index compilation is from Wang, Jianzhen, "China's Price Statistices,"in China State Statistical Bureau, Statistical Science Research Insti-tute, The Establishment and Develonment of China's Socialist StatisticalWork (in Chinese), 1985, Beijings State Statistical Publishing House,pp. 158-166.
2L This report focuses its examination on price survey work in urban areasand is unable to verify details of price data collection in rural areas.Chinese officials commented that the national retail price index includesprice changes in rural periodic markets as well as government-managedprices in rural state-run shops. Other than this, very little is knownabout price data collection In rural periodic markets.

- 61 -
areas could not price all items. By 1991 the national urban survey networkhad 1,500 full-time price investigators and 12,000 part-time assistantsemployed in the shops and markets surveyed (some of whom also collected ruralperiodic market prices). In the 1985-87 period, the sample of commercialestablishments in the price survey was also expanded and greater stratifica-tion introduced. At that time, 183 "representative" large, middle, and smallcities and rural towns were chosen for regular sampling, an increase from only54 cities and towns before 1985. The total number of commercial establish-ments and local markets sampled expanded to 9,382, and if the supplementarysample sites added by local governments are included, the total by 1987 was14,571. Measures of price change evolved as well. While most localitiestraditionally report monthly price changes as an increase over comparableprices in the same month one year earlier, many large cities in 1987 beganreporting individual price levels relative to comparable prices in December ofthe previous year, and beginning in 1991 they reported monthly prices relativeto one month earlier.
5.8 One difficulty for urban price surveys is the rapid expansion of theeconomy, with many new enterprises, especially individually-owned and smallcollective enterprises. SSB officials at the central and provincial levelfeel that this is not a serious problem, however, because all new undertakingsno matter how modest--including individual peddlers--are required to registerwith their city, town, or county. In the process of registering, the enter-prise or individual must provide a minimal set of statistics. Apparently, allregistered establishments and individuals are included in the stratified ran-dom survey sample selection process. No information was available about sam-ple rotation or renewal for price surveys. However, SSB officials were quitesure that undercoverage was not a problem, and that lapses in registering orreporting were remedied by sending someone to gather the information person-ally.
5.9 These elaborate procedures are largely geared to obtaining informa-tion on retail turnover and must be commended as providing a perspective onchanging sales and overall outlays (including purchases for tusiness purposes)mostly by households acting as consumers and, occasionally, producers. How-ever, the use in the past of the retail trade turnover values to calculateweights for a "proxy" CPI was increasingly only an approximation of overallretail price changes. The use of such turnover data for calculation ofweights for the CPI is inappropriate as the weights make no allowances forconsumption patterns at the household level and are biased towards items witha high turnover value. Nor do these aggregates cover services which enterinto the household consumption basket. To the extent that services areincreasingly purchased and are assuming importance in the overall patterns ofconsumption, another bias is introduced.
5.10 Price Collection. In terms of ,.oduct coverage, the SSB has fivecriteria or guidelines for selecting products for any particular price indexsurvey:
(a) goods meeting the special needs of the price index, according toscientific classification and selected specifications representingcommodities suitable for the index in question;

- 62 -
(b) goods termed "large-expenditure good.," that is, goods consideredrepresentative because of their large sales or purchase volume;
(c) goods "representative" of their commodity groups, which is to say,goods whose price changes represent the commodity group and otheritems in the same group;
(d) goods whose price changes are "typical," so their price changes notonly represent the group but also the general trend; and
(a) goods with a relatively stable production to ensure the stability ofrepresentative specifications in the price index.
For the retail price survey data, there is a list of 403 goods representingmore than 80 percent of all retail commodity sales in the country. Fifty moregoods are added to the list by local aurvey offices to cover differences inregional tastes and product availability.
5.11 In general, each establishment is visited every five days. At leastthree price quotations are taken in any locality for a single product, andsome goods are sampled at as many as eight different astablishments. For allrelevant product., prices from as many as three different price categories arecollected for the same good: a list price, a negotiated price, and a periodicmarket price. Multiple prices for the same product are especially importantfor foods. List prices are collected only once a month, because they do notvary frequently, and their changes are officially published. Other prices arecollected more frequently.
5.12 The SSB's current price survey methodology still contains signifi-cant product coverage variation from region to region, which is considereddesirable to a certain degree, because many brands and important product typesare not found in all regions. The SSB mandates a core set of products andbrands, and then it allows localities choice over supplemental products of aspecific type orefrom specific categories. Although the SSB does not requireit, considerations of sales volume, stable supply and representative pricingoften lead local statistical offices to select locally produced products assupplemental products. A good example is beer. There are many brands ofbeer, but many cities tend to report only the price of the locally producedbeer. This is true even in Beijing. Many kinds of beer are sold in Beijing,but its beer price data only report prices for the brand "Beijing Beer." Inthe case of Beijing Beer, it is not clear if this brand is chosen becausesurvey information indicates it is most representative or because price datacan be collected easily through administrative channels. If the latter reasondetermines local selection of commodities and brands, the result might be tobias the overall price survey in the direction of stability, since listedprices for locally produced goods would tend to vary less than negotiatedprices and periodic market prices for out-of-town and out-of-province prod-ucts.
5.13 With regard to local discretion in price surveys? atcording to offi-cials in the Chongqing Statistical Bureau, although SSB preoscribed 300 stan-dard commodities, Chongqing could price only roughly 200. For the others, itfound substitutes as close as possible to corresponding products on the SSB

- 63 -
list. SSB officials added that China's CPI compilation procedures stipulatethat 404 commodity groups must be reportedt, whil allowing local regions toadd another 50. Furthermore, the cost-of-living price index includes 30 ser-vice items. The sales covered by these groups account for 80 percent ofretail sales, and the groups are further broken down into numerous subcatego-ries and representative commodities, so that a small city would select forInvestigation as many as 1,000 specific items, representing tens of thousandsof individual price measurements.
5.14 Price differences by quality are difficult to account for, accordingto SS8 officials. For foods, one methodology is to specify a "standard" spe-cimen and collect its price. A good example of this method is the specifica-tion of a standard egg. For services, qualitative differences are even moredifficult, and SSB guidelines are not ideal. For example, the SSB requirosthat there be a fixed price for housing, regardless of where the housing islocated. It is not clear what the SSB intends to do with these and otherservice prices as reforms continue. Commercial housing reform has continuedto be a reform priority, both for ownership of homes and for rentals at scar-city prices. These reform trends are especially strong for rural housing andhousing for nontraditional ("own-grain") urban households. While the StateCouncil has mandated these improvements, SSB officials indicated in November1990 that insufficient resources prevented them from doing much in thisregard. Clearly, a higher priority for these improvements in price data col°lection would be highly desirable.
C. Role of the State Price Burau
5.15 It is useful to note that price data are also collected by the SPB,which is largely responsible for setting state prices and monitoring allprices, including negotiated and periodic market prices. SPB representativesstressed that they are primarily a management bureau, not a data collectionbureau. The SPB compiles its own price series but also uses SSB data. SPBconcentrates its work on analyzing changes in prices and their impact on citi-zens' lives. For these purposes, it collects some price data in its own spe-cialized surveys and combines them with SSB data for internal reports used forpolicy making. For example, it collects detailed data on wholesale prices forproduction materials which are either not collected by the SSB or not avail-able at the central-government level. Another example is the SPB's collectionof mea., vegetable, and grain prices in villages if it is looking at a specif-ic problem or policy option. Its price data are not generally published orotherwise made available to the public.
5.16 SPB officials indicated that an important part of future price sur-vey work must strengthen survey coverage of services and standardize furtherthe general coverage from region to region. The coverage of services seld tohouseholds, for example, is reportedly most complete for urban households andlses so for rural households. SPB officials said that even in cities, thescope of service coverage is much smaller than in other countries. This spe-cific problem is related to the more general problem of adjusting the statis-tical system to meet the new needs introduced by economic reform. Most ofthe change under reforms has been in rural areas and in nontraditional urbanhouseholds not covered by the regular urban household survey.

- 64 -
D. China'. Price Indice
5.17 The SSB compiles pric- indices based on its price survey., most ofwhich aro holdovers from the proreform era. When the 585 list. its tradi-tional price indices, it lits eight different indices and a ninth which isthe "scissors" ratio of two others. These eight price indices are presentedin Table 5.1, which also gives some indication of when the statistics becameavailblea.
Retail Price Index for the Whole Societv
5.18 The national retail price index (quan ohehui lingshou wujia zhishu)reflects price changes for some goods, but not services, sold retail in urbanand rural areas. It is composed of the State Store Retail Price Index(guoying shangye lingshou wujia zhishu) and subcomponents of the PeriodicMarket Trade Price Index (jishi maoyi jiage zhiahu), in particular the sale ofrural goods to urban residents in periodic market.. Its urban component isbased on consumption by registered urban households and apparently includesretail sale. to organizations as well.
5.19 SSB technical handbooks describe calculation of price indices forthe whole society as combining list, negotiated, and periodic market priceswith weights made up of the "volume" shares of consumption for the variousgoods sold at the three prices. It is not clear what prices the "volume"shares themselves are calculated in, but the presumption is that they arecurrent prices. In other words, for the ame good with different prices, itslist price weight in the total index is the value of sales of that good at itslist price, and so on for other prices and other goods.
5.20 There are various stages to calculating a typical prico indox,whether it ic a retail price index, a cost-of-living index, or some otherindex. First, an average price for each specific good is calculated fromprices obtained in price surveys. The average price for a good is a weightedaverage of its three prices, if it has that many, and its unit is the Chineseyuan. These prices are calculated monthly, and the annual average is a simplearithmetic average of the monthly prices, except in some cases where theannual price is sampled at a specific time in the year, such as for agricul-tural prices during the peak harvest season.
5.21 Secord, an index is calculated for each price, iomparing it to theprice in the came month in the previous year for monthly price. and to theprevious year's price for the annual index. In other words, tha previousyear's corresponding price is set to 100. One SSB technical handbook 3/notes that in 1987 there were exceptions for provincial-level cities llkeBeijing and Shanghai, provincial capitals, and Chongqing, which calculatedmonthly indices by cetting December in the previous year to 100. It is notcertain that this was still the case at the end of 1990.
5.22 Finally, indices for individual goods are combined in weighted aver-ages to obtain indices for broader categories and for the whole society. SSB
I/ SSB, gp. cat., p. 25.

- 65 -
Table. 5.1 CHINA'S 1988 PRICE INDICES
1950-100 1978-100 1987-100
Retail Price Index for the Whole SocietyNational Average 234.6 172.7 118.5Urban 310.2 191.7 121.3Rural 196.0 161.2 117.1
By Type of GoodConsumer Goods 175.4 119.0Urban 191.7 121.3Rural 163.2 117.4
Farm InputsRural 155.6 155.5 116.2
State Store Retall Price IndexNational Average 214.2 166.1 117.3Urban 236.9 176.2 117.7Rural 202.0 161.2 117.1
Periodic Market Price IndexNational Average 521.7 212.1 131.9urban /a 516.1 208.6 128.9
Household Cost-of-Livina Index For Whole SocietyOverall Price Index 118.8Services 116.2
Urban Household Cost of Livin2 /bOverall Price Index 273.1 188.5 120.7Services 113.8
Rural Household Cost of LivlnaOverall Price Index 117.5Service. 118.2
Farm and Sideline Product ProcurementOverall Price Index 531.9 244.5 123.0
Industrial Goods Sold in Rural AreasOverall Price Index 152.3 138.5 115.2
LA The original source notes that periodic market prices are only for ruralconsumer goods sold to "urban residents." See the text for a discussionof how this restriction may result in an understatement of price changesin periodic markets nationwide.
Lb "Workers" household cost of living is a holdover from the earlier Workers'Household Survey, which the S8B now calls the Urban Household Survey; theold name indicates that weights used in calculating the index are basedonly on survey data from the subsidized portion of the urban populationwhich has access to ration coupons and ration prices.
Source: Beijing Price Publishing House, China Price Yearbook 1989 (inChinese), 1989, p. 3521 National Periodic Market Index from SSB ChinaStatist4cAl Yearbook 1989 (in English), 1990, Beijing, p. 604.

- 66 -
officials explained that the weights used are mostly from household expendi-ture surveys, but also are based on retail sales information from statestores, other state-owned commercial establishments, and marketing and supplycooperatives. It is not clear, even after discussions with SSB official., howthe information from both household surveys and retail establishments is com-bined into overall weights for the index.
State Store Retail Price Index
5.23 The state store retail index (guoying shangye lingshou wujia zhishu)reflects only those goods sold in state stores in both rural and urban areas.It is used as a basis for comparison with the periodic market prices to seethe degree to which two-tier pricing is affecting a certain good or categoryof goods. It is often presented as a subcategory under the retail price indexfor the whole society.
Periodic Market Trading Price Index
5.24 The periodic market index (jishi maoyi jiage zhishu) reflects pricechanges in both urban and rural periodic markets. These markets sell finalfarm products, means of production, animals, and locally produced articles fordaily use. Periodic markets and China's index of periodic market prices haveexisted since the earliest years of statistical reporting in the early 1950s.The periodic market index is divided into two subcategories, urban and rural.Coverage in the rural or "village" index (nongcun jishi maoyi jiage zhishu)has two "large" subcategories for consumer goods aczd farm means of production.Consumer goods include grain, edible oil, fresh ve&atables, dry vegetables,eggs, aquatic products, fresh and dry fruit, and daily use articlees. Farmmeans of production include animal feed, small farm tools, live poultry, largeanimals, and bamboo and other wood. The urban periodic market index (chengshijishi maoyi jdage zhishu) only includes consumer goods. It does not includeany farm means of production.
5.25 This sumanry explains why many references to the nationwide periodicmarket refer to it as the "farm periodic market." Its orientation is towardfarm production, either output or input. As such, it suffers from insuffi-cient coverage of nonfarm household transactions. Such insufficiencies maynot have been significant before reforms, but with more than one third ofChina's industrial labor force in the rural labor force by 1990, not to men-tion large segments of the transport, construction and other labor force com-ponents, periodic market price coverage is lagging behind changes in the econ-omy. Future improvements in SSB's rural price surveys and indices shouldfocus on expanding coverage and accuracy to include the many new rural pzicesimportant for reforms, combining them with appropriate weights into a ruralprice index adequate for reflecting all rural transactions. Analytically,this index would best be described as a general price index incorporatingconsumer, producer, and intermediate goods.
5.26 As for the urban periodic market, its coverage underreports a vari-ety of transactions, especially those between urban entities not related tofarm products. 8SB technical manuals report that urban periodic market pricecoverage is generally limited to the consumer portion of periodic markets incities and towns. Periodic market components of the urban retail price index

- 67 -
also overemphasize goods sold to urban residents by farners. That is, nonfarmurban transactions are givon insufficient coverage. In these ways, the prere-form focus of periodic market durveys still dominates their implementationunder statistical reforms and the Early Hybrid System.
Houaehold Coet-of-LiIint Index for the Wgole Society
5.27 The traditional name for this countrywide price index is the "Resi-dento' Cost-of-Living Index" (jumin shenghuo feiyong jiage zhishu), and it ismeant to reflect all changes in prices of consumption goods and services byhouseholds in urban and rural areas. In general, it is a combination of its.two major subcomponents, the Urban and Rural Household Cost-of-Living Indices*and so is subject to the same concerns affecting those indices. For each oftheso categories, consumption is split into a commodity expenditure categoryand a service expenditure category. In the earlier urban cost of livingindex, services were included at state established prices but, because theirresulting weight was statistically insignificant, little official attentionwas paid to them in published documents.
Urban RouseVoid Cost-of-Living Index
5.28 The Urban Household Cost-of-Living Index is still called the "Work-ers' Cost-of-Living Index" (zhigong shenghuo feiyong jiage zhishu) whichreflects both its origins and its current content. It originally was based onthe spending patterns of the households of state, urban collective, and urbangovernment employees, since before economic reforms virtually all urban house-holds were in these categories. With reforms, however, migration to the urbanareas has accelerated.
5.29 The calculation of the urban household index is the same as for theretail price indices, in that it combines list, negotiated, and periodic mar-ket prices according to the value of transactions for a good at each price.The prices are measured by the urban price survey, and transaction valueweights are from the urban household survey. It was confirmed that this surveydoes not cover households for an important and growing segment of the urbanpopulation, namely the *own grain" households (see Chapter VI on householdsurveys). As a result, the transactions used to weight urban prices reflectspending patterns by traditional urban households only, the so-called "nou-agricultural households." These households have a subsidized standard ofliving (although price reforms are reducing the scale of the subsidy), withthe subsidy taking the form of rationed goods sold at low state list prices.An a result, traditional urban households do not need to purchase as manygoods at periodic markets as nontraditional households (the "own-grain" house-holds). By only considering spending for traditional households, the urbancost of living survey overemphasizes list prices and underemphasizes periodicmarket prices, which in general are higher and fluctuate more frequently.
5.30 This underreporting and insufficient consideration of own-grainhousehold transactions introduce significant distortions in China's priceindices which future phases of China's statistical reforms should seek toreduce. Although SSB officials indicated that they did not survey ovwn-grainhouseholds, they have not escaped the notice of other agencies such as theMinistry of Internal Security, which, as of the mid-1980s, has been register-

- 68 -
ing own-grain households as a sep&rate category of urban 'esidents (see para.6.37). Whether or not the results of such a survey are made public, theirexpenditure weights should be made available to the SSB so it may initiate thecalculation and publication of a second more comprehensive urban consumerprice index.
Rural Household Cost-of-Livina Index
5.31 The rural cost-of-living index is called the "Farmers' Cost-of-Liv-ing Index" (nongmin shenghuo feiyong jiage zhishu), reflecting traditionalconcepts in China dating from before reforms, when all rural households wereesseratially farm households. It combines prices for consumer goods and ser-vices using rural household consumption weights. SSB officials, however, saidthat the collection of rural service price data was poor, and it appears thatthe prices used for the index are those collected for the rural periodic mar-ket prices, which are virtually all commodity prices.
Farm and Sideline Output Procurement Price Index
5.32 The rural procurement index (nongfu chanpin shougou jiage zhishu)combines changes in prices of all kinds paid for rural farm products, whetherby state enterprises, at periodic markets, by individuals, or through otherorganizations. It is essentially a farmgate price index which includesfarmer handicrafts and other sidelines. While irformation is not available onexactly how the prices for this survey are collected, it appears that they area combination of rural list prices paid by state agencies collected throughadministrative channels, and rural periodic market prices collected as part ofthe traditional periodic market price survey.
Retail Price Index for Industrial Goods Sold in Rural Areao
5.33 The rural industrial goods index (nongcun gongyapin lingshou jiagezhlshu) includes both means of production and consumer goods, including dura-bles. It is calculated by making adjustments to the rural retail price indexcomponent of the retail price index for the whole society.A/ This meansthat it only includes goods sold in state stores. This introduces an elementof downward bias in the index because, with reforms, more retail sales inrural areas are made by individuals and private enterprises rather than bystate-run stores. It is not clear what share of urban industrial goods soldin rural areas are sold outside state stores, but as reforms continue, itsshare will surely grow.
Other Price Indices
5.34 In addition to these traditional price indices, the SSB is currentlyworking on several new price indices on which compilation results are stillpreliminary. The three major new price indices are:
(a) Industrial Producers Price Index;
4/ SSh, 02D cit., p. 28.

- 69 -
(b) Purchased Raw Matorials Price Indox; and
(c) Construction Price Index.
5.35 The SSB indicated that these price indices are in an early stage ofdevelopment and were too crude at present to publish. It was not possible tofind out if these indices cover all productive establishments in the economy,urban and rural, or whether they are merely an extension of the traditionalstate-dominated production system, underemphasizing the growing importance ofnonstato economic sectors.
S. Conclusion
5.36 The present range of price indices has several shortcomings relatedto the choice of weights, the coverage of items, and the range of prices usedin the computations. In light of the far-reaching changes taking place in theeconomy, SSB chould, as an urgent priority, review all of the indices, elimi-nate those that are no longer relevant, modify those that remain and introduceadditional indices that would better capture the main price trends in theeconomy. In this context, SSB is urged to rapidly develop the Industrial Pro-ducers Price Index, the Purchased Raw Material Price end the ConstructionPrice Indices. It should be noted that the Ministry of Foreign Trade (MOFERT)has produced some import and export price indices which, because they relateto goods passing through state trading enterprises, do not cover comprehen-sively all traded items. In addition, in compiling such indices there arecomplex problems of valuing traded goods at domestic versus world prices, andat implicit prices received (and paid) for the goods in question, which needto be resolved and for which it is understood SSB is seeking technical assis-tance from the IMF.

- 70 -
VI. HOU8EHOLD SURVEMS
A. Intgoduction
6.1 China's household surveys aro just one example of a channel for datacollection which will become increasingly important in many sectors as econo-'mic reforms progress. More specifically, data requirements for nationalaccounts under China's Hybrid Statistical System will need to rely increas-ingly on aimle surveys using economic concepts based on SNA principles.Sample *urvoys will eventually reduce China's heavy reliance on its network ofdata collection based on complete enumeration of results from all enterprisesin a given ministry, sector, and ownership category. Interestingly, eventualdeemphasis of completo enumeration based on administrative reporting and itsreplacement with random sample surveys will increase the accuracy of data andwill result in Improvements in national accounts. This is true because theomissions and blas." in administrative reporting are systematic and persis-tent, compared to the results from a well-designed and Implemented randomsample survey. In addition to accuracy, sample surveys enjoy lower costs,especially as statistical requirements increase in ̂ omplexity. As the pace ofChina's reforms increases, the inevitable growth in the number of enterprisesoutside administrative reporting channels will need to be covered by surveys.China's social and economic surveys have improved enormously since reformsbegan in 1978, and their techniques continue to increase in sophistication.There is still significant room for further improvement however, especiallysince, in at least one case, a rapidly growing section of the urban populationmay still not be sampled at all (the so-called "own-grain" population; seebelow). This review of China's survey practices is aimed at assisting SSB instrengthening its overall survey programs.
6.2 Household surveys are already well-established in China. While manydata are collected through administrative reporting, a critical and growingsegment of primary data comes from a variety of household surveys. For admin-istrative purposes, the surveys are divided into two major categoriess ruralsurveys ("Rural Village Household Socioeconomic Surveys") and urban surveys("Urban Household Socioeconomic Surveys"). Unlike most other statistics,which are passed on to the SSB in aggregated form from their originating agen-cies and units, many of these two categories of surveys are conducted by theSSB itself under the direction of two of its 26 d*partmant-lovel units: theRural Bureau and the Urban Survey Tamse The two most important surveys arethe regular monthly urban and rural household surveys, but these two are notby any means Chinr's only household surveys. The Ministry of Agriculture, forexample, conducto exteneive household surveys of production and output condi-tions. Nevertheless, the two 8SB-managed regular surveys are by far the prin-cipal survoys for compiling national accounts components and calculatinghousehold incomes and expnditures, and they are also used in the calculationof retail price indices. The surveys provide the necessary information forestablishing household consumption, savings, transfers, and other elementsimportant for generating the xpenditure side of the national accounts. SSBis also Increasingly turning to the use of sample surveys for gathering dataon the activities of businesses In the service sector.

- 71 -
B. Rural Household Survey History
6.3 Both the rural and urban survey, have their origins in the 1950s,during the first decade of China's economic program. Both surveys were inter-rupted by the great political and economic upheavals during the Cultural Revo-lution, but at the same time skills and methodologies gradually accumulated.TheSa surveys did not initially use probability sampling techniques but were"model" surveys.
6.4 The rural household survey began as a one-time survey in 1955 cover-ing 16,486 households and collecting information for the year 1954. Ten thou-sand households were then chosen for resurvey in 1956, and by the first halfof 1958, just before the Great Leap Forward, the sample was 18,000 householdsIn 770 counties. The selection of households was not based on sampling prac-tices. The rural survey was suspended twice: first in the years 1958-62during the Great Leap Forward, and second in the years 1966-78 during theGreat Proletarian Cultural Revolution. The survey's restoration in 1962allowed the survey to grow from 4,958 households that year to 12,095 in 1964.With the Cultural Revolution's start in 1966, the SSB stopped all surveyactivity, and indeed the State Statistical Bureau itself ceased to exist 1/
6.5 Beginning with coverage of 1978, the rural surveys have continuedthrough the 1980s and early 1990s without a break. The actual survey workbegan in 1979 with a household sample size of 10,282 and a questionnaire cov-ering both years 1978 and 1979. The sample size was expanded quickly to16,000 hLuseholds in 1980, 23,000 in 1982, and 30,500 in 1984. By 1990 thesample was just unde" '0,000 households.
6.6 During more than twelve years of economic reforms, as China's eco-nomic system haa largely abandoned its heavily state-administered economicmanagement apparatus, China's household surveys have grown in importance. Inrural areas, where communes once administered virtually all farm life, eco-nomic reforms have brought about changes that affect data collection. Whlilecentral authorities couid once rely on commune-repacted statistics, they nowmust collect most intormation with survey techniques, although villages asadmnaistrative reporting units do keep records on all households which arealso used for statistical purposes. In urban areas, where state enterprisesand other centrally administered units once employed virtually all workers,commercialization of the economy through r.iforms and inmigration of numerousrural workers and private entrepreneurs has spread the economy well beyond the3ates of state-controlled enterprises, which have themselves gone through tax
1/ Much of this and subsequent information was obtained from the two arti-cleas Wu, Hui, "China's Statistical Survey Mothods," (in Chinese) and"China's Farm Household Survey," (in CLinese) by He, Huanyan and Pan,Yanjin in SSB (State Statistical Bureau), Research Institute of Statisti-cal Science, e, Td of Ch4na's SocialistStatistical Work (in Chinese), 1985, Beijings China Statistical Publish-ing House, pp. 31-41t 207-215, end from lnterviows with mambers of theSSB Rural Household Survey Team: Xu Lashong, Tang Ping, Ran Tong and SunNai'` n, In Boijing, iovamber 1990.
- 72 -
and management reforms separating them from direct management by Ministriesand their local bureaus.
6.7 Given these rapid system changes and the demands they make on surveydata sources, it is encouraging that the scope and collection methodce ofChina's household surveys have improved significantly during the 1980e, andthat many of the concerns expressed by early visiting foreign specialists havebeen addressed and corrected. During the 1980., sample sizes have increased,sampling techniques have improved, and the scope of statistical coverage hasexpanded. As a result, the two surveys together provide a wide variety ofsuch economic information as employment, cash holdings, cash and in-kindincome, expenditure, consumption, ownership of durables, land and housingspace, and detailed cash purchases organized by the category of price that waspaid.
6.8 As survey improvements have matured and improved, however, otherconcerns persist, and at least one major new concern--that of coverage ofthese surveys--deserves special attention. Traditional concerns which persistare mostly related to nonsampling error. That is, the actual collection ofdata at the grassroots level appears to suffer from uumerous lacunas whichhave worsened as economic reforms have complicated the overall structure ofthe economy.
6.9 The most serious concern, already mentioned above, is the omissionof "Own-Grain" households from coverage in both surveys, since neither urbannor rural surveys seem to cover this new category of urban households--house-holds recently moved to the city from rural areas and ineligible for standardurban subsidies. This lapse in coverage may not have been important in themid-1980. when the new population category first developed, but it grew inimportance through the end of the decade, and will certainly become increas-ingly important as reforms and market relations proliferate in the 1990s.
C. Urban Household Survel History
6.10 The history of the urban housphold survey also goes back to 1955,and can be divided into four periods: 1955-60, 1961-66, 1980-34, and 1984-present. The survey began as the "Industrial Workers' Household Survey,"first limited to 6,000 worker households in 27 cities, to make the job manage-able.2/ The households were selected by enterprises themselves based onincome range. An 4mmediate difficulty with the early sampling technique, inaddition to its limit to industrial households, was that while it was designedto give a representative sample for the country as a whole it did not give arepresentative picture of each individual city or region, which made it unpop-ular among local officials and hurt its development.
2/ This account of the earlier development of the Urban Ho%-.ehold Survey islargely taken from mission interviews and two essays: Wu, Hui, "China'sStatistical Survey Methods," (in Chinese) and Shao, Zongming, "China'sWorker Household Survey," (in Chinese), both published in SSB, The Estab-lishment and Develoyment of China's Socialist Statistical Work (inChinese), cited above, pp. 31-41, 198-206.

-73 -
6.11 Beginning in 1957, this preliminary defect was corrected and thenumber of households was expanded to 7,000 in 32 cities, with households drawnnot just from industry but from four sectors: Industry, Commerce, Education,and Government Administration. Beginning in the second half of 1958, becauseof the Great Leap Forward's slogan, "Emphasize Production, Downplay Living,"the number of households in the survey declined sharply, and in the secondquarter of 1960 the formal compilation of the survey results stopped through-out the country.
6.12 Urban surveys began again in 1961 because of the need to understandthe plight of urban households during the difficult years of starvation andfinancial disorder which followed the Great Leap. From roughly 1,000 house-holds in 28 cities in 1961, the survey expanded to nearly 4,000 households in40 cities in 1966. However, the samples were neither random nor representa-tive and there were no uniform rules for sample size. Before the work of cor-recting these defects could be completed, the Cultural Revolution began in1966, and the survey was suspended until 1980.
6.13 Urban worker household surveys actually began anew with a one-timesurvey of "Urban Household Conditions" in 1978 covering more than 88,000households in 67 cities and 93 county towns. Costs prevented beginning aregular survey that year, but in 1980 the State Council decided to reestablishthe Urban Wlorkers' Household Survey, with an expanded nationwide staff paid,for the fiirst time, by administrative outlays from provincial and local bud-gets. In 'hat year, a one-time survey of basic conditions in worker house-holds involved 47 cities directly sampled by the State Statistical Bureau andan additional 79 cities and 26 counties sampled by provincial and local gov-ernment. Altogether 200,000 households were in the 1980 one-time survey, outof which 15,000 were made regular survey households, of which in turn 8,000were selected for direct sampling by the SSB as the new Urban Workers' House-hold Survey.
6.14 In the early 1980s, the urban survey's major shortcoming was that itonly included families of workers in state enterprises and collectives. Itdid not include those urban households in which no one was a worker or no onewas employed in a state-owaed or collective enterprise. It did not includesingle-person households or households of foreigners, and it was limited tomajor cities only, leaving out workers in county towns.
6.15 In order to correct some of these shortcomings, and in general inorder to make the urban survey conform more to the needs of economic reforms,the urban survey was revised in 1984, when the State Statistical Bureaucreated its now Urban Socioeconomic Survray Team. The name of the nationalsurvey was changed from "Urban Workers' Household Survey" to "Urban HouseholdSurvey," because the basis of sample selection was gradually shifted fromstratification based on the enterprise and worker rolls, to one based on citysection, street, neighborhood, and household. The national survey wasextended to include towns as well as cities, and by 1990, when the shift tostreets and neighborhoods was complete, the total sample was 30,000 householdsin 500 cities and towns.

- 74 -
D. General Survey Administration
6.16 Both the rural and urban household surveys are administered directlyby SSB through the network of provincial end local government statisticaloffices. At the national level, two of the SS8. 26 departments have directresponsibilityr the Rural Survey Team (or Nongcu Shehui Jingji Diaocha Dul,"Farm Village Social Economic Survey Team") and srban Survey Teem(Chengshi Shehui J"ngji Diaochadui, "Urban Soc. conomic Survey Team"). Bothwre eastablithed in 1984 by order of the State % acil.
6.17 In August 1990, the Rural Survey Team's central office had an autho-rized staff of 85, with a countrywide *taff of 8,250 at provincial end localoffices, where they functioned as part of local SSB branch offices. In addi-tion, there were 27,000 "assistants" nationwide to help with data collectionand the day-to-day management of household record keeping. Not all of thecentral staff, however, were directly associated with the regular householdsurvey. In all, the Rural Survey Teem in mid-1990 had these different sec-tionst
Rural Survey Teem 31
* Leadersblp Section* Overall Administrative Section* Localities Section* Forestl7, Livestock, end Fisheries Section* Farm Village Household Survey Section* Crop Section* Special Survey Section* Secretariat
6.18 The Urban Survey Team at the some time in mid-August 1990 had apermanent central staff of 78, with a nationwide staff of 4,550 in 146 large,medium, and small cities. By November 1990, the SSB had amended its urbanclassification scheme to separate out "especially large cities." Tho UrbanTeam in mid-1990 also had a number of sections, not all of which were directlyinvolved in the regular urban household surveys:
Urban Survev Team A/
o Leadership Section* Urban Socioeconomic Section* Urban Residence Survey Section* Production and Investment Prices Section* Circulating Goods Prices Section* Consumer Pric6 Section* Computer management Section
3/ SSB, "A Simple Introduction to China0s Statistical Work" (in Chinese),August 1990, Beijingt SSB (mim ographed essay presented to Mission,November 1990), p. 13.
41 o. cit.L, p. 14.

- 75 -
* Sample Survey Design Section* Secretariat
6 19 Although household survey results for both teams are analyzed atcentral SSB headquarters, the collection work and initial compilation intosummary statistics are done at the provincial and local branch office. Theseoffices not only collect and pass along national survey data, they also con-duct additiozal surveys of their own and even, for their own local purpose.,expand the national surveys with additional households and survey items.Funding for the national surveys comes from the state budget, but if the localbranch office adds questions or households to the national survey, then itadds it. own funds to cover the additional costs.
6.20 As for detailed implementation of the urban and rural householdsurveys, provincial statistical authorities confirmed that instructions sentfrom the central office are extremely detailed for sample selection andrelated issues. In some other areas, however, there is local discretion,especially for the selection of commodities used to gather expenditures byprice category, because of the large variation in tastes and product brandfrom locality to locality (see para. 5.13).
6.21 In terms of the range of surveys conducted by provincial and localoffices, data collection varies depending on the nature of the survey. Forthe regular household surveys, relatively detailed central instructions guideregular monthly, quarterly, and annual collections and compilations throughspecialized networks. For irregular "special" surveys, instructions to prov-inces and localities are much more flexible, and in Chongqing City, two basicmethods were used for special surveys. First, where the subject matter islimited to state-sector organizations, survey data are commissioned from min-istries and their local bureaus. Second, for administratively decentralizedtopics, counties and townships are charged with conducting the surveys, oftenin conjunction with the registries developed for the regular urban and ruralhousehold surveys. Special government surveys and inereasingly frequent Sur-veys conducted for private Chinese clients form a major and interesting compo-nent of the SSB's survey activity; they are, however, beyond the scope of thisreport.
5.22 In regard to all ourvey activ-ity, it is important nevertheless tonote that at provincial and local levels, one of the major ongoing initiativesto improve the quality of data collectien is the establishment of statistical"stations" at the county level as an extension of the SSB9' nationwide net-work. Such stations already exist in many parts of the country, and asresources becom available the SSB plans to introduce them in all rural coun-ties. In Novembor 1990, Chongqing Municipality had such stations in only halfof its rural counties, but planned to establish them in all counties by theend of 1991. Each center is nominally headed by a township official, with afull-time statistician as vicedirector and other statistical staff headingspecIalized subunits. In addition to managing the collection and processingof data, these stations are also statistical information centers for theircounties. At the same time, in late 1990, 3imilar organs for cities and town-ships, called Onsighborhood statistical centers," were being planned, orga-nized by city blocks.

- 76 -
6.23 One of the difficulties facing the present administration is itslack of resources to standardize survey criteria sufficiently in all ofChina's provinces and localities. This constraint is especially serious forcoverage of service activities and prices, which were not adequately treatedin the Soviet statistical system China adopted in the 1950s.
6.24 SSB has made considerable progress in developing the capacity forconducting surveys of households. This is in part in response to the need foradditional data that administrative records do not generate. Secondly, it isa reflection of the need to develop independent sources of data for socioeco-nomic analys4s. It can also be surmised that these survey initiatives aredesigned to o,ercome some of the inherent biases present in data sets culledfrom administrative records managed and controlled by local officials. Thegreat strides that SSB has made in organizing the statistical infrastructurefor conducting household surveys are impressive. China has now in place acapacity for conducting household surveys whi:h measures well against thecapacity of other countries at a comparable stage of development.
E. SamIling: Rural Household Survey
6.25 The sampling design for both the urban and rural surveys had, by thelatter 1980s, incorporated suggestions of foreign specialists in the early1980a and developed a stratified selection system based on location, ratherthan employment rolls or other listings. In both cases the SSB has also beguna system of sample rotation, replacing a share of the total sample each year.Within the stratified target population, households are ranked by income,based on administrative and one-time survey data, and then selected usingsystematic sampling techniques.
6.26 For the rural survey, multistage stratification is employed. Twodifferent approaches, depending on the population density and administrativemakeup of the region are used. In general, the stratification is:
Province-->County--oVillage-->Household
but in densely populated counties whero there are well-enough developed town-ships (which are larger than villages and have a better statistical office),the village administration (between township and household) is skipped and thestratification is:
Province-->County- -1Tovnship- ->Sousehold
6.27 In the 1990 procedure, the survey selected roughly 35 percent of themore than 2,000 counties In the entire country. Every province is sampled,but for large provinces a lower share of its counties is used, sometimes aslow as 20 percent, while in smaller provincoo the share of counties selectedis much larger, sometimes as much as 50-60 percent. Counties are by defini-tion rural, and in 1990 there were more than 9,000 villages or townships intba counties selected for the survey. For these villages and townships therural survey uses data from administrative sources ont (a) average per capitaincome for each village, and (b) total population per village. Within a prov-ince, village-level sampling intervals are determined by population and rankedaccording to per capita lncome, and then the number of households to be sam-

- 77 -
pled per village is determined by a regular sampling interval across the province, selecting households by population interval without village replacement.Within villages there is household selection, also based on administrativemeasures of household per capita income, using a double systematic symmetri-cal-centered sampling procedure, which SSB officials said they introduced in1985.
6.28 Households that fall within the survey maintain a daily diary (theZhangben) and two transactions books, one for cash transactions and one fortransactions in kind. Households receive a maximum payment of Y 6 per monthfor participating in the survey, and the households also receive goods andother benefits from time to time. These incentive payments are designed toencourage participation. There are no penalties for nonperformance, and ifthere are difficulties, the assistant enumerator responsible makes extraefforts to improve personal relations with the household. For each fivehouseholds there is an assistant enumerator who visits the households andhelps those who are illiterate or who have other difficulties. Each householdis visited roughly once a week. If a particular household needs more help, itis visited more frequently. The assistant is paid Y 10-15 per month and issomeone living in the some village. The assistant enumerator fills out a formeach month summarizing the two transaction books, which is delivered to thecounty or toumship statistical office. The county/township summarizes themonthly reports and sends its results to the provincial statistical office.There are insufficient resources at the provincial level to process the indi-vidual monthly data records, so these remain at the county/township level.
6.29 The rLral survey hao gradually introduced systematic rotation of thesample. In 1980, 1982, and 1984, the survey replaced only those householdswhich were not reporting well. At the same time it was expanding the sample.In 1985, the entire sample was replaced, and then in 1987 there were someslight sample cleaning. In 1989, the SSB rotated out one fifth of the entiresample, and beginning at the end of 1990 it will start rotating out one fourthof the sample each year. Explaining their work in a different way, SSB offi-cials said that, by 1991, all of the original 1985 sample will have beenrotated out, because at end-1989 they rotated the entire sample in six prov-inces as a learning exercise, and at the end of 1990 (for the 1991 survey)they planned to rotate out all of the rest of the 1985 sample. Beginning atthe end of 1991, they were to start rotating out one fourth of the sample eachyear. Throughout the 19800, as some of these changes took place, the share ofpoorly-reporting households was less than 1 percent.
F. Samplina: Urban Household Survey
6.30 As with the rural survoy, sampling techniques for the urban surveyhave matured in the 1980s. By 1991, the sampling methods in use were satis-factory and the organizational arrangements in place were impressive. Priorto 1985, the urban survey used worker rolls from all the eligible cities ineach of China's six official regions, or districts for sample selection ofhouseholds. The pre-1985 survey used these urban worker rolls and rankedhouseholds by per capita income and proceeded to sample households on a sys-tematic basis. Beginning in 1985, however, the sample selection process hasgradually shifted to neighborhoods, streets and roads (based on the advice of

- 78 -
an advisor sent by the United Nations in 1981), and by 1990 this shift wascomplete.
6.31 In the current sample design, China's cities are dividec into fourcategoriest especially large, large, medium, and small cities. Target house-hold sample sizes for each city are based on sampling ratios for each category(for examplo, 8 per 1,000 for large cities, 10 per 1,000 for medium citieo,and 15 per 1,000 for small cities). Based on a first-stage survoy of roughly150,000 households, the SSB has information on household size, householdemployment, and household income. With this information, cities are ranked bypopulation and average income and sampling intervals are used to pick thecities chosen for detailed survey. Because of the desire to include all pro-vincial capitals, if any of these is missed by the initial city selectionprocess, it is added into the sample, resulting in oversampling.
6.32 Zach city is stratified by city section, then by street, then byneighborhood commitees, and then by household. Within a neighborhood, thereis a syotematic selection by interval, with the first household selected atthe midpoint of the first interval. The SSB acknowledges that it has beenadvised to randomize the first household's location within the first interval,but this has not yet been done.
6.33 In the first phase of the process, when only size, employment, andincome are asked, the sample includes one-person households, but these areexcluded when the SSB selects the smaller sample for daily record ketping.Furthermore, 58B officials confirmed that the sample only includes the so-called "nonagricultural" population (see below in the section on "own-grain"households). Interestingly, even if a household has one "nonagricultural"person, who is married to a so-called "agricultural" person, that household isexcluded from the survey.
6.34 Each household participating in the urban survey receives an incen-tive payment of Y 5 per month. Some households have offereil to pay the SSBY 5 per month if it would excuse the household from participating in the sur-vey. SSB officials respon ible for the urban survey stressed that, in theirmany years of experience, the most serioua' problem in thek survey was nonsempleerror. Survey interviewers must spend conaeideri-ole energy to win the coopera-tion of the households. For example, the interviewer will help the householdwith its laundry, or take a basket of fruit, or help the family solve anadministrative or personal problem, even visiting them i2 the hospital whenthey are sick. To avoid disputes within a household, each member is encour-aged to keep a separate transactions diary.
6.35 Most of the data are processed at the provincial level, although SSBdoes receive data for a third of the sample to use for its own purposes. Alldata are sent to the SS8 central office on computer diskettes. OvGrall, theurban survey is well conducted both operationally and In terms of the method-ology.
G. Urban Survev Coverate
6.36 With respect to the coverage and scope of the two household surveys,it should be noted that these surveys do not cover the entire population. By

- 79 -
way of background it is necessary to offer an explanation about China's popu-lation registration system. Beginning in the early 1960s, China formalized asystem of separate household registration for rural and urban householde--called the "agricultural" and "nonagricultural" populations, respectively. Itis important to realize that the term "agricultural" in this usage does notnecessarily imply that a household is primarily engaged in agricultural pur-suits. That was in general the case when the registration system vas firstintroduced, but as reforms proceeded in the 1980s, many rural householdsmigrated to the towns and cities or had their homes incorporated in new towns.Many more so-called "agricultural" households came to be employed or engagedin industry, construction, transport, commerce, and other service sectors. Bythe latter 1980s, more than 40 percent of China's total industrial labor forcewas registered as "rural labor" drawn from the so-called "agricultural popula-tion."
6.37 As a consequence of these migratory movements, in part the result ofthe disbanding of the communes and the sub6equent growth of Town and VillageEnterprises (TVEs) linked to the major economic reforms, the population is nowcategorized into three distinct groups and so registered. Since 1986, byorder of the State Council, the Ministry of Internal Security has introduced anew third registration category for recently arrived or incorporated urbanresidents who do not receive the subsidies and benefits of more traditioualurban households. Because they cannot rely on the state for a basic householdgrain allocation at subsidized prices, they are given official names whichara --A4 tps best translated as "Urban Residents Responsible for their OwnGrain' (Dai Kouliang Jin Chengde) or "Population with Self-Managed Grain"(Zili Kouliang Renkou), shortened here and referred to as the "Own-Grain"population. There is great sensitivity on the issue of this new category.During preparations for the mid-year 1990 census, the issue of the Own Graincategory was discussed, but in the published reports all Own Grain householdswere included together with "agricultural" households.
6.33 Household registry is important in China for a wide variety of rea-sons, including employment, taxation, vital reporting, birth control monitor-ing, education, welfare services, and distribution of ration coupons. Themajor distinction between "agricultural" and "nonagricultural" populations hasalways been that a household officially registered as "nonagricultural" isautomatically entitled to a whole range of ration coupons, subsidized ser-vices, and income suppleeunts not available to the "agricultural" population.Before economic reforms spread the use of markets in China, household registrywas part of an effective system limiting rural-urban migration because, unlessa household was registered in the city, its membera could not get a job, findhousing, or purchase food. With the advent of reforms, however, theserestrictions were relaxed and markets removed the need for ration coupons if amigrant was able to pay the higher nonsubsidized prices.
6.39 As a result of rural-urban migration during the 1980s, and the cre-ation of new cities and towns in what had been rural areas, the close corres-pondence between urban population numbers and the so-called "nonagriculturalpopulation" began to weaken. Tli divergence for Chongqing M:uicipality in8ichuan Province can be seen in Table 6.1 which shows that in the late 1970.and early 1980., there was close correspondence between the urban populationin Chongqing and its registered "nonagricultural" population. As reforms

- 80 -
Table 6 1: CHONGQING URBAN AND 'NONAGRICULTURAL" POPULATIONS
Urban Subsidizedpopulation "nonaricultural" Dogulation(thousand) Thousands Share (2)
1978 2,875 2,686 93.41979 2,989 2,829 94.61980 3,060 2,887 94.31981 3,126 2,964 94.81982 3,246 3,043 93.71983 3,346 3,137 93.81984 3,556 3,200 90.01985 Ia 4,258 3,357 78.81986 4,638 3,452 74.41987 4,804 3,535 73.61988 4,940 3,601 72.91989 5,198 3,652 70.3
La Urban boundaries were redefined in 1985.
progressed, especially after the onset of urban management and rural commer-cial reforms in 1984, the urban population grew much faster than the "nonagri-cu!tural" population, until the "nonagricultural" share of the urban popula-tion had dropped from 95 percent in 1981 to 70 percent in 1989 can (an exten-sion of urban boundaries also served to enlarge the share of the urban popula-tion).
6.40 The difference between the "urban" population and the "nonagricul-tural" population is not the same as the own grain porticn of the urban popu-lation since the criteria for determining if households are "rural" or "urban"is not the same as the criteria for determining if they are registered "agri-cultural" or "nonagricultural." The rural-urban population category is basedon dwelling location and is determined according to city and town boundariesby local officials responsible for administrative population measurements*The "agricultural"-"nonagricultural" registration category is based on ahousehold's inherited registration status and is maintained by the localoffice of the Ministry of Internal Security. The major complication is thatwith the uspread of town and city boundaries in the 1980., many farmers foundthemselves, their dwellings and even their fields within town and city boun-daries. Thuts, ts urban population includes own-grain households as well asurban agricultural households.
6.41 The complexity of trying to match population and registration cate-gories io best illustrated with an example. Even though Chongqing is a muni-cipality, it has a large number of rural counties under its administration.Even in 1989, its rural and farm village population was nearly double its"urban' population, which is officially called the "city and town" population

- 81 -
and includes the population of towns In farming counties. Many of Chongqing'sall-urban "sections" and all of its farm-county towns apparently include sig-nificant numbers of farmers and farm dwellings. Since the rural survey coversall households engaged in agriculture, wherever they live, it also covers agood portion of those urban residents who are not at the same time registered"nonagricultural"--because even though they live within urban boundaries, theyare in fact farmers. It was explained to the mission that to be an "agricul-tural" household, the housohold had to be primarily engaged in agriculture,but many of its members might also be engaged in other sectors. Other inter-views gave a somewhat different standard, which was that the household had tohave its own land or animals--that is, land or animals officially contractedto it and under its production "responsibility."
H. Own-Grain oDpuiation Size Estimates and Imilications for Analysis
6.42 These definitional complications for population counting and regis-tration are important because ignoring them introduces distortions intonational survey results and calculations of price indexes. For example,inclusion of own-grain household data in national survey results might resultin significantly different sommary statistics for urban household income,household size, household liviug space, and household asset ownership. Withr'spect to price indices, excluding own-grain transactions generally resultsIn indices which understate actual price changes. It is therefore significantthat there is no available measure of even the size of tne own-grain popula-tion "missed" by both surveys, and indirect estimates such as those presentedbelow yield only a wide range of possibilities.
6.43 One method of estimating the own-grain population size uses laborforce data. China's labor force data are classified by both sector of employ-ment and by rural and nonrural (urban) status. The most obvious labor-forceproxy for the own-grain population is "urban inrividual" workers ("IndividualLaborers in Cities and Towns"), which is d.jtinguished from two other majorcategories: "State and Urban Collective Employees," who are probably mostlyregistered "nonagricultural," and "rural and village laborers," who are almostcertainly all registered "agricultural." If "State and Collective Employees"and "Urban Individuals" together are taken as the urban labor force, then forChongqing Municipality, "Urban Individuals" have only grown from 0.13 percentof the urban labor force in 1978 to 3.3 percent in 198945/ For all ofChina, the shift in the "Urban Individual" share of the urban labor forceduring the same 1978-89 period was from 0.16 percent to 4.5 percent.6/
6.44 There are several potential sources of error in using labor forcedata to estimate the ScAle of the own-grain portion ef China's urban popula-tion. In the first place, labor force data refer to iudividuals, and manypersons working for nonstate-system enterprises are individuals temporarilyliving and working in urban areas. They would not be considered households,and if they were sending money back to a home village, that income would be
5/ Calculated from Chonagint Statistical Yearbook 1990, p. 33.
J§ Calculated from SSB, China Statistical Yearbook 1990 (in Chinese),p. 113.

- 82 -
included in rural survey coverag, there. This factor points to labor forcedata overstating the importance of own-grain households. At the same time,there are incentives for state-system enterprises (especially collectives) tohire workers who are not part of the state-system labor force (that is, notpart of the officially registered "nonagricultural" labor force). This isbecause they are less expensive and do not need the many benefits tradition-ally guaranteed to state-system workers. This factor points to more own-grainhouseholds than labor data indicate. In general, labor force data probablyunderstate the scale of own-grain households, so that 4.5 percent is a safelower-bound on the extent to which the urban survey of "nonagricultural"household sample is apparently deficient.
6.45 A second approach to estimating the size of China's ur&>' awn-grainpopulation is to use results from China's 1990 census, which apparently had anarrower definition of "urban" households than the city and town border crite-rion used by administrative population measures. Preliminary census datareport that China's urban ("city and town," or shi-zhen) population in mid-1990 was 296.5 million persons. The next step would be to compare this figurewith the urban "nonagricultural" population at the same time, but this statis-tic is not yet available. The most re..ant data are for end-1988, when the"city and town" "nonagricultural" population was 204.1 million persons. Usingthe recent historical growth rate of 5.0 percent for this population categorygenerates an estimate for mid-1990 of 219.6 million "city and town nonagricul-tural" persons.7/
6.46 Comparing the census urban population with this mid-1990 "nonagri-cultural" estimate results in a mid-1990 estimate for China's own-grain popu-lation of roughly 77 million persons, or 26 percent of China's total urbanpopulation. This is clfiarly a high outer bound on such estimates, because SSBpopulation specialists told the mission that census urban population figuresstill include "town" populations from many parts of the country where thereare large numbers of new towns which contain mostly farmers. This is espe-cially true in the south, in provinces such as Guang#ong. In addition, thecensus figure for China's urban population captures a large number of workersand families temporarily in urban areas but not settled there who remit partof their income to a rural household where they are at least partially coveredby the rural household survey.
6.47 Whether the own-grain portion of China's urban population is 5 per-cent or 25 percent, it is clear that a problem exists. SSB officials in bothChongqing and leijing confirmed that they recognize that the rural survey doesnot cover the own-grain part of "nonagricultural" households, because they are
7/ These statistics are from SSB, China Population Statistics Yearbook 1989,p. 152. It is interesting to note that the city and town nonagriculturalpopulation grew much faster than total population after 1978, averaging5.0 percent per yeor, while during the period 1965-77 it averaged only1.4 percent growth. For this reason, 5.0 percent growth is used to proj-ect the end-1988 city and town nonagricultural figure to mid-1990. £imi-larly, it is relevant that not all of China"s "nonagricultural" popula-tion lives in cities and towns; roughly 10 percent lives in rural coun-ties outside cities and towns. See ibid, pp. 3-7.

- 83 -
not farmers. At the same time, they were very matter-of-fact about theirunderstanding that since the urban survey only samples those urban householdswhich are officially "nonagricultural," it also misses own-grain householdsbecause they do not have that status. Although SSB officials did not quan-tify the size, they were of the view that these own-grain household numberswere not significant.
6.48 The reason Chinese officials gave for this own-grain gap in surveycoverage was that SSB lacked resources to cover these households. There are&lso apparently technical problems, since some of the own-grain population isthe so-called "floating population" of temporary or migrant workers. Further-more, it was explained that, given tight SSB manpower constraints, other sur-veys had higher priority such as surveys to help compile new types of urbanprice deflator.
6.49 The omission of the own-grain segment of the population from house-hold surveys has important implications for the national accounts. For exam-ple, price indices rely on household surveys for expenditure weights withwhich to average individual price movements. If urban expenditure weights arebased only on state-system "nonagricultural" household spending patterns,price indices will weigh low state prices too heavily and higher market pricestoo lightly, resulting in an understatement of the seriousness of inflation.Continued exclusion of own-grain households imposes a heavy cost as a numberof statistical series will continue to incorporate distortions and biases.Significant improvements in national accounting are unlikely to proceed untilthis segment of the population is included in the coverage of surveys.
I. Survey Content and Usage
6.50 Both the rural and urban household surveys collect a broad andimpressive range of information. While their basic thrusts are similar, thedetailed questionnaires and reports are organized very differently. It shouldalso be noted that, although a large and rich volume of data are gathered, thetabulations, at least those ,ublished, do not maximize data use. The informa-tion gathered is largely aggregated across the questionnaires resulting insimple one-way or at best two-way tables. Given the enhanced computing capac-ity now available to it, SSB shoula attempt to develop cross-tabulations withmultiple variables depicted. Tkis would greatly enrich the data and lead tofurther uso of the informatior in policy formulation and in monitoring socio-economic trends in a rapidly _hanging environment.
6.51 Although SSB uses the information gathered in astimating subaggre-gates of the national accounts, e.g., household consumption, housihold savingsand for computing weights for price indices, the potential exists for greateruse. The calculation of income/expenditure elasticities, estimation of othercoefficients, changes in patterns of income distribution over time, assessingregional differences represent several other potential uses of the data whichdo not appear to have been tapped. We recognize that SSB may lack the meansfor embarking upou these undertakings, and therefore recommend that collabora-tive arrangements be developed with research and policy institutes withinChina. It is further recommended that SSB begin a long-term (possibly ten-year) process of merging and consolidating the two surveys. This could beginby introducing piecemeal a few items at a time which are defined exactly the

- 84 -
same in both surveys and broadening the scope of such items as time goes on.This kind of gradual conciliation between the two surveys anticipates the timewhen coa,rcialization of all sectors of the economy will have effectivelyreduced the purely rural-urban distinctions between households.

- 85 -
VII * OUANTITATIVE ISSUES RELATED TO SSB'a GDP AND GROWTH MEASURES
A. Introduction
7.1 China'. etatistical system, its national accounting estimates, andtheir identified weaknesses is discussed in Chapters II through VI. Thischapter reviews how quantitative adjustments can be made to existing measuresof GDP and output growth. For the moat part, the task can be undertakenthrough separate subsectoral exercises. For example, the undervaluation ofhousing services can be aeparately explored from that for vegetable output.In each subeategory, Ch nese statisticians have already begun supplementinginformation from traditional sources to improve GNP coverage; separate inves-tigations for each category would determine the degree to which these supple-mentary statistics are adequate. Such separate investigations comprise muchof the discussion below. Separate elements, however, also have secondaryinfluences on each other, as when revaluation of housing costs requires reval-uation of government employee costs-of-living and hence revaluation of govern-ment services output. These influences can be important for overall valuationof economic activity and open the door to conceptual and policy issues espe-cially important for China.
7.2 At the outset, it is useful to distinguish be,ween major GDP correc-tions needed in ChinOa's case to arrive at a consistent set of accounts, andcomputations useful for internatl.onal comparisons between countries. For thelatter purpose calculations using purchasing power parities are needed. Chinahas not participated in the International Comparison (ICP) Project to date,but has signaled that it shall in the next phase. The discussion it. thischapter will not address the issue of detailed international comparisons.Rather, it will focus on issues of how the national accounts can be inprovedin the short term. In China's case, major corrections are justified in someinstances, because the values placed on certain useful goods and services areeither zero or so low that no conceptual value system--either Marxist or mar-ket--justifies them. In other words, particular components of China's GDP arenot valued at "market" prices but at artificial "transaction" prices which donot serve as adequate measures of actual economic activity. This is espe-cially clear, for example, where China places no value on services such asenterprise-supplied education, health care, and housing. These servicescleazly have significant value and belong in aggregate GDP. Still, once theneed for such major crude corrections is recognized, it is not easy to sayjust what the new valuation should be. The second set of corrections concernthe application of appropriate statistical methods to reduce biases introducedby measurement techniques and coverage currently practiced. Thus, someadjustments are necessary for underrecording, undervaluing, or nonpricing ofeconomic services, while others are required, for example, in the area ofenterprise supplied welfare services, to ensure that outlays, value added andmacroeconomic aggregates are properly allocated to their appropriate sectors.
7.3 Treating CDP corrections and movements toward an internally consis-tent valuation system has some practical implications. For the domestic econ-omy, it helps guide economic reforms in the process of adjusting actualprices. In China, for example, recently publicized steps in housing reformare meant ultimately to end direct enterprise provision of housing for mploy-

- 86 -
sea by r'ising rents to. "maningful" levels and allowing urban residents toown their own homes paying "meaningful" prices for them. This is one of sev-eral necessary steps to sever the barter dependence between worker and firmwhich has so far prevented urban labor reform and ultimately prevented econ-omy-wide enterprise reform. This process needs guidance, because in themedium term it requires compensation through higher cash incomes, which inturn must come from profits, the state budget, or some gain in labor produc-tivity. Theo* in turn may Imply new pricing and tax systems, new transfers,investments, and layoffs. In this example, by estimating a value for housingservices consistent with other economic dimensions, China can better see thescale of additional practical policy steps needed to complement housingreform.
7.4 Considering GDP corrections as movement toward a different system ofvalues or prices has implications for international comparisons as woll, evenwhen comparisons are made by conversions at an official exchange rate, whichin turn is expected to have some meaningful relationship to prices for a coun-try's internationally traded goods. If corrections to measures of China's GDPsignificantly alter effective relative prices between China's traded and non-traded sectors, as would be the case with a major revaluation of services, thestandard international measure of China's per capita GDP would also beaffected. The critical issue here is not a sector's new output value inabsolute torms, but its value in relation to traded goods. Price reformswhich either raised prices for nontraded goods or lowered prices for tradedgoods would result in a higher international valuation for total GDP. Forexample, industrial pretax profit-rate comparisons indicate that, for thepurpose of enhancing tax revenues, China may significantly overvalue theoutput of some manufacturing subsectors, many of which are important forexports. After price reform, lower prices for these manufacturing subsectorswould be compatible with a revaluation of the exchange rate, which would meanthat in international terms all other sectors of the economy would be worthmore.
7.5 Finally, recognizing measurement corrections for China's GDP asadjustments In a system of relative values wlli permit a look at the Impactthat revaluations in one sector have on the value of output in other sectors.For example, significant nonzero new values for housing services raise fullmeasurement labor costs for all sectors. To the degree that nontrade sectorsin China are more labor-cost-intensive than traded sectors, the internationalequivalent of China's GDP will be larger. In other words, major correctionsto GDP measures for a few large and critical sectors could result in substan-tial further corrections in a wide range of other sectors and hence in totalGDP. The Importance of this phenomenon is amplified by strong evidence thatthe services sector in general has developed particularly fast since Chinaembarked on its reforms in 1978. Even though 8SB has redesigned Its approachto measurement of the service sector, it Is difficult to capture satisfac-torily the many ripid structural changes occurring--both between services andindustry and between urban end rural areas.
7.6 It is important to stress that reworking China's GDP by subsector asdescribed below is not recalculating China's GDP according to some ideal pricesystem. However, some lements of the present valuation system reflect con-ceptual biases and distortions which must be adjusted in estimating GDP. For

- 87 -
example, prior to the introduction of reforms, prices of so-called necessitieswere all set at low or negligible levels to reduce nominal labor costs. Butprices of so-called luxuries were set artificially high, to capture excesspurchasing powjr. In a senose, these prices are misleading measures of China'sactual economic activity levels and give an inaccurate description of economiclife in China. Corrections to thee and other distortion. are the purpose ofGDP component revaluations discussed below.
7.7 The case-by-case treatment of subsectors below is divided into twoseparate parts. Section B presents possibilities for correcting China's GDPmeasure in a single year--such as in 1987, when the new input-output table wascompiled. Section C addresses growth rate measures for GDP in the 1980.,again by suggesting separate subsectors as sources of bias or methodclogicalInconsistency. Before turnling to these issues, it is perhaps useful to pointout that some provincial governments and munic!.palities, such as in Chongqing,prepare additional statistical calculations which, in certain instances, aremore complete than those of the central goverment. Several carry out sepa-rate input-output exercises and price and production studies, for example, inconstruction and agriculture, respectively.
B. Issues Important for Sinkle-Year GDP Measurement Corrections
7.8 Most of the issues listed here as important for correcting the mea-surement of some GDP components relate to a specific economic subsector or setof subsectors. Ideally, each should be examined by specialists familiar withthe subsector and with valuation problems in general. In this way, work onGDP valuation can be broken into separata modules to economize on time andenhance accuracy.
Housint Services
7.9 Improving accuracy in both the scope and valuation of housing ser-vices is possibly the most significant single task facing Chinese statisti-cians. Most of Chinese housing services are either excluded from real estateGDP measurements or are included at very low values. While there are theoret-ical and conceptual explanations for the evolution of extremely low housingservices valuation during the 1949-78 period, the real reasons are probablymore practical and operational. Housing services were either absorbed intoenterprise accounts as nonproductive costa, provided virtually free to otherurban residents as a way to reduce labor costs, or significantly under-setimated as part of the rural household own consumption economy (becauserural housing services constructed with household labor or bartered villagelabor aro often not valued at all).
7.10 Urban and rural housing services represent different measurementchallenges, but in both cases the existence of adequate information on housingarea provides a good statistical basis for the work. In each case, the majordifficulty is not agreeing on whether to raise estimates for housing services,but how much to raise them. As mentioned in the introduction, there ls no*correct" answer to this question, so an adjustment of the correct order ofmagnitude is the goal.

- 88 -
7.11 There are two basic Issues related to setting a value for housingservices: (i) the cost of provision, and (14) a premium for central placescarcity. Cost of provision includes depreciation, maintenance of publicspaces in multi-unit dwellings, administration, interest costs for investedfunds, ome normal rontal Income, and routine upkeep (but not major repair.).Of these, depreciation represents the separate challonge of valuing originalhousing construction, which tends to be at low historical values rather thanreplacement values, and setting realistic lifetimes, which are shorter inrural areas than in cities. In China's case, current GDP measurement prac-tices reflect eitbor actual rents paid, which are often below depreciationvalues or imputed rents estimated to be (very low) depreciation costs.
7.12 Valuation of housing service components should also include an itemfor imputed taxes or rents corresponding to the central place scarcity valueof the housing location. In other words, housing oerviess at the center oflarge cities should have a much higher value per square metor than rural hous-ing. This is Important both as a transitional measuro for Chinese housingvaluation after hos4ing reforms and as an aid to international comparisons. Inthis regard, central place scarcity in China could be etimated by applyingcentral place rental patterns from other poor countries to China's housingservice esti_atme. Valuation of central place scarcity has a role in "early-stage" socialist economies for a number of practical reasons, but there isalso theoretical justification from the source of all socialist value in so-called "use-value."
Commercial Rents
7.13 Commarcial rents are not usually considered for the revaluation ofGDP components because they are in general intermediate inputs and costs andnot part of final demand. Henco, they are not usually thought of as part ofGDP. While this perspective is valid when treating sectors one-by-one inisolation, when China's economy is viewed as a svstem of interrelated values,commercial real estate rents have a differential impact on the value of tradedand nontraded goods. In general, more realistic higher commercial rents wouldraise the costs and prices of urban production and hence of nontraded goods,because of the large service component in center-city GDP. More realisticva'sation of commercial rents would also assist in preparations for commercialreal estate reforms, which are already in their early stages. Given theseconsiderations, the impact of commercial rents on China's GDP needs adjustmentjust as that for housing services does.
Government Services
7.14 Government services in GDP are currently estimated from wage andsalary data, but these do not include realistic cost-of-living items for themany subsidized or gratis benefits enjoyed by public employees. Housing isonly one of these benefits, but possibly the most significant. Price subsi-dies for food and other benefits should also be included more fully in thewages and salaries used to estimte the value of governmwnt services. Withthese adjustments, government serviess will be significantly higher than cur-rently estimated for China's GDP. The Implications for government policy,especially financial policy as housing and other price reforms proceed, are

- 89 -
significant, and given the nontraded naturo of government services, interna-tional comparisons would be affected ao well.
Urban Enterorlc 8ubaidie. and Unusually NSAh Profits
7.!5 Many of China'l urban commercial and Industrial activities are sub-sidized, but the subsidies are treated for GDP purposes as negative value-added. That io, for any given subsector, if revenues fall short of costs, thesector is considered to be making a negative contribution to value-added, andstate budget allocations or loans on generous terms from state banks are usedto make up the difference. This is not only unsatisfactory from a practicalstandpoint--negative output over the longer term--but is not an accurate rep-resentation of supply and demand in the Ch-asse economy. What is really hap-pening is the provision of goods and services to households and other enter-prises at some "full value," with part of the bill paid by the state, eitherout of the budget or with borrowed money. In other words, chronic subsidiesshould in fact be treated as part of enterprise revenues, because the state isin fact paying these enterprises to provide goods and services to third par-ties.
7.16 Conceptually, this amounts to a redefinition of the naturo of gov-ernment subsidy transfers, from producer cost subsidies to user income supple-ments. To the degree that user income supplements refer to private house-holds, they should be treated as enhanced labor income. To the degree thatgoveroment subsidies are reinterpreted as payments for intermediate inputs,they would be seen as supplemental subsidies to the purchas:.ng sector, whichin turn would be reinterpreted as government demand channeled through the nextround of purchasers, until ultimately they appear as higher revenues fromsales to final users. In other words, for intermediate inputs the subsidizedlosses from one sector are merely being transferred to another. But suchadjustments do more than shuffle funding around, because they itply fullerestimates for value-added in many sectors and ultimately for the economy as awhole.
7.17 Corrections in the treatment of urban subsidies of this nature runinto the practical question of how much to adjust the value-added in thesesubsectors. What is normal profit for China's urban enterprises? Calculationof rates of profit (and taxes) relative to physical and working capital needsfor even major s*ctoral aggregates results in wildly disparate profit rates,ome close to zero if not negative (as for coal, for example). As for outputprices, there is no 'correct" level for profits or profit rates.
7.18 The issue of unusually high urban enterprise profits for some Sec-tors is part of the same adjustment process applied to subsidios. Mny sec-tors, especially in light manufacturing, have very high profit rates comparedto fixed and working capital which tend to overvalue the GDP component forthose sectors. Although it is not easy to say how much output should be cor-rected, some rough adjustment is called for. Again, it might be remarked thatsuch corrections would just shuffle funds around end have no significanteffect on GDP measurement. But such adjustments, besides generating more accu-rate sectoral GDP data, are worthwhile to the degree that they provide guid-ance to future price reform and complementary governmAnt policies. Purther-more, since many light manufacturing sectors are active exporters, downward
i'

- 90 -
valuation adjustments have the effect of raising overall GDP in internationalcomparisons, because such downward domestic valuations correspond in somemeasures to a revaluation of the Renminbi.
Enterprise-Supnlied Honhousing Services
7.19 In addition to housing, Chinese enterprises provide an array ofservices to employees and their families, usually for free or for insignifi-cantly nominal fees. Examples are education, health care, nursery care,social welfare administration, and entertainment. Costs of these services arepart of overall enterprise finance, but since they are usually treated neitheras an enterprise output nor as a cost of production, their value is under-reported as part of national service sector output. Statistics on the scaleand quality of these services are either physical--in the form of relevantlabor force or other data--or financial but difficult to disentangle fromother enterprise finances. Cooperation of the Ministry of Finance is neededto find an administrative solution to the problem, using the SSB's experi-mental surveys as a guide.
7.20 The major issue is that this extensive range of urban services isprovidee alzost free of charge. While it may be difficult to agree on anexact revalAation figure, some crude but substantial upward adjustment iscalled for As with revaluation of other services consumed by households,revaluation of enterprise-supplied services increases the valuation of thereal cost of living for urban workers which in turn has a complex influence onvalue-added for enterprises. If profits and taxes are calculated net of thecost of such services, then value-added for the enterprises is incteased byrevaluation, because revaluation represents adding additional worker income topay for services which also represent an additional enterprise output. If theenterprise traditionally pays for such services out of its profits and taxes,then oniterprise value-added would remain unchanged, as value-added representedby profits would be replaced by an equivalent amount in labor income. Indiscussions with officials it was learned that enterp-ise profits and taxesare net of such service costs, which are nevertheless not treated as costs ofproduction. This is a complex problem and one that is especially Important inChina's context, since the services provided constitute an important elementof household welfare. At the time of the mission, it was difficult t confirmhow these activities were treated and whether practices actually diff& d fromone enterprise or industry to another. Within a national accounting frame-work, however, it would be highly desirable to have all these enterprise-sup-plied social welfare services for employees and their families shown separ-ately according to their category, and to have them valued appropriately. Atthe very least, this value should represent their imputed labor cost.
7.21 The mission was encouraged to learn that SSB is taking action alongthese lines. The total number of people working in nonindependent accountingservice facilities established by enterprises and institutions is recordedseparately (by the enterprises and agencies), and value changes in this ser-vice subsector are calculated according to the total wages of the employeesconcerned. For a fully comprehensive SNA treatment, however, the statisticalseparation should treat these "units" as independent accounting entities,paying out costs for such things as administrative overheads, rent, utilities,telecommunications, and other inputs, to allow more accurate production cost

- 91 -
calculations (and hence value added) for both service establiohments and theirnonservice parent enterprises.
Domestic Servants
7.22 National accounting estimates prepared by SSB appear to continuesignificant underreporting of income earned by domestic servants. Domesticservants themselves are often excluded from urban household surveys, becausethey are not considered household members. For purposes of grain rationing,they are counted as miscellaneous persons outside the household to whom thehousehold supplies grain. These grain payments and other payments for domes-tic help, however, are a significant GDP component and add to the real cost-of-living for urban state-system workers and staff. It does not matter thaturban household in-kind payments to domestic servants come from incomesalready reported as urban wageo, because household costs-of-living are notconsidered intermediate inputs for national accounting purposes. While ruralworkers temporarily employed in cities as domestic servants are included tosome degree in surveys of their home villages--especially income remittedhome--those rural surveys significantly underreport income and consumption bythe domestic servants themselves while they live in cities. Consequently,aome rough estimate of the degree to which value added by domestic servants isunderreported should be part of the adjustment of urban GDP.
Nondomestic Casual and Itinerant Services
7.23 Statistics on private workers need to cover all people in society,including not only domestic servants (see above) but also the migrant popula-tion. With the spread of reformo in China, especially since 1984, rural-urbanmigration has been significant, and a sizable number of new households havesettled in cities. But only a few migrant households have been allowed toregister as official "nonagricultural population" urban workers (those whoreceive subsidies and are covered in traditional urban household surveys).Others--for example most construction workers--maintain their rural or "agri-cultural population" registration status, while still other urban migrantshave been given a special status which excludes them from the subsidized bene-fits of traditional state-system urban residents (see the section on "Own-Griln Households" in Chapter VI). It is likely that most of these persons areemployed in units which report value-added through normal channels, and henceno adjustment is needed purely on account of their migrant or "own-grain"registration status. Largo numbers of others, however, are self-employed asstall peddlers, repair shop attendants, carters, and a variety of other Casualor itinerant service workers.
7.24 The GDP contribution of these services is currently estimated frombusiness registration rolls and average income from surveys, but there isinsufficient corroboration of the registration numbers, because the SSB con-firmed that it does not do sample surveys covering many of the households fromwhich these workers come. While some underreporting of income for such casuallabor is normal for all countries, in China's case the scale of omissior fromGDP accounts is larger than usual because of rapid urban inmigration since1984 and the lag in development of the statistical infrastructure needed tomesure its significance. Coverage of these so-called "floating population"temporary urban workers by rural surveys in their home villages is incomplete,

- $ft2 -
especially for income not remitted back to the home village. GDP adjustmentscan be estimated from labor force and urban population data, but withoutbetter urban household survey data, there may be no fully satisfactory basisfor adjustment.
Other Urban Services
7.25 Certain urban service¢ in add4tion to housing are provided outsidethe enterprises, but their representation in GDP measures is either incompleteor significantly undervalued. Any listing of these services at this point islikely to be incomplete, but they include financial, accounting, real estate,and legal services, as well as independent laundries, independent bath houses,independent child care centers. Most if not all of these GDP components aresignificantly underreported because they are outside the scope of traditionalservice-seotor data collection.
7.26 For other urban service subsectors, such as financial institutions,SSB is in the process of shifting from reliance on traditional arrangements tomore use of SNA concepts and sample surveys. For example, China's traditionalnational accounting methodologies did not use interest earnings to measurerevenues, but SSB did take account of ilterest earnings when compiling the1987 input-output table. Traditionally, value-added in banking services wascalculated from labor-force data as if banks were governmont agencies. It isnot clear to what degree the new input-output methodology has influencedrecent GDP calculations. Furthermore, since 1987, a large number of nonbankand nonstate financial institutions have appeared operating in a more busi-nes-like manner for fees and in some cases by making profits on the marginbetween funds borrowed and lent It is not clear what account is taken ofthese "second-tier" financial services in total value-added.
7.27 The collection of services in this "other" urban category is hetero-geneous, and corrections will have to rely on a variety of information. Never-theless, the GDP contribution could be significant, and adjustments should bemade accordingly.
7.28 Outside housing services, probably the largest category in need ofmajor upward adjustment is rural services not related to agricultural produc-tion. Rural surveys, designed in earlier decades to serve the economic link-age between city and farm, still provide only partial coverage of serviceswhich the rural labor force provides to rural households. SSB officialsacknowledge that there is serious undervaluation of such important sectors asrural transportation, personal services such as haircuto, repairs of consumerdurables such as bicycles, and independent rural financial companies or"clubs." Although new rural surveys collect some income information in thesecategories, without more complete coverage, estimation of the GDP contribu-tion of these subsectors is difficult, but some estimates based on existingrural household survey data should be mas.
Townshin and Villlagg nter2rlise Nonservice Output
7.29 Since 1984, private and cooperative enterprises have multipliedrapidly in rural townships and villages, supervised by a specialized office inthe Ministry of Agriculture. While they are registered by local governments

- 93 -
and in many ways encouraged to expand and hire local labor, the adequacy ofstatistical coverage is dlfficult to gauge. Their vory large number and thevolatility of their activity, however, influence the accuracy of statistics ofvalue-added. Some upward adjustment is probably warranted. At the same, thevaluation of output at current prices, when aggregated with constant pricedcomponents, inflates value-added in comparable prices, and an adjustment isneeded (see Chapters II and IV).
Physical Grain Outout
7.30 Grain output is the single largest component in China's crop outputand perhaps in all rural output, but the accuracy of cultivated area andplanted area data needs to be vorified. Only access to and use of currentlyongoing nationwide land utilization surveys can determine the degree of under-reporting from this source. Given the history of China's measurement of cul-tivated area, it is possibe that the undercount is not insignificant. Somecorrection should be considered (soe CW)pter II).
Grain OutDut Valualion
7.31 A potentially more important adjustment than even area planted tograin is the valuation of grain output, but it is difficult to know how muchof an adjustment is appropriate. China's grain output and pricing are subjectto substantial direct control by central and local government authorities.More grain is planted than farmers would be willing to plant if not forced todo so, and the price paid for much marketed grain output--probably all of it,since essentially all prices are disciplined--is generally low compared towhat it would be without administrative controls.
7.32 The real economic background to this situation is China's nationalpolicy of limiting grain imports when it at the ame time faces a criticalshortage of arable land by world standards. Under these conditions, wherearable land is extremely scarce, its output sbould be relatively valuable. Iffarmers were allowed to plant whatever they wanted, many would satisfy theirown grain needs on a small part of their land and then plant much higher valuecrops, such as vegetables and fruits. They are prevented from doing this, butthe fact remains that the appropriation of a significant portion of the graincrop at low prices undervalues the crop. If higher grain imports were per-mitted, much of China's faralandw sould be planted not to grain, but to vegeta-bles, which has a per hectare value-yield of from four to five times that ofgrain.
7.33 Although this is perhaps one of the most important cases in China ofofficial nonmarket pricing which distorts the measure of GDP, valuationadjustment is not as compelling as for housing services, because housing ser-vices are often reported at zero or near-zero levels while grain outputappears to have a significant unit value. Nevertheless, given the Importanceof grain, corrections for the systematic and significant bias in grain pricingshould be a priority in the adjustment of GDP. Not only would this exercisebe useful for purposes of international comparisons, it would give the SSB andChinese policymakers an indication of the impact of price reform. Even ifthis type of adjustment is not made for state procured grain, an adjustment is

_ 94 -
necessary to value own account consumption of grain by farm households at anaverage of all grain prices rather than at state prices.
Nongrain CroRlOutgua
7.34 The independence and diversity of rural nongrain crop output *inceland tenure reform in the early 1980. (the so-called Household ResponsibilitySystem) accelerated through the decade, especially with the increasing use ofplastic greenhousing and the more careful private use of miscellaneous parcelsof land. In addition, commercial reforms enabled farmers to sell producedirectly to town and city residents at prices substantially higher than tradi-tional state list prices. As a result of all these technical and market fac-tors, vegetable and other nongrain crop production has risen rapidly, whilethe statistical system designed to measure it has only slowly expanded itssophistication. Medium and large cities submit half-year crop reports, and inrural areas, output data are obtained by calculating the average unit yieldand multiplying it by area planted. Sources are also verified with surveyinformation on annual rural household consumption of vegetables and othernongrain crops. The SSB considers these output data to be quite accurate, andofficial data show a rapid increase in the output of such crops, but thedescription of data collection methods by rural statistical officers raisesthe possibility of significant underreporting of planted area, especially forvegetables and other crops with short growing cycles and a high degree ofmultiple cropping. Given the very high value-yield per hectare for somecrops--especially vegetables--even a modest adjustment in estimates of areaplanted, improved yields and varieties, and improved quality and seasonalitywould result in significant upward adjustments to GDP. Some adjustments ofthis nature should be made.
Animal Husbandry Outi,ut
7.35 Some animal husbandry output is difficult to capture satisfactorilyin existing surveys because of insufficient rigor in rural data collectionbased on personal interviews at a time of rapid growth in small animal popula-tions. For large animals, the practice continues of counting growth in ani-mals on the hoof as output, rather than counting output only as offtake ofmeat, wool, milk, hides and other actual products. The traditional methodencourages the maintenance of uneconomical herds in many of China's pastureregions, where output may in fact be much lower than animal-number carryoverwould indicate. For this reason, a downward adjustment of gross output datafor animal husbandry is called for, but the scale is likely to be slight,depending on how widespread the practice is for pigs.
7.36 For actual offtake, measures of pork output in particular probablyneed to be adjusted upward significantly because of shortcomings in measuringquality of pork when slaughtered, anc because even disregarding quality, mea-surement of meat tonnage is usually calculated according to rules of thumb formeat per category of animal at a time when much if not most pork is now soldon periodic markets where product quality, especially leanness, commands apremium. China's current practice values hogs at different prices accordingto different classes of pork, so there is a degree of sensitivity to meatquality, but a systematic investigation of the adequacy of this coverage wouldprobably result in a significant increase in reported output.

- 95 -
7.37 The weaknesses in the measurement of depreciation and the tendencyto underestimate it have been noted earlier. Whether this affects SSB's esti-mate of GDP remains to be addressed. Since the MPS measure of depreciation isadded to NMP to derive GDP, and since the some measure has been previouslysubtracted from gross output to derive WP, the two adjustments cancel eachother and the measurement of GDP would not have been affected by this bias.However, estimates of NMP would be or-eratated.
Value Readjustment Multinlier Effect
7 38 As mentioned in the introduction, valuation 'orrections to individ-ual subsectore are important in their own right but also have indirect influ-ence on the value of other sectors. These secondary influences are importantfor a number of domestic policy purposes anticipating price reform, but theyare also significant for international comparisons to the degree that theultimate revaluations change the value relationship between traded and non-traded goods.
7.39 Quantitative measures of the importance of these secondary effectsrequire input-output calculations in which labor and housebold consumptionvectors in the input-output table are considered part of the intermediate-input quadrant. In other words, the solution to the problem includes treatingthe economy as a value &ystem, which would also require considering a varietyof hypothetical transfer payments, rents, profit distributions, and taxeswhich are currently hidden by the unadjusted valuation system. There is thusa need for imputations for several of these flows. While such an exercisemight seem involved, it could be carried out with a more aggregate version ofChina's 1987 input-output table, leaving more detailed calculations forChinese agencies helping prepare for price reform later in the decade.
C. Adiustments to Historical Growth Trends
7.40 As officially reported, China's GDP and RMP growth rates since 1978have been high. Fir the 1986-90 Five-Year Plan period, China's official GDPgrowth measure averaged 7.8 percent per year, while over the 1978-85 periodit had averaged 9.4 percent. Sustained real growth rates in this range arevery high by world standards, but not unprecedented. There is no doubt thatsince 1978 economic progress and output growth have been extremely rapid. Atthe sams time, however, there are several statistical indications tbat offi-cial growth rates in some sectors and in some localities were hi%er than theyshould have been, either because of limited experience and outdated practicesat grassroots reporting levels, or because of incompatibilities between thetraditional statistical system and the more sophisticated demands of China'scomplex economy under economic reforms.
7.41 Chinese statistical officials are woll aware of grceth rate overes-timation issues in a number of dimensions, but retroactive corr,ction posesseveral challenges. First is the issue of how much to adjust growth rates invarious subsectors. While there may be general agreement on which sectorshave the most serious overestimation, introducing corrections requires quan-titative parameters in an analytical framework. Second is the practical ques-

- 96 -
tion of how to introduce corrected growth rates in China's statistical report-Ing. Should all numbers be revised in some dramatic announcement which uightundermine the credibility of China's atseistical system? Or should revisionsbe introduced piecemeal as the year. go by? Or is there a third solution? Theissues merit close attention and choices will need to be exercised after tak-ing account of resoureo and data implications.
7.42 The first challenge--how much to adjuot--is briefly addressed in theparagraphs below, which discusses a few subsectors where growth-rate adjust-ments seem particularly important. The second challenge--how to report theadjustments--finds a propitious opportunity for quick announcement in the veryrecent Chinese decision to introduce a new "constant price" growth standardwithin the existing system of accounts. For most of the reform period, Chinahas based its real growth rates on a set of 1980 benchmark accounting pricescalled "1980 constant prices." Beginning with 1991, howevor, China is intro-ducing "1990 constant prices," and henceforth all growth rates will bereported by the new standard. Revisions in past growth rates can convenientlybe combined with introduction of tho new standards.
7.43 In the past, when China has changed its "constant-price" benchmark--this occurred in 1957, 1970, and 1980--it has not used the new sot of pricesto go back and recalculate growth rates for previous periods. Instead, it hasmerely "linked" constant-priced output in the previous period to the newhigher-priced standard by calculating the new-to-old value ratio at the switchyear, whether 1970, 1980, or in this case 1990. The long-term growth rateswhich result are callod "comparable growth rates," and for major aggregateshave the seme historical growth rates in various subperiods as those for datausing the subpariod's "constant" prices (see Chapter IV). For example, "com-parable-price" growth rates in the 1970s are the same as the growth ratesbased on "1970 constant prices." This practice, while computationally conve-nient, has numerous drawbacks which have been addressed in scholarly and othercommentary on China's statistics. It has the added drawback of perpetuatingoverstated growth measurements of the kind that appeared in the 1980..
7.44 The use of 1990 constant prices starting in 1991 provides an oppor-tunity to replace "linked" or "comparable" growth rates for the 1980s withgrowth rates from recalculated data. The recalculated data would be based orthe application of 1990 constant prices to highly disaggregated GDP componentsfor the 1980s. In the process, SSB could also correct for a variety of realgrowth rate measurement distortions of the type discussed below. Revisedgrowth rates for the past ten years, based on application of 1990 prices tohighly disaggregated data, could help add to world respect for China's remark-able growth achievements under economic reforms.
7.45 As with adjustments to GDP for a single year, a variety of quitedifferent circumf aces lead to the need for adjustments to growth rates, andiuch circumstance can be examined separately by k specialized study group.Four examples of separate circumstances suggestik.g needed adjustment aredescribed briefly below.
- 97 -
Numerator-Denominator Gross Outnut Deflaitor HisgMth
7.46 One of the most serious sources of growth-rate overotatemont is theuse of proxy deflators whiuh are understated in their own right, and henceinsuff4 eiantly deflate the current-priced series to which they are applied.The clearest example occurs when a deflator calculated from current-priced andconotant-priced gross output is applied to net output.
7.47 ThQ gross output deflator itself may significantly understate infla-tion because apparently in some enterprises it is calculated as a ratio inwhich the numerator and denominator represent different statistics. Thenumerator in the ratio is usually current-priced gross output, whicl is mea-sured by all marketable output for the period In question, say, a year. Thedenomlnator, however, is apparently constant-priced output produced within theenterprise, but not necessarily considered marketable, and includes outputkept on the enterprise premias for a variety of uses. Hence, under thesecircumstances, the deflator is calculated as the ratio of a current-pricedflow of limited scope divided by a constant-priced flow of larger scope,resulting in a deflator which is lower than warranted by the actual pricedifferences. As explained earlier, using an unduly low gross-output deflatorto correct for net output inflation, results in overstated estimates for re1lnet output growth.
7.48 Questioning the quality of gross output deflators themselves leadsto questioning the suitability of applying such deflators--even if corrected--to net output measures. As explained earlier, a widely used procedure is"double-deflation" by which total output for a sector is deflated by an outputdeflator and intermediate input items are deflated by cost deflators. Wherethe necessary data are available, double deflation should be the appropriatemethod for use in CLina. In the dase of alternative methods, such as singledeflatLon, the output deflator is applied directly to current-priced value-added, and this method may actually be preferred if input cost deflators areof poor quality. For national accounting purposes, however, single deflatiouis in principle a second-best solution. An economy's actual output is thecombination of net producte available for final use, and to the degree that asector's share In total GDP as measured by final use is different from itsshare in total GDP as measured by value-added (income-approach) methods, sin-gle-deflation techniques w. l result in unpredictable inaccuracies. It isworth repeating, howeverg that the double deflator mothoi may not be the bestmethod in all circumstances, since its usefulness depends heavily on the qual-ity of price indices for intermediate goods. While double deflation is to bepreforred, it is recommended that a small group of specialists should investi-gate the respective biases, which in any case are likely to be small comparedto those introduced by faulty deflators.
Substitutins Gross Output Growth Rates for Net OutDUt Growth _aR!_t
7.49 SSS officials indicated that in a few cases in yearn of slow growthin the state soctor, gross output growth rates, as measured directly vithChina's "constant-price" valuation system, were used instead of growth ratesfrom deflated value-added data. This vas apparently done in 1989-90 becauseinflation In the price of inputs Was so much higher than price increaes iaoutput that the 8SB considered current-priced output estimates to be too low.

- 98 -
In this way one Inappropriate growth measure wag introduced to correct forwhat soemed to be even moro serious failing. of another growth measure.
7.50 The overall difficulty of this issuo relates directly to the concep-tual danger of taking value added for a single sector (as measured by theincome or production methods) and treating it as that sector's contribution tototal GDP, suitablo for deflation to some base-year price. In other woords, ininput-outpat or Social Accounting Matrix terms, value added for an individualsector is taken from columz. calculations in the matrix, while a sector's truecontribution to output can only be seen by examining its output based on itsrow in the matrix. The distinction is Irrelevant for aggregation in currentyear prices, but can become important if the value-added, column data aredeflated by separate deflators.
7.51 The growth rate distortion discussed here, aubstituting gross outputgrowth rates for deflated net output growth rates, raises a serious issue. Itis likely that the assumed insufficiency of the net output growth rate resultsfrom an increase in subsidie, which are treated--perhaps mistakenly--asnegative value-added (see above). But it is also possible that in periods ofvery slow growth, real value-added growth can be negative in a sector waichstill shows positive growth in gross output. In any event, gross outputgrowth rates are usually high because of changes in "double counting" whichare an integral part of using the statistic for any national accounting pur-poses. The issue deserves careful attention and is almost certainly a sourceof overstated growth.
New Product Pricinu in a "Conste:it-Price" .,enortina Slstem
7.52 One of tho most obvious sources of overstated growth rates in recentyears has been the use of current prices to report the "constant-price" valueof new products or imrroved products. The problem was first noticed in themid-1980e becausp output measures for some industrial categories were the samein both current- and constant-priced data, when in fact inflation had beenrelatively high throughout the economy. This was most obvious for output ofthe new and rapidly growing TVH sector, which begari to proliferate after thenationwide introduction of industrial management rafcrms in 1984. Somethingwas clearly wrong, and SSB and other officials concur that the problem hadbeen serious. Such enterprises and the local statistical offices reporting onthem either had insufficient resoarcus to recalculate output in 198C prices orcould not find satisfactory equivalent products in the 1980-price lists. Thisparticular problem for Tm8s became serious again during the 1988 economicboom. Current priceo of new innovations are often used as proxies for con-stant prices, in the *tate as well as in COE/TVE sectors For those TVEs thatdo not keep a record of constant *alue GVIO but instead report current priceGVI0, the fact that these wvuld be the some in not surprising. But it is notnecessarily evidence of substituting current priceo for constant price pursu-ant to new product innovation.
7.53 The problem of usinp, current prices in place of 1980 constant onesapparently also appeared in larger state-owned enterprises, because earnestmanagers seekLng to moet constant-price-denominated output targets sought,often successfully, to get permission to report imprzved products at a higher"constant price." When there was no equivalent for the improved product in

- 99 -
the original 1980 constant-price standards, current prices were often substi-tuted to estimate constant-prica output values. It is not clear how seriousthis problem is on a nationwide basis, a"d some Chinese officials cite surveydata reports that yearly output value of new products in the mid-1980saccounted for only 2-3 percent of total industrial output. As reforms and newproducts spread in the latter part of the decade, however, the problem almostcertainly became more serious.
7.54 Corrections to this problem are amenable to a systematic approach byindustrial ownership and output categories. TVEs are a rapidly growing partof the economy and reprosent a significant portion of total GVIO in China 1/While it is not clear how much of an influence these corrections will have onaggregate growth, the need for the corrections should be obvious.
"First-Year" or Peak-Season Pricing in Airiculture
7.55 Discussions with both SSB and local county statistical officialsrevealed that "current-priced" data for agricultural products were based onshort-cut calculations which still based value output on annual estimates forphysical product, multiplying physical data by a "current" price selected at asingle time in the year. While some methodological guidelines stressed theneed to use peak-season pricing for grain, for vegetables and other crops as aproxy for the current price, the more convenient route of using the "firstprice" for the product in that year, often the price in January or February,is in practice used.
7.56 These practices may an be important source of overestimated growthIn agriculture. While the "first-price" or peak-season price is used to cal-culate a locality's crop price deflator, value output for many crops, such asfor vegetables, is based on year-round reporting. Year-round prices are notonly affected by inflation as the year proceeds further from January and Feb-ruary, but they are also higher in the off season, when farmers operating fortheir own profit have been finding ways to use vinyl greenhousing and othermethods to stretch the growing season into profitable market periods. It istrue that most of China's crop output is reported in physical terms, valued in1980 constant prices and recorded directly as an inflation-free statistic. Butto the degree that farmers sell heterogeneous products which vary in qualityand hence in price, and to the degree they report output in current-pricedvalue terms, a deflator based on peak-season or "first-price" measures wouldresult in insufficient correction for inflation and an overstatement of realgrowth. Again, this particular problem requires addressing.
D. A Pronosal for Ouantitative Estimates for Apparent Biases
7.57 For both kinds of biases introduced above, GDP undervaluation andgrowth rate overstatement, the issues are serious enough to justify continued
1/ The 1990 Statistical Yearbook suggests that 35.7 percent of China's GVIOwas produced by collective-owned units in 1989. but Chinese officialsmaintain that township-run enterprises account for just over 10 of allIndustrial output. In any event, the extent of the problem is signifi-cant end warrants quantitative investigation.

_ 100 -
study. The acknowledged presence of these many unresolved questions affectsthe overall credibility of China's national accounts end th.ir relevance forguiding Chinese economic policy. With this in mind, this report recommendsthat as China end the World Bank continue their invoetigations such as at theseminar proposed in Chapter IX, they oleo xplore ways to resolve thes. andother issues of appropriate valuation, coverage and methodology. It is fur-ther recommended that participants on the China side include representativesof major users of Chinese statistics outside the State Statistical Bureatt,such as the State Planning Comission and the Development Research Centerunder the State Council.

- 101 -
VIII ASSESSMENT OF CHIA'S FULL HYBRID SYSTEM OF ACCOUNTS
A. Introduetion
8.1 When fully implemented, China's Hybrid System (the Full Hybrid Sys-tem) for collecting and reporting national accounting statistics will provideChina with a practical transitional national accounting arrangement. ChaptersII through VII have concentratod their deceription and analysis on currentearly implementation of the Hybrid System (the Early Hybrid). This chapterpresents a more focused sessment of the Full lybrid System of nationalaccounts. The Full Hybrid System will reprosent a major step in the gradualshift from China's earlier Material Product System (HPS) to a more modern andpolicy-relevant System of National Accounts (SNA) based on world standardsendorsed by the Unitod Nations. Indeed, China's future national rccountingsystem--the ultimate goal of statistical system reform--might best be calledan "SNA with Chinese characteristics." Such an "SNA with Chinese characteris-tics" would be significeantly different from the Hybrid System reviewed in thisreport, largely because SNA methods and standards for data collection are muchmore accurate, cost-effective, and policy relevant. Even though the UN SNAstandard itself continues to evolve, the same goals motivate both the ongoingUN revision of the SNA and China's implementation of the Full Hybrid System.Both seek better coverage, greater accuracy, lower cost, increased policyrelevance, and continuity vith the past. China's need for change, however, ismore immediate and more dramatic than for most countries, because reforms inthe management of its entire economy continue to introduce market forces at arelatively rapid pace. These market forces, in turn, generate a wide range ofeconomic activities for which both the earlier NPS and the Full Hybrid Systemprovide insufficient coverage. For this reason, it is important to emphasizethat while the Hybrid System is a useful compromise arran8ement, it is stillonly an early stage in the overall transition to a more stable nationalaccounting framework adequate for analyzing the wide range of market-orientedeconomic activities now appearing in China.
B. Creation of China's Hvbrid SYstem
8.2 In assessing China's Full Hybrid System, it is useful to review itsorigins. Economic reforms since 1978 and official recognition of traditionalMHS shortcomings led to a relatively early government consensus on the need todevelop a new system of national economic accounts that would serve the needsof a "socialist planned commodity economy."j/ While noting that the Westernmarket-oriented accounting framework, as represented by the full SNA, is morecomprehensive than the MPS, Chinese authorities contended that the full SITAwould not wholly suit Chinose eircumstances and needs, especially now, as theeconomy is itself in transition and retains many of its central planninginstitutions.
I/ This is the phrase China uses to describe the goal of its economicreforms, since in China the word "comodity" embraces most of the charac-teristics associated with market forces. Such a "planned commodity"economy, it has been stressed by SSB officials, would retain some amountof central planning to guide its market-oriented dimensions.

- 102 -
8.3 Work on developing the Hybrid System began in January 1984 when theState Council promulgated the "Decision on Strengthening Statistical Work" andditrcted explicitlys "In order to .nhance China's economic management level, aunified, scientific national accounting system shall be established, theaccounting system of statisties, accounting and operation are defined in aunified way, and a leading group shall be set up to fonmulate unified nationaleconomic accounting standards." In November 1984, a Leading Group was estab-lished and SSB created a Systems and Methods Department to work on the designof the system. Developmental work continued and formal responsibility forputting together the system was transferred to SSB in late 1988. A four-yearprogram for finalization and implementation of the new system was also put inplace.
C Design of the Full Hybrid System
8.4 The design of China's Full Hybrid System reflects the official viewin the early 1980s that China's MPS system no longer served the country'sneeds, as it shifted from a centrally planned economy to "a planned comodityeconomy." The official view recognized that exclusion of nonmaterial produc-tion In the MPS was a fundamental shortcoming, particularly in view of thegrowth of the services sector after 1978. Reformers also realized that theUPS system concentrated on measurement of output in constant or comparableprices and did not sufficiently recognize the role of prices, inflation, orthe role of finance and credit. The Hybrid System's designers further recog-nized that modern macroeconomic management, the achievement of overall equi-librium, and the analytical needs of linking savings, invsotment and consump-tion could not be based on UPS aggregates. Reformers further noted that, asChina became increasingly interlinked with the global economy, internationalcomparisons would be increasingly useful for domestic policy formation. TheMPS did not lend itself to such purposes. The weak financial and accountingsystems in place at the grassroots level, and their separation from therecording of production, reduced the value of the UPS framework as a tool foreconomic management.
8.5 In the early 1980s, initial Chinese discussions concerning thedevelopment of a new system of national accounting revealed three distinctbodies of thought. One group proposed that even after economic reforms werecompleted, China could continue to use the MPS, with makeshift adjustmentsallowing a few limited SRA measures for international comparisons. A secondschool argued for a gradual long-term transformation of the MPS Into an SNA-based framework. A third group wanted China's eventual post-reform nationalaccounting framework to be a compromise system with elements of both the UPSand SA framework.s ChinOa's nw Hybrid System is a combination of the secondand third approaches, because it has the flexibility of either remainingChlna'i long-term system (the second option), or of performing a transitionalrole to an SNA with Chinese characteristics (a special version of the thirdoption).
8.6 In May 1986, the Leading Group established by the State Councilrecommended the Hybrid System approach. This recommendation was endorsed bythe State Council, which noteds "We should pay attention to statistical work

- 103 _
on CDP and on the productlon of the tertiary industry ai while continuouslyworking on the sotiatitcs on social general production and national income.Consent is given to the view of the State Statistical Bureau that in the longrun, we *hall gradually ostablish a sot of accountinog systems suited toChina's socialist plamed commodity economy in the light of our country'ospecific conditions while drawing on the strength of accounting systems ofeastern and Wostern Countries." The arguments advanced by S88, and the ratio-nale for adopting this posture aro caot in the following terms: during aperiod of transition the economy will change, but even in the post-reformevolved state, central planning will coexist with a large market-orienteddimensions the MPS provides the means for maintaining the balance of materialfinancial and human resources; the SNA has the advantage of capturing activi-ties not coverod by the MPS and furthermore provides a wide set of usefulindicators for purposes of economic managements hence under these circum-stance., the new Hybrid System would bost serve China's needs.
D. Structure of the Full Hybrid National Accountina System
8.7 The Full Hybrid System recognizes that economic transactions can becategorized accordfng to the process of production, distribution, circulationand utilization. The overall framework consists of six parts:
ftrt I Depicto elements which provide the basis for socialreproduction, covering population, labor, capital assets,and the stock of natural resources.
Part II Endeavors to capture production within the national econ-omy and provides aggregates of national income and itsdistribution, including consumption and investment. Bothnet material product and grose domestic product are mea-sured. Four basic tabulations are generated portrayingoutput and its use, "major resources of physical productsand their use," composite price indices, and an input-output statement.
Zb& IJI Deals with uses of national income and is shown in fourtabless (a) capital flow statements for physical trans-actions; (b) financial transactions; (c) financial bal-ance sheets; and (d) commodity balances.
gait Deals with investment and consumption by source and func-tion.
Par-t v Focuses on external transactions, both of a current andcapital nature.
Part VI Is a composite matrix encompassing all of the elementsdealt with in the previous parts and is in the nature ofan input-output table with features of a social account-
11 Services Ln the context of the SNA.

- 104 -
ing matrix. Both IPS and SNA subaggregates can bederived from the framework.
S. Features of the Hvbrld Svatem
8.8 It should be noted that although the Full Hybrid System accountingframework will provide useful estimates of national income and product in boththe MPS and SNA modes, it will still be basically a modified MPS framework.It does permit the calculation of some SNA-related aggregates and subaggre-gates, and there are many other useful changes, but most of the Full HybridSystem categories, concepts, and data collection conventions will continue toreflect strong MPS influence, and in essence the UPS framework will be largelymaintained. For instance, the sectors continue to be classified in MPS terms;computational procedures are barely altered; calculations continue to relyheavily on MPS practices (as for depreciation); present data sources based onNPS concepts would continue to be tapped. On the other hand, the modifica-tions being introduced do recognize and address the issue of coverage of ser-vices currently not covered in order to meet SEA requirements. There is somegreater recognition of the role of financial institutions and flow of funds,and certain disaggregations not shown in the MPS (such as household consump-tion) are introduced in the Hybrid System.
8.9 There are of course Important similarities between the MPS founda-tion to the Hybrid System and the full SNA, which can be quickly recounted.In both accounting systems, income is calculated and shown by sector or ori-gin, by type, and by disposition. Both systems distinguish between interme-diate and final goods, with only the latter entering into the final calcula-tions of national income (either NOP or CDP). Both focus on current incomes,and transfers are omitted.
8.10 In spite of these similarities, and even though the Hybrid Systemhas corrected for some of the most obvious differences between the UPS and SNAstandards, the MPS and the SNA differ in many more ways than just their formaltreatment of "nonmaterial" services and depreciation (see Chapter II for afuller discussion of these topics). The additional differences are both con-ceptual and operatlonal, and many of them remain in the new Hybrid System.For example, the Full Hybrid System is inconsistent in its treatment of aggre-gates such as passenger transport and communications because, in brief, theMPS criteria for distinguishing "nonproductive" activities are ambiguous.This ambiguity influences the Hybrid System. Similarly, grass-roots datacollection will still reflect traditional YPS overemphasis of physical outputmeasures and MPS underemphasis of financial and monetary linkages. SNA con-cepta, on the other hand, attempt neutral measures of all transactions in theeconomy, using the same collection methods regardless of an activity's "mate-rial" status. As a result, the SNA achieves a fuller and more useful inte-gration of national accounts without jeopardizing its ability to generateseparate estimates of "material" and "normaterial" output.
8.11 Another UPS feature carried on to the Full Hybrid System is themeasurement of long-term trends In national income. The Hybrid System uses"comparable" prices, which in turn are based on officially published "con-stant" prices (see Chapters II and IV for a discussion of comparable and con-stant prices). The SA, however, measures real long-term trends by beginning

- 105 -
with data on sctual current-priced transactions and then correcting for infla-tion using price deflator. The use of a base year is common to bothapproaches, but the methodologies--both conceptual and operational--differsignificantly.
8.12 The Hybrid System's continued use of the MPS approach to measuringlong-term trends, even if acceptable in theory, gives rise to a number ofpractical problms in applications. Assigning "constant prices" to goodsnewly produced after the base year raises a particular difficulty, because inmany cases an attempt is made to in-ent an appropriate base-year price for theproduct in question. While this can be done by reference to trends from thebase year in prices of similar products already in production, in reality thisis complex and not done. In China's case, the introduction of a whole rangeof new products, especially by Town and Village Enterprises in recent years,has meant that these products have been given "constant" prices based for themost part on prices prevailing around the time of their introduction. It islikely that this distortion will continue in the future, because the FullHybrid System framework does not explicitly intend to modify the practice ofusing official constant prices. Distortions will therefore continue to affectroported trends in overall Hybrid System aggregates, such as HP and GDP,which will in part reflect current-year inflated prices. Measurements ofgrowth will thus be distorted. It should be further noted that measurement inofficial "constant" prices is appropriate in the calculation of gross value ofoutputs but is not entirely satisfactory in the calculation of value added, asit is often difficult to calculate intermediate consumption in official con-taunt prices.
8.13 It should also be noted that the issue of new products is not uniqueto the Hybrid System and its MPS foundation. The SNA has developed correc-tions to deal with the same problem. Price indices used for deflating cur-rent-price series in SNA accounts also acquire biases, unless there are regu-lar revisions in data collection to reflect new products and unless there arenew weights for new products. Countries using the SRA therefore usuallyupdate price indices at five- to seven-year intervals, particularly if rapidchanges are taking place in the product mix. In the interim, SRA measurementsoften introduce prices for new products by replacing prices for discontinuedproducts.
8.14 Most analysts around the world acknowledge the weaknesses of the NPSframework. China's Full Hybrid System inherits a number of these. Most econ-omies--including many centrally planned economies--are either adopting the SNAor are In a transitional process designed to develop such a system eventually.Virtually all those BPS economies which aro introducing market reforms havealso decided to introduco the SNA accounting framework, and they are goaringbasic data collection to moet the BRA requirements for GDP calculations. IfChina decided to stop its statistical reforms with the lull Hybrid System anduse the Full Hybrid System as its ultimate national accounting framework,China--alone among these nations--would be retaining an MPS-oriented systemwith almost all of the MPS procedures and concepts at its core. In terms ofthe effectiveness of China"s national accounts, if China clings to the FullHybrid System as its permanent long term system, BPS concepts and classifica-tions will continue to Influence data collection and thus leave unaddressedthe most important concerns identified In this report. Without further tran-

- 106 -
sitional phases in the direction of an "SNA with Chinese characteristics,"China will not have the flexible, well-articulated, consistent accountingframework it needs to serve its emerging "planned commodity economy."
8.15 Furthermore, an SNA with Chinese characteristics would still be ableto serve the n.eds of planning and state management. Almost all developingcountries have used the SNA framework, even though many of them have strong,centrally planned sectors. India is a case in point, as are several Africaneconomies. Hungary and Yugoslavia have used dual systems of national account-ing, because they introduced the SNA early in their reforms, and the avall-ability of national accounts in the SEA format greatly facilitated market-oriented reforms and macroeconomic policj formation. At the same time, theyretained accounts in the MPS format. All other Est European economies--whoare in various phases of reform transition--have chosen the SNA, and theirchoice underscores two points. First, the SNA is compatible with centralplanning and a mixed economic system. Indeod, boing a more comprehensivesystem, the SEA provides the basis for greater flexibility in the managementof such an economy. Second, the SEA better mirrors transactions and flows inany economy, irrespective of its orientation. The SNA's more transparentmeasurements have advantages that are absent in the Hybrid System, bocause ofits core MPS orientation. In all of the countries cited, SNA-orientednational accounts have eased the policy process by providing a wide range ofinformation on price, investment and consumption trends, and the SEA hasserved as an organizing framework for development of statistical work beyondthe collection of just output data.
8.16 All of these concerns address the possibility that China will keepthe Hybrid System as its ultimate national accounting framework, even thoughSSB and other Chinese authorities have not officially decided to do so.Indeed, a speedy introduction of full SNA procedures would require a majorreorientation of the statistical system, which would be both costly and beyondthe SSBs' present expansion capacity. The Hybrid System is a useful andaffordable temporary step and reflects a great deal of hard work and creativeenergy. SSB continues its pursuit of full implementation with support fromthe highest levels of the government. Nevertheless, for the medium-term andlong-term, gradual introduction of a fuller SNA--with Chinese characteristics--is possible, and this report recommends that China reexamine its implementa-tion of the Hybrid System with this goal in mind. This is the approach beingfollowed by other MPS countries adopting the SNA.
F. The Next Phases for China's Hybrid System
8.17 Rather than accept the Hybrid System as China's best long-tern solu-tion to its national accounting needs, this report recommends that 8SB developa dual system for use in its next several phases of a long-term transition tofull SEA accounting with Chinese characteristics. The dual system would con-sist of both the Full Hybrid System, with ongoing modifications, and a paral-lel and largely independent SA system based on an entirely different set ofdata collection concepts and recording formats and relying much more heavilyon sample survey statistics There would of course be natural overlap betweenthe two parallel systems, and the long-tenm period of transition could lcat adecade or more. For the sake of statistical continuity and to mast the ongo-ing needs of Chinese economic planning, these next phases of the transition
- 107 -
would continue to generate national accounting statistics using the FullHybrid System'o UPS-based accounts. The gradual introduction of a parallelSRA system alongside and in addition to the Hybrid System framework, however,calls for a special effort. It would need *ignificant domestic and interna-tional resources and careful attention to a number of issues. Most of the"cissues fit Into three broad categories: classification schemes, data collec-tion, and SEA-UPS compatibility.
Classification Schemes
8.18 Particular attention should be paid to issues of institutional sec-toring. To illustrato the point, it would be highly desirable, from both anmaalytical viewpoint and for greater consistency with the SNA, that enter-prises bo divided by legal status, separating public, cooperative, and pri-vately owned enterpriess. Although the Hybrid System's UPS-based data collec-tion and aggregation methods have ownership subcategories, they are designedfor the pre-1978 economic management system. They depend on rigid separationbetween urban and rural enterprises, and they do not classify urban enter-prises in ways which statistical experience in market economies has shown tobe most ussiul. Similarly, financial institutions should be defined so thatthe central monetary authorities are separately identified from the rest ofthe banking system. The roles and functions of China's central monetaryauthorities will become increasingly distinct from commercial banking opera-tions, as they are in other economies, and the statistical system shouldreflect this distinction.
6.19 Attention should also be paid to increasingly detailed classifica-tions of industries beyond the primary, secondary, tertiary categorization.For improving the usefulness of the accounts as market forces strengthen,there is a nsed for a clearly defined set of classifications which takeaccount of appropriate international standards (such as the InternationalStandard Industrial Classification). Therefore, this report recommends that,before settling the framework for the next phase of adjus-n-ts in industrialclassifications, SSB design a long-term strategy for gradually approaching afull range of SRA classifications. Subsequent phases in development ofChina's accounting framework could then articulate and subdivide each of themain industrial categories in ways which are compatible with its long-termstrategy.
8.20 Detailed definitions of many of the basic SNA elements appropriatefor China in the long run are provided in tables in an annex to this chapter.It should be emphasized that some further adaptations and refinements would beappropriate to suit circumstances prevailing in Chins.
8.21 For example, gross domestic product (GDP) can be calculated by thedistribution method, as the sum of primary incomes of all enterprises, insti-tutions, organizations, and the population--income received in connection withthe production of goods and services (Tables 8.4-8.5). These Incomes includewages and other types of remuneration of labor, allowances for social insur-anco, profLts, taxes and other primary incomes. Also included are amortiza-tion allowances.

- 108 -
8.22 Finally, as an extension of work on classifications and definitions,greater attention should be paid to the rules underlying particular calcula-tions. To mention but two, the basis for calculation of depreciation ought tobe fully reviewed along with the procedures for imputing the value of owneroccupied dwellings. The uso of an original cost basis in calculating depreci-ation understates the size of the existing capital stock. The use of lowrates of depreciation, which ascribe a long life to assets, does notadequately account for obsolescence. Furthermore, the use of capital stock inthe production process is underestimated in overall terms. Although theapproach does not appear to be based on theoretical considerations, NPS prac-tices will be embodied in the Hybrid System. As noted above, 8SB should mod-ify its present practices and begin to use replacement costs as a basis forcalculating depreciation. This improvement--as well as depreciation ratesthat better reflect the rate at which equipment must be replaced--will assumegreater importance during periods of inflation such as those which usuallyaccompany price reform.
8.23 There are numerous other related issues. The question of imputingvalues for owner occupied dwellings has been dealt with in Chapter III, but itbears repetition to state that SSB should devise procedures that reflect thecost of replacing the housing stock over time and attribute the real costsinvolved. The basis for valuation of general industrial output should also beclarified. If producer prices are to be the norm, there is a need to indicatehow indirect taxes and subsidies are to be treated. It is recommended thatgreater use be made of SNA conventions for specific calculations and imputa-tions.
Data Collection
8.24 SSB's plans call for an expanded collection of data from sectorswhich are currently inadequately covered by statistical operations. Whilethis is welcomed, SSB should place less emphasis on elaborate reportingarrangements which will only serve to burden the statistical system. Thisreport recommends that the comprehensive administrative reporting system cur-rently so important for Hybrid System accounts not be extended to sectorspreviously not covered. Full or complete enumeration is not justified forseveral reasons: high cost, SSB'o inability to absorb and process the data,and the general difficulty ensuring data quality. A more realistic approachbased on well-designed, carefully supervised and well-executed enterprise andbusiness surveys will overcome many of the hurdles that exist. This approachis widely used in most countriae, including both developing and developedcountries (including those in East Europe), and permits linkages with comer-cial accounting and tax practices. It would also imply that the presentemphasis on measurement of physical output would be reduced. The proposedsurveys would focus on revenues, costs, and profits, all of which are empha-sized by the economic reforms.
8.25 It is recognized that changes in collection procedures will requirechanges at both the enterprise level and at 8SB. The present practice ofusing report forms, with aggregations teking place at various levels of thestatistical system, is deficient in that it permits errors, misroporting, andfalsification to go undetected. Local and provincial agencies are left withtoo much freedom and to many opportunities to modify what Is reported. At

- 109 -
present there are no integrated accounts that are provided by enterprises tothe statistical agencies. This implies that consistency checks are difficultin practice because the available information is partial. With the introduc-tion of sampling on a larger scale it should prove possible for the Provin-cial and State Statistical Bureaus to directly receive and check forms.Indeed, it would be desirable to review the entire system of reporting withthe aim of reducing the size of collections and the role of lower-level unitsin the statistical chain. The present report forms in themselves should bemodified so as to enhance clarity, and introduco new data elements that willbe needed to satisfy now demands.
8.26 Earlier references to the need for fully articulated classificationschemes must again be stressed. These should be used in conjunction with therevised reporting forms and questionnaires. It should be stressed that with-out changes in the manner in which micro data are collected, there is littlelikelihood of a significant improvement in the overall quality of the nationalaccounts of China. Such changes need to be phased in over a period of yearsand probably need to be introduced first in the larger enterprises and insectors which are not covered at present.
SNA-MPS Compatibilitv
8.27 There has been considerable work at the international level directedat defining a set of SNA-related national accounting tables appropriate forcountries which have previously relied on the MPS. These tables permit thecompilation of GDP eetimates by adapting existing data flows and institutionalcircumstances. It is recommended that SSB integrate this approach into futurephases of its transition from to an SNA with Chinese characteristics. A tabu-lar scheme is presented at the end of this chapter to enable SSB to proceedwith the task. The scheme takes account of the special inastitutional arrange-ments in China, and the proposed tables can therefore be derived in China'scontext with little difficulty.
8.28 The information presently collected, if supplemented by surveys cov-ering sectors presently not covered, along with new price indices and tappingof data sets compiled by the tax authorities, should begin to provide thebasis for parallel compilation of the SNA-related tables presented below(Tables 8.1-8.3). Such an approach would essentially require a rearrangementof information in SNA format. During China'o relatively long period of tran-sition, continuity with historical series would be maintained, since the FullHybrid System could continue to produce MPS accounts, while the next transi-tional phases provide a bridge to the future by introducing the SEA tablesrecommended below.
8.29 SSB stands to gain from ongoing work along these lines at theinternational level and might wish to participate in that effort. Beyondthese considerations, adoption of such an approach would permit SSB to moveforward towards a wholly SNA-based system (with Chinese characteristics) ingradual stages, while keeping pace with economic and institutional changes inChina. This proposal is in keeping with desires expressed by SSB that theChinese authorities would like to retain a dual system for the foreseeablefuture. Methodological work should continue. SSB staff familiar with SEApractices are dedicated and resourceful, but they are few in number. As a

- 110 -
fLr t step, sore staff used to study both the 1968 SA end its current formalinterDational revisions duo for adoption In 1993. The new International SRAwill became the world'. universal national accounting framework. Expandingend training a core staff In ba¢ic and advanced SMA methods will enlarge 88B'scapacity to enSgge In methodologlcal work in a more systematic way.

- ,11l '
Tb l* 8.1s GDP BY INDUSTRIAL ORIGCI
Code Value added by industries Vaue(1) (2)
01 Industry02 Construction03 Agriculture04 Forestry05 Transport06 Ctmmunications07 Trade, Material-Technical Supply and Procureoent08 Other sectors of Matorial Production09 Housin$-Comnnal Economy and Everyday Services10 Science11 Education12 Culture and the Arts13 Public Health, Social Insurance, Physical Culture, and Tourism14 Financs, Credit, Insurance15 General Goveriment16 Other Sectors of the Wonmaterial Sphere
A Total for the national economy
B Import Duties
C Difference between interest received and paid out by the beaks undaetransactions involving provision of attracted funds.
D Gross Domestic Product (A + B - C)
I Income of residents of a given country received abroad free theirparticipation In the production of goods and services minus sidiletincoma received by residents of other countries on the territory ofa given country (balance)
Gros national product (D + Z)

- 112 -
The calculation of gross value added by the production method also allows GDPto be grouped by Institutional sectors Thls Is illustrated by the tablobelows
Tabl f.2s GDP BY INSTITUTIONAL SECTORS
Code Institutional sectors Value(1) (2) (3)
1 Nonfinancial enterprises2 financial Institutions3 State administration bodies4 Households Including holdings of the population and private
uninco.porated enterprise5 Social organizations servicing households
A Total for the National Economy
3 Import Duties
C Difference between interest received and paid out by the banks undertransactions Involving provision of attracted funds
D Gross Dooestic Product(A + B - C)
K Incomes of residents of a given country received abroad from theirparticipation In the production of goods and services minus similarIncomes received by residents of other countries on the territory ofa ;ven country (balance)
P Gross National Product (D + 3)

- 113 -
It is also possible to calculate gross value added by types of ownership,which can be depicted as follow s
Table 8.3t CDP BY SOCIAL SECTORS
Code Socioeconomic subsectors Value(1) (2) (3)
1 Public subsector2 Cooperative subsector3 Corporate subsector4 Social orgenizations5 Privato subsector6 Units not employing hired labor
A Total for the National Economy
B Import Duties
C Difference between interest received and paid out by bank. undertransactions involving provision of attracted fund.
D Gross Doestic ftsvluct(A + B - C)
s Incomes of residents of a given country received abroad from theirparticipation lmt .- production of goods end services minus similarincomes received by -i*sidents of other countries on the territory ofa given country (ba)-nco)
F Cross National Produc-l iD + R)

- 114 -
Is1 84L ! ,-?ION OF GDP BY T7E DISTRIBUTION METHOD
o. Income Items Total Material The sphere of(4 + 5) production noamateril,
sphere services(value) (value)
(1) (2) (3) (4) (5)
I Population ilnmes(1.1+1.2+1.341.4+1.5)
1.1 Wages and Salaries$.2 loeuneration of labor in agricultural cooperative.1t3 Incomes of private enterprises and holdings1.4 Value added by subsidiary holdings of the population1.5 Income* from Individual labor activity (not)
3 Incoms of enterprises and organization.(2.1+2.2+2.3+2.4+2.5)
g.1 Allowanceo for social InsuranceR.2 Operating surplus (or incomes equated with them)3.3 Turnover taz (or taxes equated with it)3.* Other Items;.5 Depreclation allowances
3 Differencs between Interest received and paid out by the banks undertrnsactions Involving provision of attracted funds.
4 Gross Domestic Product (1 + 2 + 3)
5 Incomes of residents of a given country received abroad from theirparticipation In the production of goods and services minus similarIncomes received by residents of other countries on the territory of agiven country (balance)
* Gross National Product (4 + 5)

- 115 -
Takbl $.5s GDP BY END USE
Items Value
1 Final consumption (1.1+1.241.3)1 1 Final consumption expenditure of households1.2.1 Final consumption xpenditure of state Institutions
(1.2.1+1.2.2) of which ont1.2.1 Services meoting individual requirements of the population1.2.2 Servico meoting collective requirements of the population1.3 Final consumption expenditure of public (nonco=erclal)
organizations servicing the population (1.3.1+1.3.2) of which ont1.3.1 Services meeting individual requirements of the population1.3.2 Services meeting collective requirements of the population2 Gross capital formation (2.142.2)2.1 Gross fixed capital formation2.2 Increaso In stocks3 Foreign trade balance4 Losses of material current capital
5 Gross Domestic Product (5+6)
6 Incomes of resident of a given country received abroad from theirparticipation in the production of goods and *orviess ainus similarinomes received by residents of other countries on the territory ofa given country (balance)
7 Gross National Product (5+6)

- 116 -
IX.. ORGANIZATION AND TECHNICAL ASSISTANCE
9.1 This report has reviewed China's statistical system and its nationalaccounting practices. The report recommends that China move over the longerterm to an accounting framework based on the United Nation's System ofNational Accounts (SNA). To this ond, SSB is encouraged to take steps seekingexternal assistance to further strengthen its already extensive statisticalorganization. It is particularly important that the technical assistanceprogram improve the effectiveness and long-term affordability of data collec-tion. The program should also improve cooperation and interaction among dif-ferent relevant government agencies.
9.2 For maximum effectiveness, this report recommends that the assis-tanoe program combine a domestically-funded modernization program with compat-ible international provision of expertise, training, and equipment. As a stepin the design of such a joint program, this report recommends SSB cooperationin a seminar focused on specific Hybrid System features, to further clarifyChina's national accounting and data collection conventions. The domes-tically-funded modernization program would focus on extension of a grassrootsnetwork for data collection by random sample surveys, especially for produc-tion data. Internationally-funded assistance would complement the domesticeffort with a variety of programs. These would include orientation studytours for higher-level statistical personnel, extended middle-level stafftraining in economic survey techniques and national accounts, seminars byinternational experts, design of domestic training programs, and appropriatecomputer equipment to meet central, provincial and even lower-level needs.
Interact.ion with Other Aag_e es
9.3 This report recommends that SSB improve its working relationshipswith statistical units in other government ministries and agencies, eventhough SSB already has formal arrangements with many of them. SSB officialswould benefit from closer working relationships with statistical offices inthe Ministry of Finance, for example, to speed up and fill out transmission oftax data, especially data at a less aggregated level. Although these dataflows already exist, SSB needs to pursue how the process can be strengthened.As a first step, S5B should define with some degree of specificity the rangeand nature of information it requires. Discussions should then proceed withMinistry officials as to how best the flows could be improved. In the eventresources are an issue, $85 should seek additional budgetary support for thisput-pose. In relative terms, the extra costs would be modest in relation toSSB mounting a wholly parallel effort to collect the same data from respond-ing units. If problems persist, SSB might seek the intervention of the StateCouncil to put in place regulations end enforcement that would require otheragencies to share vith 8SB information in their possession.
9.4 In more -'sneral terms, a serious effort needs to be made to reduceor eliminate the classified, confidential (nei-bu), or otherwise secret statusof economic statistics throughout the government's various ministries, agen-cies, corporationst banks, and other bodies. In the prereform era, all sta-tistical information was treated as a state secret. At the same time therewas a tendency for differeat agencies to operate in a compartmentalized van-

- 117 -
nor, and in general data were not shared. Although these factors have becomeless important and there is far greater openness, vestiges of these earlierpractices persist. An effective Committee or Council at which all producersof data can come together to iron out differences and promote data exchangeshould be established. There are many areas where SSB needs data collected byother agencies, such as trade price data from the State Price Bureau, regis-tration data from the Customs, agencies that regulate newly established enter-prises, and monetary data from the People's Bank. SSB has a mandate under theStatistics Law to play a leadership role in the release and dissemination ofthese data, and it should exercise that authority.
9.5 On the opposite side of the coin, SSB should establish andstrengthen "User Committees" and enhance its delivery of statistical informa-tion to other government agencies. Several key agencies such as the Develop-ment Research Center, the State Planning Commission and the Systems ReformCommission need information that is more disaggregated than that the SSB pub-lishes. Their needs are being only partially satisfied. SSB may wish toreview its present practices as regards the sharing of disaggregated statis-tics with key user agencies. Appropriate safeguards about confidentiality ofindividual returns must of course remain in place but, with some prudent safe-guards, much more can be done. It is for this reason that an examination ofpresent policies and attitudes is urged. Although SSB has understandableconcerns about its responsibility for the quality of data released in thisway, SSB should note that users can make a constructive contribution by evalu-ating the data in the process of utilizing the data. Such constructive feed-back will enable SSB to introduce refinements and thus, in the longer term,gain a wider reputation for excellence. Most countries witness tensionsbetween statistical agencies and data users, but many of these countries havebeen able to minimize difficulties by establishing User Committees, and SSBshould develop and strengthen similar institutional arrangements.
ImDroving SSB's Technical Calacitv
9.6 A coordinated program of domestic investment in China's statisticalinfrastructure, backed up by foreign technical assistance, would significantlystrengthen SSB's technical capacity to provide policy-relevant nationalaccounting data. This report strongly recommends such a program. After studyand consultation concerning relevant components and details, the program wouldprobably consist of several major elements: broad domestic training for man-power and skill development, focused international study and training for higher-and middle-level leadership personnel, international seminars designed toresolve conceptual and technical difficulties, and significant investment incomputational equipment for all levels of the system--national, provincial,and local. As part of study and consultation in preparation for such a pro-gram, this report recommends that a seminar originally proposed to reviewnarrow quantitative issues be converted to a focused investigation of the manystill poorly-understood dimensions of China's national accounting frameworkand their differences from SNA standards.
Manpower and Skills
9.7 In broad terms China's statistical system employs almost a millionpersons, if account is taken of those employed at the grassroots level. By

- 118 -
any standard this is a large work force and almost impossible to manage anddirect. It is to SSB's credit that it has been able to build up a capacity aslarge as this in the past decade from the ruins of the Cultural Revolutionwhen the statistical system was eliminated as a functioning entity. Whilemindful of the enormity of the task that has been undertaken and the largeeffort made to develop the skills of its work force, it must be recognizedthat much remains to be done. It should be noted that the staff at the grass-roots level are the backbone of China's statistical structure and the successor failure of how the statistical system responds will depend on the qualityand performance of personnel at this level. Although SSB has endeavored toupgrade skills and strengthen computing capacities, SSB itself acknowledgesthat current arrangements are still inadequate for the enormous task at hand.In strengthening the statistical system, it is imperative that particularattention be focused on equipping and training of staff at all levels, butespecially at the local level.
9.8 This report therefore recommends that an appropriate training andskill development strategy be prepared and implemented. Implementation ofsuch a strategy would require significant domestic resources, and the degreeof its successful implementation will be the single most important factor indetermining the overall success of the entire development and assistanceprogram. Such a strategy would have a variety of dimensions and components,including recruitment, expansion and strengthening of training centers, andthe preparation of qualified training personnel, including trainers at thecounty level. As a minimum, it would be appropriate to have a trainer at eachcounty statistical office who would take responsibility for training personnelat the enterprise level. The development of handbooks and manuals will alsobe an essential job, to enable on-the-job training of county-level staff.
9.9 This report also recommends that existing training centers at theprovincial and regional levels be strengthened. The caliber of staff at theMunicipal Statistical Bureau in Chongqing was impressive. If the same situa-tion prevails at other Municipal and Provincial Bureaus, the basis for opti-mism about the future evolution of the statistical system is well founded.However, most staff, while competent and articulate, appeared to have littlefamiliarity with SEA concepts and methodologies, although they were well-acquainted with the MPS framework and with the methods associated with compre-hensive reporting. The mission did not find a clear and full understanding ofWestern economic concepts or sample survey techniques. There is thus a needto train staff at this intermediate level in these and other technical areas.But a reorientation of the content of training is essential, with greaterfocus on applications and less on statistical theory.
9.10 This report recommends that SSB's training centers and their pro-grams be modified to focus on training staff in three important areas: (a)national accounting and economic statistics, (b) sampling methodology andapplications, and (c) the use of microcomputing equipment. In the firstplace, SSB should develop appropriate teaching materials for use in thesecourses. It is suggested that instead of developing such material fromscratch, SSB should acquire course material from training institutions abroad.To mention but one such institution, the US Census Bureau's InternationalTraining Center offers opportunities. Courses developed by the US Bureau arewell-designed, and with some modifications they could suit China's circum-

- 119 -
stances. Training documents should be translated into Chinese for use at theProvincial and Regional centers. If this effort is coupled with the trainingof a core body of trainers through the US Census Bureau program or similarcourses elsewhere, rapid progress could be made in creating a network oftraining facilities to prepare well-trained statistical personnel familiarwith current mainstream world thinking on statistical issues and applications.To supplement the arrangements proposed above, SSB should arrange for a seriesof seminars and workshops over a three-year period with guest lecturers fromabroad. These workshops should focus on the collection of economic statis-tics with an SNA orientation.
TechrLical Coooeration
9.11 SSB has received technical assistance on an ad hoc basis from avariety of sources over the past several years, but the very ad hoc natura ofthis assistance has greatly reduced its effectiveness. The Asian DevelopmentBank has assisted SSB with work on the input-output tables. The UN Statisti-cal Office has advised on sampling, International Comparisons Project (ICP),and computerization in the context of the population census. The Interna-tional Statistical Institute has provided inputs in davelopir.g training insti-tutions and sample survey methods. Staff of the Statistical Office of theEuropean Community (EUROSTAT) have advised on the industrial census. Fundingfrom the UN Fund for Population Activities (UNFPA) has been made available forthe population census, in particular for acquiring hardware. SSB has alsobenefited from participation in training courses at the Statistical Institutefor Asia and the Pacific (SIAP), the Economic and Social Commission for Asiaand the Pacific (ESCAP), the Munich Advanced Statistical Training Center, theUS Bureaus of the Census and Labor Statistics. This listing is not exhaustivebut is indicative of what support has been forthcoming. Given the size ofChina, these training efforts have been modest, but their inputs have made asignificant contribution. Their ad hoc nature, however, has meant that SSBhas not benefited from a coordinated approach within an ovcrall set of workpriorities. Coordinated foreign assistance must be part of a complementarydomestic program on an adequate scale.
Comguterization
9.12 The statistical system has made enormous progress in computerizationof etatistical work in the past decade. SSB has acquired central processingfacilities at the headquarters level. Similar facilities exist at Provincialand Municipal levels. There has also been a sizable increase in the avail-ability of microcomputers at all levels of the statistical chain. SS8 indi-cated that some 5,000 microcomputers were available at statistical offices atand above the county level. Some 60 percent of statistical units at thecounty level have equipment, although much of the equipment in place has beendeployed for processing the recent population census. Long-range computernetworks have been gradually developed and now function. These bridge theenormous distances between the center and the remote statistical units. How-ever, many statistical functions are still performed with the aid of abacuses.The available hardware equipment is inadequate to serve the needs of the sta-tistical system.

- 120 -
Concluding Remarks
9.13 This report has sought to evaluate China's national accounting prac-tices and their ability to generate reasonably accurate measures of real eco-nomic performance. The accuracy of these aggregates is important, since theyusually form the basis for decietons by Chinese policymakers on macroeconomicmanagement and strategic development. They are also important for helpingChina apply lessons from development experience in other parts of the world tocomparable Chinese circumstances. The report recognizes both the advantagesand the long-term weaknesses of China's Hybrid System of national accounts andrecommends changes to improve the existing system and speed its evolution inthe direction of an SNA with Chineso characteristics. Grassroots data collec-tion and processing are critical in this regard, especially the extendedapplicaticni of sample survey techniques. The report's recommendations haveincorporated the need for continued generation of NPS aggregates while sub-stantially improving the accuracy of existing SNA measures. Such a dual-tracksystem will ease the process of economic reform in China by providing policy-makers with timely comprehensive reports and an increasingly better gauge ofeconomic development patterns and trends.

- 121 -
Chart Cls CHIUM'S STATISTICAL SYSTEf
|linstry Headquartero Statistical |pecializedState of of People.' Bureau tries
FantacD Bank of Chlia
t .......... ......... t.....
Province Department . Bank * Statistical Specializedand of Branch ..... Bureau ...... DepartmeosCity Finace
t ~~............ ...................
Bureau . Bank * Statistical SpecializedCounty of Subbranch ...... Bureau ..,,. Bureaux
Finance
. t t t
Township Office of Baok Township Specializedand Finance and Operations and Companies
Village Office of Office Vllauge and GrainaTaxatioa Stations
I -
Grassroots Enterprises &Households

- 122 -
Chart 9.2. STATE STATISTICAL BUREAU ORGANZATION CUiRT
S TATE STATIS1A I Dso
Supervisory Unit Operational UNait i Administrative Unit
National ECoDo Auditing. _ Xural Sociooconomic Survey Lead Tem Read OfficoCoordination Comittco I
(Province Autonomous Region National Economy GoneralCentr.llj Administered WUniCiDaiity) Statistics Department
Rural S cioeconomic Survey tr
County "Rural Socioeconomic Urbau Socloeconomic Survey Lead Toam National Econmy BalancingSurvey ToD pcpartment
(Province, Autonomou Region Syst ad Method DepartmentCentrally Admiuictored ni1pt)
Urbu Socioeconomic Survo a
City aud County "Urban International Statistical Rural Socioeconomic Statistic _Socioeconomic Survey Team Information Center Departaet
Computation Conter Industr and TrasportationitiStatistico Departutnt
Statistical Cadre Training Conter Fixed Assets InvestmentI Statistics Department
China Statistics and Soicil Economics Trade and Materiel StatisticsReoearct Institute l | Department
State Statistical Bureau China Statistics Publishing Unit Social Sttatieotis DepartmtPrinting Factory
China Statistical Nvewletter Unit | Population Statistics Departmet
China Statistical Information Scicand Tehn1oland Consultacy Service Center Statiatics Department
Cbina Grain and Agriculture Externl ffairs DepartntStatistics Center t
aXin Stetietical College Peroonnel Departmet
Sicuban Statistical College Financial and InfrastructureDn prtv Ct
|Pollay and Rcgulationo D partomt
I nstitution Service Center


![Japan & World’s medical industry gathered here! · [China Health Statistical Yearbook, China Health and Family Planning Statistical Yearbook] ... "2013 Annual Report on the Survey](https://img.pdfslide.net/doc/110x75/60205ce470913614931fb427/japan-worldas-medical-industry-gathered-here-china-health-statistical.jpg)